Business Wire News

HOUSTON--(BUSINESS WIRE)--Members of the Phillips 66 (NYSE: PSX) Executive Leadership Team will participate in a fireside chat at the BofA Securities Global Energy Conference on Thursday, Nov. 18, 2021, at 3 p.m. EST.


Phillips 66 leaders will discuss the company’s strategic initiatives to further strengthen its diversified portfolio, its focus on lower-carbon initiatives and its commitment to deliver attractive shareholder returns.

To access the webcast, go to the Events and Presentations section of the Phillips 66 Investors site, https://www.phillips66.com/investors. A replay of the webcast will be archived on the Events and Presentations page approximately two hours after the event, and a transcript will be available at a later date.

About Phillips 66

Phillips 66 is a diversified energy manufacturing and logistics company. With a portfolio of Midstream, Chemicals, Refining, and Marketing and Specialties businesses, the company processes, transports, stores and markets fuels and products globally. Headquartered in Houston, the company has 14,100 employees committed to safety and operating excellence. Phillips 66 had $56 billion of assets as of Sept. 30, 2021. For more information, visit www.phillips66.com or follow us on Twitter @Phillips66Co.


Contacts

Jeff Dietert (investors)
832-765-2297
This email address is being protected from spambots. You need JavaScript enabled to view it.

Shannon Holy (investors)
832-765-2297
This email address is being protected from spambots. You need JavaScript enabled to view it.

Thaddeus Herrick (media)
855-841-2368
This email address is being protected from spambots. You need JavaScript enabled to view it.

BURLINGTON, Ontario--(BUSINESS WIRE)--$ANRG #ANRG--Anaergia Inc. (“Anaergia” or the “Company“) (TSX: ANRG), an integrated waste-to-value platform created to eliminate greenhouse gases by cost-effectively turning organic waste into renewable natural gas, fertilizer, and water, today announced financial results for the three-month period ended September 30, 2021. All financial results are reported in Canadian dollars unless otherwise stated.


“The financial results we are reporting today for Anaergia’s third quarter show lower revenues, but higher gross profit as compared to the same quarter in 2020. This is largely attributable to the impact of a large-revenue, but low-margin, capital sale that affected results in the prior year. As a result, the third quarter of last year was the highest revenue quarter of the year. Typically, our fourth quarter is usually the highest revenue quarter of the year, and this will likely be the case in 2021,” noted Anaergia’s Chairman and CEO, Andrew Benedek. “Furthermore, while our Revenue Backlog[1] rose to $3.5 billion from $3.2 billion at the end of the second quarter, two new orders that we had anticipated in the third quarter have closed in this quarter, which bodes well for revenue growth and rising profitability in future periods.

“Growth is particularly strong in western Europe, where we added a large build, own and operate (BOO) project in Denmark. We also added projects in Italy and in the US. We continue to see many opportunities in Italy, and as such we are working to put in place significant new project-level financing for the Italian market,” concluded Dr. Benedek.

Q3 2021 Financial Results

Third Quarter financial highlights:

  • Revenues for the third quarter fell to $33.8 million from $42.5 million in the prior year, but increased to $103.4 million for the nine-month period compared to $88.1 million in the same period in the prior year. The increase for the year-to-date was driven by activity in both the Europe, Middle East and Africa (EMEA) and the North American markets. Specifically, government regulations and incentives in Europe and North America are driving the development of new facilities in efforts to divert greater amounts of organic waste from landfills and produce increasing quantities of renewable natural gas in each of these markets.
  • Gross Profit increased to $8.5 million for the three-month period ended September 30, 2021, compared to $8.1 million for the same period the prior year. The increase in the gross profit percentage to 25% in the third quarter of this year from 19% in the third quarter of the prior year was driven by the completion of a large-revenue, but low-margin, capital sale in the prior quarter.
  • Adjusted EBITDA1 of $1.2 million for the three-month period ended September 30, 2021 was lower than the $1.5 million in the same period the prior year. The decrease was attributable to increased SG&A expenses as the Company positions itself for future growth. For the nine-month period, Adjusted EBITDA rose to $5.1 million from $1.5 million in the prior year.

Three months ended:


30-Sep-21


30-Sep-20


% Change

(In millions of Canadian dollars)


Revenue


33.8


42.5


-20%

Gross profit


8.5


8.1


6%

Gross profit %


25%


19%


Income (loss) from operations


(3.9)


0.0


Net income (loss)


0.0


0.0


Adjusted EBITDA1


1.2


1.5


Nine months ended:


30-Sep-21


30-Sep-20


% Change

(In millions of Canadian dollars)


Revenue


103.4


88.1


17%

Gross profit


25.3


18.6


36%

Gross profit %


24%


21%


Loss from operations


(5.5)


(1.8)


Net loss


(1.6)


(15.3)


Adjusted EBITDA1


5.1


1.5


Statement of


Financial Position


30-Sep-21


31-Dec-20

(In millions of Canadian dollars)


Total Assets


654.4


452.2

Total Liabilities


310.1


326.4

Equity


344.3


125.8

For a more detailed discussion of Anaergia’s third quarter 2021 results, please see the Company’s financial statements and management’s discussion & analysis, which are available at https://www.anaergia.com/investor-relations and on the Company’s SEDAR page at www.sedar.com.

Non-IFRS Measures

This press release makes reference to certain non-IFRS measures. These measures are not recognized measures under IFRS and do not have a standardized meaning prescribed by IFRS and are therefore unlikely to be comparable to similar measures presented by other companies. Rather, these measures are provided as additional information to complement IFRS measures by providing further understanding of our results of operations from management’s perspective. Accordingly, these measures should not be considered in isolation or as a substitute for analysis of our financial information reported under IFRS. We use non-IFRS measures to provide investors with supplemental measures. Management also uses non-IFRS measures internally in order to facilitate operating performance comparisons from period to period, prepare annual operating budgets and assess our ability to meet our future debt service, capital expenditure and working capital requirements. Management believes these non-IFRS measures and industry metrics are important supplemental measures of operating performance because they eliminate items that have less bearing on operating performance and highlight trends in the core business that may not otherwise be apparent when relying solely on IFRS financial measures. Management believes such measures allow for assessment of our operating performance and financial condition on a basis that is more consistent and comparable between reporting periods. We also believe that securities analysts, investors and other interested parties frequently use non-IFRS measures in the evaluation of issuers.

Definitions and reconciliations of non-IFRS measures to the relevant reported measures can be found in our MD&A. Such reconciliations can also be found in this press release under “Reconciliation of Non-IFRS Measures”.

Adjusted EBITDA” is defined as net earnings before finance costs, taxes and depreciation and amortization adjusted for our normalized proportionate interest in our build, own and operate (“BOO”) assets and one-time or non-recurring items, stock-based compensation expense, asset impairment charges and write downs, gains and losses for equity-accounted investees, foreign exchange gains or losses, restructuring costs, ERP customization and configuration costs, litigation and other claims settlements, gains and losses resulting from changes in certain balance sheet valuations (such as derivatives and warrants), acquisition costs and costs related to our initial public offering, including estimated incremental auditing and professional services costs incurred in connection with our initial public offering. For further details, refer to “Reconciliation of Non-IFRS Measures” below.

Revenue Backlog” is defined as the balance of unrecognized, undiscounted, consolidated revenues from signed contracts in our Capital Sales and Services segments and from our BOO assets that are operational, under construction or financially closed over their remaining useful life. We have conservatively modelled for only 20 years of revenue out of the useful life of the BOO assets.

Conference Call and Webcast

A conference call to review the Company’s results for the second quarter of 2021 will take place at 11:30 a.m. (ET) on Thursday, November 11, 2021, hosted by Chief Executive Officer Andrew Benedek, Chief Operating Officer Yaniv Scherson, and Chief Financial Officer Hani Kaissi. An accompanying slide presentation will be posted to the Investor Relations section of our website shortly before the call.

To participate in the call please sign up to receive your personal event-joining details at the following pre-registration link:

To listen to the webcast live:

The webcast will be archived and will be available in the Investor Relations section of our website following the call.

About Anaergia

Anaergia was created to eliminate a major source of greenhouse gases by cost effectively turning organic waste into renewable natural gas (RNG), fertilizer and water, using proprietary technologies. With a proven track record from delivering world leading projects on four continents, Anaergia is uniquely positioned to provide end-to-end solutions for extracting organics from waste, implementing high efficiency anaerobic digestion, upgrading biogas, producing fertilizer and cleaning water. Our customers are in the municipal solid waste, municipal wastewater, agriculture, and food processing industries. In each of these markets Anaergia has built many successful plants including some of the largest in the world. Anaergia owns and operates some of the plants it builds, and it also operates plants that are owned by its customers.

For further information please see: www.anaergia.com

Forward-Looking Statements

This news release may contain forward-looking information within the meaning of applicable securities legislation, which reflects the Company’s current expectations regarding future events. Forward-looking information is based on a number of assumptions and is subject to a number of risks and uncertainties, many of which are beyond the Company’s control. Such risks and uncertainties include, but are not limited to, the factors discussed under “Risk Factors” in the Company’s supplemented PREP prospectus dated June 18, 2021. Actual results could differ materially from those projected herein. Anaergia does not undertake any obligation to update such forward-looking information, whether as a result of new information, future events or otherwise, except as expressly required under applicable securities laws.

Reconciliation of Non-IFRS Financial Measures

Three months ended:

30-Sep-21


30-Sep-20

(In thousands of Canadian dollars)


Net income

193


753

Finance costs

(863)


816

Depreciation and amortization

855


769

Income tax expense (benefit)

(1,617)


56

EBITDA

(1,432)


2,394


Share-based compensation expense

107


123

Net gain on Fibracast deconsolidation

(2,346)


-

Gain on RBF embedded derivative

(306)


(4,628)

Stock warrant valuation loss

-


1,138

Share of loss in equity accounted investees

780


1,720

Provision for customer claim

3,473


-

Other (gains) losses

(341)


127

ERP customization and configuration costs

922


226

Costs related to the Offering

1,247


-

Foreign exchange (gain) loss

(919)


431

Adjusted EBITDA

1,185


1,531


Nine months ended:

30-Sep-21


30-Sep-20

(In thousands of Canadian dollars)


Net loss

(1,591)


(15,271)

Finance costs

(1,224)


2,470

Depreciation and amortization

2,372


1,478

Income tax expense (benefit)

(703)


4,323

EBITDA

(1,146)


(7,000)


Share-based compensation expense

405


537

Net gain on Fibracast deconsolidation

(2,346)


-

Gain on RBF embedded derivative

(3,513)


(3,112)

Gain on warrant forfeitures

(615)


Stock warrant valuation loss

914


1,744

Share of loss in equity accounted investees

2,629


2,941

Provision for customer claim

3,473


-

Other losses

244


579

ERP customization and configuration costs

1,496


1,300

Costs related to the Offering

4,332


-

Foreign exchange (gain) loss

(816)


4,522

Adjusted EBITDA

5,057


1,511


__________________________

1 See “Non-IFRS Measures."

Source: Anaergia, Inc.


Contacts

For media relations please contact: Melissa Bailey, Director, Marketing & Corporate Communications, This email address is being protected from spambots. You need JavaScript enabled to view it.
For investor relations please contact: This email address is being protected from spambots. You need JavaScript enabled to view it.


Thursday, November 18, 2021

HOUSTON--(BUSINESS WIRE)--The Port Commission of the Port of Houston Authority will hold its Budget Workshop on Thursday, Nov. 18, 2021. The workshop will begin at 9:00 a.m. and be conducted as a hybrid meeting. The Commissioners, executive leadership, and legal counsel will be present in the boardroom of the Port Authority Executive Office Building, located at 111 East Loop North, Houston, TX 77029.


The meeting is open to the public to attend. However, the meeting can also be accessed virtually via WebEx webinar.

The agenda and the instructions to access Port Houston public meetings are available at https://porthouston.com/leadership/public-meetings/.

Please note the following upcoming planned Port Houston public meetings: (subject to change)

December 7: Port Commission Regular meeting – 9:00 a.m.

Sign up for public comment is available up to an hour before these Port Commission meetings by contacting Erik Eriksson at This email address is being protected from spambots. You need JavaScript enabled to view it.or Liana Christian at This email address is being protected from spambots. You need JavaScript enabled to view it.

About Port Houston

For more than 100 years, Port Houston has owned and operated the public wharves and terminals along the Houston Ship Channel – the nation’s largest port for waterborne tonnage and an essential economic engine for the Houston region, the state of Texas, and the U.S. nation. The more than 200 private and eight public terminals along the federal waterway support the creation of nearly 1.35 million jobs in Texas and 3.2 million jobs nationwide, economic activity totaling $339 billion in Texas, and a total of $801.9 billion in economic impact across the nation. For more information, visit the website: https://porthouston.com/


Contacts

Lisa Ashley, Director, Media Relations, Port Houston
Office: 713-670-2644; Mobile: 832-247-8179; E-mail: This email address is being protected from spambots. You need JavaScript enabled to view it.

Addition of industry thought leaders in the battery technology, engineering and operations space to drive battery portfolio expansion

BUFFALO, N.Y. & SANTA MONICA, Calif.--(BUSINESS WIRE)--Unifrax, a leading manufacturer of high-performance specialty materials, today introduced its Battery Advisory Board, which will meet regularly to provide strategic guidance as Unifrax grows its battery portfolio and enters the silicon anode market with its new SiFAB™ Silicon Fiber Anode Battery Technology.


SiFAB, a scalable proprietary silicon anode battery technology demonstrated in wide-reaching applications, including electric vehicles, power tools, smartphones, personal computers, medical devices and aviation, can deliver up to 20% increase in gravimetric energy density in lithium-ion batteries. It has proven through advanced testing high reversible capacity of greater than 1,000 mAh/g. Unifrax recently broke ground on its first production line located in New Carlisle, IN, which is expected to come online in early 2022.

This transformational technology becomes part of a robust battery portfolio that also consists of world class thermal management products and separator media.

The advisory board will bring together four highly experienced professionals and visionaries in the battery technology, engineering and operations space, with experts from the nation’s top universities and esteemed technology companies.

Unifrax’s Battery Advisory Board will include:

  • Dr. Prabhakar Patil, former CEO, LG Chem Power, and Chief Engineer of Hybrid Technologies, Ford Motor Company. Dr. Patil previously served as CEO of LG Chem Power (LGCPI) for 10 years. Prior to joining LGCPI in 2005, Dr. Patil spent 27 years of his professional career at Ford Motor Company in various engineering and management positions. He served as Chief Engineer for Ford’s hybrid technologies during 2003 and was also Chief Engineer for the Ford Escape Hybrid from 1998 to 2003.
  • Rita Lane, former Vice President of Operations, Apple Inc., and Senior Vice President of Integrated Supply Chain, Motorola. Ms. Lane has more than 30 years of experience building and leading global hardware operations and supply chain teams for Fortune 100 companies. From 2008 until her retirement in 2014, she served as Vice President of Operations at Apple, where she oversaw the launch of the iPad and manufacturing of the Mac desktop and accessories product lines. From 2006 to 2008, Lane was Chief Procurement Officer and SVP, Supply Chain, at Motorola. Prior to working at Motorola, Lane held various senior-level operations roles at IBM for more than 10 years.
  • Dr. Arumugam “Ram” Manthiram, Professor, University of Texas at Austin. Dr. Manthiram is Director of the Texas Materials Institute and the Materials Science and Engineering Graduate Program. With more than 35 years of experience, Dr. Manthiram’s research is focused on the development of low-cost, high-performance materials for batteries. He is a globally recognized leader in cathode materials for lithium-ion batteries. He has authored more than 850 journal articles. Dr. Manthiram holds the Cockrell Family Regents Chair in Engineering #5. He delivered the lecture on behalf of Nobel Prize recipient John B. Goodenough in 2019 in Stockholm for his work on lithium-ion batteries.
  • Dr. Jennifer Rupp, Professor of Electrochemical Materials, Massachusetts Institute of Technology (MIT) and TU Munich (TUM). Dr. Rupp is Associate Professor of Electrochemical Materials in the Departments of Materials Science and Engineering at MIT and in the Department of Chemistry at TUM, and technical director of TUM Int. Energy. Dr. Rupp gave keynote lectures at Nature Energy and Sustainability conferences, Gordon Research keynote lectures in ceramics and electrochemistry and at the Royal Chemical Society, and presented on battery, information and energy technology at the World Economic Forum. Dr. Rupp’s team's current research focuses are on solid-state material design and tuning of structure-property relations for novel energy and information devices and operation schemes. In 2021, Rupp was invited to become a Fellow of the Royal Society of Chemistry (FRSC).

“We’re thrilled to have put together such a talented and influential advisory board,” said John Dandolph, CEO, Unifrax. “Their depth of experience and perspective in lithium-ion battery technology and novel chemistries spans multiple industries, including portable electronics, consumer devices and EVs, which will help us navigate the complex supply chains as we bring hundreds of metric tons of capacity to the market in the near future. I look forward to partnering with this group of industry icons as we transform battery safety, capacity, power, and charge times.”

To learn more about SiFAB or to follow the latest updates on the technology, visit www.sifab.com.

About Unifrax

Unifrax develops and manufactures high-performance specialty materials used in advanced applications, including high-temperature industrial insulation, electric vehicles, energy storage, filtration and fire protection, among many others. Unifrax products are designed with the ultimate goal of saving energy, reducing pollution and improving safety for people, buildings and equipment by delivering on our commitment to our customers of greener, cleaner, safer solutions for their application challenges. Unifrax has over 60 global manufacturing facilities and employs 5,600+ employees globally. More information is available at www.unifrax.com. For updates, follow us on Twitter, LinkedIn and Facebook.

About Clearlake

Clearlake Capital Group, L.P. is a leading investment firm founded in 2006 operating integrated businesses across private equity, credit, and other related strategies. With a sector-focused approach, the firm seeks to partner with world-class management teams by providing patient, long-term capital to dynamic businesses that can benefit from Clearlake’s operational improvement approach, O.P.S.® The firm’s core target sectors are technology, industrials, and consumer. Clearlake currently has approximately $50 billion of assets under management and its senior investment principals have led or co-led over 300 investments. The firm has offices in Santa Monica and Dallas. More information is available at www.clearlake.com and on Twitter @ClearlakeCap.


Contacts

Media:
For Unifrax:
Deborah L. Myers
Director, Global Marketing Communication
This email address is being protected from spambots. You need JavaScript enabled to view it.
716.812.4802

For Clearlake:
Jennifer Hurson
Lambert & Co.
This email address is being protected from spambots. You need JavaScript enabled to view it.
845.507.0571

TORONTO--(BUSINESS WIRE)--Superior Plus Corp. (“Superior”) (TSX:SPB) announced today its financial and operating results for the third quarter ended September 30, 2021. Unless otherwise expressed, all financial figures are expressed in Canadian dollars.


“During the third quarter, we were successful in our continued progress towards our Superior Way Forward acquisition and operational improvement initiatives,” said Luc Desjardins, President and Chief Executive Officer. “In the past twelve months, we have announced or closed eight acquisitions for an investment of approximately $625 million, and we continue to see a robust pipeline of acquisition opportunities in the U.S. and Canada.”

“Although our third quarter is our seasonally lowest, our results were modestly higher than the prior year quarter, and we are confirming our 2021 Adjusted EBITDA guidance,” added Desjardins. “Our sales volumes were higher due to acquisitions completed in the past twelve months and modest improvement in commercial and wholesale demand as COVID-19 restrictions are eased.”

Financial Highlights:

  • Superior achieved third quarter Adjusted EBITDA of $13.0 million, a $2.2 million or 20% increase over the prior year quarter primarily due to lower corporate costs, and to a lesser extent, a higher realized gain on foreign currency hedging contracts partially offset by lower EBITDA from operations.
  • Net loss from continuing operations of $35.9 million in the third quarter increased $9.8 million compared to the third quarter of 2020 primarily due to higher selling, distribution and administrative costs (“SD&A costs”), and lower gains on derivatives and foreign currency translation of borrowings, partially offset by higher gross profit and lower finance expense. Gross profit and SD&A costs increased primarily due to the impact of acquisitions completed in the past twelve months. Gains on derivatives and foreign currency translation of borrowings decreased due to the impact from the stronger Canadian dollar on the translation of U.S. denominated borrowings and foreign currency forward sales contracts. Finance expense decreased primarily due to lower average debt levels and lower average interest rates related to the senior unsecured notes.
  • U.S. Propane EBITDA from operations was ($7.8) million, a decrease of $3.8 million compared to the prior year quarter primarily due to the higher operating costs, partially offset by higher adjusted gross profit. Operating costs and adjusted gross profit increased primarily due to the impact of acquisitions completed in the past twelve months. Due to the seasonality of the U.S. Propane business, the increase in operating costs more than offset the increase in gross profit. Adjusted gross profit increased $8.9 million primarily due to higher sales associated with acquisitions completed in the last twelve months, and, to a lesser extent, higher average unit margins and higher other services gross profit. Sales volumes increased due to the contribution from acquisitions completed in the last twelve months Average unit margins increased due to sales and marketing initiatives, including focused sales growth in higher margin propane customers, partially offset by the impact of the stronger Canadian dollar on U.S. denominated gross profit. Operating costs increased by $12.7 million primarily due to the impact of acquisitions completed in the past twelve months, partially offset by cost-saving initiatives, realized synergies and the impact of the stronger Canadian dollar on the translation of U.S. denominated operating costs.
  • Canadian Propane EBITDA from operations of $21.2 million, decreased $0.4 million or 2% from the prior year quarter primarily due to higher operating costs, partially offset by higher adjusted gross profit. Operating costs increased $7.6 million primarily due to the impact from the lower Canadian Emergency Wage Subsidy (“CEWS”) benefit recorded during the quarter compared to the prior year quarter and higher volume-related costs, partially offset by lower incentive plan costs and cost-saving initiatives. Adjusted gross profit increased $7.2 million primarily due to higher average unit margins and higher sales volumes. Average unit margins increased primarily due to the timing of sales of carbon offset credits and stronger wholesale propane market fundamentals in the California market compared to the prior year quarter and customer mix. Sales volumes have increased primarily due to higher wholesale sales volumes in California related to increased demand as COVID restrictions were lifted.
  • Corporate costs for the third quarter of 2021 were $1.0 million, a $6.1 million decrease compared to the prior year quarter due to long-term incentive plan recovery of $3.3 million in the current quarter compared to a long-term incentive plan cost of $2.6 million in the prior year quarter. The long-term incentive plan recovery in the current quarter was due to the decrease in the liability related to the lower share price at September 30, 2021 compared to June 30, 2021.
  • AOCF before transaction and other costs during the third quarter was ($4.8) million, a $7.9 million increase compared to the prior year quarter primarily due to lower interest costs, and, to a lesser extent, higher Adjusted EBITDA and lower cash taxes. AOCF before transaction and other costs per share was ($0.02), $0.04 higher than the prior year due to an increase in AOCF before transaction and other costs, partially offset by an increase in weighted average shares outstanding. Weighted average shares outstanding, which assumes the exchange of the preferred shares into common shares, were higher than the prior comparable period due to the issuance of preferred shares to Brookfield Asset Management (the “Preferred Shares”) that are reflected on an as converted basis.
  • Superior’s Total Net Debt to Adjusted EBITDA leverage ratio for the trailing twelve months ended September 30, 2021, was 3.5x, which is within Superior’s long-term target range of 3.0x to 3.5x. Total Net Debt to Adjusted EBITDA increased from 3.3x at June 30, 2021 primarily due to higher total debt. Total debt increased due to the acquisition of Williams Energy Group, lower cash flow from operations in the third quarter related to seasonality and higher net working capital.
  • Superior is confirming its previously disclosed Adjusted EBITDA range of $390 million to $420 million.

Strategic Developments and Highlights:

  • On July 7, 2021, Superior acquired the assets of a retail propane distribution company based in North Carolina, operating under the tradename, Williams Energy Group (“Williams Energy”). Founded in 1998, Williams Energy is an established independent retail propane distributor delivering approximately 7 million gallons of propane annually to 12,000 retail and commercial customers in North Carolina.
  • On July 14, 2021, Superior announced that one of its wholly-owned subsidiaries entered into an agreement to acquire the equity interests of Kamps Propane, Inc., High Country Propane, Inc., Pick Up Propane, Inc., Kiva Energy, Inc., Competitive Capital, Inc. and Propane Construction and Meter Services (collectively, “Kamps”) for an aggregate purchase price of approximately US $240 million (CDN $299 million) before adjustments for working capital. Founded in 1969 by John Kamps, Kamps is an established independent family owned and operated retail and wholesale propane distributor based in California servicing approximately 45,000 residential, commercial and wholesale customers. Kamps has 14 retail branch offices, 5 company-operated rail terminals, over 375 vehicles and approximately 280 employees.
  • On September 23, 2021, Superior announced it had received a request for additional information (“second request”) from the United States Federal Trade Commission (“FTC”) in connection with the pending acquisition of Kamps. Kamps has also received a similar second request from the FTC. The second requests were issued under the Hart-Scott-Rodino Antitrust Improvements Act of 1976, as amended (“HSR Act”). Superior and Kamps are in the process of supplying the FTC with information related to the second request. Superior expects the second request may delay the closing of Kamps until the first quarter of 2022.

Financial Overview


Three Months Ended


Nine Months Ended


September 30


September 30

(millions of dollars, except per share amounts)


2021


2020


2021


2020 (1)

Revenue


362.6


256.8


1,567.7


1,245.0


Gross Profit


132.6


120.7


630.8


636.2


Net earnings (loss) from continuing operations attributable to common shareholders


(35.9

)


(26.1

)


3.4


(25.1

)

Net earnings (loss) from continuing operations per share attributable to common shareholders, diluted (4)


$

(0.24

)


$

(0.18

)


$

(0.08

)


$

(0.17

)

EBITDA from operations (2)


$13.4


$17.6


$266.8


$255.9


Adjusted EBITDA (2)


$13.0


$10.8


$256.2


$235.3


Net cash flows from operating activities


(3.3

)


17.2


226.2


289.6


Net cash flows from operating activities per share, diluted (4)


$

(0.02

)


$

0.09


$

1.10


$

1.57


AOCF before transaction and other costs (2)(3)


($4.8

)


($12.7

)


$189.5


$158.2


AOCF before transaction and other costs per share, diluted (2)(3)(4)


$

(0.02

)


$

(0.06

)


$

0.92


$

0.86


AOCF (2)


(11.7

)


(17.2

)


168.9


143.1


AOCF per share, basic and diluted (2)(4)


$

(0.06

)


$

(0.09

)


$

0.82


$

0.78


Cash dividends declared on common shares


31.7


31.7


95.1


94.8


Cash dividends declared per share


$

0.18


$

0.18


$

0.54


$

0.54


(1)

Comparative figures have been reclassified to exclude the results of the Specialty Chemicals segment due to the divestiture of the segment subsequent to the end of the first quarter. See the unaudited condensed interim consolidated financial statement for the three and nine months ended, third quarter, 2021 and 2020.

(2)

EBITDA from operations, Adjusted EBITDA, interest expense, AOCF before transaction and other costs, and AOCF are Non-IFRS measures. See “Non-IFRS Financial Measures”.

(3)

Transaction and other costs for the three and nine months ended, third quarter, 2021 and 2020 are related to acquisition activity, restructuring and the integration of acquisitions and the divestiture of the Specialty Chemical segment. See “Transaction and Other Costs” for further details.

(4)

The weighted average number of shares outstanding for the three and nine months ended, third quarter, 2021 was 206.0 million (three and nine months ended, September 30, 2020 was 201.8 million, and 184.2 million). The weighted average number of shares assumes the exchange of the preferred shares into common shares. There were no other dilutive instruments with respect to AOCF per share and AOCF before transaction and other costs per share for the three and nine months ended, third quarter, 2021 and 2020.

Segmented Information


Three Months Ended


Nine Months Ended


September 30


September 30

(millions of dollars)


2021


2020(1)


2021


2020(1)

EBITDA from operations(1)


U.S. Propane Distribution


(7.8

)


(4.0

)


146.3


126.5


Canadian Propane Distribution


21.2


21.6


120.5


129.4


13.4


17.6


266.8


255.9


(1)

See “Non-IFRS Financial Measures”. Comparative figures have been reclassified to exclude the results of the Specialty Chemicals segment as a result of the announced divestiture and subsequent closing of the transaction. See the unaudited condensed interim consolidated financial statements and notes thereto as at and for the three and nine months ended, third quarter, 2021 and 2020.

MD&A and Financial Statements

Superior’s MD&A, the unaudited Interim Condensed Consolidated Financial Statements and the Notes to the Interim Condensed Consolidated Financial Statements for the three and nine months ended September 30, 2021 provide a detailed explanation of Superior’s operating results. These documents are available online at Superior’s website at www.superiorplus.com under the Investor Relations section and on SEDAR under Superior’s profile at www.sedar.com.

2021 Third Quarter Conference Call

Superior will be conducting a conference call and webcast for investors, analysts, brokers and media representatives to discuss the Third Quarter Results at 10:30 a.m. EST on Friday, November 12, 2021. To participate in the call, dial: 1-844-389-8661. Internet users can listen to the call live, or as an archived call on Superior’s website at www.superiorplus.com under the Events section.

Non-IFRS Financial Measures

Throughout the first quarter earnings release, Superior has used the following terms that are not defined by International Financial Reporting Standards (“Non-IFRS Financial Measures”), but are used by management to evaluate the performance of Superior and its business: AOCF before and after transaction and other costs, earnings before interest, taxes, depreciation and amortization (“EBITDA”) from operations, Adjusted Gross Profit, Adjusted EBITDA, Total Debt to Adjusted EBITDA leverage ratio, Senior Debt, Credit Facility EBITDA and Senior Debt to Credit Facility EBITDA leverage ratio. These measures may also be used by investors, financial institutions and credit rating agencies to assess Superior’s performance and ability to service debt. Non-IFRS financial measures do not have standardized meanings prescribed by IFRS and are therefore unlikely to be comparable to similar measures presented by other companies. Securities regulations require that Non-IFRS financial measures are clearly defined, qualified and reconciled to their most comparable IFRS financial measures. Except as otherwise indicated, these Non-IFRS financial measures are calculated and disclosed on a consistent basis from period to period. Specific items may only be relevant in certain periods. See “Non-IFRS Financial Measures” in the MD&A for a discussion of Non-IFRS financial measures and certain reconciliations to IFRS financial measures.

The intent of Non-IFRS financial measures is to provide additional useful information to investors and analysts, and the measures do not have any standardized meaning under IFRS. The measures should not, therefore, be considered in isolation or used in substitute for measures of performance prepared in accordance with IFRS. Other issuers may calculate Non-IFRS financial measures differently. Investors should be cautioned that AOCF, EBITDA from operations, Adjusted EBITDA and Credit Facility EBITDA should not be construed as alternatives to net earnings, cash flow from operating activities or other measures of financial results determined in accordance with IFRS as an indicator of Superior’s performance.

Adjusted Operating Cash Flow and Adjusted Operating Cash Flow per Share

AOCF is equal to cash flow from operating activities as defined by IFRS, adjusted for changes in non-cash working capital, other expenses, non-cash interest expense, current income taxes and finance costs. Superior may deduct or include additional items in its calculation of AOCF; these items would generally, but not necessarily, be infrequent in nature and could distort the analysis of trends in business performance. Excluding these items does not imply they are non-recurring. AOCF and AOCF per share are presented before and after transaction and other costs.

AOCF per share before transaction and other costs is calculated by dividing AOCF before transaction and other costs by the weighted average number of shares outstanding. AOCF per share is calculated by dividing AOCF by the weighted average number of shares outstanding.

AOCF is a performance measure used by management and investors to evaluate Superior’s ongoing performance of its businesses and ability to generate cash flow. AOCF represents cash flow generated by Superior that is available for, but not necessarily limited to, changes in working capital requirements, investing activities and financing activities of Superior.

The seasonality of Superior’s individual quarterly results must be assessed in the context of annualized AOCF. Adjustments recorded by Superior as part of its calculation of AOCF include, but are not limited to, the impact of the seasonality of Superior’s businesses, principally the Energy Distribution segment, by adjusting for non-cash working capital items, thereby eliminating the impact of the timing between the recognition and collection/payment of Superior’s revenues and expenses, which can differ significantly from quarter to quarter. AOCF is reconciled to cash flow from operating activities. Please refer to the Financial Overview section of the MD&A for the reconciliation.

EBITDA from operations

EBITDA from operations is defined as Adjusted EBITDA excluding costs that are not considered representative of Superior’s underlying core operating performance, including gains and losses on foreign currency hedging contracts, corporate costs and transaction and other costs. Management uses EBITDA from operations to set targets for Superior (including annual guidance and variable compensation targets). EBITDA from operations is reconciled to net earnings before income taxes. Please refer to the Results of Operating Segments in the MD&A for the reconciliations.

Adjusted EBITDA

Adjusted EBITDA represents earnings before interest, taxes, depreciation, amortization, losses (gains) on disposal of assets, finance expense, restructuring costs, transaction and other costs, and unrealized gains (losses) on derivative financial instruments. Adjusted EBITDA is used by Superior and investors to assess its consolidated results and ability to service debt. Adjusted EBITDA is reconciled to net earnings before income taxes.

Adjusted EBITDA is a significant performance measure used by management and investors to evaluate Superior’s ongoing performance of its businesses. Adjusted EBITDA is also used as one component in determining short-term incentive compensation for certain management employees.

The seasonality of Superior’s individual quarterly results must be assessed in the context of annualized Adjusted EBITDA.

Total Net Debt to Adjusted EBITDA Leverage Ratio and Pro Forma Adjusted EBITDA

Adjusted EBITDA for the Total Net Debt to Adjusted EBITDA Leverage Ratio is defined as Adjusted EBITDA calculated on a 12-month trailing basis giving pro forma effect to acquisitions and dispositions adjusted to the first day of the calculation period (“Pro Forma Adjusted EBITDA”). Pro Forma Adjusted EBITDA is used by Superior to calculate its Total Net Debt to Adjusted EBITDA Leverage Ratio.

Total Net Debt is determined by taking the sum of borrowings before deferred financing fees and lease liabilities and reducing this by the cash and cash equivalents balance.

To calculate the Total Net Debt to Adjusted EBITDA Leverage Ratio divide Total Net Debt by Pro Forma Adjusted EBITDA. Total Net Debt to Adjusted EBITDA Leverage Ratio is used by Superior and investors to assess its ability to service debt.

Forward Looking Information

Certain information included herein is forward-looking information within the meaning of applicable Canadian securities laws. Forward-looking information may include statements regarding the objectives, business strategies to achieve those objectives, expected financial results (including those in the area of risk management), economic or market conditions, and the outlook of or involving Superior, Superior LP and its businesses. Such information is typically identified by words such as “anticipate”, “believe”, “continue”, “estimate”, “expect”, “plan”, “forecast”, “future”, “outlook, “guidance”, “may”, “project”, “should”, “strategy”, “target”, “will” or similar expressions suggesting future outcomes.

Forward-looking information in this document includes: future financial position, expected Adjusted EBITDA and the anticipated closing of the Kamps acquisition and the associated timing.

Forward-looking information is provided for the purpose of providing information about management’s expectations and plans about the future and may not be appropriate for other purposes. Forward-looking information herein is based on various assumptions and expectations that Superior believes are reasonable in the circumstances. No assurance can be given that these assumptions and expectations will prove to be correct. Those assumptions and expectations are based on information currently available to Superior, including information obtained from third party industry analysts and other third party sources, and the historic performance of Superior’s businesses. Such assumptions include the time required to complete the regulatory process for the Kamps acquisition, anticipated financial performance, current business and economic trends, the amount of future dividends paid by Superior, business prospects, utilization of tax basis, regulatory developments, currency, exchange and interest rates, future commodity prices relating to the oil and gas industry, future oil rig activity levels, trading data, cost estimates, our ability to obtain financing on acceptable terms, expected life of facilities and statements regarding net working capital and capital expenditure requirements of Superior or Superior LP, the assumptions set forth under the “Financial Outlook” sections of our MD&A. The forward looking information is also subject to the risks and uncertainties set forth below.

By its very nature, forward-looking information involves numerous assumptions, risks and uncertainties, both general and specific. Should one or more of these risks and uncertainties materialize or should underlying assumptions prove incorrect, as many important factors are beyond our control, Superior’s or Superior LP’s actual performance and financial results may vary materially from those estimates and intentions contemplated, expressed or implied in the forward-looking information. These risks and uncertainties include incorrect assessments of value when making acquisitions, increases in debt service charges, the loss of key personnel, the anticipated impact of the COVID-19 pandemic and the expected economic recession, fluctuations in foreign currency and exchange rates, inadequate insurance coverage, liability for cash taxes, counterparty risk, compliance with environmental laws and regulations, reduced customer demand, operational risks involving our facilities, force majeure, labour relations matters, our ability to access external sources of debt and equity capital, and the risks identified in (i) our MD&A under the heading “Risk Factors” and (ii) Superior’s most recent Annual Information Form. The preceding list of assumptions, risks and uncertainties is not exhaustive.

When relying on our forward-looking information to make decisions with respect to Superior, investors and others should carefully consider the preceding factors, other uncertainties and potential events. Any forward-looking information is provided as of the date of this document and, except as required by law, neither Superior nor Superior LP undertakes to update or revise such information to reflect new information, subsequent or otherwise. For the reasons set forth above, investors should not place undue reliance on forward-looking information.

For more information about Superior, visit our website at www.superiorplus.com.


Contacts

Beth Summers Executive Vice President and Chief Financial Officer
Phone: (416) 340-6015

Rob Dorran Vice President, Investor Relations and Treasurer
Phone: (416) 340-6003
Toll Free: 1-866-490-PLUS (7587)

The Firm’s Latest Venture Fund Brings Together an Expanded Network of Forward-Looking Utilities and Industrials Backing Innovators Advancing Critical Climate Technologies

NEW YORK--(BUSINESS WIRE)--Energy Impact Partners LP (EIP), a global venture capital firm leading the transition to a sustainable future, announced today the final close on its latest Flagship Fund with over $1 billion in capital commitments. The Fund brings together one of the industry's most comprehensive ecosystems of strategic and financial investors across the utility, energy, real-estate, mobility and industrial sectors that are accelerating progress toward net zero GHG emissions by investing in venture and growth companies advancing critical climate solutions.


Founded by a team of industry veterans in 2015, EIP is custom-built to lead the transition to a zero-carbon economy. Today, with nearly 60 professionals located across six global offices, EIP manages more than $2 billion in assets under management across early stage, venture, growth, credit and infrastructure investments. The EIP team is comprised of experienced investors, researchers and technologists who work closely with the firm’s strategic limited partners to accelerate their own paths to net zero and catalyze growth in EIP's portfolio of innovative climate investments. EIP has established one of the world's largest climate focused venture technology portfolios with over 75 investments ranging from revolutionary technology start ups to established enterprise platforms.

“We are thrilled to bring together an even larger coalition of utilities and industrials focused on creating a sustainable future,” said Hans Kobler, Founder and Managing Partner of EIP. “Tackling climate change is a major challenge and opportunity that can only be solved by working together. Our unique engagement model helps our partners innovate, drives growth in our investments and maximizes real near-term climate impact as a result.”

EIP looks for inspired entrepreneurs who are re-imagining the future and helps them scale by leveraging its strategic partner coalition. Given EIP's distinct approach, investment highlights from the firm’s portfolio where EIP led the Series A investment include: Dragos, the largest industrial cyber security company worldwide whose latest fundraising round valued the company at $1.7 billion; Arcadia, a software platform connecting enterprises and consumers to clean energy solutions; and Enchanted Rock, a category-leading reliability platform enabling decarbonization and electrification of the grid. These examples, as well as the other companies within EIP’s portfolio, are critical to accelerating the energy transition.

Fund II features an industry-leading group of corporate partners and investors including:

Alliant Energy (NASDAQ: LNT), Ameren Corp. (NYSE: AEE), AvalonBay (NYSE: AVB), Avista Corp. (NYSE: AVA), Burns & McDonnell, Cox Enterprises, Duke Energy (NYSE: DUK), EDF Group (Euronext Paris) through its corporate venture arm EDF Pulse Holding, Emera Inc. (TSX: EMA), ENMAX Corporation, Entergy Corporation (NYSE: ETR), Enterprise Holdings, Evergy Inc. (NYSE: EVRG), FirstEnergy Corp. (NYSE: FE), Fortis Inc. (TSX, NYSE: FTS), Hawaiian Electric Industries, Inc. (NYSE: HE), Hydro One Ltd (TSE: H), MGE Energy, Inc. (NASDAQ: MGEE), Microsoft (NASDAQ: MSFT), through its Climate Innovation Fund, OGE Energy Corp. (NYSE: OGE), Park Hotels & Resorts (NYSE: PK), Pinnacle West Capital Corporation (NYSE: PNW), Portland General Electric Company (NYSE: POR), PPL Corporation (NYSE: PPL), Public Storage (NYSE: PSA), Southern Company (NYSE: SO), TC Energy Corporation (TSX, NYSE: TRP), Tennessee Valley Authority Asset Retirement Trust, Williams (NYSE: WMB) and Xcel Energy (NASDAQ: XEL) among others.

“As a founding partner of Energy Impact Partners, Southern Company continues to believe in the platform’s mission to find and nurture those companies aiding the world’s transition to a sustainable energy future. Equally important are the deeper conversations we are having with the portfolio companies around technology and business model innovation - we’ve engaged over half of the portfolio companies in those conversations. We see this as vital for the future of our business, our ability to achieve our sustainability goals and delivering the energy solutions our customers require,” said Christopher Cummiskey, EVP and Chief Customer Solutions Officer, Southern Company.

EIP's approach is predicated on working closely with industry incumbents who can make an immediate impact given the breadth of their activities. Building off this successful strategy, Fund II has already made significant investments in more than a dozen promising technology companies.

“Delivering a cleaner energy future depends on what we do today,” said David Hutchens, President and CEO, Fortis Inc. “By joining EIP’s limited partner advisory council, sharing our expertise and cultivating an innovative culture at Fortis, we are investing in the most transformative new ideas in our industry.”

Bob Frenzel, President and CEO of Xcel Energy said: “As the first major U.S. power provider to announce a vision to deliver 100% carbon-free electricity to customers, Xcel Energy is committed to building a sustainable clean energy future. We are long-time supporters of Energy Impact Partners and are proud to have invested in this Fund. We look forward to seeing the innovation and new technologies that arise.”

Please email This email address is being protected from spambots. You need JavaScript enabled to view it. for more information on Fund II or visit www.energyimpactpartners.com.

About Energy Impact Partners
Energy Impact Partners, LP (EIP) is a global venture capital firm leading the transition to a sustainable future. EIP brings together entrepreneurs and the world's most forward-looking energy and industrial companies to advance innovation. With over $2.0 billion in assets under management, EIP invests globally across venture, growth, credit, and infrastructure – and has a team of nearly 60 professionals based in its offices in New York, San Francisco, Palm Beach, London, Cologne, and Oslo. For more information on EIP, please visit www.energyimpactpartners.com.


Contacts

Tori McDonnell
Silverline Communications – on behalf of EIP
703-338-2362
This email address is being protected from spambots. You need JavaScript enabled to view it.

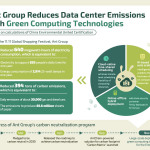
HANGZHOU, China--(BUSINESS WIRE)--#carbon--Ant Group announced today that according to calculations by China Environmental United Certification, it was able to cut its data centers’ electricity consumption by 640 megawatt-hours during this year’s 11.11 Global Shopping Festival from November 1 to November 11, thanks to a range of new green computing technologies.


The use of these technologies contributed to reducing carbon emissions by 394 tons over the 11-day period, equivalent to the daily emissions of about 30,000 gas and diesel cars.

The green computing technologies, including online-offline hybrid deployment, cloud-native time-shared scheduling and AI-based auto scaling, allow data centers to provide computing resources as efficiently as possible and ensure applications have access to the computing power they need, while avoiding servers running idle. Using these technologies, data centers can support more business demands with fewer servers, maximize their utilization of computing resources, minimize wasted electricity, and reduce energy intensity.

Ni Xingjun, Chief Technology Officer of Ant Group, said: “As a leading payment platform providing comprehensive services to hundreds of millions of users every day, Alipay needs to support massive computing tasks around the clock while ensuring reliability and security. We not only pay attention to the capacity of our computing system, but also its energy efficiency, and are always committed to developing and deploying more and more innovative green computing technologies."

Fueling today’s digital economy, data centers consume a large amount of electricity, which also comes with carbon emissions. Ant Group began exploring application of innovative technologies to improve its data centers' operational efficiency in 2019. Since then, it has more than doubled its data centers’ server utilization rate.

In March 2021, Ant Group pledged to become carbon neutral by 2030. In addition to reducing carbon emissions with green technologies, Ant Group also launched several campaigns during the 11.11 Global Shopping Festival to encourage green activities. MYbank, an online private commercial bank and associate of Ant Group, announced an initiative enabling merchants to shorten their accounts receivable turnover period for certified green products. Moreover, Alipay Ant Forest, a tree-planting mini-program within the Alipay app, also worked with brands and offered incentives to consumers for choosing energy-efficient home appliances.

About Ant Group

Ant Group aims to create the infrastructure and platform to support the digital transformation of the service industry. It strives to enable all consumers and small and micro businesses to have equal access to financial and other services that are inclusive, green and sustainable.

Ant Group is the owner and operator of Alipay, the leading digital payment platform in China serving hundreds of millions of users, and connecting them with merchants and partner financial institutions that offer inclusive financial services and digital daily life services such as food delivery, transport, entertainment, and healthcare.

Ant Group has further introduced Alipay+, which provides global cross-border mobile payments and marketing solutions that enable global e-wallets and merchant partners, especially small and medium-sized businesses, to better serve their users and customers from all over the world.


Contacts

Media Inquiries
Ant Group
Vick Li Wei
This email address is being protected from spambots. You need JavaScript enabled to view it.

WESTLAKE, Ohio--(BUSINESS WIRE)--TravelCenters of America Inc. (Nasdaq: TA), nationwide operator and franchisor of the TA, Petro Stopping Centers and TA Express travel center network, has teamed up with Mobil Delvac™ heavy-duty diesel engine oil to donate $50,000 to Folds of Honor, an organization providing educational scholarships to the spouses and children of America’s fallen and disabled service members.


This is the fifth year in a row that TA and Mobil Delvac heavy-duty diesel engine oil have come together to support Folds of Honor and pay tribute to fallen service members. To date, the companies together have donated a total of $250,000 to the organization.

“As a nearly 50-year-old American company, we are proud to support U.S. veterans and active-duty military,” said Jon Pertchik, Chief Executive Officer of TA. “On this Veterans Day, we honor those who have made the ultimate sacrifice, and are pleased this donation will provide educational support for the families of those who have fallen.”

“We are thankful for the contributions of our veterans and are proud to honor them by supporting scholarships that will help their families achieve their dreams through education,” added Kristine Amy, Mobil Delvac USA Commercial Brand Manager.

Since launching in 2007, Folds of Honor has awarded nearly 29,000 educational scholarships to the families of these American heroes. There are more than 1 million disabled and fallen service members and nearly two million dependents of military heroes adversely affected by war.

About TravelCenters of America

TravelCenters of America Inc. (Nasdaq: TA) is the nation's largest publicly traded full-service travel center network. Founded in 1972 and headquartered in Westlake, Ohio, its more than 18,000 team members serve guests in over 275 locations in 44 states and Canada, principally under the TA®, Petro Stopping Centers® and TA Express® brands. Offerings include diesel and gasoline fuel, truck maintenance and repair, full-service and quick-service restaurants, travel stores, car and truck parking and other services dedicated to providing great experiences for its guests. TA is committed to sustainability, with its specialized business unit, eTA, focused on sustainable energy options for professional drivers and motorists, while leveraging alternative energy to support its own operations. TA operates over 600 full-service and quick-service restaurants and nine proprietary brands, including Iron Skillet® and Country Pride®. For more information, visit www.ta-petro.com.


Contacts

Tina Arundel
TravelCenters of America
440-250-4758
This email address is being protected from spambots. You need JavaScript enabled to view it.

As a part of COP26, members of the US Senate and House of Representatives visited Quinbrook’s innovative UK aggregator and flexible energy specialist

LONDON & HOUSTON--(BUSINESS WIRE)--Quinbrook Infrastructure Partners ("Quinbrook"), a specialist global investment manager focused exclusively on renewables, storage and grid support infrastructure, was pleased to welcome two groups of US members of Congress this week to its portfolio company, Flexitricity, as a part of their trip to the COP26 conference in Glasgow.


Headquartered in Edinburgh, Flexitricity was the first demand response aggregator to market in Great Britain,1 and now manages a virtual power plant with a contracted portfolio of 595 MW of distributed flexible energy from a wide range of assets owned by customers across the region. The company looks for flexibility in electricity consumption and generation to enhance grid support during periods of system stress and higher power prices; this, in turn, reduces carbon emissions and generates cost savings for energy consumers. The addition of Flexitricity takes Quinbrook’s total flexible energy portfolio towards c. 1 GW.2

The Senate delegation was led by Senator Chris Coons who was joined by fellow members of Congress who attended the event during the COP26 summit in Glasgow (full list below).

Senator Coons, co-chair of the Senate Climate Solutions Caucus said, “While leading a bipartisan Congressional delegation to COP26, I appreciated the opportunity to tour the Flexitricity Control Center in Edinburgh and hear from leaders of Quinbrook and the H100 Fife hydrogen project. As we work to develop robust, secure infrastructure for renewables in the United States – one of the core strategies we have to reduce emissions and combat climate change — we can learn from our Scottish partners about their transition to renewable energy.”

Flexible energy solutions are an essential element of the UK’s changing energy mix and is a key component of Quinbrook’s efforts to support the UK government’s 2035 Net Zero electricity target3 through investments in smarter, more resilient and flexible power management systems that enables increased reliability on variable renewable energy.

The Republican delegation was led by Representative Garrett Graves, ranking member of the House Select Committee on the Climate Crisis, who was joined by other representatives (listed below) whose visit to COP26 was the first time a conservative-only delegation had attended the annual gathering of leaders and activists.

Congressman Graves said, “Thank you to Flexitricity for hosting our delegation for an informative site visit. It was great to hear from those advancing creative ways to use technology to optimize energy sources for emissions reduction.”

Rory Quinlan, Co-Founder and Managing Partner of Quinbrook said, “We were delighted to welcome the US Congressional delegations to tour our Flexitricity headquarters and see first-hand the innovation underway in the UK to help combat the global climate crisis. As the UK’s energy system undergoes a transformational shift to scale up its reliance on renewable energy to meet its net zero goals, it’s critical that this rapid energy transition is delivered without disruption to energy security and reliability. What Flexitricity does is a key part of ensuring there continues to be reliable yet affordable, emissions-free energy to meet growing demand.”

These visits by US elected officials come on the heels of Quinbrook’s recent announcement of Project Fortress, the largest consented single-site solar PV and battery storage installation in the UK,4 which is expected to generate 350 MW of solar PV power and includes 150 MW battery storage to support the UK grid.5 Last year, Quinbrook announced the approval of Project Gemini, a solar PV + battery storage project comprising of 690 MW of solar PV and 380 MW of battery storage6 to provide renewable power to the City of Las Vegas, once operational. At the time of its federal approval, Gemini was the largest solar project in US history and one of the largest in the world.7

Quinbrook and its portfolio companies operate a variety of additional solar, wind and biomass energy sources, energy storage systems, renewables for green data centres and other mission-critical infrastructure investments across the US, UK and Australia that encompass over 18 GW of renewable energy and transition projects,8 generating more than 3.3 TWh of renewable energy in 2020 and delivering an estimated 2.4 million tons of avoided carbon emissions. The company’s commitment to ESG means that each project not only reduces emissions but also aims to create and preserve jobs, promote sustainability, foster community engagement, improve transparency and enhance the local economy.9

These are just some examples of Quinbrook’s commitment to investing in impactful new infrastructure and advanced technology solutions to affordably and sustainably support a global shift to alternative energy adoption and sustainable consumption. With all eyes on Glasgow this fortnight, we are pleased to showcase how Quinbrook and its investors are supporting the global race to net zero while maintaining the highest standard of ESG principles when creating new infrastructure projects that create and preserve jobs, stimulate local economies and deliver positive environmental outcomes,” added Mr. Quinlan.

The members of the Congressional delegations that visited Flexitricity included:

  • Senator Chris Coons (D-DE)
  • Senator Tom Carper (D-DE), Chairman, Environment and Public Works Committee
  • Senator Jeff Merkley (D-OR), Environment and Public Works Committee
  • Senator John Hickenlooper (D-CO), Energy and Natural Resources Committee
  • Senator Kirsten Gillibrand (D-NY)
  • Senator Michael Bennet (D-CO)
  • Senator Tammy Baldwin (D-WI)
  • Representative Scott Peters (D-CA-52), Energy and Commerce Committee
  • Representative Tom Malinowski (D-NJ-7)
  • Representative Garret Graves (R-LA-6), Natural Resources Committee
  • Representative John Curtis (R-UT-3), Energy and Commerce Committee
  • Representative Dan Crenshaw (R-TX-2), Energy and Commerce Committee
  • Representative Mariannette Miller-Meeks (R-IA-2)

About Flexitricity

Flexitricity was the first demand response aggregator to market in Great Britain,10 and now manages a virtual power plant with a contracted portfolio of 595 MW of distributed flexible energy. Headquartered in Edinburgh, Flexitricity partners with businesses throughout Great Britain to provide reserve electricity to National Grid. The word “Flexitricity” means “Flexible Electricity”. The company looks for flexibility in electricity consumption and generation, creating revenue for energy users and generators as well as reducing national CO2 emissions and helping to secure energy supplies. The Flexitricity team is fully engaged at all industry and regulatory levels and has a track record that demonstrates innovation and delivery success. Flexitricity is a portfolio company of Quinbrook Infrastructure Partners.

About Quinbrook

Quinbrook Infrastructure Partners (http://www.quinbrook.com) is a specialist investment manager focused exclusively on renewables, storage and grid support infrastructure and operational asset management in the US, UK and Australia. Quinbrook is led and managed by a senior team of power industry professionals who have collectively invested c. USD 8.2 billion equity in energy infrastructure assets since the early 1990s, representing a total enterprise value of c. USD 28.7 billion or 19.5 GW of power supply capacity. Quinbrook's investment and asset management team has offices in Houston, London, Jersey, and the Gold Coast of Australia. Quinbrook has completed and actively manages a diverse range of direct investments in both utility and distributed scale wind and solar power, grid support, biomass, battery storage and “smart grid” projects in the US, UK and Australia.

________________________

1 Scottish Financial News, “Quinbrook acquires Edinburgh-based Flexitricity” (15 September 2020)

2 As at 30 September 2021, based on Flexitricity’s contracted portfolio of 595.5 MW and an additional 300 MW from Velox Power

3 HM Government, “Net Zero Strategy: Build Back Greener” (October 2021)

4 As at September 2021 based on Bloomberg NEF data

5 As at September 2021

6 As at June 2021

7 Green Tech Media, “Trump Administration Approves $1B Gemini Solar Project in Nevada Desert” (11 May 2020)

8 As at 30 June 2021

9 As demonstrated under the Quinbrook Low Carbon Power Fund as at 30 June 2021

10 Scottish Financial News, “Quinbrook acquires Edinburgh-based Flexitricity” (15 September 2020)


Contacts

Media:
Jennifer Pflieger
This email address is being protected from spambots. You need JavaScript enabled to view it.
+1 (212) 446-1866

Cutting-edge carbon accounting software will ensure 100 percent of JPMorgan Chase’s electricity consumption is matched in real-time to renewable generation

AUSTIN, Texas--(BUSINESS WIRE)--#ESG--ClearTrace, a leading energy-tracking and carbon accounting software company, today announced a collaboration with EDF and JPMorgan Chase to ensure that 100% of the electricity consumed by JPMorgan Chase’s UK offices operations are matched in real-time with renewable energy. As part of the deal, EDF, Britain’s largest producer of zero-carbon electricity, will match JPMorgan Chase’s electricity consumption with renewable generation on a 24/7 basis, through source-specific access to EDF’s 8 TWh of Power Purchase Agreement portfolio.


Energy production and consumption will be monitored using blockchain-based energy-tracking technology from ClearTrace to ensure that the electricity consumed is matched digitally, on a half-hourly basis, to renewable generation. This platform will provide an accurate, real-time view into JPMorgan Chase’s carbon footprint enabling auditable, around-the-clock monitoring of energy generation and consumption.

EDF will provide JPMorgan Chase with enough renewable electricity each year to power more than 3 million square feet of offices across the UK, which is the equivalent of powering nearly 33,000 households in the UK. This groundbreaking collaboration will be a model for large businesses looking to decarbonize their electricity supply and significantly improve their carbon footprint through carbon accounting.

“We are delighted to be partnering with JPMC and EDF to deliver half-hourly load-matching of consumption and generation data,” said Lincoln Payton, CEO of ClearTrace. “More and more leading-edge businesses are seeking detailed data and real-time tracking to help them shrink their carbon footprint and prove their progress — we are committed to supporting this transition, helping businesses like JPMC to be more accountable, efficient, and transparent in their energy usage.”

“Thanks to our strength and expertise in renewable PPAs and supply, we have delivered an innovative, tailored solution for JPMorgan Chase,” said Raghav Singh, Head of Large Business at EDF. “Zero carbon electricity will be essential for British businesses to achieve Net Zero and we are proud to be supporting our customers on their journeys, delivering solutions that meet their diverse requirements.”

This announcement is part of JPMorgan Chase’s commitment to maintain carbon-neutral operations annually and source renewable energy for 100% of global power needs. The UK-based project is the second agreement between ClearTrace and JPMorgan Chase. In 2020, ClearTrace announced plans to offer a carbon accounting solution in partnership with Brookfield Renewable to provide 24/7 renewable energy generation to JPMorgan Chase’s New York operations.

About ClearTrace
ClearTrace is a leading energy, data, and technology company streaming secure energy data to the world of energy management, ESG reporting, and corporate sustainability. ClearTrace’s digital assets represent the purest form of proof and immutability for the real-world impact of energy generation. ClearTrace allows companies to stand behind their claims of carbon reductions, sustainability, and renewable energy to prevent greenwashing and provide a source of truth for corporate decarbonization. For more information, please visit cleartrace.io or contact This email address is being protected from spambots. You need JavaScript enabled to view it..

About JPMorgan Chase
JPMorgan Chase & Co. (NYSE: JPM) is a leading global financial services firm with assets of $3.7 trillion and operations worldwide. The Firm is a leader in investment banking, financial services for consumers and small businesses, commercial banking, financial transaction processing, and asset management. A component of the Dow Jones Industrial Average, JPMorgan Chase & Co. serves millions of customers in the United States and many of the world’s most prominent corporate, institutional and government clients under its J.P. Morgan and Chase brands. Information about JPMorgan Chase & Co. is available at www.jpmorganchase.com.

About EDF
EDF is helping Britain achieve Net Zero by leading the transition to a cleaner, low emission electric future and tackling climate change. We are Britain’s biggest generator of zero carbon electricity – from our eight nuclear power stations and more than thirty wind farms – meeting around one-fifth of the country’s demand. In addition to being one of the largest suppliers to British homes and businesses, we’re a leading supplier of innovative energy solutions that are helping our customers become more energy efficient and independent. We continue to invest in the UK’s low carbon energy infrastructure, constructing the first new nuclear power station in a generation at Hinkley Point C, leading the development of plans for Sizewell C in Suffolk, and construction, planning and development across a range of technologies including onshore and offshore wind, solar and battery storage.

EDF is part of EDF Group, the world’s biggest electricity generator. In the UK we employ around 11,000 people.


Contacts

Media
Kenny Gayles
This email address is being protected from spambots. You need JavaScript enabled to view it.

DUBLIN--(BUSINESS WIRE)--The "Air-to-Air Refueling Market by System (Probe & Drogue, Boom Refueling, Autonomous), Component (Pumps, Valves, Hoses, Boom, Probes, Fuel Tanks, Pods), Aircraft Type (Fixed, Rotary), Type (Manned, Unmanned), End User, Region - Global Forecast to 2025" report has been added to ResearchAndMarkets.com's offering.


The air-to-air refueling market size is projected to grow from an estimated USD 501 million in 2020 to USD 851 million by 2025, at a CAGR of 11.2% during the forecast period.

The outbreak of COVID-19 and its resultant lockdowns and supply chain disruptions have adversely affected the aerospace and defense industry, with the suspension and delay of new defense procurement and maintenance projects. OEMs have been significantly affected due to restrictions and the temporary halts in production, while the impact on the aftermarket has been comparatively lower due to the basic maintenance and monitoring requirements of combat aircraft. For instance, in October 2020, the Boeing KC-46A Pegasus in-flight refueling tanker program reported a USD 67 million loss due to coronavirus disruptions resulting in production inefficiencies.

Based on end user, the aftermarket segment accounts for the largest market size during the forecast period

Based on end user, the air-to-air refueling market has been segmented into OEM and Aftermarket. The aftermarket segment is estimated to lead the air-to-air refueling market during the forecast period. The aftermarket companies offer complete maintenance, repair, and overhaul services. For example, damaged components of air-to-air refueling systems, such as hydraulic systems, fuel management systems, and safety systems, are considered for maintenance, repair, and overhaul. The aftermarket also offers repairing services for over-the-counter products in case hydraulic components such as pumps, couplings, and nozzles are damaged beyond repair.

Based on the aircraft type, the fixed-wing segment is projected to grow at the highest CAGR during the forecast period

Based on aircraft type, the fixed-wing segment is estimated to lead the air-to-air refueling market during the forecast period. A fixed wing aircraft attains flight using wings fixed to the fuselage to generate the necessary lift using the forward motion of the aircraft. The fixed wing aircraft segment is experiencing growth as it can be used for longer travel distances and has better aerodynamic structures than rotary wing aircraft. Fixed wing aircraft can also take flight in challenging conditions and environments.

North America is projected to grow at the highest CAGR during the forecast period.

North America is one of the leading markets for air-to-air refueling systems in terms of research and development activities, deployment, and the presence of key market players. The major countries under this region are the US and Canada. The US leads the air-to-air refueling market in North America. The military aviation sector in North America is growing steadily, and consequently created a significant demand for air-to-air refueling systems. The presence of major players, OEMs, and component manufacturers are one of the key factors expected to boost the air-to-air refueling market in North America. The US is expected to drive the growth of the North American air-to-air refueling market. An increasing number of military aircraft upgrade programs, ongoing research and development of advanced military aircraft platforms, and the presence of major systems and components manufacturers are expected to lead to a surge in demand for air-to-air refueling systems in North America during the forecast period.

Market Dynamics

Drivers

  • Increasing Demand for Air-to-Air Refueling Systems to Support Overseas Deployments
  • Increased Defense Expenditure of Countries
  • Development of Advanced Aerial Tankers
  • Increase in Combat Aircraft Procurement

Opportunities

  • Autonomous Refueling

Challenges

  • High Installation and Maintenance Cost

Companies Mentioned

  • Airbus
  • BAE Systems
  • Boeing
  • Cobham plc
  • Draken International
  • Eaton Corporation
  • Elbit Systems Ltd.
  • Esco Technologies
  • GE Aviation
  • Israel Aerospace Industries
  • Lockheed Martin Corporation
  • Marshall Aerospace and Defence Group
  • Moog
  • Northstar
  • Parker Hannifin Corporation
  • Protankgrup
  • Rafaut Group
  • Raytheon Technologies Corporation
  • Safran
  • Wittenstein Se

For more information about this report visit https://www.researchandmarkets.com/r/57pxt9


Contacts

ResearchAndMarkets.com
Laura Wood, Senior Press Manager
This email address is being protected from spambots. You need JavaScript enabled to view it.

For E.S.T Office Hours Call 1-917-300-0470
For U.S./CAN Toll Free Call 1-800-526-8630
For GMT Office Hours Call +353-1-416-8900

As a Service-Disabled Veteran-Owned Small Business, Apollo is a Designated Source for the U.S. Department of Veteran Affairs’ Procurement of EV Fleet Charging Stations

NEWARK, Calif.--(BUSINESS WIRE)--#ApolloSunguardSystems--FreeWire Technologies, a leader in electric vehicle (EV) charging and power solutions, has partnered with Apollo Sunguard Systems, Inc., a Service-Disabled Veteran-Owned Small Business (SDVOSB) and contractor with the U.S. General Services Administration (GSA) to provide ultrafast EV charging to the federal fleet industry. The collaboration combines Apollo’s past performance federal government services expertise with FreeWire’s infrastructure-light charging technology (the Buy America compliant Boost Charger) to enable fast deployment of high-power charging.


“We are proud to partner with FreeWire to accelerate decarbonization of the federal transportation sector,” said Apollo Sunguard President, Kevin Connelly. “The federal fleet’s transition to zero-emissions EVs should catalyze adoption nationwide, and with Boost Charger, the federal government can accelerate the scale-up of charging infrastructure while reducing the need for burdensome and costly grid upgrades.”

Apollo sells directly to federal, state, and local government agencies as a pre-approved vendor and bypasses the need for a lengthy competitive bidding process. With less than one percent of the government’s 657,000 vehicles currently electric, the White House has vowed to replace the nation’s fleet with clean electric vehicles. Deploying faster chargers as quickly as possible, and at a lower total cost, is critical to making the transition to electrification successful.

“FreeWire’s inclusion on Apollo’s GSA schedule will support government and military fleets in accelerating the build-out of fast EV charging stations, reducing costs and strain on the electric grid,” said Arcady Sosinov, FreeWire Technologies Founder and CEO. “Apollo’s deep expertise in serving government agencies as a distributor of EV charging solutions is especially crucial as state and federal fleets transition to electric vehicles.”

The first battery-integrated fast charging solution to be added to the GSA schedule is especially ideal for remote and urban areas, giving agencies the ability to deploy in hours, not months, and deliver fast charging where grid power is limited. As demonstrated by FreeWire’s recent deployment of Alaska’s first ultrafast charger, the Boost Charger plugs into the existing low-voltage utility service and delivers high-power charging in areas that typically need extensive grid upgrades. Because the fully-integrated systems charge EVs directly from the battery, and not the electric grid, demand charges are virtually eliminated with peak-shaving and load-shifting capabilities, in addition to proprietary management software which reduces costs and provides additional energy services. An independent report from the Electric Power Research Institute (EPRI) found potential cost-savings of $30,000 a year in energy fees and charges.

In addition to cost-savings and energy services, the Boost Charger’s semi-permanent design allows fleet operators the flexibility to assess utilization or return on investment and scale or relocate their infrastructure as needed.

FreeWire recently announced its compliance with Buy America provisions under the Federal Highway Administration (FHWA) requirements for domestic sourcing of components in the production of its Boost Charger, increasing control over its supply chain and making it one of a few preferred fast charging vendors for federally-funded transportation investments.

About FreeWire Technologies

FreeWire’s turnkey power solutions deliver energy whenever and wherever it is needed for reliable electrification beyond the grid (see video). With scalable clean power that moves to meet demand, FreeWire customers can tackle new applications and deploy new business models without the complexity of upgrading traditional energy infrastructure.

FreeWire has deployed battery-integrated chargers with Fortune 100 companies, commercial customers, fleets, retail locations, and gas stations. FreeWire and ampm, a bp subsidiary and convenience store chain with over 1,000 locations, have already deployed multiple public charging stations in the U.S. Learn more at www.freewiretech.com and follow us @FreeWireTech

About Apollo Sunguard Systems EVSE GSA Contractor

Since 2012, Apollo Sunguard has sold and distributed EV charging stations across the country, including over 100 federal agencies such as the State Department of Defense, FBI and the United States Fish and Wildlife Services. In 2017, we were awarded a blanket purchase agreement by GSA Fleet (BPA GS-30FGA082) making us one of only two vendors with a BPA for the sale of electric vehicle supply equipment. This allows us to sell ChargePoint EV stations, network plans, and EV accessories to federal agencies. With FreeWire added to the GSA schedule, we now have two leading fast charging solutions for government fleets. For additional information, please visit: https://apollosunguard.com/ev-charging/


Contacts

For Apollo Sunguard Systems
Cheray Keyes-Shima, APR, CPRC
Director, Marketing Communications
Apollo Sunguard
(941) 356-0262
This email address is being protected from spambots. You need JavaScript enabled to view it.

For FreeWire Technologies
Laurie Peters
Director, Marketing Communications
FreeWire
818-635-4101
This email address is being protected from spambots. You need JavaScript enabled to view it.

Cory Ziskind
ICR
646-277-1232
This email address is being protected from spambots. You need JavaScript enabled to view it.

HONG KONG--(BUSINESS WIRE)--#FnLWeek2022--F+L Week 2022 will be held in Bangkok, Thailand on April 27-29, 2022. A change to the event location was confirmed today by Vicky Villena-Denton, CEO of F&L Asia Ltd, the major industry publisher that puts on the popular yearly conference. F+L Week attracts a global audience, and the shift back to Bangkok follows a recent move by the Thailand government to open its borders to fully vaccinated travellers from 63 countries, including most of Asia-Pacific.


F+L Week 2022 will be F&L Asia's first in-person event since the advent of Covid-19 and will build on a successful F+L Week Virtual conference held early this year. “After a disruptive 18 months, we can’t wait to host all of our speakers, delegates, and sponsors in Thailand and I am sure it will be an event to remember,” says Villena-Denton. “The conference theme, Disruption & Transformation in the Fuels and Lubes Industry, provides a unique opportunity to explore the long-term impact of Covid-19, including the acceleration of electrification and digitalization, and to deliver insight on how to prepare your business moving forward,” she says.

Alongside the change to the event location, F+L Week has extended the timings for submission of abstract proposals and F&L Asia Awards nominations to December 15.

F+L Week’s exclusive networking event, F+L Connect, will be held on April 27, providing opportunities to connect with industry colleagues and develop mutually beneficial relationships. The event will offer a comprehensive series of training courses on April 27 to expand your or your employee’s knowledge on metalworking fluids (MWFs) or the special fluid requirements of electric vehicles (EVs). A tightly packed two-day technical session will be held on April 28-29. The popular F&L Asia Awards Dinner, where we recognise exceptional contributions to the fuels and lubricants industry as well as those that show outstanding potential, will be held on the evening of April 28.

F+L Week 2022 will again be co-located with the Annual Meeting of the Asian Lubricants Industry Association (ALIA) due to synergies between the two events. The ALIA Annual Meeting will be held from April 25-27, 2022 and will explore how to build resilience and incorporate sustainability in your supply chain.

For more information on F+L Week 2022 visit https://flweek.fuelsandlubes.com/

ABOUT F+L WEEK

F+L Week is the premier fuels, lubricants, additives and base oils conference in Asia-Pacific and the convergence of the Annual Fuels & Lubes Asia Conference and the Asia-Pacific Base Oil Conference. F+L Week is a unique platform for our industry to discuss the latest technical and marketing trends and for you to gain insights that you’ll never get anywhere else. It is not your typical conference. The event focuses on a specific theme based on a key industry issue, which is then addressed by carefully selected speakers, who are world experts and prominent industry personalities.

ABOUT F&L ASIA

F&L Asia Ltd. has been providing world-class fuel and lubricant industry news and events since 1995. The publication company provides media services to some of the biggest names in the industry and each year produces F+L Week, the industry conference and exhibition premier event.

Unparalleled thought leadership, stringent content quality standards and uncompromising journalism (gathering facts directly from the frontline, at the heart of the strategic Asian region) are some of F&L Asia’s core strengths and the reason why it retains an unchallenged “first with the latest” position. Directed by industry veteran journalist, Vicky Villena-Denton, F&L Asia has a diverse portfolio of unique and powerful lead-generation tools which allow advertisers and sponsors to increase their regional, as well as global, brand awareness, and establish, promote, and nurture their fluid industry connections within this tight-knit community.

For more information, please, visit our website: https://www.fuelsandlubes.com/


Contacts

Vicky Villena-Denton
F&L Asia Ltd.
Email: This email address is being protected from spambots. You need JavaScript enabled to view it.
22/F., 3 Lockhart Road
Wanchai, Hong Kong
Phone (Hong Kong): +852 3183 4143

PLEASANTON, Calif.--(BUSINESS WIRE)--#Leafygreensuppliers--DeltaTrak®, a leading innovator of cold chain management solutions, announces new FlashTrak Maritime Service, providing exporters and importers with shipment location visibility while at sea. Knowing the location of a shipment, the estimated time of arrival (ETA), and delayed arrival period from the original schedule, allows for advanced insurance claims notification, scheduling of inspections and customer pick-ups. This empowers decision-makers to quickly make informed decisions regarding cargo disposition.


FlashTrak’s Maritime Service tracks shipments, by using GPS positioning and automatic identification systems to show vessel location. Given the current state of supply chains around the world, having container visibility is extremely important. Typically, once a container leaves the port, its whereabouts are unknown. However, with maritime tracking, DeltaTrak customers can confidently proceed with business, knowing that should an unforeseen situation arise, they have the information necessary to take immediate action. This new service provides FlashTrak subscribers with end to end temperature and location data during ground and ocean transport. Other sensor data such as humidity, light and shock are also available, depending on the Real Time Logger model used.

Frederick Wu, CEO and Founder of DeltaTrak shared, “We pride ourselves in offering innovative technology solutions that enhance the value of our service, setting us apart in the industry. We believe this new maritime service will provide more confidence and significant value to our customers, protecting their cargo during this disruptive global supply chain situation. We are offering a free beta trial of this service to our customers.”

About DeltaTrak®

DeltaTrak® is a leading innovator of cold chain management, environmental monitoring and food safety solutions for the food, produce, life science, and chemical industries. Contact DeltaTrak® by phone at 1-800-962-6776 or by email at This email address is being protected from spambots. You need JavaScript enabled to view it.. Additional information can be found at www.deltatrak.com.


Contacts

Alex Kingston
DeltaTrak
Voice: +1 925-249-2250
Email: This email address is being protected from spambots. You need JavaScript enabled to view it.

GUILDFORD, England--(BUSINESS WIRE)--Black & Veatch has secured the contract to optimise steam generation at Sembcorp Energy UK’s (SEUK) 2,000-acre site at Wilton International.


SEUK’s site at Wilton International on Teesside sits within a hub of decarbonisation innovation. At the site, SEUK provides energy-intensive industrial businesses with combined heat and power (CHP) via the UK’s largest and most diverse private wire electricity network; which supplies electricity generated by gas and biomass.

The engineer, procure, construction management (EpCM) contract encompasses enhancements to both SEUK’s 75-megawatt (MW) combined cycle gas turbine (CCGT) and 30MW wood-fired biomass power generation assets.

With the CCGT alone generating up to 140 tonnes of steam per hour, optimisation will ensure a reliable steam supply for SEUK’s process industry clients at Wilton International, that is generated on the most efficient and cost-effective basis.

“This is a complex project on a busy, physically constrained site. Ensuring continuity of steam supply to SEUK’s clients during the work is paramount,” said Youssef Merjaneh, Senior Vice President, Black & Veatch Power - Europe, Middle East and Africa. “For projects like this an EpCM model offers the most flexibility to meet the owner’s requirements and can accommodate changes as the project develops. Final costs are optimised as a result including avoiding premiums for risk transfer, and controlling equipment and materials costs.”

Maximising the efficiency of the steam system at Wilton International includes replacing and optimising mechanical and electrical equipment, and control systems, on both the CCGT and biomass plant. Black & Veatch’s scope encompasses the role of Principal Designer.

“Our UK team has considerable CCGT experience on both utility and industrial sites. They have also proven the worth of EpCM contracting on numerous projects,” Merjaneh added. “To provide clients with strength in depth on UK projects like Wilton International, we will be using not just our in-country professionals, but expertise from across our global power business - for instance Thai engineering capabilities, and our US plant modernisation team.”

“We’re pleased to have appointed Black & Veatch for this project. Sembcorp Energy UK is committed to lowering the carbon emissions of its assets, and this includes making sure our current assets run as efficiently as possible,” commented Dave Thompson, UK Operations Director, Sembcorp Energy UK.

Click here to download an image of Wilton International.

About Black & Veatch

Black & Veatch is an employee-owned global engineering, procurement, consulting and construction company with a more than 100-year track record of innovation in sustainable infrastructure. Since 1915, we have helped our clients improve the lives of people around the world by addressing the resilience and reliability of our most important infrastructure assets. Our revenues in 2020 exceeded US$3.0 billion. Follow us on www.bv.com and on social media.

About Sembcorp Energy UK

Sembcorp Energy UK (SEUK), a wholly-owned subsidiary of Sembcorp Industries, is a leading provider of sustainable solutions supporting the UK’s transition to Net Zero. With an energy generation and battery storage portfolio of nearly 1GW in operation, our expertise helps major energy users and suppliers improve their efficiency, profitability, and sustainability, while supporting the growth of renewables and strengthening the UK’s electricity system.

Our Wilton International site on Teesside sits within a hub of decarbonisation innovation. At the site, we provide energy-intensive industrial businesses with combined heat and power (CHP) via our private wire network that supplies electricity generated by gas and biomass.

These services are complemented by our fleet of fast-acting, decentralised power stations and battery storage sites situated throughout England and Wales. Monitored and controlled from our central operations facility in Solihull, these flexible assets deliver electricity to the national grid, helping to balance the UK energy system and ensure reliable power for homes and businesses.

For more information on Sembcorp Energy UK visit www.sembcorpenergy.co.uk | LinkedIn | Twitter


Contacts

MALCOLM HALLSWORTH | +44 1483 319287 p | +44 7920 701764 m | This email address is being protected from spambots. You need JavaScript enabled to view it.
24-HOUR MEDIA HOTLINE | +1 855-999-5991

DALLAS--(BUSINESS WIRE)--Generational Equity, a leading mergers and acquisitions advisor for privately held businesses, is pleased to announce the sale of its client, Global Net Logistics, Inc. to Rhenus Logistics Americas (Rhenus). The acquisition closed November 1, 2021.


Global Net Logistics provides domestic and international freight forwarding, air and ocean, full truckload, and less than truckload services. The acquisition with Global Net Logistics will enable Rhenus to further solidify its air and ocean solutions, particularly its road freight services, to strengthen the existing LCL services and provide customers with door-to-door solutions. Global Net Logistics is located in Flower Mound, Texas.

Aligned strategically with the Rhenus 2025 growth vision, the acquisition will strengthen the company’s global air and ocean network in the southwest region of the USA and complement the existing Houston branch. Rhenus has 820 locations in 50 countries, and is headquartered in Holzwickede, Germany.

“This is a milestone for Rhenus Logistics Americas as we continue to invest and enhance our presence in the Americas Region. This acquisition will provide value and growth to the Rhenus worldwide network and expand our capabilities as we meet with the fast-paced and evolving demands of the supply chain industry,” said Jörn Schmersahl, CEO of Rhenus Air & Ocean Americas.

He added, “Our presence in the southwest region in the USA is an ample a vast opportunity in the market for Rhenus Logistics Americas, offering a full global network and supplemented air and ocean services to our current and prospective customers.”

In addition, Rhenus USA will take over the Global Net Logistics 22,500 square feet warehouse facility located five miles away from Dallas/ Fort Worth International Airport (DFW). The facility will strengthen the warehouse presence of Rhenus USA in the area, including land bridge and cross-border services between Mexico and the USA. The Southwest region has historically been one of the fastest-growing regions in the USA and is expecting continued growth in the future. The Rhenus Group recently acquired Polish freight forwarding and logistics company, C. Hartwig Gdynia, adding 12 additional locations, including New York.

Generational Equity Executive Managing Director of M&A – Central Region, Michael Goss, and his team lead by Managing Director, M&A, Luan Ly successfully closed the deal. Senior Managing Director David Robinson established the initial relationship with Global Net Logistics.

“This transaction should add more opportunities to a growing firm and allows the buyer to capture a larger footprint given a strong foundation in place. I wish them both all my very best,” said Ly.

About Generational Equity

Generational Equity, Generational Capital Markets (member FINRA/SIPC), Generational Wealth Advisors, Generational Consulting Group, and DealForce are part of the Generational Group, which is headquartered in Dallas and is one of the leading M&A advisory firms in North America.

With more than 250 professionals located throughout 16 offices in North America, the companies help business owners release the wealth of their business by providing growth consulting, merger, acquisition, and wealth management services. Their six-step approach features strategic and tactical growth consulting, exit planning education, business valuation, value enhancement strategies, M&A transactional services, and wealth management.

The M&A Advisor named the company the 2017 and 2018 Investment Banking Firm of the Year and Valuation Firm of the Year in 2020. For more information, visit https://www.genequityco.com/ or the Generational Equity press room.


Contacts

Carl Doerksen
972-232-1125
This email address is being protected from spambots. You need JavaScript enabled to view it.

NEWPORT BEACH, Calif.--(BUSINESS WIRE)--$CLNE--Clean Energy Fuels Corp. (Nasdaq: CLNE) and bp today announced that its renewable natural gas (RNG) joint venture will build on previously announced plans to finance and develop new projects at dairy farms, starting in the Midwest.


Located in South Dakota and Iowa, the dairy farms, with more than 30,000 cows, have the estimated potential to convert the methane produced from waste into more than seven million gallons of RNG annually.

Agriculture accounts for nearly 10 percent of U.S. greenhouse gas (GHG) emissions, according to the U.S. Environmental Protection Agency. Capturing methane from farm waste can lower these emissions. RNG is used as a transportation fuel and has lower GHG emissions on lifecycle basis when compared to conventional gasoline and diesel. The California Air Resources Board has given similar projects a carbon intensity (CI) score of weighted average of -320 compared to CI scores of 101 for conventional diesel fuel and 15 for electric batteries.

“The demand for RNG is rapidly growing, highlighted by our recent announcement to fuel a new fleet of Amazon heavy-duty trucks deploying across the country,” said Clay Corbus, senior vice president and co-head of renewable fuels at Clean Energy. “Our joint venture with bp to develop new supplies is critical to keeping up with this demand. The RNG that is expected to flow from these dairies to our fueling infrastructure will allow our customers to dramatically reduce their carbon emissions and turn their sustainability goals into reality.”

Dynamic Holdings will oversee construction and develop and operate the facilities following the execution of an agreement with the joint venture to execute multiple phases of dairy RNG projects.

With over 550 dispensing locations, Clean Energy has the largest network of RNG stations in the U.S. bp’s world-class trading organization transports RNG to California markets and monetizes the environmental credits associated with dispensing the RNG.

“These collaborations are critical steps toward our ambition of helping the world reach net zero by 2050 or sooner,” said Sean Reavis, bp biogas origination. “Our biogas strategy is focused on growth and developing an integrated business model that allows us to deliver the unique energy products the market is demanding.”

The first RNG production facility is expected to be operational in 2022.

About bp

bp’s ambition is to become a net zero company by 2050 or sooner, and to help the world get to net zero. bp is America’s largest energy investor since 2005, investing more than $130 billion in the economy and supporting about 230,000 additional jobs through its business activities. For more information on bp in the US, visit www.bp.com/us.

About Clean Energy

Clean Energy Fuels Corp. is the country’s largest provider of the cleanest fuel for the transportation market. Our mission is to decarbonize transportation through the development and delivery of renewable natural gas (RNG), a sustainable fuel derived from organic waste. Clean Energy allows thousands of vehicles, from airport shuttles to city buses to waste and heavy-duty trucks, to reduce their amount of climate-harming greenhouse gas. We operate a vast network of fueling stations across the U.S. and Canada. Visit www.cleanenergyfuels.com and follow @CE_NatGas on Twitter.

About Dynamic

Dynamic was founded in 2011 and is a full-service company that provides leading edge waste recovery solutions for both the Agricultural and Food Processing Industries. Three of its founding owners are involved with the daily operations of the business. They are the driving force of the company by integrating Dynamic's technology and design into the following areas: landfill diversion, anaerobic digestion, nutrient concentration, and water treatment. Dynamic adds a unique value in the field by being experienced, and knowledgeable in the finance, design, development, operation, and management of customized world-class infrastructure assets. These turnkey renewable energy and clean water solutions dispose of organic waste to impact the economy in environmentally friendly ways.


Contacts

Clean Energy Contact:
Raleigh Gerber
949-437-1397
This email address is being protected from spambots. You need JavaScript enabled to view it.

UK’s leading provider of electric vehicle charging solutions opens North American division with a dedicated focus on private and public fleet operators

LONDON & STAMFORD, Conn.--(BUSINESS WIRE)--EO Charging (“EO”), a leading UK-based provider of technology-enabled turnkey solutions for electric vehicle (“EV”) fleets, today announced its expansion into the U.S. market and the initiation of the site selection process for its North American office, planned to open in early 2022. This new division will deliver EO’s complete fleet charging ecosystem for businesses and government fleet operators throughout the Americas, as well as additional offerings from EO’s charging products and services.


EO’s experience in delivering EV fleet charging solutions at scale in the EU and UK for fleets like Amazon, DHL, Uber and Tesco will prove invaluable for similar global operators on the opposite side of the Atlantic. EO will initially focus on electrifying car, van, truck and bus fleets in the U.S., having already secured a pilot demonstration project in California for a global logistics leader.

EO’s entry into the U.S. comes as the EV market has experienced significant support and growth in the region. The $1.2 trillion infrastructure bill recently passed by the U.S. Congress contains multiple programs supporting electrification of vehicles and busses, including $7.5B for charging infrastructure alone. Analysts have projected that total U.S. sales of EVs could reach 24% of all new vehicle sales by 2030, creating a $28 billion EV charging market with a CAGR of 39% along the way.

“It’s no longer a question of whether fleets should electrify, but rather a question of how and when,” said Charlie Jardine, EO CEO and Founder. “We have tested the U.S. market’s appetite for our charging solutions, following discussions with our current and potential fleet customers, and listened to their needs within the U.S. market and beyond. By bringing on board two new industry experts, Tim Weaver and Austin Hausmann, our global team is now primed to deliver EO’s EV fleet charging proposition at pace and scale.”

Active in e-mobility since 2009, Tim Weaver has global executive experience working with private & municipal fleets, OEMs, governments, and utilities. Through his work with multiple electric vehicle manufacturers and suppliers, he has supported the deployment of thousands of zero-emission vehicles worldwide along with significant EV infrastructure projects. Active in public policy, Weaver has secured over $300 million in incentive funds for EV companies, vehicles, and charging in the last decade.

Austin Hausmann brings over 12 years of dedicated commercial electric vehicle OEM leadership to EO. He has developed and commercialized over 15 EV platforms for the U.S. market and overseen the design and development of the hardware and software solutions required for adoption, including various on-and-off vehicle charging programs. Hausmann has been responsible for global engineering teams, projects with the US Departments of Defense and Energy, and oversight of operational strategies, supply chain, after sales services, finance, and corporate growth.

“Expansion into the U.S. is a significant step for EO, laying the foundation for our extensive growth plans in this region and beyond. We look forward to building on our new U.S. team’s deep experience with many of the world’s largest fleets, as well as key infrastructure partners, in deploying electric vehicles and charging solutions,” said Jardine.

The creation of a new U.S. division comes on the back of considerable growth for EO, which, despite the pandemic, saw its revenues triple and headcount double in 2020. Earlier this year, EO was ranked number 27 on the FT’s list of Europe’s fastest growing companies, the highest-ranked business in the EV sector. With a bolstered international team and blue-chip customers such as Amazon, DHL, Go-Ahead, Tesco and Uber, EO forecasts significant growth in 2022.

EO Charging previously announced an agreement for a business combination with First Reserve Sustainable Growth Corp. (NASDAQ: FRSG), which is expected to result in EO Charging becoming a public company listed on the NASDAQ exchange.

About EO

EO Charging (EO) is a leading technology solutions provider in the EV sector. EO deploys EV charging stations, hardware-agnostic cloud-based software, electrical installation, grid upgrades and ongoing service and maintenance for fleets. EO also provides this end-to-end solution for fleets that require mission critical infrastructure.

Founded in 2014, EO’s technology is used by a number of the world’s largest businesses and fleet operators and it now distributes to over 35 countries around the world. It aims to become the global leader in charging electric van, truck, bus and car fleets.

EO Charging previously announced an agreement for a business combination with First Reserve Sustainable Growth Corp. (NASDAQ: FRSG), which is expected to result in EO Charging becoming a public company listed on the NASDAQ exchange.

EO was ranked number 27 on the Financial Times’ FT1000 list of Europe’s fastest-growing companies. To learn more, please visit www.EOcharging.com and follow us @EOCharging on Twitter and LinkedIn.

Forward Looking Statements

The information in this press release includes "forward-looking statements". All statements, other than statements of present or historical fact included in this press release, regarding the proposed business combination between First Reserve Sustainable Growth Corp. (“FRSG”), Juuce Limited (the “Company”) and EO Charging (“EO”), each of such parties’ ability to consummate the transaction, the benefits of the transaction and the combined company's future financial performance, as well as the combined company's strategy, future operations, estimated financial position, estimated revenues and losses, projected costs, prospects, plans and objectives of management are forward-looking statements. When used in this press release, the words "could," "should," "will," "may," "believe," "anticipate," "intend," "estimate," "expect," "project," the negative of such terms and other similar expressions are intended to identify forward-looking statements, although not all forward-looking statements contain such identifying words. These forward-looking statements are based on management's current expectations and assumptions about future events and are based on currently available information as to the outcome and timing of future events. Except as otherwise required by applicable law, FRSG, the Company and EO disclaim any duty to update any forward-looking statements, all of which are expressly qualified by the statements in this section, to reflect events or circumstances after the date of this press release. FRSG, the Company and EO caution you that these forward-looking statements are subject to numerous risks and uncertainties, most of which are difficult to predict and many of which are beyond the control of any of FRSG, the Company or EO. In addition, FRSG, the Company and EO caution you that the forward-looking statements contained in this press release are subject to the following factors: (i) the occurrence of any event, change or other circumstances that could delay the business combination or give rise to the termination of the Business Combination Agreement and Plan of Reorganization, dated as of August 12, 2021, by and among FRSG, FRSG Merger Sub Inc., EO and the Company, and the other agreements related to the business combination (including catastrophic events, acts of terrorism, the outbreak of war, COVID-19 and other public health events), as well as management’s response to any of the foregoing; (ii) the outcome of any legal proceedings that may be instituted against FRSG, the Company, EO, their affiliates or their respective directors and officers following announcement of the transactions; (iii) the inability to complete the business combination due to the failure to obtain approval of the stockholders of FRSG, regulatory approvals, or other conditions to closing in the transaction agreement; (iv) the risk that the proposed business combination disrupts FRSG's or the Company's current plans and operations as a result of the announcement of the transactions; (v) the Company's and EO’s ability to realize the anticipated benefits of the business combination, which may be affected by, among other things, competition, the pace and depth of EV adoption generally, and the ability of the Company to accurately estimate supply and demand for its EV charging products and services, and to grow and manage growth profitably following the business combination; (vi) risks relating to the uncertainty of the projected financial information with respect to the Company, including the conversion of pre-orders into binding orders; (vii) costs related to the business combination; (viii) changes in applicable laws or regulations, governmental incentives and fuel and energy prices; (ix) the possibility that the Company may be adversely affected by other economic, business, and/or competitive factors; (x) the amount of redemption requests by FRSG’s public stockholders; and (xi) such other factors affecting FRSG that are detailed from time to time in FRSG’s filings with the Securities and Exchange Commission (the "SEC"). Should one or more of the risks or uncertainties described in this press release, or should underlying assumptions prove incorrect, actual results and plans could differ materially from those expressed in any forward-looking statements. Additional information concerning these and other factors that may impact the operations and projections discussed herein can be found in FRSG's final prospectus for its initial public offering, which was filed with the SEC on March 5, 2021, and its periodic filings with the SEC, including its Quarterly Report on Form 10-Q for quarterly period ended June 30, 2021. FRSG's SEC filings are available publicly on the SEC's website at www.sec.gov.

Important Information for Investors and Stockholders

In connection with the proposed business combination, a registration statement on Form F-4 that includes a preliminary proxy statement/prospectus has been filed by EO with the SEC. After the registration statement is declared effective, the definitive proxy statement will be distributed to FRSG’s stockholders in connection with FRSG’s solicitation for proxies for the vote by FRSG’s stockholders in connection with the proposed business combination and other matters as described in the Form F-4, as well as a definitive prospectus of EO relating to the offer of the securities to be issued in connection with the completion of the business combination. Copies of the Form F-4 may be obtained free of charge at the SEC's website at www.sec.gov. FRSG’s stockholders are urged to read the preliminary proxy statement/prospectus and the other relevant materials (including, when available, the definitive proxy statement/prospectus) when they become available before making any voting decision with respect to the proposed business combination because they will contain important information about the business combination and the parties to the business combination. The information contained on, or that may be accessed through, the websites referenced in this press release is not incorporated by reference into, and is not a part of, this press release.

No Offer or Solicitation

This communication is not a proxy statement or solicitation of a proxy, consent, or authorization with respect to any securities or in respect of the proposed business combination and shall not constitute an offer to sell or a solicitation of an offer to buy the securities of FRSG, EO or Juuce, nor shall there be any sale of any such securities in any state or jurisdiction in which such offer, solicitation, or sale would be unlawful prior to registration or qualification under the securities laws of such state or jurisdiction. No offer of securities shall be made except by means of a prospectus meeting the requirements of Section 10 of the Securities Act, as amended, or exemptions therefrom.

Participants in the Solicitation

FRSG, the Company and EO and their respective directors and officers may be deemed participants in the solicitation of proxies of FRSG's stockholders in connection with the proposed business combination. Security holders may obtain more detailed information regarding the names, affiliations and interests of certain of FRSG's executive officers and directors in the solicitation by reading FRSG's final prospectus for its initial public offering, which was filed with the SEC on March 5, 2021, and the proxy statement/prospectus and other relevant materials filed with the SEC in connection with the business combination when they become available. Information concerning the interests of FRSG's, the Company’s and EO’s participants in the solicitation, which may, in some cases, be different than those of their stockholders generally, will be set forth in the proxy statement/prospectus relating to the business combination when it becomes available.


Contacts

EO Contacts:

SEC Newgate UK
Ian Morris / Sophie Morello / Jessica Hodson Walker / Tim Le Couilliard
This email address is being protected from spambots. You need JavaScript enabled to view it.

For Investors:
ICR, Inc.
This email address is being protected from spambots. You need JavaScript enabled to view it.

For US Media:
ICR, Inc.
This email address is being protected from spambots. You need JavaScript enabled to view it.

LONDON--(BUSINESS WIRE)--Purus Marine, a maritime holding company that owns environmentally-advanced vessels and infrastructure equipment, today announced an agreement to acquire two 180,000 cbm LNG Carriers (“LNGCs”). The vessels are expected to deliver in Q3 2024, directly into multi-year time charters with an energy major. The vessels were acquired in partnership with a leading ship manager, who will provide technical and commercial services for the vessels.


By using the latest generation of engine and energy saving device technologies, the LNGCs are expected to be best-in-class in environmental performance,” said Julian Proctor, Chief Executive Officer of Purus Marine.

This acquisition diversifies our fleet and allows us to further support the maritime industry’s transition to a lower-carbon future,” said Svein Engh, Senior Advisor and a Board Member of Purus Marine.

About Purus Marine

Purus Marine is a maritime holding company that owns environmentally-advanced vessels and infrastructure equipment, contracted long-term to high quality end-users. The Company serves a wide variety of maritime sectors, including the industrial shipping, short-sea, ferry, offshore wind and environmental remediation sectors. Purus Marine is committed to supporting the maritime industry’s transition to a zero-carbon and sustainable future by owning vessels and infrastructure equipment that reduce carbon emissions and ocean pollution. Its climate target is for its fleet to achieve net zero-emissions within the 2030 decade. For more information visit www.purusmarine.com.


Contacts

Alastair McDonald
Managing Director, Investments
+44 20 7389 1351
This email address is being protected from spambots. You need JavaScript enabled to view it.

DUBLIN--(BUSINESS WIRE)--The "Oil and Gas Accumulators Market Review 2021 and Strategic Plan for 2022 - Insights, Trends, Competition, Growth Opportunities, Market Size, Market Share Data and Analysis Outlook to 2028" report has been added to ResearchAndMarkets.com's offering.


The Oil and Gas Accumulators Market is expected to register an attractive growth rate during the outlook period driven by technological innovations and application-specific developments.

Market Players in the Oil and Gas Accumulators Market business are aligning their operating model to the new normal by pivoting towards digitalization of operations and adapting to emerging technologies in robotic automation and artificial intelligence.

Mergers and acquisitions to acquire new technologies, strengthen portfolios, and leverage capabilities to remain key strategies of top companies in the Oil and Gas Accumulators Market industry during the outlook period. Investing in R&D and technology to improve product lines will be the major growth driver in the short to medium term for the Oil and Gas Accumulators Market amid prevailing tough conditions.

The market study provides a comprehensive description of current trends and developments in the Oil and Gas Accumulators Market industry along with a detailed predictive and prescriptive analysis to 2028.

Key Topics Covered:

1. Table of Contents

1.1 List of Tables

1.2 List of Figures

2. Global Oil and Gas Accumulators Market Review, 2020

2.1 Oil and Gas Accumulators Market Industry Overview

2.2 Research Methodology

3. Oil and Gas Accumulators Market Insights

3.1 Oil and Gas Accumulators Market Trends to 2028

3.2 Future Opportunities in Oil and Gas Accumulators Market

3.3 Dominant Applications of Oil and Gas Accumulators Market to 2028

3.4 Key Types of Oil and Gas Accumulators Market to 2028

3.5 Leading End Uses of Oil and Gas Accumulators Market to 2028

3.6 High Prospect Countries for Oil and Gas Accumulators Market to 2028

4. Oil and Gas Accumulators Market Trends, Drivers, and Restraints

4.1 Latest Trends and Recent Developments in Oil and Gas Accumulators Market

4.2 Key Factors Driving the Oil and Gas Accumulators Market Growth

4.2 Major Challenges to the Oil and Gas Accumulators Market industry, 2021-2028

4.3 Impact of COVID on Oil and Gas Accumulators Market and Scenario Forecasts to 2028

5 Five Forces Analysis for Global Oil and Gas Accumulators Market

5.1 Oil and Gas Accumulators Market Industry Attractiveness Index, 2021

5.2 Threat of New Entrants

5.3 Bargaining Power of Suppliers

5.4 Bargaining Power of Buyers

5.5 Intensity of Competitive Rivalry

5.6 Threat of Substitutes

6. Global Oil and Gas Accumulators Market Data - Industry Size, Share, and Outlook

6.1 Oil and Gas Accumulators Market Annual Sales Outlook, 2021-2028 ($ Million)

6.1 Global Oil and Gas Accumulators Market Annual Sales Outlook by Type, 2021-2028 ($ Million)

6.2 Global Oil and Gas Accumulators Market Annual Sales Outlook by Application, 2021-2028 ($ Million)

6.3 Global Oil and Gas Accumulators Market Annual Sales Outlook by End-User, 2021-2028 ($ Million)

6.4 Global Oil and Gas Accumulators Market Annual Sales Outlook by Region, 2021-2028 ($ Million)

7. Asia Pacific Oil and Gas Accumulators Market Industry Statistics - Market Size, Share, Competition and Outlook

7.1 Asia Pacific Market Insights, 2020

7.2 Asia Pacific Oil and Gas Accumulators Market Revenue Forecast by Type, 2021-2028 (USD Million)

7.3 Asia Pacific Oil and Gas Accumulators Market Revenue Forecast by Application, 2021-2028 (USD Million)

7.4 Asia Pacific Oil and Gas Accumulators Market Revenue Forecast by End-User, 2021-2028 (USD Million)

7.5 Asia Pacific Oil and Gas Accumulators Market Revenue Forecast by Country, 2021-2028 (USD Million)

7.6 Leading Companies and strategies in Asia Pacific Oil and Gas Accumulators Market Industry

8. Europe Oil and Gas Accumulators Market Historical Trends, Outlook, and Business Prospects

9. North America Oil and Gas Accumulators Market Trends, Outlook, and Growth Prospects

10. Latin America Oil and Gas Accumulators Market Drivers, Challenges, and Growth Prospects

11. Middle East Africa Oil and Gas Accumulators Market Outlook and Growth Prospects

12. Oil and Gas Accumulators Market Structure and Competitive Landscape

12.1 Key Companies in Oil and Gas Accumulators Market Business

12.2 Oil and Gas Accumulators Market Key Player Benchmarking

12.3 Oil and Gas Accumulators Market Product Portfolio

12.4 Financial Analysis

12.5 SWOT and Financial Analysis Review

13. Latest News, Deals, and Developments in Oil and Gas Accumulators Market

14. Appendix

For more information about this report visit https://www.researchandmarkets.com/r/eh6htm


Contacts

ResearchAndMarkets.com
Laura Wood, Senior Press Manager
This email address is being protected from spambots. You need JavaScript enabled to view it.
For E.S.T Office Hours Call 1-917-300-0470
For U.S./CAN Toll Free Call 1-800-526-8630
For GMT Office Hours Call +353-1-416-8900

Offshore Source Logo

Offshore Source keeps you updated with relevant information concerning the Offshore Energy Sector.

Any views or opinions represented on this website belong solely to the author and do not represent those of the people, institutions or organizations that Offshore Source or collaborators may or may not have been associated with in a professional or personal capacity, unless explicitly stated.

Corporate Offices

Technology Systems Corporation
8502 SW Kansas Ave
Stuart, FL 34997

info@tscpublishing.com