Business Wire News

Sustainability Efforts Create Key Benefits Including Reduced Energy Costs for Greater Efficiency, Increased Customer and Employee Loyalty and Improved Community Relations

OAKLAND, Calif.--(BUSINESS WIRE)--Navis, the provider of operational technologies and services that unlock greater performance and efficiency for the world’s leading organizations across the shipping supply chain, unveiled new survey findings that examine the motivation behind global terminals implementing new sustainability initiatives, as well as the current status and expected benefits of these endeavors. Under growing pressure from regulators, customers and the global community, the shipping industry is working to increase sustainability while maintaining a profit. According to Navis’ survey, 93% of respondents believe it’s either important or extremely important for their organizations to have sustainability initiatives in place, with a majority reporting efforts are already underway to implement, track and measure the effectiveness of these initiatives.

The results from the 2021 Sustainability Survey, gathered from over 71 Navis customers, highlight the interest that terminals have in moving towards more sustainable operations and that Navis customers are among those already putting plans into action - outlining sustainability strategies with clear, focused priorities, setting targets for sustainable efforts, setting KPIs for sustainability and planning sustainability initiatives for the future.

When asked what is motivating them to adopt sustainability initiatives, the top responses included complying with environmental regulations, aligning with organizational goals/values, making a tangible impact on the local/global environment, and meeting customer expectations. Respondents noted clear benefits for companies that get it right as sustainability efforts can add value to terminal operations by reducing energy costs for greater efficiency (73%), improving community relations by demonstrating a commitment to protecting the environment (68%), attracting/retaining customers (47%) and avoiding penalties for missing environmental regulations (46%).

Reinforcing the growing demand from customers to partner with environmentally conscious companies, 35% of respondents noted that their customers monitor their operation’s sustainability performance, and about a quarter said their customers integrate sustainability KPIs in their qualification criteria when selecting suppliers.

For companies evaluating which initiatives will have the biggest impact on improving sustainability in their operations, the survey found terminals prioritize:

  • Reducing fuel consumption and emissions by reducing wait times for trucks and/or vessels (76%)
  • Improving the efficiency of container handling in the yard (61%)
  • Electrifying equipment (58%)
  • Reducing energy consumption in data centers by moving to the cloud (27%)

In order to reach these goals more efficiently, terminals are now turning to software and solutions, such as those provided by Navis, for support. These solutions help organizations optimize driving distances for container handling equipment (CHE), reduce rehandles and minimize maintenance windows, reduce truck and vessel wait times and improve turn times, optimize berth position to improve yard operations, manage and prevent incidents that could impact the environment, and reduce on-premise hardware footprint by moving to the cloud.

“While the primary focus for sustainability in the industry has always been on the equipment and energy efficiency through minimizing unnecessary moves and reduction of fuel, the modern port now focuses on how we can move cargo in fewer moves to reduce fuel usage,” said Ajay Bharadwaj, Senior Director Product Management, Navis. “TOS in the cloud enables ports to operate smarter, moving equipment in a streamlined way to avoid more moves and longer journeys. This allows operators to move more cargo in less time while also minimizing the number of moves that take place.”

Bharadwaj continued, “Another benefit of using a cloud-based TOS is that over time, operational data is collected which can be used to improve performance. The data informs sustainable business decisions that not only optimize operations but also minimize impact to the planet. As a result, allocation of equipment and workers can be reconfigured in a way that lowers the environment footprint while also streamlining the process.”

Highlighting the importance of sustainability within the supply chain, Navis will feature this topic at its upcoming Navis Connect event. Attendees can join Bonnie Nixon, ESG Strategic Advisor and Adjunct Professor at Harvard University, for her session “Seismic Shifts for a Sustainable Future,” at 9am ET on Wednesday, November 10, 2021.

Further reinforcing its own commitment to sustainability, at the event, Navis will be hosting a fundraiser to raise money to protect the oceans for future generations. Navis will be collecting donations prior to and during the three day Navis Connect virtual conference to donate to the Marine Conservation Institute. Donations can be made here and Navis will match all donations made during the event.

For more information on the survey, visit: https://www.techvalidate.com/portals/2021-sustainability-survey-results

About Navis, LP

Navis is a provider of operational technologies and services that unlock greater performance and efficiency for the world’s leading organizations across the cargo supply chain, making global trade smarter, safer and more sustainable for everyone. Navis combines industry best practices with innovative technology and world-class services, to enable our customers, regardless of cargo type, to maximize performance and reduce risk. Through its holistic approach to operational optimization, Navis customers benefit from improved visibility, velocity and measurable business results. Whether tracking cargo through a terminal, improving vessel safety and cargo capacity, optimizing rail network planning and asset utilization, automating equipment operations, or managing multiple terminals through an integrated, centralized solution, Navis helps streamline operations. www.navis.com


Contacts

Jennifer Grinold
Navis, LLC
T+1 510 267 5002
This email address is being protected from spambots. You need JavaScript enabled to view it.

Anna Patrick
Gregory FCA
T+1 212 398 9680
This email address is being protected from spambots. You need JavaScript enabled to view it.

GILA BEND, Ariz.--(BUSINESS WIRE)--OPAL Fuels LLC, a vertically integrated producer and distributor of renewable natural gas (RNG), and the Paloma Dairy will host a ribbon cutting ceremony for the new Sunoma Renewable Natural Gas Facility at Paloma Dairy in Gila Bend, AZ. The event will feature remarks by representatives from the offices of Senator Kyrsten Sinema and Senator Mark Kelly.


WHO:

  • Allan Van Hofwegen, Partner, Paloma Dairy
  • Adam Comora and Jonathan Maurer, Co-CEOs, OPAL Fuels
  • Carlos Ramos, Constituent Affairs Representative for Senator Kyrsten Sinema
  • Luis Heredia, Arizona State Director for Senator Mark Kelly

ALSO IN ATTENDANCE:

  • Black Bear Environmental Assets
  • Live Oak Bank
  • Montrose Environmental Group
  • Southwest Gas Corporation

WHAT:

On November 10, Paloma Dairy and OPAL Fuels will host a ribbon-cutting ceremony to mark the official start of operations of the Sunoma digester at Paloma Dairy. The digester converts methane emissions from cow manure into RNG, an inexpensive, cleaner burning diesel-fuel replacement for heavy-duty trucks. The facility, which will prevent 54,000 metric tons of carbon equivalent from entering the atmosphere annually and heating the planet, will also result in savings by heavy-duty trucking companies of nearly $4 million in fuel costs. The project employed more than 50 people in its construction. The event will feature remarks from representatives of Senators Kyrsten Sinema and Mark Kelly. Please join us!

WHEN:

  • 9:00am - 10:00am MST
  • Wednesday, Nov 10, 2021

WHERE:

  • Paloma Dairy, 55310 S Citrus Valley Rd, Gila Bend, AZ 85337
    • In front of the dairy digesters (please follow signage and attendants)
    • Parking will be available.

About OPAL Fuels LLC

OPAL Fuels LLC, a Fortistar portfolio company, brings together Fortistar Methane Group, Fortistar RNG, and TruStar Energy to create a vertically integrated renewable fuels platform. The company is a leader in the production and distribution of renewable natural gas (RNG) for the heavy-duty truck market. It is a proven low carbon fuel with a track record of results that has the power to rapidly decarbonize the transportation industry now. OPAL Fuels captures harmful methane emissions at the source and recycles the trapped energy into a commercially viable, low-cost alternative to diesel fuel. OPAL Fuels also manages all RNG fueling station development and construction. As a producer and distributor of carbon-reducing fuel for heavy-duty truck fleets for over 15 years, the company delivers best-in-class, complete renewable solutions to customers and production partners. To learn more about OPAL Fuels and how it is leading the effort to capture North America's harmful methane emissions and decarbonize the transportation industry, please visit www.opalfuels.com and follow the company on LinkedIn and Twitter at @OPALFuels.

About Paloma Dairy

Paloma Dairy is owned by the Van Hofwegen family, a fourth-generation dairy farm family in Gila Bend, AZ. The farm relies on the latest radio-frequency identification (RFID) technology that helps to provide its distinctive black and white Holstein cows with individualized care and provisions. Paloma Dairy keeps track of the entire health record of each cow via its signature RFID technology, which also allows employees to check on the health of each cow daily. In addition to the care of over 10,000 animals, the farm produces cow feed via alfalfa, corn silage, wheat and barley across 7,000 acres of farmland.


Contacts

Media
Jason Stewart
914-421-5336
This email address is being protected from spambots. You need JavaScript enabled to view it.

NEWPORT BEACH, Calif.--(BUSINESS WIRE)--Graphene & Solar Technologies, Ltd. announces the acquisition of a Patented Thin-Film Technology development corporation for new thin-film Solar applications and patented 5G EMF network integrity, and a new GSTX developed Air-to-Water Harvester, utilizing a unique solid-state air to water extraction device, which GSTX plans for world-wide distribution. GSTX purchased 120 internationally registered, patented technologies and “thin-film” applications from Cima NanoTech, in Israel.

Following the US $47 million purchase, a new USA subsidiary was formed to hold the assets, “US Thin-Film Corporation (USTC)”. Thin-film solar applications are a recent solar industry innovation which when combined with emerging Nanotech Solar applications have significantly advanced Solar industry technologies. Transparent and flexible seamless, light-weight solar panels will largely replace existing cumbersome, metal-framed solar installations in buildings around the world.

The Water Extraction device is designed to supply clean water for outdoor locations, or an entire household. The unit is capable of being installed in water harvester farms of parallel units. The GSTX proprietary Water Harvester technology system that will operate efficiently on electrical, solar and/or battery power systems, uses an active cooling system utilizing modern, energy-efficient control systems, energy-efficient cooling, and the system is designed to efficiently maximize energy use. A basic Water Harvester Unit sales cost will be US$ 5,000 to US$ 8,000 approximately, with a service life of 10+ years.

U.S. Thin Film Corporation (USTFC) is a US Company, and a 100% owned GSTX subsidiary that now owns the exclusive Intellectual rights to an advanced Patent Portfolio of 120 high-level, internationally registered engineering patents. These were originally developed in Israel but are now entirely owned by GSTX. The patents cover the production of Transparent Conductive Thin Films (TCF).

About Graphene

GSTX is a leading-edge high-tech developer of Renewable Alternative Energy systems. GSTX is the sole owner of the exclusive rights to two rare High Purity Quartz mineral deposits (15 million tons) utilized as feedstock for the manufacture of PV solar cells and all electronics and semiconductor production materials.

Forward-Looking Statements

All statements in this release that are not strictly historical facts are "forward-looking statements." Forward-looking statements are based on SQTX’s current assumptions, beliefs and expectations, and involve risks, uncertainties and other factors that may cause SQTX’s actual results to be materially different from any results expressed or implied by such forward-looking statements.


Contacts

GSTX -Contact: Roger May – 1-844-301-4000

COLUMBUS, Ind.--(BUSINESS WIRE)--Cummins Inc. (NYSE: CMI) was named today one of 45 inaugural recipients of the Terra Carta Seal, an initiative led by the United Kingdom’s Prince Charles to recognize businesses for their commitment to environmental sustainability and decarbonization.

Inspired by the Magna Carta, the medieval document that remains an important symbol of liberty around the world, the Terra Carta is a recovery plan for the planet that serves as the guiding mandate for The Prince of Wales’ Sustainable Markets Initiative (SMI). The initiative seeks to establish a global forum for industries to restructure their operations in a way that protects the world’s natural resources.

“The Terra Carta Seal recognizes those organizations which have made a serious commitment to a future that is much more sustainable, and puts Nature, People and the Planet at the heart of the economy,” Prince Charles said in a ceremony at an art museum and gallery not far from the COP26 global climate summit taking place in Glasgow, Scotland. “We all need to make changes if we are to preserve the planet for our children and grandchildren and these businesses have pledged to make it easier for us all to do so.”

The Sustainable Markets Initiative says the seal is awarded to companies who hold a leadership position within their industry and have “credible transition roadmaps to reduce their impact on the environment, including the carbon they produce, underpinned by globally recognized, scientific metrics for achieving net zero emissions by 2050 or earlier.”

Cummins is committed to taking a leadership role on the world’s climate challenges and other environmental concerns. In 2019, the company unveiled PLANET 2050, Cummins’ environmental sustainability strategy, which includes science-based goals timed to 2030 that are aligned to the Paris climate agreements. The agreements seek to limit average global temperature rise above pre-industrial levels to 1.5 degrees Celsius.

“As the Terra Carta recognizes, sustaining a vibrant economy while using fewer of the earth’s resources is the challenge of our time,” said Cummins Chairman and CEO Tom Linebarger. “Our mission of making people’s lives better by powering a more prosperous world requires a healthier planet, and it will take all of us working together to solve the world’s climate challenges. Being part of the Sustainable Markets Initiative is both a great honor and a great responsibility.”

As part of its approach to environmental stewardship, Cummins aspires to be carbon neutral by 2050. The company is working to reduce the carbon impact of its diesel and natural gas platforms while bringing to market innovative no-carbon technology, including battery and fuel cell electric. Cummins has also quickly emerged as a leader in the manufacture of electrolyzers critical to the production of green hydrogen, a promising no-carbon fuel.

The company also advocates for climate action through its membership in several organizations, including Business Ambition for 1.5°C, the CEO Climate Dialogue, the Business Roundtable and the Hydrogen Council, a global coalition of CEOs working to accelerate the use of green hydrogen. Linebarger serves as co-chair of the Hydrogen Council.

Cummins has been named to the S&P Dow Jones Sustainability Indices for North America for 15 consecutive years and qualified for Sustainalytics’ 2021 ESG Industry Top Rated Badge among other honors.

Other inaugural recipients of the Terra Carta Seal include Bank of America, PepsiCo, Salesforce and Xerox. The Sustainable Markets Initiative expects to add more recipients annually as additional companies join its campaign to meet the world’s climate challenges.

About the seal
Working closely with The Prince of Wales, Sir Jony Ive and his creative team at LoveFrom have created a physical and animated seal that is both simple and beautifully crafted. The prince’s Sustainable Markets Initiative says the design combines “a host of natural references including oak leaves, fern, magnolia and honeybees and intricate patterns both in nature and in the arts, creating a visual celebration reflecting the power of and reverence for nature that is at the heart of the Terra Carta.”

About Cummins Inc.
Cummins Inc., a global power leader, is a corporation of complementary business segments that design, manufacture, distribute and service a broad portfolio of power solutions. The company’s products range from diesel, natural gas, electric and hybrid powertrains and powertrain-related components including filtration, aftertreatment, turbochargers, fuel systems, controls systems, air handling systems, automated transmissions, electric power generation systems, batteries, electrified power systems, hydrogen generation and fuel cell products. Headquartered in Columbus, Indiana (U.S.), since its founding in 1919, Cummins employs approximately 57,825 people committed to powering a more prosperous world through three global corporate responsibility priorities critical to healthy communities: education, environment and equality of opportunity. Cummins serves its customers online, through a network of company-owned and independent distributor locations, and through thousands of dealer locations worldwide and earned about $1.8 billion on sales of $19.8 billion in 2020. See how Cummins is powering a world that’s always on by accessing news releases and more information at https://www.cummins.com/always-on.


Contacts

Jon Mills, Cummins Inc.
317-658-4540
This email address is being protected from spambots. You need JavaScript enabled to view it.

BOSTON--(BUSINESS WIRE)--#DigitalTransformation--Schneider Electric, the global leader in the digital transformation of energy management and automation, is hosting Innovation Summit North America 2021 on Wednesday, November 10 at 1:00 p.m. ET. The virtual event is aimed at customers and business leaders in Canada, Mexico, and the U.S. It will focus on the strategies necessary to manage energy and automation in the new normal, including best practices to achieving sustainability across business, infrastructure, industry, and homes. Event registration is also open to media and analysts.


To request an interview with an executive or subject matter expert, please email This email address is being protected from spambots. You need JavaScript enabled to view it. with your affiliation and area of interest.

Recognized as the world’s most sustainable corporation in 2021 by Corporate Knights, this year’s event will feature a keynote from Annette Clayton, chief executive officer and president, Schneider Electric North America. Ms. Clayton will address what holistic climate action looks like and describe a three-step journey that transforms how any organization can become more sustainable. The event will also include panel discussions with insights and advice from experts on infrastructure solutions, digitization, and sustainability strategies. Industry-specific strategy talks will be centered on getting businesses and organizations ready for the future by improving resilience and leveraging digitization. Attendees will also gain first-hand insight into Schneider Electric’s portfolio of new software and hardware offerings for use in industry, data centers, and homes.

An overview of the event includes:

  • Keynote: How we will Travel the Path to Sustainability featuring Annette Clayton, CEO & president, Schneider Electric North America
  • Panel: Making Sense of the Latest Infrastructure Opportunities hosted by Aamir Paul, Schneider Electric’s U.S. Country President, and featuring Chris Brown, Chief, Office of Energy and Sustainability Dept., Montgomery County, Maryland, and David Terry, Executive Director, National Association of State Energy Officials
  • Case study (in Spanish): Leading the New Digital Reality with Enrique Gonzalez, Schneider Electric’s Mexico Country President, discussing how Nestle Toluca increased productivity in their operation
  • Panel: Leadership and the Climate Challenge - The Path to Net-Zero hosted by Adrian Thomas, Schneider Electric’s Canada Country President, and featuring Frances Edmonds, Head of Sustainability Impact, Hewlett-Packard, and Toby Heaps, Co-founder & CEO, Corporate Knights
  • A series of Strategy Talks will be available on-demand following the event:
    • Buildings of the Future: A recovery powered by digital and electric
    • Data Centers of the Future: Sustainability and resiliency aren’t mutually exclusive
    • Homes of the Future: Innovations for the new electric home
    • Grids of the Future: How to overcome your energy challenges with microgrids
    • Industries of the Future: Your resilient and sustainable future
    • How prosumers will disrupt the energy system of today - the complexity and opportunities created by the new energy landscape
    • Achieving Net Zero: From ambition to action

For more information about Schneider Electric’s Innovation Summit and the full agenda, please visit: https://events.se.com/website/5735/home/

To register for the event, please visit: https://events.se.com/ereg/

About Schneider Electric

Schneider’s purpose is to empower all to make the most of our energy and resources, bridging progress and sustainability for all. We call this Life Is On.

Our mission is to be your digital partner for Sustainability and Efficiency. We drive digital transformation by integrating world-leading process and energy technologies, end-point to cloud connecting products, controls, software and services, across the entire lifecycle, enabling integrated company management, for homes, buildings, data centers, infrastructure and industries.

We are the most local of global companies. We are advocates of open standards and partnership ecosystems that are passionate about our shared Meaningful Purpose, Inclusive and Empowered values.

www.se.com

Discover Life Is On  Follow us on:  TwitterFacebookLinkedInYouTubeInstagramBlog

Hashtags: #LifeIsOn #Sustainability #energytransformation #decarbonization #climateaction #NetZeroHomes #Ecostruxure #IndustrialAutomation #DigitalTransformation #PowerManagement #IoT


Contacts

Schneider Electric Media Relations - Vicki True; 774-613-1158; This email address is being protected from spambots. You need JavaScript enabled to view it.
PR agency for Schneider Electric - Kappie Kopp; 919-741-9446; This email address is being protected from spambots. You need JavaScript enabled to view it.

DUBLIN--(BUSINESS WIRE)--The "Global Emission Control Catalysts Market by Type (Palladium, Platinum, Rhodium), Application (Mobile Sources, Stationary Sources), and Region - Forecast to 2026" report has been added to ResearchAndMarkets.com's offering.


The global emission control catalysts (ECC) market is estimated at USD 42.9 billion in 2021 and is projected to reach USD 59.8 billion by 2026, at a CAGR of 6.9% during the forecast period.

The market is driven by various factors, such as increase in the use of automotive diesel engines, and stringent emission regulations from the government. However, dependence of performance on temperature and loss of activity through poisoning and thermal deactivation can restrain the growth of the market.

Increase usage of gasoline engines leads to growing demand of palladium in catalytic converter

Palladium is one of the metals from the PGM group that dominates the catalytic converter technology. Palladium is used as an oxidation catalyst which is widely used in gasoline autocatalyst (petrol based engines) the in diesel engines. Palladium is not suitable for diesel-based autocatalyst because the fuel has high level of Sulphur content, which sticks to palladium but not platinum.

Stringent emission regulations in mobile sources to grow the demand for ECC

The mobile industry is the largest market for PGM based on ECC. The ECC market is derived further dividing the market into on road, and off road. Stringent emission regulations, and increasing pollution have increased the demand for ECC market.

APAC is expected to register the highest growth during the forecast period

APAC is expected to register the highest growth during the forecast period. Increasing population, growing industrialization, strict government norms, and environmental regulations are the key factors attributed to the overall growth of the market in the region. The increasing developments in the automotive industries in emerging countries of the region are providing huge growth opportunities for the ECC market.

Market Dynamics

Drivers

  • Stringent Emission Control Regulations to Drive the Emission Control Catalysts Market
  • Rising Demand for Diesel Oxidation Catalysts due to the Increasing Adoption of Diesel Engine Vehicles
  • Rising Demand for Advanced Selective Catalytic Reduction (SCR) Systems in Heavy Diesel Engines
  • Growing Aftermarket for Catalytic Converters Expected to Boost the Demand for ECC

Restraints

  • Rising Demand for Battery-Operated Electric Vehicles (BEVs), Plug-In Hybrid Electric Vehicles (PHEVs), and Hybrid Vehicles Supported by Government Incentives to Impact the Market for ECCs
  • Possibility of Undesired Secondary Emissions by Precious Metals

Opportunities

  • Rising Awareness Among Manufacturers in the Reduction of Vehicle Emissions by Installing Catalytic Converters
  • Increasing Innovation and Focus on the Washcoat Technology

Challenges

  • Decline in Global Automotive Industry Impacted by COVID-19
  • Fluctuating Prices of Platinum Group Metals
  • Loss of the Efficiency of Precious Metals Through Poisoning and Thermal Deactivation

Companies Mentioned

  • BASF Catalysts
  • Bosal
  • Cataler Corporation
  • CDTI Advanced Materials, Inc.
  • Clariant
  • Cormetech
  • Cummins, Inc.
  • DCL International Inc.
  • Ecocat India Pvt. Ltd.
  • Heraeus Holding
  • Hitachi Zosen Corporation
  • HJS Emission Technology GmbH & Co. KG
  • Ibiden
  • Interkat Catalyst GmbH
  • Johnson Matthey
  • Klarius Products Ltd
  • Kunming Sino-Platinum Metals Catalyst Co. Ltd.
  • Nett Technologies, Inc.
  • NGK Insulators, Ltd.
  • Shell Global
  • Sinocat Environmental Technology Co. Ltd.
  • Solvay
  • Tenneco, Inc.
  • Umicore
  • Zelolyst International

For more information about this report visit https://www.researchandmarkets.com/r/syffz2


Contacts

ResearchAndMarkets.com
Laura Wood, Senior Press Manager
This email address is being protected from spambots. You need JavaScript enabled to view it.

For E.S.T Office Hours Call 1-917-300-0470
For U.S./CAN Toll Free Call 1-800-526-8630
For GMT Office Hours Call +353-1-416-8900

NEW YORK--(BUSINESS WIRE)--Today Prescriptive Data, a smart building and real estate sustainability artificial intelligence company, announced it has been named the newest member of Microsoft for Startups, a global program that helps B2B startups scale with cloud resources and mentoring.


Prescriptive Data’s participation in Microsoft for Startups and collaboration with Microsoft helps increase opportunities for real estate owners and large enterprises in the U.S. and in global markets to use its smart building automation technology, Nantum OS. Nantum OS is a hardware agnostic platform with the ability to more efficiently connect and manage any real estate operational technology (HVAC, Meters, Occupancy Sensors, Indoor Air Quality Sensors, Lights, Shades, Thermostats) using artificial intelligence (AI) and machine-learning (ML).

Being a part of Microsoft for Startups will enable us to help more enterprises and real estate owners measure their real estate carbon emissions and automate their real estate decarbonization efforts,” said Sonu Panda, CEO, Prescriptive Data. “Microsoft for Startups gives us the ability to speed up our sales efforts so our team can stay focused on reducing carbon emissions across the entire real estate industry.”

Nantum OS serves as a smart building operating system to provide real estate managers with live occupancy data, energy demand and consumption data, and real-time and predictive carbon emission data. The system also uses machine learning to alert building operations teams to equipment malfunctions, fault detection, and even potential leaks and floods. Nantum OS further leverages AI to correlate real-time occupancy data with HVAC systems so buildings use the least amount of energy possible to provide the maximum amount of occupant comfort.

Nantum OS is now available on the Azure Marketplace and has announced their Microsoft partnership during the Microsoft Ignite conference November 2-4. Making Nantum OS available on the Azure Marketplace will allow Prescriptive Data customers to optimize their real estate and sustainability using Microsoft Azure services for a greater level of spatial intelligence.

Making software that supports sustainable real estate accessible is critical for organizations to meet their emission reductions goals. Utilizing both Microsoft for Startups and the Azure marketplace helps accelerate that,” said Tegan Keele, Managing Director, KPMG.

KPMG, in collaboration with Microsoft, helped advise Prescriptive Data’s buildout on Azure. “As we’ve been working alongside the Prescriptive Data team on helping clients to decarbonize their real estate portfolio, it only made sense to help deliver these services on the Azure marketplace,” said Craig Hays, Managing Director – Cloud Engineering, KPMG.

Prescriptive Data is best known for its work with Rudin Management, a large New York City real estate owner. Through portfolio-wide deployment of Nantum OS, the company saves $5.5 million each year on its energy bills, and has reduced its carbon emissions by more than 40%, as measured by NYSERDA’s 2019 measurement and verification case study.

Microsoft is committed to empowering developers to drive digital transformation for the built world,” said Tom Davis, Senior Director, Microsoft for Startups. “Prescriptive Data and its Nantum OS solution harnesses Microsoft’s intelligent cloud and edge offerings to achieve new levels of sustainability for commercial real estate.”


Contacts

Media:
Elise Szwajkowski
Marino, Account Director
This email address is being protected from spambots. You need JavaScript enabled to view it.
(212) 402-3495

Plan to end the use of coal as a primary fuel at Elm Road will help MGE achieve its carbon reduction goals


MADISON, Wis.--(BUSINESS WIRE)--Madison Gas and Electric (MGE) is taking another step toward its goal of net-zero carbon electricity with plans to eliminate coal-fired generation from its portfolio by 2035. This anticipated step will end the company's investment in coal-fired power generation and advance its goal of deep decarbonization.

Future plans for Elm Road Generating Station

MGE is a minority owner of the Elm Road Generating Station in Oak Creek, Wisconsin, owning 8.33%. The approximately 1,230-megawatt (MW) coal-fired plant is owned by WEC Energy Group, whose subsidiary serves as operator, and by WPPI Energy, Inc.

As majority owner, WEC Energy Group has announced plans to transition the Elm Road units to natural gas as their primary fuel source. This transition is expected to reduce the use of coal at Elm Road substantially by 2030 and to eliminate coal as an energy source at Elm Road by 2035.

"We have said since introducing our clean energy and carbon reduction goals—if we can go further faster, we will. By working with our partners to transition to natural gas as the primary fuel source, MGE expects to substantially reduce the use of coal at Elm Road by 2030 and to have no coal-fired power plants by 2035," MGE Chairman, President and CEO Jeff Keebler said. "Our continued transition away from coal and our significant investments in renewable energy represent our ongoing commitment to a cost-effective clean energy transition that benefits all MGE customers and maintains MGE's top-ranked electric reliability."

Ongoing transition away from coal-fired generation

MGE announced several years ago it was transitioning away from coal.

Earlier this year, MGE and its utility partners announced plans to retire the approximately 1,100-MW coal-fired Columbia Energy Center near Portage, Wisconsin, 15 years ahead of schedule.

By 2025, with the planned retirement of both units at Columbia, MGE will have eliminated approximately two-thirds of the company's current coal-fired generation capacity. By 2030, the company's remaining use of coal is expected to be reduced substantially, and by 2035, MGE is expected to eliminate coal as an energy source.

"Transitioning away from coal has been a priority since we established our ambitious carbon reduction goals, both in 2015 and in 2019, when we were one of the first utilities in the nation to announce plans to achieve net-zero carbon by 2050," Keebler added. "In 2011, MGE eliminated coal at the only coal-fired power plant in which we have sole ownership, Blount Generating Station. Ten years later, with this next step at Elm Road, we look forward to being another step closer to a net-zero carbon energy future."

Working toward net-zero carbon

Consistent with global climate science, MGE expects to achieve carbon reductions of at least 65% by 2030 and net-zero carbon electricity by 2050. The company continues to transition its energy supply, with the estimated addition of nearly 400 MW of wind, solar and battery storage between 2015 and 2024. The elimination of coal-fired generation is another example of MGE moving further faster to accomplish our goals.

Strategies to achieve net-zero carbon electricity

MGE's net-zero carbon goal is consistent with climate science from the Intergovernmental Panel on Climate Change (IPCC) October 2018 Special Report on limiting global warming to 1.5 degrees Celsius. To achieve deep decarbonization, MGE is growing its use of renewable energy, engaging customers around energy efficiency and working to electrify transportation, all of which are key strategies identified by the IPCC.

About MGE

MGE generates and distributes electricity to 157,000 customers in Dane County, Wisconsin, and purchases and distributes natural gas to 166,000 customers in seven south-central and western Wisconsin counties. MGE's parent company is MGE Energy, Inc. The company's roots in the Madison area date back more than 150 years.


Contacts

Kaya Freiman
Corporate Communications Manager
608-252-7276 | This email address is being protected from spambots. You need JavaScript enabled to view it.

DUBLIN--(BUSINESS WIRE)--The "Inland Vessel Market by Vessel Type, Fuel Type and Application: Global Opportunity Analysis and Industry Forecast, 2021-2030" report has been added to ResearchAndMarkets.com's offering.


Inland vessels are water floating vessels designed especially for transporting cargo as well as passengers. Increase in trade activities between cities followed by the need for smarter transportation activities creates numerous opportunities for growth of the market during the forecast period.

Moreover, presence of companies such as Groupe Beneteau, CMA CGM Group, and Damen Shipyards Group supports growth of the market.

The inland vessel market has witnessed significant growth over the years, owing to increase in trend of advanced floating vessels, which supplements growth of the market.

The global inland vessel market is segmented on the basis of vessel type, fuel type, application, and region. By vessel type, the global market has been segmented into passenger vessel and non-passenger vessel. By fuel type, it is segmented into LNG, diesel oil, heavy fuel oil, and others. By application, it is segmented into oil tankers, bulk carriers, general cargo ships, container ships, and others. Region wise, the global market is segmented into North America, Europe, Asia-Pacific, and LAMEA.

Key Benefits

  • This study presents analytical depiction of the global inland vessel market along with the current trends and future estimations to depict the imminent investment pockets.
  • The overall market potential is determined to understand the profitable trends to enable stakeholders gain a stronger foothold in the market.
  • The report presents information related to key drivers, restraints, and opportunities with a detailed impact analysis.
  • The current market is quantitatively analyzed from 2020 to 2030 to highlight the financial competency of the market.
  • Porter's five forces analysis illustrates the potency of the buyers and suppliers.

Market Dynamics

Drivers

  • Increase in demand for cargo transportation through ships
  • Rise in trade-related agreements
  • Technological advancement in boats and boat engines

Restraints

  • Fluctuations in transportation and inventory costs
  • Environmental concerns associated with inland vessels

Opportunities

  • Anticipated trend of automation in marine transportation
  • Increase in marine safety norms

Key Players

  • Alnmaritec Ltd.
  • Groupe Beneteau
  • CMA CGM Group
  • Damen Shipyards Group
  • EURO-RIJN B.V.
  • Hodder Tugboat Co. Ltd.
  • DSME
  • Viking Shipping
  • SANMAR
  • Windcat Workboats BV

For more information about this report visit https://www.researchandmarkets.com/r/dhz4cd


Contacts

ResearchAndMarkets.com
Laura Wood, Senior Press Manager
This email address is being protected from spambots. You need JavaScript enabled to view it.

For E.S.T Office Hours Call 1-917-300-0470
For U.S./CAN Toll Free Call 1-800-526-8630
For GMT Office Hours Call +353-1-416-8900

2022 schedule has 200+ sailings with exciting ships and itineraries to meet every traveler’s high seas vacation plans

SAN PEDRO, Calif.--(BUSINESS WIRE)--The departure of the Grand Princess at the Port of Los Angeles on September 25 signaled the start of a big comeback for cruise ship operations at the World Cruise Center on the LA Waterfront.


The Port is forecasting more than 200 sailings during the 2022 calendar year – the most since 2008. Vacationers can choose itineraries from 11 unique cruise brands, anchored by the Port’s longest-standing cruise partner Princess Cruises, along with Norwegian Cruise Line and Royal Caribbean Cruise Lines, which makes its return to the Los Angeles market after a decade.

Luxury cruise lines Oceania, Regent Seven Seas, Viking Cruises, Crystal, Seabourn, Cunard and NYK also have scheduled sailings from the LA Waterfront this coming year.

“Resumption of cruises from the LA Waterfront is not only great news for our cruise partners and local economy, but also the tens of thousands of vacationers who will have a variety of cruise options, itineraries and exciting destinations conveniently accessible from the Port of Los Angeles,” said Christopher Chase, marketing manager at the Port of Los Angeles.

“Many of these cruise ships are less than five years old, and can be considered destinations in and of themselves, featuring incredible amenities that passengers of all ages can appreciate,” added Chase.

Sailing from the Port of Los Angeles since 1965, Princess Cruises and its iconic LA-based Pacific Princess introduced cruise vacations to a new generation of travelers when the ship was featured on The Love Boat television series starting in the 1970s. More than a half century later, Princess Cruises’ 70 departures out of Los Angeles in 2022 include sailings on the Discovery Princess, the cruise line’s newest 3,600-passenger flagship vessel, slated to arrive in the first half of next year.

In 2022, Princess Cruises’ itineraries out of Los Angeles will largely focus on week-long trips to the Mexican Rivera, with stops in Cabo San Lucas, Puerta Vallarta and Mazatlán. Once Hawaii lifts its current COVID-19 travel restrictions, Princess Cruises will once again offer its popular 14-day itineraries to the Hawaiian Islands.

Norwegian Cruise Lines’ Norwegian Bliss and Norwegian Joy, also newer vessels, will continue to sail from the LA Waterfront. With capacity for up to 4,500 passengers, they are the largest cruise ships serving the U.S. West Coast and also sail Mexican Riviera itineraries.

For 2022, Royal Caribbean Cruise Lines will return to the LA Waterfront with its 3,200-passenger Navigator of the Seas, offering year-round, twice-weekly three-day getaways to Ensenada, Mexico, and four-day cruises to Ensenada and Catalina Island. Since the early 2000s, Ensenada has grown into an emerging Baja California culinary hub, known for its fish and lobster tacos, plus an expanding wine region.

Los Angeles remains a top market for cruises, widely recognized as a convenient embarkation and disembarkation point for sea-going travelers. Its new and expanded cruise offerings solidify Los Angeles as an exciting gateway to cruises throughout the Pacific.

Cruise travel is also a valuable component of L.A. tourism economy. A busy cruise weekend, with three or four ships in port, brings as many as 20,000 travelers to the LA Waterfront. Each cruise ship call generates more than $1 million in economic activity.

L.A. is also the nation’s largest “drive-to” cruise market, attracting motorists from as far as Phoenix and Las Vegas. Farther north, cruise vacationers from San Francisco, Seattle and Vancouver, BC, Canada, appreciate the fly-in convenience of Los Angeles World Airport, 22 miles north of the Port, as do the frequent wintertime Canadian “snowbirds” from Edmonton and Calgary. Click here for cruise schedules.


Contacts

Arley Baker
Port of L.A. Communications
(310) 732-3093
This email address is being protected from spambots. You need JavaScript enabled to view it.

  • Initial proof-of-concept demonstration conducted in August 2021
  • Leverages an AeroVironment end-to-end solution with combat-proven systems for increased mission autonomy and efficacy

ARLINGTON, Va.--(BUSINESS WIRE)--$AVAV #AeroVironment--AeroVironment, Inc. (NASDAQ: AVAV), a global leader in intelligent, multi-domain robotic systems, today announced the successful demonstration of integrating Switchblade® 300 loitering missiles and JUMP® 20 medium unmanned aircraft systems (UAS) for increased mission autonomy and efficacy. This Air Launched Effects (ALE) proof-of-concept demonstration took place in August 2021 with the goal of launching an inert Switchblade 300 from the JUMP 20 and successfully recovering both air vehicles.


The systems were integrated by fixing the inert Switchblade 300 tube-launch system to the existing JUMP 20 platform’s vertical lift boom with a custom-made bolt-on mount and firing solution. Switchblade 300 was remotely fired using the JUMP 20 ground control solution with in-flight control taken by a separate Switchblade ground element. Both vehicles were successfully recovered, proving the demonstration event to be the first-ever Switchblade 300 integration and air launch from a JUMP 20 Group 3 vertical takeoff and landing (VTOL) platform.

“This end-to-end integrated solution enables customers with greater time on station than if they were to deploy a Switchblade on its own, resulting in the ability to conduct persistent real-time surveillance to increase the chance of identifying the correct target and minimizing collateral damage,” said Brett Hush, AeroVironment vice president and product line general manager of tactical missile systems. “It combines the combat-proven Switchblade loitering missile’s lethality, reach and precision strike capabilities with low collateral effects and the VTOL, fixed-wing JUMP 20’s advanced multi-sensor ISR services and 14-hour endurance.”

ABOUT AEROVIRONMENT, INC.

AeroVironment (NASDAQ: AVAV) provides technology solutions at the intersection of robotics, sensors, software analytics and connectivity that deliver more actionable intelligence so you can Proceed with Certainty. Headquartered in Virginia, AeroVironment is a global leader in intelligent, multi-domain robotic systems and serves defense, government and commercial customers. For more information, visit www.avinc.com.

SAFE HARBOR STATEMENT

Certain statements in this press release may constitute "forward-looking statements" as that term is defined in the Private Securities Litigation Reform Act of 1995. These statements are made on the basis of current expectations, forecasts and assumptions that involve risks and uncertainties, including, but not limited to, economic, competitive, governmental and technological factors outside of our control, that may cause our business, strategy or actual results to differ materially from those expressed or implied. Factors that could cause actual results to differ materially from the forward-looking statements include, but are not limited to, our ability to perform under existing contracts and obtain additional contracts; changes in the regulatory environment; the activities of competitors; failure of the markets in which we operate to grow; failure to expand into new markets; failure to develop new products or integrate new technology with current products; and general economic and business conditions in the United States and elsewhere in the world. For a further list and description of such risks and uncertainties, see the reports we file with the Securities and Exchange Commission. We do not intend, and undertake no obligation, to update any forward-looking statements, whether as a result of new information, future events or otherwise.


Contacts

Makayla Thomas
AeroVironment, Inc.
+1 (805) 520-8350
This email address is being protected from spambots. You need JavaScript enabled to view it.

Mark Boyer
For AeroVironment, Inc.
+1 (213) 247-4109
This email address is being protected from spambots. You need JavaScript enabled to view it.

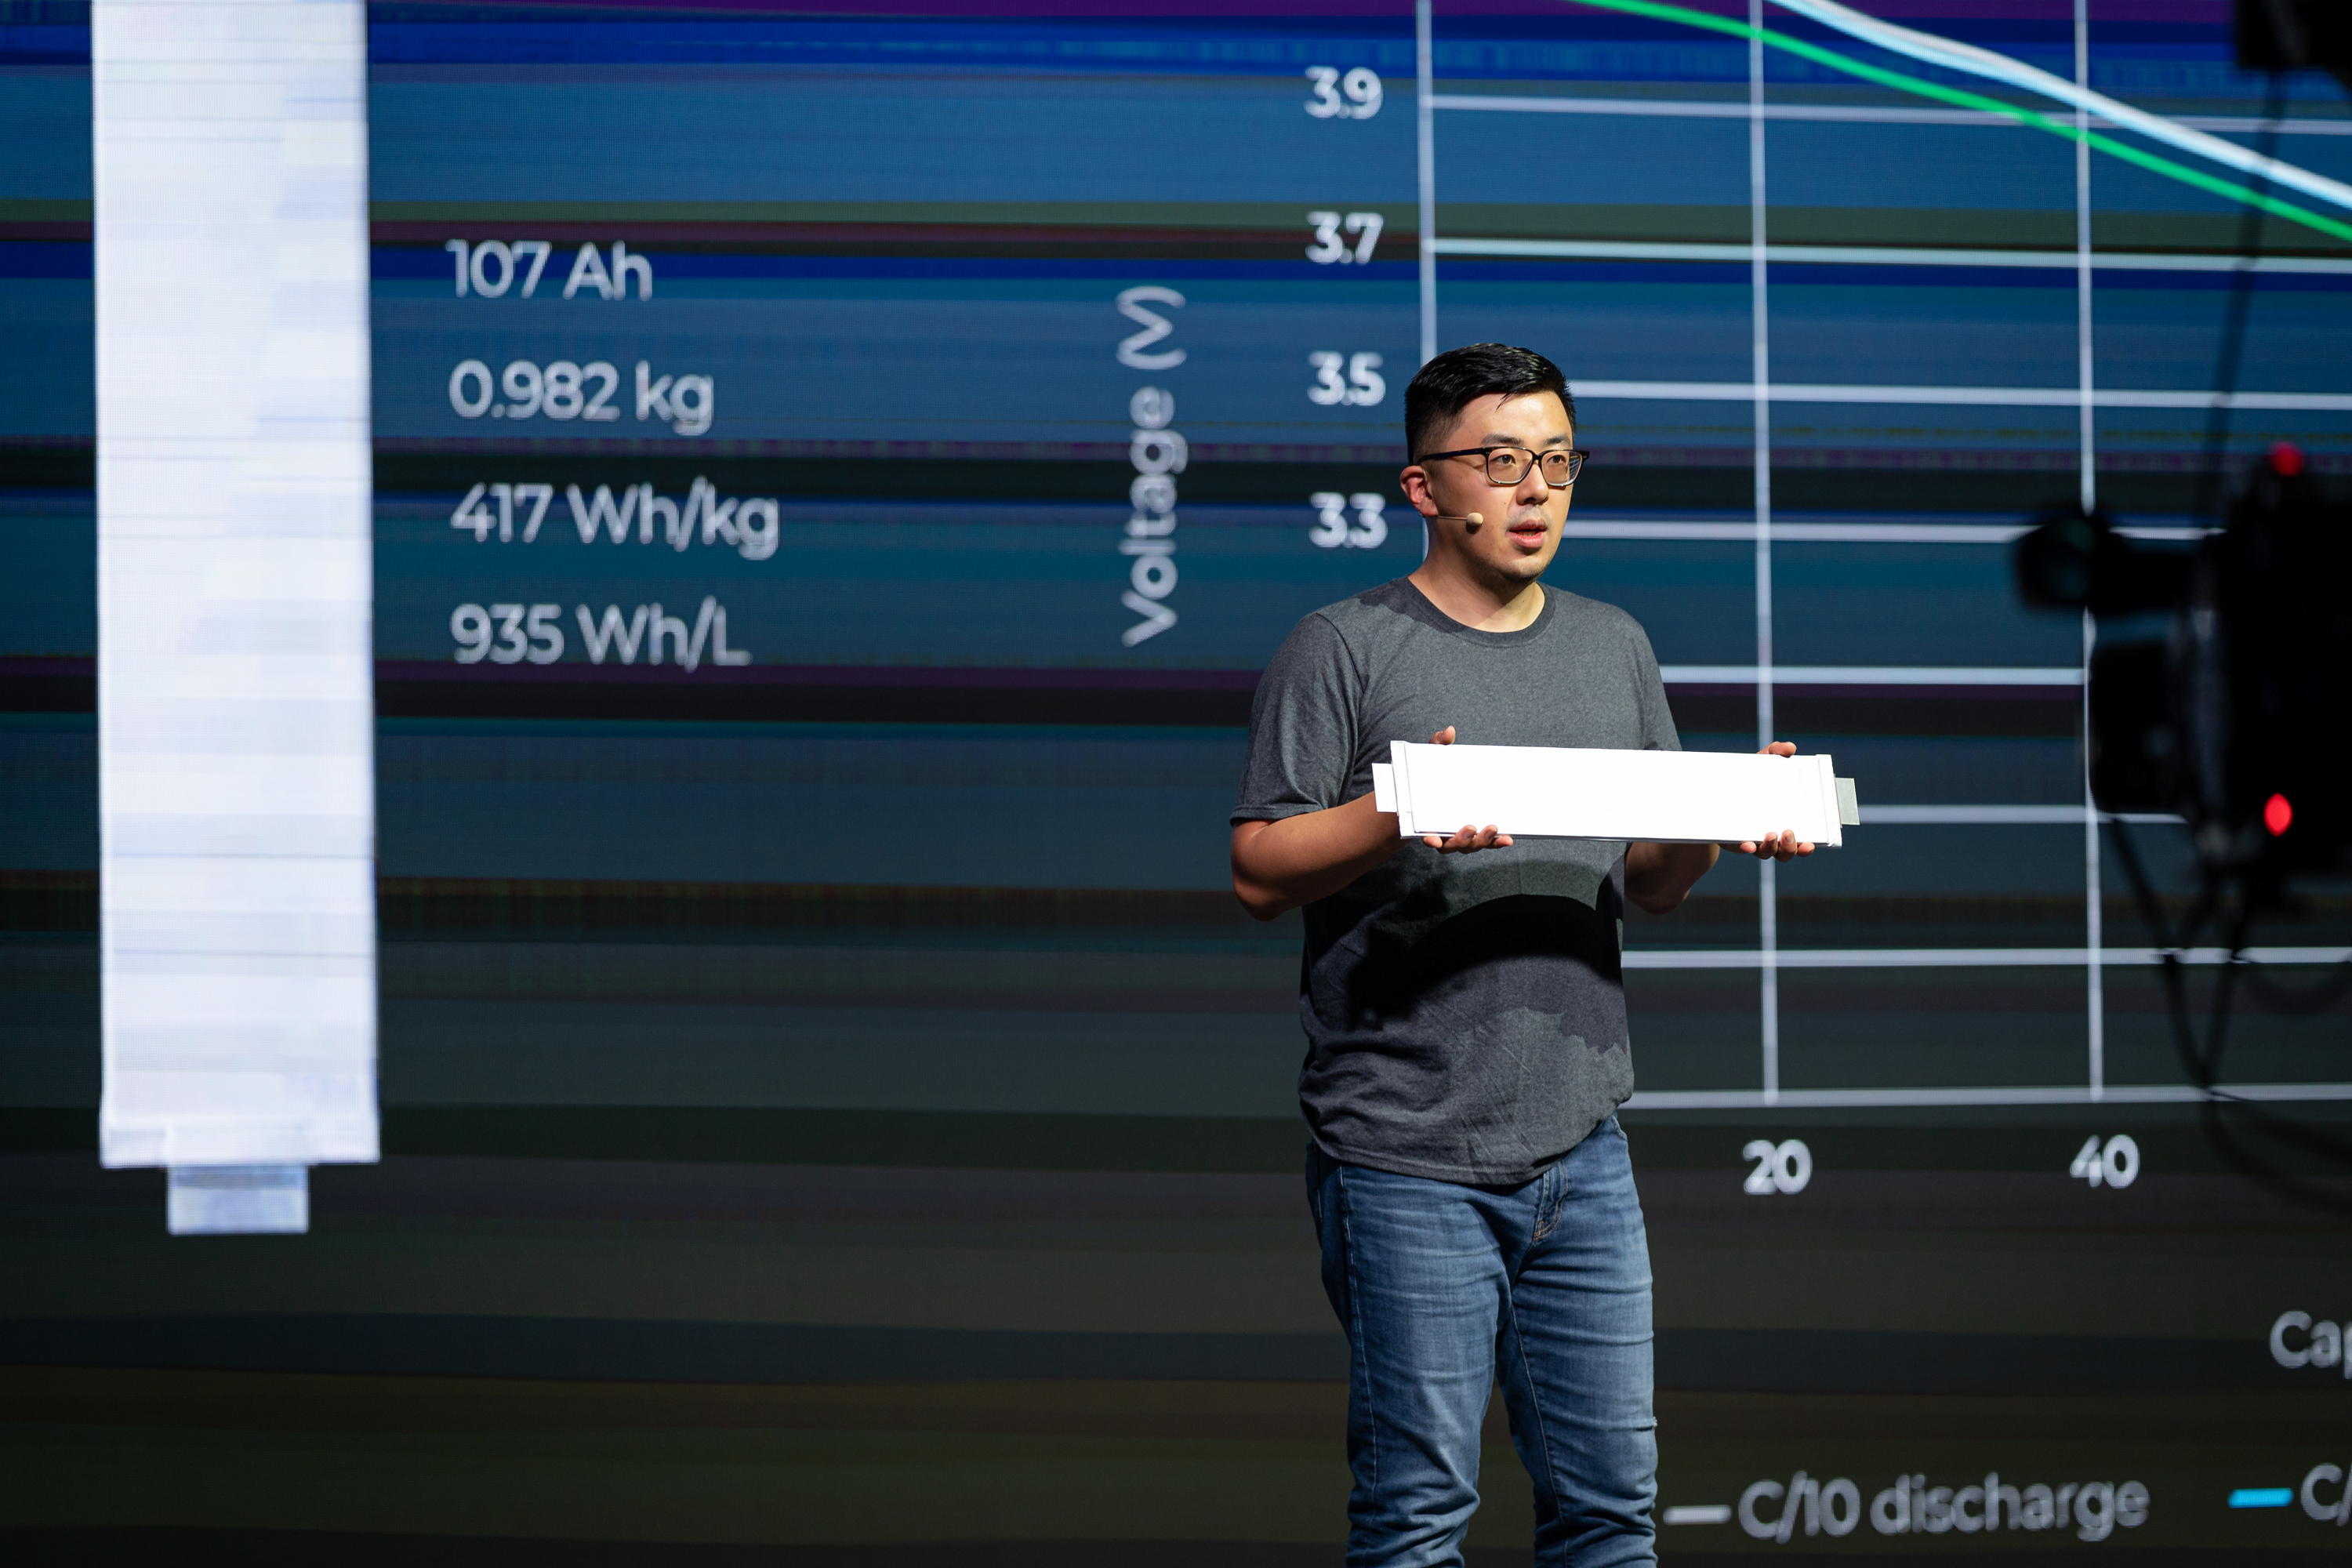
107 Ah Li-Metal battery marks a major milestone in demonstrating commercial readiness of Li-Metal battery technology for EV market

BOSTON--(BUSINESS WIRE)--#ai--SES (formerly known as SolidEnergy Systems), a global leader in the development and initial production of high-performance hybrid lithium-metal (Li-Metal) rechargeable batteries for electric vehicles (EVs) and other applications, today announced Apollo™, a 107 Ah Li-Metal battery that is the largest in the world and a breakthrough for the automotive industry. This is also the world’s first 100 plus Ah Li-Metal battery ever demonstrated. SES also announced the largest Li-Metal facility in the world – the Shanghai Giga, a new 300,000 square-foot facility being built in Shanghai, China and scheduled for completion in 2023.


The announcements were made at SES Battery World, the company’s inaugural Battery World virtual event taking place in the United States on November 3 and in South Korea and China on November 4.

In July 2021, SES announced plans to list on the New York Stock Exchange (NYSE) through a merger with Ivanhoe Capital Acquisition Corp. (NYSE: IVAN) (“Ivanhoe Capital”). Upon the closing of the transaction, the combined company will be listed on the NYSE under the new ticker symbol “SES.”

Apollo™ can deliver 107 Ah, weighs only 0.982 kg, and has an energy density of 417 Wh/kg and 935 Wh/L. Apollo™ also demonstrated similarly high capacity and energy density when tested at C/10 (10 hour discharge), C/3 (3 hour discharge), and 1C (1 hour discharge) at room temperature.

“There’s a race among leading global carmakers and next generation battery suppliers to develop and demonstrate the world’s first 100 Ah Li-Metal battery. Today we did it. We will continue to work with our OEM partners to optimize this battery and bring it to commercial production. We are confident that we and our OEM partners will win this race, and be the first to commercialize this next generation Li-Metal battery,” said Dr. Qichao Hu, founder and CEO, SES (formerly known as SolidEnergy Systems). “These batteries will need to go through further testing and optimization, but we are very excited about the performance that they have shown. Batteries need to be capable of delivering high energy density over a wide range of temperature and power density. A car needs to work in hot and cold environments and perform seamlessly when driven fast or slowly. Solid state batteries can never achieve this performance at the level of our hybrid Li-Metal batteries.”

SES also introduced its 3 parallel development tracks: Hermes™ (platform for material development), Apollo™ (engineering capability for large automotive cells), and Avatar™ (AI-powered safety software to monitor battery health).

SES is working with GM and Hyundai to deliver practical automotive A samples next year, and aim to start commercialization of Li-Metal batteries in 2025. SES is the only company that has entered into automotive A-sample joint development with automakers for Li-Metal batteries.

Expanding for Future Growth

Dr. Hu also unveiled an aerial image of SES’s new Shanghai Giga. Scheduled for completion in 2023, the Shanghai Giga will be a 300,000 square-foot facility located in the “auto city” Jiading, Shanghai, capable of producing 1 GWh of Li-Metal batteries annually, by far the largest Li-Metal facility on the planet.

“The industry doesn’t need another battery breakthrough. What the world needs is someone who can take a battery breakthrough and make it work, truly, practically and completely, and then scale it up into hundreds of thousands and millions of vehicles. That’s what we’re here to do,” said Hu.

“Of all the public claims of new battery technologies, SES is the first which I am aware of to achieve large cell format Lithium metal anodes,” said Bob Galyen, Owner of Galyen Energy LLC and Former CTO of CATL. “With SES’s unique electrolyte-salt combination they have created a cell which has superior safety, impressive performance, achieved respectable life and utilizes nearly the same manufacturing processes as used by the Lithium-Ion manufacturers today.”

“We looked at a wide array of battery companies and SES has by far the most advanced next generation battery technologies and is the closest to commercializing those technologies in electric vehicles,” said Robert Friedland, Chairman and CEO, Ivanhoe Capital Acquisition and Founder and Executive Co-Chairman, Ivanhoe Mines.

About SES

SES is a global leader in development and initial production of high-performance Li-Metal rechargeable batteries for electric vehicles (EVs) and other applications. Founded in 2012, SES is an integrated Li-Metal battery manufacturer with strong capabilities in material, cell, module, AI-powered safety algorithms and recycling. Formerly known as SolidEnergy Systems, SES is headquartered in Singapore and has operations in Boston, Shanghai and Seoul.

About Ivanhoe Capital Acquisition Corp.

Ivanhoe Capital Acquisition Corp. (NYSE: IVAN) is a special purpose acquisition company formed for the purpose of effecting a merger, share exchange, asset acquisition, share purchase, reorganization or similar business combination with one or more businesses. Ivanhoe was formed to seek a target in industries related to the paradigm shift away from fossil fuels towards the electrification of industry and society.

Forward-looking statements

All statements other than statements of historical facts contained in this press release are “forward-looking statements.” Forward-looking statements can generally be identified by the use of words such as “believe,” “may,” “will,” “estimate,” “continue,” “anticipate,” “intend,” “expect,” “should,” “would,” “plan,” “project,” “forecast,” “predict,” “potential,” “seem,” “seek,” “future,” “outlook,” “target” and other similar expressions that predict or indicate future events or events or trends that are not statements of historical matters. These forward-looking statements include, but are not limited to, statements regarding the development and commercialization of SES’s products, the amount of capital and other benefits to be provided by the transaction, estimates and forecasts of other financial and performance metrics, and projections of market opportunity and market share. These statements are based on various assumptions, whether or not identified in this press release, and on the current expectations of SES's and Ivanhoe's management and are not predictions of actual performance. These forward-looking statements are provided for illustrative purposes only and are not intended to serve as and must not be relied on by any investor as a guarantee, an assurance, a prediction or a definitive statement of fact or probability. Actual events and circumstances are difficult or impossible to predict and may differ from assumptions, and such differences may be material. Many actual events and circumstances are beyond the control of SES and Ivanhoe. These forward-looking statements are subject to a number of risks and uncertainties, including changes in domestic and foreign business, market, financial, political and legal conditions; the inability of the parties to successfully or timely consummate the business combination, including the risk that any required regulatory approvals are not obtained, are delayed or are subject to unanticipated conditions that could adversely affect the combined company or the expected benefits of the business combination or that the approval of the shareholders of SES or Ivanhoe is not obtained; the failure to realize the anticipated benefits of the business combination; risks relating to the uncertainty of the projected financial information with respect to SES; risks related to the development and commercialization of SES's battery technology and the timing and achievement of expected business milestones; the effects of competition on SES's business; the risk that the business combination disrupts current plans and operations of Ivanhoe and SES as a result of the announcement and consummation of the business combination; the ability to recognize the anticipated benefits of the business combination, which may be affected by, among other things, competition, the ability of the combined company to grow and manage growth profitably, maintain relationships with customers and retain its management and key employees; risks relating SES’s history of no revenues and net losses; the risk that SES’s joint development agreements and other strategic alliances could be unsuccessful; risks relating to delays in the design, manufacture, regulatory approval and launch of SES’s battery cells; the risk that SES may not establish supply relationships for necessary components or pay components that are more expensive than anticipated; risks relating to competition and rapid change in the electric vehicle battery market; safety risks posed by certain components of SES’s batteries; risks relating to machinery used in the production of SES’s batteries; risks relating to the willingness of commercial vehicle and specialty vehicle operators and consumers to adopt electric vehicles; risks relating to SES’s intellectual property portfolio; the amount of redemption requests made by Ivanhoe's public shareholders; the ability of Ivanhoe or the combined company to issue equity or equity-linked securities or obtain debt financing in connection with the business combination or in the future and those factors discussed in Ivanhoe's annual report on Form 10-K, filed with the U.S. Securities and Exchange Commission (the “SEC”) on March 31, 2021, under the heading "Risk Factors," and other documents of Ivanhoe filed, or to be filed, with the SEC relating to the business combination. If any of these risks materialize or Ivanhoe's or SES's assumptions prove incorrect, actual results could differ materially from the results implied by these forward-looking statements. There may be additional risks that neither Ivanhoe nor SES presently know or that Ivanhoe and SES currently believe are immaterial that could also cause actual results to differ from those contained in the forward-looking statements. In addition, forward-looking statements reflect Ivanhoe's and SES's expectations, plans or forecasts of future events and views only as of the date of this press release. Ivanhoe and SES anticipate that subsequent events and developments will cause Ivanhoe's and SES's assessments to change. However, while Ivanhoe and SES may elect to update these forward-looking statements at some point in the future, Ivanhoe and SES specifically disclaim any obligation to do so. These forward-looking statements should not be relied upon as representing Ivanhoe's and SES's assessments as of any date subsequent to the date of this press release. Accordingly, undue reliance should not be placed upon the forward-looking statements.

Additional Information

This press release relates to the proposed business combination between Ivanhoe and SES. This press release does not constitute an offer to sell or exchange, or the solicitation of an offer to buy or exchange, any securities, nor shall there be any sale of securities in any jurisdiction in which such offer, sale or exchange would be unlawful prior to registration or qualification under the securities laws of any such jurisdiction. Ivanhoe has filed a Registration Statement on Form S-4 with the SEC, which includes a document that serves as a joint prospectus and proxy statement, referred to as a proxy statement/prospectus, and which has not yet been declared effective. A proxy statement/prospectus will be sent to all Ivanhoe shareholders. No offering of securities shall be made except by means of a prospectus meeting the requirements of Section 10 of the Securities Act of 1933, as amended, or an exemption therefrom. Ivanhoe will also file other documents regarding the proposed business combination with the SEC. BEFORE MAKING ANY VOTING DECISION, INVESTORS AND SECURITY HOLDERS OF IVANHOE ARE URGED TO READ THE REGISTRATION STATEMENT, THE PROXY STATEMENT/PROSPECTUS AND ALL OTHER RELEVANT DOCUMENTS FILED OR THAT WILL BE FILED WITH THE SEC IN CONNECTION WITH THE PROPOSED BUSINESS COMBINATION AS THEY BECOME AVAILABLE BECAUSE THEY WILL CONTAIN IMPORTANT INFORMATION ABOUT THE PROPOSED BUSINESS COMBINATION.

Investors and security holders will be able to obtain free copies of the registration statement, the proxy statement/prospectus and all other relevant documents filed or that will be filed with the SEC by Ivanhoe through the website maintained by the SEC at www.sec.gov. The documents filed by Ivanhoe with the SEC also may be obtained free of charge upon written request to Ivanhoe Capital Acquisition Corp., 1177 Avenue of the Americas, 5th Floor, New York, New York 10036.

Participants in the Solicitation

Ivanhoe, SES and their respective directors and executive officers may be deemed to be participants in the solicitation of proxies from Ivanhoe’s shareholders in connection with the proposed business combination. You can find information about Ivanhoe’s directors and executive officers and their interest in Ivanhoe can be found in Ivanhoe’s Annual Report on Form 10-K for the fiscal year ended December 31, 2020, which was filed with the SEC on March 31, 2021. A list of the names of the directors, executive officers, other members of management and employees of Ivanhoe and SES, as well as information regarding their interests in the business combination, are contained in the Registration Statement on Form S-4 filed with the SEC by Ivanhoe. Additional information regarding the interests of such potential participants in the solicitation process may also be included in other relevant documents when they are filed with the SEC. You may obtain free copies of these documents from the sources indicated above.


Contacts

Gaby Lechin
Email: This email address is being protected from spambots. You need JavaScript enabled to view it.
Office: 720-230-6399

Investors
This email address is being protected from spambots. You need JavaScript enabled to view it.

ORANGE, Conn.--(BUSINESS WIRE)--AVANGRID, Inc. [NYSE: AGR] has issued the following statement in response to the results of yesterday’s state referendum in Maine.


“Despite support from the current and former Governors of Maine, the Biden administration, both major dailies in Maine and significant efforts highlighting the importance of the New England Clean Energy Connect (NECEC) project, the fossil fuel companies, who have spent millions on a misinformation campaign about the NECEC project, have won the vote on a citizens’ initiative also known as Question 1.

“Yesterday’s vote in Maine was a setback in our progress toward a clean, sustainable energy future for the state, the region, and for our nation which urgently needs to embrace clean energy solutions. The irony should not be lost that as global leaders are gathered in Glasgow to address climate change, selfish fossil fuel interests remain focused on their own profits and are willing to spend millions to block badly needed clean energy projects like the NECEC.

“While the outcome of this election is disappointing, it is not the end of the road and we will continue to advocate for this historic and important clean energy project. We have followed the rules every step of the way in a transparent and public process and have received every regulatory approval required for this project to proceed. Politicians and their supporters shouldn’t be allowed to tear up valid contracts, ignore the judicial and executive branches and go back in time to retroactively change the rules to stop a project like the NECEC just because it threatens their political and financial interests.

“We thank our supporters and the 148,000 Mainers who voted in support of the NECEC project. The benefits to the state as well as the region are immense, and we look forward to delivering clean energy to the New England region and the people of Maine.”

About AVANGRID: AVANGRID, Inc. (NYSE: AGR) aspires to be the leading sustainable energy company in the United States. Headquartered in Orange, CT with approximately $39 billion in assets and operations in 24 U.S. states, AVANGRID has two primary lines of business: Avangrid Networks and Avangrid Renewables. Avangrid Networks owns and operates eight electric and natural gas utilities, serving more than 3.3 million customers in New York and New England. Avangrid Renewables owns and operates a portfolio of renewable energy generation facilities across the United States. AVANGRID employs approximately 7,000 people and has been recognized by Forbes and Just Capital as one of the 2021 JUST 100 companies – a list of America’s best corporate citizens – and was ranked number one within the utility sector for its commitment to the environment and the communities it serves. The company supports the U.N.’s Sustainable Development Goals and was named among the World’s Most Ethical Companies in 2021 for the third consecutive year by the Ethisphere Institute. For more information, visit www.avangrid.com.


Contacts

MEDIA:
Zsoka McDonald
This email address is being protected from spambots. You need JavaScript enabled to view it.
203-997-6892

INVESTOR:
Patricia Cosgel
This email address is being protected from spambots. You need JavaScript enabled to view it.
203-499-2624

DUBLIN--(BUSINESS WIRE)--The "Energy Harvesting System Market Size, Share & Trends Analysis Report By Technology (Lights, Vibration), By Vibration Technology (Piezoelectric, Electrostatic), By Component, By Application, and Segment Forecasts, 2020-2028" report has been added to ResearchAndMarkets.com's offering.


The global energy harvesting system market size is expected to reach USD 986.3 million by 2028 and is expected to grow at a CAGR of 10.2% from 2020 to 2028

Growing expenditure in infrastructure and industry development is anticipated to have a positive impact on the global market over the projected period.

The COVID-19 pandemic has caused many disruptions in the market. However, mobility and economic activity are likely to accelerate with time. This is expected to increase commercial and industrial demand for Internet of Things (IoT) projects deployment, which will increase the demand for energy harvesting systems in the future.

IoT has gained widespread momentum across all industrial sectors including automotive, energy, defense, consumer electronics, and healthcare, among others. The increasing preference towards offering data-centric, personalized experiences to the customers is pushing companies to connect as many devices as possible to gather more consumer-related data.

Europe accounted for the maximum share of the global revenue in 2020 due to supporting policies by the European Union. European countries are investing in and focusing on the maximum utilization of IoTs to drive the technology's advancement across various end-use sectors in the region, such as building & home automation, lighting, industrial, and automated meter reading.

Energy Harvesting System Market Report Highlights

  • The market is highly fragmented as it has different categories of technology, application, and service providers.
  • The industrial application type segment accounted for the largest revenue share of more than 30% in 2020.
  • The vibration technology segment led the global market in 2020 with a revenue share of over 32%.
  • Government schemes aim to promote product installation across industrial, residential, and commercial applications.
  • These systems can be operated on-grid as well as off-grid depending on the application and location.
  • Moreover, the multiple benefits of these systems over conventional power generation methods are expected to fuel the market growth.

Key Topics Covered:

Chapter 1. Methodology and Scope

Chapter 2. Executive Summary

Chapter 3. Energy Harvesting System Market Variables, Trends & Scope

Chapter 4. Energy Harvesting System Market: Technology Estimates & Trend Analysis

Chapter 5. Energy Harvesting System Market: Vibration Technology Estimates & Trend Analysis

Chapter 6. Energy Harvesting System Market: Component Estimates & Trend Analysis

Chapter 7. Energy Harvesting System Market: Application Estimates & Trend Analysis

Chapter 8. Energy Harvesting System Market: Regional Estimates & Trend Analysis

Chapter 9. Competitive Analysis

Chapter 10. Company Profiles

  • ABB
  • Schneider Electric
  • Bionic Power Inc
  • Texas Instruments Incorporated
  • Analog Devices inc
  • Voltree Power Inc
  • STMicroelectronics
  • Cymbet
  • Powercast Corp.
  • EnOcean GmbH
  • E-peas
  • Mahale GmbH
  • Viezo
  • Kinergizer
  • Enervibe

For more information about this report visit https://www.researchandmarkets.com/r/shfwnt


Contacts

ResearchAndMarkets.com
Laura Wood, Senior Press Manager
This email address is being protected from spambots. You need JavaScript enabled to view it.

For E.S.T Office Hours Call 1-917-300-0470
For U.S./CAN Toll Free Call 1-800-526-8630
For GMT Office Hours Call +353-1-416-8900

New quarterly report helps shippers better understand when to book ocean freight to help ensure goods arrive on time and mitigate risks of downstream disruptions

AUSTIN, Texas--(BUSINESS WIRE)--E2open Parent Holdings, Inc. (NYSE: ETWO), a leading network-based provider of a mission-critical, cloud-based, end-to-end supply chain management platform, today released a new quarterly report that tracks ocean shipment delivery times from booking freight to receipt of goods, across major trade lanes between Asia, North America and Europe to help importers mitigate risk and make better decisions on when to book cargo.

Based on information from E2open’s business network, which encompasses 26% of all global ocean bookings and has visibility into more than 40% of international container trade, the E2open Ocean Shipping Index provides a data-driven reference for shippers to understand how long it takes to move goods internationally as well as the factors that contribute to observed delays.

Key findings from the Ocean Shipping Index include:

  • Overall, lead times have steadily increased across all lanes during the last 12 months, requiring shippers to budget more time for transporting goods
  • In the third calendar quarter of 2021, the average global shipment took 12 more days, or 23% longer, than the same period last year
  • The two most significant factors were a rise in time between the booking to gate in at the port, up 43%; and the ocean transit time, up 36%
  • Overall lead times from North America to Asia took 17 days longer than from Asia to North America, or 25% longer

“Ocean transportation is the backbone for world’s largest supply chains and critical to the flow of goods that power global economies,” said Pawan Joshi, executive vice president of products and strategy at E2open. “Successful operations require an accurate understanding of how long it takes to ship freight, especially for just-in-time supply chains. Detailed understanding of the time required for containers to arrive at the port, clear customs and be ready for pick up by ground carriers is the key to streamlining port operations and decongesting logistics operations. Transportation volatility – driven by high demand, container shortages and port congestion – has made historical lead times unreliable, increasing the risks of disruption in downstream production and customer service. Among other things, this quarterly index provides a new level of visibility so that shippers can better understand when to book capacity for goods to arrive at the required date.”

The Ocean Shipping Index adds to a growing list of benchmark reports available from E2open to help the industry navigate the increasingly complex global supply chain, including the annual Forecasting and Inventory Benchmark Study, monthly Freight Market Index and dynamic Freight Rate Index.

Learn more about the E2open Ocean Shipping Index at E2open.com.

About E2open

At E2open, we’re creating a more connected, intelligent supply chain. It starts with sensing and responding to real-time demand, supply and delivery constraints. Bringing together data from clients, distribution channels, suppliers, contract manufacturers and logistics partners, our collaborative and agile supply chain platform enables companies to use data in real time, with artificial intelligence and machine learning to drive smarter decisions. All this complex information is delivered in a single view that encompasses your demand, supply, logistics and global trade ecosystems. E2open is changing everything. Demand. Supply. Delivered.™ Visit www.e2open.com.

E2open and the E2open logo are registered trademarks of E2open, LLC. Demand. Supply. Delivered. is a trademark of E2open, LLC. All other trademarks, registered trademarks and service marks are the property of their respective owners.


Contacts

Corporate Contact:
Kristin Seigworth | VP, Communications | E2open | This email address is being protected from spambots. You need JavaScript enabled to view it.

Media Contact:
WE Communications for E2open | This email address is being protected from spambots. You need JavaScript enabled to view it. | 512-527-7029

DALLAS--(BUSINESS WIRE)--#AI--Leading energy storage and distributed energy analytics firm, Enovation Analytics, has launched their Real Time Trading Desk Platform. This new capability enables the development of competitively advantaged dispatch strategies that provides asset managers with an empirically based approach to maximize their returns.


The SaaS platform combines advanced machine learning models for more accurately predicting near term energy prices with portfolio short term dispatch optimization of storage and hybrid renewable resources. The platform integrates operational equipment constraints and financial trading strategies to maximize the portfolio value.

Enovation Analytics has developed best-in-class AI techniques to manage battery, solar, wind and fuel cell assets across all ISOs in North America. The enhanced user interface allows users easy access to position, pricing and performance analysis across multiple asset classes and geographies. Terry Bickham, Head of Product at Enovation Analytics, observes, “The deep experience and industry knowledge, the breadth of that experience, coupled with best-in-class AI techniques has produced some phenomenal results.”

From their work as the analysis engine supporting Lazard’s “Levelized Cost of Storage” series to the new Short Term Trading Desk Platform, Enovation Analytics continues to bring world class trading expertise to the Distributed Energy Resource Revolution.

About Enovation Analytics:
The Enovation Analytics (www.enovation-analytics.com) platform is a cloud based, AI driven, techno-economic analysis tool for electric utilities, consultants, developers, and capital partners. We provide the best available comparison of emerging technologies, data, and use cases to solve the emerging and challenging needs of renewable and distributed generation, battery storage, and electric vehicles (EVs) informing solid business decisions and investment. Our platform is SOC-2 certified and compliant - ready for enterprise IT and regulatory engagements.


Contacts

Terry Bickham
This email address is being protected from spambots. You need JavaScript enabled to view it.
+1 (312) 953-3555

DUBLIN--(BUSINESS WIRE)--The "Shale Gas Market - Global Forecast up to 2027" report has been added to ResearchAndMarkets.com's offering.


The Shale Gas Market is anticipated to grow at the rate of 8.5% CAGR by 2027.

Shale gas is a natural gas that is found trapped in shale formations. Shale gas has become an increasingly prominent source of natural gas in the world. The combination of horizontal drilling and hydraulic fracturing has majorly enabled access to vast capacities of shale gas that were before uneconomical to produce.

The advantages associated with shale gas, including lesser natural gas prices, a cleaner environmental footprint than some other fossil fuels, which include coal, fuel oil or natural gas, intensified energy security & the availability of energy fuels, and local economic development are significant factors which are primarily driving the growth of the global shale gas market.

The rising awareness about the environment elevates the utilization of clean fuels, including natural gas, which is surging demand for shale gas. However, the production of shale gas can be economically not feasible at times and negatively impact the environment, which are the key factors limiting the shale gas market growth.

Scope of the Report

Based on technology, the shale gas market is divided into exploration & drilling and fracturing fluid. The fracturing fluid segment is projected to witness a higher CAGR rate over the forecasted period. The segment's growth is ascribed to the rising popularity of fracturing technology because of its outstanding cost-efficiency and great hydrocarbon recovery technique for extraction.

In addition, the adoption of hydraulic fracturing with horizontal drilling for piercing ultra-hard shale deep underground reserves and the use of watery fluids such as gel, brines, water, and acid as the base fluid in the abstraction of shale gas is further enhancing the growth of the market.

As per the market-based application, the shale gas market is categorized into power generation, industrial, residential, commercial, and transportation. The power generation segment is likely to hold the highest share in the shale gas market. The highest share is credited to the rising use of natural gas in power generation, coupled with the lower price and minimum carbon emission of shale gas.

The rising demand for power among industrial verticals and the rising inclination towards cleaner combustion quality of shale gas when compared to other fossil fuels further augment the market growth over the forecast period.

In terms of geographical analysis, the regions are divided accordingly, such as North America, Europe, Asia Pacific, and the rest of the world. Among them, North America is expected to hold a substantial market share. This is majorly due to the enormous of technically regained shale reserves, along with the active commercial production of shale in the region are the key factors.

Furthermore, the emerging advances in technology such as advances in horizontal drilling, the use of multi-well drilling pads, and multi-stage hydraulic fracturing enable the efficient production of shale gas, which is majorly driving the global market's growth. The hydraulic fracturing disturbs the local stress field and causes slid or shearing in naturally broken shale formations.

Since monitoring this process utilizing microseismic techniques offers a valuable tool helping to detect the result of the drilling and understand the efficacy of the operation. Hence, it improves shale gas production.

This report also includes the key vendor's profiles of the shale gas market

  • Polskie Gornictwo Naftowe I Gazownictwo Sa
  • Marathon Oil Corp
  • Baker Hughes Inc.
  • Beach Energy Ltd
  • Bnk Petroleum Inc
  • Lng Energy Ltd.
  • Chesapeake Energy Corp
  • Southwestern Energy Company
  • Quicksilver Resources Inc.
  • Petrohawk Energy Corp

Key Topics Covered:

1. Executive Summary

2. Industry Outlook

2.1. Industry Overview

2.2. Industry Trends

3. Market Snapshot

3.1. Market Definition

3.2. Market Outlook

3.2.1. Porter Five Forces

3.3. Related Markets

4. Market characteristics

4.1. Market Overview

4.2. Market Segmentation

4.3. Market Dynamics

4.3.1. Drivers

4.3.2. Restraints

4.3.3. Opportunities

4.4. DRO - Impact Analysis

5. Technology: Market Size & Analysis

5.1. Overview

5.2. Exploration & Drilling

5.3. Fracturing Fluid

6. Application: Market Size & Analysis

6.1. Overview

6.2. Power Generation

6.3. Industrial

6.4. Residential

6.5. Commercial

6.6. Transportation

7. Geography: Market Size & Analysis

7.1. Overview

7.2. North America

7.3. Europe

7.4. Asia Pacific

7.5. Rest of the World

8. Competitive Landscape

8.1. Competitor Comparison Analysis

8.2. Market Developments

8.2.1. Mergers and Acquisitions, Legal, Awards, Partnerships

8.2.2. Product Launches and execution

9. Vendor Profiles

9.1. Overview

9.2. Financial Overview

9.3. Product Offerings

9.4. Developments

9.5. Business Strategy

10. Analyst Opinion

11. Annexure

For more information about this report visit https://www.researchandmarkets.com/r/ml1wea


Contacts

ResearchAndMarkets.com
Laura Wood, Senior Press Manager
This email address is being protected from spambots. You need JavaScript enabled to view it.
For E.S.T Office Hours Call 1-917-300-0470
For U.S./CAN Toll Free Call 1-800-526-8630
For GMT Office Hours Call +353-1-416-8900

MIDLAND, Texas--(BUSINESS WIRE)--Please replace the release with the following corrected version due to multiple revisions.


The updated release reads:

CORRECTING and REPLACING ProPetro Reports Financial Results for the Third Quarter of 2021

ProPetro Holding Corp. ("ProPetro" or "the Company") (NYSE: PUMP) today announced financial and operational results for the third quarter of 2021.

Third Quarter 2021 and Recent Highlights

  • Total revenue for the quarter increased 15% to $250 million compared to $217 million for the second quarter of 2021.
  • Net loss for the quarter improved over 40% to $5 million, or $0.05 per diluted share, compared to net loss of $9 million, or $0.08 per diluted share, for the second quarter of 2021.
  • Adjusted EBITDA(1) for the quarter increased 18% to $42 million compared to $36 million for the second quarter of 2021.
  • Effective utilization for the third quarter was 13.8 fleets compared to 13.1 fleets for the second quarter of 2021.
  • Net cash provided by operating activities for the quarter of $48 million as compared to $44 million for the second quarter of 2021.
  • Positive Free Cash Flow(2) of approximately $13 million as compared to positive Free Cash Flow of approximately $16 million for the second quarter of 2021.

(1) Adjusted EBITDA is a Non-GAAP financial measure and is described and reconciled to net income (loss) in the table under “Non-GAAP Financial Measures.”

(2) Free cash flow ("FCF") is a Non-GAAP financial measure and is defined as net cash flow provided from operating activities less net cash used in investing activities. During the quarter ended September 30, 2021, net cash provided by operating activities of approximately $48 million less net cash used in investing activities of approximately $35 million resulted in free cash flow of approximately $13 million. During the quarter ended June 30, 2021, net cash provided by operating activities of $44 million less net cash used in investing activities of $29 million resulted in free cash flow of approximately $16 million.

Sam Sledge, Chief Executive Officer, commented, “Demand for ProPetro's services continued to increase in the third quarter. As activity normalizes, we see operators in the Permian placing more value on efficient service providers that can consistently deliver industry leading performance in the field. Due to tighter fundamentals in the pressure pumping space, modest net pricing increases for services were achieved across ProPetro's operations. I'm proud of the continued commitment to safety and efficient field performance that our team delivered during the quarter. Our results reflect this dedication to excellence that is ProPetro's hallmark."

"We also continued our commitment to converting our legacy fleet, over time, to ESG-friendly assets. Accordingly and notably, we accelerated a portion of our 2022 capital expenditures and announced an order for 50 Tier IV Dynamic Gas Blending ("DGB") dual-fuel pumping unit conversions for approximately $74 million. DGB fleets remain highly utilized in our market and our customers are pleased with their performance. As previously communicated, these converted units, paired with our industry-leading operational performance, will continue to position us well in a frac market that is constrained for reliable, high-performing, and lower emissions fleets."

"Our dedication to profitable operations and ESG-friendly offerings was evident in the third quarter," David Schorlemer, Chief Financial Officer, commented. "After full delivery of the recently ordered dual-fuel conversions, we will have 86 Tier IV DGB units in our portfolio which, in today's market, are achieving higher relative pricing than our conventional diesel units. While not compromising our high quality conventional equipment, we maintain our resolve to support our customers by adding to our inventory of lower emissions equipment. Additionally, we believe we are operating all our fleets at industry-leading pumping productivity rates which is critical to operators focused on completions efficiencies and which ProPetro has become known for in our market."

Third Quarter 2021 Financial Summary

Revenue for the third quarter of 2021 was $250 million compared to revenue of $217 million for the second quarter of 2021. The 15% increase was attributable to our increased effectively utilized fleet count and improved pricing.

Cost of services, excluding depreciation and amortization of approximately $34 million, for the third quarter of 2021 increased to $189 million from $163 million during the second quarter of 2021. Contributing to the increase were higher activity levels, reactivation costs of previously stacked equipment, wage increases and general cost inflation.

General and administrative expense of $21 million for the third quarter of 2021 increased from $18 million in the second quarter of 2021. General and administrative expense, exclusive of a net expense of $2.0 million relating to non-recurring and non-cash items (insurance recovery legal settlement of $1.0 million offset by stock-based compensation of $3.0 million), was $19 million, or 8% of revenue, for the third quarter of 2021 consistent with the second quarter of 2021.

Net loss for the third quarter of 2021 totaled $5 million, or $0.05 per diluted share, compared to net loss of $9 million, or $0.08 per diluted share, for the second quarter of 2021.

Adjusted EBITDA increased to $42 million for the third quarter of 2021 from $36 million for the second quarter of 2021. The sequential improvement in Adjusted EBITDA was primarily attributable to increased activity, improved pricing and profitability offset by reactivation costs of previously stacked equipment, wage increases and general cost inflation.

Liquidity and Capital Spending

As of September 30, 2021, total cash was $85 million and the Company remained debt free. Total liquidity at the end of the third quarter of 2021 was $154 million including cash and $69 million of available capacity under the Company’s revolving credit facility. As of October 29, 2021, total cash was $91 million and the Company had no debt outstanding. Total liquidity as of October 29, 2021, was $159 million including cash and $68 million of available capacity under the Company’s revolving credit facility.

Capital expenditures incurred during the third quarter of 2021 were $53 million, the majority of which was maintenance spending. Capital expenditures paid (as appears in the Investing Activities section of the Statement of Cash Flows) in the third quarter were $35 million. Based on our current and projected activity levels for 2021 along with strategic supply chain investments previously announced, the Company expects full year 2021 incurred capital expenditures to be between $155 million and $165 million. Our full year incurred capital expenditure guidance includes approximately $30 million associated with our recent accelerated purchase of 50 Tier IV DGB conversions. Full year capital expenditures paid may differ due to the timing of payments.

Outlook

Mr. Sledge concluded, “We anticipate pressure pumping fundamentals to continue to improve as we progress into 2022 and ProPetro is well prepared to react to the modest increase in activity that we expect in the months to come. Our focus is to remain capital disciplined and operate as the most efficient frac provider in the Permian Basin."

Conference Call Information

The Company will host a conference call at 8:00 AM Central Time on Wednesday, November 3, 2021, to discuss financial and operating results for the third quarter of 2021. The call will also be webcast on ProPetro’s website at www.propetroservices.com. To access the conference call, U.S. callers may dial toll free 1-844-340-9046 and international callers may dial 1-412-858-5205. Please call ten minutes ahead of the scheduled start time to ensure a proper connection. A replay of the conference call will be available for one week following the call and can be accessed toll free by dialing 1-877-344-7529 for U.S. callers, 1-855-669-9658 for Canadian callers, as well as 1-412-317-0088 for international callers. The access code for the replay is 10160844.

About ProPetro

ProPetro Holding Corp. is a Midland, Texas-based oilfield services company providing pressure pumping and other complementary services to leading upstream oil and gas companies engaged in the exploration and production of North American unconventional oil and natural gas resources. For more information visit www.propetroservices.com.

Forward-Looking Statements

Except for historical information contained herein, the statements and information in this news release are forward-looking statements that are made pursuant to the Safe Harbor Provisions of the Private Securities Litigation Reform Act of 1995. Statements that are predictive in nature, that depend upon or refer to future events or conditions or that include the words “may,” “could,” “plan,” “project,” “budget,” “predict,” “pursue,” “target,” “seek,” “objective,” “believe,” “expect,” “anticipate,” “intend,” “estimate,” and other expressions that are predictions of, or indicate, future events and trends and that do not relate to historical matters identify forward-looking statements. Our forward‑looking statements include, among other matters, statements about our business strategy, industry, future profitability, expected fleet utilization, sustainability efforts, the future performance of newly improved technology (such as our DuraStim® fleets), expected capital expenditures and the impact of such expenditures on our performance and capital programs. A forward‑looking statement may include a statement of the assumptions or bases underlying the forward‑looking statement. We believe that we have chosen these assumptions or bases in good faith and that they are reasonable.

Although forward‑looking statements reflect our good faith beliefs at the time they are made, forward-looking statements are subject to a number of risks and uncertainties that may cause actual events and results to differ materially from the forward-looking statements. Such risks and uncertainties include the volatility of oil prices, the operational disruption and market volatility resulting from the COVID-19 pandemic and other factors described in the Company's Annual Report on Form 10-K and Quarterly Reports on Form 10-Q, particularly the “Risk Factors” sections of such filings, and other filings with the Securities and Exchange Commission (the “SEC”). In addition, the Company may be subject to currently unforeseen risks that may have a materially adverse impact on it, including matters related to shareholder litigation and the SEC investigation. Accordingly, no assurances can be given that the actual events and results will not be materially different than the anticipated results described in the forward-looking statements. Readers are cautioned not to place undue reliance on such forward-looking statements and are urged to carefully review and consider the various disclosures made in the Company’s Annual Report on Form 10-K, Quarterly Reports on Form 10-Q and other filings made with the SEC from time to time that disclose risks and uncertainties that may affect the Company’s business. The forward-looking statements in this news release are made as of the date of this news release. ProPetro does not undertake, and expressly disclaims, any duty to publicly update these statements, whether as a result of new information, new developments or otherwise, except to the extent that disclosure is required by law.

PROPETRO HOLDING CORP.

CONDENSED CONSOLIDATED STATEMENTS OF OPERATIONS

(In thousands, except per share data)

(Unaudited)


Three Months Ended


September 30,
2021


June 30, 2021


September 30,
2020

REVENUE - Service revenue


$

250,099


$

216,887


$

133,710


COSTS AND EXPENSES


Cost of services (exclusive of depreciation and amortization)


188,690


162,837


99,592


General and administrative (inclusive of stock-based compensation)


21,348


17,529


21,817


Depreciation and amortization


33,531


33,243


37,467


Loss on disposal of assets


12,424


15,025


11,286


Total costs and expenses


255,993


228,634


170,162


OPERATING LOSS


(5,894

)


(11,747

)


(36,452

)

OTHER EXPENSE:


Interest expense


(143

)


(159

)


(137

)

Other expense


(309

)


(302

)


(312

)

Total other expense


(452

)


(461

)


(449

)

LOSS BEFORE INCOME TAXES


(6,346

)


(12,208

)


(36,901

)

INCOME TAX BENEFIT


1,279


3,697


7,717


NET LOSS


$

(5,067

)


$

(8,511

)


$

(29,184

)


NET LOSS PER COMMON SHARE:


Basic


$

(0.05

)


$

(0.08

)


$

(0.29

)

Diluted


$

(0.05

)


$

(0.08

)


$

(0.29

)


WEIGHTED AVERAGE COMMON SHARES OUTSTANDING:


Basic


103,257


102,398


100,897


Diluted


103,257


102,398


100,897


PROPETRO HOLDING CORP.

CONDENSED CONSOLIDATED BALANCE SHEETS

(In thousands, except share data)

(Unaudited)


September 30,
2021


December 31,
2020

ASSETS


CURRENT ASSETS:


Cash and cash equivalents


$

84,601


$

68,772

Accounts receivable - net of allowance for credit losses of $217 and $1,497, respectively


149,650


84,244

Inventories


3,477


2,729

Prepaid expenses


5,197


11,199

Other current assets


14


782

Total current assets


242,939


167,726

PROPERTY AND EQUIPMENT - net of accumulated depreciation


853,928


880,477

OPERATING LEASE RIGHT-OF-USE ASSETS


486


709

OTHER NONCURRENT ASSETS:


Other noncurrent assets


1,397


1,827

Total other noncurrent assets


1,397


1,827

TOTAL ASSETS


$

1,098,750


$

1,050,739

LIABILITIES AND SHAREHOLDERS’ EQUITY


CURRENT LIABILITIES:


Accounts payable


$

167,085


$

79,153

Accrued and other current liabilities


24,597


24,676

Operating lease liabilities


360


334

Total current liabilities


192,042


104,163

DEFERRED INCOME TAXES


63,701


75,340

NONCURRENT OPERATING LEASE LIABILITIES


192


465

Total liabilities


255,935


179,968

COMMITMENTS AND CONTINGENCIES (Note 10)


SHAREHOLDERS’ EQUITY:


Preferred stock, $0.001 par value, 30,000,000 shares authorized, none issued, respectively


Common stock, $0.001 par value, 200,000,000 shares authorized, 103,259,971 and 100,912,777 shares issued, respectively


103


101

Additional paid-in capital


841,110


835,115

Retained earnings


1,602


35,555

Total shareholders’ equity


842,815


870,771

TOTAL LIABILITIES AND SHAREHOLDERS’ EQUITY


$

1,098,750


$

1,050,739

PROPETRO HOLDING CORP.

CONDENSED CONSOLIDATED STATEMENTS OF CASH FLOWS

(In thousands)

(Unaudited)


Nine Months Ended September 30,


2021


2020

CASH FLOWS FROM OPERATING ACTIVITIES:


Net loss


$

(33,953

)


$

(62,908

)

Adjustments to reconcile net loss to net cash provided by operating activities:


Depreciation and amortization


100,253


117,844


Impairment expense


16,654


Deferred income tax benefit


(11,639

)


(15,490

)

Amortization of deferred debt issuance costs


405


407


Stock-based compensation


8,405


5,968


Provision for credit losses


282


448


Loss on disposal of assets


40,500


39,875


Changes in operating assets and liabilities:


Accounts receivable


(65,244

)


117,072


Other current assets


325


2,598


Inventories


(747

)


587


Prepaid expenses


6,027


4,741


Accounts payable


64,237


(97,380

)

Accrued and other current liabilities


408


(11,996

)

Accrued interest


(394

)

Net cash provided by operating activities


109,259


118,026


CASH FLOWS FROM INVESTING ACTIVITIES:


Capital expenditures


(87,700

)


(86,509

)

Proceeds from sale of assets


2,151


4,330


Net cash used in investing activities


(85,549

)


(82,179

)

CASH FLOWS FROM FINANCING ACTIVITIES:


Repayments of borrowings


(130,000

)

Payment of finance lease obligation


(30

)

Repayments of insurance financing


(5,473

)


Proceeds from exercise of equity awards


3,365


Tax withholdings paid for net settlement of equity awards


(5,773

)


(598

)

Net cash used in financing activities


(7,881

)


(130,628

)

NET INCREASE (DECREASE) IN CASH AND CASH EQUIVALENTS


15,829


(94,781

)

CASH AND CASH EQUIVALENTS - Beginning of period


68,772


149,036


CASH AND CASH EQUIVALENTS - End of period


$

84,601


$

54,255


Reportable Segment Information


Three Months Ended


September 30, 2021


June 30, 2021

(in thousands)

Pressure
Pumping


All Other


Total


Pressure
Pumping


All Other


Total


Service revenue

$

245,641


$

4,458


$

250,099


$

213,461


$

3,426


$

216,887

Adjusted EBITDA

$

53,975


$

(11,877

)


$

42,098


$

46,826


$

(11,133

)


$

35,693

Depreciation and amortization

$

32,536


$

995


$

33,531


$

32,256


$

987


$

33,243

Capital expenditures

$

52,904


$

300


$

53,204


$

30,744


$

29


$

30,773

Non-GAAP Financial Measures

Adjusted EBITDA is not a financial measure presented in accordance with GAAP. We believe that the presentation of this non-GAAP financial measure provides useful information to investors in assessing our financial condition and results of operations. Net income (loss) is the GAAP measure most directly comparable to Adjusted EBITDA. Non-GAAP financial measures should not be considered as alternatives to the most directly comparable GAAP financial measure. Non-GAAP financial measures have important limitations as analytical tools because they exclude some, but not all, items that affect the most directly comparable GAAP financial measures. You should not consider Adjusted EBITDA in isolation or as a substitute for an analysis of our results as reported under GAAP. Because Adjusted EBITDA may be defined differently by other companies in our industry, our definitions of this non-GAAP financial measure may not be comparable to similarly titled measures of other companies, thereby diminishing their utility.

Reconciliation of Net Loss to Adjusted EBITDA


Three Months Ended


September 30, 2021


June 30, 2021

(in thousands)


Pressure
Pumping


All Other


Total


Pressure
Pumping


All Other


Total

Net income (loss)


$

9,058


$

(14,125

)


$

(5,067

)


$

(809

)


$

(7,702

)


$

(8,511

)

Depreciation and amortization


32,536


995


33,531


32,256


987


33,243


Interest expense


143


143


159


159


Income tax benefit


(1,279

)


(1,279

)


(3,697

)


(3,697

)

Loss on disposal of assets


12,381


43


12,424


15,379


(354

)


15,025


Stock-based compensation


3,009


3,009


2,909


2,909


Other expense


309


309


302


302


Other general and administrative expense, net (1)


(972

)


(972

)


(3,737

)


(3,737

)

Adjusted EBITDA


$

53,975


$

(11,877

)


$

42,098


$

46,826


$

(11,133

)


$

35,693


(1)

Other general and administrative expense, (net) relates to nonrecurring professional fees paid to external consultants in connection with the Company's pending SEC investigation and shareholder litigation, net of insurance recoveries. During the three months ended September 30, 2021, and June 30, 2021, we received approximately $1.4 million and $5.1 million, respectively, from our insurance carriers in connection with the SEC investigation and Shareholder litigation.


Three Months Ended

(in thousands)


September 30, 2021


June 30, 2021


Cash from Operating Activities


$

47,779


$

44,472


Cash used in Investing Activities


(34,629

)


(28,650

)

Free Cash Flow


$

13,150


$

15,822


Contacts

Investor Contacts:
David Schorlemer
Chief Financial Officer
This email address is being protected from spambots. You need JavaScript enabled to view it.
432-227-0864

Josh Jones
Director of Finance
This email address is being protected from spambots. You need JavaScript enabled to view it.
432-276-3389

  • 2030 targets announcement follows Morgan Stanley’s commitment to net-zero financed emissions by 2050, the first among large U.S. banks
  • Progress builds on Firm’s leadership in the Partnership for Carbon Accounting Financials (PCAF) and the Net-Zero Banking Alliance (NZBA)

NEW YORK--(BUSINESS WIRE)--Morgan Stanley (NYSE: MS) today announced new steps towards its commitment to reach net-zero financed emissions by 2050. Building on its commitment to finance $1tn towards the Sustainable Development Goals, including $750MM of financing to drive the climate transition, Morgan Stanley has set 2030 interim targets for three sectors: Auto Manufacturing, Energy and Power.

In September 2020, Morgan Stanley became the first major U.S.-headquartered financial services firm to commit to net-zero financed emissions by 2050. The release of the Firm’s first interim targets represents an important milestone in support of its 2050 commitment.

Audrey Choi, Morgan Stanley’s Chief Sustainability Officer said “The recent report from the Intergovernmental Panel on Climate Change makes clear the urgency of addressing greenhouse gas emissions, and that near-term reductions are necessary if the world is to limit global temperature rise to 1.5°Celsius. Morgan Stanley’s interim net-zero targets set us on that path toward a more sustainable and prosperous future.”

Morgan Stanley’s 2030 Interim Targets

For each sector, Morgan Stanley is taking an approach that examines its financed emissions relative to client financing commitments. This will help the Firm align the relative carbon emissions footprint of its lending portfolios with science-based sector pathways to reach net-zero by 2050.

Each sector target covers Scope 1, Scope 2 and Scope 3 emissions and all greenhouse gases and is inclusive of the corporate lending portfolio. The targets are:

  • Auto Manufacturing: -35%
  • Energy: -29%
  • Power: -58%

Full details on the Firm’s targets can be found here, including a detailed methodology that describes our multi-step process for setting our targets.

Morgan Stanley’s Approach to Net-Zero

Morgan Stanley has taken a proactive approach to leading the development of methodologies necessary to set and track progress against credible net-zero targets. The Firm will leverage this work across the three-part Measure, Manage and Report framework for net-zero:

  • Measure: Utilize the carbon accounting methodology of the Partnership for Carbon Accounting Financials (PCAF) to measure baseline emissions and track progress towards 2030 interim targets
    • Morgan Stanley was the first large U.S. financial firm to join PCAF and, is the only large U.S. financial Firm to sit on PCAF’s Steering Committee.
  • Manage: Set ambitious, credible targets using the Net-Zero Banking Alliance (NZBA) methodology to help manage emissions.
    • Morgan Stanley is a founding member of NZBA and was elected to its Steering Group.
  • Report: Transparently disclose progress to shareholders and other stakeholders utilizing the Taskforce for Climate-related Finance Disclosure’s four-part framework.
    • Morgan Stanley was among the first supporters of the TCFD’s recommendations and published its first report in 2020.

Looking Ahead

Morgan Stanley recognizes that the approach to net-zero will need to be an iterative process as data, methodologies, and climate science evolve and will update it over time to reflect these dynamics. To that end, Morgan Stanley will continue its work to develop additional financed and facilitated emissions accounting methodologies through its leadership position in the Partnership for Carbon Accounting Financials ("PCAF”). Morgan Stanley will report progress towards its 2030 interim targets annually in its Taskforce for Climate-related Financial Disclosures (“TCFD”) reports. The first set of financed emissions data is expected to be released in the 2022 report.

“Morgan Stanley is committed to working with our clients to accelerate sustainable efforts by offering leading products, solutions and insights to facilitate their low carbon transition plans. Today’s announcement builds upon the Firm’s decade plus leadership in sustainable investing”, says Choi.

To learn more about the 2030 targets, please see here.

Morgan Stanley (NYSE: MS) is a leading global financial services firm providing investment banking, securities, wealth management and investment management services. With offices in more than 41 countries, the Firm's employees serve clients worldwide including corporations, governments, institutions and individuals. For more information about Morgan Stanley, please visit www.morganstanley.com.

FORWARD-LOOKING STATEMENTS

Certain statements herein, including expectations related to financed emissions targets and the achievement thereof, may be “forward-looking statements” within the meaning of the safe harbor provisions of the Private Securities Litigation Reform Act of 1995. These statements are based on management’s current expectations and are subject to uncertainty and changes in circumstances. These statements are not guarantees of future results or occurrences. Actual results and financial conditions may differ materially from those included in these statements due to a variety of factors, including, among others, global socio-demographic and economic trends, energy prices, technological innovations, climate-related conditions and weather events, counterparty and client financial health, insurance applicability, legislative and regulatory changes, and other unforeseen events or conditions, and the precautionary statements included in this report and those contained in Morgan Stanley’s periodic filings with the Securities and Exchange Commission under the Securities Exchange Act of 1934. Any forward-looking statements made by or on behalf of Morgan Stanley speak only as to the date they are made, and Morgan Stanley does not undertake to update forward-looking statements to reflect the impact of circumstances or events that arise after the date the forward-looking statements were made. You should, however, consult further disclosures Morgan Stanley may make in future filings of its annual reports on Form 10-K, quarterly reports on Form 10-Q and current reports on Form 8-K and any amendments thereto or in future press releases or other public statements.

USE OF THIRD-PARTY INFORMATION

In addition, the methodology used to establish financed emission targets and track future progress against such targets utilize emissions information and estimates that have been derived from publicly available information released by third-party sources, which Morgan Stanley believes to be reasonable, although Morgan Stanley has only been able to complete limited validation. Additionally, in the absence of counter-party specific emissions data, some financed emissions will be estimated using emissions and activity factors provided by third-party sources. Certain third-party information, such as Scope 3 emissions and emissions factors, may change over time as methodologies evolve and are refined. These and other factors could cause results to differ materially from those expressed in the estimates and beliefs made by third parties and by Morgan Stanley.

© 2021 Morgan Stanley & Co. LLC and Morgan Stanley Smith Barney LLC. Members SIPC. CRC 3864584 11/2021


Contacts

Media: Katherine Stueber, This email address is being protected from spambots. You need JavaScript enabled to view it.

NEW YORK--(BUSINESS WIRE)--New Fortress Energy Inc. (NASDAQ: NFE) (“NFE” or the “Company”) today reported its financial results for the third quarter ending September 30, 2021.


Third Quarter Highlights

  • Record Total Segment Operating Margin(1) in Q3 of approximately $210 million, beating Illustrative Total Segment Operating Margin Goal(2) of $208 million
  • Illustrative Total Segment Operating Margin Goal for the 2nd half of 2021 expected to be $585 million, a 50% increase from the Illustrative Total Segment Operating Margin Goal set in July
  • FY 2022 Illustrative Total Segment Operating Margin Goal is on track for over $1.1 billion with significant earnings growth as Brazil, Ireland and Fast LNG come Online(3)

Growth

  • Continued energy shortages in Brazil have led to emergency power measures, including an auction in the South and Southeast region which took place in October:
    • 1.2 GW of new power projects were awarded in the October auction with an average variable power price of $0.14 / kWh
    • NFE positioned to supply LNG through the Santa Catarina terminal to over 400MW (>900k GPD of LNG forecasted) of new power plants
    • Supply period will be Q2 2022 through end of 2025
  • NFE and Norsk Hydro executed definitive commercial terms for a 15-year LNG supply agreement utilizing NFE’s Barcarena LNG terminal
    • ~1.0m GPD to supply the Alunorte alumina refinery (co-located with the Barcarena terminal) starting Q1 2023

Development update

  • NFE continues to make great progress on our first Fast LNG assets, which we intend to deploy through two distinct business lines:
    • Tolling agreements with high credit quality counterparties to lock in stable cash flows similar to our current FLNG asset, the Hilli
    • Merchant production where we maximize flexibility by supplying through our owned infrastructure or into the spot market at more profitable rates
  • In Nicaragua, we are completing terminal and power plant construction in Q4 2021, and we expect to begin commissioning of our power plant in Q1 2022
  • Our La Paz terminal in Baja California Sur, Mexico is fully Operational(3)
    • CFEnegia power plant fully commissioned on natural gas
    • NFE power plant will begin commissioning in Q4 2021
  • Our development projects in Barcarena and Santa Catarina are advancing on schedule
    • Signed EPC contracts, obtained all material permits and commenced construction

Energy transition

  • Nearing FID(4) on first blue ammonia facility which will include the capture of up to 99% of CO2 emitted
    • Targeting an acquisition of a key site on the U.S. Gulf Coast in the fourth quarter, with permitting, EPC contract and financing completed in Q1 2022
    • First facility targeted to be operational within 20 to 24 months from FID
  • Expect our Clean Fuels business to benefit from proposed Build Back Better legislation

Financing update

  • We closed a ship financing facility at pricing of LIBOR + 300bps with initial proceeds of $425mm; ability to increase this facility by approximately $300mm
  • Our Board of Directors approved a dividend of $0.10 per share, with a record date of December 7, 2021 and a payment date of December 17, 2021

Financial Highlights

Total Segment Operating Margin of $210.5mm, including contribution of approximately $116mm from our Terminals and Infrastructure segment and approximately $95mm from our Ships segment. Total Segment Operating Margin increase driven by incremental revenue from our Ships segment and the Sergipe Power Plant.

For the Three Months Ended,


June 30,

September 30,


(in millions, except Average Volumes)

2021

2021


Revenues

$223.8

$304.7


Net Loss

($1.7)

($17.8)


Terminals and Infrastructure Segment Operating Margin

$54.4


$115.7


Ships Segment Operating Margin(1)

$75.6


$94.8


Total Segment Operating Margin(1)

$130.0


$210.5


Average Volumes (k GPD)

1,496

1,764


  • Record quarterly revenue of over $300mm, increasing approximately $81mm from the second quarter
  • Record Total Segment Operating Margin in Q3 of $210.5 million, resulting from:
    • Terminals and Infrastructure Segment Operating Margin increased from cargo sales, emergency dispatch at the Sergipe Power Plant and the impact of increased natural gas pricing
    • Ships Segment Operating Margin includes a full quarter of contribution from FSRUs and LNG carriers that are leased to customers under long-term or spot arrangements as well as a full quarter of our effective share of the revenue and costs of the Hilli

Please refer to our Q3 2021 Investor Presentation (the “Presentation”) for further information about the following terms:

1) “Total Segment Operating Margin” is the total of our Terminals and Infrastructure Segment Operating Margin and Ships Segment Operating Margin. Terminals and Infrastructure Segment Operating Margin includes our effective share of revenue, expenses and operating margin attributable to our 50% ownership of Centrais Elétricas de Sergipe Participações S.A. (“CELSEPAR”). Ships Segment Operating Margin includes our effective share of revenue, expenses and Operating Margin attributable to our ownership of 50% of the common units of Hilli LLC. Hilli LLC owns Golar Hilli Corporation (“Hilli Corp”), the disponent owner of the Hilli.

2) “Illustrative Total Segment Operating Margin Goal” or “Illustrative Future Goal” means our goal for Total Segment Operating Margin under certain illustrative conditions. Please refer to this explanation for all uses of this term in this Press Release and the Presentation. This goal reflects the volumes of LNG that it is our goal to sell under binding contracts multiplied by the average price per unit at which we expect to price LNG deliveries, including both fuel sales and capacity charges or other fixed fees, less the cost per unit at which we expect to purchase or produce and deliver such LNG or natural gas, including the cost to (i) purchase natural gas, liquefy it, and transport it to one of our terminals or purchase LNG in strip cargos or on the spot market, (ii) transfer the LNG into an appropriate ship and transport it to our terminals or facilities, (iii) deliver the LNG, regasify it to natural gas and deliver it to our customers or our power plants and (iv) maintain and operate our terminals, facilities and power plants. For Vessels chartered to third parties, this illustration reflects the revenue from ships chartered to third parties, capacity and tolling arrangements, and other fixed fees, less the cost to operate and maintain each ship, in each case based on contracted amounts for ship charters, capacity and tolling fees, and industry standard costs for operation and maintenance. There can be no assurance that the costs of purchasing or producing LNG, transporting the LNG and maintaining and operating our terminals and facilities will result in the Illustrative Total Segment Operating Margin Goal reflected. For the purpose of this Press Release and the Presentation, we have assumed an average Total Segment Operating Margin between $2.71 and $7.82 per MMBtu for all downstream terminal economics, because we assume that (i) we purchase delivered gas at a weighted average of $11.03 in Q4-21, $8.34 in 2022, and $6.32 in 2023 via current long term contracts, (ii) our volumes increase over time, and (iii) we will have costs related to shipping, logistics and regasification similar to our current operations because the liquefaction facility and related infrastructure and supply chain to deliver LNG from Pennsylvania or Fast LNG (“FLNG”) does not exist, and those costs will be distributed over the larger volumes. For Hygo + Suape assets we assume an average delivered cost of gas of $8.78 in 2022, and $7.10 in 2023 based on industry averages in the region and the existing LNG contract at Sergipe. Hygo + Sergipe incremental assets include every terminal and power plant other than Sergipe, and we assume all are Operational and earning revenue through fuel sales and capacity charges or other fixed fees. This illustration reflects our effective share of operating margin from Sergipe Power Plant. For Vessels chartered to third parties, this illustration reflects the revenue from ships chartered to third parties, capacity and tolling arrangements, and other fixed fees, less the cost to operate and maintain each ship, in each case based on contracted amounts for ship charters, capacity and tolling fees, and industry standard costs for operation and maintenance. We assume an average Total Segment Operating Margin of $13k to $159k per day per vessel and our effective share of revenue and operating expense related to the existing tolling agreement for the Hilli FLNG going forward. For Fast LNG, this illustration reflects the difference between the delivered cost of open LNG and the delivered cost of open market LNG less Fast LNG production cost. Management is currently in multiple discussions with counterparties to supply feedstock gas at pricing ranging between $1.00 and $3.00 per MMBtu, multiplied by the volumes for one Fast LNG installation of 1.2 MTPA per year. These costs do not include expenses and income that are required by GAAP to be recorded on our financial statements, including the return of or return on capital expenditures for the relevant project, and selling, general and administrative costs. Our current cost of natural gas per MMBtu are higher than the costs we would need to achieve Illustrative Total Segment Operating Margin Goal, and the primary drivers for reducing these costs are the reduced costs of purchasing gas and the increased sales volumes, which result in lower fixed costs being spread over a larger number of MMBtus sold. References to volumes, percentages of such volumes and the Illustrative Total Segment Operating Margin Goal related to such volumes (i) are not based on the Company’s historical operating results, which are limited, and (ii) do not purport to be an actual representation of our future economics. We cannot assure you if or when we will enter into contracts for sales of additional LNG, the price at which we will be able to sell such LNG, or our costs to produce and sell such LNG. Actual results could differ materially from the illustration and there can be no assurance we will achieve our goal.

3) “Operational” or “Online” with respect to a particular project means we expect gas to be made available within thirty (30) days, gas has been made available to the relevant project, or that the relevant project is in full commercial operations. Where gas is going to be made available or has been made available but full commercial operations have not yet begun, full commercial operations will occur later than, and may occur substantially later than, our reported Operational date, and we may not generate any revenue until full commercial operations have begun. We cannot assure you if or when such projects will reach full commercial operations. Actual results could differ materially from the illustrations reflected in this presentation and there can be no assurance we will achieve our goals.

4) “FID” means management has made an internal commitment to commit resources (including capital) to a particular project. Our management has not made a FID decision on certain projects as of the date of this press release, and there can be no assurance that we will be willing or able to make any such decision, based on a particular project’s time, resource, capital and financing requirements.

Additional Information

For additional information that management believes to be useful for investors, please refer to the presentation posted on the Investors section of New Fortress Energy’s website, www.newfortressenergy.com, and the Company’s most recent Annual Report on Form 10-K and Quarterly Report on Form 10-Q, which are available on the Company’s website. Nothing on our website is included or incorporated by reference herein.

Earnings Conference Call

Management will host a conference call on Wednesday, November 3, 2021 at 8:00 A.M. Eastern Time. The conference call may be accessed by dialing (866) 953-0778 (from within the U.S.) or (630) 652-5853 (from outside of the U.S.) fifteen minutes prior to the scheduled start of the call; please reference “NFE Third Quarter 2021 Earnings Call.”

A simultaneous webcast of the conference call will be available to the public on a listen-only basis at www.newfortressenergy.com. Please allow extra time prior to the call to visit the website and download any necessary software required to listen to the internet broadcast.

A replay of the conference call will also be available after 11:00 A.M. on November 3, 2021 through 11:00 A.M. on November 10, 2021 at (855) 859-2056 (from within the U.S.) or (404) 537-3406 (from outside of the U.S.), Passcode: 7250426.

About New Fortress Energy Inc.

New Fortress Energy Inc. (NASDAQ: NFE) is a global energy infrastructure company founded to help accelerate the world’s transition to clean energy. The company funds, builds and operates natural gas infrastructure and logistics to rapidly deliver fully integrated, turnkey energy solutions that enable economic growth, enhance environmental stewardship and transform local industries and communities.

Cautionary Statement Concerning Forward-Looking Statements

Certain statements contained in this press release constitute “forward-looking statements” including our expected volumes of LNG or production of power in particular jurisdictions; ability to achieve our growth goals; ability to finalize definitive agreements for which we have MOUs or framework agreements; our expectations regarding our organic growth opportunities and the full capacity of our existing infrastructure including run rates; our expected needs for LNG supply in the future; expectations regarding certain facilities becoming Operational; our expected ability to supply gas; expectations regarding growth of our facilities; the expectation that we will continue to take advantage of low LNG prices and develop our Fast LNG project for long-term LNG pricing; and ability to maintain our expected development timelines and the Illustrative Total Segment Operating Margin Goals related to such growth; and our ability to fulfill all of the conditions precedent to effectiveness under our commercial agreement with Norsk Hydro. You can identify these forward-looking statements by the use of forward-looking words such as “expects,” “may,” “will,” “approximately,” “predicts,” “intends,” “plans,” “estimates,” “anticipates,” or the negative version of those words or other comparable words. These forward-looking statements represent the Company’s expectations or beliefs concerning future events, and it is possible that the results described in this press release will not be achieved. These forward-looking statements are subject to risks, uncertainties and other factors, many of which are outside of the Company’s control, that could cause actual results to differ materially from the results discussed in the forward-looking statements. Factors that could cause or contribute to such differences include, but are not limited to: the risk that our development, construction or commissioning schedules will take longer than we expect, the risk that the volumes we are able to sell are less than we expect due to decreased customer demand or our inability to supply, the risk that our expectations about the price at which we purchase LNG, the price at which we sell LNG, the cost at which we produce, ship and deliver LNG, and the margin that we receive for the LNG that we sell are not in line with our expectations, the risk that we may not develop our Fast LNG project on the timeline we expect or at all, or that we do not receive the benefits we expect from the Fast LNG project, risks that our operating or other costs will increase and our expected funding of projects may not be possible, the risk that the foregoing or other factors negatively impact our liquidity, the risk that our organic and inorganic growth opportunities do not materialize due to our inability to reach commercial arrangements on terms that are acceptable to us or at all, the risk that organic and inorganic growth opportunities do not offer the Operating Margin that we expect due to higher costs of LNG, higher costs of infrastructure for inorganic growth, competitive pressures on our pricing, or other factors, and the risk that our investment and pilot projects in green hydrogen do not advance NFE’s transition to zero emissions on the timeline we expect or at all. Accordingly, readers should not place undue reliance on forward-looking statements as a prediction of actual results.

Any forward-looking statement speaks only as of the date on which it is made, and, except as required by law, the Company does not undertake any obligation to update or revise any forward-looking statement, whether as a result of new information, future events or otherwise. New factors emerge from time to time, and it is not possible for the Company to predict all such factors. When considering these forward-looking statements, you should keep in mind the risk factors and other cautionary statements included in the Company’s annual and quarterly reports filed with the SEC, which could cause its actual results to differ materially from those contained in any forward-looking statement.

Exhibits – Financial Statements


Consolidated Statements of Operations
For the three months ended June 30, 2021 and September 30, 2021
(Unaudited, in thousands of U.S. dollars, except share and per share amounts)


For the Three Months Ended


June 30,
2021

September 30,
2021

Revenues


Operating revenue


$ 102,836

$ 188,389

Vessel charter revenue


64,561

78,656

Other revenue


56,442

37,611

Total revenues


223,839

304,656


Operating expenses


Cost of sales


101,430

135,432

Vessel operating expenses


15,400

15,301

Operations and maintenance


18,565

20,144

Selling, general and administrative


44,536

46,802

Transaction and integration costs


29,152

1,848

Depreciation and amortization


26,997

31,194

Total operating expenses


236,080

250,721

Operating (loss) income


(12,241)

53,935

Interest expense


31,482

57,595

Other (income), net


(7,457)

(5,400)

Net (loss) income before income from equity
method investments and income taxes


(36,266)

1,740

Income (loss) from equity method investments


38,941

(15,983)

Tax provision


4,409

3,526

Net loss


(1,734)

(17,769)

Net (income) loss attributable to non-controlling interest


(4,310)

7,963

Net loss attributable to stockholders


$ (6,044)

$ (9,806)


Net loss per share – basic and diluted


$ (0.03)

$ (0.05)


Weighted average number of shares outstanding – basic and diluted

202,331,304

207,497,013


Segment Operating Margin
(Unaudited, in thousands of U.S. dollars)


Performance of our two segments, Terminals and Infrastructure and Ships, is evaluated based on Segment Operating Margin. Segment Operating Margin reconciles to Consolidated Segment Operating Margin as reflected below, which is a non-GAAP measure. We define Consolidated Segment Operating Margin as GAAP net loss, adjusted for selling, general and administrative expense, transaction and integration costs, contract termination charges and loss on mitigation sales, depreciation and amortization, interest expense, other (income) expense, loss on extinguishment of debt, net, income from equity method investments and tax expense. Consolidated Segment Operating Margin is mathematically equivalent to Revenue minus Cost of sales minus Operations and maintenance minus Vessel operating expenses, each as reported in our financial statements.

Three Months Ended September 30, 2021
(in thousands of $)

Infrastructure and Terminals (1)

Ships (2)

Total Segment

Consolidation and Other (3)

Consolidated

Segment Operating Margin

$

115,638

$

94,840

$

210,478

$

(76,699

)

$

133,779


Less:
Selling, general and administrative


46,802


Transaction and integration costs


1,848


Depreciation and amortization


31,194


Interest expense


57,595


Other (income), net


(5,400

)

Tax provision


3,526


Loss from equity method investments


15,983


Net loss


(17,769

)

(1) Terminals and Infrastructure includes the Company's effective share of revenues, expenses and operating margin attributable to 50% ownership of CELSEPAR. The losses and earnings attributable to the investment of $27,792 for the three months ended September 30, 2021, respectively are reported in income (loss) from equity method investments on the condensed consolidated statements of operations. Terminals and Infrastructure does not include the unrealized mark-to-market loss on derviative instruments of $2,316 for the three months ended September 30, 2021 reported in Cost of sales.
(2) Ships includes the Company's effective share of revenues, expenses and operating margin attributable to 50% ownership of the Hilli Common Units. The earnings attributable to the investment of $11,809 for the three months ended September 30, 2021, respectively, are reported in income (loss) from equity method investments on the condensed consolidated statements of operations and comprehensive loss.
(3) Consolidation and Other adjusts for the inclusion of the effective share of revenues, expenses and operating margin attributable to 50% ownership of CELSEPAR and Hilli Common Units in our segment measure and exclusion of the unrealized mark-to-market gain or loss on derviative instruments.
Three Months Ended June 30, 2021
(in thousands of $)

Infrastructure and Terminals

Ships

Total Segment

Consolidation and Other (3)

Consolidated

Segment Operating Margin

$

54,453

$

75,587

$

130,040

$

(41,596

)

$

88,444


Less:
Selling, general and administrative


44,536


Transaction and integration costs


29,152


Depreciation and amortization


26,997


Interest expense


31,482


Other (income), net


(7,457

)

Tax provision


4,409


(Income) from equity method investments


(38,941

)

Net loss


(1,734

)

(1) Terminals and Infrastructure includes the Company's effective share of revenues, expenses and operating margin attributable to 50% ownership of CELSEPAR. The earnings attributable to the investment of $28,447 are reported in income (loss) from equity method investments on the condensed consolidated statements of operations.
(2) Ships includes the Company's effective share of revenues, expenses and operating margin attributable to 50% ownership of the Hilli Common Units. The earnings attributable to the investment of $10,494 are reported in income (loss) from equity method investments on the condensed consolidated statements of operations and comprehensive loss.
(3) Consolidation and Other adjust for the inclusion of the effective share of revenues, expenses and operating margin attributable to 50% ownership of CELSEPAR and Hilli Common Units in our segment measure.


Condensed Consolidated Balance Sheets
As of September 30, 2021 and December 31, 2020
(Unaudited, in thousands of U.S. dollars, except share and per share amounts)


September 30,


December 31,


2021


2020


Assets


Current assets


Cash and cash equivalents

$

224,383


$

601,522


Restricted cash


72,338


12,814


Receivables, net of allowances of $130 and $98, respectively


161,008


76,544


Inventory


82,390


22,860


Prepaid expenses and other current assets, net


75,602


48,270


Total current assets


615,721


762,010


Restricted cash


37,879


15,000


Construction in progress


973,880


234,037


Property, plant and equipment, net


2,025,688


614,206


Equity method investments


1,227,991


-


Right-of-use assets


145,941


141,347


Intangible assets, net


166,964


46,102


Finance leases, net


603,662


7,044


Goodwill


740,132


-


Deferred tax assets, net


6,087


2,315


Other non-current assets, net


121,142


86,030


Total assets

$

6,665,087


$

1,908,091


Liabilities


Current liabilities


Current portion of long-term debt

$

249,752


$

-


Accounts payable


210,259


21,331


Accrued liabilities


159,304


90,352


Current lease liabilities


32,009


35,481


Due to affiliates


6,910


8,980


Other current liabilities


109,662


35,006


Total current liabilities


767,896


191,150


Long-term debt


3,597,659


1,239,561


Non-current lease liabilities


93,321


84,323


Deferred tax liabilities, net


284,176


2,330


Other long-term liabilities


37,885


15,641


Total liabilities


4,780,937


1,533,005


Commitments and contingencies


Stockholders’ equity


Class A common stock, $0.01 par value, 750.0 million shares authorized, 206.9 million issued and outstanding as of September 30, 2021; 174.6 million issued and outstanding as of December 31, 2020


2,069


1,746


Additional paid-in capital


1,912,643


594,534


Accumulated deficit


(283,256

)


(229,503

)

Accumulated other comprehensive income


24,625


182


Total stockholders' equity attributable to NFE


1,656,081


366,959


Non-controlling interest


228,069


8,127


Total stockholders' equity


1,884,150


375,086


Total liabilities and stockholders' equity

$

6,665,087


$

1,908,091


Contacts

IR:
Joshua Kane
(516) 268-7455
This email address is being protected from spambots. You need JavaScript enabled to view it.

Media:
Jake Suski
(516) 268-7403
This email address is being protected from spambots. You need JavaScript enabled to view it.


Read full story here
Offshore Source Logo

Offshore Source keeps you updated with relevant information concerning the Offshore Energy Sector.

Any views or opinions represented on this website belong solely to the author and do not represent those of the people, institutions or organizations that Offshore Source or collaborators may or may not have been associated with in a professional or personal capacity, unless explicitly stated.

Corporate Offices

Technology Systems Corporation
8502 SW Kansas Ave
Stuart, FL 34997

info@tscpublishing.com