Business Wire News

To occur upon Holly's Resignation at the Company’s Emergence From Chapter 11

The Company Also Announces Expected Changes to the Board of Directors

DENVER--(BUSINESS WIRE)--Whiting Petroleum Corporation (NYSE: WLL) (“Whiting” or the “Company”) today announced the expected appointment of Lynn Peterson, a 40-year oil and gas industry veteran, as Chief Executive Officer, effective as of the Company’s anticipated emergence from chapter 11, which is projected to occur on September 1, 2020. Mr. Peterson succeeds Bradley J. Holly, who will resign effective at that time to pursue other interests following the Company’s restructuring. Mr. Peterson will also join the Company’s Board of Directors.


“We thank Brad for his leadership and strategic contributions that built the foundation for Whiting to expeditiously complete its financial restructuring and implement pivotal enhancements with a stronger balance sheet and improved cost structure. During this period of unprecedented volatility for the industry, Whiting set the standard for executing on a challenging business plan. In addition, over his tenure Brad built a strong management team and advanced the Company’s efforts in sustainability with a focus on diversity and inclusion,” said James Catlin, Whiting’s lead director. “As a Board, and in partnership with Brad, we are committed to conducting an orderly emergence from chapter 11 and transitioning seamlessly to the new executive leadership team which has a strong track record of maximizing shareholder value through transactions in the basins where Whiting operates.”

A hearing to consider confirmation of the Company’s chapter 11 plan is scheduled for August 14, 2020, and if the bankruptcy court confirms the plan, the Company expects to emerge from chapter 11 on September 1, 2020. Upon its expected emergence from chapter 11, Whiting will also welcome a new independent Board of Directors that is anticipated to consist of Chairman Kevin McCarthy (Vice Chairman of Kayne Anderson Capital Advisors), Janet L. Carrig (former Senior Vice President & General Counsel at ConocoPhillips), Susan Cunningham (former Executive Vice President at Noble Energy, Inc.), Paul Korus (former Senior Vice President and Chief Financial Officer at Cimarex Energy Co.), Daniel Rice (Founder and Partner at Rice Investment Group, former CEO at Rice Energy) and Anne Taylor (former Vice Chairman & Managing Partner at Deloitte).

“We believe that Lynn brings strong leadership, extensive industry knowledge and unique perspective to Whiting’s business in the Williston and DJ basins, leveraging his deep experience that includes operating the same cornerstone asset during his tenure at Kodiak prior to its acquisition by Whiting,” said new incoming Chairman Kevin McCarthy. “Lynn’s strategic and operating experience will allow us to enhance and capitalize on the Company’s attractive portfolio as we look to create value for our shareholders.”

Mr. Peterson most recently served as Chief Executive Officer and Chairman of SRC Energy Inc. before its combination with PDC Energy, Inc. in January 2020. Prior to SRC Energy, Mr. Peterson was co-founder, Chief Executive Officer and Chairman of Kodiak Oil & Gas Corp. before its integration with Whiting in December 2014. Mr. Peterson began his career in accounting and auditor roles at Ernst & Young and holds a Bachelor of Science in Accounting from the University of Northern Colorado.

“I am honored to join and lead the Whiting team of talented employees and eager to work alongside our new Board of Directors, which is one of the finest assembled in the E&P sector, to build upon the momentum achieved through the restructuring for a bright Whiting future,” Mr. Peterson added. “With a keen focus on excellence, discipline in all facets of our operations, continuing emphasis on environmental, health and safety, and good citizenship within the communities in which we live and operate, I am confident that Whiting will create value even in this challenging environment.”

“As we emerge from chapter 11, the company has significantly reduced its leverage and strengthened its balance sheet. Moving forward, we expect to focus on the development of our top-tier Bakken acreage, further reducing our leverage, and driving down operating and G&A costs. This should position the Company well for the anticipated industry consolidation that we expect to see in the coming years, particularly in the opportunity-rich landscape of the Williston Basin.”

About Whiting Petroleum Corporation

Whiting Petroleum Corporation, a Delaware corporation, is an independent oil and gas company that explores for, develops, acquires and produces crude oil, natural gas and natural gas liquids primarily in the Rocky Mountain region of the United States. The Company’s largest projects are in the Bakken and Three Forks plays in North Dakota and Niobrara play in northeast Colorado. The Company trades publicly under the symbol WLL on the New York Stock Exchange. For further information, please visit http://www.whiting.com.

Forward-Looking Statements

This news release contains statements that we believe to be “forward-looking statements” within the meaning of Section 27A of the Securities Act of 1933 and Section 21E of the Securities Exchange Act of 1934. All statements other than historical facts, including, without limitation, statements regarding our future financial position, business strategy, projected revenues, earnings, costs, capital expenditures and debt levels, and plans and objectives of management for future operations, are forward-looking statements. When used in this news release, words such as we “expect,” “intend,” “plan,” “estimate,” “anticipate,” “believe” or “should” or the negative thereof or variations thereon or similar terminology are generally intended to identify forward-looking statements. Such forward-looking statements are subject to risks and uncertainties that could cause actual results to differ materially from those expressed in, or implied by, such statements.

These risks and uncertainties include, but are not limited to: our ability to obtain United States Bankruptcy Court for the Southern District of Texas (the “Bankruptcy Court”) approval with respect to motions or other requests made to the Bankruptcy Court; our ability to confirm and consummate our plan of reorganization; the effects of our voluntary cases under Chapter 11 of the United States Bankruptcy Code (the “Chapter 11 Cases”) on our liquidity or results of operations or business prospects; the effects of the Chapter 11 Cases on our business and the interests of various constituents; the length of time that we will operate under chapter 11 protection; risks associated with third-party motions in the Chapter 11 Cases; declines in, or extended periods of low oil, NGL or natural gas prices; our level of success in exploration, development and production activities; risks related to our level of indebtedness, our ability to comply with debt covenants, periodic redeterminations of the borrowing base under our credit agreement and our ability to generate sufficient cash flows from operations to service our indebtedness; our ability to generate sufficient cash flows from operations to meet the internally funded portion of our capital expenditures budget; our ability to obtain external capital to finance exploration and development operations; our inability to access oil and gas markets due to market conditions or operational impediments, including any court rulings which may result in the inability to transport oil on the Dakota Access Pipeline; the impact of negative shifts in investor sentiment towards the oil and gas industry; impacts resulting from the allocation of resources among our strategic opportunities; the geographic concentration of our operations; impacts to financial statements as a result of impairment write-downs and other cash and noncash charges; federal and state initiatives relating to the regulation of hydraulic fracturing and air emissions; revisions to reserve estimates as a result of changes in commodity prices, regulation and other factors; inaccuracies of our reserve estimates or our assumptions underlying them; the timing of our exploration and development expenditures; risks relating to decreases in our credit rating; market availability of, and risks associated with, transport of oil and gas; our ability to successfully complete asset dispositions and the risks related thereto; our ability to drill producing wells on undeveloped acreage prior to its lease expiration; shortages of or delays in obtaining qualified personnel or equipment, including drilling rigs and completion services; weakened differentials impacting the price we receive for oil and natural gas; risks relating to any unforeseen liabilities of ours; the impacts of hedging on our results of operations; adverse weather conditions that may negatively impact development or production activities; uninsured or underinsured losses resulting from our oil and gas operations; lack of control over non-operated properties; failure of our properties to yield oil or gas in commercially viable quantities; the impact and costs of compliance with laws and regulations governing our oil and gas operations; the potential impact of changes in laws that could have a negative effect on the oil and gas industry; impacts of local regulations, climate change issues, negative public perception of our industry and corporate governance standards; our ability to replace our oil and natural gas reserves; negative impacts from litigation and legal proceedings; unforeseen underperformance of or liabilities associated with acquired properties or other strategic partnerships or investments; competition in the oil and gas industry; any loss of our senior management or technical personnel; cybersecurity attacks or failures of our telecommunication and other information technology infrastructure; and other risks described under the caption “Risk Factors” in Item 1A of our Quarterly Report on Form 10-Q for the quarter ended June 30, 2020 and our Annual Report on Form 10-K for the year ended December 31, 2019. We assume no obligation, and disclaim any duty, to update the forward-looking statements in this news release.


Contacts

Eric K. Hagen
Title: Vice President, Corporate Affairs
Phone: 303.837.1661
Email: This email address is being protected from spambots. You need JavaScript enabled to view it.

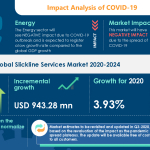
LONDON--(BUSINESS WIRE)--#GlobalSlicklineServicesMarket--Technavio has been monitoring the slickline services market and it is poised to grow by USD 943.28 million during 2020-2024, progressing at a CAGR of over 5% during the forecast period. The report offers an up-to-date analysis regarding the current market scenario, latest trends and drivers, and the overall market environment.


Technavio suggests three forecast scenarios (optimistic, probable, and pessimistic) considering the impact of COVID-19. Please Request Free Sample Report on COVID-19 Impact

Frequently Asked Questions -

  • What is the key factor driving the market?
  • Increase production from mature oil & gas fields is one of the key factors driving the market growth.
  • Who are the top players in the market?
  • AOS Orwell Ltd., Archer Ltd., Baker Hughes Co., Expro Holdings UK 2 Ltd., Halliburton Co., Pioneer Energy Services Corp., Schlumberger Ltd., Superior Energy Services Inc., Weatherford International Plc, and Wellservices BV. are some of the major market participants.
  • Which region is expected to hold the highest market share?
  • North America
  • What is the year-over-year growth rate of the global market?
  • The year-over-year growth rate for 2020 is estimated at 3.93%.

The market is fragmented, and the degree of fragmentation will accelerate during the forecast period. AOS Orwell Ltd., Archer Ltd., Baker Hughes Co., Expro Holdings UK 2 Ltd., Halliburton Co., Pioneer Energy Services Corp., Schlumberger Ltd., Superior Energy Services Inc., Weatherford International Plc, and Wellservices BV are some of the major market participants. The increase production from mature oil & gas fields will offer immense growth opportunities. To make most of the opportunities, market vendors should focus more on the growth prospects in the fast-growing segments, while maintaining their positions in the slow-growing segments.

Slickline Services Market 2020-2024: Segmentation

Slickline Services Market is segmented as below:

  • Application
    • Onshore
    • Offshore
  • Geographic Landscape
    • APAC
    • Europe
    • MEA
    • North America
    • South America

To learn more about the global trends impacting the future of market research, download a free sample: https://www.technavio.com/talk-to-us?report=IRTNTR40332

Slickline Services Market 2020-2024: Scope

Technavio presents a detailed picture of the market by the way of study, synthesis, and summation of data from multiple sources. Our slickline services market report covers the following areas:

  • Slickline Services Market size
  • Slickline Services Market trends
  • Slickline Services Market analysis

This study identifies the introduction of digital slickline services as one of the prime reasons driving the slickline services market growth during the next few years.

Slickline Services Market 2020-2024: Vendor Analysis

We provide a detailed analysis of vendors operating in the slickline services market, including some of the vendors such as AOS Orwell Ltd., Archer Ltd., Baker Hughes Co., Expro Holdings UK 2 Ltd., Halliburton Co., Pioneer Energy Services Corp., Schlumberger Ltd., Superior Energy Services Inc., Weatherford International Plc, and Wellservices BV. Backed with competitive intelligence and benchmarking, our research reports on the slickline services market are designed to provide entry support, customer profile and M&As as well as go-to-market strategy support.

Register for a free trial today and gain instant access to 17,000+ market research reports. Technavio's SUBSCRIPTION platform

Slickline Services Market 2020-2024: Key Highlights

  • CAGR of the market during the forecast period 2020-2024
  • Detailed information on factors that will assist slickline services market growth during the next five years
  • Estimation of the slickline services market size and its contribution to the parent market
  • Predictions on upcoming trends and changes in consumer behavior
  • The growth of the slickline services market
  • Analysis of the market’s competitive landscape and detailed information on vendors
  • Comprehensive details of factors that will challenge the growth of slickline services market vendors

Table of Contents:

PART 01: EXECUTIVE SUMMARY

PART 02: SCOPE OF THE REPORT

  • 2.1 Preface
  • 2.2 Currency conversion rates for US$

PART 03: MARKET LANDSCAPE

  • Market ecosystem
  • Market characteristics
  • Value chain analysis
  • Market segmentation analysis

PART 04: MARKET SIZING

  • Market definition
  • Market sizing 2019
  • Market outlook
  • Market size and forecast 2019-2024

PART 05: FIVE FORCES ANALYSIS

  • Bargaining power of buyers
  • Bargaining power of suppliers
  • Threat of new entrants
  • Threat of substitutes
  • Threat of rivalry
  • Market condition

PART 06: MARKET SEGMENTATION BY APPLICATION

  • Market segmentation by application
  • Comparison by application
  • Onshore - Market size and forecast 2019-2024
  • Offshore - Market size and forecast 2019-2024
  • Market opportunity by application

PART 07: CUSTOMER LANDSCAPE

PART 08: GEOGRAPHIC LANDSCAPE

  • Geographic segmentation
  • Geographic comparison
  • North America - Market size and forecast 2019-2024
  • APAC - Market size and forecast 2019-2024
  • Europe - Market size and forecast 2019-2024
  • MEA - Market size and forecast 2019-2024
  • South America - Market size and forecast 2019-2024
  • Key leading countries
  • Market opportunity

PART 09: DECISION FRAMEWORK

PART 10: DRIVERS AND CHALLENGES

  • Market drivers
  • Market challenges

PART 11: MARKET TRENDS

  • Rise in deepwater and ultra-deepwater E&P activities
  • Declining prices of raw materials
  • Introduction of digital slickline services

PART 12: VENDOR LANDSCAPE

  • Overview
  • Landscape disruption
  • Competitive scenario

PART 13: VENDOR ANALYSIS

  • Vendors covered
  • Vendor classification
  • Market positioning of vendors
  • AOS Orwell Ltd.
  • Archer Ltd.
  • Baker Hughes Co.
  • Expro Holdings UK 2 Ltd.
  • Halliburton Co.
  • Pioneer Energy Services Corp.
  • Schlumberger Ltd.
  • Superior Energy Services Inc.
  • Weatherford International Plc
  • Wellservices BV

PART 14: APPENDIX

  • Research methodology
  • List of abbreviations
  • Definition of market positioning of vendors

PART 15: EXPLORE TECHNAVIO

About Us

Technavio is a leading global technology research and advisory company. Their research and analysis focuses on emerging market trends and provides actionable insights to help businesses identify market opportunities and develop effective strategies to optimize their market positions. With over 500 specialized analysts, Technavio’s report library consists of more than 17,000 reports and counting, covering 800 technologies, spanning across 50 countries. Their client base consists of enterprises of all sizes, including more than 100 Fortune 500 companies. This growing client base relies on Technavio’s comprehensive coverage, extensive research, and actionable market insights to identify opportunities in existing and potential markets and assess their competitive positions within changing market scenarios.


Contacts

Technavio Research
Jesse Maida
Media & Marketing Executive
US: +1 844 364 1100
UK: +44 203 893 3200
Email: This email address is being protected from spambots. You need JavaScript enabled to view it.
Website: www.technavio.com/

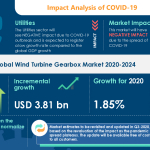
LONDON--(BUSINESS WIRE)--#GlobalWindTurbineGearboxMarket--Technavio has been monitoring the wind turbine gearbox market and it is poised to grow by USD 3.81 billion during 2020-2024, progressing at a CAGR of almost 6% during the forecast period. The report offers an up-to-date analysis regarding the current market scenario, latest trends and drivers, and the overall market environment.


Technavio suggests three forecast scenarios (optimistic, probable, and pessimistic) considering the impact of COVID-19. Please Request Free Sample Report on COVID-19 Impact

Frequently Asked Questions-

  • At what rate is the market projected to grow during the forecast period 2020-2024?
  • Growing at a CAGR of almost 6%, the market growth will accelerate in the forecast period.
  • What is the key factor driving the market?
  • Increase in offshore wind energy installations is one of the key factors driving the market growth.
  • Who are the top players in the market?
  • Dana Inc., Flender GmBH (Winergy), General Electric Co., ISHIBASHI Manufacturing Co. Ltd., Moventas Gears Oy, Nanjing High Accurate Drive, Equipment Manufacturing Group Co. Ltd., Robert Bosch GmbH, Siemens AG, Voith GmbH & Co. KGaA, and ZF Friedrichshafen AG are some of the major market participants.
  • Which region is expected to hold the highest market share?
  • APAC
  • What is the year-over-year growth rate of the global market?
  • The year-over-year growth rate for 2020 is estimated at 1.85%.

The market is concentrated, and the degree of concentration will accelerate during the forecast period. Dana Inc., Flender GmBH (Winergy), General Electric Co., ISHIBASHI Manufacturing Co. Ltd., Moventas Gears Oy, Nanjing High Accurate Drive Equipment Manufacturing Group Co. Ltd., Robert Bosch GmbH, Siemens AG, Voith GmbH & Co. KGaA, and ZF Friedrichshafen AG are some of the major market participants. The increase in offshore wind energy installations will offer immense growth opportunities. To make most of the opportunities, market vendors should focus more on the growth prospects in the fast-growing segments, while maintaining their positions in the slow-growing segments.

Wind Turbine Gearbox Market 2020-2024: Segmentation

Wind Turbine Gearbox Market is segmented as below:

  • Type
    • New
    • Replacement
  • Geography
    • APAC
    • Europe
    • North America
    • South America
    • MEA

To learn more about the global trends impacting the future of market research, download a free sample: https://www.technavio.com/talk-to-us?report=IRTNTR41387

Wind Turbine Gearbox Market 2020-2024: Scope

Technavio presents a detailed picture of the market by the way of study, synthesis, and summation of data from multiple sources. Our wind turbine gearbox market report covers the following areas:

  • Wind Turbine Gearbox Market size
  • Wind Turbine Gearbox Market trends
  • Wind Turbine Gearbox Market analysis

This study identifies the rise in renewable energy consumption as one of the prime reasons driving the wind turbine gearbox market growth during the next few years.

Wind Turbine Gearbox Market 2020-2024: Vendor Analysis

We provide a detailed analysis of vendors operating in the wind turbine gearbox market, including some of the vendors such as Dana Inc., Flender GmBH (Winergy), General Electric Co., ISHIBASHI Manufacturing Co. Ltd., Moventas Gears Oy, Nanjing High Accurate Drive Equipment Manufacturing Group Co. Ltd., Robert Bosch GmbH, Siemens AG, Voith GmbH & Co. KGaA, and ZF Friedrichshafen AG. Backed with competitive intelligence and benchmarking, our research reports on the wind turbine gearbox market are designed to provide entry support, customer profile and M&As as well as go-to-market strategy support.

Register for a free trial today and gain instant access to 17,000+ market research reports. Technavio's SUBSCRIPTION platform

Wind Turbine Gearbox Market 2020-2024: Key Highlights

  • CAGR of the market during the forecast period 2020-2024
  • Detailed information on factors that will assist wind turbine gearbox market growth during the next five years
  • Estimation of the wind turbine gearbox market size and its contribution to the parent market
  • Predictions on upcoming trends and changes in consumer behavior
  • The growth of the wind turbine gearbox market
  • Analysis of the market’s competitive landscape and detailed information on vendors
  • Comprehensive details of factors that will challenge the growth of wind turbine gearbox market vendors

Table of Contents:

Executive Summary

  • Market Overview

Market Landscape

  • Market ecosystem
  • Value chain analysis

Market Sizing

  • Market definition
  • Market segment analysis
  • Market size 2019
  • Market outlook: Forecast for 2019 - 2024

Five Forces Analysis

  • Bargaining power of buyers
  • Bargaining power of suppliers
  • Threat of new entrants
  • Threat of substitutes
  • Threat of rivalry
  • Market condition

Market Segmentation by Type

  • Market segments
  • Comparison by Type
  • New - Market size and forecast 2019-2024
  • Replacement - Market size and forecast 2019-2024
  • Market opportunity by Type

Customer landscape

  • Overview

Geographic Landscape

  • Geographic segmentation
  • Geographic comparison
  • APAC - Market size and forecast 2019-2024
  • Europe - Market size and forecast 2019-2024
  • North America - Market size and forecast 2019-2024
  • South America - Market size and forecast 2019-2024
  • MEA - Market size and forecast 2019-2024
  • Key leading countries
  • Market opportunity by geography

Drivers, Challenges, and Trends

  • Market drivers
  • Volume driver - Demand led growth
  • Volume driver - Supply led growth
  • Volume driver - External factors
  • Volume driver - Demand shift in adjacent markets
  • Price driver - Inflation
  • Price driver - Shift from lower to higher priced units
  • Market challenges
  • Market trends

Vendor Landscape

  • Overview
  • Landscape disruption

Vendor Analysis

  • Vendors covered
  • Market positioning of vendors
  • Dana Inc.
  • Flender GmBH (Winergy)
  • General Electric Co.
  • ISHIBASHI Manufacturing Co. Ltd.
  • Moventas Gears Oy
  • Nanjing High Accurate Drive Equipment Manufacturing Group Co. Ltd.
  • Robert Bosch GmbH
  • Siemens AG
  • Voith GmbH & Co. KGaA
  • ZF Friedrichshafen AG

Appendix

  • Scope of the report
  • Currency conversion rates for US$
  • Research methodology
  • List of abbreviations

About Us

Technavio is a leading global technology research and advisory company. Their research and analysis focuses on emerging market trends and provides actionable insights to help businesses identify market opportunities and develop effective strategies to optimize their market positions. With over 500 specialized analysts, Technavio’s report library consists of more than 17,000 reports and counting, covering 800 technologies, spanning across 50 countries. Their client base consists of enterprises of all sizes, including more than 100 Fortune 500 companies. This growing client base relies on Technavio’s comprehensive coverage, extensive research, and actionable market insights to identify opportunities in existing and potential markets and assess their competitive positions within changing market scenarios.


Contacts

Technavio Research
Jesse Maida
Media & Marketing Executive
US: +1 844 364 1100
UK: +44 203 893 3200
Email: This email address is being protected from spambots. You need JavaScript enabled to view it.
Website: www.technavio.com/

HOUSTON--(BUSINESS WIRE)--Sunnova Energy International Inc. (“Sunnova”) (NYSE: NOVA) today announced that it has launched an underwritten public offering (the “Offering”) of 8,000,000 shares of Sunnova’s common stock by certain of our stockholders, including affiliates of Energy Capital Partners (collectively, the “Selling Stockholders”). Certain of the Selling Stockholders intend to grant the underwriters a 30-day option to purchase an additional 1,200,000 shares of common stock. Sunnova is not offering any shares of its common stock in the Offering and will not receive any proceeds from the sale of shares by the Selling Stockholders in the Offering.

BofA Securities, J.P. Morgan, Credit Suisse and Goldman Sachs & Co. LLC are acting as joint book-running managers. Baird and Roth Capital Partners are acting as co-managers.

Sunnova has filed a shelf registration statement on Form S-3 relating to the Offering (including a prospectus) with the Securities and Exchange Commission (the “SEC”) that has become effective. A preliminary prospectus supplement relating to the Offering will also be filed with the SEC. Before you invest, you should read the prospectus, the preliminary prospectus supplement and other documents that Sunnova may file with the SEC for more complete information about Sunnova and this Offering. A copy of the preliminary prospectus supplement relating to the Offering, when available, may be obtained from BofA Securities, NC1-004-03-43, 200 North College Street, 3rd Floor, Charlotte, NC 28255-0001, Attention: Prospectus Department or by email at This email address is being protected from spambots. You need JavaScript enabled to view it.; J.P. Morgan Securities LLC, Attention: Broadridge Financial Solutions, 1155 Long Island Avenue, Edgewood, NY 11717, by telephone 1-866-803-9204 or by email at This email address is being protected from spambots. You need JavaScript enabled to view it.; Credit Suisse Securities (USA) LLC, Attn: Prospectus Department, 6933 Louis Stephens Drive, Morrisville, North Carolina 27560, United States, Telephone: 1-800-221-1037, Email: This email address is being protected from spambots. You need JavaScript enabled to view it.; or Goldman Sachs & Co. LLC, Prospectus Department, 200 West Street, New York, NY 10282, Telephone: 1-866-471-2526, Facsimile: 212-902-9316, Email: This email address is being protected from spambots. You need JavaScript enabled to view it..

This press release shall not constitute an offer to sell or the solicitation of an offer to buy these securities, nor shall there be any sale of these securities in any state or jurisdiction in which such offer, solicitation or sale would be unlawful prior to registration or qualification under the securities laws of any such state or jurisdiction.

ABOUT SUNNOVA

Sunnova Energy International Inc. (NYSE: NOVA) is a leading residential solar and energy storage service provider, with customers across the U.S. and its territories. Sunnova's goal is to be the source of clean, affordable and reliable energy, with a simple mission: to power energy independence so that homeowners have the freedom to live life uninterrupted™.

FORWARD LOOKING STATEMENTS

This press release contains forward-looking statements within the meaning of Section 27A of the Securities Act of 1933, as amended, and Section 21E of the Securities Exchange Act of 1934, as amended. Forward-looking statements generally relate to future events or Sunnova's future financial or operating performance. In some cases, you can identify forward-looking statements because they contain words such as "may," "will," "should," "expect," "plan," "anticipate," "going to," "could," "intend," "target," "project," "contemplates," "believe," "estimate," "predict," "potential" or "continue" or the negative of these words or other similar terms or expressions that concern Sunnova's expectations, strategy, priorities, plans or intentions. Forward-looking statements in this release include, but are not limited to, statements regarding the conduct of the Offering and the size and terms of the Offering. Sunnova's expectations and beliefs regarding these matters may not materialize, and actual results in future periods are subject to risks and uncertainties that could cause actual results to differ materially from those projected, including risks regarding our ability to forecast our business due to our limited operating history, the effects of the coronavirus pandemic on our business and operations, results of operations and financial position, our competition, fluctuations in the solar and home-building markets, availability of capital, our ability to attract and retain dealers and customers and our dealer and strategic partner relationships. The forward-looking statements contained in this release are also subject to other risks and uncertainties, including those more fully described in Sunnova's filings with the SEC, including our Annual Report on Form 10-K for the year ended December 31, 2019, our Quarterly Reports on Form 10-Q for the quarters ended March 31 and June 30, 2020 and in the registration statement on Form S-3 filed with the SEC. The forward-looking statements in this release are based on information available to Sunnova as of the date hereof, and Sunnova disclaims any obligation to update any forward-looking statements, except as required by law.


Contacts

INVESTOR AND ANALYST CONTACT
Rodney McMahan
Sunnova Energy International Inc.
This email address is being protected from spambots. You need JavaScript enabled to view it.
(281) 971-3323

PRESS AND MEDIA CONTACT
Kelsey Hultberg
Sunnova Energy International Inc.
This email address is being protected from spambots. You need JavaScript enabled to view it.

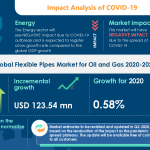
LONDON--(BUSINESS WIRE)--#FlexiblePipesMarketforOilandGas--Technavio has been monitoring the flexible pipes market for oil and gas and it is poised to grow by USD 123.54 million during 2020-2024, progressing at a CAGR of over 2% during the forecast period. The report offers an up-to-date analysis regarding the current market scenario, latest trends and drivers, and the overall market environment.


Technavio suggests three forecast scenarios (optimistic, probable, and pessimistic) considering the impact of COVID-19. Please Request Free Sample Report on COVID-19 Impact

  • At what rate is the market projected to grow during the forecast period 2020-2024?
  • Growing at a CAGR of over 2%, the market growth will accelerate in the forecast period.
  • What is the key factor driving the market?
  • Rising investment in upstream oil and gas activity is one of the key factors driving the market growth.
  • Who are the top players in the market?
  • Airborne Oil & Gas BV, Continental AG, FlexSteel Pipeline Technologies Inc., General Electric Co., MAGMA GLOBAL Ltd., National Oilwell Varco Inc., Prysmian Spa, Shawcor Ltd., TechnipFMC Plc, and Wienerberger AG are some of the major market participants.
  • Which region is expected to hold the highest market share?
  • MEA
  • What is the year-over-year growth rate of the global market?
  • The year-over-year growth rate for 2020 is estimated at 0.58%.

The market is fragmented, and the degree of fragmentation will accelerate during the forecast period. Airborne Oil & Gas BV, Continental AG, FlexSteel Pipeline Technologies Inc., General Electric Co., MAGMA GLOBAL Ltd., National Oilwell Varco Inc., Prysmian Spa, Shawcor Ltd., TechnipFMC Plc, and Wienerberger AG are some of the major market participants. The rising investment in upstream oil and gas activity will offer immense growth opportunities. To make most of the opportunities, market vendors should focus more on the growth prospects in the fast-growing segments, while maintaining their positions in the slow-growing segments.

Flexible Pipes Market for Oil and Gas 2020-2024: Segmentation

Flexible Pipes Market for Oil and Gas is segmented as below:

  • Type
    • HDPE
    • PA
    • PVDF
    • Others
  • Geography
    • North America
    • MEA
    • South America
    • APAC
    • Europe
  • Application
    • Offshore
    • Onshore

To learn more about the global trends impacting the future of market research, download a free sample: https://www.technavio.com/talk-to-us?report=IRTNTR43877

Flexible Pipes Market for Oil and Gas 2020-2024: Scope

Technavio presents a detailed picture of the market by the way of study, synthesis, and summation of data from multiple sources. Our flexible pipes market for oil and gas report covers the following areas:

  • Flexible Pipes Market for Oil and Gas size
  • Flexible Pipes Market for Oil and Gas trends
  • Flexible Pipes Market for Oil and Gas industry analysis

This study identifies the growing acceptance of engineering-grade flexible materials as one of the prime reasons driving the growth of flexible pipes market for oil and gas during the next few years.

Flexible Pipes Market for Oil and Gas 2020-2024: Vendor Analysis

We provide a detailed analysis of vendors operating in the flexible pipes market for oil and gas, including some of the vendors such as Airborne Oil & Gas BV, Continental AG, FlexSteel Pipeline Technologies Inc., General Electric Co., MAGMA GLOBAL Ltd., National Oilwell Varco Inc., Prysmian Spa, Shawcor Ltd., TechnipFMC Plc, and Wienerberger AG. Backed with competitive intelligence and benchmarking, our research reports on the flexible pipes market for oil and gas are designed to provide entry support, customer profile and M&As as well as go-to-market strategy support.

Register for a free trial today and gain instant access to 17,000+ market research reports. Technavio's SUBSCRIPTION platform

Flexible Pipes Market for Oil and Gas 2020-2024: Key Highlights

  • CAGR of the market during the forecast period 2020-2024
  • Detailed information on factors that will assist the growth of the flexible pipes market for oil and gas during the next five years
  • Estimation of the size of the flexible pipes market for oil and gas and its contribution to the parent market
  • Predictions on upcoming trends and changes in consumer behavior
  • The growth of the flexible pipes market for oil and gas
  • Analysis of the market’s competitive landscape and detailed information on vendors
  • Comprehensive details of factors that will challenge the growth of vendors in flexible pipes market for oil and gas

Table of Contents:

Executive Summary

Market Landscape

  • Market ecosystem
  • Value chain analysis

Market Sizing

  • Market definition
  • Market segment analysis
  • Market size 2019
  • Market outlook: Forecast for 2019 - 2024

Five Forces Analysis

  • Five force summary
  • Bargaining power of buyers
  • Bargaining power of suppliers
  • Threat of new entrants
  • Threat of substitutes
  • Threat of rivalry
  • Market condition

Market Segmentation by Application

  • Market segments
  • Comparison by Application
  • Offshore - Market size and forecast 2019-2024
  • Onshore - Market size and forecast 2019-2024
  • Market opportunity by Application

Market Segmentation by Type

  • Market segments
  • Comparison by Type
  • HDPE - Market size and forecast 2019-2024
  • PA - Market size and forecast 2019-2024
  • PVDF - Market size and forecast 2019-2024
  • Others - Market size and forecast 2019-2024
  • Market opportunity by Type

Customer Landscape

Geographic Landscape

  • Geographic segmentation
  • Geographic comparison
  • North America - Market size and forecast 2019-2024
  • MEA - Market size and forecast 2019-2024
  • South America - Market size and forecast 2019-2024
  • APAC - Market size and forecast 2019-2024
  • Europe - Market size and forecast 2019-2024
  • Key leading countries
  • Market opportunity by geography

Volume Drivers – Demand led growth

Market Challenges

Market Trends

Vendor Landscape

  • Overview
  • Vendor landscape
  • Landscape disruption

Vendor Analysis

  • Vendors covered
  • Market positioning of vendors
  • Airborne Oil & Gas BV
  • Continental AG
  • FlexSteel Pipeline Technologies Inc.
  • General Electric Co.
  • MAGMA GLOBAL Ltd.
  • National Oilwell Varco Inc.
  • Prysmian Spa
  • Shawcor Ltd.
  • TechnipFMC Plc
  • Wienerberger AG

Appendix

  • Scope of the report
  • Currency conversion rates for US$
  • Research methodology
  • List of abbreviations

About Us

Technavio is a leading global technology research and advisory company. Their research and analysis focuses on emerging market trends and provides actionable insights to help businesses identify market opportunities and develop effective strategies to optimize their market positions. With over 500 specialized analysts, Technavio’s report library consists of more than 17,000 reports and counting, covering 800 technologies, spanning across 50 countries. Their client base consists of enterprises of all sizes, including more than 100 Fortune 500 companies. This growing client base relies on Technavio’s comprehensive coverage, extensive research, and actionable market insights to identify opportunities in existing and potential markets and assess their competitive positions within changing market scenarios.


Contacts

Technavio Research
Jesse Maida
Media & Marketing Executive
US: +1 844 364 1100
UK: +44 203 893 3200
Email: This email address is being protected from spambots. You need JavaScript enabled to view it.
Website: www.technavio.com/

ORANGE, Conn.--(BUSINESS WIRE)--Today the Maine Supreme Court issued a ruling that found the proposed citizen’s initiative on the New England Clean Energy Connect (NECEC) unconstitutional. The NECEC is a renewable energy project being built by AVANGRID (NYSE: AGR) to bring hydropower from Quebec to Maine and other parts of New England. Opponents had proposed a referendum to block the project.

“This ruling by the Maine Supreme Court is a victory for Maine and all of New England, putting us on a path toward a cleaner energy future that benefits the state and the region both environmentally and economically,” said AVANGRID Deputy CEO, Robert Kump. “The NECEC is a significant renewable energy project that will help address the climate crisis, removing millions of metric tons of carbon from our air annually. The project will also provide hundreds of jobs and increased property tax revenues for Maine and result in lower energy prices across New England. We now look forward to completing the permitting process and getting to work to deliver the benefits of this project.”

The Maine Supreme Court remanded the case to the Superior Court to enter a declaratory judgment. The court is not requiring an injunction based on its understanding that the Secretary of State will not put the unconstitutional initiative on the ballot based on statements made by Maine’s Assistant Attorney General during oral argument.

The project requires a permit from the US Army Corps of Engineers prior to commencing construction and a Presidential Permit from the US Department of Energy is required to enable cross-border transmission from Canada.

ABOUT THE NECEC PROJECT

The New England Clean Energy Connect (NECEC) is a $950 million investment that will deliver 1,200 megawatts of renewable hydropower to the New England energy grid in Lewiston, Maine. All of the costs will be paid for by Massachusetts electric customers. Once built, the NECEC will be New England’s largest source of renewable energy, representing a fundamental shift away from fossil fuels while simultaneously lowering energy costs in Maine and New England.

The 145-mile transmission line will be built on land owned or controlled by Central Maine Power. The 53 miles of new corridor on working forest land will use a new clearing technique of tapered vegetation; the remaining two-thirds of the project follows existing power lines created for the state’s hydroelectric industry almost a century ago.

The project will create more than 1,600 good-paying jobs during the two-and-a-half-year construction period and provide $200 million in upgrades to Maine’s energy grid, making Maine’s electricity service more reliable. The NECEC will allow more producers of renewable energy in Maine to get their energy on the grid, and because the corridor project will use clean hydropower, it will reduce the use of fossil fuels, cutting three million metric tons of dirty emissions each year.

For more information about the New England Clean Energy Connect, please visit our website at https://www.necleanenergyconnect.org/

About AVANGRID: AVANGRID, Inc. (NYSE: AGR) is a leading, sustainable energy company with approximately $35 billion in assets and operations in 24 U.S. states. With headquarters in Orange, Connecticut, AVANGRID has two primary lines of business: Avangrid Networks and Avangrid Renewables. Avangrid Networks owns eight electric and natural gas utilities, serving more than 3.3 million customers in New York and New England. Avangrid Renewables owns and operates a portfolio of renewable energy generation facilities across the United States. AVANGRID employs approximately 6,600 people. AVANGRID supports the U.N.’s Sustainable Development Goals and was named among the World’s Most Ethical Companies in 2019 and 2020 by the Ethisphere Institute. For more information, visit www.avangrid.com.


Contacts

Media:

Zsoka McDonald
This email address is being protected from spambots. You need JavaScript enabled to view it.
203.997-6892 (mobile)

24/7 Media Hotline
833.MEDIA.55 (833.633.4255)

Investors:

Patricia Cosgel
This email address is being protected from spambots. You need JavaScript enabled to view it.
203.499.2624

INDIANAPOLIS--(BUSINESS WIRE)--Allison Transmission Holdings Inc. (NYSE: ALSN), the largest global manufacturer of medium- and heavy-duty fully automatic transmissions and a supplier of commercial vehicle propulsion solutions, including electric hybrid and fully electric propulsion systems, today announced that its Board of Directors has declared a cash dividend of $0.17 per share on the Company’s common stock for the third quarter of 2020. Payment will be made on August 31, 2020, to stockholders of record at the close of business on August 24, 2020.


The payment of any future dividends will be at the discretion of the Board of Directors and will be dependent upon Allison Transmission’s financial position, results of operations, available cash, cash flow, capital requirements and other factors deemed relevant by the Board of Directors.

About Allison Transmission
Allison Transmission (NYSE: ALSN) is the world’s largest manufacturer of fully automatic transmissions for medium- and heavy-duty commercial vehicles and medium- and heavy-tactical U.S. defense vehicles, as well as a supplier of commercial vehicle propulsion solutions, including electric hybrid and fully electric propulsion systems. Allison products are used in a wide variety of applications, including on-highway trucks (distribution, refuse, construction, fire and emergency), buses (school, transit and coach), motorhomes, off-highway vehicles and equipment (energy, mining and construction applications) and defense vehicles (wheeled and tracked). Founded in 1915, the company is headquartered in Indianapolis, Indiana, USA. With a market presence in more than 80 countries, Allison has regional headquarters in the Netherlands, China and Brazil with manufacturing facilities in the U.S., Hungary and India. Allison also has approximately 1,500 independent distributor and dealer locations worldwide. For more information, visit allisontransmission.com.

Forward-Looking Statements
This press release contains forward-looking statements. All statements other than statements of historical fact contained in this press release are forward-looking statements, including all statements regarding future financial results or expected ability to re-open our facilities promptly. In some cases, you can identify forward-looking statements by terminology such as “may,” “will,” “should,” “expect,” “plans,” “project,” “anticipate,” “believe,” “estimate,” “predict,” “intend,” “forecast,” “could,” “potential,” “continue” or the negative of these terms or other similar terms or phrases. Forward-looking statements are not guarantees of future performance and involve known and unknown risks. Factors which may cause the actual results to differ materially from those anticipated at the time the forward-looking statements are made include, but are not limited to: the duration and spread of the COVID-19 outbreak, mitigating efforts deployed by government agencies and the public at large, and the overall impact from such outbreak on economic conditions, financial market volatility and our business, including but not limited to the operations of our manufacturing and other facilities, our supply chain, our distribution processes and demand for our products and the corresponding impacts to our net sales and cash flow; risks related to our substantial indebtedness; our participation in markets that are competitive; the highly cyclical industries in which certain of our end users operate; uncertainty in the global regulatory and business environments in which we operate; our ability to prepare for, respond to and successfully achieve our objectives relating to technological and market developments, competitive threats and changing customer needs; the concentration of our net sales in our top five customers and the loss of any one of these; the failure of markets outside North America to increase adoption of fully-automatic transmissions; U.S. and foreign defense spending; general economic and industry conditions; increases in cost, disruption of supply or shortage of raw materials or components used in our products; the discovery of defects in our products, resulting in delays in new model launches, recall campaigns and/or increased warranty costs and reduction in future sales or damage to our brand and reputation; risks associated with our international operations, including increased trade protectionism; labor strikes, work stoppages or similar labor disputes, which could significantly disrupt our operations or those of our principal customers; our intention to pay dividends and repurchase shares of our common stock and other risks and uncertainties associated with our business described in our Annual Report on Form 10-K, Quarterly Reports on Form 10-Q and Current Reports on Form 8-K. Although we believe the expectations reflected in such forward-looking statements are based upon reasonable assumptions, we can give no assurance that the expectations will be attained or that any deviation will not be material. All information is as of the date of this press release, and we undertake no obligation to update any forward-looking statement to conform the statement to actual results or changes in expectations.


Contacts

Raymond Posadas
Managing Director of Investor Relations
This email address is being protected from spambots. You need JavaScript enabled to view it.
(317) 242-3078

Media Relations
This email address is being protected from spambots. You need JavaScript enabled to view it.
(317) 242-5000

Wins validate success of strategies to leverage installed base and broaden geographic reach through localization

BATAVIA, N.Y.--(BUSINESS WIRE)--Graham Corporation (NYSE: GHM), a global business that designs, manufactures and sells critical equipment for the oil refining, petrochemical and defense industries, today announced that it secured $11 million in orders for three oil refining projects in Asia. Two projects are in Southeast Asia while the largest project is the first large order received in India by the Company and is with a new customer.


James R. Lines, Graham’s President and Chief Executive Officer, commented, “We believe our effective execution on strategy and our consultative selling platform enabled us to capture these awards during a period of intense competition and focus on price. We believe that our decision to localize in India provided us the opportunity to successfully compete on that project and is also keeping the bid pipeline in that country quite active. We continued to leverage our global fabrication supply chain where appropriate in order to compete effectively, and we stayed engaged throughout the nearly two year pipeline cycle with both buyers and end users to ensure we addressed their requirements.”

The project in India is a greenfield, integrated refining and petrochemical complex for which Graham will provide an ejector-liquid ring pump vacuum system.

Graham will also be providing an ejector-liquid ring pump vacuum system for the upgrade and expansion of a clean fuels refinery project, as well as replacing a 25-year-old Graham-built steam surface condenser for a refinery revitalization and capacity expansion project. Both of these projects are in Southeast Asia.

The projects will be recognized in backlog for the second quarter of fiscal 2021 while revenue associated with the three projects is expected be realized in fiscal 2022, which ends March 31, 2022.

ABOUT GRAHAM CORPORATION

Graham is a global business that designs, manufactures and sells critical equipment for the energy, defense and chemical/petrochemical industries. Energy markets include oil refining, cogeneration, and alternative power. For the defense industry, the Company’s equipment is used in nuclear propulsion power systems for the U.S. Navy. Graham’s global brand is built upon world-renowned engineering expertise in vacuum and heat transfer technology, responsive and flexible service and unsurpassed quality.

Graham designs and manufactures custom-engineered ejectors, vacuum pumping systems, surface condensers and vacuum systems. Graham’s equipment can also be found in other diverse applications such as metal refining, pulp and paper processing, water heating, refrigeration, desalination, food processing, pharmaceutical, heating, ventilating and air conditioning. Graham’s reach spans the globe and its equipment is installed in facilities from North and South America to Europe, Asia, Africa and the Middle East.

Graham routinely posts news and other important information on its website, www.graham-mfg.com, where additional comprehensive information on Graham Corporation and its subsidiaries can be found.

Safe Harbor Regarding Forward Looking Statements

This news release contains forward-looking statements within the meaning of Section 27A of the Securities Act of 1933, as amended, and Section 21E of the Securities Exchange Act of 1934, as amended.

Forward-looking statements are subject to risks, uncertainties and assumptions and are identified by words such as “expects,” “estimates,” “confidence,” “projects,” “typically,” “outlook,” “anticipates,” “believes,” “appears,” “could,” “opportunities,” “seeking,” “plans,” “aim,” “pursuit,” “look towards” and other similar words. All statements addressing operating performance, events, or developments that Graham Corporation expects or anticipates will occur in the future, including but not limited to, effects of the COVID-19 global pandemic, expected expansion and growth opportunities within its domestic and international markets, anticipated revenue, the timing of conversion of backlog to sales, market presence, profit margins, tax rates, foreign sales operations, its ability to improve cost competitiveness and productivity, customer preferences, changes in market conditions in the industries in which it operates, the effect on its business of volatility in commodities prices, including, but not limited to, the extreme price volatility seen in the first six months of calendar year 2020, changes in general economic conditions and customer behavior, forecasts regarding the timing and scope of the economic recovery in its markets, its acquisition and growth strategy and its operations in China, India and other international locations, are forward-looking statements. Because they are forward-looking, they should be evaluated in light of important risk factors and uncertainties. These risk factors and uncertainties are more fully described in Graham Corporation’s most recent Annual Report filed with the Securities and Exchange Commission, included under the heading entitled “Risk Factors.”

Should one or more of these risks or uncertainties materialize or should any of Graham Corporation’s underlying assumptions prove incorrect, actual results may vary materially from those currently anticipated. In addition, undue reliance should not be placed on Graham Corporation’s forward-looking statements. Except as required by law, Graham Corporation disclaims any obligation to update or publicly announce any revisions to any of the forward-looking statements contained in this news release.


Contacts

Jeffrey F. Glajch
Vice President – Finance and CFO
Phone: (585) 343-2216
This email address is being protected from spambots. You need JavaScript enabled to view it.

Deborah K. Pawlowski / Christopher M. Gordon
Kei Advisors LLC
Phone: (716) 843-3908 / (716) 843-3748
This email address is being protected from spambots. You need JavaScript enabled to view it. / This email address is being protected from spambots. You need JavaScript enabled to view it.

HOUSTON--(BUSINESS WIRE)--ECA MARCELLUS TRUST I (OTC Pink: ECTM) announced today that there will be no distribution paid for the quarter ended June 30, 2020 to holders of record as of the close of business on August 24, 2020, as Trust expenses exceeded net revenues to the Trust for the quarter.

The Trust was formed to own royalty interests in natural gas properties now held by Greylock Energy LLC, and certain of its wholly owned subsidiaries (“Greylock”) in the Marcellus Shale formation in Greene County, Pennsylvania. The Trust is entitled to receive certain amounts of the proceeds attributable to Greylock’s interest in the sale of production from the properties. As described in the Trust's filings, the amount of the quarterly distributions is expected to fluctuate from quarter to quarter, depending on the proceeds received by the Trust as a result of production and natural gas prices and the amount of the Trust's administrative expenses, among other factors. The amount of proceeds received or expected to be received by the Trust (and its ability to pay distributions) has been and will continue to be directly affected by the volatility in commodity prices, which have declined since the beginning of 2020 primarily attributable to the economic effects of the COVID-19 pandemic and could remain low for an extended period of time. Continued low natural gas prices will reduce proceeds to which the Trust is entitled, which will reduce the amount of cash available for distribution to unitholders and in certain periods could result in no distributions to unitholders.

Pursuant to IRC Section 1446, withholding tax on income effectively connected to a United States trade or business allocated to non-U.S. persons (“ECI”) should be made at the highest marginal rate. Under Section 1441, withholding tax on fixed, determinable, annual, periodic income from United States sources allocated to non-U.S. persons should be made at 30% of gross income unless the rate is reduced by treaty. This release is intended to be a qualified notice to nominees and brokers as provided for under Treasury Regulation Section 1.1446-4(b) by ECA Marcellus Trust I, and while specific relief is not specified for Section 1441 income, this disclosure is intended to suffice. For distributions made to non-U.S. persons, nominees and brokers should withhold at the highest effective tax rate.

This press release contains statements that are "forward-looking statements" within the meaning of Section 27A of the Securities Act of 1933, as amended, and Section 21E of the Securities Exchange Act of 1934, as amended. All statements contained in this press release, other than statements of historical facts, are "forward-looking statements" for purposes of these provisions. These forward-looking statements include the amount and date of any anticipated distribution to unit holders. The anticipated distribution is based, in part, on the amount of cash received or expected to be received by the Trust from Greylock with respect to the relevant quarterly period. Any differences in actual cash receipts by the Trust could affect this distributable amount. Other important factors that could cause actual results to differ materially include expenses of the Trust and reserves for anticipated future expenses and the effect, impact, potential duration or other implications of the COVID-19 pandemic. Statements made in this press release are qualified by the cautionary statements made in this press release. Neither Greylock nor the Trustee intends, and neither assumes any obligation, to update any of the statements included in this press release. An investment in Common Units issued by ECA Marcellus Trust I is subject to the risks described in the Trust's Annual Report on Form 10-K for the year ended December 31, 2019, and all of its other filings with the Securities and Exchange Commission. The Trust's annual, quarterly and other filed reports are or will be available over the Internet at the SEC's web site at http://www.sec.gov.


Contacts

ECA Marcellus Trust I
The Bank of New York Mellon Trust Company, N.A., as Trustee
Sarah Newell
1(512) 236-6555

KANSAS CITY, Mo.--(BUSINESS WIRE)--Kansas City Southern (KCS) (NYSE: KSU) announced today that it has formally joined the global network of Operation Clean Sweep® – the Plastic Industry Association’s and American Chemistry Council’s Plastics Division’s campaign to reduce pellet, flake and powder loss for greater product stewardship and environmental protection. OCS reaches all aspects of the plastics industry and is being adopted globally through the Global Declaration of Solutions to Marine Litter.


As a transportation provider, this is an important initiative and a direct way that KCS can work toward eliminating plastic waste in the environment,” said KCS executive vice president and chief marketing officer Mike Naatz. “We are committed to adopting and implementing the Operation Clean Sweep® program of best management practices to reduce pellet, flake and powder loss for the protection of the environment.”

As part of KCS’ Health, Safety, Security and Environmental Commitment Statement, we affirm, to all our stakeholders, including our employees, customers, shareholders, and the public, our commitment to safe, healthy, and secure operations,” said KCS executive vice president and chief operating officer Jeff Songer.

Specific initiatives now underway in the U.S. and Mexico include development of a transload environmental compliance evaluation program for facilities on KCS property; incorporation of OCS Best Management Practices into the company’s storm water pollution prevention training; and referencing the OCS Program Manual in future plastics transload agreements.

Headquartered in Kansas City, Mo., KCS is a transportation holding company that has railroad investments in the U.S., Mexico and Panama. Its primary U.S. holding is The Kansas City Southern Railway Company, serving the central and south central U.S. Its international holdings include Kansas City Southern de Mexico, S.A. de C.V., serving northeastern and central Mexico and the port cities of Lázaro Cárdenas, Tampico and Veracruz, and a 50 percent interest in Panama Canal Railway Company, providing ocean-to-ocean freight and passenger service along the Panama Canal. KCS' North American rail holdings and strategic alliances with other North American rail partners are primary components of a unique railway system, linking the commercial and industrial centers of the U.S., Mexico and Canada.


Contacts

C. Doniele Carlson
816-983-1372
This email address is being protected from spambots. You need JavaScript enabled to view it.

DALLAS--(BUSINESS WIRE)--Flowserve Corporation (NYSE: FLS), a leading provider of flow control products and services for the global infrastructure markets, today announced that its board of directors has elected Carlyn Taylor as an independent director and a member of the Audit Committee and the Corporate Governance & Nominating Committee of the board.


Ms. Taylor, 52, has more than 30 years of experience involving strategy and business transformation, capital allocation, capital markets and other transaction-related services. At FTI Consulting, Inc., a Washington, D.C.-based global business advisory firm listed on the New York Stock Exchange, in addition to serving as a member of FTI Consulting’s Executive Committee, Ms. Taylor is the Global Co-Leader of the Corporate Finance segment, leader of the Business Transformation and Transactions practices, and Chairperson of FTI Capital Advisors, FTI Consulting’s investment banking subsidiary. Ms. Taylor is widely recognized for her industry expertise in telecom, media and technology, as well as in industrials, energy, retail and healthcare, among other sectors.

Ms. Taylor’s leadership of the Business Transformation and Transactions practices within the Corporate Finance segment has been instrumental in extending FTI Consulting’s core restructuring and turnaround capabilities by partnering with healthy companies to drive operational excellence, reduce complexity, expand margins, increase capital efficiency and accelerate growth. Ms. Taylor’s leadership of FTI Consulting’s diversified product offering of business transformation and transaction-related services has been critical in driving record financial performance and headcount growth at FTI Consulting. "Carlyn brings to this role an extensive background in corporate strategy, finance and accounting, most notably leveraging her expertise in capital allocation strategies and capital markets to help businesses spearhead transformative initiatives,” said Roger Fix, chairman of the Flowserve board of directors. “The board looks forward to the addition of her expertise and insight as we continue to support the evolution of Flowserve through its Flowserve 2.0 initiatives.”

“The expertise that Carlyn brings from her years of leadership in multiple roles at FTI Consulting will serve us well as we continue to execute on our multi-year Flowserve 2.0 initiatives.” said Scott Rowe, Flowserve president and chief executive officer. “Building the Flowserve of the future requires both operational progress and a board with the strategic foresight to support our vision. The Flowserve executive leadership team and I look forward to leveraging Carlyn’s relevant experience as we continue to drive our long-term strategy, even in these unprecedented times.”

Ms. Taylor holds a B.S. and an M.A. in economics from the University of Southern California, where she graduated as valedictorian. She is a Certified Public Accountant in Colorado and holds investment banking licenses and is a registered general securities principal with FINRA.

“I’m pleased to join the Flowserve board of directors during such a transformative period in the company’s 200-year history,” said Ms. Taylor. “Based on the results of the Flowserve 2.0 transformation initiative to date, the organization is clearly committed to driving enterprise-wide transformation on its journey towards becoming the industry’s fluid motion and control leader through its focus on the customer experience, employee engagement and shareholder value.”

About Flowserve

Flowserve Corp. is one of the world’s leading providers of fluid motion and control products and services. Operating in more than 50 countries, the company produces engineered and industrial pumps, seals and valves as well as a range of related flow management services. More information about Flowserve can be obtained by visiting the company’s Web site at www.flowserve.com.

Safe Harbor Statement: This news release includes forward-looking statements within the meaning of Section 27A of the Securities Act of 1933 and Section 21E of the Securities Exchange Act of 1934, which are made pursuant to the safe harbor provisions of the Private Securities Litigation Reform Act of 1995, as amended. Words or phrases such as, "may," "should," "expects," "could," "intends," "plans," "anticipates," "estimates," "believes," "forecasts," "predicts" or other similar expressions are intended to identify forward-looking statements, which include, without limitation, earnings forecasts, statements relating to our business strategy and statements of expectations, beliefs, future plans and strategies and anticipated developments concerning our industry, business, operations and financial performance and condition.

The forward-looking statements included in this news release are based on our current expectations, projections, estimates and assumptions. These statements are only predictions, not guarantees. Such forward-looking statements are subject to numerous risks and uncertainties that are difficult to predict. These risks and uncertainties may cause actual results to differ materially from what is forecast in such forward-looking statements, and include, without limitation, the following: the impact of the global outbreak of COVID-19 on our business and operations; a portion of our bookings may not lead to completed sales, and our ability to convert bookings into revenues at acceptable profit margins; changes in global economic conditions and the potential for unexpected cancellations or delays of customer orders in our reported backlog; our dependence on our customers’ ability to make required capital investment and maintenance expenditures; if we are not able to successfully execute and realize the expected financial benefits from our strategic transformation and realignment initiatives, our business could be adversely affected; risks associated with cost overruns on fixed-fee projects and in taking customer orders for large complex custom engineered products; the substantial dependence of our sales on the success of the oil and gas, chemical, power generation and water management industries; the adverse impact of volatile raw materials prices on our products and operating margins; economic, political and other risks associated with our international operations, including military actions, trade embargoes, epidemics or pandemics or changes to tariffs or trade agreements that could affect customer markets, particularly North African, Russian and Middle Eastern markets and global oil and gas producers, and non-compliance with U.S. export/re-export control, foreign corrupt practice laws, economic sanctions and import laws and regulations; increased aging and slower collection of receivables, particularly in Latin America and other emerging markets; our exposure to fluctuations in foreign currency exchange rates, including in hyperinflationary countries such as Venezuela and Argentina; our furnishing of products and services to nuclear power plant facilities and other critical processes; potential adverse consequences resulting from litigation to which we are a party, such as litigation involving asbestos-containing material claims; expectations regarding acquisitions and the integration of acquired businesses; our relative geographical profitability and its impact on our utilization of deferred tax assets, including foreign tax credits; the potential adverse impact of an impairment in the carrying value of goodwill or other intangible assets; our dependence upon third-party suppliers whose failure to perform timely could adversely affect our business operations; the highly competitive nature of the markets in which we operate; environmental compliance costs and liabilities; potential work stoppages and other labor matters; access to public and private sources of debt financing; our inability to protect our intellectual property in the U.S., as well as in foreign countries; obligations under our defined benefit pension plans; our internal control over financial reporting may not prevent or detect misstatements because of its inherent limitations, including the possibility of human error, the circumvention or overriding of controls, or fraud; the recording of increased deferred tax asset valuation allowances in the future or the impact of tax law changes on such deferred tax assets could affect our operating results; our information technology infrastructure could be subject to service interruptions, data corruption, cyber-based attacks or network security breaches, which could disrupt our business operations and result in the loss of critical and confidential information; ineffective internal controls could impact the accuracy and timely reporting of our business and financial results; and other factors described from time to time in our filings with the Securities and Exchange Commission.

All forward-looking statements included in this news release are based on information available to us on the date hereof, and we assume no obligation to update any forward-looking statement.

The Company reports its financial results in accordance with U.S. generally accepted accounting principles (GAAP). However, management believes that non-GAAP financial measures which exclude certain non-recurring items present additional useful comparisons between current results and results in prior operating periods, providing investors with a clearer view of the underlying trends of the business. Management also uses these non-GAAP financial measures in making financial, operating, planning and compensation decisions and in evaluating the Company's performance. Throughout our materials we refer to non-GAAP measures as “Adjusted.” Non-GAAP financial measures, which may be inconsistent with similarly captioned measures presented by other companies, should be viewed in addition to, and not as a substitute for, the Company’s reported results prepared in accordance with GAAP.


Contacts

Investor Contacts:
Jay Roueche, Vice President, Investor Relations & Treasurer (972) 443-6560
Mike Mullin, Director, Investor Relations (972) 443-6636

Media Contact:
Lars Rosene, Vice President, Corporate Communications & Public Affairs (972) 443-6644

IRVINE, Calif.--(BUSINESS WIRE)--Montrose Environmental Group, Inc. (the “Company” or “Montrose”) (NYSE: MEG) announced today that it will issue its second quarter 2020 earnings release on Monday, August 31, 2020, after the close of trading on the New York Stock Exchange.


You are invited to participate in the Company’s conference call hosted by senior management on August 31, 2020 at 5:00 PM EDT to discuss the Company’s second quarter financial results. Their prepared remarks will be followed by a question and answer session.

2Q20 Conference Call Date & Time:
Monday, August 31, 2020 at 5:00 PM EDT

To participate on the day of the call, dial 1-877-407-9208 or internationally 1-201-493-6784 approximately ten minutes before the call and tell the operator you wish to join the Montrose Second Quarter 2020 Earnings Conference Call.

A live webcast of the conference call will be available in the Investor Relations section of the Montrose website at investors.montrose-env.com. For those who are unable listen to the live broadcast, an audio replay of the conference call will be available on the Montrose website for 30 days.

About Montrose

Montrose is a leading environmental services company focused on supporting government and commercial organizations as they deal with the challenges of today, and prepare for what’s coming tomorrow. With 1,700 employees across 70 locations serving customers around the world, Montrose combines deep local knowledge with an integrated approach to design, engineering, and operations, enabling us to respond effectively and efficiently to the unique requirements of each project. From comprehensive air measurement and laboratory services to regulatory compliance, permitting, engineering, and remediation, Montrose delivers innovative and practical solutions that keep our clients on top of their immediate needs – and well ahead of the strategic curve. For more information, visit montrose-env.com.


Contacts

Investor Relations:
Rodny Nacier
(949) 988-3383
This email address is being protected from spambots. You need JavaScript enabled to view it.

Media Relations:
Doug Donsky
(646) 361-1427
This email address is being protected from spambots. You need JavaScript enabled to view it.

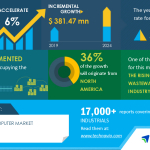
LONDON--(BUSINESS WIRE)--#FlowComputerMarket--Technavio has been monitoring the flow computer market and it is poised to grow by $ 381.47 mn during 2020-2024, progressing at a CAGR of almost 6% during the forecast period. The report offers an up-to-date analysis regarding the current market scenario, latest trends and drivers, and the overall market environment.


Technavio suggests three forecast scenarios (optimistic, probable, and pessimistic) considering the impact of COVID-19. Please Request Latest Free Sample Report on Covid-19 Impact

The market is fragmented, and the degree of fragmentation will accelerate during the forecast period. ABB Ltd., Emerson Electric Co., Honeywell International Inc., KROHNE Messtechnik GmbH, Schneider Electric SE, SICK AG, Siemens AG, TechnipFMC Plc, Thermo Fisher Scientific Inc., and Yokogawa Electric Corp. are some of the major market participants. To make the most of the opportunities, market vendors should focus more on the growth prospects in the fast-growing segments, while maintaining their positions in the slow-growing segments.

The rising demand from wastewater treatment industry has been instrumental in driving the growth of the market. However, the stagnant oil and gas industry might hamper the market growth.

Flow Computer Market 2020-2024 : Segmentation

Flow Computer Market is segmented as below:

  • Product
    • Wired Flow
    • Wireless Flow
  • End-user
    • Oil And Gas
    • Others
  • Geographic Landscape
    • North America
    • Europe
    • APAC
    • MEA
    • South America

To learn more about the global trends impacting the future of market research, download a free sample: https://www.technavio.com/talk-to-us?report=IRTNTR41068

Flow Computer Market 2020-2024 : Scope

Technavio presents a detailed picture of the market by the way of study, synthesis, and summation of data from multiple sources. Our flow computer market report covers the following areas:

  • Flow Computer Market size
  • Flow Computer Market trends
  • Flow Computer Market industry analysis

This study identifies the enhanced oil recovery as one of the prime reasons driving the flow computer market growth during the next few years.

Flow Computer Market 2020-2024 : Vendor Analysis

We provide a detailed analysis of around 25 vendors operating in the flow computer market, including some of the vendors such as ABB Ltd., Emerson Electric Co., Honeywell International Inc., KROHNE Messtechnik GmbH, Schneider Electric SE, SICK AG, Siemens AG, TechnipFMC Plc, Thermo Fisher Scientific Inc., and Yokogawa Electric Corp. Backed with competitive intelligence and benchmarking, our research reports on the Flow Computer Market are designed to provide entry support, customer profile and M&As as well as go-to-market strategy support.

Register for a free trial today and gain instant access to 17,000+ market research reports.

Technavio's SUBSCRIPTION platform

Flow Computer Market 2020-2024 : Key Highlights

  • CAGR of the market during the forecast period 2020-2024
  • Detailed information on factors that will assist flow computer market growth during the next five years
  • Estimation of the flow computer market size and its contribution to the parent market
  • Predictions on upcoming trends and changes in consumer behavior
  • The growth of the flow computer market
  • Analysis of the market’s competitive landscape and detailed information on vendors
  • Comprehensive details of factors that will challenge the growth of flow computer market vendors

Table Of Contents :

Executive Summary

  • Market Overview

Market Landscape

  • Market ecosystem
  • Value chain analysis

Market Sizing

  • Market definition
  • Market segment analysis
  • Market size 2019
  • Market outlook: Forecast for 2019 - 2024

Five Forces Analysis

  • Bargaining power of buyers
  • Bargaining power of suppliers
  • Threat of new entrants
  • Threat of substitutes
  • Threat of rivalry
  • Market condition

Market Segmentation by Product

  • Market segments
  • Comparison by Product placement
  • Wired flow - Market size and forecast 2019-2024
  • Wireless flow - Market size and forecast 2019-2024
  • Market opportunity by Product

Market Segmentation by End-user

  • Market segments
  • Comparison by End-user placement
  • Oil and gas - Market size and forecast 2019-2024
  • Others - Market size and forecast 2019-2024
  • Market opportunity by End-user

Customer Landscape

  • Overview

Geographic Landscape

  • Geographic segmentation
  • Geographic comparison
  • North America - Market size and forecast 2019-2024
  • Europe - Market size and forecast 2019-2024
  • APAC - Market size and forecast 2019-2024
  • MEA - Market size and forecast 2019-2024
  • South America - Market size and forecast 2019-2024
  • Key leading countries
  • Market opportunity by geography

Drivers, Challenges, and Trends

  • Market drivers
  • Volume driver - Demand led growth
  • Volume driver - Supply led growth
  • Volume driver - External factors
  • Volume driver - Demand shift in adjacent markets
  • Price driver - Inflation
  • Price driver - Shift from lower to higher priced units
  • Market challenges
  • Market trends

Vendor Landscape

  • Overview
  • Landscape disruption
  • Vendor Analysis

Vendors covered

  • Market positioning of vendors
  • ABB Ltd.
  • Emerson Electric Co.
  • Honeywell International Inc.
  • KROHNE Messtechnik GmbH
  • Schneider Electric SE
  • SICK AG
  • Siemens AG
  • TechnipFMC Plc
  • Thermo Fisher Scientific Inc.
  • Yokogawa Electric Corp.

Appendix

  • Scope of the report
  • Currency conversion rates for US$
  • Research methodology
  • List of abbreviations

About Us

Technavio is a leading global technology research and advisory company. Their research and analysis focuses on emerging market trends and provides actionable insights to help businesses identify market opportunities and develop effective strategies to optimize their market positions. With over 500 specialized analysts, Technavio’s report library consists of more than 17,000 reports and counting, covering 800 technologies, spanning across 50 countries. Their client base consists of enterprises of all sizes, including more than 100 Fortune 500 companies. This growing client base relies on Technavio’s comprehensive coverage, extensive research, and actionable market insights to identify opportunities in existing and potential markets and assess their competitive positions within changing market scenarios.


Contacts

Technavio Research
Jesse Maida
Media & Marketing Executive
US: +1 844 364 1100
UK: +44 203 893 3200
Email: This email address is being protected from spambots. You need JavaScript enabled to view it.
Website: www.technavio.com/

SAN JOSE, Calif.--(BUSINESS WIRE)--Bloom Energy Corporation (NYSE: BE) today announced that, on August 11, 2020, the initial purchaser exercised its option in full to purchase an additional $30.0 million aggregate principal amount (the “additional notes”) of Bloom Energy’s 2.50% green convertible senior notes due 2025 (the “notes”). The additional notes closed today. This purchase increases the outstanding aggregate principal amount of notes issued to $230.0 million.


The notes are senior, unsecured obligations of Bloom Energy and will accrue interest at a rate of 2.50% per annum, payable semi-annually in arrears on February 15 and August 15 of each year, beginning on February 15, 2021. The notes will mature on August 15, 2025, unless earlier repurchased, redeemed or converted. Before May 15, 2025, noteholders will have the right to convert their notes only upon the occurrence of certain events. From and after May 15, 2025, noteholders may convert their notes at any time at their election until the close of business on the second scheduled trading day immediately before the maturity date. Bloom Energy will settle conversions by paying or delivering, as applicable, cash, shares of its Class A common stock or a combination of cash and shares of its Class A common stock, at Bloom Energy’s election. The initial conversion rate is 61.6808 shares of Class A common stock per $1,000 principal amount of notes, which represents an initial conversion price of approximately $16.21 per share of Class A common stock. The initial conversion price represents a premium of approximately 25.0% over the last reported sale price of $12.97 per share of Bloom Energy’s Class A common stock on August 6, 2020. The conversion rate and conversion price is subject to adjustment upon the occurrence of certain events. If a “make-whole fundamental change” (as defined in the indenture for the notes) occurs, Bloom Energy will, in certain circumstances, increase the conversion rate for a specified time for holder who convert their notes in connection with that make-whole fundamental change.

The notes are redeemable, in whole or in part, for cash at Bloom Energy’s option at any time, and from time to time, on or after August 21, 2023 and on or before the 26th scheduled trading day immediately before the maturity date, but only if the last reported sale price per share of Bloom Energy’s Class A common stock exceeds 130% of the conversion price for a specified period of time. The redemption price is equal to the principal amount of the notes to be redeemed, plus accrued and unpaid interest, if any, to, but excluding, the redemption date. If Bloom Energy calls any or all notes for redemption, holders of notes called for redemption may convert their notes during the related redemption conversion period, and any such conversion will also constitute a “make-whole fundamental change” with respect to the notes so converted.

If a “fundamental change” (as defined in the indenture for the notes) occurs, then, subject to a limited exception, noteholders may require Bloom Energy to repurchase their notes for cash. The repurchase price is equal to the principal amount of the notes to be repurchased, plus accrued and unpaid interest, if any, to, but excluding, the applicable repurchase date.

The notes, including the additional $30.0 million sold today, were offered and sold only to qualified institutional buyers in accordance with Rule 144A under the Securities Act of 1933, as amended.

The offer and sale of the notes and any shares of Class A common stock issuable upon conversion of the notes have not been, and will not be, registered under the Securities Act or any other securities laws, and the notes and any such shares cannot be offered or sold except pursuant to an exemption from, or in a transaction not subject to, the registration requirements of the Securities Act and any other applicable securities laws. This press release does not constitute an offer to sell, or the solicitation of an offer to buy, the notes or any shares of Class A common stock issuable upon conversion of the notes, nor will there be any sale of the notes or any such shares, in any state or other jurisdiction in which such offer, sale or solicitation would be unlawful.

About Bloom Energy

Bloom Energy’s mission is to make clean, reliable energy affordable for everyone in the world. Bloom Energy’s product, the Bloom Energy Server, delivers highly reliable and resilient, always-on electric power that is clean, cost-effective, and ideal for microgrid applications. Bloom’s customers include many Fortune 100 companies and leaders in manufacturing, data centers, healthcare, retail, higher education, utilities, and other industries.

Forward-Looking Statements

This press release includes forward-looking statements. Forward-looking statements represent Bloom Energy’s current expectations regarding future events and are subject to known and unknown risks and uncertainties that could cause actual results to differ materially from those implied by the forward-looking statements. Among those risks and uncertainties are market conditions and risks relating to Bloom Energy’s business, including those described in periodic reports that Bloom Energy files from time to time with the Securities Exchange Commission. The forward-looking statements included in this press release speak only as of the date of this press release, and Bloom Energy does not undertake to update the statements included in this press release for subsequent developments, except as may be required by law.


Contacts

Investor Relations:
Mark Mesler
Bloom Energy
+1 (408) 543-1743
This email address is being protected from spambots. You need JavaScript enabled to view it.

Media:
Erica Osian
Bloom Energy
+1 (401) 714-6883
This email address is being protected from spambots. You need JavaScript enabled to view it.

DUBLIN--(BUSINESS WIRE)--The "Indonesia Geothermal Energy Market - Growth, Trends, and Forecasts (2020-2025)" report has been added to ResearchAndMarkets.com's offering.


The Indonesia geothermal energy market is expected to grow at a CAGR of around 5.5% during the forecast period.

The primary driver for the market includes the government efforts to reduce the dependency on fossil fuels, and thereby reduce CO2 emission of the country.

However, the higher price associated with geothermal energy as compared to fossil fuel-based power generation along with increasing competition for alternative renewable energy sources such as solar and wind is expected to hinder the market growth during the forecast period.

The market is moderately consolidated. Some of the key players in the market include Enal SpA, Toshiba Energy Systems & Solutions Corporation, BCPG Public Company Limited, PT Supreme Energy, and Sarulla Operations Ltd.

Market Highlights

  • Increasing demand for electricity is likely to drive the market during the forecast period.
  • During 2018 it has been estimated that Indonesia has the potential of generating around 29 GWe. With an estimated growing population to 296 million and an increased urbanization rate of 71% by 2030, it is expected to have growth in electricity demand. Indonesian government effort to reduce CO2 emission by 29% by 2030, it is most likely to have growth in renewable energy to meet the increasing electricity demand, which is likely to create an opportunity for the geothermal market to grow in the near future.
  • Upcoming coal fired power plants are likely to restrict the market growth during the forecast period.

Market Trends

Increasing Demand for Electricity Likely to Drive the Market

  • Electricity demand in Indonesia is growing over the years with the increasing population and the growth in urbanization. During 2018, the consumption of electricity in Indonesia grew from 1012 kilowatt per hour (KWh) per capita in 2017 to 1064 KWh in 2018.
  • During 2018, the total electricity consumption in Indonesia was nearly 266 GWh. Households consumed the highest percentage of electricity, with almost 40% of the total electricity consumed.
  • It is estimated that the household electricity demand in Indonesia is likely to increase to 350 TWh, while demand in the industrial and commercial sector is likely to increase to nearly 80 TWh and 70 TWh, respectively.
  • Uses of electronic appliances in the household sector are expected to be the significant driver for the increase in electricity consumption, while industries like metal, chemical, food, and textile industries are expected to the major driver for industrial electricity consumption.
  • With an increase in population, the Indonesia household is likely to increase to nearly 80 million by 2050, which is expected to have further increase in electricity consumption during the upcoming years. With government initiatives to increase the share of renewable energy in the country's total electricity generation, geothermal energy as a possible electricity source is likely to grow during the forecast period.

Upcoming Coal Fired Power Plant Likely to Restrict Market Growth

  • During 2018, Indonesia's power plant capacity increased to nearly 64.5 GW, an increase of around 3% compared to the capacity in 2017. The power plant installed capacity in 2018 was mostly dominated by fossil fuel power plants, especially coal (50%), followed by gas (29%), fuel (7%) and renewable energy (14%).
  • In 2018, power plant production reached 283.8 TWh, which got generated from 56.4% coal, 20.2% gas, 6.3% petroleum fuel, and 17.1% renewables (including geothermal of 5%).
  • With existing coal power plants on the operation, the country is planning to build new coal power plants. During January 2020, the country has nearly 32.3 GW capacity coal power plants, and around 19.3 GW of coal power plants are on various stages of implementation.
  • Increasing the capacity of coal-fired power plants is expected to have a significant share in the electricity generation mix. It thus is expected to meet the maximum percentage of rising electricity demand during the forecast period, which is likely to slow down the growth of geothermal energy along with other renewable sources in the country.

Key Topics Covered

1 INTRODUCTION

1.1 Scope of the Study

1.2 Market Definition

1.3 Study Assumptions

2 EXECUTIVE SUMMARY

3 RESEARCH METHODOLOGY

4 MARKET OVERVIEW

4.1 Introduction

4.2 Geothermal Energy Installed Capacity and Forecast in MW, till 2025

4.3 Recent Trends and Developments

4.4 Government Policies and Regulations

4.5 Market Dynamics

4.5.1 Drivers

4.5.2 Restraints

4.6 Supply Chain Analysis

4.7 PESTLE Analysis

5 COMPETITIVE LANDSCAPE

5.1 Mergers and Acquisitions, Joint Ventures, Collaborations, and Agreements

5.2 Strategies Adopted by Leading Players

5.3 Company Profiles

5.3.1 Enal S.p.A.

5.3.2 Toshiba Energy Systems & Solutions Corporation

5.3.3 BCPG Public Company Limited

5.3.4 PT Supreme Energy

5.3.5 Sarulla Operations Ltd.

6 MARKET OPPORTUNITIES AND FUTURE TRENDS

For more information about this report visit https://www.researchandmarkets.com/r/9dndny


Contacts

ResearchAndMarkets.com
Laura Wood, Senior Press Manager
This email address is being protected from spambots. You need JavaScript enabled to view it.
For E.S.T Office Hours Call 1-917-300-0470
For U.S./CAN Toll Free Call 1-800-526-8630
For GMT Office Hours Call +353-1-416-8900

LONDON--(BUSINESS WIRE)--#GlobalSolarMicroinverterMarket--The global solar microinverter market size is expected to grow by USD 618.54 million as per Technavio. This marks a significant market growth compared to the 2019 growth estimates due to the impact of the COVID-19 pandemic in the first half of 2020. Moreover, steady growth is expected to continue throughout the forecast period, and the market is expected to grow at a CAGR of 12%. Request Free Sample Report on COVID-19 Impacts


Read the 120-page report with TOC on "Solar Microinverter Market Analysis Report by End-user (Residential and Non-residential) and Geography (North America, Europe, APAC, South America, and MEA), and the Segment Forecasts, 2020-2024".

https://www.technavio.com/report/solar-microinverter-market-industry-analysis

The market is driven by the increasing solar energy installation. In addition, the increasing deployment of microgrids is anticipated to boost the growth of the solar microinverter market.

In recent years, the solar energy industry has gained momentum and grown drastically. This is mainly due to the initiatives undertaken by governments worldwide that encourage the use of renewable resources. Many industrialized or developed nations have integrated a significant quantity of solar power into their electrical grids to provide an alternative to conventional energy sources. On the other hand, developing nations use solar energy to reduce their dependence on expensive imported fuels. The growing awareness about solar energy benefits is driving the demand for solar projects, which in turn will increase the level of solar energy output, thereby ensuring a high rate of return for investors in solar projects. Moreover, the hike in the cost of fossil fuels is making solar power a more economical source of renewable energy. Thus, solar energy consumption is expected to increase rapidly, thereby driving the demand for solar microinverter systems.

Buy 1 Technavio report and get the second for 50% off. Buy 2 Technavio reports and get the third for free.

View market snapshot before purchasing

Major Five Solar Microinverter Companies:

ABB Ltd.

ABB Ltd. has business operations under various segments, such as electrification, industrial automation, motion, robotics and discrete automation, corporate and other. The company offers 250 W and 300 W micro inverters. Some of the variants are MICRO-0.25-I-OUTD, MICRO-0.3-I-OUTD, and MICRO-0.3HV-I-OUTD.

Autarco Group BV

Autarco Group BV is engaged in the design and development of solar solutions such as panels, inverters, and others for businesses, homes, and dealers. The company offers Autarco LD and LQ Mark II series inverters range from 5 kW to 20 kW.

Chilicon Power LLC

Chilicon Power LLC is engaged in the design and development of microinverter, gateways, and related components. The company offers CP-250E and CP-720 variants of microinverter.

Enphase Energy Inc.

Enphase Energy Inc. is engaged in the design, development, manufacture, and sale of solutions for the solar photovoltaic industry. The company offers Enphase IQ 7X, Enphase IQ 7+, Enphase IQ 7, Enphase IQ 6+, and other variants of solar microinverters.

LeadSolar Energy Co. Ltd.

LeadSolar Energy Co. Ltd. has business operations under microinverters, gateway, monitoring platform, and smart junction box. The segment offers solar microinverter which features PLC and Zigbee communication.

Register for a free trial today and gain instant access to 17,000+ market research reports.

Technavio's SUBSCRIPTION platform

Solar Microinverter End-user Outlook (Revenue, USD mn, 2020-2024)

  • Residential
  • Non-residential

Solar Microinverter Regional Outlook (Revenue, USD mn, 2020-2024)

  • North America
  • Europe
  • APAC
  • South America
  • MEA

Technavio’s sample reports are free of charge and contain multiple sections of the report, such as the market size and forecast, drivers, challenges, trends, and more. Request a free sample report

About Technavio

Technavio is a leading global technology research and advisory company. Their research and analysis focuses on emerging market trends and provides actionable insights to help businesses identify market opportunities and develop effective strategies to optimize their market positions.

With over 500 specialized analysts, Technavio’s report library consists of more than 17,000 reports and counting, covering 800 technologies, spanning across 50 countries. Their client base consists of enterprises of all sizes, including more than 100 Fortune 500 companies. This growing client base relies on Technavio’s comprehensive coverage, extensive research, and actionable market insights to identify opportunities in existing and potential markets and assess their competitive positions within changing market scenarios.


Contacts

Technavio Research
Jesse Maida
Media & Marketing Executive
US: +1 844 364 1100
UK: +44 203 893 3200
Email: This email address is being protected from spambots. You need JavaScript enabled to view it.
Website: www.technavio.com/

DALLAS--(BUSINESS WIRE)--Flowserve Corporation, (NYSE: FLS), a leading provider of flow control products and services for the global infrastructure markets, announced that its Board of Directors has authorized a quarterly cash dividend of $0.20 per share on the company's outstanding shares of common stock.


The dividend is payable on October 2, 2020, to shareholders of record as of the close of business on September 18, 2020.

While Flowserve currently intends to pay regular quarterly cash dividends for the foreseeable future, any future dividends, at this $0.20 per share rate or otherwise, will be reviewed individually and declared by the Board at its discretion.

Safe Harbor Statement:

This news release includes forward-looking statements within the meaning of Section 27A of the Securities Act of 1933 and Section 21E of the Securities Exchange Act of 1934, which are made pursuant to the safe harbor provisions of the Private Securities Litigation Reform Act of 1995, as amended. Words or phrases such as, "may," "should," "expects," "could," "intends," "plans," "anticipates," "estimates," "believes," "forecasts," "predicts" or other similar expressions are intended to identify forward-looking statements, which include, without limitation, earnings forecasts, statements relating to our business strategy and statements of expectations, beliefs, future plans and strategies and anticipated developments concerning our industry, business, operations and financial performance and condition.

The forward-looking statements included in this news release are based on our current expectations, projections, estimates and assumptions. These statements are only predictions, not guarantees. Such forward-looking statements are subject to numerous risks and uncertainties that are difficult to predict. These risks and uncertainties may cause actual results to differ materially from what is forecast in such forward-looking statements, and include, without limitation, the following: the impact of the global outbreak of COVID-19 on our business and operations; a portion of our bookings may not lead to completed sales, and our ability to convert bookings into revenues at acceptable profit margins; changes in global economic conditions and the potential for unexpected cancellations or delays of customer orders in our reported backlog; our dependence on our customers’ ability to make required capital investment and maintenance expenditures; if we are not able to successfully execute and realize the expected financial benefits from our strategic transformation and realignment initiatives, our business could be adversely affected; risks associated with cost overruns on fixed-fee projects and in taking customer orders for large complex custom engineered products; the substantial dependence of our sales on the success of the oil and gas, chemical, power generation and water management industries; the adverse impact of volatile raw materials prices on our products and operating margins; economic, political and other risks associated with our international operations, including military actions, trade embargoes, epidemics or pandemics or changes to tariffs or trade agreements that could affect customer markets, particularly North African, Russian and Middle Eastern markets and global oil and gas producers, and non-compliance with U.S. export/re-export control, foreign corrupt practice laws, economic sanctions and import laws and regulations; increased aging and slower collection of receivables, particularly in Latin America and other emerging markets; our exposure to fluctuations in foreign currency exchange rates, including in hyperinflationary countries such as Venezuela and Argentina; our furnishing of products and services to nuclear power plant facilities and other critical processes; potential adverse consequences resulting from litigation to which we are a party, such as litigation involving asbestos-containing material claims; expectations regarding acquisitions and the integration of acquired businesses; our relative geographical profitability and its impact on our utilization of deferred tax assets, including foreign tax credits; the potential adverse impact of an impairment in the carrying value of goodwill or other intangible assets; our dependence upon third-party suppliers whose failure to perform timely could adversely affect our business operations; the highly competitive nature of the markets in which we operate; environmental compliance costs and liabilities; potential work stoppages and other labor matters; access to public and private sources of debt financing; our inability to protect our intellectual property in the U.S., as well as in foreign countries; obligations under our defined benefit pension plans; our internal control over financial reporting may not prevent or detect misstatements because of its inherent limitations, including the possibility of human error, the circumvention or overriding of controls, or fraud; the recording of increased deferred tax asset valuation allowances in the future or the impact of tax law changes on such deferred tax assets could affect our operating results; our information technology infrastructure could be subject to service interruptions, data corruption, cyber-based attacks or network security breaches, which could disrupt our business operations and result in the loss of critical and confidential information; ineffective internal controls could impact the accuracy and timely reporting of our business and financial results; and other factors described from time to time in our filings with the Securities and Exchange Commission.

All forward-looking statements included in this news release are based on information available to us on the date hereof, and we assume no obligation to update any forward-looking statement.

The Company reports its financial results in accordance with U.S. generally accepted accounting principles (GAAP). However, management believes that non-GAAP financial measures which exclude certain non-recurring items present additional useful comparisons between current results and results in prior operating periods, providing investors with a clearer view of the underlying trends of the business. Management also uses these non-GAAP financial measures in making financial, operating, planning and compensation decisions and in evaluating the Company's performance. Throughout our materials we refer to non-GAAP measures as “Adjusted.” Non-GAAP financial measures, which may be inconsistent with similarly captioned measures presented by other companies, should be viewed in addition to, and not as a substitute for, the Company’s reported results prepared in accordance with GAAP.


Contacts

Flowserve Contacts
Investor Contacts:
Jay Roueche, Vice President, Investor Relations & Treasurer (972) 443-6560
Mike Mullin, Director, Investor Relations, (972) 443-6636

Media Contact:
Lars Rosene, Vice President, Corporate Communications & Public Affairs, (972) 443-6644

DALLAS--(BUSINESS WIRE)--New Concept Energy, Inc. (NYSE American: GBR), (the “Company” or “NCE”) a Dallas-based oil and gas company, today reported a net loss from continuing operations for the three months ended June 30, 2020 of $137,000 or ($0.03) per diluted share, compared to net loss from continuing operations of $141,000 or ($0.03) per share for the three months ended June 30, 2019.


The Company reported a net loss from continuing operations for the six months ended June 30, 2020 of $234,000 or ($0.05) per share, compared to net loss from continuing operations of $15,000 for the six months ended June 30, 2019.

For the three months ended June 30, 2019, the Company recorded oil and gas revenues of $93,000 as compared to $164,000 for the comparable period of 2019. The decrease was principally due to a lower price received for the sale of natural gas.

For the three months ended June 30, 2020, the Company recorded oil and gas operating expenses of $163,000 as compared to $231,000 for the comparable period of 2019. The decrease was principally due to reductions in payroll, consulting fees and overall expenses.

For the three months ended June 30, 2019, corporate general & administrative expenses were $127, 000 as compared to $134,000 for the comparable periods in 2019.

NEW CONCEPT ENERGY, INC. AND SUBSIDIARIES

CONSOLIDATED BALANCE SHEETS

(unaudited)

(amounts in thousands)

June 30,
2020

December 31,
2019

 
Assets
 
Current assets
Cash and cash equivalents

$

39

$

22

Accounts receivable from oil and gas sales


69


73

Current portion note receivable (including $3,620 and $4,136 in 2020 and 2019 from related parties


3,660


4,046

Other current assets


25


-

Total current assets


3,793


4,141


Oil and natural gas properties (full cost accounting method)
Proved developed and undeveloped oil and gas properties, net of depletion


706


767

 
Property and equipment, net of depreciation
Land, buildings and equipment - oil and gas operations


662


668

 
Note receivable


192


214

 
Total assets

$

5,353

$

5,790

NEW CONCEPT ENERGY, INC. AND SUBSIDIARIES

CONSOLIDATED BALANCE SHEETS - CONTINUED

(unaudited)

(dollars in thousands, except par value amount)


June 30,
2020

December 31,
2019

   
Liabilities and stockholders' equity  
   
Current liabilities  
Accounts payable - (including $20 and $180 due to related parties in 2020 and 2019)  

$

195

$

355

Accrued expenses  


37


35

Current portion of long term debt  


40


44

Total current liabilities  


272


434

   
Long-term debt  
Notes payable less current portion  


161


177

Asset retirement obligation  


2,745


2,770

Total liabilities  


3,178


3,381

   
Stockholders' equity  
Preferred stock, Series B  


1


1

Common stock, $.01 par value; authorized, 100,000,000  
shares; issued and outstanding, 5,131,934 and 2,036,935 shares  
at June 30, 2020 and December 31, 2019  


51


51

Additional paid-in capital  


63,579


63,579

Accumulated deficit  


(61,456)


(61,222)

   
Total shareholder equity  


2,175


2,409

   
Total liabilities & equity  

$

5,353

$

5,790

NEW CONCEPT ENERGY, INC AND SUBSIDIARIES

CONSOLIDATED STATEMENT OF OPERATIONS

(unaudited)

(amounts in thousands, except per share data)


For the Three Months
ended June 30,


For the Six Months
ended June 30,


2020


2019


2020


2019

Revenue  
Oil and gas operations, net of royalties  

$

93

$

164

$

218

$

344

   
Operating expenses  
Oil and gas operations  


163


231


341


410

Corporate general and administrative  


127


134


231


222

Total Operating Expenses  


290


365


572


632

Operating earnings (loss)  


(197)


(201)


(354)


(288)


Other income (expense)  
Interest income  


63


64


127


129

Interest expense  


(3)


(4)


(7)


(9)

Other income (expense), net  


-


-


-


153

Expense  


60


60


120


273


Net income (loss) applicable to common shares  

$

(137)

$

(141)

$

(234)

$

(15)

   
Net income (loss) per common share-basic and diluted  

$

(0.03)

$

(0.03)

$

(0.05)

$

-


Weighted average common and equivalent shares outstanding - basic  


5,132


5,132


5,132


5,132


Contacts

New Concept Energy Inc.
Investor Relations
Gene Bertcher, (800) 400-6407
This email address is being protected from spambots. You need JavaScript enabled to view it.

VISTA, Calif.--(BUSINESS WIRE)--$FLUX #NASDAQ--Flux Power Holdings, Inc. (“Flux Power”) (OTCQB: FLUX NASDAQ: FLUX), a developer of advanced lithium industrial batteries for commercial and industrial equipment, today announced the pricing of a $10.8 million underwritten public offering of 2,695,000 shares of common stock at a public offering price of $4.00 per share. Flux Power has also granted to the underwriters a 30-day option to acquire an additional 404,250 shares to cover overallotments in connection with the offering. The offering is expected to close on August 18, 2020, subject to the satisfaction of customary closing conditions. Flux Power intends to use the net proceeds of the offering for working capital and general corporate purposes.


Flux Power also announced that, in connection with the offering, its common stock has been approved for listing on the Nasdaq Capital Market and will begin trading on the Nasdaq Capital Market under the symbol “FLUX” on August 14, 2020.

Roth Capital Partners and National Securities Corporation, a wholly owned subsidiary of National Holdings Corporation (NASDAQ: NHLD), acted as the joint book-running managers for the offering.

A registration statement relating to the securities being sold in this offering was filed with the Securities and Exchange Commission (SEC) on May 24, 2019 and was declared effective on August 12, 2020. This press release shall not constitute an offer to sell or the solicitation of an offer to buy any of the securities described herein, nor shall there be any sale of these securities in any state or jurisdiction in which such offer, solicitation or sale would be unlawful prior to registration or qualification under the securities laws of any such state or jurisdiction. Copies of the final prospectus will be filed with the SEC and, when available, electronic copies of the final prospectus may be obtained by contacting Roth Capital Partners, LLC, 888 San Clemente, Newport Beach, CA 92660, Attention: Prospectus Department, by at (800) 678-9147, or by accessing the SEC’s website, www.sec.gov.

About Flux Power Holdings, Inc. (www.fluxpower.com)

Flux Power designs, develops, manufactures, and sells advanced rechargeable lithium-ion energy storage solutions for lift trucks and other industrial equipment including airport ground support equipment (GSE), energy storage for solar applications, and industrial robotic applications. Flux Power’s LiFT Packs, including the proprietary battery management system (BMS), provide customers with a better performing, more environmentally friendly, and lower total cost alternative, in many instances, to traditional lead acid and propane-based solutions.

This release contains projections and other "forward-looking statements" relating to Flux Power’s business, that are often identified by the use of "believes," "expects" or similar expressions. Forward-looking statements involve a number of estimates, assumptions, risks and other uncertainties that may cause actual results to be materially different from those anticipated, believed, estimated, expected, etc. Such forward-looking statements include the expected timing for completion of the offering, the development and success of new products; projected sales; Flux Power’s ability to timely obtain UL Listing for its products; Flux Power’s ability to fund its operations; distribution partnerships and business opportunities and the uncertainties of customer acceptance of current and new products; Flux Power’s ability to comply with the terms of the outstanding loans with various lenders; Flux Power’s ability to avoid disruption in its business and operations as a result of the COVID-19 pandemic, including suspension of manufacturing operations, customer demand, the length of its sales cycles, disruptions in its supply chain, lower the operating efficiencies at its facility, worker shortages and declining staff morale, and other unforeseen disruptions. Actual results could differ from those projected due to numerous factors and uncertainties. Factors that may cause such differences include, but are not limited to, uncertainties relating to: market conditions, the completion of the offering, the risk that the offering will not be consummated, the satisfaction of customary closing conditions related to the offering and the intended use of net proceeds from the offering.

Although Flux Power believes that the expectations, opinions, projections, and comments reflected in these forward-looking statements are reasonable, they can give no assurance that such statements will prove to be correct, and that the Flux Power’s actual results of ‎operations, financial condition and performance will not differ materially from the ‎results of operations, financial condition and performance reflected or implied by these forward-‎looking statements. Undue reliance should not be placed on the forward-looking statements and Investors should refer to the risk factors outlined in the Form 10-K, 10-Q and other reports filed with the Securities and Exchange Commission (SEC) and available at www.sec.gov/edgar.

These forward-looking statements are made as of the date of this news release, and Flux Power assumes no obligation to update these statements or the reasons why actual results could differ from those projected. Any disruption in the Company’s manufacturing operations would have a material adverse effect on the Company’s business and would impede the Company’s ability to manufacture and ship products to its customers in a timely manner, or at all. The effect of the COVID-19 pandemic and its associated restrictions may adversely impact many aspects of the Company’s business, including customer demand, the length of its sales cycles, disruptions in its supply chain, lower the operating efficiencies at its facility, worker shortages and declining staff morale, and other unforeseen disruptions. The demand for the Company’s products may significantly decline as COVID-19 continues to spread and as its customers suffer losses in their businesses. The supply of the Company’s raw materials and its supply chain may be disrupted and adversely impacted by the pandemic.

Flux, Flux Power and associated logos are trademarks of Flux Power Holdings, Inc. All other third party brands, products, trademarks, or registered marks are the property of and used to identify the products or services of their respective owners.

Follow us at:
Blog: Flux Power Blog
News: Flux Power News
Twitter: @FLUXpwr
LinkedIn: Flux Power


Contacts

Flux Power Media & Investor Relations:
Justin Forbes
877-505-3589
This email address is being protected from spambots. You need JavaScript enabled to view it.

TULSA, Okla.--(BUSINESS WIRE)--#CELP--Today, Cypress Environmental Partners, L.P., (NYSE: CELP) reported its financial results for the three months ended June 30, 2020.


HIGHLIGHTS

  • Net loss attributable to common unitholders of $1.3 million for the three months ended June 30, 2020.
  • Distributable cash flow (DCF) of $0.3 million for the three months ended June 30, 2020.
  • Second quarter 2020 Adjusted EBITDA of $3.1 million, an increase of 17% over first quarter 2020.
  • Second quarter 2020 Pipeline Inspection Services segment gross margin of $4.4 million, a decrease of 31% from first quarter 2020.
  • Second quarter 2020 Pipeline & Process Services segment gross margin increased 276% from first quarter 2020, and 56% from second quarter 2019, driven by increased activity levels and backlog.
  • Second quarter 2020 Water & Environmental Services segment gross margin of $0.8 million, a 17% decrease from first quarter 2020.
  • Temporarily suspended our common unit distribution to protect our balance sheet and liquidity and completed cost reductions representing over $4.5 million of annual savings.
  • Paid down debt on our credit facility and exited the second quarter with approximately $27.8 million of cash and cash equivalents.
  • Started a new service line to offer corrosion inspection services, nondestructive examination, and related support services to the municipal water and the offshore energy markets.

SECOND QUARTER 2020 SUMMARY FINANCIAL RESULTS


Three Months Ended


June 30,


2020


2019


(Unaudited)


(in thousands, except per unit amounts)


Net income

$

381

$

5,643

Net (loss) income attributable to common unitholders

$

(1,349)

$

4,333

Net (loss) income per limited partner unit - basic

$

(0.11)

$

0.36

Net (loss) income per limited partner unit - diluted

$

(0.11)

$

0.29

Adjusted EBITDA(1)

$

3,121

$

9,154

Distributable cash flow(1)

$

255

$

5,237

(1) This press release includes the following financial measures not presented in accordance with U.S. generally accepted accounting principles, or GAAP: adjusted EBITDA, adjusted EBITDA attributable to limited partners, and distributable cash flow. Each such non-GAAP financial measure is defined below under “Non-GAAP Financial Information”, and each is reconciled to its most directly comparable GAAP financial measure in schedules at the end of this press release.

CEO'S PERSPECTIVE

“The second wave of virus cases, the reinstitution of select lockdowns, and the risk of lingering high unemployment creates an uncertain economic environment that likely persists through the rest of 2020 and until a vaccine is discovered. This pandemic is adversely impacting the energy industry, demand, prices, our customers, and in turn us. Given these factors, we are preparing for potential future volatility, while also focusing on structurally reducing our cost base and implementing several strategic initiatives across our companies. As a result, we took the necessary action to temporarily suspend our common unit distributions until our operating results improve. Our primary focus continues to be the health and safety of our employees and our operations during this unprecedented and dynamic environment," said Peter C. Boylan III, chairman, president, and CEO. “Our talented team delivered better than expected second quarter performance as a result of increased activity in our Pipeline & Process Services segment, early and decisive actions focused on cost reductions, and our commitment to operational excellence and safely serving our customers. We remain confident in our ability to navigate this challenging environment while maintaining our liquidity, culture, and safely providing excellent service to our valued customers."

GROWTH UPDATE

Pipeline Inspection Services

  • A new corrosion service line has been started that is led by a National Association of Corrosion Engineers (“NACE”)-certified engineer to offer a wide range of inspection, nondestructive examination, and related services to the municipal water industry as well as to our energy customers both onshore and offshore.
  • The Pipeline Inspection segment has been aggressively pursuing organic business development (despite the work from home environment) and has successfully been awarded some new customer contracts and relationships that should benefit us in the future.

Pipeline & Process Services (“PPS”)

  • The PPS segment is having an excellent year despite the challenges with COVID; continuing to expand its backlog and considering adding some new service lines to its current offerings.

Water & Environmental Services (“W&E”)

  • Volumes have improved significantly in the Bakken despite the rig count declining to 11 rigs, down from 55 in late 2019. The previous record low during the prior downturn was 22 rigs in May 2016. Operators are slowly returning production after having choked back wells earlier this year when oil prices collapsed, instead of selling the oil at such depressed levels.
  • A new contract was recently completed with a public energy company to connect their water pipeline into one of our facilities.

COMMON UNIT DISTRIBUTIONS

On July 28, 2020, CELP announced that it has temporarily suspended common unit distributions.

CELP generated distributable cash flow of $0.3 million for the three months ended June 30, 2020. Common unit distributions were $2.6 million for the first quarter of 2020.

SECOND QUARTER 2020 OPERATING RESULTS BY BUSINESS SEGMENT

Pipeline Inspection Services (“PIS”)

PIS segment results for the three months ended June 30, 2020 and 2019 were:

  • Revenue - $43.3 million and $104.0 million, respectively.
  • Gross Margin - $4.4 million and $11.4 million, respectively.

Pipeline & Process Services (“PPS”)

PPS segment results for the three months ended June 30, 2020 and 2019 were:

  • Revenue - $7.2 million and $4.4 million, respectively.
  • Gross Margin - $2.1 million and $1.4 million, respectively.

Water & Environmental Services (“Environmental”)

Environmental segment results for the three months ended June 30, 2020 and 2019 were:

  • Revenue - $1.3 million and $2.7 million, respectively.
  • Gross Margin - $0.8 million and $2.0 million, respectively

CAPITALIZATION, LIQUIDITY, AND FINANCING

Credit Facility

CELP has a $110 million revolving credit facility. Proceeds from this facility can be used to fund working capital requirements and other general partnership purposes, including growth and acquisitions. CELP had $27.8 million of cash and cash equivalents at June 30, 2020.

  • The credit facility matures on May 28, 2021. CELP is working with the agent and lenders regarding both a renewal and the possibility of utilizing one of the new US Federal Reserve Main Street Lending facilities.
  • As of June 30, 2020, CELP had $81.7 million of debt outstanding (inclusive of finance leases). At June 30, 2020, CELP's leverage ratio was 2.3 times on a net debt basis. The effective interest rate on CELP's debt as of June 30, 2020 was 3.7%.

CAPITAL EXPENDITURES

During the six months ended June 30, 2020, CELP had growth capital expenditures totaling $1.1 million and maintenance capital expenditures totaling $0.4 million that are reflective of our business model that allows us to generate attractive free cash flow with minimal capital expenditures.

QUARTERLY REPORT

CELP filed its quarterly report on Form 10-Q for the three months ended June 30, 2020 with the Securities and Exchange Commission today. CELP will also post a copy of the Form 10-Q on its website at www.cypressenvironmental.biz. Unitholders may request a printed copy of CELP’s complete audited financial statements and annual report for the year ended December 31, 2019 free of charge by contacting CELP at the email address below.

NON-GAAP FINANCIAL INFORMATION

This press release and the accompanying financial schedules include the following non-GAAP financial measures: adjusted EBITDA, adjusted EBITDA attributable to limited partners, and distributable cash flow. The accompanying schedules provide reconciliations of these non-GAAP financial measures to their most directly comparable GAAP financial measures. CELP's non-GAAP financial measures should not be considered in isolation or as an alternative to its financial measures presented in accordance with GAAP, including revenues, net income or loss attributable to limited partners, net cash provided by or used in operating activities, or any other measure of liquidity or financial performance presented in accordance with GAAP as a measure of operating performance, liquidity, or ability to service debt obligations and make cash distributions to unitholders. The non-GAAP financial measures presented by CELP may not be comparable to similarly-titled measures of other entities because other entities may not calculate their measures in the same manner.

CELP defines adjusted EBITDA as net income or loss exclusive of (i) interest expense, (ii) depreciation, amortization, and accretion expense, (iii) income tax expense or benefit, (iv) equity-based compensation expense, (v) and certain other unusual or nonrecurring items. CELP defines adjusted EBITDA attributable to limited partners as adjusted EBITDA exclusive of amounts attributable to the general partner and to noncontrolling interests. CELP defines distributable cash flow as adjusted EBITDA attributable to limited partners less cash interest paid, cash income taxes paid, maintenance capital expenditures, and cash distributions on preferred equity. Management believes these measures provide investors meaningful insight into results from ongoing operations.

These non-GAAP financial measures are used as supplemental liquidity and performance measures by CELP's management and by external users of its financial statements, such as investors, commercial banks, research analysts, and others to assess:

  • financial performance of CELP without regard to financing methods, capital structure or historical cost basis of assets;
  • CELP's operating performance and return on capital as compared to those of other companies, without regard to financing methods or capital structure;
  • viability and performance of acquisitions and capital expenditure projects and the overall rates of return on investment opportunities; and
  • the ability of CELP's businesses to generate sufficient cash to pay interest costs, support its indebtedness, and make cash distributions to its unitholders.

ABOUT CYPRESS ENVIRONMENTAL PARTNERS, L.P.

Cypress Environmental Partners, L.P. is a master limited partnership that provides essential environmental services to the energy and municipal water industries, including pipeline & infrastructure inspection, NDE testing, various integrity services, and pipeline & process services throughout the United States. Cypress also provides environmental services to upstream energy companies and their vendors in North Dakota, including water treatment, hydrocarbon recovery, and disposal into EPA Class II injection wells to protect our groundwater. Cypress works closely with its customers to help them protect people, property, and the environment, and to assist their compliance with increasingly complex and strict rules and regulations. Cypress is headquartered in Tulsa, Oklahoma.

CAUTIONARY STATEMENTS

This press release may contain or incorporate by reference forward-looking statements as defined under the federal securities laws regarding Cypress Environmental Partners, L.P., including projections, estimates, forecasts, plans and objectives. Although management believes that expectations reflected in such forward-looking statements are reasonable, no assurance can be given that such expectations will prove to be correct. In addition, these statements are subject to certain risks, uncertainties and other assumptions that are difficult to predict and may be beyond CELP's control. If any of these risks or uncertainties materialize, or if underlying assumptions prove incorrect, CELP's actual results may vary materially from what management forecasted, anticipated, estimated, projected or expected.

The key risk factors that may have a direct bearing on CELP's results of operations and financial condition are described in detail in the "Risk Factors" section of CELP's most recently filed annual report and subsequently filed quarterly reports with the Securities and Exchange Commission. Investors are encouraged to closely consider the disclosures and risk factors contained in CELP's annual and quarterly reports filed from time to time with the Securities and Exchange Commission. The forward-looking statements contained herein speak as of the date of this announcement. CELP undertakes no obligation to publicly update or revise any forward-looking statements, whether as a result of new information, future events or otherwise, except as required by applicable securities laws. Information contained in this press release is unaudited and subject to change.


CYPRESS ENVIRONMENTAL PARTNERS, L.P.

Unaudited Condensed Consolidated Balance Sheets

As of June 30, 2020 and December 31, 2019

(in thousands)

June 30,


December 31,


2020


2019


ASSETS

Current assets:

Cash and cash equivalents

$

27,761


$

15,700


Trade accounts receivable, net


35,008


52,524


Prepaid expenses and other


1,704


988


Total current assets


64,473


69,212


Property and equipment:

Property and equipment, at cost


26,903


26,499


Less: Accumulated depreciation


15,082


13,738


Total property and equipment, net


11,821


12,761


Intangible assets, net


18,719


20,063


Goodwill


50,287


50,356


Finance lease right-of-use assets, net


749


600


Operating lease right-of-use assets


2,207


2,942


Debt issuance costs, net


532


803


Other assets


588


605


Total assets

$

149,376


$

157,342


LIABILITIES AND OWNERS' EQUITY

Current liabilities:

Accounts payable

$

3,594


$

3,529


Accounts payable - affiliates


141


1,167


Accrued payroll and other


9,813


14,850


Income taxes payable


1,385


1,092


Finance lease obligations


249


183


Operating lease obligations


421


459


Current portion of long-term debt


81,029


-


Total current liabilities


96,632


21,280


Long-term debt


-


74,929


Finance lease obligations


423


359


Operating lease obligations


1,717


2,425


Other noncurrent liabilities


169


158


Total liabilities


98,941


99,151


Owners' equity:

Partners’ capital:

Common units (12,209 and 12,068 units outstanding at

June 30, 2020 and December 31, 2019, respectively)


29,445


37,334


Preferred units (5,769 units outstanding at June 30, 2020 and December 31, 2019)


44,291


44,291


General partner


(25,876

)


(25,876

)

Accumulated other comprehensive loss


(2,368

)


(2,577

)

Total partners' capital


45,492


53,172


Noncontrolling interests


4,943


5,019


Total owners' equity


50,435


58,191


Total liabilities and owners' equity

$

149,376


$

157,342


CYPRESS ENVIRONMENTAL PARTNERS, L.P.

Unaudited Condensed Consolidated Statements of Operations

For the Three and Six Months Ended June 30, 2020 and 2019

(in thousands, except per unit data)


Three Months Ended June 30,


Six Months Ended June 30,


2020


2019


2020


2019


Revenue

$

51,688


$

111,091


$

120,171


$

201,467


Costs of services


44,307


96,284


104,835


176,637


Gross margin


7,381


14,807


15,336


24,830


Operating costs and expense:

General and administrative


4,926


6,158


10,866


12,389


Depreciation, amortization and accretion


1,211


1,109


2,419


2,213


Gain on asset disposals, net


(11

)


(2

)


(23

)


(23

)

Operating income


1,255


7,542


2,074


10,251


Other (expense) income:

Interest expense, net


(1,152

)


(1,415

)


(2,276

)


(2,726

)

Foreign currency gains (losses)


184


84


(273

)


185


Other, net


165


50


270


138


Net income (loss) before income tax expense


452


6,261


(205

)


7,848


Income tax expense


71


618


291


824


Net income (loss)


381


5,643


(496

)


7,024


Net income attributable to noncontrolling interests


697


277


609


58


Net (loss) income attributable to partners / controlling interests


(316

)


5,366


(1,105

)


6,966


Net income attributable to preferred unitholder


1,033


1,033


2,066


2,066


Net (loss) income attributable to common unitholders

$

(1,349

)

$

4,333


$

(3,171

)

$

4,900


Net (loss) income per common limited partner unit:

Basic

$

(0.11

)

$

0.36


$

(0.26

)

$

0.41


Diluted

$

(0.11

)

$

0.29


$

(0.26

)

$

0.38


Weighted average common units outstanding:

Basic


12,209


12,053


12,153


12,012


Diluted


12,209


18,218


12,153


18,163


Reconciliation of Net Income (Loss) to Adjusted EBITDA and Distributable Cash Flow


Three Months ended June 30,


Six Months ended June 30,


2020


2019


2020


2019


(in thousands)


Net income (loss)

$

381

$

5,643

$

(496

)

$

7,024

Add:

Interest expense


1,152


1,415


2,276


2,726


Depreciation, amortization and accretion


1,447


1,388


2,927


2,764


Income tax expense


71


618


291


824


Equity-based compensation


254


174


518


443


Foreign currency losses


-


-


273


-


Less:

Foreign currency gains


184


84


-


185


Adjusted EBITDA

$

3,121


$

9,154


$

5,789


$

13,596


Adjusted EBITDA attributable to noncontrolling interests


844


420


906


331


Adjusted EBITDA attributable to limited partners / controlling interests

$

2,277


$

8,734


$

4,883


$

13,265


Less:

Preferred unit distributions


1,033


1,033


2,066


2,066


Cash interest paid, cash taxes paid, and maintenance capital expenditures


attributable to limited partners


989


2,464


2,194


3,682


Distributable cash flow

$

255


$

5,237


$

623


$

7,517


Reconciliation of Net (Loss) Income Attributable to Limited Partners to Adjusted

EBITDA Attributable to Limited Partners and Distributable Cash Flow

Three Months ended June 30,


Six Months ended June 30,


2020


2019


2020


2019


(in thousands)


Net (loss) income attributable to limited partners

$

(316

)

$

5,366

$

(1,105

)

$

6,966


Add:

Interest expense attributable to limited partners


1,152


1,415


2,276


2,726


Depreciation, amortization and accretion attributable to limited partners


1,318


1,255


2,653


2,504


Income tax expense attributable to limited partners


53


608


268


811


Equity based compensation attributable to limited partners


254


174


518


443


Foreign currency losses attributable to limited partners


-


-


273


-


Less:

Foreign currency gains attributable to limited partners


184


84


-


185


Adjusted EBITDA attributable to limited partners


2,277


8,734


4,883


13,265


Less:

Preferred unit distributions


1,033


1,033


2,066


2,066


Cash interest paid, cash taxes paid, and maintenance capital expenditures

attributable to limited partners


989


2,464


2,194


3,682


Distributable cash flow

$

255


$

5,237


$

623


$

7,517


Reconciliation of Net Cash Flows Provided by (Used In) Operating

Activities to Adjusted EBITDA and Distributable Cash Flow

Six Months ended June 30,


2020


2019


(in thousands)


Cash flows provided by (used in) operating activities

$

15,432


$

(9,040

)

Changes in trade accounts receivable, net


(17,516

)


25,595


Changes in prepaid expenses and other


734


(128

)

Changes in accounts payable and accrued liabilities


5,152


(6,358

)

Change in income taxes payable


(292

)


252


Interest expense (excluding non-cash interest)


1,987


2,465


Income tax expense (excluding deferred tax benefit)


291


824


Other


1


(14

)

Adjusted EBITDA

$

5,789


$

13,596


Adjusted EBITDA attributable to noncontrolling interests


906


331


Adjusted EBITDA attributable to limited partners / controlling interests

$

4,883


$

13,265


Less:

Preferred unit distributions


2,066


2,066


Cash interest paid, cash taxes paid, and maintenance capital expenditures

attributable to limited partners


2,194


3,682


Distributable cash flow

$

623


$

7,517


Operating Data

Three Months


Six Months

Ended June 30,


Ended June 30,


2020


2019


2020


2019


Total barrels of water processed (in thousands)


1,769


3,518


4,091


6,333


Average revenue per barrel

$

0.72


$

0.77


$

0.72


$

0.77


Environmental Services gross margins


66.3

%


74.3

%


63.5

%


69.8

%

Average number of inspectors


700


1,673


858


1,553


Average number of U.S. inspectors


700


1,669


858


1,545


Average revenue per inspector per week

$

4,754


$

4,782


$

4,830


$

4,737


Pipeline Inspection Services gross margins


10.2

%


11.0

%


10.1

%


10.4

%

Average number of field personnel


27


29


27


28


Average revenue per field personnel per week

$

20,379


$

11,621


$

14,431


$

8,778


Pipeline & Pipeline Services gross margins


29.5

%


30.9

%


26.5

%


25.3

%

Capital expenditures including finance lease payments (in thousands)

$

357


$

708


$

1,497


$

1,061


Common unit distributions (in thousands)

$

-


$

2,531


$

2,564


$

5,062


Preferred unit distributions (in thousands)

$

1,033


$

1,033


$

2,066


$

2,066


Net debt leverage ratio

2.28x

2.85x

2.28x

2.85x


Contacts

Investors or Analysts:
Contact: Cypress Environmental Partners, L.P. - Jeff Herbers – Vice President & Chief Financial Officer
This email address is being protected from spambots. You need JavaScript enabled to view it. or 918-947-5730

Offshore Source Logo

Offshore Source keeps you updated with relevant information concerning the Offshore Energy Sector.

Any views or opinions represented on this website belong solely to the author and do not represent those of the people, institutions or organizations that Offshore Source or collaborators may or may not have been associated with in a professional or personal capacity, unless explicitly stated.

Corporate Offices

Technology Systems Corporation
8502 SW Kansas Ave
Stuart, FL 34997

info@tscpublishing.com