Business Wire News

New family of products includes the Splitvolt Splitter Switch that eliminates electrician installation costs and complexity for EV owners

SANTA CLARA, Calif.--(BUSINESS WIRE)--#EV--Splitvolt announces a new family of products to Empower Electric Vehicle (EV) Adoption™ and address the major market shift now underway. These first products help new and existing EV owners save thousands of dollars and make fast home charging easier by avoiding the installation of a dedicated circuit. The Splitvolt product line includes the Splitvolt Splitter Switch, as well as high-performance portable EV chargers and other accessories. These include 240V extension cables and plug adapters, which cost-effectively provide the fastest possible, safe-charging rates allowed by the U.S. National Electrical Code (NEC).


The Splitvolt Splitter Switch solves charging challenges by intelligently sharing power of an existing dryer circuit with the EV charger. Intelligent switching and prioritization allow users to charge their cars as they automatically and transparently share power with their dryer or another appliance on an existing circuit when not actively in use. It also includes critical safety and power usage reporting features.

After a recent preview of its innovative technology by a group of judges, the company won gold in the 10th Annual Consumer World Awards, the Consumer Electronics category. Judges from a broad spectrum of industry voices from around the world participated, and their average scores determined the 2020 award winners.

“Home charging is the most convenient and cost-effective way to power vehicles,” said Daniel Liddle, founder and CEO of Splitvolt. “Who doesn’t want to pay less and wake up every morning with a full ‘tank’ range of 300-500 miles? The trouble is, with new battery capacities, standard 110V wall plugs charge at only three miles per hour, which is way too slow. Today’s EVs need the faster 21m.p.h. (+) charging rates you get using 240V circuits. However, installing a dedicated EV charging circuit is complicated and can cost up to $900 for installation by an electrician. It can also be potentially thousands of dollars more for a utility company to add power to a home. The plug-and-play Splitter Switch solves this dilemma by sharing an existing 220-240V dryer socket and automatically switching full-power between the EV charger and the dryer--without any intervention required. Just plug in your dryer and EV charger, and you have fast charging!”

Splitvolt solutions follow the NEC standards for home charging power safety. For added peace of mind, the Splitter Switch uses high-quality components, displays real-time power information and includes an internal power breaker for overcurrent, overvoltage and overheating protection. The solution works with common U.S. EVs and dryer models, as well as Splitvolt and third-party EV chargers.

PRICING AND SPECIAL DISCOUNT

To get the Splitvolt Splitter Switch, visit the Indiegogo campaign page to register and get a 33-percent discount (total price of $299) for first-come-first-served limited quantities.

Splitvolt portable EV fast home chargers and accessories are available for purchase now at www.splitvolt.com/shop and at Amazon at a special launch discount. Maximum performance chargers for common 30 and 50 amp 220-240V circuits are now available at a special discounted launch price of $284.99 and $314.99. Flexible, convenient extension cables and adapters are priced from $29.99 to $124.99.

About Splitvolt

Led by an executive team with extensive enterprise and consumer tech experience at public and private companies, Splitvolt is doing its part for climate change by addressing a distinct pain point affecting the adoption of electric vehicles: simple and inexpensive power access for fast home charging. The award-winning Splitvolt Splitter Switch provides 240V power access by intelligently sharing power using existing dryer sockets, without any rewiring or electrician fees. The Splitvolt family of EV chargers and extension cable accessories also provide the fastest possible NEC-safe charging rates at industry-leading price points. To find out more, visit www.splitvolt.com or follow us on Facebook, Instagram, Twitter and YouTube.


Contacts

Georgiana Comsa
Silicon Valley PR
This email address is being protected from spambots. You need JavaScript enabled to view it.
650-800-7084
 
Daniel Liddle
Splitvolt, Inc.
This email address is being protected from spambots. You need JavaScript enabled to view it.
650-209-0091

DUBLIN--(BUSINESS WIRE)--The "Energy and Utility Analytics Market Forecast to 2027 - COVID-19 Impact and Global Analysis by Type, By Deployment Model, By Application, and By Verticals" report has been added to ResearchAndMarkets.com's offering.


The market was valued at US$ 2,672.5 million in 2019 and is projected to reach US$ 6,971.2 million by 2027; it is expected to grow at a CAGR of 13.4% from 2020 to 2027.

The financial outcomes of oil and gas companies depend upon the performance of complex, capital-intensive process facilities, to a large extent. However, until very recently, these companies have not had the tools or the capabilities needed to operate these assets at their maximum capacity.

The oil and gas industry had to manage risks on many fronts, and the assets employed were expensive and capital intensive. To mitigate these risks, they have begun implementing cloud-based data analytics systems. The reliability, responsiveness, and security conferred by cloud-based computing have been, therefore, driving the demand for cloud-based analytics solutions, which, in turn, boosts the growth of the energy and utility analytics market.

Impact of COVID-19 Pandemic on Energy and Utility Analytics Market

According to the World Health Organization (WHO), the US, India, Brazil, Russia, Peru, Columbia, South Africa, and Mexico are a few of the worst-affected countries due to the COVID-19 pandemic. The pandemic is affecting the industries worldwide; the global economy is on the verge of taking the worst hit in 2020, and the impact is likely to continue in 2021 as well. The outbreak has created significant disruptions in energy and utility sector.

Atos SE; BUILDINGIQ, INC.; CAPGEMINI SE; IBM Corporation; Infosys Ltd.; Oracle Corporation; SAP SE; SAS Institute Inc.; WegoWise, Inc.; and Wipro Limited are among the few major companies operating in the energy and utility analytics market.

Key Topics Covered:

1. Introduction

1.1 Study Scope

1.2 Report Guidance

1.3 Market Segmentation

2. Key Takeaways

3. Research Methodology

4. Energy and Utility Analytics Market Landscape

4.1 Market Overview

4.2 PEST Analysis

4.3 Ecosystem Analysis

4.4 Expert Opinion

5. Energy and Utility Analytics -Market Dynamics

5.1 Key Market Drivers

5.1.1 Advanced decision making capabilities offered by Analytics solutions

5.1.2 Enhanced customer service capabilities

5.1.3 Increasingly complicating oil & gas industry to drive the demand for robust analytical solutions

5.2 Key Market Restraint

5.2.1 High capital expenditure value

5.3 Key Market Opportunity

5.3.1 Increasing infrastructure development and smart cities

5.4 Future Trend

5.4.1 Data sharing will be a widespread trend

5.5 Impact Analysis of Drivers and Restraints

6. Energy and Utility Analytics Market - Global Analysis

6.1 Global Energy and Utility Analytics Market Overview

6.2 Energy and Utility Analytics Market - Revenue and Forecast to 2027 (US$ Million)

6.3 Market Positioning - Five Key Players

7. Energy and Utility Analytics Market Analysis - By Type

7.1 Overview

7.2 Energy and Utility Analytics Market Breakdown, by Type, 2019 & 2027

7.3 Software

7.3.1 Overview

7.3.2 Software Market Revenue and Forecast to 2027 (US$ Million)

7.4 Service

7.4.1 Overview

7.4.2 Service Market Revenue and Forecast to 2027 (US$ Million)

7.4.2.1 Professional Service

7.4.2.2 Managed Service

8. Energy and Utility Analytics Market Analysis - By Deployment Model

8.1 Overview

8.2 Energy and Utility Analytics Market Breakdown, by Deployment Model, 2019 & 2027

8.3 On-Premise

8.3.1 Overview

8.3.2 On-Premise Market Revenue and Forecast to 2027 (US$ Million)

8.4 Cloud

8.5 Hybrid

9. Energy and Utility Analytics Market Analysis - By Application

9.1 Overview

9.2 Energy and Utility Analytics Market Breakdown, by Application, 2019 & 2027

9.3 Load Forecasting

9.3.1 Overview

9.3.2 Load Forecasting Market Revenue and Forecast to 2027 (US$ Million)

9.4 Customer Analytics

9.5 Grid Analytics

9.6 Asset Management

9.7 Smart Meter Analytics

9.8 Others

10. Energy and Utility Analytics Market Analysis - By Vertical

10.1 Overview

10.2 Energy and Utility Analytics Market Breakdown, by Vertical, 2019 & 2027

10.3 Oil and Gas

10.3.1 Overview

10.3.2 Oil and Gas Forecasting Market Revenue and Forecast to 2027 (US$ Million)

10.4 Renewable Energy

10.5 Nuclear Power

10.6 Electricity

10.7 Water

10.8 Others

11. Energy and Utility Analytics Market - Geographic Analysis

12. Energy and Utility Analytics Market- COVID-19 Impact Analysis

13. Industry Landscape

13.1 Overview

13.2 Market Initiative

13.3 New Product Development

13.4 Merger and Acquisition

14. Company Profiles

14.1 Key Facts

14.2 Business Description

14.3 Products and Services

14.4 Financial Overview

14.5 SWOT Analysis

14.6 Key Developments

  • Atos SE
  • BUILDINGIQ, INC.
  • CAPGEMINI SE
  • IBM Corporation
  • Infosys Ltd.
  • Oracle Corporation
  • SAP SE
  • SAS Institute Inc.
  • WegoWise, Inc.
  • Wipro Limited

For more information about this report visit https://www.researchandmarkets.com/r/vhq2kn


Contacts

ResearchAndMarkets.com
Laura Wood, Senior Press Manager
This email address is being protected from spambots. You need JavaScript enabled to view it.

For E.S.T Office Hours Call 1-917-300-0470
For U.S./CAN Toll Free Call 1-800-526-8630
For GMT Office Hours Call +353-1-416-8900

Milestone safety achievement highlights UPA’s work on SoCalGas project

GREENVILLE, S.C.--(BUSINESS WIRE)--#UPA--Utility Partners of America (UPA), a leading provider of project management, construction management, operations, maintenance and professional services for utilities and energy cooperatives throughout the country, announced today a significant safety milestone on one of its long-standing projects.


After beginning operations of an eight-acre pipe and related materials yard for Southern California Gas Co. (SoCalGas) in 2015, UPA has eclipsed 200,000 man-hours on the Bakersfield, California-based project with zero accidents, lost-time events or recordable injuries. A subsidiary of Sempra Energy, SoCalGas recently extended its contract with UPA through the end of 2022.

"SoCalGas has been an amazing partner to work with,” said Ed Schwalbach, UPA’s program lead on the project. “We have a great team in Bakersfield committed to quality and safety, along with an excellent working relationship, mutually aligned goals and effective communication between key stakeholders. Achieving this safety milestone is another example of our joint success and commitment to making safety and safe work practices our top priority. We want to work hard and earn our valued customer’s business every day.”

UPA’s work with SoCalGas in Bakersfield is in support of its Pipeline Safety Enhancement Plan (PSEP) Program. This scope comes on the heels of a previous engagement in which UPA was responsible for project management and support. The success of that partnership, paired with UPA’s reputation for service and focus on safety and transparency, helped to form this new project relationship with SoCalGas when they were seeking a reliable partner.

Since taking on the Bakersfield project five years ago, UPA’s involvement has continued to grow.

What started as an eight-acre operation has evolved to 26 acres, including three warehouses that offer bulk and racked storage. UPA receives and sends more than 200 shipments of material from this facility each month. UPA is confident this project and scope of work will continue to expand.

In addition to overseeing storage and shipping, UPA facilitated the leasing of a facility and currently provides quality control, testing, inventory management and transportation services to SoCalGas.

The Bakersfield safety milestone of 200,000 man-hours with no lost-time events or recordable injuries represents nearly 100 man-years of work without incident, an impressive feat that serves as a testament to UPA’s and SoCalGas’ commitment to safety and excellence.

“UPA has been an outstanding collaborative partner throughout the years, and we are more than proud to see their continued commitment to safety and excellence,” said Jason Simonek, inventory management team lead at SoCalGas. “Here at SoCalGas, we greatly prioritize safety and safe working practices. We look forward to continuing working with UPA to achieve greater milestones in the future.”

For more information on UPA and how the company partners with utilities and energy co-ops to build, inspect, maintain and upgrade the nation’s utility infrastructure, visit UtilityPartners.com.


Contacts

Josh Hall, Sage & Sterling Communications
Phone: 813-884-9333
Email: This email address is being protected from spambots. You need JavaScript enabled to view it.

ORANGE, Conn.--(BUSINESS WIRE)--AVANGRID, Inc. (NYSE: AGR), a leading sustainable energy company, announced today the appointment of Kim Harriman to the role of Vice President, State Government and Public Affairs. In this role, Harriman will be responsible for developing and leading state public policy strategy for the Company and coordinating design of the Company’s policy positions and strategies to support business objectives and drive favorable policy and regulatory outcomes.

“As we work with states to help meet aggressive climate goals and build the grid of the future, Kim will play an important role in enabling AVANGRID and our operating companies to be the leader in the energy transition,” said Deputy CEO and President of AVANGRID, Robert Kump. “Kim’s extensive public policy and government affairs experience in the energy sector will be an asset to AVANGRID as we pursue our ESG+F objectives by embracing and developing innovative energy solutions to transform and enhance the economic, social and environmental value we deliver to our customers, employees, partners and shareholders.”

Prior to joining AVANGRID, Harriman served as Senior Vice President for Public and Regulatory Affairs at the New York Power Authority (NYPA). At NYPA she led advocacy before the New York Public Service Commission and the New York Independent System Operator, and managed local and state elected affairs and community engagement for NYPA and the New York State Canal Corporation, a subsidiary of NYPA. Prior to NYPA, Harriman held key leadership roles at the New York Public Service Commission focusing on key energy policy initiatives and legislative engagement. She also served as Senior Counsel to the Moreland Commission on Utility Storm Preparation and Response for Governor Cuomo, and she continued to advise the administration on utility storm response matters after joining NYPA.

Harriman’s appointment is effective December 14. She will report to Kump.

About AVANGRID: AVANGRID, Inc. (NYSE: AGR) is a leading, sustainable energy company with approximately $36 billion in assets and operations in 24 U.S. states. With headquarters in Orange, Connecticut, AVANGRID has two primary lines of business: Avangrid Networks and Avangrid Renewables. Avangrid Networks owns eight electric and natural gas utilities, serving more than 3.3 million customers in New York and New England. Avangrid Renewables owns and operates a portfolio of renewable energy generation facilities across the United States. AVANGRID employs approximately 6,600 people. AVANGRID supports the U.N.’s Sustainable Development Goals and was named among the World’s Most Ethical Companies in 2019 and 2020 by the Ethisphere Institute. For more information, visit www.avangrid.com.


Contacts

Athena Hernandez
This email address is being protected from spambots. You need JavaScript enabled to view it.

TRINITY, Ala.--(BUSINESS WIRE)--Progressive Pipe Fabricators, a division of Shambaugh & Son L.P., celebrated the grand opening of their new Trinity, Alabama facility with a ribbon-cutting event that attracted a number of high-profile attendees from the State of Alabama and the National Fire Sprinkler Association (NFSA). Shambaugh is currently the largest MEP construction services contractor in Indiana and ranked the third largest specialty contractor in the United States.


The new 82,000-square-foot fabrication facility, which has been under construction since January, will fabricate and deliver more than 20,000 individual sprinklers per week, and has the capacity to ship more than 1-million pounds of fabricated sprinkler pipe per week.

“We couldn’t be more excited about this new facility,” said Rob Vincent, Shambaugh’s chief operating officer, fire protection. “By expanding our fabrication capabilities throughout the United States, our new shop will now serve a much larger geographic area. What’s even more exciting is that while we’re expanding our reach, we’re simultaneously bolstering our sustainability efforts by reducing fuel consumption and improving speed to market.”

With the opening of this new facility, Progressive Pipe Fabricators has also created 60 new jobs in Lawrence County.

“Being able to support the local community as an employer is something that makes all of us at Progress Pipe Fabricators extremely proud,” said Vincent. “I’m happy to report that with support from the State of Alabama Department of Commerce AIDT Division, we’ve successfully filled nearly all of those jobs.”

The new facility is located at 2060 Cooperage Way, Trinity, AL 35673.


Contacts

Progressive Pipe Fabricators
Rob Vincent
This email address is being protected from spambots. You need JavaScript enabled to view it.
260.487.7873

COLUMBIA, Md.--(BUSINESS WIRE)--GSE Systems, Inc. (“GSE Solutions”, “GSE” or “the Company”) (Nasdaq: GVP), a leader in delivering and supporting end-to-end training, engineering, compliance, simulation and workforce solutions to the power industry, announced today its financial results for the three months ended September 30, 2020 (“Q3 2020”).


Q3 2020 Financial Overview

  • Revenue of $12.9 million, compared to $20.0 million in Q3 2019
  • Gross profit of $3.3 million, compared to $4.7 million in Q3 2019
  • Net loss of $0.7 million or $(0.03) per basic and diluted share in Q3 2020, compared to a net loss of $1.2 million, or $(0.06) per basic and diluted share in Q3 2019
  • Adjusted net loss1 of $ 1.0 million, or $(0.05) adjusted loss per share in Q3 2020 , compared to adjusted net income of $0.6 million or $0.03 adjusted earnings per diluted share, in Q3 2019
  • Adjusted EBITDA1 of $(0.6) million in Q3 2020, compared to $1.4 million in Q3 2019
  • Cash flow provided by operations of $1.6 million during the nine months ended September 30, 2020, compared to cash used during the nine months ended September 30, 2019 of $0.3 million
  • New orders of $10.9 million during Q3 2020, compared to new orders of $19.0 million in Q3 2019
  • Repaid $9.9 million of outstanding long-term debt obligations during Q3 2020

At September 30, 2020

  • Cash and cash equivalents of $7.7 million
  • Total indebtedness of $13.6 million
  • Working capital of $2.4 million and current ratio of 1.1x
  • Backlog of $44.6 million

1 Refer to the non-GAAP reconciliation tables at the end of this press release for a definition of "EBITDA", “adjusted EBITDA” and “adjusted net income”.

Kyle J. Loudermilk, GSE’s President and Chief Executive Officer, said, “In the third quarter of 2020, industrywide RFP delays and project suspensions due to the COVID-19 pandemic continued to dampen our financial results. In this challenging environment, we remained focused on cost containment and debt repayment, while positioning GSE for success as industry demand for our services returns to normalized levels. Of note, during the quarter we repaid nearly $10 million of long-term debt and strengthened our leadership team with the appointment of Brian Greene as Vice President of our NITC business. Brian’s proven track record in staffing spans 15+ years and he already has reenergized our NITC group. Finally, our Performance segment continues to win a steady flow of fundamental engineering and simulation projects, and we remained focused on organic growth opportunities through cross selling and upselling GSE’s full range of products and services. Our services are essential to the nuclear industry, which plays a critical role in the decarbonization of energy.”

Q3 2020 FINANCIAL RESULTS

Q3 2020 revenue of $12.9 million, a decrease of $7.1 million, from $20.0 million in Q3 2019.

Three months ended


Nine months ended

(in thousands)

September 30, 2020


September 30, 2019


September 30, 2020


September 30, 2019

Revenue:


Performance

$

7,257

$

11,417

$

25,240

$

36,617

NITC


5,665


8,614


19,727


29,066

Total revenue

$

12,922

$

20,031

$

44,967

$

65,683

Performance revenue decreased to $7.3 million in Q3 2020, from $11.4 million in Q3 2019. The decrease was mainly due to delays in beginning new contracts, a reduction of DP Engineering revenue due to a customer incident in the prior year and major project completions during the third quarter of 2019. We recorded total Performance orders of $9.3 million and $10.7 million for Q3 2020 and Q3 2019, respectively.

NITC revenue decreased to $5.7 million in Q3 2020 from $8.6 million in Q3 2019. The decrease in revenue was largely due to lower staffing needs during the quarter, due primarily to the COVID-19 pandemic, contributing to lower demand for staff augmentation. NITC orders were $1.6 million and $8.3 million for Q3 2020 and Q3 2019, respectively.

Q3 2020 gross profit was $3.3 million or 25.7% of revenue, compared to $4.7 million or 23.3% of revenue, in Q3 2019.

Three months ended


Nine months ended

September 30, 2020

September 30, 2019

September 30, 2020

September 30, 2019

(in thousands)

$


%


$


%


$


%


$


%

Gross profit:


Performance

$

2,482


34.2%


$

3,548


31.1%


$

8,240


32.6%


$

11,787


32.2%

NITC


837

14.8%


1,125

13.1%


2,756

14.0%


3,489

12.0%

Consolidated gross profit

$

3,319

25.7%

$

4,673

23.3%

$

10,996

24.5%

$

15,276

23.3%

The decrease in our gross profit of $1.4 million was primarily driven by a decrease in Performance and NITC revenue during the nine months ended September 30, 2020, as well as completion of higher margin projects in our True North and DP Engineering subsidiaries during 2019.

Selling, general and administrative expenses in Q3 2020 totaled $2.9 million or 22.3% of revenue, compared to $3.5 million or 17.3% of revenue, in Q3 2019. The decrease in SG&A during Q3 2020 over Q3 2019 was due primarily to the net gain on legal settlement of $1.0 million in the current year with no similar activity in the prior year; this credit in SG&A is offset by an increase in business development expenses during the current fiscal year for two of our consolidated subsidiaries.

Net loss for Q3 2020 totaled $0.7 million or $(0.03) per basic and diluted share, compared to a net loss of $1.2 million or $(0.06) per basic and diluted share, in Q3 2019.

Adjusted net loss totaled $1.0 million or $(0.05) adjusted loss per diluted share in Q3 2020 compared to adjusted net income of $0.6 million, or $0.03 adjusted earnings per diluted share, in Q3 2019.

Earnings before interest, taxes, depreciation and amortization ("EBITDA") for Q3 2020 was approximately $0.2 million, compared to $0.4 million in Q3 2019.

Adjusted EBITDA ("AEBITDA") totaled $(0.6) million in Q3 2020, compared to $1.4 million in Q3 2019.

BACKLOG AND CASH POSITION

Backlog at September 30, 2020 was $44.6 million, compared to $52.7 million at December 31, 2019. Backlog at September 30, 2020 included $33.2 million of Performance backlog and $11.4 million of NITC backlog. Performance backlog decreased by $4 million primarily due to 2019 backlog that was converted to revenues during 2020 and has only been partially replaced by new orders.

Our cash position was $7.7 million at September 30, 2020, compared to $11.7 million at December 31, 2019. The decrease of $4 million during the nine months ended September 31, 2020 in our cash and cash equivalents was primarily due to payments on long-term debt of $18.5 million, offset by proceeds from the Paycheck Protection Program of $10 million and draws on our revolving line of credit, net of repayments of $3.5 million.

CONFERENCE CALL

Management will host a conference call today at 4:30 pm Eastern Time to discuss Q3 2020 results as well as other matters.

Interested parties may participate in the call by dialing:
(877) 407-9753 (Domestic)
(201) 493-6739 (International)

The conference call will also be accessible via the following link: https://78449.themediaframe.com/dataconf/productusers/gvp/mediaframe/41905/indexl.html

For those who cannot listen to the live broadcast, an online webcast replay will be available www.gses.com or the following link: https://78449.themediaframe.com/dataconf/productusers/gvp/mediaframe/41905/indexl.html.

ABOUT GSE SOLUTIONS

We are the future of operational excellence in the power industry. As a collective group, GSE Solutions leverages top skills, expertise, and technology to provide highly specialized solutions that enable customers to achieve the performance they envision. Our experts deliver and support end-to-end training, engineering, compliance, simulation, and workforce solutions that help the power industry reduce risk and optimize plant operations. GSE is a proven solution provider, with more than four decades of industry experience and more than 1,100 installations serving hundreds of customers in over 50 countries spanning the globe. www.gses.com

FORWARD LOOKING STATEMENTS

We make statements in this press release that are considered forward-looking statements within the meaning of Section 27A of the Securities Act of 1933, as amended, and Section 21E of the Securities Exchange Act of 1934. These statements reflect our current expectations concerning future events and results. We use words such as “expect,” “intend,” “believe,” “may,” “will,” “should,” “could,” “anticipates,” and similar expressions to identify forward-looking statements, but their absence does not mean a statement is not forward-looking. These statements are not guarantees of our future performance and are subject to risks, uncertainties and other important factors that could cause our actual performance or achievements to be materially different from those we project. For a full discussion of these risks, uncertainties and factors, we encourage you to read our documents on file with the Securities and Exchange Commission, including those set forth in our periodic reports under the forward-looking statements and risk factors sections. We do not intend to update or revise any forward-looking statements, whether as a result of new information, future events or otherwise.


GSE SYSTEMS, INC. AND SUBSIDIARIES

Condensed Consolidated Statements of Operations

(in thousands, except share and per share data)

(unaudited)


Three months ended


Nine months ended

September 30, 2020

September 30, 2019


September 30, 2020


September 30, 2019


Revenue

$

12,922

$

20,031


$

44,967


$

65,683

Cost of revenue

9,603

15,358


33,971


50,407

Gross profit

3,319

4,673


10,996


15,276

Operating expenses:


Selling, general and administrative

2,878

3,465


12,548


12,231

Research and development

137

130


526


526

Restructuring charges

185

740


195


742

Loss on impairment

-

-


4,302


5,464

Depreciation

76

107


254


300

Amortization of intangible assets

414

596


1,528


1,804

Total operating expenses

3,690

5,038


19,353


21,067


Operating loss

(371)

(365)


(8,357)


(5,791)


Interest expense, net

(128)

(288)


(556)


(812)

Gain (loss) on derivative instruments, net

31

(61)


35


(69)

Other (expense) income, net

(77)

59


(24)


62

Loss before income taxes

(545)

(655)


(8,902)


(6,610)

Provision for (benefit from) income taxes

116

568


166


(874)

Net loss

$

(661)

$

(1,223)


$

(9,068)


$

(5,736)


Net loss per common share - basic and diluted

$

(0.03)

$

(0.06)


$

(0.44)


$

(0.29)


Weighted average shares outstanding used to compute net loss per share - basic and diluted

20,563,452

20,007,469


20,438,571


20,021,829 


GSE SYSTEMS, INC AND SUBSIDIARIES

Selected Balance Sheet Data

(in thousands)


(unaudited)

(audited)


September 30, 2020

December 31, 2019


Cash and cash equivalents

$

7,660

$

11,691


Current assets

$

20,520

$

30,778

Noncurrent assets


21,097

27,731

Total assets

$

41,617

$

58,509


Current liabilities

$

18,135

$

34,434

Noncurrent liabilities


12,047

3,956

Stockholders' equity


11,435

20,119

Total liabilities and shareholders’ equity

$

41,617

$

58,509


EBITDA and Adjusted EBITDA Reconciliation (in thousands)

References to “EBITDA” means Net Income (Loss), before taking into account interest income and expense, provision for income taxes, depreciation and amortization. References to Adjusted EBITDA ("AEBITDA") exclude the impact on our net loss due to any impairment of our intangibles, gain from the change in fair value of contingent consideration, restructuring charges, stock-based compensation expense, impact of the change in fair value of derivative instruments, provision for legal settlements and acquisition-related expenses. EBITDA and Adjusted EBITDA are not measures of financial performance under generally accepted accounting principles (GAAP). Management believes EBITDA and Adjusted EBITDA, in addition to operating profit, net income and other GAAP measures, are useful to investors to evaluate the Company’s results because it excludes certain items that are not directly related to the Company’s core operating performance that may, or could, have a disproportionate positive or negative impact on our results for any particular period. Investors should recognize that EBITDA and AEBITDA might not be comparable to similarly-titled measures of other companies. This measure should be considered in addition to, and not as a substitute for or superior to, any measure of performance prepared in accordance with GAAP. A reconciliation of non-GAAP EBITDA and AEBITDA to the most directly comparable GAAP measure in accordance with SEC Regulation G follows:

Three months ended


Nine months ended

September 30, 2020

September 30, 2019


September 30, 2020

September 30, 2019

Net loss

$

(661)

$

(1,223)


$

(9,068)

$

(5,736)

Interest expense, net

128

288


556

812

Provision for (benefit from) income taxes

116

568


166

(874)

Depreciation and amortization

579

768


2,030


2,397

EBITDA

162

401


(6,316)

(3,401)

Gain on legal settlement, net

(952)

-


(91)

-

Loss on impairment

-

-


4,302

5,464

Impact of the change in fair value of contingent consideration

-

-


-

(1,200)

Restructuring charges

185

740


195

742

Stock-based compensation expense

33

114


357

1,150

(Gain) loss on derivative instruments

(31)

61


(35)

69

Acquisition-related expenses

3

116


191

744

Adjusted EBITDA

$

(600)

$

1,432


$

(1,397)

$

3,568


Adjusted Net (Loss) Income and Adjusted EPS Reconciliation (in thousands, except per share amounts)

References to Adjusted Net (Loss) Income exclude the impact of gain from the change in fair value of contingent consideration, loss on impairment of our intangibles, restructuring charges, stock-based compensation expense, change in fair value of derivative instruments, acquisition-related expense, acquisition-related legal settlement, amortization of intangible assets and the income tax expense impact of any such adjustments. Adjusted Net Income and adjusted earnings per share (adjusted EPS) are not measures of financial performance under generally accepted accounting principles (GAAP). Management believes adjusted net income and adjusted EPS, in addition to other GAAP measures, are useful to investors to evaluate the Company’s results because they exclude certain items that are not directly related to the Company’s core operating performance and non-cash items that may, or could, have a disproportionate positive or negative impact on our results for any particular period. These measures should be considered in addition to, and not as a substitute for or superior to, any measure of performance prepared in accordance with GAAP. A reconciliation of non-GAAP adjusted net income and adjusted EPS to GAAP net income, the most directly comparable GAAP financial measure, is as follows:

(in thousands)

Three months ended

Nine months ended

September 30, 2020

September 30, 2019

September 30, 2020


September 30, 2019


Net loss

$

(661)

$

(1,223)

$

(9,068)

$

(5,736)

Gain legal settlement, net

(952)

-

(91)

-

Loss on impairment

-

-

4,302

5,464

Impact of the change in fair value of contingent consideration

-

-

-

(1,200)

Restructuring charges

185

740

195

742

Stock-based compensation expense

33

114

357

1,150

(Gain) loss on derivative instruments, net

(31)

61

(35)

69

Acquisition-related expense

3

116

191

744

Amortization of intangible assets

414

596

1,528

1,804

Income tax expense impact of adjustments

-

186

-

(1,761)

Adjusted net (loss) income

$

(1,009)

$

590

$

(2,621)

$

1,276


Adjusted (loss) earnings per common share – diluted

$

(0.05)

$

0.03

$

(0.13)

$

0.06


Weighted average shares outstanding - diluted(1)

20,563,452

20,586,145


20,438,571


20,418,960


(1) During the three and nine months ended September 30, 2020, we reported a GAAP net loss and an adjusted net loss. Accordingly, there were 66,261 and 12,172 dilutive shares from RSUs that were excluded from the adjusted net loss per common share.


(1) During the three and nine months ended September 30, 2019, we reported a GAAP net loss and an adjusted net income. Accordingly, there were 578,676 and 397,131 dilutive shares from RSUs included in the adjusted earnings per share calculation that were considered anti-dilutive when calculating the net loss per share.


Contacts

Company Contact
Kyle Loudermilk
Chief Executive Officer
GSE Systems, Inc.
(410) 970-7800

The Equity Group Inc.
Kalle Ahl, CFA
(212) 836-9614
This email address is being protected from spambots. You need JavaScript enabled to view it.

Market-Leading KloudGin AI Cloud Software Integrates Real-time Location Mapping That Streamlines Asset Management and Mobile Field Service Operations

SANTA CLARA, Calif.--(BUSINESS WIRE)--#esri--KloudGin, the leading provider of AI cloud-based field service and asset management solutions, today announced that it has become a Silver Partner of Esri, the global leader in location intelligence. The Silver Partnership will provide KloudGin with the ability to deliver real-time location and mapping data information to its customers for their asset management and mobile workforce management (MWM) operations.


KloudGin customers will now have the ability to tightly integrate their mapping technology, simplify workflows and increase process efficiency across broad geographic areas. KloudGin’s services connect customers, employees, and assets with AI powered access to information on any device and stay abreast of changing technological advancements in geographic information systems (GIS).

KloudGin and Esri will also collaborate on joint offerings in the energy transmission and distribution, renewables, oil and gas, telecom, water/wastewater, and manufacturing markets for organizations with assets and customers dispersed over wide geographic areas. KloudGin will now offer an expansive set of contextual tools and capabilities to perform integrated map-based workflows such as work creation, recording assets onto existing work orders, identifying trouble locations by dropping pins and associating them to work orders. Users can also view as-built drawings, work history, asset status, thematic maps and much more.

KloudGin users can also update GIS feature attributes from the field, and mark-up maps with redlines that show whether field crews are online or offline on their mobile devices. Specialty processes are also tightly integrated such as performing valve traces within the map and leveraging the affected asset data to seamlessly inform customers of an impending outage.

“With dozens of customers in the energy, telecommunications and municipal utilities sectors, KloudGin has a proven track record of successfully implementing location-centric solutions for field-based utilities and service providers worldwide,” said Dawn Caravallo, Manager, Esri Partner Network. “KloudGin’s combined field service and asset management solutions provide customers a single face of work, paving the way for smarter asset and personnel deployment and strategic management decisions.”

“Our strategic partnership with Esri will allow us to provide our joint customers with seamless access to their advanced GIS capabilities which will help increase worker productivity and safety, and improve location-based customer service,” said Vikram Takru, CEO, KloudGin. “We are working directly with the Esri R&D team to ensure that our product roadmaps align and that we provide a streamlined experience to businesses that drive efficiencies and revenues.”

About the Esri Partner Network

The Esri Partner Network is a rich ecosystem of organizations that work together to amplify The Science of Where. Esri’s 2,700+ partners deliver solutions, content, and services around the world. Combining industry-specific knowledge with ArcGIS software expertise, Esri partners customize and extend the reach of geographic science in limitless applications and organizations. Learn more at www.esri.com/en-us/about/esri-partner-network/overview

Esri users can take advantage of KloudGin’s field service and asset management software, and contact KloudGin HERE.

About Esri

Esri, the global market leader in geographic information system (GIS) software, location intelligence, and mapping helps customers unlock the full potential of data to improve operational and business results. Founded in 1969, Esri software is deployed in more than 350,000 organizations including 90 of the Fortune 100 companies, all 50 state governments, more than half of all counties (large and small), and 87 of the Forbes Top 100 Colleges in the U.S., as well as all 15 Executive Departments of the U.S. Government and dozens of independent agencies. With its pioneering commitment to geospatial information technology, Esri engineers the most advanced solutions for digital transformation, the Internet of Things (IoT), and advanced analytics. Visit us at esri.com.

About KloudGin

KloudGin is the only combined one-cloud industry-focused field service and asset management solution that automates work management processes, enables customer self-service, increases worker productivity. KloudGin’s solutions unlock new revenue streams and business models. Serving companies with complex, asset management and field service requirements, KloudGin connects customers, employees, sub-contractors, and assets with AI-powered access to information on any device. Visit www.kloudgin.com.


Contacts

Joe Volat
This email address is being protected from spambots. You need JavaScript enabled to view it.
877-256-8303

NEW YORK--(BUSINESS WIRE)--SG Blocks, Inc. (Nasdaq: SGBX) (“SG Blocks” or the “Company”), a leading designer, innovator and fabricator of container-based structures, announced today that its Clarity Mobile Venture (“CMV”) partnership with Clarity Lab Solutions has been selected as a Trusted Testing Partner (TTP) for Hawaii’s COVID-19 travel testing program.

Our scalable solution for COVID-19 testing has various use-cases, and CMV’s pre-travel service has been in serious demand,” stated Daniel Leger, President and Co-Founder of Clarity Lab Solutions. “With the knowledge of SG Blocks and their deployable modular laboratories and Clarity Lab Solutions’ experience in molecular diagnostics, we were able to fulfill the requirements put forth by Hawaii’s Department of Health to become a Trusted Testing Partner.”

This is a huge step for our CMV partnership into the rapidly-growing and highly-profitable mobile laboratory market,” stated Paul Galvin, Chief Executive Officer of SG Blocks. “Our ability to combine Clarity’s PCR testing expertise and lab certification, with SG Blocks’ modular, efficient and quickly-deployable testing facilities positions us to assist Hawaii’s efforts to resume normal business and leisure travel activity as quickly and safely as possible.”

CMV has the ability to provide testing services that fulfill TTP requirements around the country and is currently in discussions for launching testing sites in localities that are ideal for testing passengers travelling to Hawaii. Initially, testing will be available in Southern California.

Hawaii’s COVID-19 travel testing program requires that all travelers, five years and older, arriving in the State of Hawaii may bypass the state’s mandatory 14-day quarantine by taking a COVID-19 Nucleic Acid Amplification Test (NAAT) from a trusted testing partner, including CMV. Partners were selected based on their ability to administer the test and expand the testing network, with the goal of making it easier to safely travel to Hawaii. The state will accept COVID-19 test results from the new partners starting November 17, 2020.

About SG Blocks:

SG Blocks, Inc. is a premier innovator in advancing and promoting the use of code-engineered cargo shipping containers for safe and sustainable construction. The firm offers a product that exceeds many standard building code requirements, and also supports developers, architects, builders and owners in achieving greener construction, faster execution, and stronger buildings of higher value. Each project starts with GreenSteelTM, the structural core and shell of an SG Blocks building, and then customized to client specifications. For more information, visit www.sgblocks.com.

Safe Harbor Statement

This release contains forward-looking statements within the meaning of the Private Securities Litigation Reform Act of 1995. In some cases, forward-looking statements can be identified by terminology such as "may," "should," "potential," "continue," "expects," "anticipates," "intends," "plans," "believes," "estimates," and similar expressions and includes statements such as making it easier to safely travel to Hawaii. These forward-looking statements are based on management's expectations and assumptions as of the date of this press release and are subject to a number of risks and uncertainties, many of which are difficult to predict that could cause actual results to differ materially from current expectations and assumptions from those set forth or implied by any forward-looking statements. Important factors that could cause actual results to differ materially from current expectations include, among others, the Company’s ability to construct, deliver and deploy testing facilities to assist Hawaii’s efforts to resume normal business and leisure travel as planned, the Company’s ability to position itself for future profitability, , the Company’s ability to maintain compliance with the NASDAQ listing requirements, and the other factors discussed in the Company’s Annual Report on Form 10-K for the year ended December 31, 2019 and the Company’s subsequent filings with the SEC, including subsequent periodic reports on Forms 10-Q and 8-K. The information in this release is provided only as of the date of this release, and we undertake no obligation to update any forward-looking statements contained in this release on account of new information, future events, or otherwise, except as required by law.


Contacts

Media:
Rubenstein Public Relations
Christina Levin
Account Director
212-805-3029
This email address is being protected from spambots. You need JavaScript enabled to view it.

Investors:
Stephen Swett
(203) 682-8377
This email address is being protected from spambots. You need JavaScript enabled to view it.

New Research Shows: People Want Nuclear Energy to Help Combat Climate Change

WASHINGTON, D.C.--(BUSINESS WIRE)--#cleanenergy--As Americans experience record-breaking heat waves, floods, and wildfires, they are looking for solutions to climate change and supporting U.S. policymakers who are working to lead us out of the climate crisis.


So, what types of energy and energy policies do Americans want?

Well over half of Americans (56 percent) support existing nuclear energy and recognize that it produces around 20 percent of our electricity, according to ecoAmerica’s third annual American Climate Perspectives Survey. The survey found that 64 percent of Republicans and 56 percent of Democrats support nuclear power. This support has grown, up from 49 percent in 2018 to 56 percent in 2020, driven by a notable rise in Democrat support (up from 37 percent in 2018). The full report can be found here.

Seventy percent of people in the U.S. credit nuclear power plants with generating a lot of electricity, reliably, and 64 percent say that nuclear power plants keep America competitive and energy independent. Sixty-two percent of Americans want to keep nuclear power plants running as long as they are cost effective.

When defined as a new technology that is cheap, produces little waste, and is fail-safe so human errors can’t cause widespread damage, 74 percent of Americans indicated they would support “new”nuclear power such as molten salt reactors. Among those who do not support nuclear power, 17 percent indicated they would shift their opinion to support it after learning that we can clean up unhealthy pollution and make the climate stable by modernizing nuclear power.

“Americans clearly want a wholesale shift to clean energy sources—and they want policymakers to enact real solutions to the existential threat of climate change,” said Dr. Leslie Dewan, founder of Criticality Capital. “This survey shows that Americans of both parties support using new and existing nuclear power to build a carbon-free future.”

“Washington is sensing the growing support for nuclear,” said Eric Meyer, executive director of Generation Atomic, an advocacy group. “In the last couple of years, we’ve seen two bipartisan nuclear innovation bills become law, the Department of Energy fund multiple advanced reactor demonstration projects, and the Democratic Party add nuclear as an important clean energy source in their party platform for the first time since 1972. The tide is changing, and just in time to help us rapidly address climate change.”

About Generation Atomic

Generation Atomic is a 501(c)3 non-profit organization that is growing a movement to fight for the atomic energy of today and tomorrow. Since 2017 they’ve reached millions of people over social media and empowered thousands to contact their elected officials in support of protecting today’s reactors from early shutdown and laying the groundwork for the next generation of low carbon, environmentally friendly energy. Learn more and take action at GenerationAtomic.Org.


Contacts

Marie Domingo
This email address is being protected from spambots. You need JavaScript enabled to view it.
(650) 888-5642

Stacy Williams
This email address is being protected from spambots. You need JavaScript enabled to view it.
(970) 819-0839

  • Fisker and Magna achieve Preliminary Product Specification, a key engineering and purchasing gateway, on the Fisker Ocean product program

LOS ANGELES--(BUSINESS WIRE)--#EVs--Fisker Inc. (NYSE: FSR) (“Fisker”) – designer and manufacturer of the world’s most emotion-stirring, eco-friendly electric vehicles and advanced mobility solutions – today confirmed that the company and Magna International Inc. (collectively with its affiliates, “Magna”) had completed the Preliminary Product Specification (PPS) gateway, a key engineering and purchasing milestone for the Fisker Ocean SUV. This milestone confirms preliminary specifications and targeted performance on key components and subsystems, as well as timing for all subsequent gateways through to the planned start of production in Q4, 2022.


“Today’s announcements demonstrate our team’s ability to set aggressive targets and achieve them on time,” commented Fisker Chairman and Chief Executive Officer, Henrik Fisker. “Completing these important engineering and purchasing milestones demonstrates how well the Fisker and Magna teams are working together and keeping our rapid, capital-light product development program on-track towards the delivery of the all-electric Fisker Ocean SUV, expected to commence in Q4 2022.”

On Oct. 15, 2020, Fisker and Magna announced they had entered into agreements to provide the framework for strategic platform sharing and manufacturing cooperation for the Fisker Ocean SUV. The Fisker Ocean will initially be manufactured exclusively by Magna in Europe, where it currently produces several high-quality vehicles on behalf of global brands. Fisker and Magna have agreed to work together to continue to develop new technologies that will accelerate innovation across multiple automotive systems and architectures for Fisker vehicles.

For more information, or for interview inquiries, contact This email address is being protected from spambots. You need JavaScript enabled to view it..

About Fisker Inc.

California-based Fisker Inc. is revolutionizing the automotive industry by developing the most emotionally desirable and eco-friendly electric vehicles on Earth. Passionately driven by a vision of a clean future for all, the company is on a mission to become the No. 1 e-mobility service provider with the world’s most sustainable vehicles. To learn more, visit www.FiskerInc.com – and enjoy exclusive content across Fisker’s social media channels: Facebook, Instagram, Twitter, YouTube and LinkedIn. Download the revolutionary new Fisker mobile app from the App Store or Google Play store.

Forward Looking Statements

This press release includes forward-looking statements. These statements are made under the “safe harbor” provisions of the U.S. Private Securities Litigation Reform Act of 1995. These statements may be identified by words such as “feel,” “believes,” expects,” “estimates,” “projects,” “intends,” “should,” “is to be,” or the negative of such terms, or other comparable terminology. Forward-looking statements are statements that are not historical facts. Such forward-looking statements are not guarantees of future performance and are subject to risks and uncertainties, which could cause actual results to differ materially from the forward-looking statements contained herein due to many factors, including, but not limited to: Fisker’s limited operating history; Fisker’s ability to enter into platform and manufacturing contracts with Magna, or other OEMs or tier-one suppliers in order to execute on its business plan; Fisker’s ability to execute its business model, including market acceptance of its planned products and services; Fisker’s inability to retain key personnel and to hire additional personnel; competition in the electric vehicle market; Fisker’s inability to develop a sales distribution network; and the ability to protect its intellectual property rights. Any forward-looking statements speak only as of the date on which they are made, and Fisker undertakes no obligation to update any forward-looking statement to reflect events or circumstances after the date of this press release.


Contacts

Fisker Inc.
Simon Sproule, SVP, Communications
310.374.6177 / This email address is being protected from spambots. You need JavaScript enabled to view it.

Dan Galves, VP, Investor Relations
This email address is being protected from spambots. You need JavaScript enabled to view it.

WASHINGTON & CHICAGO--(BUSINESS WIRE)--Nodal Exchange and IncubEx today announced the successful launch of eight new Renewable Identification Number (RIN) futures and options contracts, plus seven new Renewable Energy Certificate (REC) contracts.


The 15 new contracts, listed only on Nodal Exchange, add to the largest set of environmental products offered in the world.

The new contracts listed are as follows:

● D3, D4, D5 and D6 RIN futures and options

● M-RETS® Renewable Energy Certificates from Center for Resource Solutions (CRS) Listed Wind Energy Facilities (front-half and back-half) futures

● Texas Compliance Solar Renewable Energy Certificates from CRS Listed Facilities (front-half and back-half) futures

● New York Renewable Energy Certificates Tier 1 futures

● Texas Compliance Renewable Energy Certificates from CRS Listed Facilities (front-half and back-half) options

The RIN futures and options contracts are physically delivered and cover the most actively traded RIN markets: D3 RINs for cellulosic biofuels, D4 RINs for biomass-based diesel, D5 RINs for advanced biofuels such as sugarcane ethanol and D6 RINS for renewable fuels such as corn ethanol.

After extensive customer consultation and development, the new RIN contracts are designed to bring efficiency and transparency to these largely over-the-counter markets.

"We're seeing healthy interest from RIN market participants who are looking for standardized contracts that are listed and cleared on a regulated exchange," said Nathan Clark, Managing Director at IncubEx. "These contracts virtually eliminate counterparty risk and offer capital efficiencies that are simply not available in the existing bi-lateral markets.”

The new REC futures and options contracts are the first of their kind on any exchange and build on Nodal's unmatched suite of REC products.

The M-RETS® wind futures contracts are based on RECs from M-RETS, a registry that tracks in all North American states and provinces and is the system of record for various state/province Renewable Portfolio Standards (RPS) programs. The M-RETS® wind and Texas solar contracts, along with Nodal's existing Texas wind REC contract, each deliver RECs from facilities registered with Center for Resource Solutions (CRS) in accordance with its Green-e® renewable energy certification program. The New York REC futures contract is based on energy production from eligible generation sources under the state's Clean Energy Standard.

The new contracts, developed with Nodal's partner IncubEx, further extend the broadest suite of exchange listed environmental products and build on the carbon, REC and renewable fuels credit futures and options now offered on Nodal. With the new products, Nodal now offers 82 futures and options contracts on 49 distinct environmental markets.

"We launched the first North American futures and options 2 years ago and have worked with IncubEx to grow the product group to more than 90,000 contracts of open interest," said Paul Cusenza, Chairman and CEO of Nodal Exchange. "The new RIN and REC products are examples of our continued efforts to innovate and meet customer needs in the marketplace. We are proud to be playing a role in efforts to improve our environment."

About IncubEx

IncubEx is an incubator for exchange traded products, services, and technology solutions. At its core, IncubEx is a product and business development firm. The company works in conjunction with its global exchange partner, European Energy Exchange (EEX), Nodal Exchange and other leading service providers and stakeholders to design and develop new financial products in global environmental, reinsurance, and related commodity markets. The company has a specific focus on innovation and continuous improvement of products and services, including technology, trading solutions, and operational efficiencies. The IncubEx team is led by former key Climate Exchange executives and is uniquely positioned to capture these opportunities with its partners. The company was founded in 2016 and currently has offices in Chicago and London.

About Nodal

Nodal Exchange is a derivatives exchange providing price, credit and liquidity risk management solutions to participants in the North American commodities markets. Nodal Exchange is a leader in innovation, having introduced the world’s largest set of electric power locational (nodal) futures contracts. As part of EEX Group, a group of companies serving international commodity markets, Nodal Exchange currently offers over 1,000 contracts on hundreds of unique locations, providing the most effective basis risk management available to market participants. In addition, Nodal Exchange offers natural gas and environmental contracts. All Nodal Exchange contracts are cleared by Nodal Clear which is a CFTC registered derivatives clearing organization. Nodal Exchange is a designated contract market regulated by the CFTC.


Contacts

Jim Kharouf
IncubEx Communications Director
Phone: 773-391-0439
Email: This email address is being protected from spambots. You need JavaScript enabled to view it.

Nicole Ricard
Nodal Exchange Managing Director of Marketing
Phone: 703-962-9816
E-mail: This email address is being protected from spambots. You need JavaScript enabled to view it.

AKRON, Ohio--(BUSINESS WIRE)--$BW #NaturalGas--Babcock & Wilcox (B&W) (NYSE: BW) announced today that its B&W Thermal segment will supply equipment to upgrade burners and provide other boiler related equipment for a power plant in North America to allow it to utilize cleaner-burning natural gas as its main fuel. The contract is valued at approximately $3 million.


“As utilities look to perform maintenance and upgrades to their existing fleets, B&W has the depth of knowledge and expertise to supply these components and perform a broad range of services that allow customers to produce power more cleanly and efficiently,” said B&W Chief Operating Officer Jimmy Morgan. “We see continued opportunities in this market as more U.S. plants look to utilize natural gas to generate power.”

B&W will supply natural gas valve trains and other burner related components for the plant’s boiler. Material delivery is scheduled for early 2021.

In addition to steam generation and related auxiliary equipment, B&W’s field engineers can provide expert support for emissions control systems, heat recovery steam generators, and other power plant equipment.

About Babcock & Wilcox

Headquartered in Akron, Ohio, Babcock & Wilcox is a global leader in energy and environmental technologies and services for the power and industrial markets. Follow us on LinkedIn and learn more at www.babcock.com.

About B&W Thermal

Babcock & Wilcox Thermal designs, manufactures and erects steam generation equipment, aftermarket parts, construction, maintenance and field services for plants in the power generation, oil & gas, and industrial sectors. Babcock & Wilcox Thermal has an extensive global base of installed equipment for utilities and general industrial applications including refining, petrochemical, food processing, metals and more.

Forward-Looking Statements

B&W cautions that this release contains forward-looking statements, including, without limitation, statements relating to the execution and completion of a contract to supply components for a natural gas upgrade at a power plant in North America. These forward-looking statements are based on management’s current expectations and involve a number of risks and uncertainties. For a more complete discussion of these risk factors, see our filings with the Securities and Exchange Commission, including our most recent annual report on Form 10-K. If one or more of these risks or other risks materialize, actual results may vary materially from those expressed. We caution readers not to place undue reliance on these forward-looking statements, which speak only as of the date of this release, and we undertake no obligation to update or revise any forward-looking statement, except to the extent required by applicable law.


Contacts

Investor Contact:
Megan Wilson
Vice President, Corporate Development & Investor Relations
Babcock & Wilcox
704.625.4944 | This email address is being protected from spambots. You need JavaScript enabled to view it.

Media Contact:
Ryan Cornell
Public Relations
Babcock & Wilcox
330.860.1345 | This email address is being protected from spambots. You need JavaScript enabled to view it.

New Athena Microlearning Delivers 6,524 Training Nuggets to Your Handheld Devices

BOSTON--(BUSINESS WIRE)--#competency--IHRDC, a leader in training and competency development for the worldwide oil and gas industry for more than 50 years, announced IHRDC Athena Microlearning today, the company’s innovative new product to deliver, online, just-in-time training in small bites to learners around the globe.


The new, extensive database of learning nuggets is derived from IHRDC’s many in-depth e-Learning resources containing more than 1,500 courses encompassing the Oil and Gas Business, Upstream Technology, and Operations & Maintenance. From these resources, the company’s e-Learning Solutions group compiled more than 6,500 microlearning nuggets consisting of 5-8 minute segments of text, video, animation, interactive, content and knowledge checks and assembled them into a searchable database. The new collection is named Athena Microlearning for the Greek Goddess of Wisdom.

Access is available through any web-connected device. As a user you simply enter a search term of immediate job or competency development need into the IHRDC Learning Platform and a dashboard of relevant Microlearning learning tablets, each with their respective context, appears for your individual selection. In no time, you have access to the learning you need! It offers a perfect way to close knowledge gaps quickly, and seamlessly deliver practical knowledge on the job or wherever needed.

“We are very excited to offer the industry this new workforce training resource,” observed IHRDC President Dr. David Donohue. “In personal interviews, our clients told us that their younger employees prefer access to learning nuggets on handheld devices to meet their immediate job need and to eliminate competency gaps. Athena Microlearning is our innovative answer to those expressed needs – it includes over 6,500 learning nuggets in industry related business, technology, operations and maintenance at modest user cost.”

Comments of users during beta testing have been very positive: “Love the design” “Ideal to eliminate competency gaps” “Great as on-the-job advisor” “Lets me learn just what I need” “Easily accessible on my iPhone, too”.

So, to learn more about this exciting new product, including a full demo or to license it for your own use go to the website below. You will be happy you did!

Details about Athena Microlearning can be accessed here:

www.ihrdc.com/IHRDC-e-LearningSolutions/AthenaMicrolearning/

About IHRDC:

International Human Resources Development Corporation (www.ihrdc.com ) has been a global leader in training and competency management for the oil and gas industry for more than 50 years. It offers the best Instructional Programs, e-Learning and Knowledge Solutions, and Competency Management products and services available to the industry today. The company is headquartered in Boston, USA with offices in Houston, London, Amsterdam, Abu Dhabi, Kuala Lumpur, and Lagos.

IHRDC is the proud recipient of the "Petroleum Industry Training Provider of the Year Award" from the Getenergy organization for 2010, 2011, and 2012, the 2011 Platinum AVA Award, 18 Telly Awards, and the 2003 Corporate Award for Excellence in Distance Learning Programming.


Contacts

Kathleen McDonnell, IHRDC This email address is being protected from spambots. You need JavaScript enabled to view it.


DALLAS--(BUSINESS WIRE)--New Concept Energy, Inc. (NYSE American: GBR), ( the “Company” or “NCE”) a Dallas-based company, today reported net income for the three months ended September 30, 2020 of $2,182,000 or ($0.43) per share, compared to a net loss of $2,320,000 or ($0.45) per share for the three months ended September 30, 2019.


For the three months ended September 30, 2020, the Company recorded net revenue from continuing operations of $82,000 and net income from discontinued operations of $2,100,000. For the three months ended September 30, 2019, the Company recorded $22,000 from continuing operations and a loss of $2,342,000 from discontinued operations.

On August 31, 2020 the Company sold its entire oil and gas operation for $85,000 to an independent third party. In prior years the Company has accrued a liability of $2,745,000 to plug and abandon the existing wells. This obligation was assumed by the buyer. Upon the sale of the wells the Company recorded a gain of $2,138,000.

In September 2019 the Company wrote down the accounting value of its oil and gas reserves by $2,285,000.

For the three months ended September 30, 2020 the Company reported other income of $84,000 which represents a tax refund for taxes paid in prior years.

The Company continues to own approximately 190 acres of land located in Parkersburg West Virginia. Located on the land are four structures totaling approximately 53,000 square feet. Of this total area the main industrial / office building contains approximately 24,800 square feet of which approximately 16,000 square feet is leased at a rate of $101,000 per annum.

NEW CONCEPT ENERGY, INC. AND SUBSIDIARIES

CONSOLIDATED BALANCE SHEETS 

(unaudited) 

(dollars in thousands, except par value amount)
   September 30,
2020
December 31,
2019
   (unaudited) (audited)
Assets
  
Current assets
 Cash and cash equivalents

 $

                       42


 $

                      22

 Current portion notes receivable (including $3,578 and $4,005 due to related parties in 2020 and 2019)


                     3,618


                    4,046

 Other current assets


                        104


                         -  

Total current assets


                     3,764


                    4,068


Property and equipment, net of depreciation      
 Land, buildings and equipment 


                        659


                       668

     
Assets held for sale


                          -  


                       840

 
Other  assets 


                        181


                       214

       
Total assets

 $

                  4,604


 $

                 5,790


NEW CONCEPT ENERGY, INC. AND SUBSIDIARIES
CONSOLIDATED BALANCE SHEETS - CONTINUED
(unaudited) 
(dollars in thousands, except par value amount)
 
September 30,
 2020
December 31,
 2019
 
Liabilities and stockholders' equity    
    
Current liabilities    
    Accounts payable  (includes $32 and $180 due to related parties in 2020 and 2019)

 $

                         39


 $

                    226


    Accrued expenses 


                            18


                         20


    Current portion of long term debt


                            40


                         44


Total current liabilities


                            97


                       290


Long-term debt          
    Notes payable less current portion


                          150


                       177


 Liabilities of assets held for sale


                            -


                    2,914


Total liabilities


                          247


                    3,381


Stockholders' equity          
    Preferred stock, Series B


                              1


                          1


Common stock, $.01 par value; authorized, 100,000,000 shares; issued and outstanding, 5,131,934 shares at September 30, 2020 and December 31, 2019


                            51


                         51


    Additional paid-in capital


                     63,579


                  63,579


    Accumulated deficit


                    (59,274

)


                 (61,222

)

            
Total Shareholder Equity


                       4,357


                    2,409


Total liabilities & equity

 $

                    4,604


 $

                 5,790


NEW CONCEPT ENERGY, INC AND SUBSIDIARIES
CONSOLIDATED STATEMENT OF OPERATIONS
(unaudited)
(amounts in thousands, except per share data)
 
For the Three Months ended September 30,  For the Nine Months ended September 30, 


2020


2019


2020


2019


Revenue      
Rent

 $

           25


 $

               25


 $

          76


 $

             76


Operating expenses      
Operating expenses


15


17


46


53


Corporate general and administrative


65


92


296


314


Total operating expenses


80


109


342


367


    Operating loss


(55

)


(84

)


(266

)


(291

)


Other income (expense)
Interest income from related parties


54


60


172


180


Interest Income from third parties


3


3


12


12


Interest expense


(3

)


(3

)


(9

)


(12

)

 Income other


83


46


83


199


Other income


137


106


258


379


Net income (loss) from continuing operations


82


22


(8

)


88


Discontinued Operations
Gain (loss) from discontinued operations 


(38

)


(2,342

)


(182

)


(2,423

)

Gain (loss) from disposal of Oil & Gas Operations


2,138


               -


2,138


                -


2,100


         (2,342

)


1,956


          (2,423

)

   
Net income  (loss) applicable to common shares


2,182


(2,320

)


1,948


(2,335

)

             
Net income (loss) per common share-basic and diluted

 $

        0.43


 $

          (0.45

)


 $

          0.38


 $

           (0.45

)


Weighted average common and equivalent shares outstanding - basic


5,132


5,132


5,132


5,132


Contacts

New Concept Energy Inc.
Investor Relations
Gene Bertcher, (800) 400-6407
This email address is being protected from spambots. You need JavaScript enabled to view it.

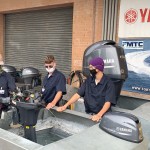
FT. MYERS, Fla.--(BUSINESS WIRE)--As part of a continued effort to develop qualified marine technicians, Yamaha Marine and the Marine Industries Association of Southwest Florida and Tampa Bay (MIA of SWFL&TB) teamed up to help provide the funding and equipment to make it possible for Ft. Myers Technical College (FMTC) to offer Yamaha’s new Maintenance Certification Program (MCP) to students during the 2020/2021 school year. MIA of SWFL&TB contributed $10,000 toward the four modules of curriculum, and Yamaha donated an F300 V6 outboard for hands-on instruction in the classroom.


“Like Yamaha, the MIA of SWFL&TB is dedicated to creating solid paths for marine technician career development,” said Gregg Snyder, Marine Training Department Manager, Yamaha U.S. Marine Business Unit. “Ft. Myers Technical College has a long history of providing exceptional instruction to students who choose to pursue careers as marine technicians. We applaud their efforts to work with Yamaha Marine and the Marine Industries Association to bring the four comprehensive modules of Yamaha’s Maintenance Certification Program to the college. Technicians who complete the program will enter the workforce prepared for success.”

Ft. Myers Technical College is a long-standing, active participant in Yamaha Marine’s Technical School Partnership (TSP) program. Launched in 2015, Yamaha’s TSP program aims to develop a stronger marine technician workforce through a certified curriculum, Yamaha systems access and product donations used in the classroom for hands-on training. Yamaha Marine’s TSP program reached its 100th member milestone in October of 2020.

“We’ve been part of the TSP program since the beginning, and our placement rate for students who complete the Marine Service Technologies program is close to 100 percent. Hands-on experience is a vital part of a technician’s training and, through these donations, MIA of SWFL&TB and Yamaha are helping us provide the best training in the industry,” said Mike Esterline, Marine Service Technologies Instructor and Department Chair for Specialized Mechanics at FMTC. “Technicians in our area of the state are in greater demand than ever before as we have one of the highest rates of boats per capita in the country. Dealers here know technicians who complete Yamaha certification courses through our school are well versed in product knowledge and ready for real-world scenarios. We greatly appreciate the support from the MIA of SWFL&TB and Yamaha as we work to build a strong marine technician workforce.”

Yamaha Marine makes a wide variety of sponsored curricula available to technical school partners for use in the classroom. The first curriculum, titled “Introduction to Outboard Systems,” (ITOS) includes textbook materials and hands-on learning experiences for students who wish to start a career as a marine industry technician. Students who successfully complete the course receive Yamaha Marine’s Introduction to Outboard Systems Certification. ITOS is a pre-requisite for Yamaha’s new Maintenance Certification Program (MCP), which is based on the 20, 100, 300, 500 and 1,000-hour maintenance procedures for Yamaha Outboards. MCP students will leave the Yamaha Technical School Partner with certified maintenance competencies that prepare them to be immediately profitable in Yamaha dealership service departments. Yamaha dealerships can take them on as apprentices or full-time technicians to help them continue to develop their skills.

“Yamaha has a great, dependable, high-quality product. For technicians in this area of the state, in-depth knowledge of Yamaha outboards is a must,” continued Esterline. “The fact that these new technicians can get this kind of certification locally through our school is a huge benefit for dealers in the area. We’re even planning a co-op program with several local dealers to allow their technicians to participate in Yamaha’s MCP program at night next year. The effort Yamaha and the MIA of SWFL&TB board put toward technician development in this industry is more than commendable.”

For more information about the Yamaha Technical School Partnership program, please visit ymutechs.com or contact This email address is being protected from spambots. You need JavaScript enabled to view it..

Yamaha Marine products are marketed throughout the United States and around the world. Yamaha Marine U.S. Business Unit, based in Kennesaw, Ga., supports its 2,400 U.S. dealers and boat builders with marketing, training and parts for Yamaha’s full line of products and strives to be the industry leader in reliability, technology and customer service. Yamaha Marine is the only outboard brand to have earned NMMA®’s C.S.I. Customer Satisfaction Index award every year since its inception.

REMEMBER to always observe all applicable boating laws. Never drink and drive. Dress properly with a USCG-approved personal floatation device and protective gear.

© 2020 Yamaha Motor Corporation, U.S.A. All rights reserved.

This document contains many of Yamaha's valuable trademarks. It may also contain trademarks belonging to other companies. Any references to other companies or their products are for identification purposes only and are not intended to be an endorsement


Contacts

Melissa Boudoux
Communications Manager
Yamaha U.S. Marine Business Unit
Office: (770) 701-3269
Mobile: (404) 381-7593
This email address is being protected from spambots. You need JavaScript enabled to view it.

Neal Wheaton
Wilder+Wheaton for
Yamaha U.S. Marine Business Unit
Mobile: (404) 317-0698
This email address is being protected from spambots. You need JavaScript enabled to view it.

  • Corporation reports EPS of $0.07 per diluted share for Q3 2020 despite continued impact of COVID-19 pandemic on end-market demand, sequentially higher than Q2 2020 EPS.
  • Return to profitability extends for fourth consecutive quarter.
  • $19.3 million gross proceeds from equity offering completed in Q3.
  • Total debt of $32.6 million reduced by $38.3 million (54%) from $70.9 million at December 31, 2019.

CARNEGIE, Pa.--(BUSINESS WIRE)--Ampco-Pittsburgh Corporation (NYSE: AP) (the "Corporation" or “Ampco-Pittsburgh”) reported net income for the three and nine months ended September 30, 2020, of $1.0 million, or $0.07 per diluted share, and $5.8 million, or $0.43 per diluted share, respectively. By comparison, the Corporation incurred a net loss of $(5.1) million, or $(0.40) per diluted share, and $(24.1) million, or $(1.91) per diluted share, for the same periods of the prior year which respectively included losses of $(0.27) and $(0.72) per diluted share from discontinued operations.


Sales from continuing operations were $75.7 million and $241.5 million for the three and nine months ended September 30, 2020, respectively, compared to $90.9 million and $300.9 million for the three and nine months ended September 30, 2019, respectively. The decrease is primarily attributable to a lower volume of shipments for the Forged and Cast Engineered Products segment due to pandemic-related customer deferrals in the flat-rolled steel and aluminum markets and, to a lesser extent, reduced demand for other forged engineered products, primarily in the oil and gas market.

Remarking on the quarter’s results, Brett McBrayer, Ampco-Pittsburgh’s Chief Executive Officer, said, “Ampco-Pittsburgh has continued to perform amidst the challenges presented by this pandemic. Despite significant plant downtime experienced in the quarter to manage through the contraction and handle scheduled maintenance activities, we extended our positive net earnings performance for a fourth consecutive quarter. The Forged and Cast Engineered Products segment delivered improved results for the quarter compared to prior year, while the Air and Liquid Processing segment remained a stable force with results equaling prior year. Our successful equity raise during Q3 strengthened our balance sheet considerably and with significant liquidity and operating leverage, we are well positioned to capitalize on recovery in our end markets.”

Operating cash flow generation year-to-date and the proceeds from the equity offering completed during the quarter have allowed the Corporation to reduce its total debt balance by 54% from $70.9 million at December 31, 2019, to $32.6 million at September 30, 2020.

The Corporation reported income from continuing operations for the three and nine months ended September 30, 2020, of $0.2 million and $4.4 million, respectively, compared to losses of $(1.3) million and $(14.0) million, respectively, for the same periods of the prior year. Income from continuing operations for the nine months ended September 30, 2020, includes $0.8 million in subsequent proceeds from a 2018 business interruption claim (“Proceeds from Business Interruption Insurance Claim”). By comparison, loss from continuing operations for the nine months ended September 30, 2019, includes $4.6 million in excess costs of the Corporation’s Avonmore, PA cast roll manufacturing facility (“Avonmore”) which was sold in September 2019 (“Excess Costs of Avonmore”), $1.7 million in professional fees and employee severance costs associated with the Corporation’s overall restructuring plan (“Restructuring-Related Costs”), and $1.4 million in bad debt expense for a cast roll customer who had filed for bankruptcy protection (“Bad Debt Expense”). Additionally, loss from continuing operations for the nine months ended September 30, 2019, includes an impairment loss (“Impairment Charge”) of $10.1 million associated with the write-down of certain assets of Avonmore in anticipation of its sale.

Excluding the Proceeds from the Business Interruption Insurance Claim from the current year operating results and the Bad Debt Expense, the Excess Costs of Avonmore, the Restructuring-Related Costs, and the Impairment Charge from prior year operating results, as applicable, adjusted income (loss) from continuing operations, which is not based on U.S. generally accepted accounting principles (“GAAP”), was $0.2 million and $3.7 million for the three and nine months ended September 30, 2020, and $(0.1) million and $3.7 million for the three and nine months ended September 30, 2019, respectively. Adjusted income from continuing operations was approximately comparable to the prior year periods, despite decreases in sales of approximately 17% and 20%, respectively, for the three and nine months ended September 30, 2020, driven principally by the pandemic. Although the current year periods benefited from lower raw material costs, reduced SG&A expense and, for the year-to-date period, improved roll pricing, these factors were approximately offset by the pandemic-driven impacts of the lower shipment volumes and net unfavorable plant absorption from lower production levels in the Forged and Cast Engineered Products segment. A reconciliation of these GAAP to non-GAAP results is provided below under “Non-GAAP Financial Measures Reconciliation Schedule.”

Other income – net for the three months ended September 30, 2020, improved in comparison to the prior year primarily due to dividend income of $1.2 million from one of the Corporation’s Chinese joint ventures in the current period. On a year-to-date basis, however, lower interest expense and lower foreign exchange transaction losses in 2020 could not offset the impact of net gains recorded in 2019 from the curtailment of pension and postretirement plans and special termination benefit costs associated with the Avonmore cast roll plant exit.

The income tax benefit for the nine months ended September 30, 2020, includes a benefit of $3.5 million for the additional tax loss carryback provisions included in the CARES Act.

Segment Results

Forged and Cast Engineered Products

Sales for the three and nine months ended September 30, 2020, declined 19% and 25% from the respective prior year periods primarily due to customers deferring shipments for mill rolls in response to pandemic-related market impacts and, to a lesser extent, lower demand for other forged engineered products, primarily in the oil and gas market. Operating results for the three months ended September 30, 2020, improved compared to prior year. While the segment was adversely impacted by the lower volume of shipments and net unabsorbed costs associated with the temporary idling of certain of its forged and cast roll manufacturing facilities in response to lower demand, elimination of the Excess Costs of Avonmore, and a reduced cost structure due to restructuring and efficiency improvements more than offset the impact to operating results.

Air and Liquid Processing

Sales for the Air and Liquid Processing segment for the three and nine months ended September 30, 2020, were slightly below prior year levels. Operating income for the quarter was approximately equal to the prior year level yet continues to exceed prior year on a year-to-date basis.

Teleconference Access

Ampco-Pittsburgh Corporation (NYSE: AP) will hold a conference call on Tuesday, November 17, 2020, at 10:30 a.m. Eastern Time (ET) to discuss its financial results for the quarter ended September 30, 2020. The Corporation encourages participants to pre-register at any time, including up to and after the call start time via this link: https://dpregister.com/sreg/10148835/dac17764c3. Those without internet access or unable to pre-register should dial in at least five minutes before the start time using:

  • Participant Dial-in (Toll Free): 1-844-308-3408
  • Participant International Dial-in: 1-412-317-5408

For those unable to listen to the live broadcast, a replay will be available one hour after the event concludes on the Corporation’s website under the Investors menu at www.ampcopgh.com.

About Ampco-Pittsburgh Corporation

Ampco-Pittsburgh Corporation manufactures and sells highly engineered, high-performance specialty metal products and customized equipment utilized by industry throughout the world. Through its operating subsidiary, Union Electric Steel Corporation, it is a leading producer of forged and cast rolls for the global steel and aluminum industry. It also manufactures open-die forged products that principally are sold to customers in the steel distribution market, oil and gas industry, and the aluminum and plastic extrusion industries. The Corporation is also a producer of air and liquid processing equipment, primarily custom-engineered finned tube heat exchange coils, large custom air handling systems, and centrifugal pumps. It operates manufacturing facilities in the United States, England, Sweden, Slovenia, and participates in three operating joint ventures located in China. It has sales offices in North and South America, Asia, Europe, and the Middle East. Corporate headquarters is located in Carnegie, Pennsylvania.

Non-GAAP Financial Measures

The Corporation presents non-GAAP adjusted income from continuing operations as a supplemental financial measure to GAAP financial measures regarding the Corporation’s operational performance. This non-GAAP financial measure excludes unusual items affecting comparability, as described more fully in the footnotes to the attached “Non-GAAP Financial Measures Reconciliation Schedule,” including the Impairment Charge, the Restructuring-Related Costs, the Excess Costs of Avonmore, and the Proceeds from Business Interruption Insurance Claim, which the Corporation believes are not indicative of its core operating results. A reconciliation of this non-GAAP financial measure to income (loss) from continuing operations, the most directly comparable GAAP financial measure, is provided below under “Non-GAAP Financial Measures Reconciliation Schedule.”

The Corporation has presented non-GAAP adjusted income from continuing operations because it is a key measure used by the Corporation’s management and Board of Directors to understand and evaluate the Corporation’s operating performance and to develop operational goals for managing the business. Management believes this non-GAAP financial measure provides useful information to investors and others in understanding and evaluating the operating results of the Corporation, enhancing the overall understanding of the Corporation’s past performance and future prospects, and allowing for greater transparency with respect to key financial metrics used by management in its financial and operational decision-making. Non-GAAP adjusted income from continuing operations should be used only as a supplement to GAAP information, in conjunction with the Corporation’s condensed consolidated financial statements prepared in accordance with GAAP, and should not be considered in isolation of, or as an alternative to, measures prepared in accordance with GAAP. There are limitations related to the use of non-GAAP adjusted income from continuing operations rather than GAAP income (loss) from continuing operations. Among other things, the Excess Costs of Avonmore, which are excluded from the non-GAAP financial measure, necessarily reflect judgments made by management in allocating manufacturing and operating costs between Avonmore and the Corporation’s other operations and in anticipating how the Corporation will conduct business following the sale of Avonmore, which was completed on September 30, 2019.

Forward-Looking Statements

The Private Securities Litigation Reform Act of 1995 (the “Act”) provides a safe harbor for forward-looking statements made by or on behalf of Ampco-Pittsburgh Corporation (the “Corporation”). This press release may include, but is not limited to, statements about operating performance, trends, events that the Corporation expects or anticipates will occur in the future, statements about sales and production levels, restructurings, the impact from global pandemics (including COVID-19), profitability and anticipated expenses, future proceeds from the exercise of outstanding warrants, and cash outflows. All statements in this document other than statements of historical fact are statements that are, or could be, deemed “forward-looking statements” within the meaning of the Act and words such as “may,” “intend,” “believe,” “expect,” “anticipate,” “estimate,” “project,” “forecast” and other terms of similar meaning that indicate future events and trends are also generally intended to identify forward-looking statements. Forward-looking statements speak only as of the date on which such statements are made, are not guarantees of future performance or expectations, and involve risks and uncertainties. For the Corporation, these risks and uncertainties include, but are not limited to: cyclical demand for products and economic downturns; excess global capacity in the steel industry; increases in commodity prices or shortages of key production materials; consequences of global pandemics (including COVID-19); new trade restrictions and regulatory burdens associated with “Brexit”; inability of the Corporation to successfully restructure its operations; limitations in availability of capital to fund the Corporation’s operations and strategic plan; inability to satisfy the continued listing requirements of the New York Stock Exchange or NYSE American; potential attacks on information technology infrastructure and other cyber-based business disruptions; and those discussed more fully elsewhere in this report and in documents filed with the Securities and Exchange Commission by the Corporation, particularly in Item 1A, Risk Factors, in Part I of the Corporation’s latest Annual Report on Form 10-K, and Part II of the Quarterly Report on Form 10-Q. The Corporation cannot guarantee any future results, levels of activity, performance or achievements. In addition, there may be events in the future that the Corporation may not be able to predict accurately or control which may cause actual results to differ materially from expectations expressed or implied by forward-looking statements. Except as required by applicable law, the Corporation assumes no obligation, and disclaims any obligation, to update forward-looking statements whether as a result of new information, events or otherwise.


AMPCO-PITTSBURGH CORPORATION

FINANCIAL SUMMARY

(in thousands except per share amounts)


Three Months Ended

September 30


Nine Months Ended

September 30,


2020


2019


2020


2019


Sales

$

75,674


$

90,872


$

241,515

$

300,885


Cost of products sold


(excl. depreciation and amortization)


59,461


75,475


189,604


250,232


Selling and administrative


11,445


12,365


33,474


40,179


Depreciation and amortization


4,511


4,502


13,863


14,411


Impairment charge


-


-


-


10,082


Loss (gain) on disposal of assets


79


(130

)


131


(67

)

Total operating expenses


75,496


92,212


237,072


314,837


Income (loss) from continuing operations


178


(1,340

)


4,443


(13,952

)

Other income (expense) – net


1,690


546


609


1,673


Income (loss) from continuing operations before income taxes


1,868


(794

)


5,052


(12,279

)


Income tax (provision) benefit


(630

)


(429

)


1,649


(1,716

)


Net income (loss) from continuing operations


1,238


(1,223

)


6,701


(13,995

)

Loss from discontinued operations, net of tax


-


(3,398

)


-


(9,031

)

Net income (loss)


1,238


(4,621

)


6,701


(23,026

)


Less: Net income attributable to noncontrolling interest


270


434


923


1,035


Net income (loss) attributable to Ampco-Pittsburgh

$

968


$

(5,055

)

$

5,778

$

(24,061

)


Net income (loss) from continuing operations per share attributable to Ampco-Pittsburgh common shareholders:


Basic

$

0.07


$

(0.13

)

$

0.45

$

(1.19

)

Diluted

$

0.07


$

(0.13

)

$

0.43

$

(1.19

)

Loss from discontinued operations, net of tax, per share attributable to Ampco-Pittsburgh common shareholders:


Basic

$

-


$

(0.27

)

$

-

$

(0.72

)

Diluted

$

-


$

(0.27

)

$

-

$

(0.72

)

Net income (loss) per share attributable to Ampco-Pittsburgh common shareholders

Basic

$

0.07


$

(0.40

)

$

0.45

$

(1.91

)

Diluted

$

0.07


$

(0.40

)

$

0.43

$

(1.91

)


Weighted-average number of common shares outstanding

Basic


13,343


12,640


12,915


12,572


Diluted


14,454


12,640


13,585


12,572


AMPCO-PITTSBURGH CORPORATION

SEGMENT INFORMATION

(in thousands)


Three Months Ended

September 30,


Nine Months Ended

September 30,


2020


2019


2020


2019

 
Net Sales

Forged and Cast Engineered Products

$

54,499


$

67,452


$

173,723


$

231,299


Air and Liquid Processing


21,175


23,420


67,792


69,586


Consolidated

$

75,674


$

90,872


$

241,515


$

300,885


Income (Loss) from Continuing Operations:

Forged and Cast Engineered Products

$

1,301


$

(437

)

$

5,434


$

(10,640

)

Air and Liquid Processing


2,261


2,280


7,691


7,371


Corporate costs


(3,384

)


(3,183

)


(8,682

)


(10,683

)

Consolidated

$

178


$

(1,340

)

$

4,443


$

(13,952

)


AMPCO-PITTSBURGH CORPORATION
NON-GAAP FINANCIAL MEASURES RECONCILIATION SCHEDULE
(in thousands)

As described under “Non-GAAP Financial Measures” above, the Corporation presents non-GAAP adjusted income (loss) from continuing operations as a supplemental financial measure to GAAP financial measures. The following is a reconciliation of this non-GAAP financial measure to income (loss) from continuing operations, the most directly comparable GAAP financial measure, for the three and nine months ended September 30, 2020, and 2019, respectively:


Three Months Ended

September 30,


Nine Months Ended

September 30,


2020


2019


2020


2019


Income (loss) from continuing operations, as reported (GAAP)


$

178


$

(1,340

)


$

4,443


$

(13,952

)

Impairment Charge (1)


-


-


-


10,082


Restructuring-Related Costs (2)


-


561


-


1,653


Excess Costs of Avonmore (3)


-


685


-


4,572


Bad Debt Expense (4)


-


-


-


1,366


Proceeds from Business Interruption Insurance Claim (5)


-


-


(769

)


-


Income (loss) from continuing operations, as adjusted (Non-GAAP)


$

178


$

(94

)


$

3,674


$

3,721


(1)

Represents an impairment charge to record the Avonmore plant to its estimated net realizable value less costs to sell in anticipation of its sale, which was completed in 2019.

(2)

Represents professional fees associated with the Corporation’s overall restructuring plan and employee severance costs due to reductions in force.

(3)

Represents estimated net operating costs not expected to continue after the sale of the Avonmore plant, which was completed in 2019. The estimated temporary excess costs include judgments made by management in allocating manufacturing and operating costs between Avonmore and the Corporation’s other operations and in anticipating how it will conduct business following the sale of the Avonmore plant.

(4)

Represents bad debt expense for a cast roll customer who filed for bankruptcy during the second quarter of 2019.

(5)

Represents business interruption insurance proceeds received for equipment outages that occurred in 2018.


Contacts

Michael G. McAuley
Senior Vice President, Chief Financial Officer and Treasurer
(412) 429-2472
This email address is being protected from spambots. You need JavaScript enabled to view it.

HOUSTON--(BUSINESS WIRE)--Waste Management, Inc. (NYSE: WM) today announced the declaration of a quarterly cash dividend of $0.545 per share payable Dec. 18, 2020 to stockholders of record on Dec. 4, 2020.


ABOUT WASTE MANAGEMENT

Waste Management, based in Houston, Texas, is the leading provider of comprehensive waste management environmental services in North America. Through its subsidiaries, the Company provides collection, transfer, disposal services, and recycling and resource recovery. It is also a leading developer, operator and owner of landfill gas-to-energy facilities in the United States. The Company’s customers include residential, commercial, industrial, and municipal customers throughout North America. To learn more information about Waste Management, visit www.wm.com.


Contacts

Waste Management

Website
www.investors.wm.com

Analysts
Ed Egl
713.265.1656
This email address is being protected from spambots. You need JavaScript enabled to view it.
Media
Janette Micelli
602.579.6152
This email address is being protected from spambots. You need JavaScript enabled to view it.

Combined Company Renamed “Eos Energy Enterprises, Inc.”

Common Stock and Warrants to Trade on The Nasdaq Capital Market under the Ticker Symbols "EOSE" and “EOSEW”, respectively, Commencing on November 17, 2020

NEW YORK & EDISON, N.J.--(BUSINESS WIRE)--B. Riley Principal Merger Corp. II (NYSE: BMRG, BMRG WS, BMRG.U) (“BMRG”), a special purpose acquisition company sponsored by an affiliate of B. Riley Financial, Inc. (Nasdaq: RILY) (“B. Riley Financial”), and Eos Energy Storage, LLC, a leading manufacturer of safe, reliable, low-cost zinc battery storage systems, today announced the completion of their previously announced business combination. The business combination has a projected pro forma market capitalization of approximately $500 million.


Upon completion of the business combination, the combined company was renamed Eos Energy Enterprises, Inc. ("Eos" or the "Company"). Beginning November 17, 2020, the Company's shares of common stock and warrants will begin trading on The Nasdaq Capital Market under the new ticker symbols "EOSE" and “EOSEW”, respectively.

Eos's executive management team will continue to be led by Joe Mastrangelo, who will serve as the Company's Chief Executive Officer, and Sagar Kurada, who will serve as the Company’s Chief Financial Officer. The Company's board of directors will be comprised of Joe Mastrangelo, Russell Stidolph, chairman of the board since 2018, Dan Shribman, B. Riley Financial’s Chief Investment Officer and BMRG’s former Chief Executive Officer, Alex Dimitrief, former President and Chief Executive Officer of General Electric’s Global Growth Organization, Dr. Krishna Singh, founder of Holtec International, Marian “Mimi” Walters, Chief Commercial Officer for Leading Edge Power Solutions, LLC and Audrey Zibelman, Chief Executive Officer at the Australian Energy Market Operator.

“This milestone is the culmination of more than a decade of commitment to addressing the world’s energy storage challenges,” said Mr. Mastrangelo. “We have a proven, safe and sustainable storage solution that’s ready to help accelerate and scale the clean energy transition. We are grateful to the B. Riley team for their partnership and support over these last few months and we look forward to sharing our progress with our shareholders as we continue to execute on our growth strategy.”

"In Eos we found an ideal partner to complete this business combination," said Mr. Shribman. "The market opportunity for Eos is extremely promising. They are a mission-driven organization focused on accelerating clean energy adoption, and importantly, they have the technology to make this happen. We wouldn’t have been able to close this transaction so quickly without the tireless work of the entire Eos team as well as the continued support of our financial partners and shareholders. We’re proud to be a strategic partner as Eos looks toward a bright future ahead.”

B. Riley Securities, Inc. served as capital markets advisor to BMRG. White & Case LLP acted as BMRG’s legal advisor. Guggenheim Partners served as capital markets advisor to Eos in connection with the business combination. Evercore acted as financial advisor to Eos. Morrison Cohen LLP acted as legal advisor to Eos. KPMG served as the Company’s public company readiness advisor. Deloitte served as the Company’s auditor.

About Eos Energy Enterprises, Inc.

Eos Energy Enterprises, Inc. is accelerating the shift to clean energy with positively ingenious solutions that transform how the world stores power. Our breakthrough Znyth® aqueous zinc battery was designed to overcome the limitations of conventional lithium-ion technology. Safe, scalable, efficient, sustainable—and manufactured in the U.S—it's the core of our innovative systems that today provide utility, industrial, and commercial customers with a proven, reliable energy storage alternative. Eos was founded in 2008 and is headquartered in Edison, New Jersey.

About B. Riley Principal Merger Corp. II

BMRG was formed for the purpose of effecting a merger, share exchange, asset acquisition, share purchase, reorganization or similar business combination with one or more businesses.

Forward-Looking Statements

This press release includes certain statements that may constitute "forward-looking statements" for purposes of the federal securities laws. Forward-looking statements include, but are not limited to, statements that refer to projections, forecasts or other characterizations of future events or circumstances, including any underlying assumptions. The words "anticipate," "believe," "continue," "could," "estimate," "expect," "intends," "may," "might," "plan," "possible," "potential," "predict," "project," "should," "would" and similar expressions may identify forward-looking statements, but the absence of these words does not mean that a statement is not forward-looking. Forward-looking statements may include, for example, statements about: the benefits of the business combination; the future financial performance of the Company; the Company's plans for expansion and acquisitions; and changes in the Company's strategy, future operations, financial position, estimated revenues, and losses, projected costs, prospects, plans and objectives of management. These forward-looking statements are based on information available as of the date of this press release, and current expectations, forecasts and assumptions, and involve a number of judgments, risks and uncertainties. Accordingly, forward-looking statements should not be relied upon as representing the parties' views as of any subsequent date, and the Company does not undertake any obligation to update forward-looking statements to reflect events or circumstances after the date they were made, whether as a result of new information, future events or otherwise, except as may be required under applicable securities laws. You should not place undue reliance on these forward-looking statements. As a result of a number of known and unknown risks and uncertainties, actual results or performance may be materially different from those expressed or implied by these forward-looking statements. Some factors that could cause actual results to differ include, but are not limited to: (1) the outcome of any legal proceedings that may be instituted against the Company relating to the business combination and related transactions; (2) the ability to maintain the listing of the Company's shares of common stock on NASDAQ following the business combination; (3) the risk that the business combination or the acquisitions disrupt the Company's current plans and operations as a result of the consummation of the transactions described herein; (4) the ability to recognize the anticipated benefits of the proposed business combination, which may be affected by, among other things, competition, (5) the ability of the Company's business to grow and manage growth profitably, maintain relationships with customers and suppliers and retain its management and key employees; (6) costs related to the business combination; (7) changes in applicable laws or regulations; (8) the possibility that the Company may be adversely affected by other economic, business, and/or competitive factors; and (9) other risks and uncertainties indicated from time to time in the Prospectus included as part of Amendment No. 1 to the Registration Statement on Form S-1 filed by BMRG with the Securities and Exchange Commission (“SEC”) on November 13, 2020, Registration No. 333-333-249713, including those under the heading "Risk Factors" therein, and other factors identified in BMRG’s prior SEC filings and the Company’s future filings with the SEC, available at www.sec.gov.


Contacts

For Eos Energy Enterprises, Inc.

Investors
Ed Yuen
This email address is being protected from spambots. You need JavaScript enabled to view it.
Media
James McCusker
This email address is being protected from spambots. You need JavaScript enabled to view it.

For B. Riley:
Investors
Brad Edwards
This email address is being protected from spambots. You need JavaScript enabled to view it.

Media
Andrew Jennings
This email address is being protected from spambots. You need JavaScript enabled to view it.
Joint Effort Established Supporting Western States to Accelerate Green Hydrogen Production, Infrastructure, and Seasonal Energy Storage

BERKELEY, Calif.--(BUSINESS WIRE)--#ChangeInPower--At the Green Hydrogen Visions for the West Virtual Conference, a joint coalition spearheaded by the National Association of State Energy Officials (NASEO), the Western Interstate Energy Board (WIEB), and the Green Hydrogen Coalition (GHC) today announced the launch of the Western Green Hydrogen Initiative (WGHI) with the support of Mitsubishi Power.


WGHI is a public-private partnership to assist interested states and partners in advancing and accelerating deployment of green hydrogen infrastructure in the Western region for the benefit of the region’s economy and environment. The initiative will include engagement of interested Western states and two Canadian provinces. The WGHI will serve as the steering committee to assist in the development of a regional green hydrogen strategy, including the development of large-scale, long-duration green-hydrogen-based renewable energy storage.

Green hydrogen is a domestically produced, carbon-free resource that can increase the West’s energy reliability and independence, and create and repurpose jobs. Green hydrogen can help avoid uneconomic grid buildout, prevent renewable curtailment, repurpose existing infrastructure, reduce greenhouse gases and air pollution, reduce agricultural and municipal waste, and diversify fuels for multiple sectors from steel production to aviation. Until now, green hydrogen development in the West has been minimal. However, falling costs and increased deployment of variable renewable energy generation has spurred interest in green hydrogen from diverse stakeholders including investors, utilities and environmentalists. To enable investments at scale, green hydrogen must be compensated for the many benefits it provides.

“States have a critical role in creating market guidance that allows green hydrogen to be appropriately valued for its many benefits. Through the WGHI, interested Western states will be assisted in building the market fundamentals required for greater investment and a more integrated, higher-performing grid,” states David Terry, Executive Director at NASEO.

“As we saw this past summer, dependable dispatchable electric generating capacity is an important element of electric system reliability in the West,” observes Maury Galbraith, Executive Director of WIEB. “Green hydrogen is a promising fuel source that can contribute to maintaining electric system reliability while not compromising on meeting the aggressive clean energy goals of the Western states. The WGHI will provide a forum for moving forward on these important goals.”

Paul Browning, President and Chief Executive Officer of Mitsubishi Power Americas, adds, “For the past two decades, the carbon intensity of power generation in the Western United States has fallen as coal-fired power generation has been replaced by a combination of natural gas and renewables. To achieve the next phase of decarbonization in the West, we will need more renewables, energy storage, and green hydrogen. We’re proud to support the Western Green Hydrogen Initiative because we believe that green hydrogen is an essential technology to achieve net zero carbon emissions in the power sector.”

“The Green Hydrogen Coalition is proud to help launch this initiative that is vital in moving us towards a carbon-neutral future,” states Dr. Laura Nelson, Executive Director of GHC and former Energy Policy Advisor to the Governor of Utah. “As a clean resource for multiple diverse sectors, green hydrogen is the new clean strategic fuel for everyone. With all of the challenges we have been facing in the West, we must work quickly.”

Specifically, the WGHI will

  • Coordinate and leverage state, federal and industry Research, Development and Demonstration (RD&D) green hydrogen investments to guide priorities and scale commercial technology options
  • Address regulatory, policy and commercial barriers associated with the scaled production and use of green hydrogen
  • Support regional grid and gas sector modeling efforts to inform coordinated state policy actions and investment for green hydrogen utilizing existing energy infrastructure
  • Identify education and workforce opportunities that support the transition to a local and resilient green hydrogen energy system
  • Assist states in developing hydrogen storage and utilization roadmaps to advance innovation and expand opportunities for low-cost renewable energy to produce, use and store green hydrogen

To learn more about the Western Green Hydrogen Initiative or to become a supporter, visit www.WesternGHI.org.

About National Association of State Energy Officials (NASEO)

NASEO is the only national non-profit association for the governor-designated energy officials from each of the 56 states and territories. Formed by the states in 1986, NASEO facilitates peer learning among state energy officials, serves as a resource for and about state energy offices, and advocates the interests of the state energy offices to Congress and federal agencies.

About Western Interstate Energy Board (WIEB)

The Western Interstate Energy Board is an organization of 11 Western States and two Western Canadian Provinces. The legal basis of the Energy Board is the Western Interstate Nuclear Compact (Public Law 91-461). The governor of each state and the premier of each province appoints a member to the Board. The Compact provides for the President of the United States to appoint an ex-officio member to the Board.

About Green Hydrogen Coalition (GHC)

The Green Hydrogen Coalition (GHC) is an educational 501(c)3 non-profit organization dedicated to building top-down momentum for green hydrogen projects that leverage multi-sector opportunities to simultaneously scale supply and demand. Visit www.ghcoalition.org.

About Mitsubishi Power Americas, Inc.

Mitsubishi Power Americas, Inc. employs more than 2,000 power generation, energy storage, and digital solutions experts and professionals. Our employees are focused on empowering customers to affordably and reliably combat climate change while also advancing human prosperity. Our power generation solutions include natural gas, steam, aero-derivative, geothermal, distributed renewable technologies, environmental controls, and services. Energy storage solutions include green hydrogen and battery energy storage systems. Mitsubishi Power also offers digital solutions that enable autonomous operations and maintenance of power assets. Mitsubishi Power is a part of Mitsubishi Power, Ltd., a wholly owned subsidiary of Mitsubishi Heavy Industries, Ltd. (MHI). For more information, visit the Mitsubishi Power Americas website and our Change in Power website, and follow us on LinkedIn.


Contacts

Melanie Davidson
Director of Marketing
Green Hydrogen Coalition
This email address is being protected from spambots. You need JavaScript enabled to view it.
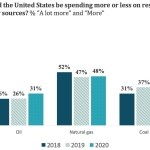
Phone: +1 (510) 296-0416

Sharon Prater
Marketing Communications Manager
Mitsubishi Power
This email address is being protected from spambots. You need JavaScript enabled to view it.
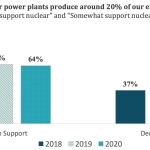
Phone: +1 (407) 688-6200

MANCHESTER, England--(BUSINESS WIRE)--Luxfer Holdings PLC (NYSE: LXFR), (“Luxfer” or the “Company”), a global manufacturer of highly-engineered industrial materials, today released its 2020 Environmental, Social and Governance (ESG) Report. Amid the COVID-19 pandemic, the report highlights the ways in which Luxfer is supporting its customers, employees, and communities to help drive positive environmental and social progress around the world.


Despite the challenges that the world has faced in 2020, Luxfer will continue delivering the products that our customers rely on to minimize the environmental impacts of their operations while also tackling our own,” said Alok Maskara, CEO of Luxfer. “ESG is here to stay, and it is important to us that our shareholders and stakeholders have an understanding of where Luxfer is now and where we want to be in the future.”

The Company has adopted environmental protection goals that address emissions, water and waste-to-landfill reduction targets which it seeks to achieve by 2025. The report discloses social and employment statistics, community outreach activities, and gives an overview of its governance structure and its role in ESG improvements.

To download the report and for more information on Luxfer’s ESG efforts visit https://www.luxfer.com/about/corporate-social-responsibility/.

About Luxfer Holdings PLC

Luxfer is a global manufacturer of highly-engineered industrial materials, which focuses on value creation by using its broad array of technical know-how and proprietary technologies. Luxfer’s high-performance materials, components, and high-pressure gas containment devices are used in defense and emergency response, healthcare, transportation, and general industrial applications. For more information, please visit www.luxfer.com.

Luxfer is listed on the New York Stock Exchange and its ordinary shares trade under the symbol LXFR.


Contacts

Luxfer Holdings PLC
Alok Maskara
+1 414-269-2419
This email address is being protected from spambots. You need JavaScript enabled to view it.

Offshore Source Logo

Offshore Source keeps you updated with relevant information concerning the Offshore Energy Sector.

Any views or opinions represented on this website belong solely to the author and do not represent those of the people, institutions or organizations that Offshore Source or collaborators may or may not have been associated with in a professional or personal capacity, unless explicitly stated.

Corporate Offices

Technology Systems Corporation
8502 SW Kansas Ave
Stuart, FL 34997

info@tscpublishing.com