Business Wire News

FORT WORTH, Texas--(BUSINESS WIRE)--FTS International, Inc. (NYSE American: FTSI) today reported its financial and operational results for the second quarter of 2020.


Michael Doss, Chief Executive Officer, commented “Due to the impacts of COVID-19 and the Saudi-Russian oil price war earlier this year, the second quarter was challenging for us and our industry. We reacted quickly in late March to adjust our business to lower demand by aggressively cutting costs to preserve liquidity. Sequentially, we were able to cut our annualized costs of revenue per active fleet by approximately $6 million and reduce our annualized SG&A by approximately $18 million.

We continue to expect a challenging market for the remainder of the year. While I am encouraged by the recent improvement in activity levels from the trough, margins are expected to remain compressed. With a firm grip on operating costs, low fleet reactivation costs and our ability to react quickly to market changes, I am confident that we will hold our position as a leader in through-cycle cash returns.”

Second Quarter 2020 Compared to the First Quarter 2020

  • Revenue was $29.5 million, down from $151.5 million
  • Net loss was $(50.7) million, compared to a loss of $(11.7) million
  • Earnings per share of $(9.43), compared to $(2.18)
  • Adjusted EBITDA was $(9.1) million, down from $22.3 million
  • Capital expenditures were $0.4 million, down from $16.4 million

Operational Update

Average active fleets during the second quarter was 5.0, down from 16.0 in the first quarter. Utilization of our active fleets averaged 46% during the second quarter, resulting in fully-utilized fleets of 2.3 during the second quarter. This compares to 88% utilization and fully-utilized fleets of 14.0 during the first quarter.

We completed 1,468 stages during the second quarter, or 638 stages per fully-utilized fleet. This compares to 6,888 stages during the first quarter, or 492 stages per fully-utilized fleet. The increase from the prior quarter was largely driven by customer and geographical mix, but also by an increase in average pumping hours per day.

While utilization of our active fleets was low due to significant white space in our operations calendar, we continued to further increase our average pumping hours per active day to an all-time high of 14.4 hours. Our highest utilized fleets routinely pump more than 18 pumping hours per active day. This exemplifies our unwavering attention to efficiency and safety even during challenging times.

We have 6 fleets active today and currently expect to average 6 to 7 active fleets in the third quarter. However, with limited visibility we also expect white space to persist in our operations calendar for the foreseeable future.

These increased activity levels are accretive to the company as we are only pursuing work that provides a positive contribution margin; however, we expect gross profit to be minimal due to the low pricing for our services and certain fixed costs. The largest fixed costs are contractual in nature and are for items that are not being fully utilized at today’s activity levels.

Liquidity and Capital Resources

Capital expenditures were $0.4 million in the second quarter, down from $16.4 million in the first quarter as we took quick action to preserve liquidity. Due to the low number of fleets operating, we were able to utilize the pumps that were most recently rebuilt for our active fleets. In the third quarter, we will continue to minimize capital expenditures. We currently expect to incur total capital expenditures between $20 million and $25 million for 2020.

As of June 30, 2020, our borrowing base and therefore our maximum availability under our revolving credit facility was $9.0 million. As of June 30, 2020, there were no borrowings outstanding under the credit facility, and letters of credit totaling $4.0 million were issued, resulting in $5.0 million of availability under the credit facility. This availability requires us to maintain a minimum fixed charge coverage ratio (“FCCR”) of 1.0 to 1.0. At our next compliance date in August 2020, we expect our FCCR to be below the minimum. We are evaluating our options, which include modifying or terminating the credit facility.

As of June 30, 2020, we had $192.5 million of cash and $437.3 million of gross debt. Net debt, excluding unamortized discount and debt issuance costs, was $244.8 million. Additionally, at quarter end, total liquidity was $197.5 million, including $5.0 million of availability under our revolving credit facility.

Conference Call & Webcast

We do not expect to host a conference call and webcast to discuss financial results for the second quarter.

About FTS International, Inc.

Headquartered in Fort Worth, Texas, FTS International is an independent hydraulic fracturing service company and one of the only vertically integrated service providers of its kind in North America.

To learn more, visit www.FTSI.com.

Non-GAAP Financial Measures

Adjusted EBITDA is a non-GAAP financial measure that we define as earnings before interest; income taxes; and depreciation and amortization, as well as, the following items, if applicable: gain or loss on disposal of assets; debt extinguishment gains or losses; inventory write-downs, asset and goodwill impairments; gain on insurance recoveries; acquisition earn-out adjustments; stock-based compensation; supply commitment charges; gain on sale of equity interest in joint venture affiliate; acquisition or disposition transaction costs; and employee severance costs related to corporate-wide cost reduction initiatives. The most comparable financial measure to Adjusted EBITDA under GAAP is net income or loss. The company also uses Adjusted EBITDA per average active fleet on an annualized basis, which is a non-GAAP measure and is defined as Adjusted EBITDA divided by the average active fleets per quarter then multiplying the result by four, and Adjusted EBITDA per fully-utilized fleet on an annualized basis, which is a non-GAAP measure and is defined as Adjusted EBITDA divided by the number of fully-utilized fleets during a quarter then multiplying the result by four. We calculate the number of fully-utilized active fleets during a quarter by multiplying utilization percentage by the average active fleets during a quarter. We calculate utilization percentage by multiplying average active fleets by 78 then dividing the result by the total number of active days during a quarter. 78 is the total number of days an active fleet could be active during a quarter not including transition or move days during a quarter. Adjusted EBITDA, Adjusted EBITDA per average active fleet on an annualized basis and Adjusted EBITDA per fully-utilized fleet on an annualized basis are used by management to evaluate the operating performance of the business for comparable periods and Adjusted EBITDA is a metric used for management incentive compensation. Adjusted EBITDA, Adjusted EBITDA per average active fleet on an annualized basis and Adjusted EBITDA per fully-utilized fleet on an annualized basis should not be used by investors or others as the sole basis for formulating investment decisions, as they exclude a number of important items. We believe Adjusted EBITDA, Adjusted EBITDA per average active fleet on an annualized basis and Adjusted EBITDA per fully-utilized fleet on an annualized basis are important indicators of operating performance because they exclude the effects of the company’s capital structure and certain non-cash items from the company’s operating results. Adjusted EBITDA is also commonly used by investors in the oilfield services industry to measure a company's operating performance, although our definition of Adjusted EBITDA may differ from other industry peer companies.

Net debt, excluding unamortized discount and debt issuance costs is a non-GAAP financial measure that we define as total long-term debt plus current maturities of long-term debt plus unamortized discount and debt issuance costs less cash and cash equivalents. The most comparable financial measure to net debt under GAAP is long-term debt. Net debt is used by management as a measure of our financial leverage and helps our investors better understand our financial leverage. Net debt should not be used by investors or others as the sole basis in formulating investment decisions as it does not represent the company’s actual indebtedness.

Forward-Looking and Cautionary Statements

This press release contains “forward-looking statements” within the meaning of the Private Securities Litigation Reform Act of 1995. Forward-looking statements include statements regarding market expectations, expected margins, our average active fleets and fleet utilization in the third quarter, expected gross profit and pricing for our services, capital expenditures for 2020, our future deployment of additional fleets, our fixed charge coverage ratio at our next compliance date, increases in our net working capital in the third quarter, and other statements identified by words such as “could,” “should,” “may,” “might,” “will,” “likely,” “anticipates,” “intends,” “plans,” “seeks,” “believes,” “estimates,” “expects,” “continues,” “projects” and similar references to future periods. Forward-looking statements are based on our current expectations and assumptions regarding capital market conditions, our business, the economy and other future conditions. Because forward-looking statements relate to the future, by their nature, they are subject to inherent uncertainties, risks and changes in circumstances that are difficult to predict. As a result, our actual results may differ materially from those contemplated by the forward-looking statements. Important factors that could cause actual results to differ materially from those in the forward-looking statements include, but are not limited to, further declines in domestic spending by the onshore oil and natural gas industry; continued volatility in oil and natural gas prices; the effect of a loss of, financial distress of, or decline in activity levels of, one or more significant customers; actions of the Organization of the Petroleum Exporting Countries, or OPEC, its members and other state-controlled oil companies relating to oil price and production controls; our inability to employ a sufficient number of key employees, technical personnel and other skilled or qualified workers; the price and availability of alternative fuels and energy sources; the discovery rates of new oil and natural gas reserves; the availability of water resources, suitable proppant and chemicals in sufficient quantities and pricing for use in hydraulic fracturing fluids; uncertainty in capital and commodities markets and the ability of oil and natural gas producers to raise equity capital and debt financing; our ability to manage the maturities of our term loan and senior notes; ongoing and potential securities litigation and other litigation and legal proceedings, including arbitration proceedings and our dispute with Covia Holdings Corporation regarding a terminated supply agreement; our ability to participate in consolidation opportunities within our industry; the ability to successfully manage the economic and operational challenges associated with a disease outbreak, including epidemics, pandemics, or similar widespread public health concerns, including the COVID-19 pandemic; the ultimate geographic spread, duration and severity of the COVID-19 outbreak, and the effectiveness of actions taken, or actions that may be taken, by governmental authorities to contain such outbreak or treat its impact; the ultimate duration and impact of geopolitical events that adversely affect the price of oil, including the Saudi-Russia price war earlier this year; and a deterioration in general economic conditions or a weakening of the broader energy industry. Any forward-looking statement made in this press release speaks only as of the date on which it is made. We undertake no obligation to publicly update or revise any forward-looking statement, whether as a result of new information, future developments or otherwise, except as required by law.

When considering these forward-looking statements, you should keep in mind the risk factors and other cautionary statements in our filings with the SEC. The risk factors and other factors noted in our filings with the SEC could cause the company’s actual results to differ materially from those contained in any forward-looking statement.


Consolidated Statements of Operations (unaudited)

Three Months Ended

Six Months Ended

Jun. 30,

Mar. 31,

Jun. 30,

Jun. 30,

Jun. 30,

(Dollars in millions, except per share amounts; shares in thousands)

2020

2020

2019

2020

2019

 
Revenue
Revenue $

29.5

$

150.8

$

225.8

$

180.3

$

447.4

Revenue from related parties

-

0.7

-

0.7

0.9

Total revenue

29.5

151.5

225.8

181.0

448.3

 
Operating expenses
Costs of revenue, excluding depreciation and amortization

28.9

114.6

164.8

143.5

326.9

Selling, general and administrative

13.2

17.7

21.7

30.9

45.3

Depreciation and amortization

20.2

21.4

22.8

41.6

45.2

Impairments and other charges

10.3

4.3

3.9

14.6

65.7

Loss (gain) on disposal of assets, net

0.2

(0.1)

(1.2)

0.1

(0.9)

Total operating expenses

72.8

157.9

212.0

230.7

482.2

 
Operating (loss) income

(43.3)

(6.4)

13.8

(49.7)

(33.9)

 
Interest expense, net

(7.4)

(7.3)

(7.7)

(14.7)

(15.9)

Gain on extinguishment of debt, net

-

2.0

(0.1)

2.0

0.4

Equity in net income of joint venture affiliate

-

-

-

-

0.6

 
(Loss) income before income taxes

(50.7)

(11.7)

6.0

(62.4)

(48.8)

Income tax expense

-

-

0.1

-

0.3

 
Net (loss) income $

(50.7)

$

(11.7)

$

5.9

$

(62.4)

$

(49.1)

 
Basic and diluted earnings per share $

(9.43)

$

(2.18)

$

1.08

$

(11.61)

$

(8.95)

 
Shares used in computing basic and diluted earnings per share

5,379

5,367

5,484

5,373

5,483


Consolidated Balance Sheets (unaudited)


Jun. 30,

Mar. 31,

Dec. 31

(Dollars in millions)

2020

2020

2019

 
ASSETS
Current assets
Cash and cash equivalents

$

192.5


$

199.2

$

223.0

Accounts receivable, net


20.8


78.6


77.0

Accounts receivable from related parties, net


-


0.6


-

Inventories


40.0


43.6


45.5

Prepaid expenses and other current assets


5.8


15.0


7.0

Total current assets


259.1


337.0


352.5

 
Property, plant, and equipment, net


203.7


223.1


227.0

Operating lease right-of-use assets


21.1


22.5


26.3

Intangible assets, net


29.5


29.5


29.5

Investment in joint venture affiliate


-


-


-

Other assets


3.8


3.9


4.0

Total assets

$

517.2


$

616.0

$

639.3

 
LIABILITIES AND STOCKHOLDERS' (DEFICIT) EQUITY
Current liabilities
Accounts payable

$

16.8


$

53.6

$

36.4

Accrued expenses


13.0


25.2


22.9

Current maturities of long-term debt


67.2


-


-

Current portion of operating lease liabilities


13.0


13.8


14.3

Other current liabilities


12.8


14.6


11.6

Total current liabilities


122.8


107.2


85.2

 
Long-term debt


367.8


434.7


456.9

Operating lease liabilities


9.7


10.5


13.9

Other liabilities


35.0


34.6


45.6

Total liabilities


535.3


587.0


601.6


Stockholders' (deficit) equity
Total stockholders' (deficit) equity


(18.1

)


29.0


37.7

Total liabilities and stockholders' (deficit) equity

$

517.2


$

616.0

$

639.3


Consolidated Statements of Cash Flows (unaudited)


Three Months Ended

Six Months Ended

Jun. 30,

Mar. 31,

Jun. 30,

Jun. 30,

Jun. 30,

(Dollars in millions)

2020

2020

2019

2020

2019

 
Cash flows from operating activities
Net (loss) income

$

(50.7

)

$

(11.7

)

$

5.9


$

(62.4

)

$

(49.1

)

Adjustments to reconcile net loss (income) to net cash provided by operating activities:
Depreciation and amortization


20.2


21.4


22.8


41.6


45.2


Stock-based compensation


3.5


3.1


3.7


6.6


6.7


Amortization of debt discounts and issuance costs


0.5


0.4


0.4


0.9


0.9


Impairment of assets


-


-


2.7


-


5.5


(Gain) loss on disposal of assets, net


0.2


(0.1

)


(1.2

)


0.1


(0.9

)

(Gain) loss on extinguishment of debt, net


-


(2.0

)


0.1


(2.0

)


(0.4

)

Inventory write-down


3.9


0.6


1.1


4.5


3.5


Non-cash provision for supply commitment charges


5.9


3.2


0.1


9.1


56.7


Cash paid to settle supply commitment charges


(7.6

)


(11.2

)


(15.9

)


(18.8

)


(15.9

)

Other non-cash items


(0.1

)


0.9


(0.1

)


0.8


(1.1

)

Changes in operating assets and liabilities:
Accounts receivable


57.8


(2.4

)


9.1


55.4


16.8


Accounts receivable from related parties


0.7


(0.7

)


-


-


-


Inventories


(0.3

)


1.3


7.1


1.0


4.6


Prepaid expenses and other assets


9.0


(8.1

)


(8.9

)


0.9


(8.6

)

Accounts payable


(37.5

)


16.2


(1.0

)


(21.3

)


(12.3

)

Accrued expenses and other liabilities


(11.8

)


2.3


(12.5

)


(9.5

)


(4.3

)

Net cash (used in) provided by operating activities


(6.3

)


13.2


13.4


6.9


47.3


Cash flows from investing activities
Capital expenditures


(0.4

)


(16.4

)


(14.8

)


(16.8

)


(26.5

)

Proceeds from disposal of assets


-


0.1


1.2


0.1


1.3


Net cash used in investing activities


(0.4

)


(16.3

)


(13.6

)


(16.7

)


(25.2

)

 
Cash flows from financing activities
Repayments of long-term debt


-


(20.6

)


(5.0

)


(20.6

)


(31.3

)

Repurchases of common stock


-


-


(4.6

)


-


(4.6

)

Taxes paid related to net share settlement of equity awards


-


(0.1

)


(0.2

)


(0.1

)


(1.9

)

Net cash used in financing activities


-


(20.7

)


(9.8

)


(20.7

)


(37.8

)

 
Net decrease in cash and cash equivalents


(6.7

)


(23.8

)


(10.0

)


(30.5

)


(15.7

)

Cash and cash equivalents at beginning of period


199.2


223.0


172.1


223.0


177.8


Cash and cash equivalents at end of period

$

192.5


$

199.2


$

162.1


$

192.5


$

162.1


Reconciliation of Net (Loss) Income to Adjusted EBITDA


Three Months Ended

Six Months Ended

Jun. 30,

Mar. 31,

Jun. 30,

Jun. 30,

Jun. 30,

(Dollars in millions, except fleets)

2020

2020

2019

2020

2019

 
Net (loss) income

$

(50.7

)

$

(11.7

)

$

5.9


$

(62.4

)

$

(49.1

)

Interest expense, net


7.4


7.3


7.7


14.7


15.9


Income tax expense


-


-


0.1


-


0.3


Depreciation and amortization


20.2


21.4


22.8


41.6


45.2


(Gain) loss on disposal of assets, net


0.2


(0.1

)


(1.2

)


0.1


(0.9

)

(Gain) loss on extinguishment of debt, net


-


(2.0

)


0.1


(2.0

)


(0.4

)

Stock-based compensation


3.5


3.1


3.7


6.6


6.7


Supply commitment charges


5.9


3.2


0.1


9.1


56.7


Inventory write-down


3.9


0.6


1.1


4.5


3.5


Impairment of assets


-


-


2.7


-


5.5


Employee severance costs


0.5


0.5


-


1.0


-


Adjusted EBITDA


(9.1

)


22.3


43.0


13.2


83.4


Adjusted EBITDA


(9.1

)


22.3


43.0


13.2


83.4


Average active fleets


5.0


16.0


21.0


10.5


20.5


Annualized adjusted EBITDA per average active fleet


(7.3

)


5.6


8.2


2.5


8.1


Adjusted EBITDA


(9.1

)


22.3


43.0


13.2


83.4


Fully-utilized fleets


2.3


14.0


18.2


8.2


17.6


Annualized adjusted EBITDA per fully-utilized fleet

$

(15.8

)

$

6.4


$

9.5


$

3.2


$

9.5


Average active fleets


5.0


16.0


21.0


10.5


20.5


Utilization %


46

%


88

%


87

%


78

%


86

%

Fully-utilized fleets


2.3


14.0


18.2


8.2


17.6


Reconciliation of Long-term Debt to Net Debt


Jun. 30,

Mar. 31,

Dec. 30,

(Dollars in millions)

2020

2020

2019

 
Term loan due April 2021

$

67.4


$

67.4


$

90.0


Senior notes due May 2022


369.9


369.9


369.9


Total principal amount of debt


437.3


437.3


459.9


Less current portion of long-term debt


(67.2

)


-


-


Less unamortized discount and debt issuance costs


(2.3

)


(2.6

)


(3.0

)

Total long-term debt


367.8


434.7


456.9


Add current maturities of long-term debt


67.2


-


-


Add unamortized discount and debt issuance costs


2.3


2.6


3.0


Total principal amount of debt


437.3


437.3


459.9


Less cash and cash equivalents


(192.5

)


(199.2

)


(223.0

)

Net debt

$

244.8


$

238.1


$

236.9


Contacts

Lance Turner
Chief Financial Officer
817-862-2000

HANGZHOU, China--(BUSINESS WIRE)--Total (China) Investment (the Company) has signed a Memorandum of Understanding (MoU) in order to pursue strategic collaboration with Alibaba Group (“Alibaba”) (NYSE: BABA; SEHK: 9988) and leverage their respective resources to drive the digital transformation of the Company’s operations in China.


Under the MoU, the two companies will develop in-depth collaboration based on the Alibaba Business Operating System (ABOS). Total (China) Investment will utilize Alibaba’s leading digital capabilities and technology across e-commerce, online payments, local services, supply chain, big data, and organizational management. The partnership will provide digital infrastructure and support for TOTAL’s service stations, lubricants and special fluids businesses in China, helping the company to enhance the accessibility and flexibility of its product offerings and services, accelerate its branded retail and outlet footprint and drive sustainable growth opportunities.

Total has been present in China for almost 40 years. This collaboration signifies that Total has become the first international energy company to leverage Alibaba ABOS, setting a digital transformation benchmark in the energy industry.

“Digital technology is a critical driver for achieving our excellence objectives across all of Total’s business segments. Total Group’s ambition is to generate as much as $1.5 billion in value per year for the company by 2025 through digital transformation initiatives,” said Ian Lepetit, President of Total (China) Investment. “China has a world-leading environment for digital innovation and a fertile ground for making it a reality. We hope the partnership will not only improve our business in this country but also create a best practice that we can roll out to Total Group’s overseas business, delivering better products, services and better customer experiences to more than 8 million customers everyday worldwide.”

“As one of the foremost players in the global energy industry, Total is renowned for an excellent lineup of products and services,” said Jet Jing, Vice President of Alibaba Group. “It is a privilege to work together and leverage the Alibaba Business Operating System to accelerate Total’s digital transformation, particularly in the areas of product innovations, customer acquisition, order fulfilment and organizational development. We believe the ABOS will support Total to establish a data-technology-driven and customer-centric operating system. Thriving on Alibaba’s integrated platforms and customer touch points, the ABOS will also facilitate Total to serve more customers, serve each customer to the fullest and provide better customer experience at a lower cost and in a more efficient manner.”

The partnership will cover Total (China) Investment’s major business activities (including service stations, lubricants business and car care business) and cooperate with more than 10 business units in the Alibaba Digital Economy. Total will have a cross-platform consumer-facing storefront, which will be launched to the market soon. Customers will be able to enjoy a seamless online-to-offline experience for TOTAL’s products and services on various popular apps, such as Taobao, Tmall, Alipay, Eleme and Amap, at anytime and anywhere.

Total has long been pursuing digital transformation. As part of an effort to efficiently implement its digital strategy, Total has adjusted its enterprise organizational structure, establishing the new role of Chief Digital Officer and appointing digital officers to its business segments.

About Alibaba Group

Alibaba Group’s mission is to make it easy to do business anywhere. The company aims to build the future infrastructure of commerce. It envisions that its customers will meet, work and live at Alibaba and that it will be a good company that lasts for 102 years.

About Total in China

Total has been present in China for almost 40 years. The Group was the first international energy company to enter China’s offshore oil and gas exploration and refining business.

With a team of more than 4,000 employees the company is actively present across the entire value chain of China’s energy industry, including Exploration & Production, Gas, Renewables & Power, Refining & Chemicals, and Marketing & Services activities. Total is constantly developing new business opportunities with Chinese partners both in China and globally.

About Total

Total is a broad energy Group, which produces and markets fuels, natural gas and low-carbon electricity. Our 100,000 employees are committed to better energy that is safer, more affordable, cleaner and accessible to as many people as possible. Active in more than 130 countries, our ambition is to become the responsible energy major.


Contacts

Johnny Tao
Total China
Tel: 010-85905613
Email: This email address is being protected from spambots. You need JavaScript enabled to view it.

Alex Liu
Alibaba Group
Tel: 18301299663
Email: This email address is being protected from spambots. You need JavaScript enabled to view it.

Jenny Hsu
Alibaba Group
Tel: +86 17857411742
Email: This email address is being protected from spambots. You need JavaScript enabled to view it.

SCOTTSDALE, Ariz.--(BUSINESS WIRE)--Nuverra Environmental Solutions, Inc. (NYSE American: NES) (“Nuverra,” the “Company,” “we,” “us” or “our”) today announced financial and operating results for the second quarter and six months ended June 30, 2020.

SUMMARY OF FINANCIAL RESULTS

  • Revenue for the second quarter of 2020 was $24.5 million compared to $45.2 million for the second quarter of 2019.
  • Net loss for the second quarter of 2020 was $6.8 million compared to a net loss of $5.0 million for the second quarter of 2019.
  • For the second quarter of 2020, adjusted EBITDA decreased $2.8 million to $2.5 million versus $5.3 million for the second quarter of 2019 driven by significant commodity price and subsequent activity declines year over year partially offset by meaningful fixed and variable cost reductions.
  • Revenue for the six months ended June 30, 2020 was $62.4 million compared to $87.9 million for the six months ended June 30, 2019.
  • Net loss for the six months ended June 30, 2020 was $29.8 million compared to a net loss of $11.4 million for the six months ended June 30, 2019, primarily a result of $15.6 million long-lived asset impairment charges taken in the six months ended June 30, 2020.
  • For the six months ended June 30, 2020, adjusted EBITDA decreased $5.4 million to $4.4 million versus $9.8 million for the six months ended June 30, 2019.
  • During the first half of 2020, the Company generated net cash provided by operating activities of $9.8 million.
  • Principal payments on debt and finance lease payments during the first half of 2020 totaled $3.0 million.
  • The Company invested $2.3 million in gross capital expenditures during the first half of 2020.

In these challenging times, we have continued to focus on growing market share and managing costs throughout the business while watching liquidity closely to best position the Company for the recovery. While oil prices have improved from the lows and some producers are turning wells back online, the macroeconomic challenges of COVID-19 and subsequent depressed commodity price environment will likely continue throughout the rest of the year. Our Rocky Mountain division experienced significant declines as expected in the second quarter due to the lower oil price, which was fortunately counterbalanced by some stability in our natural gas-focused Southern and Northeast divisions. On a bright note, we successfully amended our credit facilities, which is a very positive development in this extremely challenging debt market, generated more adjusted EBITDA in the second quarter of 2020 than we did in the first quarter, and ended the quarter with a cash balance of $15.8 million. While we remain cautious, we believe through intense focus, dedication and hard work by all employees at the Company we are positioned as well as we can be to weather this environment,” said Charlie Thompson, Chief Executive Officer.

SECOND QUARTER 2020 RESULTS

When compared to the second quarter of 2019, revenue decreased by 45.9%, or $20.8 million, resulting primarily from lower activity levels in water transport services and disposal services across all three divisions. The major underlying driver for this decrease was lower commodity prices for both crude oil and natural gas, which decreased 53.4% and 33.9%, respectively, over this time period. This led to a decline in both drilling and completion activity with fewer rigs operating in all three divisions as well as wells being shut-in primarily in the Northeast condensate window and the Rocky Mountain division by producers due to wells becoming uneconomic at prevailing oil prices and a lack of storage for oil and natural gas liquids as refineries significantly curtailed refined product production due to COVID-19-related demand loss for gasoline, diesel and jet fuel. Rig count at the end of the second quarter of 2020 compared to the end of the second quarter of 2019 declined 82% in the Rocky Mountain division, 52% in the Northeast division and 44% in the Southern division.

The Rocky Mountain division experienced a significant slowdown, with rig count declining 82% from 55 at June 30, 2019 to 10 at June 30, 2020 in addition to producers shutting in wells due to the decline in oil price, which averaged $28.00 in the second quarter of 2020 versus an average of $60.03 for the same period in 2019. Revenues for the Rocky Mountain division decreased by $16.8 million during the second quarter of 2020 as compared to the second quarter of 2019 primarily due to a decrease in water transport revenues from lower trucking volumes, with third-party trucking activity being the largest factor. While company-owned trucking activity is more levered to production water volumes, third-party trucking activity is more sensitive to drilling and completion activity, which has declined to historically low levels. Our rental and landfill businesses are our two service lines most levered to drilling activity and therefore have declined by the highest percentage versus the prior period. Rental revenues decreased by 62% in the current year due to lower utilization resulting from a significant decline in drilling activity driving the return of rental equipment. Additionally, we experienced a 74% decrease in disposal volumes at our landfill as rigs working in the vicinity declined materially. Well shut-ins and lower completion activity led to a 48% decrease in average barrels per day disposed in our saltwater disposal wells during the current year, with water from producing wells continuing to maintain a base level of volume activity.

Revenues for the Northeast division decreased by $2.6 million during the second quarter of 2020 as compared to the second quarter of 2019 due to decreases in both water transport services and disposal services. Natural gas prices, as measured by the Henry Hub Natural Gas Index decreased 33.9% from an average of $2.57 for the three months ended June 30, 2019 to an average of $1.70 for the three months ended June 30, 2020, contributing to a 52% rig count reduction in the Northeast operating area from 75 at June 30, 2019 to 36 at June 30, 2020. Additionally, as a result of the 53.4% decline in oil prices experienced during the period, many of our customers who had historically focused on production of liquids-rich wells reduced activity levels and shut in some production in our operating area due to lower realized prices for these products. This led to lower activity levels for both water transport services and disposal services despite the relatively lower decrease in natural gas prices versus crude oil. In addition to reduced drilling and completion activity due to commodity prices, our customers continued the industry trend of water reuse during completion activities. Water reuse inherently reduces trucking activity due to shorter hauling distances as water is being transported between well sites rather than to disposal wells. For our trucking services, total billable hours were down 11% from the prior year and pricing decreases also contributed to the decline. Disposal volumes decreased in our saltwater disposal wells resulting in a 15% decrease in average barrels per day.

The Southern division experienced the lowest revenue decline relative to the other business units, driven by its focus on servicing customers who are themselves focused on dry natural gas, which has experienced a relatively smaller impact from the 2020 downturn in commodity prices. Revenues for the Southern division decreased by $1.4 million during the second quarter of 2020 as compared to the second quarter of 2019 due primarily to lower disposal well volumes, whether connected to the pipeline or not, resulting from an activity slowdown in the region, as evidenced by fewer rigs operating in the area. Rig count declined 44% in the area, from 62 at June 30, 2019 to 35 at June 30, 2020. Volumes received in our disposal wells not connected to our pipeline decreased by an average of 12,471 barrels per day (or 39%) during the current year and volumes received in the disposal wells connected to the pipeline decreased by an average of 7,092 barrels per day (or 16%) during the current year.

Total costs and expenses for the second quarter of 2020 and 2019 were $30.2 million and $49.1 million, respectively. Total costs and expenses, adjusted for special items, for the second quarter of 2020 were $29.1 million, or a 40.9% decrease, when compared with $49.3 million in the second quarter of 2019. This is primarily a result of lower activity levels for water transport services and disposal services, resulting in a decline in compensation costs, third-party hauling costs and fleet-related expenses, including fuel and maintenance and repair costs. In addition, the Company enacted cost-cutting and optimization measures in the first quarter of 2020 which began to take effect in the second quarter of 2020.

Net loss for the second quarter of 2020 was $6.8 million, an increase of $1.8 million as compared to a net loss for the second quarter of 2019 of $5.0 million. For the second quarter of 2020, the Company reported a net loss, adjusted for special items, of $5.8 million. This compares with a net loss, adjusted for special items, of $5.3 million in the second quarter of 2019.

Adjusted EBITDA for the second quarter of 2020 was $2.5 million, a decrease of 52.2% as compared to adjusted EBITDA for the second quarter of 2019 of $5.3 million. The decrease is a function of the reasons discussed previously, with primary drivers being lower trucking volumes, saltwater disposal volumes and rental equipment utilization in the Rocky Mountain region. Second quarter of 2020 adjusted EBITDA margin was 10.3%, compared with 11.7% in the second quarter of 2019.

YEAR-TO-DATE (“YTD”) RESULTS FOR THE SIX MONTHS ENDED JUNE 30, 2020

When compared to YTD 2019, YTD 2020 revenue decreased by 29.0%, or $25.5 million, due primarily to lower activity levels in water transport services and disposal services across all three divisions. The major underlying driver for this decrease was lower commodity prices for both crude oil and natural gas, which decreased 36.0% and 33.9%, respectively, over this time period. This led to a decline in both drilling and completion activity with fewer rigs operating in all three divisions as well as wells being shut-in primarily in the Northeast condensate window and the Rocky Mountain division by producers due to wells becoming uneconomic at prevailing oil prices and a lack of storage for oil and natural gas liquids as refineries significantly curtailed refined product production due to COVID-19 related demand loss for gasoline, diesel and jet fuel. Rig count at the end of the second quarter of 2020 compared to the end of the second quarter of 2019 declined 82% in the Rocky Mountain division, 52% in the Northeast division and 44% in the Southern division.

The Rocky Mountain division experienced a significant slowdown, with rig count declining 82% from 55 at June 30, 2019 to 10 at June 30, 2020 in addition to producers shutting in wells due to the decline in oil price, which averaged $36.82 YTD 2020 versus an average of $57.53 for the same period in 2019. Revenues for the Rocky Mountain division decreased by $18.2 million during YTD 2020 as compared to YTD 2019 primarily due to a decrease in water transport revenues from lower trucking volumes, with third-party trucking activity being the largest factor. While company-owned trucking activity is more levered to production water volumes, third party trucking activity is more sensitive to drilling and completion activity, which has declined to historically low levels. Our rental and landfill businesses are our two service lines most levered to drilling activity and therefore have declined by the highest percentage versus the prior period. Rental revenues decreased by 34% in the current year due to lower utilization resulting from a significant decline in drilling activity driving the return of rental equipment. Additionally, we experienced a 37% decrease in disposal volumes at our landfill as rigs working in the vicinity declined materially. Well shut-ins and lower completion activity led to a 26% decrease in average barrels per day disposed in our saltwater disposal wells during the current year, with water from producing wells continuing to maintain a base level of volume activity.

Revenues for the Northeast division decreased by $4.6 million during YTD 2020 as compared to YTD 2019 due to decreases in both water transport services and disposal services. Natural gas prices, as measured by the Henry Hub Natural Gas Index decreased 33.9% from an average of $2.74 for YTD 2019 to an average of $1.81 for YTD 2020, contributing to a 52% rig count reduction in the Northeast operating area from 75 at June 30, 2019 to 36 at June 30, 2020. Additionally, as a result of the 36.0% decline in oil prices experienced during the period, many of our customers who had historically focused on production of liquids-rich wells reduced activity levels and shut-in some production in our operating area due to lower realized prices for these products. This led to lower activity levels for both water transport services and disposal services despite the relatively lower decrease in natural gas prices versus crude oil. In addition to reduced drilling and completion activity due to commodity prices, our customers continued the industry trend of water reuse during completion activities. Water reuse inherently reduces trucking activity due to shorter hauling distances as water is being transported between well sites rather than to disposal wells. For our trucking services, total billable hours were down 7% from the prior year and pricing decreases also contributed to the decline. Disposal volumes decreased in our saltwater disposal wells resulting in a 15% decrease in average barrels per day.

The Southern division experienced the lowest revenue decline relative to the other business units, driven by its focus on servicing customers who are themselves focused on dry natural gas, which has experienced a relatively smaller impact from the 2020 downturn in commodity prices. Revenues for the Southern division decreased by $2.7 million during YTD 2020 as compared to YTD 2019 due primarily to lower disposal well volumes, whether connected to the pipeline or not, resulting from an activity slowdown in the region, as evidenced by fewer rigs operating in the area. Rig count declined 44% in the area, from 62 at June 30, 2019 to 35 at June 30, 2020. Volumes received in our disposal wells not connected to our pipeline decreased by an average of 9,711 barrels per day (or 30%) during the current year, and volumes received in the disposal wells connected to the pipeline decreased by an average of 8,609 barrels per day (or 18%) during the current year.

Total costs and expenses for YTD 2020 and 2019 were $90.1 million and $96.4 million, respectively. Total costs and expenses, adjusted for special items, for YTD 2020 were $73.2 million, or a 24.2% decrease, when compared with $96.6 million for YTD 2019. This is primarily a result of lower activity levels for water transport services and disposal services, resulting in a decline in compensation costs, third-party hauling costs and fleet-related expenses, including fuel and maintenance and repair costs. In addition, the Company enacted cost-cutting and optimization measures in the first quarter of 2020 which began to take effect in the second quarter of 2020.

Net loss for YTD 2020 was $29.8 million, an increase of $18.5 million as compared to a net loss for YTD 2019 of $11.4 million. For YTD 2020, the Company reported a net loss, adjusted for special items, of $13.0 million. This compares with a net loss, adjusted for special items, of $11.5 million for YTD 2019.

Adjusted EBITDA for YTD 2020 was $4.4 million, a decrease of 55.0% as compared to adjusted EBITDA for the YTD 2019 of $9.8 million. The decrease is a function of the reasons discussed previously, with primary drivers being lower trucking volumes, saltwater disposal volumes and rental equipment utilization in the Rocky Mountain region. YTD 2020 adjusted EBITDA margin was 7.1%, compared with 11.2% in YTD 2019 driven primarily by lower margin work in 2020 and property tax reductions in 2019 that were not repeated in 2020.

CASH FLOW AND LIQUIDITY

Net cash provided by operating activities for the six months ended June 30, 2020 was $9.8 million, while gross capital expenditures of $2.3 million net of asset sales of $1.5 million consumed cash of $0.8 million. Net cash provided by financing activities was $1.0 million for the six months ended June 30, 2020, consisting primarily of $4.0 million of proceeds from the Paycheck Protection Program loan (“PPP Loan”) partially offset by principal payments on debt and finance lease payments.

As of June 30, 2020, total liquidity was $23.0 million, consisting of $17.3 million of cash and available revolver borrowings and $5.7 million delayed borrowing capacity under our second lien term loan. As of June 30, 2020, total debt outstanding was $37.9 million, consisting of $16.4 million under our senior secured term loan facility, $8.8 million under our second lien term loan facility, $4.0 million under our PPP Loan, $0.5 million for a vehicle term loan, $0.2 million for an equipment term loan and $8.0 million of finance leases.

On July 13, 2020, we entered into agreements with our lenders to extend the maturity date on our secured credit facilities and to modify the financial covenants to better reflect our current and projected financial profile. These amendments consisted of a Third Amendment to our First Lien Credit Agreement and the Second Amendment to our Second Lien Credit Agreement. The amendments extended the maturity of our first lien facility from February 7, 2021 to May 15, 2022, our second lien facility from October 7, 2021 to November 15, 2022, and included among other terms and conditions, deferral of the measurement of the fixed charge coverage ratio ("FCCR") covenant until the second quarter of 2021. Among other terms and conditions, the amendments prohibit draws on our revolving facility until the FCCR is above an established certain ratio, add a covenant that requires us to maintain a monthly minimum liquidity, and establish maximum capital expenditures covenants for 2020 and 2021.

About Nuverra

Nuverra Environmental Solutions, Inc. provides water logistics and oilfield services to customers focused on the development and ongoing production of oil and natural gas from shale formations in the United States. Our services include the delivery, collection, and disposal of solid and liquid materials that are used in and generated by the drilling, completion, and ongoing production of shale oil and natural gas. We provide a suite of solutions to customers who demand safety, environmental compliance and accountability from their service providers. Find additional information about Nuverra in documents filed with the U.S. Securities and Exchange Commission (“SEC”) at http://www.sec.gov.

Forward-Looking Statements

This press release contains forward-looking statements within the meaning of Section 27A of the United States Securities Act of 1933, as amended, and Section 21E of the United States Securities Exchange Act of 1934, as amended. You can identify these and other forward-looking statements by the use of words such as “anticipates,” “expects,” “intends,” “plans,” “predicts,” “believes,” “seeks,” “estimates,” “may,” “might,” “will,” “should,” “would,” “could,” “potential,” “future,” “continue,” “ongoing,” “forecast,” “project,” “target” or similar expressions, and variations or negatives of these words.

These statements relate to our expectations for future events and time periods. All statements other than statements of historical fact are statements that could be deemed to be forward-looking statements, and any forward-looking statements contained herein are based on information available to us as of the date of this press release and our current expectations, forecasts and assumptions, and involve a number of risks and uncertainties. Accordingly, forward-looking statements should not be relied upon as representing our views as of any subsequent date. Future performance cannot be ensured, and actual results may differ materially from those in the forward-looking statements. Some factors that could cause actual results to differ include, among others: the severity, magnitude and duration of the coronavirus disease 2019 ("COVID-19") pandemic and oil price declines; changes in commodity prices or general market conditions, acquisition and disposition activities; fluctuations in consumer trends, pricing pressures, transportation costs, changes in raw material or labor prices or rates related to our business and changing regulations or political developments in the markets in which we operate; risks associated with our indebtedness, including changes to interest rates, decreases in our borrowing availability, our ability to manage our liquidity needs and to comply with covenants under our credit facilities, including as a result of COVID-19 and oil price declines; the loss of one or more of our larger customers; delays in customer payment of outstanding receivables and customer bankruptcies; natural disasters, such as hurricanes, earthquakes and floods, pandemics (including COVID-19) or acts of terrorism, or extreme weather conditions, that may impact our business locations, assets, including wells or pipelines, distribution channels, or which otherwise disrupt our or our customers' operations or the markets we serve; disruptions impacting crude oil and natural gas transportation, processing, refining, and export systems, including litigation regarding the Dakota Access Pipeline; our ability to attract and retain key executives and qualified employees in strategic areas of our business; our ability to attract and retain a sufficient number of qualified truck drivers; the unfavorable change to credit and payment terms due to changes in industry condition or our financial condition, which could constrain our liquidity and reduce availability under our revolving credit facility; higher than forecasted capital expenditures to maintain and repair our fleet of trucks, tanks, equipment and disposal wells; control of costs and expenses; changes in customer drilling, completion and production activities, operating methods and capital expenditure plans, including impacts due to low oil and/or natural gas prices, shut-in production, decline in operating drilling rigs, closures or pending closures of third-party pipelines or the economic or regulatory environment; risks associated with the limited trading volume of our common stock on the NYSE American Stock Exchange, including potential fluctuation in the trading prices of our common stock; risks and uncertainties associated with the outcome of an appeal of the order confirming our previously completed plan of reorganization; risks associated with the reliance on third-party analyst and expert market projections and data for the markets in which we operate that is utilized in our strategy; present and possible future claims, litigation or enforcement actions or investigations; risks associated with changes in industry practices and operational technologies; risks associated with the operation, construction, development and closure of saltwater disposal wells, solids and liquids transportation assets, landfills and pipelines, including access to additional locations and rights-of-way, permitting and licensing, environmental remediation obligations, unscheduled delays or inefficiencies and reductions in volume due to micro- and macro-economic factors or the availability of less expensive alternatives; the effects of competition in the markets in which we operate, including the adverse impact of competitive product announcements or new entrants into our markets and transfers of resources by competitors into our markets; changes in economic conditions in the markets in which we operate or in the world generally, including as a result of political uncertainty; reduced demand for our services due to regulatory or other influences related to extraction methods such as hydraulic fracturing, shifts in production among shale areas in which we operate or into shale areas in which we do not currently have operations, and shifts to reuse of water in completion activities; the unknown future impact of changes in laws and regulation on waste management and disposal activities, including those impacting the delivery, storage, collection, transportation, and disposal of waste products, as well as the use or reuse of recycled or treated products or byproducts; and risks involving developments in environmental or other governmental laws and regulations in the markets in which we operate and our ability to effectively respond to those developments including laws and regulations relating to oil and natural gas extraction businesses, particularly relating to water usage, and the disposal and transportation of liquid and solid wastes.


Contacts

Nuverra Environmental Solutions, Inc.
Investor Relations
602-903-7802
This email address is being protected from spambots. You need JavaScript enabled to view it.


Read full story here

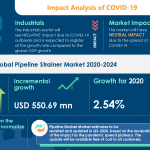
LONDON--(BUSINESS WIRE)--#GlobalPipelineStrainerMarket--Technavio has been monitoring the pipeline strainer market and it is poised to grow by USD 550.69 million during 2020-2024, progressing at a CAGR of almost 3% during the forecast period. The report offers an up-to-date analysis regarding the current market scenario, latest trends and drivers, and the overall market environment.


Although the COVID-19 pandemic continues to transform the growth of various industries, the immediate impact of the outbreak is varied. While a few industries will register a drop in demand, numerous others will continue to remain unscathed and show promising growth opportunities. Technavio’s in-depth research has all your needs covered as our research reports include all foreseeable market scenarios, including pre- & post-COVID-19 analysis. Download a Free Sample Report on COVID-19 Impacts

Frequently Asked Questions:

  • What is the year-over-year growth of the pipeline strainer market in 2020?
    As per Technavio, the year-over-year growth of the market in 2020 is estimated to be 2.54%.
  • Based on segmentation by application, which is the leading segment in the market?
    Industrial application.
  • At what rate is the market projected to grow?
    The market is projected to grow at a CAGR of almost 3% during 2020-2024.
  • Who are the top players in the market?
    Armstrong International Inc., Eaton Corp. Plc, Hayward Industries Inc., IFC Islip Flow Controls Inc., Keckley Co., OCK Engineers, Parker-Hannifin Corp., Sri Venkat Engineers, Watts Water Technologies Inc., and Weamco Inc. are the top players in the market.

The market is fragmented, and the degree of fragmentation will accelerate during the forecast period. Armstrong International Inc., Eaton Corp. Plc, Hayward Industries Inc., IFC Islip Flow Controls Inc., Keckley Co., OCK Engineers, Parker-Hannifin Corp., Sri Venkat Engineers, Watts Water Technologies Inc., and Weamco Inc. are some of the major market participants. To make the most of the opportunities, market vendors should focus more on the growth prospects in the fast-growing segments, while maintaining their positions in the slow-growing segments.

Buy 1 Technavio report and get the second for 50% off. Buy 2 Technavio reports and get the third for free.

View market snapshot before purchasing

The adoption of automatic strainers has been instrumental in driving the growth of the market. However, vulnerability to erosion and corrosion might hamper market growth.

Technavio's custom research reports offer detailed insights on the impact of COVID-19 at an industry level, a regional level, and subsequent supply chain operations. This customized report will also help clients keep up with new product launches in direct & indirect COVID-19 related markets, upcoming vaccines and pipeline analysis, and significant developments in vendor operations and government regulations.

Pipeline Strainer Market 2020-2024: Segmentation

Pipeline Strainer Market is segmented as below:

  • Application
    • Industrial
    • Commercial
    • Residential
  • Geographic Landscape
    • APAC
    • Europe
    • MEA
    • North America
    • South America

To learn more about the global trends impacting the future of market research, download a free sample: https://www.technavio.com/talk-to-us?report=IRTNTR40171

Pipeline Strainer Market 2020-2024: Scope

Technavio presents a detailed picture of the market by the way of study, synthesis, and summation of data from multiple sources. The pipeline strainer market report covers the following areas:

  • Pipeline Strainer Market Size
  • Pipeline Strainer Market Trends
  • Pipeline Strainer Market Industry Analysis

This study identifies the emergence of IoT for pipeline management as one of the prime reasons driving the pipeline strainer market growth during the next few years.

Technavio suggests three forecast scenarios (optimistic, probable, and pessimistic) considering the impact of COVID-19. Technavio’s in-depth research has direct and indirect COVID-19 impacted market research reports.

Register for a free trial today and gain instant access to 17,000+ market research reports. Technavio's SUBSCRIPTION platform

Pipeline Strainer Market 2020-2024: Key Highlights

  • CAGR of the market during the forecast period 2020-2024
  • Detailed information on factors that will assist pipeline strainer market growth during the next five years
  • Estimation of the pipeline strainer market size and its contribution to the parent market
  • Predictions on upcoming trends and changes in consumer behavior
  • The growth of the pipeline strainer market
  • Analysis of the market’s competitive landscape and detailed information on vendors
  • Comprehensive details of factors that will challenge the growth of pipeline strainer market, vendors

Table of Contents:

PART 01: EXECUTIVE SUMMARY

PART 02: SCOPE OF THE REPORT

  • 2.1 Preface
  • 2.2 Preface
  • 2.3 Currency conversion rates for US$

PART 03: MARKET LANDSCAPE

  • Market ecosystem
  • Market characteristics
  • Market segmentation analysis
  • Value chain analysis

PART 04: MARKET SIZING

  • Market definition
  • Market sizing 2019
  • Market outlook
  • Market size and forecast 2019-2024

PART 05: FIVE FORCES ANALYSIS

  • Bargaining power of buyers
  • Bargaining power of suppliers
  • Threat of new entrants
  • Threat of substitutes
  • Threat of rivalry
  • Market condition

PART 06: MARKET SEGMENTATION BY APPLICATION

  • Market segmentation by application
  • Comparison by application
  • Industrial - Market size and forecast 2019-2024
  • Commercial - Market size and forecast 2019-2024
  • Residential - Market size and forecast 2019-2024
  • Market opportunity by application

PART 07: CUSTOMER LANDSCAPE

PART 08: GEOGRAPHIC LANDSCAPE

  • Geographic segmentation
  • Geographic comparison
  • APAC - Market size and forecast 2019-2024
  • North America - Market size and forecast 2019-2024
  • Europe - Market size and forecast 2019-2024
  • MEA - Market size and forecast 2019-2024
  • South America - Market size and forecast 2019-2024
  • Key leading countries
  • Market opportunity

PART 09: DECISION FRAMEWORK

PART 10: DRIVERS AND CHALLENGES

  • Market drivers
  • Market challenges

PART 11: MARKET TRENDS

  • Increasing traction of additive manufacturing
  • Use of advanced materials for strainer manufacturing
  • Emergence of IoT for pipeline management

PART 12: VENDOR LANDSCAPE

  • Overview
  • Landscape disruption
  • Competitive scenario

PART 13: VENDOR ANALYSIS

  • Vendors covered
  • Vendor classification
  • Market positioning of vendors
  • Armstrong International Inc.
  • Eaton Corp. Plc
  • Hayward Industries Inc.
  • IFC Islip Flow Controls Inc.
  • Keckley Co.
  • OCK Engineers
  • Parker-Hannifin Corp.
  • Sri Venkat Engineers
  • Watts Water Technologies Inc.
  • Weamco Inc.

PART 14: APPENDIX

  • Research methodology
  • List of abbreviations
  • Definition of market positioning of vendors

PART 15: EXPLORE TECHNAVIO

About Us

Technavio is a leading global technology research and advisory company. Their research and analysis focuses on emerging market trends and provides actionable insights to help businesses identify market opportunities and develop effective strategies to optimize their market positions. With over 500 specialized analysts, Technavio’s report library consists of more than 17,000 reports and counting, covering 800 technologies, spanning across 50 countries. Their client base consists of enterprises of all sizes, including more than 100 Fortune 500 companies. This growing client base relies on Technavio’s comprehensive coverage, extensive research, and actionable market insights to identify opportunities in existing and potential markets and assess their competitive positions within changing market scenarios.


Contacts

Technavio Research
Jesse Maida
Media & Marketing Executive
US: +1 844 364 1100
UK: +44 203 893 3200
Email: This email address is being protected from spambots. You need JavaScript enabled to view it.
Website: www.technavio.com/

AUSTIN, Texas--(BUSINESS WIRE)--USA Compression Partners, LP (NYSE: USAC) (“USA Compression”) today announced that its senior management will attend the 2020 Citi One-on-One Midstream / Energy Infrastructure Conference. Senior management expects to participate in a series of virtual meetings with members of the investment community on August 12 and 13, and presentation materials used during these meetings will be posted to USA Compression’s website prior to the investor meetings. Please visit the Investor Relations section of the website at usacompression.com under “Presentations.”


About USA Compression Partners, LP

USA Compression Partners, LP is a growth-oriented Delaware limited partnership that is one of the nation’s largest independent providers of natural gas compression services in terms of total compression fleet horsepower. USA Compression partners with a broad customer base composed of producers, processors, gatherers and transporters of natural gas and crude oil. USA Compression focuses on providing natural gas compression services to infrastructure applications primarily in high-volume gathering systems, processing facilities and transportation applications. More information is available at usacompression.com.


Contacts

USA Compression Partners, LP
Matthew Liuzzi, CFO
(512) 369-1624
This email address is being protected from spambots. You need JavaScript enabled to view it.

Alliance provides integrated, open architecture software to maximize asset potential

HOUSTON--(BUSINESS WIRE)--Halliburton (NYSE: HAL) and Honeywell (NYSE: HON) today announced a collaboration to maximize asset potential, reduce execution risk and lower the total cost of ownership for oil and gas operators. The collaboration will leverage Halliburton Landmark’s DecisionSpace® 365 E&P cloud applications and Honeywell Forge, a powerful industrial analytics software solution, to deliver unparalleled insights about oil and gas assets.


Together, the companies bring deep domain expertise in subsurface and surface operations with the latest digital innovations to help operators address operational efficiency, asset productivity and risk across their business. Benefits include:

  • Maximize asset value by creating a digital twin on an integrated and open architecture that connects and models the supply chain from reservoir to point of sale.
  • Increase production, minimize OPEX/CAPEX and reduce operational risk by streamlining processes from downhole to surface controls, including digital solutions for improved subsurface insight.
  • Optimization of total asset and enterprise performance using real-time monitoring and remote operations.

“We look forward to working with Honeywell to co-innovate and deliver unique digital solutions for our customers that increase asset productivity and lower operating costs,” said Jeff Miller, chairman, president and chief executive officer of Halliburton. “Our alliance will help operators integrate people, processes and technology across the E&P value chain to maximize asset potential.”

“The Honeywell and Halliburton collaboration enables our oil and gas customers to make more informed, data-driven decisions from the field to the board room,” said Darius Adamczyk, chairman and chief executive officer of Honeywell. “Our customers will gain increased visibility into their operations so that they can improve productivity, reduce costs and enhance worker safety.”

About Halliburton

Founded in 1919, Halliburton is one of the world's largest providers of products and services to the energy industry. With approximately 40,000 employees, representing 140 nationalities in more than 80 countries, the company helps its customers maximize value throughout the lifecycle of the reservoir – from locating hydrocarbons and managing geological data, to drilling and formation evaluation, well construction and completion, and optimizing production throughout the life of the asset. Visit the company’s website at www.halliburton.com. Connect with Halliburton on Facebook, Twitter, LinkedIn, Instagram and YouTube.

About Honeywell

Honeywell (www.honeywell.com) is a Fortune 100 technology company that delivers industry-specific solutions that include aerospace products and services; control technologies for buildings and industry; and performance materials globally. Our technologies help aircraft, buildings, manufacturing plants, supply chains, and workers become more connected to make our world smarter, safer, and more sustainable. For more news and information on Honeywell, please visit www.honeywell.com/newsroom.


Contacts

For Halliburton

Investors:
Abu Zeya
Halliburton, Investor Relations
This email address is being protected from spambots. You need JavaScript enabled to view it.
281-871-2633

Media:
William Fitzgerald
Halliburton, External Affairs
This email address is being protected from spambots. You need JavaScript enabled to view it.
713-876-0105

For Honeywell

Mark Bendza
Honeywell, Investor Relations
This email address is being protected from spambots. You need JavaScript enabled to view it.
704-627-6190

Blake Herbert
Honeywell, External Communications
This email address is being protected from spambots. You need JavaScript enabled to view it.
803-835-8230

MIDLAND, Texas--(BUSINESS WIRE)--Concho Resources Inc. (NYSE: CXO) (“Concho” or the “Company”) today announced that it has priced an offering of a total of $500 million aggregate principal amount of senior unsecured notes due 2031 (the “notes”). The notes will bear interest at a rate of 2.40% per annum and will be issued at 99.761% of par. The notes offering is expected to close on August 24, 2020, subject to the satisfaction of customary closing conditions. Concho intends to use the net proceeds from this offering for general corporate purposes, including, together with cash on hand, to redeem all of its outstanding 4.375% senior notes due 2025 (the “2025 notes”).


BofA Securities, J.P. Morgan and Wells Fargo Securities will act as joint bookrunning managers for the senior unsecured notes offering. The offering will be made only by means of a preliminary prospectus supplement and the accompanying base prospectus, copies of which may be obtained on the Securities and Exchange Commission (“SEC”) website at www.sec.gov. Alternatively, the underwriters will arrange to send you the preliminary prospectus supplement and related base prospectus if you request them by contacting BofA Securities, Inc., 200 North College Street, NC1-004-03-43, Charlotte, NC 28255-0001, Attention: Prospectus Department, or by e-mailing This email address is being protected from spambots. You need JavaScript enabled to view it., or via phone at (800) 294-1322; J.P. Morgan Securities LLC, 383 Madison Avenue, New York, NY 10179, Attention: Investment Grade Syndicate Desk, or via phone at (212) 834-4533; or Wells Fargo Securities, LLC, 608 2nd Avenue South, Suite 1000, Minneapolis, MN 55402, Attention: WFS Customer Service, or by e-mailing This email address is being protected from spambots. You need JavaScript enabled to view it., or via phone at (800) 645-3751.

This press release is neither an offer to sell nor a solicitation of an offer to buy any securities, nor shall there be any sale of any such securities in any state or jurisdiction in which such offer, solicitation or sale would be unlawful prior to registration or qualification under the securities laws of any such state or jurisdiction. A registration statement, as amended, relating to the securities has been filed and became effective June 14, 2018. This press release is not intended as a notice of redemption. Any such notice will be given to holders of the 2025 notes in a manner prescribed in the indenture governing those notes.

Concho Resources Inc.

Concho Resources (NYSE: CXO) is one of the largest unconventional shale producers in the Permian Basin, with operations focused on safely and efficiently developing oil and natural gas resources. We are working today to deliver a better tomorrow for our shareholders, people and communities. For more information about Concho, visit www.concho.com.

Forward-Looking Statements and Cautionary Statements

The foregoing contains “forward-looking statements” within the meaning of Section 27A of the Securities Act of 1933, as amended, and Section 21E of the Securities Exchange Act of 1934, as amended. All statements, other than statements of historical fact, included in this press release that address activities, events or developments that the Company expects, believes or anticipates will or may occur in the future are forward-looking statements. The words “estimate,” “project,” “predict,” “believe,” “expect,” “anticipate,” “potential,” “could,” “may,” “enable,” “strategy,” “intend,” “positioned,” “foresee,” “plan,” “will,” “guidance,” “outlook,” “goal,” “target” or other similar expressions that convey the uncertainty of future events or outcomes are intended to identify forward-looking statements, which generally are not historical in nature. However, the absence of these words does not mean that the statements are not forward-looking. These statements are based on certain assumptions and analyses made by the Company based on management’s experience, expectations and perception of historical trends, current conditions, current plans, anticipated future developments, expected financings, the impact of the COVID-19 pandemic and the actions taken by regulators and third parties in response to such pandemic and other factors believed to be appropriate. Forward-looking statements are not guarantees of performance. Although the Company believes the expectations reflected in its forward-looking statements are reasonable and are based on reasonable assumptions, no assurance can be given that these assumptions are accurate or that any of these expectations will be achieved (in full or at all) or will prove to have been correct. Moreover, such statements are subject to a number of assumptions, risks and uncertainties, many of which are beyond the control of the Company, which may cause actual results to differ materially from those implied or expressed by the forward-looking statements. These include the risk factors and other information discussed or referenced in the Company’s most recent Annual Report on Form 10-K, Quarterly Report on Form 10-Q and other filings with the SEC. In particular, the unprecedented nature of the current economic downturn, pandemic and industry decline may make it particularly difficult to identify risks or predict the degree to which identified risks will impact the Company’s business and financial condition.

Any forward-looking statement speaks only as of the date on which such statement is made, and the Company undertakes no obligation to correct or update any forward-looking statement, whether as a result of new information, future events or otherwise, except as required by applicable law. Information on Concho’s website is not part of this press release.


Contacts

INVESTOR RELATIONS
Megan P. Hays
Vice President of Investor Relations & Public Affairs
432.685.2533

MEDIA
Mary T. Starnes
Manager of Public Affairs & Corporate Responsibility Strategy
432.221.0477

DUBLIN--(BUSINESS WIRE)--The "South Africa Solar Power Market Outlook to 2025" report has been added to ResearchAndMarkets.com's offering.


In the last decade, solar power capacity has grown tremendously to become the fastest-growing source of renewable energy in the world. However, in 2019, around 109 GW of new solar PV capacity was added worldwide, about the same as in 2018. The rapid installations were primarily due to policy support and a sharp decline in technology costs and growing environmental concerns.

However, with the economic downturn induced by the outbreak of Covid-19, demand from the residential PV segment will be severely affected due to the financial uncertainty faced by the customers. Commercial and industrial installations are expected to be negatively affected as discretionary spending will be delayed, and preserving short-term cash flow will become a priority. Further, in the utility segment, supply chain disruptions and weaker investment will lead to delays in project commissioning.

According to this report, despite the slowdown expected in 2020 due to the coronavirus pandemic's challenges, the outlook for solar remains strong in the medium term, and the market is expected to expand during the forecast period as the cost of generation from solar PV is increasingly becoming cheaper than its alternatives.

The South Africa Solar Power Market Outlook report provides a comprehensive analysis on the historical development, the current state of solar power installation scenario, and its outlook. Most of the insights in the report are derived from proprietary databases, and offerings. The insights include but are not limited to the market data, installation data and capacity additions data, policies and regulations, project data, company profiles, and competitive landscape analysis.

The report covers market dynamics, growth potential of the photovoltaic (PV) and concentrated solar power (CSP) markets, economic trends, and investment and financing scenario in South Africa. Furthermore, the report looks at the current state and assesses the potential of residential, non-residential, and utility-scale solar PV deployment.

Special attention is given to depicting the impact of the ongoing COVID-19 pandemic, national solar PV production/manufacturing scenario, and the country's imports and exports.

Key Topics Covered:

1. Executive Summary

2. Research Scope and Methodology

3. Market Analysis

3.1 Introduction

3.2 Market Dynamics

3.2.1. Drivers

3.2.2 Restraints

3.3 Market Trends & Developments

3.4 Analysis of Covid-19 Impact

3.5 Market Opportunities

3.6 Key Projects

3.7 Government Policies and Regulations

4. Market Outlook

4.1 Annual Solar Power Installed Capacity, 2001-2025, in GW

4.2 Cumulative Solar Power Installed Capacity Forecast, 2001-2025, in GW

5. Business Activity Analysis

5.1 Supply Chain Analysis

5.2 PESTLE Analysis

6. Market Segmentation & Analysis

6.1 By Technology

6.1.1 Photovoltaic (PV)

6.1.2 Concentrated Solar Power (CSP)

6.2 PV Deployment by Segment

6.2.1 Residential

6.2.2 Non-Residential

6.2.3 Utility

7. Competitive Landscape

7.1 List of Notable Players in the Market

7.2 M&A, JVs, Partnerships and Agreements

7.3 Strategies of Key Players

8. Key Company Profiles

9. Conclusions and Recommendations

Companies Mentioned

  • JinkoSolar Holding Co. Ltd.
  • JA Solar Holdings
  • Trina Solar Limited
  • LONGi Solar
  • Canadian Solar Inc
  • Hanwha Q Cells Co.Ltd.
  • Risen Energy
  • GCL System Integration Technology
  • First Solar Inc.

For more information about this report visit https://www.researchandmarkets.com/r/18g2iq

About ResearchAndMarkets.com

ResearchAndMarkets.com is the world's leading source for international market research reports and market data. We provide you with the latest data on international and regional markets, key industries, the top companies, new products and the latest trends.


Contacts

ResearchAndMarkets.com
Laura Wood, Senior Press Manager
This email address is being protected from spambots. You need JavaScript enabled to view it.
For E.S.T Office Hours Call 1-917-300-0470
For U.S./CAN Toll Free Call 1-800-526-8630
For GMT Office Hours Call +353-1-416-8900

Extension of DJ Basin Produced Water Agreement through 2027

TULSA, Okla.--(BUSINESS WIRE)--NGL Energy Partners LP (NYSE:NGL) (“NGL,” “our,” “we,” or the “Partnership”) today reported its first quarter fiscal 2021 results. Highlights for the quarter include:


  • Loss from continuing operations for the first quarter of Fiscal 2021 of $33.8 million, compared to income from continuing operations of $9.0 million for the first quarter of Fiscal 2020
  • Adjusted EBITDA from continuing operations for the first quarter of Fiscal 2021 of $91.0 million, compared to $103.7 million for the first quarter of Fiscal 2020
  • Results impacted by the COVID-19 pandemic and significant commodity price volatility, which resulted in lower demand for crude oil, liquids and refined products as well as lower crude oil prices, production volumes and drilling activity
  • Fiscal Year 2021 Adjusted EBITDA expected to range between $560 million and $600 million

Subsequent to June 30, 2020, the Partnership announced the following:

  • New, long-term extension of a current produced water transportation and disposal agreement with an existing customer, which is a leading, independent producer customer in the DJ Basin. The agreement continues our acreage dedication totaling approximately 180,000 acres in Weld County through December 2027
  • Multiple agreements and extensions, including incremental acreage dedications, with key producers in the Delaware Basin
  • New and extended contracts are expected to be serviced with the Partnership’s existing infrastructure

“Our first quarter results do not fully reflect the actions the Partnership has taken to maximize earnings through this unique environment,” stated Mike Krimbill, NGL’s CEO. “We benefited significantly from our crude oil storage assets during the period; however, these benefits are not immediately evident as we have recognized hedge losses on inventory this quarter on product that will be sold with profits recognized in the second quarter. We also held most of the skim oil barrels recovered in inventory during the quarter due to the low crude prices and have been selling those barrels in the second quarter at much higher price levels. We believe May and June to be the low point in our water volumes as we have seen producers bring production back online and increase activity with crude prices now exceeding $40.00 per barrel. We accomplished the following during the quarter in our Water Solutions segment:

- Reduced operating expenses by approximately $2.0 million per month beginning in June;

- Increased our market share in the Delaware Basin and DJ Basin through long-term contract extensions and incremental acreage dedications; and

- Lowered both growth and maintenance capital expenditures by leveraging the scale of our newly installed, fully integrated system to capture, process and dispose of produced water.”

“We continue to focus on the future to create value for our unitholders,” Krimbill concluded.

Quarterly Results of Operations

The following table summarizes operating income (loss) and Adjusted EBITDA from continuing operations by reportable segment for the periods indicated:


Quarter Ended


June 30, 2020


June 30, 2019


Operating
Income (Loss)


Adjusted
EBITDA


Operating
Income (Loss)


Adjusted
EBITDA


(in thousands)

Crude Oil Logistics


$

23,320


$

30,854


$

33,802


$

52,074


Liquids and Refined Products


4,562


12,232


15,371


18,136


Water Solutions


(16,047

)


56,926


13,689


41,089


Corporate and Other


(22,620

)


(9,030

)


(15,342

)


(7,581

)

Total


$

(10,785

)


$

90,982


$

47,520


$

103,718


The tables included in this release reconcile operating income (loss) to Adjusted EBITDA from continuing operations, a non-GAAP financial measure, on a consolidated basis and for each of the Partnership’s reportable segments.

Crude Oil Logistics

Results for the first quarter of Fiscal 2021 declined compared to the first quarter of Fiscal 2020 primarily due to commodity prices and lower crude oil demand as a result of the COVID-19 pandemic. In addition, we incurred losses of $9.8 million on the settlement of derivatives during the current quarter compared to gains of $1.4 million on the settlement of derivatives in the prior year quarter. These losses were on derivative positions that were rolled from June to future months to protect inventory from significant changes in market value. The inventory, which is valued at cost as of June 30, 2020, is sold forward at market prices and the Partnership expects to realize an offsetting gain on this inventory when it is sold in subsequent periods.

During the three months ended June 30, 2020, financial volumes on the Grand Mesa Pipeline averaged approximately 119,000 barrels per day; however, net realized margins on certain volumes purchased and shipped on the pipeline were negatively impacted by the extreme crude oil price volatility during the period. The Partnership estimates a negative impact from these barrels of approximately $11 million during the quarter compared to historical results.

In June 2020, a significant shipper on the Grand Mesa Pipeline filed a petition for bankruptcy under Chapter 11 of the bankruptcy code. This third-party has transportation contracts pursuant to which it has committed to ship crude oil on the Partnership’s pipeline through October 2026. As part of the bankruptcy filing, the third-party has requested that the court authorize it to reject these transportation contracts. The Partnership has filed an objection and a hearing on this matter is set to take place on September 3, 2020. To date, both parties have continued to operate under existing agreements.

Liquids and Refined Products

Total product margin per gallon was $0.027 for the quarter ended June 30, 2020, compared to $0.039 for the quarter ended June 30, 2019. This decrease was primarily the result of lower refined products, butane and other product margins, driven primarily by lower demand for these products as a result of the COVID-19 pandemic and lower commodity prices.

Refined products volumes decreased by approximately 109.7 million gallons, or 34.1%, during the quarter ended June 30, 2020 compared to the quarter ended June 30, 2019. Propane volumes increased by approximately 7.0 million gallons, or 2.9%, and butane volumes decreased by approximately 22.9 million gallons, or 16.1%, when compared to the quarter ended June 30, 2019. Other product volumes decreased by approximately 40.4 million gallons, or 26.1%, during the quarter ended June 30, 2020 compared to the same period in the prior year. The decrease in refined products, butane and other product volumes was also primarily due to lower demand as a result of the COVID-19 pandemic.

Water Solutions

The Partnership processed approximately 1.4 million barrels of water per day during the quarter ended June 30, 2020, a 61.0% increase when compared to approximately 849,000 barrels of produced water processed per day during the quarter ended June 30, 2019. This increase was primarily driven by our acquisition of Mesquite Disposals Unlimited, LLC (“Mesquite”) and Hillstone Environmental Partners, LLC in the Delaware Basin and was partially offset by lower disposal volumes in all other basins during the period resulting from lower crude oil prices, drilling activity and production volumes.

Revenues from recovered crude oil, including the impact from realized skim oil hedges, totaled $10.1 million for the quarter ended June 30, 2020, a decrease of $7.1 million from the prior year period. The Partnership made the strategic decision to store the majority of its recovered crude oil at its various facilities through the quarter, resulting in significantly lower physical skim oil sales. The Partnership expects to sell the stored skim oil during the three months ended September 30, 2020, along with the barrels recovered during that period.

Operating expenses in the Water Solutions segment decreased on a per barrel basis to $0.32 compared to $0.42 per barrel in the comparative quarter last year. The Partnership has taken significant steps to reduce operating costs and continues to evaluate cost saving initiatives in the current environment.

Additionally, the Partnership recently announced new agreements, including acreage dedications, with key producers in the Delaware Basin and expects to service these customers’ produced water needs with its existing infrastructure. The Partnership also announced today that it has executed a new, long-term extension of a current produced water transportation and disposal agreement in the DJ Basin through December 2027.

Corporate and Other

Corporate and Other expenses increased from the comparable prior year period primarily due to the loss recorded for the uncollectible portion of our loan receivable with a third party and increased legal costs.

Capitalization and Liquidity

Total debt outstanding was $3.29 billion at June 30, 2020 compared to $3.15 billion at March 31, 2020, an increase of $136 million due primarily to the funding of certain capital expenditures incurred prior to and accrued on March 31, 2020 and $66.3 million of the remaining $100.0 million deferred purchase price of Mesquite. Capital expenditures incurred totaled $29.9 million during the first quarter and are expected to continue to decrease throughout Fiscal 2021, with full year expectations of $100 million for both growth and maintenance capital expenditures combined. Total liquidity (cash plus available capacity on our revolving credit facility) was approximately $198.2 million as of June 30, 2020 and the Partnership is in compliance with all of its debt covenants.

First Quarter Conference Call Information

A conference call to discuss NGL’s results of operations is scheduled for 4:00 pm Central Time on Monday, August 10, 2020. Analysts, investors, and other interested parties may access the conference call by dialing (800) 291-4083 and providing access code 1189407. An archived audio replay of the conference call will be available for 7 days beginning at 1:00 pm Central Time on August 11, 2020, which can be accessed by dialing (855) 859-2056 and providing access code 1189407.

Non-GAAP Financial Measures

NGL defines EBITDA as net income (loss) attributable to NGL Energy Partners LP, plus interest expense, income tax expense (benefit), and depreciation and amortization expense. NGL defines Adjusted EBITDA as EBITDA excluding net unrealized gains and losses on derivatives, lower of cost or net realizable value adjustments, gains and losses on disposal or impairment of assets, gains and losses on early extinguishment of liabilities, equity-based compensation expense, acquisition expense, revaluation of liabilities, certain legal settlements and other. NGL also includes in Adjusted EBITDA certain inventory valuation adjustments related to TransMontaigne Product Services, LLC (“TPSL”), our refined products business in the mid-continent region of the United States (“Mid-Con”) and our gas blending business in the southeastern and eastern regions of the United States (“Gas Blending”), which are included in discontinued operations, and certain refined products businesses within NGL’s Liquids and Refined Products segment, as discussed below. EBITDA and Adjusted EBITDA should not be considered as alternatives to net (loss) income, (loss) income from continuing operations before income taxes, cash flows from operating activities, or any other measure of financial performance calculated in accordance with GAAP, as those items are used to measure operating performance, liquidity or the ability to service debt obligations. NGL believes that EBITDA provides additional information to investors for evaluating NGL’s ability to make quarterly distributions to NGL’s unitholders and is presented solely as a supplemental measure. NGL believes that Adjusted EBITDA provides additional information to investors for evaluating NGL’s financial performance without regard to NGL’s financing methods, capital structure and historical cost basis. Further, EBITDA and Adjusted EBITDA, as NGL defines them, may not be comparable to EBITDA, Adjusted EBITDA, or similarly titled measures used by other entities.

Other than for the TPSL, Mid-Con, and Gas Blending businesses, which are included in discontinued operations, and certain businesses within NGL’s Liquids and Refined Products segment, for purposes of the Adjusted EBITDA calculation, NGL makes a distinction between realized and unrealized gains and losses on derivatives. During the period when a derivative contract is open, NGL records changes in the fair value of the derivative as an unrealized gain or loss. When a derivative contract matures or is settled, NGL reverses the previously recorded unrealized gain or loss and record a realized gain or loss. NGL does not draw such a distinction between realized and unrealized gains and losses on derivatives of the TPSL, Mid-Con, and Gas Blending businesses, which are included in discontinued operations, and certain businesses within NGL’s Liquids and Refined Products segment. The primary hedging strategy of these businesses is to hedge against the risk of declines in the value of inventory over the course of the contract cycle, and many of the hedges cover extended periods of time. The “inventory valuation adjustment” row in the reconciliation table reflects the difference between the market value of the inventory of these businesses at the balance sheet date and its cost, adjusted for the impact of seasonal market movements related to our base inventory and the related hedge. NGL includes this in Adjusted EBITDA because the unrealized gains and losses associated with derivative contracts associated with the inventory of this segment, which are intended primarily to hedge inventory holding risk and are included in net income, also affect Adjusted EBITDA.

Distributable Cash Flow is defined as Adjusted EBITDA minus maintenance capital expenditures, income tax expense, cash interest expense, preferred unit distributions and other. Maintenance capital expenditures represent capital expenditures necessary to maintain the Partnership’s operating capacity. Distributable Cash Flow is a performance metric used by senior management to compare cash flows generated by the Partnership (excluding growth capital expenditures and prior to the establishment of any retained cash reserves by the Board of Directors) to the cash distributions expected to be paid to unitholders. Using this metric, management can quickly compute the coverage ratio of estimated cash flows to planned cash distributions. This financial measure also is important to investors as an indicator of whether the Partnership is generating cash flow at a level that can sustain, or support an increase in, quarterly distribution rates. Actual distribution amounts are set by the Board of Directors.

Forward-Looking Statements

This press release includes “forward-looking statements.” All statements other than statements of historical facts included or incorporated herein may constitute forward-looking statements. Actual results could vary significantly from those expressed or implied in such statements and are subject to a number of risks and uncertainties. While NGL believes such forward-looking statements are reasonable, NGL cannot assure they will prove to be correct. The forward-looking statements involve risks and uncertainties that affect operations, financial performance, and other factors as discussed in filings with the Securities and Exchange Commission. Other factors that could impact any forward-looking statements are those risks described in NGL’s Annual Report on Form 10-K, Quarterly Reports on Form 10-Q, and other public filings. You are urged to carefully review and consider the cautionary statements and other disclosures made in those filings, specifically those under the heading “Risk Factors.” NGL undertakes no obligation to publicly update or revise any forward-looking statements except as required by law.

NGL provides Adjusted EBITDA guidance that does not include certain charges and costs, which in future periods are generally expected to be similar to the kinds of charges and costs excluded from Adjusted EBITDA in prior periods, such as income taxes, interest and other non-operating items, depreciation and amortization, net unrealized gains and losses on derivatives, lower of cost or net realizable value adjustments, gains and losses on disposal or impairment of assets, gains and losses on early extinguishment of liabilities, equity-based compensation expense, acquisition expense, revaluation of liabilities and items that are unusual in nature or infrequently occurring. The exclusion of these charges and costs in future periods will have a significant impact on the Partnership’s Adjusted EBITDA, and the Partnership is not able to provide a reconciliation of its Adjusted EBITDA guidance to net income (loss) without unreasonable efforts due to the uncertainty and variability of the nature and amount of these future charges and costs and the Partnership believes that such reconciliation, if possible, would imply a degree of precision that would be potentially confusing or misleading to investors.

About NGL Energy Partners LP

NGL Energy Partners LP, a Delaware limited partnership, is a diversified midstream energy company that transports, stores, markets and provides other logistics services for crude oil, natural gas liquids and other products and transports, treats and disposes of produced water generated as part of the oil and natural gas production process. For further information, visit the Partnership’s website at www.nglenergypartners.com.


NGL ENERGY PARTNERS LP AND SUBSIDIARIES

Unaudited Condensed Consolidated Balance Sheets

(in Thousands, except unit amounts)


June 30, 2020


March 31, 2020

ASSETS


CURRENT ASSETS:


Cash and cash equivalents

$

26,400


$

22,704


Accounts receivable-trade, net of allowance for expected credit losses of $3,674 and $4,540, respectively

424,814


566,834


Accounts receivable-affiliates

14,814


12,934


Inventories

135,918


69,634


Prepaid expenses and other current assets

75,433


101,981


Total current assets

677,379


774,087


PROPERTY, PLANT AND EQUIPMENT, net of accumulated depreciation of $570,806 and $529,068, respectively

2,833,002


2,851,555


GOODWILL

993,114


993,587


INTANGIBLE ASSETS, net of accumulated amortization of $670,382 and $631,449, respectively

1,574,216


1,612,480


INVESTMENTS IN UNCONSOLIDATED ENTITIES

22,626


23,182


OPERATING LEASE RIGHT-OF-USE ASSETS

177,010


180,708


OTHER NONCURRENT ASSETS

48,739


63,137


Total assets

$

6,326,086


$

6,498,736


LIABILITIES AND EQUITY


CURRENT LIABILITIES:


Accounts payable-trade

$

367,463


$

515,049


Accounts payable-affiliates

22,864


17,717


Accrued expenses and other payables

142,836


232,062


Advance payments received from customers

25,326


19,536


Current maturities of long-term debt

4,521


4,683


Operating lease obligations

53,720


56,776


Total current liabilities

616,730


845,823


LONG-TERM DEBT, net of debt issuance costs of $24,022 and $19,795, respectively, and current maturities

3,281,402


3,144,848


OPERATING LEASE OBLIGATIONS

120,986


121,013


OTHER NONCURRENT LIABILITIES

112,034


114,079


CLASS D 9.00% PREFERRED UNITS, 600,000 and 600,000 preferred units issued and outstanding, respectively

544,151


537,283


EQUITY:


General partner, representing a 0.1% interest, 128,901 and 128,901 notional units, respectively

(51,474

)


(51,390

)

Limited partners, representing a 99.9% interest, 128,771,715 and 128,771,715 common units issued and outstanding, respectively

1,283,491


1,366,152


Class B preferred limited partners, 12,585,642 and 12,585,642 preferred units issued and outstanding, respectively

305,468


305,468


Class C preferred limited partners, 1,800,000 and 1,800,000 preferred units issued and outstanding, respectively

42,891


42,891


Accumulated other comprehensive loss

(341

)


(385

)

Noncontrolling interests

70,748


72,954


Total equity

1,650,783


1,735,690


Total liabilities and equity

$

6,326,086

$

6,498,736


NGL ENERGY PARTNERS LP AND SUBSIDIARIES

Unaudited Condensed Consolidated Statements of Operations

(in Thousands, except unit and per unit amounts)


Three Months Ended June 30,


2020


2019

REVENUES:


Crude Oil Logistics


$

276,039


$

716,160


Water Solutions


88,065


71,783


Liquids and Refined Products


479,998


1,083,693


Other


313


255


Total Revenues


844,415


1,871,891


COST OF SALES:


Crude Oil Logistics


217,557


649,240


Water Solutions


4,700


(2,807

)

Liquids and Refined Products


454,336


1,043,032


Other


454


465


Total Cost of Sales


677,047


1,689,930


OPERATING COSTS AND EXPENSES:


Operating


64,987


61,312


General and administrative


17,158


20,342


Depreciation and amortization


83,986


53,754


Loss (gain) on disposal or impairment of assets, net


12,022


(967

)

Operating (Loss) Income


(10,785

)


47,520


OTHER INCOME (EXPENSE):


Equity in earnings of unconsolidated entities


289


8


Interest expense


(43,961

)


(39,877

)

Gain on early extinguishment of liabilities, net


19,355


Other income, net


1,035


1,010


(Loss) Income From Continuing Operations Before Income Taxes


(34,067

)


8,661


INCOME TAX BENEFIT


301


321


(Loss) Income From Continuing Operations


(33,766

)


8,982


Loss From Discontinued Operations, net of Tax


(1,486

)


(943

)

Net (Loss) Income


(35,252

)


8,039


LESS: NET (INCOME) LOSS ATTRIBUTABLE TO NONCONTROLLING INTERESTS


(51

)


268


NET (LOSS) INCOME ATTRIBUTABLE TO NGL ENERGY PARTNERS LP


$

(35,303

)


$

8,307


NET LOSS FROM CONTINUING OPERATIONS ALLOCATED TO COMMON UNITHOLDERS


$

(55,815

)


$

(120,126

)

NET LOSS FROM DISCONTINUED OPERATIONS ALLOCATED TO COMMON UNITHOLDERS


$

(1,485

)


$

(942

)

NET LOSS ALLOCATED TO COMMON UNITHOLDERS


$

(57,300

)


$

(121,068

)

BASIC LOSS PER COMMON UNIT


Loss From Continuing Operations


$

(0.43

)


$

(0.95

)

Loss From Discontinued Operations, net of Tax


$

(0.01

)


$

(0.01

)

Net Loss


$

(0.44

)


$

(0.96

)

DILUTED LOSS PER COMMON UNIT


Loss From Continuing Operations


$

(0.43

)


$

(0.95

)

Loss From Discontinued Operations, net of Tax


$

(0.01

)


$

(0.01

)

Net Loss


$

(0.44

)


$

(0.96

)

BASIC WEIGHTED AVERAGE COMMON UNITS OUTSTANDING


128,771,715


125,886,738


DILUTED WEIGHTED AVERAGE COMMON UNITS OUTSTANDING

128,771,715

125,886,738


EBITDA, ADJUSTED EBITDA AND DISTRIBUTABLE CASH FLOW RECONCILIATION

(Unaudited)


The following table reconciles NGL’s net (loss) income to NGL’s EBITDA, Adjusted EBITDA and Distributable Cash Flow:


Three Months Ended June 30,


2020


2019


(in thousands)

Net (loss) income


$

(35,252

)


$

8,039


Less: Net (income) loss attributable to noncontrolling interests


(51

)


268


Net (loss) income attributable to NGL Energy Partners LP


(35,303

)


8,307


Interest expense


44,066


39,910


Income tax benefit


(301

)


(311

)

Depreciation and amortization


83,202


54,844


EBITDA


91,664


102,750


Net unrealized losses (gains) on derivatives


26,671


(3,474

)

Inventory valuation adjustment (1)


3,820


(19,746

)

Lower of cost or net realizable value adjustments


(32,003

)


(918

)

Loss (gain) on disposal or impairment of assets, net


13,084


(967

)

Gain on early extinguishment of liabilities, net


(19,355

)


Equity-based compensation expense (2)


2,302


3,701


Acquisition expense (3)


157


2,091


Other (4)


4,348


3,323


Adjusted EBITDA


$

90,688


$

86,760


Adjusted EBITDA - Discontinued Operations (5)


$

(294

)


$

(16,958

)

Adjusted EBITDA - Continuing Operations


$

90,982


$

103,718


Less: Cash interest expense (6)


40,399


37,775


Less: Income tax benefit


(301

)


(321

)

Less: Maintenance capital expenditures


9,168


16,929


Less: Preferred unit distributions


15,030


13,076


Distributable Cash Flow - Continuing Operations


$

26,686


$

36,259


Contacts

NGL Energy Partners LP
Trey Karlovich, 918-481-1119
Chief Financial Officer and Executive Vice President
This email address is being protected from spambots. You need JavaScript enabled to view it.
or
Linda Bridges, 918-481-1119
Senior Vice President - Finance and Treasurer
This email address is being protected from spambots. You need JavaScript enabled to view it.


Read full story here

LONDON--(BUSINESS WIRE)--#oilfieldservicesmarket--The global oilfield services market is poised to experience spend growth of more than USD 35 billion between 2020-2024 at a CAGR of over 4.66%. The report also provides the market impact and new opportunities created due to the COVID-19 pandemic.


Have a question for our procurement intelligence experts? Get in touch with us

SpendEdge's reports now include an in-depth complimentary analysis of the COVID-19 impact on procurement and the latest market data to help your company overcome sourcing challenges. Our oilfield services market procurement intelligence report offers actionable procurement intelligence insights, sourcing strategies, and action plans to mitigate risks arising out of the current pandemic situation. The report provides a complete drill-down on oilfield services spend outlook at a global as well as regional level. Current spend scenario, growth outlook, incremental spend and other key information is available individually for North America, South America, Europe, Middle East and Africa, and APAC.

Report scope snapshot: Oilfield Services Market

Market insights

  • Regional spend dynamics
  • Regional influence on global spend

Interested to know more about the scope of our reports? Download a FREE sample

Category ecosystem

  • Market favorability index for suppliers
  • Supplier ecosystem

Want more information? Download a FREE sample

Category definition

  • Category hierarchy
  • Category scope
  • Category map

To view this report’s table of contents, Download a FREE sample

We have helped 100+ Fortune 500 companies: View our success stories

About us

SpendEdge shares your passion for driving sourcing and procurement excellence. We are a preferred market intelligence partner for leading Fortune 500 firms and other leading companies across industries. Our strength lies in delivering actionable insights that help sourcing and procurement professionals get the right information in the right format, without any unnecessary frills.

Our procurement market intelligence coverage extends across critical processes of sourcing strategy planning process and helps clients achieve more than mere monetary savings. Our procurement insights are well-defined to meet the information needs of the procurement organizations and are aimed at helping category managers extract hidden values out of sourcing teams, suppliers, contracts, and processes.


Contacts

SpendEdge
Anirban Choudhury
Marketing Manager
US: +1 630 984 7340
UK: +44 148 459 9299
https://www.spendedge.com/contact-us

HOUSTON--(BUSINESS WIRE)--Halliburton Company (NYSE: HAL) announced today that its board of directors has declared a 2020 third quarter dividend of four and one-half cents ($0.045) a share on the Company’s common stock payable on September 23, 2020, to shareholders of record at the close of business on September 2, 2020.


About Halliburton

Founded in 1919, Halliburton is one of the world's largest providers of products and services to the energy industry. With approximately 40,000 employees, representing 140 nationalities in more than 80 countries, the company helps its customers maximize value throughout the lifecycle of the reservoir – from locating hydrocarbons and managing geological data, to drilling and formation evaluation, well construction and completion, and optimizing production throughout the life of the asset. Visit the company’s website at www.halliburton.com. Connect with Halliburton on Facebook, Twitter, LinkedIn, Instagram and YouTube.


Contacts

For Investors:
Abu Zeya
Halliburton, Investor Relations
This email address is being protected from spambots. You need JavaScript enabled to view it.
281-871-2688

For Media:
Emily Mir
Halliburton, Public Relations
This email address is being protected from spambots. You need JavaScript enabled to view it.
281-871-2601

Return to work, school demand high for clean air solutions as public health officials caution Americans to prepare to live with COVID-19 virus.

HOUSTON--(BUSINESS WIRE)--Aggreko plc, today announced it has launched Aggreko Clean Air, a multi-solution approach to quickly and cost-effectively address air quality issues for facilities that must implement health and safety measures in temporary or permanent structures where people need to gather.


Formulated to help employers, community response teams and event producers meet new air quality guidelines, Aggreko Clean Air solutions builds on the company’s 30-plus years of specialized experience and expertise. The international company provides temporary, rental cooling, heating, power and dehumidification for disaster response, industrial operations where air quality has high consequences, and the world’s largest and most watched sporting, music, political and leisure events.

In recent news interviews, Dr. Anthony S. Fauci, Director of the National Institute of Allergy and Infectious Diseases, cautioned Americans that he believes “we will never eradicate the virus” but can manage it with combined efforts, including proactive health and safety measures. The Centers for Disease Control and ASHRAE, the global society for HVAC air quality and sustainability, recently issued health and safety guidelines for facilities managers to improve the air quality in enclosures, including the need to:

  • increase the percentage of outdoor air that circulates into the cooling and ventilation system,
  • increase ventilation rates, or “air changes” per hour, and
  • introduce mechanical support for return air.

Because Aggreko routinely mobilizes in urgent situations to provide engineered solutions for air quality in some of the most extreme conditions, we realized our expertise and experience could make a meaningful difference in helping American businesses and communities begin to function again with less fear of indoor air contamination,” said Charley Royce, Managing Director for Aggreko North America.

There is no responsible DIY version of a COVID-response clean air solution, so facilities owners and operators need reliable solutions that can be implemented immediately without capital investment – and that come with mechanical engineering expertise and maintenance crew support they don’t have,” he explained.

Steve Birtch, business development manager for Aggreko manufacturing, food and beverage and pharmaceutical clients, added: “Facility managers who must respond to the new guidelines in addition to the many other demands on them need proven expertise to meet these air quality guidelines, especially since no one-size-fits-all solution exists that’s appropriate for every structure. A temporary tent for hospital beds, a university dining hall, a pharmaceutical manufacturing site and a food processing plant are all unique and complex operations. Each facility or tent requires a custom solution that considers the function to occur in that facility, existing systems that must integrate, site location, duration of operation, ambient conditions, and the potential risks involved if there’s a failure to manage air quality.

The Aggreko Clean Air solutions engineering teams include trained technicians experienced in installing and maintaining temporary air systems in a variety of settings and situations – expertise facilities managers and staffs do not typically have onsite.

Clean air solutions involve more than plug-and-play,” explained Gary Meador, Aggreko Director of Events, who leads teams to power, heat and cool every aspect of many of the world’s largest events. “Managing and maintaining many of these air filtering and scrubbing solutions requires technicians well trained not only install, but to prevent contamination or improper disposal of filters, parts and supplies during maintenance. Plus, these clean air solutions need the benefit of Aggreko’s remote monitoring to ensure any issues are addressed and the systems are consistently performing as intended.”

Response to Aggreko Clean Air solutions from the company’s existing customers across the US has been overwhelmingly positive. “We already have systems in place at university campuses and pre-installation planning underway with customers in many industries,” Royce said. “The need is great, and we have spent a great deal of time making presentations to trade groups and clients to help educate people on their options to comply with guidelines and keep people safe.”

To learn more about Aggreko Clean Air, visit Aggreko.com/CleanAir or call 833-670-5794. If your event, industry or professional organization would like to schedule an educational talk on clean air health and safety guidelines and options for temporary or permanent facility clean air solutions, email This email address is being protected from spambots. You need JavaScript enabled to view it..

EDITOR’S NOTES

Around the world, people, businesses and countries are striving for a better future - a future that needs power and the right conditions to succeed.

Aggreko works round the clock, making sure everyone gets the electricity, heating and cooling they need, whenever they need it – all powered by our class-leading equipment, trademark passion, unrivalled international experience and local knowledge. From urban development to unique commercial projects and even humanitarian emergencies, we bring our expertise and equipment to any location, from the world’s busiest cities to some of the most remote places on earth.

That’s what has made us the world’s leading provider of modular, mobile power and heating and cooling. We’ve been in business since 1962. We have more than 7,300 employees, operating from around 200 locations in 100 countries. With revenues of approximately GBP 1.7bn (USD 2.2bn or Euros 2bn) in 2017, we are listed on the London Stock Exchange (AGK.L) and have our headquarters in Scotland.

Our business helps transform the lives and livelihoods of individuals, organisations and communities across the globe, in both developed and developing countries and markets.

We operate across all sectors, including oil and gas, petrochemical and refining, utilities, manufacturing, construction, mining and events.

We design and manufacture equipment specifically for these requirements in our factory in Dumbarton, Scotland and work with leading innovators to ensure our equipment offers maximum fuel flexibility, by using gas, diesel (including HFO) and renewable fuel sources.

For more information, please visit our local website at: aggreko.com


Contacts

Ward for Aggreko
Ania Czarnecka or Laura Aebi
E: This email address is being protected from spambots. You need JavaScript enabled to view it.

NOT FOR DISTRIBUTION TO UNITED STATES NEWSWIRE SERVICES OR FOR DISSEMINATION IN THE UNITED STATES

TORONTO--(BUSINESS WIRE)--Sherritt International Corporation (“Sherritt”) (TSX:S), a world leader in the mining and refining of nickel and cobalt from lateritic ores, today published the Applicable Reference Cobalt Price and Applicable Common Shares per Warrant Ratio for the three-month period ended July 31, 2020.

Reference Date

Applicable Reference Cobalt Price

Applicable Common Shares per Warrant Ratio

July 31, 2020

US$14.58

1.00

Consistent with the terms of the Warrant Indenture dated as of January 25, 2018 and available on SEDAR, Sherritt will calculate and publish the Applicable Reference Cobalt Price based on the simple average of the midpoint of the Fastmarkets MB (formerly known as Metal Bulletin) High Price and the Fastmarkets MB Low Price1, expressed in US dollars per pound, for the three consecutive full calendar months immediately preceding each monthly Conversion Ratio Reset Date. The Applicable Common Shares per Warrant Ratio disclosed here will apply on any warrant Exercise Date from, and including, August 11, 2020 through September 8, 2020.

The next Applicable Reference Cobalt Price and Applicable Common Shares per Warrant Ratio for the three-month period ended August 31, 2020 will be announced on September 8, 2020.

About Sherritt
Sherritt is a world leader in the mining and refining of nickel and cobalt from lateritic ores with projects, operations and investments in Canada, Cuba and Madagascar. The Corporation is the largest independent energy producer in Cuba, with extensive oil and power operations across the island. Sherritt licenses its proprietary technologies and provides metallurgical services to mining and refining operations worldwide. The Corporation’s common shares are listed on the Toronto Stock Exchange under the symbol “S”. 


1 The “Fastmarkets MB High Price” means the Fastmarkets Cobalt standard grade MB free market US$/lb in warehouse monthly average high; and the “Fastmarkets MB Low Price” means the Fastmarkets Cobalt standard grade MB free market US$/lb in warehouse monthly average low. Metal Bulletin was rebranded as Fastmarkets MB on October 1, 2018 and changed the names of its benchmark in-warehouse Rotterdam cobalt price assessments on January 2, 2019. Underlying pricing data remains the same.


Contacts

Joe Racanelli, Director of Investor Relations
Telephone: 416-935-2457
Email: This email address is being protected from spambots. You need JavaScript enabled to view it.
www.sherritt.com

BOXBOROUGH, Mass.--(BUSINESS WIRE)--#aviation--Today, Integrated Defense and Security Solutions (IDSS) announced that AERO Corporation Co Limited (AERO) has awarded a contract for DETECTTM 1000 Advanced Computed Tomography Checkpoint systems in support of the Suvarnabhumi International Airport located in Bangkok, Thailand. The Suvarnabhumi International Airport is one of the airports managed and operated by Airports of Thailand Public Company Limited (AOT).


The operation and service of the DETECTTM 1000 systems deployed earlier this year, demonstrates its capability to enhance efficiencies and the passenger experience while improving security. The DETECTTM 1000’s superior image quality and intuitive user interface provides the most advanced platform with which to identify smaller and more advanced threats while improving operator efficiency and passenger experience. “As we recover from the pandemic and the return of air travel, we anticipate the DETECTTM 1000 will assist Suvarnabhumi International Airport with providing increased checkpoint capacity and operator efficiencies”, said Jeffrey Hamel, President and CEO at IDSS.

Integrated Defense and Security Solutions is a small business which develops and manufactures security technology systems based in Boxborough, Massachusetts. The company was founded in 2012 by a team of security experts with the goal of developing security solutions to address current and future threats to aviation. Our first product, the DETECT™ 1000 has received certification by the Transportation Security Administration (TSA), and the European Civil Aviation Conference (ECAC) for explosives detection in carry-on baggage. While designed initially for explosives detection, the DETECT™ 1000 superior image quality and x-ray information has been leveraged for the Non-Intrusive Inspection (NII) of mail and parcels as well as cargo of all sizes. In December 2019, IDSS was recognized as the grand prize winner in the DHS Opioid Detection Challenge (www.opioiddetectionchallenge.com) for its algorithm development and rapid detection capability for identifying illicit opioids in international mail and packaging. This program brings the superior imaging and AI algorithms to scan complete skids for aviation and customs inspection. For more information, visit www.idsscorp.net.


Contacts

Sissy Pressnell, IDSS
Phone: 202-365-2476
Email: This email address is being protected from spambots. You need JavaScript enabled to view it.

Three Consecutive Quarters Cash Flow Positive

MIDLAND, Texas--(BUSINESS WIRE)--Ring Energy, Inc. (NYSE American: REI) (“Ring”) (“Company”) announced today financial results for the three months and six months ended June 30, 2020. For the three-month period ended June 30, 2020, the Company reported oil and gas revenues of $10,636,593. For the six months ended June 30, 2020, the Company reported oil and gas revenues of $50,206,921.


For the three months ended June 30, 2020, Ring reported a net loss of $135,000,066 or $1.99 per diluted share. For the six months ended June 30, 2020, the Company reported a net loss of $91,195,948 or $1.34 per diluted share.

For the three months ended June 30, 2020, the net income included a pre-tax unrealized loss on derivatives of $26,771,529, a pre-tax ceiling test impairment of $147,937,943 and a non-cash charge for stock-based compensation of $1,317,542. Excluding these items, the net income per diluted share would have been $0.02. For the six months ended June 30, 2020, the net income included a pre-tax unrealized gain on derivatives of $20,315,152, a pre-tax ceiling test impairment of $147,937,943 and a non-cash charge for stock-based compensation of $1,991,337. Excluding these items, the net income per diluted share would have been $0.14. The Company believes results excluding these items are more comparable to estimates provided by security analysts and, therefore, are useful in evaluating operational trends of the Company and its performance, compared to other similarly situated oil and gas producing companies.

For the three months ended June 30, 2020, oil sales volume was 429,751 barrels, and gas sales volume was 417,491 MCF (thousand cubic feet). On a barrel of oil equivalent (“BOE”) basis for the three months ended June 30, 2020, production sales were 499,333 BOEs. For the six months ended June 30, 2020, oil sales volume was 1,285,354 barrels, and gas sales volume was 1,183,042 MCF. On a BOE basis for the six months ended June 30, 2020, production sales were 1,482,528 BOEs.

The average commodity prices received by the Company were $24.23 per barrel of oil and $0.53 per MCF of natural gas for the quarter ended June 30, 2020. On a BOE basis for the three-month period ended June 30, 2020, the average price received was $21.30. The average prices received for the six months ended June 30, 2020 were $38.16 per barrel of oil and $0.98 per MCF of natural gas. On a BOE basis for the six month period ended June 30, 2020, the average price received was $33.86.

The average price differential the Company experienced from WTI pricing in the second quarter 2020 was approximately $2.50.

During May 2020, the Company unwound the costless collars for June 2020 and July 2020, resulting in the receipt of a cash payment of $5,435,136. Concurrently, the Company entered into Swap contracts at $33.24 for 5,500 barrels per day for June and July 2020, equal to the barrels for which the costless collars were unwound. Similar to costless collars, there is no cost to enter into the Swap contracts. On Swap contracts, there is no spread and payments will be made or received based on the difference between WTI and the Swap contract price. The costless collar and Swap pricing does not take into account any pricing differentials between NYMEX WTI pricing and the price received by the Company.

Lease operating expenses (“LOE”), including production taxes, for the three months ended June 30, 2020 were $15.03 per BOE. Depreciation, depletion and amortization costs, including accretion, were $15.16 per BOE, and general and administrative costs, which included a $1,317,542 charge for stock-based compensation and $292,207 for an operating lease expense, were $8.95 per BOE. For the six months ended June 30, 2020, lease operating expenses, including production taxes, were $13.33 per BOE. Depreciation, depletion and amortization costs, including accretion, were $14.49 per BOE, and general and administrative costs, which included a $1,991,337 charge for stock-based compensation and $581,258 for operating lease expenses, were $5.26 per BOE.

Cash provided by operating activities, before changes in working capital, for the three and six months ended June 30, 2020 was $9,668,873, or $0.14 per fully diluted share, and $33,614,062, or $0.49 per fully diluted share. Earnings before interest, taxes, depletion and other non-cash items (“Adjusted EBITDA”) for the three and six months ended June 30, 2020 were $13,732,830, or $0.20 per fully diluted share, and $41,737,429, or $0.61 per fully diluted share. (See accompanying table for a reconciliation of net income to adjusted EBITDA).

Total capital expenditures for the three and six months ended June 30, 2020 were approximately $1.8 million and $17.9 million.

On June 17, 2020, the Company announced it had completed the spring 2020 redetermination of its senior credit facility. The Company entered into a new amendment which reduced the immediate borrowing base from $425 million to $375 million. As of June 30, 2020, the outstanding balance on the Company’s $1 billion senior credit facility was $375 million. The weighted average interest rate on borrowings under the senior credit facility was 4.5%. The next redetermination evaluation is scheduled for November 2020.

The Company’s Chief Executive Officer, Mr. Kelly Hoffman, stated, “While volatility continued in the energy space in the second quarter, we began to see some improvement and stability in the commodity price itself. We had essentially shut-in all of our production and in early June began bringing the wells back on line. Currently we are producing approximately 9,000 net BOEs per day. With production curtailed in the 2nd quarter, we made the necessary decisions to reduce costs and improve efficiencies wherever possible. Operationally, in combination with the revenue derived from the hedges we had in place, not only did we operate profitably, but we continued to be cash flow positive for the third consecutive quarter. In June, we completed the spring redetermination on the Company’s senior credit facility. The immediate borrowing base was reduced to $375 million and the current outstanding balance on our facility is $375 million. We will continue to operate within cash flow and pay down our debt through a combination of excess cash flow and strategic asset sales. Commodity prices are continuing to strengthen and the economy is showing signs of improvement. We are anxious to resume our drilling and development program once we see sustainable received prices in the low to mid $40’s per BOE. We are confident that Ring will continue to grow and prosper in this extremely challenging environment.”

About Ring Energy, Inc.

Ring Energy, Inc. is an oil and gas exploration, development and production company with current operations in Texas and New Mexico.

www.ringenergy.com

Safe Harbor Statement

This release contains forward-looking statements within the meaning of Section 27A of the Securities Act of 1933 and Section 21E of the Securities Exchange Act of 1934. Forward-looking statements involve a wide variety of risks and uncertainties, and include, without limitations, statements with respect to the Company’s strategy and prospects. Such statements are subject to certain risks and uncertainties which are disclosed in the Company’s reports filed with the SEC, including its Form 10-K for the fiscal year ended December 31, 2019, its Form 10Q for the quarter ended June 30, 2020 and its other filings with the SEC. Readers and investors are cautioned that the Company’s actual results may differ materially from those described in the forward-looking statements due to a number of factors, including, but not limited to, the Company’s ability to acquire productive oil and/or gas properties or to successfully drill and complete oil and/or gas wells on such properties, general economic conditions both domestically and abroad, and the conduct of business by the Company, and other factors that may be more fully described in additional documents set forth by the Company.

RING ENERGY, INC.
STATEMENTS OF OPERATIONS
 

Three Months Ended


Six Months Ended

June 30,


June 30,


2020


2019


2020


2019


(restated)
Oil and Gas Revenues

$

10,636,593


$

51,334,225


$

50,206,921


$

93,132,540


Costs and Operating Expenses .
Oil and gas production costs


7,072,296


11,569,109


17,450,757


20,977,873


Oil and gas production taxes


433,760


2,412,895


2,304,005


4,495,770


Depreciation, depletion and amortization


7,338,108


14,615,270


21,021,104


27,544,324


Ceiling test impairment


147,937,943


147,937,943


Asset retirement obligation accretion


231,367


229,234


463,329


445,179


Operating lease expense


292,207


128,175


581,258


256,350


General and administrative expense


4,176,609


4,743,127


7,212,504


11,541,144


Total Costs and Operating Expenses


167,482,290


33,697,810


196,970,900


65,260,640


Income (Loss) from Operations


(156,845,697

)


17,636,415


(146,763,979

)


27,871,900


Other Income (Expense)
Interest income


1


1,260


6


13,496


Interest expense


(4,253,040

)


(4,259,908

)


(8,501,538

)


(5,032,925

)

Realized gain on derivatives


13,753,567


-


17,087,695


-


Unrealized gain (loss)on change in fair value of derivatives


(26,771,529

)


1,530,230


20,315,152


1,189,545


Net Other Income (Expense)


(17,271,001

)


(2,728,418

)


28,901,315


(3,829,884

)

 
Income (Loss) Before Provision for Income Taxes


(174,116,698

)


14,907,997


(117,862,664

)


24,042,106


(Provision for) Benefit from Income Taxes


39,116,632


(3,565,400

)


26,666,716


(8,430,159

)

 
Net Income (Loss)

($135,000,066

)

$

11,342,597


($

91,195,948

)

$

15,611,857


Basic Earnings (Loss) Per Common Share

($1.99

)

$

0.17


($1.34

)

$

0.24


Diluted Earnings (Loss) Per Common Share

($1.99

)

$

0.17


($1.34

)

$

0.24


Basic Weighted-Average Common Shares Outstanding


67,980,794


67,357,645


67,987,295


65,305,081


Diluted Weighted-Average Common Shares Outstanding


67,980,794


67,670,259


67,987,295


65,852,348


COMPARATIVE OPERATING STATISTICS

Three Months Ended June 30,


2020


2019

Change

 
Net Sales - BOE per day


5,487


10,859

-49.5

%

Per BOE:
Average Sales Price

$

21.30

$

51.94

-58.9

%

 
Lease Operating Expenses


14.16


11.71

20.9

%

Production Taxes


0.87


2.44

-64.3

%

DD&A


14.70


14.79

-0.6

%

Accretion


0.46


0.23

100.0

%

General & Administrative Expenses


8.36


4.80

74.2

%

Operating Lease Expense


0.59


Six Months Ended June 30,


2020


2019

Change

 
Net Sales - BOE per day


8,145


10,314

-21.0

%

Per BOE:
Average Sales price

$

33.87

$

49.89

-32.1

%

 
Lease Operating Expenses


11.77


11.24

4.7

%

Production Taxes


1.55


2.41

-35.7

%

DD&A


14.18


14.75

-3.8

%

Accretion


0.31


0.24

29.1

%

General & Administrative Expenses


4.86


6.18

-21.3

%

Operating Lease Expense


0.39

 
RING ENERGY, INC.
BALANCE SHEET


June 30,

December 31,


2020


2019


ASSETS
Current Assets
Cash

$

17,229,780


$

10,004,622


Accounts receivable


8,652,807


22,909,195


Joint interest billing receivable


523,439


1,812,469


Derivative asset


12,770,803


Prepaid expenses and retainers


584,395


3,982,255


Total Current Assets


39,761,224


38,708,541


Property and Equipment
Oil and natural gas properties subject to amortization


953,891,407


1,083,966,135


Financing lease asset subject to depreciation


858,513


858,513


Fixed assets subject to depreciation


1,465,551


1,465,551


Total Property and Equipment


956,215,471


1,086,290,199


Accumulated depreciation, depletion and amortization


(178,095,148

)


(157,074,044

)

Net Property and Equipment


778,120,323


929,216,155


Operating lease asset


1,285,786


1,867,044


Derivative asset


4,544,271


Deferred Income Taxes


20,665,540


-


Deferred Financing Costs


2,836,243


3,214,408


Total Assets

$

847,213,387


$

973,006,148


LIABILITIES AND STOCKHOLDERS' EQUITY
Current Liabilities
Accounts payable

$

19,164,925


$

54,635,602


Financing lease liability


288,386


$

280,970


Operating lease liability

$

936,270


$

1,175,904


Derivative liabilities


-


3,000,078


Total Current Liabilities


20,389,581


59,092,554


Deferred income taxes


-


6,001,176


Revolving line of credit


375,000,000


366,500,000


Financing lease liability, less current portion


275,998


424,126


Operating lease liability, less current portion


349,516


691,140


Asset retirement obligations


16,996,355


16,787,219


Total Liabilities


413,011,450


449,496,215


Stockholders' Equity
Preferred stock - $0.001 par value; 50,000,000 shares authorized;
no shares issued or outstanding


-


-


Common stock - $0.001 par value; 150,000,000 shares authorized;
67,980,575 shares and 67,993,797 shares
issued and outstanding, respectively


67,981


67,994


Additional paid-in capital


528,189,246


526,301,281


Retained earnings (accumulated deficit)


(94,055,290

)


(2,859,342

)

Total Stockholders' Equity


434,201,937


523,509,933


Total Liabilities and Stockholders' Equity

$

847,213,387


$

973,006,148


RING ENERGY
STATEMENTS OF CASH FLOW

Six Months Ended

June 30,

June 30,

2020


2019 (restated)

 
Cash Flows From Operating Activities
Net income (loss)

($91,195,948

)

$15,611,857


Adjustments to reconcile net income (loss) to net cash
Provided by operating activities:
Depreciation, depletion and amortization

21,021,104


27,544,324


Ceiling test impairment

147,937,943


-


Accretion expense

463,329


445,179


Amortization of deferred financing costs

378,165


-


Share-based compensation

1,991,337


1,643,199


Deferred income tax provision

(25,048,702

)

5,049,219


Excess tax deficiency related to share-based compensation

(1,618,014

)

3,380,940


Change in fair value of derivative instruments

(20,315,152

)

(1,189,545

)

Changes in assets and liabilities:
Accounts receivable

15,545,418


(9,847,686

)

Prepaid expenses and retainers

3,397,860


(6,388,823

)

Accounts payable

(22,050,677

)

(451,965

)

Settlement of asset retirement obligation

(320,580

)

(384,956

)

Net Cash Provided by Operating Activities

30,186,083


35,411,743


Cash Flows from Investing Activities
Payments to purchase oil and natural gas properties

(1,017,434

)

(268,120,579

)

Payments to develop oil and natural gas properties

(30,302,779

)

(81,051,832

)

Net Cash Used in Investing Activities

(31,320,213

)

(349,172,411

)

Cash Flows From Financing Activities
Proceeds from revolving line of credit

21,500,000


321,000,000


Payments on revolving line of credit

(13,000,000

)

-


Reduction of financing lease liabilities

(140,712

)

(24,076

)

Net Cash Provided by Financing Activities

8,359,288


320,975,924


Net Change in Cash

7,225,158


7,215,256


Cash at Beginning of Period

10,004,622


3,363,726


Cash at End of Period

$17,229,780


$10,578,982


Supplemental Cash flow Information
Cash paid for interest

$8,320,562


$932,896


Noncash Investing and Financing Activities
Asset retirement obligation incurred during development

66,387


441,244


Operating lease assets obtained in exchange for new operating lease liability

-


539,577


Financing lease assets obtained in exchange for new financing lease liability

-


637,757


Capitalized expenditures attributable to drilling projects
financed through current liabilities

1,750,000


41,800,000


Acquisition of oil and gas properties
Assumption of joint interest billing receivable

-


1,464,394


Assumption of prepaid assets

-


2,864,554


Assumption of accounts and revenue payables

-


(1,234,862

)

Asset retirement obligation incurred through acquisition

-


(2,979,645

)

Common stock issued as partial consideration in asset acquisition

-


(28,356,396

)

Oil and gas properties subject to amortization

-


296,910,774


RECONCILIATION OF CASH FLOW FROM OPERATIONS
 
Net cash provided by operating activities

$30,186,083


$35,411,743


Change in operating assets and liabilities

3,427,979


17,073,430


Cash flow from operations

$33,614,062


$52,485,173


Management believes that the non-GAAP measure of cash flow from operations is useful information for investors because it is used internally and is accepted by the investment community as a means of measuring the Company's ability to fund its capital program. It is also used by professional research analysts in providing investment recommendations pertaining to companies in the oil and gas exploration and production industry.
RING ENERGY, INC.
NON-GAAP DISCLOSURE RECONCILIATION
ADJUSTED EBITDA
 
Six Months Ended
June 30, June 30,

2020


2019 (restated)

 
NET INCOME (LOSS)

($91,195,948

)

$15,611,857

 
Net other (income) expense

(28,901,315

)

3,829,884

Realized gain on derivatives

17,087,695


-

Ceiling test impairment

147,937,943


-

Income tax expense (benefit)

(26,666,716

)

8,430,159

Depreciation, depletion and amortization

21,021,104


27,544,324

Accretion of discounted liabilities

463,329


445,179

Stock based compensation

1,991,337


1,643,199

 
ADJUSTED EBITDA

$41,737,429


$57,504,602


Contacts

Bill Parsons
K M Financial, Inc.
(702) 489-4447

HOUSTON--(BUSINESS WIRE)--Enterprise Products Partners L.P. (NYSE: EPD) announced today it will host virtual investor meetings at the Goldman Sachs Power, Utilities, MLPs and Pipelines Virtual Conference on Tuesday, August 11, 2020; and the Citi One-on-One Midstream / Energy Infrastructure Virtual Conference on Wednesday, August 12 and Thursday, August 13, 2020.


A copy of the slides used in the meetings will be available on the Enterprise website at www.enterpriseproducts.com under the Investors tab.

Enterprise Products Partners L.P. is one of the largest publicly traded partnerships and a leading North American provider of midstream energy services to producers and consumers of natural gas, NGLs, crude oil, refined products and petrochemicals. Our services include: natural gas gathering, treating, processing, transportation and storage; NGL transportation, fractionation, storage and export and import terminals; crude oil gathering, transportation, storage and export and import terminals; petrochemical and refined products transportation, storage, export and import terminals and related services; and a marine transportation business that operates primarily on the United States inland and Intracoastal Waterway systems. The partnership’s assets include approximately 50,000 miles of pipelines; 260 million barrels of storage capacity for NGLs, crude oil, refined products and petrochemicals; and 14 billion cubic feet of natural gas storage capacity.


Contacts

Randy Burkhalter, Investor Relations, (713) 381-6812 or (866) 230-0745
Rick Rainey, Media Relations, (713) 381-3635

Allowing time for underground utilities to be marked before digging reduces injury and loss of services

TAMPA, Fla.--(BUSINESS WIRE)--Because tomorrow, Aug. 11, is dubbed 811 Day, it serves as a reminder for Florida residents and excavators to call 811 two business days before beginning digging to have underground utilities marked. All digging projects – from DIY tasks such as landscaping or installing a mailbox to larger projects requiring excavation equipment – require a call to 811.

Peoples Gas reminds Floridians that the underground network of utility wires, cables and pipelines is often closer to the surface than one might think. Striking one of these underground utility lines while digging could cause the loss of natural gas, electric, water or communications and cable services, injury to the person digging or others, and potentially result in fines and repair costs.

It’s not just a coincidence that we mark August 11 as a day to emphasize safe digging,” said Luke Buzard, vice president of Pipeline Safety and Regulatory Affairs for Peoples Gas. “Most damage to underground utility lines occurs during summer months, with the highest percentage in August.”

While most digging projects are preplanned and easily allow time to call 811 two business days before starting, some digging work may be unexpected. After severe weather, homeowners are often faced with downed fences and uprooted trees. As part of their post-storm recovery plan, residents should plan to call 811 before removing trees and tree stumps or resetting fences. Don’t run the risk of losing essential services by not having underground utilities marked.

Gov. Ron DeSantis signed a revised law into effect on July 1 that is expected to increase safety in Florida’s communities by strengthening “Call 811 before you dig” enforcement and accountability across the state. Residents and excavators could see increased penalties for damaged underground utilities and violations of the law. Penalties may apply when, for example, homeowners or excavators dig without calling 811, ignore the 24-inch tolerance zone, continue digging after damage has occurred, or remove any permanent utility markers required by law.

In addition to the increased penalties, the bill also expands enforcement authority to the state fire marshal and local fire chiefs, and it calls for fines to fund firefighter equipment and damage-prevention education.

One free, simple phone call to 811 or visit to sunshine811.com makes it easy for Sunshine 811 to notify all appropriate utility companies of upcoming digging projects. Sunshine 811 is a non-profit corporation funded by underground utility owners and operators. The organization began in 1993 with the adoption of the Underground Facility Damage Prevention and Safety Act.

Here are some tips to remember:

  • Residents and excavators should call 811 at least two full business days before digging to give utility companies enough time to properly mark their lines. The location and a description of the digging project is required.
  • Sunshine 811 notifies affected utility companies, who then send a professional locator to mark the approximate location of underground equipment for free.
  • Check the Sunshine 811 Positive Response link at sunshine811.com and, once all utilities have responded, dig carefully within 24 inches of any marks in your project area.
  • Even if you are not digging, remember to leave any markers – paint or flags – in place. They are a sign of work that may be coming soon to your area by a utility or contractor.

Visit sunshine811.com and peoplesgas.com for more information about safe digging.

Peoples Gas System, Florida’s largest natural gas distribution utility, serves more than 400,000 customers across the state. Peoples Gas is a subsidiary of Emera Inc., a geographically diverse energy and services company headquartered in Halifax, Nova Scotia, Canada.


Contacts

Sylvia Vega, 813.228.4381

~First Company in ASIA PACIFIC to Supply 1.5M Smart Meters~

JAIPUR, India--(BUSINESS WIRE)--#COVID19--Genus Power Infrastructures Ltd (Genus Power), the country’s largest electricity metering solutions provider, becomes the first company in Asia Pacific to achieve the milestone of supplying 1.5M Smart Meters to EESL (Energy Efficiency Services Ltd), bearing a testimony of the manufacturing capability of an Indian company for such an advanced meter amid global competition.

Genus Power is the largest supplier of Smart Meters in India and is currently executing a big contract for EESL. EESL plays a vital role in implementing India’s ambitious plan of rolling out 240 million Smart Meters in the next 3 years as planned by the Ministry of Power, Government of India.


Excited with this achievement, Jitendra K Agarwal, Jt Managing Director, Genus Power said,As a leader in the Smart Metering industry, we are proud to be the first in India to achieve this figure. The Smart Meters commissioned in various states have played an important role during the COVID 19 pandemic. The nationwide lockdown and social distancing prohibited DISCOMs from physically taking the monthly meter readings. All states where Genus Power Smart Meters were installed have been able to take readings remotely that resulted in bill generation & collection, helping DISCOMs to sustain their operations.”

Mr Saurabh Kumar, Managing Director, EESL said, “Smart Meters offer numerous benefits to DISCOMs as well as consumers. They also have the potential to make the power sector increasingly resilient, transparent, digitized, and accountable. A seamless and consumer-focused energy ecosystem is the way forward and thus we must encourage the adoption of smart meters across the country.”

Riding on its large installed base of more than 60 million electricity meters and domain expertise, Genus Power has embarked on an ambitious programme on Smart Metering in line with the Smart Grid vision of the Government of India. The company is currently exporting its products to Middle East, Africa and Asia Pacific regions.

About Genus Power Infrastructures Limited

Genus Power is a leading player in the power infrastructure space and is listed in major stock exchanges of India. The company with an annual production capacity of 10 Million Meters has its own in-house world class R&D, tool room, advanced software, and state of the art infrastructure at multiple locations. This enables Genus to present itself as an ideal OEM manufacturing partner and cater to the local & global demand of exceptional customization. Read More

For more information, please visit: www.genus.in


Contacts

Contact – Mr. R Viswanathan ( This email address is being protected from spambots. You need JavaScript enabled to view it. )

Ian Carr Elected as Corporate Vice President and Appointed as President of ExxonMobil Fuels & Lubricants Company

IRVING, Texas--(BUSINESS WIRE)--Bryan Milton, president of ExxonMobil Fuels & Lubricants, has announced his retirement, effective September 1, 2020. Exxon Mobil Corporation’s (NYSE:XOM) board of directors has appointed Ian Carr as president of ExxonMobil Fuels & Lubricants Company and elected him as vice president of Exxon Mobil Corporation.


We thank Bryan for his 34 years of dedicated service, most recently as the president of Fuels & Lubricants,” said Jack Williams, senior vice president of ExxonMobil. “In 2018, he played a leading role in the effort to combine the company’s refining and marketing operations to better respond to the needs of our customers and compete more effectively across the entire value chain.”

Milton joined Exxon in 1986 at Fawley in the United Kingdom, where he worked in various plant and engineering roles, including assignments as operations manager and plant manager. He also spent time in upstream natural gas commercial sales and held various leadership positions within ExxonMobil Chemical Company in Houston.

In 2008, Milton was assigned as executive assistant to the chairman and chief executive officer of Exxon Mobil Corporation. In 2009, he was appointed vice president of Basic Chemicals for ExxonMobil Chemical Company and in 2011 was appointed president of ExxonMobil Global Services Company. Milton has served as president of ExxonMobil Fuels & Lubricants since 2016.

Ian Carr joined Exxon in 1984 at Fawley and has held numerous positions in the U.K., Belgium, Saudi Arabia, and the United States, where he most recently served as senior vice president of Fuels.

Carr’s early career included several management roles in the fuels, refining, natural gas, and supply businesses. In 2002, he was appointed corporate Downstream advisor, and went on to serve as vice president of industrial and wholesale fuels, before becoming manager of the Antwerp refinery in 2009. He took on the roles of vice president of Downstream business development in 2012, and vice president of strategy and planning for the Refining and Supply Company in 2014. Carr was appointed vice president of Upstream strategic planning in 2017.

Carr holds a bachelor’s degree in Chemistry from Leeds University.

About ExxonMobil

ExxonMobil, one of the largest publicly traded international energy companies, uses technology and innovation to help meet the world’s growing energy needs. ExxonMobil holds an industry-leading inventory of resources, is one of the largest refiners and marketers of petroleum products, and its chemical company is one of the largest in the world. To learn more, visit exxonmobil.com and the Energy Factor.

Follow us on Twitter and LinkedIn.


Contacts

Media Relations
972-940-6007

JACKSONVILLE, Fla.--(BUSINESS WIRE)--Last Friday, Eagle LNG Partners (Eagle LNG) celebrated the 100th bunkering event of liquefied natural gas (LNG) from its Talleyrand LNG Bunker Station, located at Jacksonville Port Authority (JAXPORT), with Crowley Maritime (Crowley). Eagle LNG is proud of this accomplishment having delivered on its weekly LNG bunkering commitment regardless of COVID-19 constraints or shipping challenges.


“Since March, our operations staff have continued working with Crowley’s ship management teams to maintain safe bunkering of their ships, MV Taíno and MV El Coquí, while adhering to public health guidelines. This is a testament to the operating procedures we developed together in the spirit of partnership to keep cargo moving,” reports Sean Lalani, president of Eagle LNG. With multiple layers of safety and environmental precautions in place, we have safely surpassed 100 bunkering events. Eagle LNG is proud of the safety practices jointly created with the U.S. Coast Guard Sector Jacksonville, the Jacksonville Fire and Rescue Department, Crowley and JAXPORT – practices that are now a standard for others in the LNG industry. LNG has been shown to be both safe and reliable, in addition to being the best fuel solution to deliver environmental performance and cost savings. We look forward to serving the maritime industry throughout the country with clean burning, low-cost, U.S. LNG and bringing these remarkable benefits to countries in the Caribbean basin.”

Eagle LNG Talleyrand, which provides safe and reliable on-site storage for over 500,000 gallons of LNG, has successfully delivered over 30 million gallons or almost 50,000 metric tons over the last 100 bunkering activities to these first-in-class ships. The facility is the first of its kind in North America to provide shoreside storage and bunkering equipment to deliver the cleaner energy source for the Commitment Class, combination container/roll-on roll-off (ConRo) ships, which provide ocean transportation of dry, refrigerated and vehicle cargoes under the Jones Act.

With Eagle LNG’s proximal location to the Caribbean basin and those countries increasing use of LNG for power generation, together with one of our production locations in the Southeastern U.S. meeting a growing demand for LNG as a transportation fuel, and with our many strategic partnerships, Eagle LNG continues to create new U.S. trade opportunities adding jobs and stimulating economic development for Northeast Florida and the surrounding region, as well as spurring economic activity and jobs throughout the Caribbean basin.

Eagle LNG’s Maxville LNG Facility, located about 20 miles west of downtown Jacksonville, offers 1 million LNG-gallons of storage for daily transfers by truck to Talleyrand assuring Crowley’s weekly fuel supply. Eagle LNG is also supplying LNG to ISO tank containers for distribution into the Caribbean for power and industrial users.

“This milestone represents the result of collaboration, hard work and dedication to safety and reliability of our mariners, the men and women of Crowley, Eagle LNG, VT Halter Marine, U.S. Coast Guard, JAXPORT and the Jacksonville Fire and Rescue Department,” said Crowley Vice President Cole Cosgrove, head of the global ship management group. “We committed ourselves to ensuring these ships and our communities can leverage the benefits of cleaner energy and maximize service to our customers and partners. The achievement today signifies the ongoing commitment to long-term, environmentally sustainable ocean shipping between the U.S. mainland and Puerto Rico.”

It is important to recognize that JAXPORT, more than a decade ago, began exploring LNG bunkering for the U.S. East Coast. JAXPORT has always been welcoming of bunkering innovations and now receives inquiries from Ports and shippers around the globe asking them to share their success story. By being amongst the first to work with LNG providers, shippers and others for the future of this environmentally friendly fuel that meets International Maritime Organization (IMO) 2020 standards to reduce marine emissions in international waters, JAXPORT today is recognized as a worldwide leader in provisioning ships powered by LNG.

“With more than a billion dollars in LNG investments in the Northeast Florida region, JAXPORT partners are pioneers in the use of LNG as a clean fuel and a cargo type,” said JAXPORT CEO Eric Green. “As the use of LNG expands globally, our community continues to benefit from the environmental advantages, new business, jobs and other opportunities that come with being a global leader in the clean fuel revolution.”

Eagle LNG is also moving forward on a new larger, on-water liquefaction plant and terminal in Jacksonville, the Jacksonville LNG Export Facility, capable of producing 1.0 MTPA with 45,000 m3 or almost 12 million gallons of storage. “With an additional investment of ~$500 million to build the new export facility plus other planned expansions across the U.S. and in the Caribbean basin, Eagle LNG is committed to meeting the demand for small-scale LNG in the region plus the ever increasing domestic need for fuel-grade LNG,” reports Lalani.

About Eagle LNG Partners

Eagle LNG is a privately held and operated portfolio company of The Energy & Minerals Group. Eagle LNG provides affordable, efficient and clean burning energy. It develops small-scale LNG fueling solutions for marine industries as well as power generation in the Caribbean and Latin America. Eagle LNG is based in Houston, Texas.

For additional information, please visit www.eaglelng.com.

About The Energy & Minerals Group (EMG)

EMG is the management company for a series of specialized private equity funds. EMG focuses on investing across various facets of the global natural resource industry, including the upstream and midstream segments of the energy complex. EMG has approximately $10 billion of regulatory assets under management. EMG targets equity investments of $150 million to $1,000 million in the energy and minerals sectors focused on hard assets that are integral to existing and growing markets.

For additional information, please visit www.emgtx.com.


Contacts

Linda Berndt
Vice President, Communications
Eagle LNG Partners LLC
(214) 864-1886
This email address is being protected from spambots. You need JavaScript enabled to view it.

Offshore Source Logo

Offshore Source keeps you updated with relevant information concerning the Offshore Energy Sector.

Any views or opinions represented on this website belong solely to the author and do not represent those of the people, institutions or organizations that Offshore Source or collaborators may or may not have been associated with in a professional or personal capacity, unless explicitly stated.

Corporate Offices

Technology Systems Corporation
8502 SW Kansas Ave
Stuart, FL 34997

info@tscpublishing.com