Business Wire News

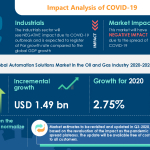
LONDON--(BUSINESS WIRE)--#AutomationSolutionsMarketintheOilandGasIndustry--Technavio has been monitoring the automation solutions market in the oil and gas industry and it is poised to grow by USD 1.49 billion during 2020-2024, progressing at a CAGR of over 3% during the forecast period. The report offers an up-to-date analysis regarding the current market scenario, latest trends and drivers, and the overall market environment.


Although the COVID-19 pandemic continues to transform the growth of various industries, the immediate impact of the outbreak is varied. While a few industries will register a drop in demand, numerous others will continue to remain unscathed and show promising growth opportunities. Technavio’s in-depth research has all your needs covered as our research reports include all foreseeable market scenarios, including pre- & post-COVID-19 analysis. Download a Free Sample Report on COVID-19 Impacts

Frequently Asked Questions-

  • Based on segmentation by product, which is the leading segment in the market?
  • The SCADA systems segment is expected to be the leading segment in the global market during the forecast period.
  • At what rate is the market projected to grow?
  • Growing at a CAGR of over 3%, the incremental growth of the market is anticipated to be USD 1.49 billion during the forecast period.
  • Who are the top players in the market?
  • ABB Ltd., Eaton Corp. Plc, Emerson Electric Co., Honeywell International Inc., Mitsubishi Electric Corp., OMRON Corp., Rockwell Automation Inc., Schneider Electric SE, Siemens AG, and Yokogawa Electric Corp. are some of the major market participants.
  • What is the key market driver?
  • Rise in the global demand for oil and gas is the major factor driving the market.

The market is fragmented, and the degree of fragmentation will accelerate during the forecast period. ABB Ltd., Eaton Corp. Plc, Emerson Electric Co., Honeywell International Inc., Mitsubishi Electric Corp., OMRON Corp., Rockwell Automation Inc., Schneider Electric SE, Siemens AG, and Yokogawa Electric Corp. are some of the major market participants. The rise in the global demand for oil and gas will offer immense growth opportunities. To make most of the opportunities, market vendors should focus more on the growth prospects in the fast-growing segments, while maintaining their positions in the slow-growing segments.

Buy 1 Technavio report and get the second for 50% off. Buy 2 Technavio reports and get the third for free.

View market snapshot before purchasing

Technavio's custom research reports offer detailed insights on the impact of COVID-19 at an industry level, a regional level, and subsequent supply chain operations. This customized report will also help clients keep up with new product launches in direct & indirect COVID-19 related markets, upcoming vaccines and pipeline analysis, and significant developments in vendor operations and government regulations.

Automation Solutions Market in the Oil and Gas Industry 2020-2024: Segmentation

Automation Solutions Market in the Oil and Gas Industry is segmented as below:

  • Product
    • SCADA
    • DCS
    • PLC
    • MES
  • Geography
    • North America
    • APAC
    • Europe
    • MEA
    • South America

To learn more about the global trends impacting the future of market research, download a free sample: https://www.technavio.com/talk-to-us?report=IRTNTR40070

Automation Solutions Market in the Oil and Gas Industry 2020-2024: Scope

Technavio presents a detailed picture of the market by the way of study, synthesis, and summation of data from multiple sources. The automation solutions market in the oil and gas industry report covers the following areas:

  • Automation Solutions Market in the Oil and Gas Industry Size
  • Automation Solutions Market in the Oil and Gas Industry Trends
  • Automation Solutions Market in the Oil and Gas Industry Analysis

This study identifies the growing importance of big data analytics and IoT as one of the prime reasons driving the automation solutions market growth in the oil and gas industry during the next few years.

Technavio suggests three forecast scenarios (optimistic, probable, and pessimistic) considering the impact of COVID-19. Technavio’s in-depth research has direct and indirect COVID-19 impacted market research reports.

Register for a free trial today and gain instant access to 17,000+ market research reports. Technavio's SUBSCRIPTION platform

Automation Solutions Market in the Oil and Gas Industry 2020-2024: Key Highlights

  • CAGR of the market during the forecast period 2020-2024
  • Detailed information on factors that will assist automation solutions market growth in the oil and gas industry during the next five years
  • Estimation of the automation solutions market size in the oil and gas industry and its contribution to the parent market
  • Predictions on upcoming trends and changes in consumer behavior
  • The growth of the automation solutions market in the oil and gas industry
  • Analysis of the market’s competitive landscape and detailed information on vendors
  • Comprehensive details of factors that will challenge the growth of automation solutions market vendors in the oil and gas industry

Table of Contents:

PART 01: EXECUTIVE SUMMARY

PART 02: SCOPE OF THE REPORT

  • 2.1 Preface
  • 2.2 Preface
  • 2.3 Currency conversion rates for US$

PART 03: MARKET LANDSCAPE

  • Market ecosystem
  • Value chain analysis
  • Market characteristics
  • Market segmentation analysis

PART 04: MARKET SIZING

  • Market definition
  • Market sizing 2019
  • Market size and forecast 2019-2024

PART 05: FIVE FORCES ANALYSIS

  • Bargaining power of buyers
  • Bargaining power of suppliers
  • Threat of new entrants
  • Threat of substitutes
  • Threat of rivalry
  • Market condition

PART 06: MARKET SEGMENTATION BY PRODUCT

  • Market segmentation by product
  • Comparison by product
  • SCADA - Market size and forecast 2019-2024
  • DCS - Market size and forecast 2019-2024
  • PLC - Market size and forecast 2019-2024
  • MES - Market size and forecast 2019-2024
  • Market opportunity by product

PART 07: CUSTOMER LANDSCAPE

PART 08: GEOGRAPHIC LANDSCAPE

  • Geographic segmentation
  • Geographic comparison
  • North America - Market size and forecast 2019-2024
  • APAC - Market size and forecast 2019-2024
  • Europe - Market size and forecast 2019-2024
  • MEA - Market size and forecast 2019-2024
  • South America - Market size and forecast 2019-2024
  • Key leading countries
  • Market opportunity

PART 09: DECISION FRAMEWORK

PART 10: DRIVERS AND CHALLENGES

  • Market drivers
  • Market challenges

PART 11: MARKET TRENDS

  • Growing importance of big data analytics and IoT
  • Value chain integration
  • Shift from on-premise to cloud-based systems

PART 12: VENDOR LANDSCAPE

  • Overview
  • Landscape disruption
  • Competitive scenario

PART 13: VENDOR ANALYSIS

  • Vendors covered
  • Vendor classification
  • Market positioning of vendors
  • ABB Ltd.
  • Eaton Corp. Plc
  • Emerson Electric Co.
  • Honeywell International Inc.
  • Mitsubishi Electric Corp.
  • OMRON Corp.
  • Rockwell Automation Inc.
  • Schneider Electric SE
  • Siemens AG
  • Yokogawa Electric Corp.

PART 14: APPENDIX

  • Research methodology
  • List of abbreviations
  • Definition of market positioning of vendors

PART 15: EXPLORE TECHNAVIO

About Us

Technavio is a leading global technology research and advisory company. Their research and analysis focuses on emerging market trends and provides actionable insights to help businesses identify market opportunities and develop effective strategies to optimize their market positions. With over 500 specialized analysts, Technavio’s report library consists of more than 17,000 reports and counting, covering 800 technologies, spanning across 50 countries. Their client base consists of enterprises of all sizes, including more than 100 Fortune 500 companies. This growing client base relies on Technavio’s comprehensive coverage, extensive research, and actionable market insights to identify opportunities in existing and potential markets and assess their competitive positions within changing market scenarios.


Contacts

Technavio Research
Jesse Maida
Media & Marketing Executive
US: +1 844 364 1100
UK: +44 203 893 3200
Email: This email address is being protected from spambots. You need JavaScript enabled to view it.
Website: www.technavio.com/

KANSAS CITY, Mo.--(BUSINESS WIRE)--Kansas City Southern’s (KCS) (NYSE:KSU) Board of Directors on August 11, 2020 declared a regular dividend of $0.25 per share on the outstanding KCS 4% non-cumulative preferred stock. The dividend is payable on October 6, 2020 to preferred stockholders of record at the close of business on September 14, 2020.


The Board of Directors also declared a regular dividend of $0.40 per share on the outstanding KCS common stock. This dividend is payable on October 7, 2020, to common stockholders of record at the close of business on September 14, 2020.

Headquartered in Kansas City, Mo., Kansas City Southern (KCS) (NYSE: KSU) is a transportation holding company that has railroad investments in the U.S., Mexico and Panama. Its primary U.S. holding is The Kansas City Southern Railway Company, serving the central and south central U.S. Its international holdings include Kansas City Southern de Mexico, S.A. de C.V., serving northeastern and central Mexico and the port cities of Lázaro Cárdenas, Tampico and Veracruz, and a 50 percent interest in Panama Canal Railway Company, providing ocean-to-ocean freight and passenger service along the Panama Canal. KCS' North American rail holdings and strategic alliances with other North American rail partners are primary components of a unique railway system, linking the commercial and industrial centers of the U.S., Mexico and Canada. More information about KCS can be found at www.kcsouthern.com.


Contacts

KCS:
Ashley Thorne, 816-983-1530
This email address is being protected from spambots. You need JavaScript enabled to view it.

Ready Access to AI-Driven Capabilities Can Help Insurers, TPAs and Self-Insured Organizations Drive Growth, Profitability, Efficiencies in Underwriting and Claims Operations

CHICAGO & BOSTON--(BUSINESS WIRE)--#AI--Origami Risk LLC and Gradient AI today announced they have formed a strategic partnership to make Gradient’s claims and policy modeling capabilities and predictive analytics resources available on Origami’s industry-leading digital platform.


Gradient’s AI-driven tools and resources help drive efficiencies in policy underwriting and claims adjusting processes, such as enabling claim teams to focus greater attention on claims with a high probability of becoming significant cost-drivers. Gradient’s predictions, as well as associated contributing factors, are fully integrated with the Origami platform's robust workflow, reporting and digital engagement tools.

Insurers, TPAs, risk pools, and self-insured organizations can leverage Origami's automation capabilities along with Gradient’s vast proprietary data sets of millions of claims and policies to expand new business, streamline underwriting, speed delivery of quotes and enhance overall performance and profitability.

“As insurers strive to operate more profitably while maintaining market share and achieving targeted growth, new AI-driven solutions are increasingly helping them achieve their goals,” said Robert Petrie, CEO, Origami Risk. “Our collaboration with Gradient AI offers insurers, risk pools and large self-administered plans using our platform ready access to robust tools that can have measurable impacts on their performance and growth.”

“There’s no question that speed and accuracy in both claims management and underwriting have become paramount for insurers,” Stan Smith, CEO, Gradient AI said. “The seamless integration of our tools with Origami’s capabilities will facilitate improved decision-making, faster responses and measurable improvements in claims experience and underwriting results.”

Additional information on Gradient’s tools now available on Origami’s digital platform is available by visiting: https://bit.ly/3fNCP70.

About Gradient AI

Gradient AI was founded in order to address the need for state-of-the-art Artificial Intelligence (AI) solutions designed specifically for the trillion-dollar insurance industry. AI has emerged as a disruptive force revolutionizing the way insurance professionals achieve their objectives, and Gradient is leading that charge. Our solutions include software and models utilized by many of the world’s most recognized insurance carriers, MGAs, TPAs, pools, PEOs and more. Gradient’s stellar client base continues to grow rapidly. Gradient’s team of expert data scientists and insurance technology experts have an exceptional history of building wildly successful insurance technology companies, with the most satisfied customers in the industry. At Gradient, we focus exclusively on delivering measurable results in your underwriting and claims operations. To learn more about Gradient AI, please visit www.gradientai.com.

About Origami Risk

Origami Risk is a leading provider of integrated SaaS solutions for the risk, safety, and insurance industry — from insured corporate and public entities to brokers and risk consultants, insurers, third party claims administrators (TPAs), and risk pools. Highly configurable and completely scalable, Origami Risk delivers a full suite of risk management tools and insurance core system solutions from a secure, cloud-based platform accessible via web browser and mobile app. Visit origamirisk.com or contact Origami at This email address is being protected from spambots. You need JavaScript enabled to view it..


Contacts

Al Modugno, 917-414-4569
This email address is being protected from spambots. You need JavaScript enabled to view it.

HOUSTON--(BUSINESS WIRE)--Helix Energy Solutions Group, Inc. ("Helix") (NYSE: HLX) announced today its intention to offer, subject to market and other conditions, $175 million principal amount of Convertible Senior Notes due 2026 (the “2026 Notes”). Helix intends to use a portion of the net proceeds from the offering to repurchase a portion of its outstanding 4.25% Convertible Senior Notes due 2022 (the “2022 Notes”) and its outstanding 4.125% Convertible Senior Notes due 2023 (the “2023 Notes” and, together with the 2022 Notes, the “Outstanding Notes”) in privately negotiated transactions effected through one of the underwriters or its affiliate, as Helix’s agent, concurrently with the offering (the “repurchase transactions”) and to fund the cost of entering into the capped call transactions described below. Helix intends to use any remaining net proceeds from the offering for general corporate purposes, which may include the repayment of other indebtedness. Wells Fargo Securities, LLC and Evercore ISI are acting as joint book-running managers for the offering.


The terms of any repurchase transaction will depend on several factors, including the market price of Helix’s common stock and the trading price of the 2022 Notes and the 2023 Notes at the time of such repurchase(s). Any repurchase transactions may affect the market price of Helix’s common stock. Helix also expects that, should it repurchase a portion of the Outstanding Notes, holders thereof that sell such Outstanding Notes to Helix may enter into or unwind various derivatives with respect to Helix’s common stock and/or purchase or sell shares of its common stock in the market to hedge their exposure in connection with these transactions. In particular, Helix expects that many holders of the Outstanding Notes employ a convertible arbitrage strategy with respect to such Outstanding Notes and have a short position with respect to Helix’s common stock that they would close, through purchases of its common stock, in connection with Helix’s repurchase, if any, of their Outstanding Notes. This activity could increase (or reduce the size of any decrease in) the market price of Helix’s common stock or the 2026 Notes at that time, which could also impact the initial conversion prices of the 2026 Notes.

In connection with the pricing of the 2026 Notes, Helix expects to enter into one or more privately negotiated capped call transactions with one or more of the underwriters of the offering and/or their respective affiliates and/or other financial institutions (the “option counterparties”). The capped call transactions are expected generally to reduce the potential dilution to Helix’s common stock upon any conversion of the 2026 Notes or at the election of Helix (subject to certain conditions) to offset any cash payments that Helix may be required to make in excess of the aggregate principal amount of the converted 2026 Notes, as the case may be, upon any conversion of the 2026 Notes, with such reduction or offset subject to a cap.

Helix has been advised that, in connection with establishing their initial hedges of the capped call transactions, the option counterparties or their respective affiliates expect to enter into cash-settled over-the-counter derivative transactions with respect to Helix’s common stock concurrently with, or shortly after, the pricing of the 2026 Notes and may unwind these cash-settled over-the-counter derivative transactions and purchase shares of Helix’s common stock in open market transactions following the pricing of the 2026 Notes. This activity could increase (or reduce the size of any decrease in) the market price of Helix’s common stock, the 2026 Notes or other equity-linked securities of Helix at that time. In addition, the option counterparties or their respective affiliates may modify their hedge positions by entering into or unwinding various derivatives with respect to Helix’s common stock and/or purchasing or selling shares of Helix’s common stock or other securities of Helix in secondary market transactions following the pricing of the 2026 Notes and from time to time prior to the maturity of the 2026 Notes (and are likely to do so on each exercise date of the capped call transactions, which are expected to occur during the observation period prior to the maturity date of the 2026 Notes (the 40 trading day period beginning on the 41st scheduled trading day prior to the maturity date of the 2026 Notes), or following any termination of any portion of the capped call transactions in connection with any repurchase, redemption or conversion of the 2026 Notes if Helix makes the relevant election under the capped call transactions). This activity could also cause or avoid an increase or a decrease in the market price of Helix’s common stock, the 2026 Notes or other equity-linked securities of Helix, which could affect the ability of holders of the 2026 Notes to convert their 2026 Notes and, to the extent the activity occurs during any observation period related to a conversion of the 2026 Notes, it could affect the number of shares of Helix’s common stock and value of the consideration that holders of the 2026 Notes will receive upon conversion thereof.

The 2026 Notes are being offered pursuant to an effective shelf registration statement on Form S-3 filed with the Securities and Exchange Commission (the “SEC”). Copies of the prospectus and preliminary prospectus supplement relating to the offering may be obtained from the offices of Wells Fargo Securities, LLC, Attention: Equity Syndicate Department, 500 West 33rd Street, New York, New York 10001, Telephone: 800-326-5897, Email: This email address is being protected from spambots. You need JavaScript enabled to view it. or Evercore Group L.L.C., Attention: Equity Capital Markets, 55 East 52nd Street, 36th Floor, New York, New York 10055, Telephone: 888-474-0200, Email: This email address is being protected from spambots. You need JavaScript enabled to view it.. Electronic copies of the prospectus and preliminary prospectus supplement may also be obtained, when available, by visiting EDGAR on the SEC’s website at www.sec.gov.

This announcement shall not constitute an offer to sell or the solicitation of an offer to buy any securities nor shall there be any sale of any securities in any state or jurisdiction in which such offer, solicitation or sale would be unlawful prior to registration or qualification under the securities laws of any such state or jurisdiction.

About Helix

Helix Energy Solutions Group, Inc., headquartered in Houston, Texas, is an international offshore energy services company that provides specialty services to the offshore energy industry, with a focus on well intervention and robotics operations.

Forward-Looking Statements

This press release contains forward-looking statements that involve risks, uncertainties and assumptions that could cause our results to differ materially from those expressed or implied by such forward-looking statements. All statements, other than statements of historical fact, are “forward-looking statements” within the meaning of the Private Securities Litigation Reform Act of 1995, including, without limitation, any statements regarding any repurchases of Outstanding Notes, capped call transactions or other use of proceeds from the offering or effects of the transactions described in this press release; our strategy; any statements regarding visibility and future utilization; any projections of financial items; any statements regarding future operations expenditures; any statements regarding the plans, strategies and objectives of management for future operations; any statements regarding our ability to enter into and/or perform commercial contracts; any statements concerning developments; any statements regarding future economic conditions or performance; any statements regarding the offering and the use of proceeds therefrom; any statements of expectation or belief; and any statements of assumptions underlying any of the foregoing. The forward-looking statements are subject to a number of known and unknown risks, uncertainties and other factors that could cause results to differ materially from those in the forward-looking statements, including but not limited to the potential effects of the transactions described in this press release; the COVID-19 pandemic and actions by governments, customers, suppliers and partners with respect thereto; market conditions; results from acquired properties; demand for our services; the performance of contracts by suppliers, customers and partners; actions by governmental and regulatory authorities; operating hazards and delays, which includes delays in delivery, chartering or customer acceptance of assets or terms of their acceptance; our ultimate ability to realize current backlog; employee management issues; complexities of global political and economic developments; geologic risks; volatility of oil and gas prices and other risks described from time to time in our reports filed with the SEC, including Helix’s most recently filed Annual Report on Form 10-K and in Helix’s other filings with the SEC, which are available free of charge on the SEC’s website at www.sec.gov. We assume no obligation and do not intend to update these forward-looking statements, which speak only as of their respective dates, except as required by the securities laws.


Contacts

Erik Staffeldt, 281-618-0400
Executive Vice President & CFO
www.HelixESG.com

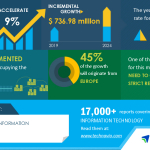
LONDON--(BUSINESS WIRE)--#GlobalMaritimeInformationMarket--Technavio has been monitoring the maritime information market and it is poised to grow by $ 736.98 million during 2020-2024, progressing at a CAGR of over 9% during the forecast period. The report offers an up-to-date analysis regarding the current market scenario, latest trends and drivers, and the overall market environment.


Technavio suggests three forecast scenarios (optimistic, probable, and pessimistic) considering the impact of COVID-19. Please Request Latest Free Sample Report on COVID-19 Impact

The market is fragmented, and the degree of fragmentation will accelerate during the forecast period. FLIR Systems Inc., Garmin Ltd., Inmarsat Group Ltd., Kongsberg Gruppen ASA, L3Harris Technologies Inc., Maxar Technologies Inc., ORBCOMM Inc., Raytheon Co., Saab AB, and Thales Group are some of the major market participants. To make the most of the opportunities, market vendors should focus more on the growth prospects in the fast-growing segments, while maintaining their positions in the slow-growing segments.

The need to comply with strict regulations has been instrumental in driving the growth of the market.

Maritime Information Market 2020-2024 : Segmentation

Maritime Information Market is segmented as below:

  • End-user
    • Commercial
    • Government
  • Application
    • MIA
    • MIP
    • VT
    • AIS
  • Geography
    • Europe
    • North America
    • APAC
    • MEA
    • South America

To learn more about the global trends impacting the future of market research, download a free sample: https://www.technavio.com/talk-to-us?report=IRTNTR40416

Maritime Information Market 2020-2024 : Scope

Technavio presents a detailed picture of the market by the way of study, synthesis, and summation of data from multiple sources. Our maritime information market report covers the following areas:

  • Maritime Information Market size
  • Maritime Information Market trends
  • Maritime Information Market industry analysis

This study identifies an increase in seaborne trade as one of the prime reasons driving the maritime information market growth during the next few years.

Maritime Information Market 2020-2024 : Vendor Analysis

We provide a detailed analysis of around 25 vendors operating in the maritime information market, including some of the vendors such as FLIR Systems Inc., Garmin Ltd., Inmarsat Group Ltd., Kongsberg Gruppen ASA, L3Harris Technologies Inc., Maxar Technologies Inc., ORBCOMM Inc., Raytheon Co., Saab AB, and Thales Group. Backed with competitive intelligence and benchmarking, our research reports on the maritime information market are designed to provide entry support, customer profile and M&As as well as go-to-market strategy support.

Register for a free trial today and gain instant access to 17,000+ market research reports.

Technavio's SUBSCRIPTION platform

Maritime Information Market 2020-2024 : Key Highlights

  • CAGR of the market during the forecast period 2020-2024
  • Detailed information on factors that will assist maritime information market growth during the next five years
  • Estimation of the maritime information market size and its contribution to the parent market
  • Predictions on upcoming trends and changes in consumer behavior
  • The growth of the maritime information market
  • Analysis of the market’s competitive landscape and detailed information on vendors
  • Comprehensive details of factors that will challenge the growth of maritime information market vendors

Table Of Contents :

Executive Summary

Market Landscape

  • Market ecosystem
  • Value chain analysis

Market Sizing

  • Market definition
  • Market segment analysis
  • Market size 2019
  • Market outlook: Forecast for 2019 - 2024

Five Forces Analysis

  • Five force summary
  • Bargaining power of buyers
  • Bargaining power of suppliers
  • Threat of new entrants
  • Threat of substitutes
  • Threat of rivalry
  • Market condition

Market Segmentation by Application

  • Market segments
  • Comparison by Application
  • MIA - Market size and forecast 2019-2024
  • MIP - Market size and forecast 2019-2024
  • VT - Market size and forecast 2019-2024
  • AIS - Market size and forecast 2019-2024
  • Market opportunity by Application

Market Segmentation by End-user

  • Market segments
  • Comparison by End-user
  • Commercial - Market size and forecast 2019-2024
  • Government - Market size and forecast 2019-2024
  • Market opportunity by End-user

Customer Landscape

Geographic Landscape

  • Geographic segmentation
  • Geographic comparison
  • Europe - Market size and forecast 2019-2024
  • North America - Market size and forecast 2019-2024
  • APAC - Market size and forecast 2019-2024
  • MEA - Market size and forecast 2019-2024
  • South America - Market size and forecast 2019-2024
  • Key leading countries
  • Market opportunity by geography

Market Drivers

Market Challenges

Market Trends

Vendor Landscape

  • Vendor landscape
  • Landscape disruption

Vendor Analysis

  • Vendors covered
  • Market positioning of vendors
  • FLIR Systems Inc.
  • Garmin Ltd.
  • Inmarsat Group Ltd.
  • Kongsberg Gruppen ASA
  • L3Harris Technologies Inc.
  • Maxar Technologies Inc.
  • ORBCOMM Inc.
  • Raytheon Co.
  • Saab AB
  • Thales Group

Appendix

  • Scope of the report
  • Currency conversion rates for US$
  • Research methodology
  • List of abbreviations

About Us

Technavio is a leading global technology research and advisory company. Their research and analysis focuses on emerging market trends and provides actionable insights to help businesses identify market opportunities and develop effective strategies to optimize their market positions. With over 500 specialized analysts, Technavio’s report library consists of more than 17,000 reports and counting, covering 800 technologies, spanning across 50 countries. Their client base consists of enterprises of all sizes, including more than 100 Fortune 500 companies. This growing client base relies on Technavio’s comprehensive coverage, extensive research, and actionable market insights to identify opportunities in existing and potential markets and assess their competitive positions within changing market scenarios.


Contacts

Technavio Research
Jesse Maida
Media & Marketing Executive
US: +1 844 364 1100
UK: +44 203 893 3200
Email: This email address is being protected from spambots. You need JavaScript enabled to view it.
Website: www.technavio.com/

ComEd expects majority of customers to be restored by Friday

CHICAGO--(BUSINESS WIRE)--ComEd crews have restored power to more than 60 percent of customers affected by a derecho that moved across the region Monday afternoon and brought hurricane force wind gusts in excess of 90 miles per hour, nearly 4,300 lightning strokes, a tornado in Chicago’s Rogers Park neighborhood and golf ball sized hail.


The company has restored service to 541,000 customers. Approximately 343,000 customers remain without power. ComEd’s smart grid investments since 2012 – such as technologies that automatically detect outages and reroute power around problem areas – helped ComEd restore service to 440,000 customers in the first 16 hours after the storm and avoid many more outages that would have occurred in a storm this severe.

The storm caused significant damage across the service territory, including downed poles, broken lines and damage from uprooted trees and broken branches. ComEd expects to restore power to the majority of customers by Friday night, with some customer outages in pockets with the most significant damage lasting until Saturday. ComEd will update customers’ individual restoration times with more accurate estimates as crews continue to assess damage and make needed repairs.

“ComEd appreciates the patience of our customers following this severe storm,” said Terry Donnelly, president and COO. “The damage from this storm was significant. As we continue to restore power to customers in hard hit communities, the safety of our customers and our crews remains our top priority.”

ComEd has more than 1,900 employees and contractors working around the clock to restore energy to affected customers as quickly and safely as possible. Additionally, more than 1,400 mutual assistance workers are coming in from out of state to assist in restoration efforts.

ComEd offers the following tips and information for customers to stay safe following severe weather:

  • If you encounter a downed power line, immediately call ComEd at 1-800-EDISON1 (1-800-334-7661) or go to ComEd.com to report the location. Spanish-speaking customers should call 1-800-95-LUCES (1-800-955-8237).
  • Never approach a downed power line. Always assume a power line is energized and extremely dangerous.
  • In the event of an outage, do not approach ComEd crews working to restore power to ask about restoration times. Crews may be working on live electrical equipment and the perimeter of the work zone may be hazardous.

Earlier technology issues with the phone system, website, and text reporting tools have been largely resolved, although there may be some intermittent interruptions as the systems become fully operational. ComEd urges customers to contact the company immediately if they experience a power outage. Customers can text OUT to 26633 (COMED) to report an outage and receive restoration information, and can follow the company on Twitter @ComEd or on Facebook at Facebook.com/ComEd. Customers can also call 1-800 EDISON1 (1-800-334-7661), or report outages via the website at www.ComEd.com/report. Spanish-speaking customers should call 1-800-95-LUCES (1-800-955-8237).

ComEd has introduced a mobile app for iPhone and Android® smart phones that gives customers the ability to report power outages and manage their accounts; download the app at www.ComEd.com/app.

ComEd has an interactive outage map on its website at www.ComEd.com/map, which allows customers to easily find information on the location and size of outages and get estimated power restoration times.

ComEd is a unit of Chicago-based Exelon Corporation (NASDAQ: EXC), a Fortune 100 energy company with approximately 10 million electricity and natural gas customers – the largest number of customers in the U.S. ComEd powers the lives of more than 4 million customers across northern Illinois, or 70 percent of the state’s population. For more information visit ComEd.com and connect with the company on Facebook, Twitter, Instagram and YouTube.


Contacts

ComEd Media Relations
312-394-3500

JACKSONVILLE, Fla.--(BUSINESS WIRE)--BAE Systems has received an $83.5 million contract from the U.S. Navy to modernize the guided-missile destroyers USS Carney (DDG 64) and USS Winston S. Churchill (DDG 81). The modernization work will be performed sequentially by the company’s shipyard in Jacksonville. The contracts include options that, if exercised, would bring the cumulative value to $211.6 million.


The USS Carney will be first in the shipyard, arriving in September 2020. The 23-year-old ship just returned from a six-year operational period in Rota, Spain, and will undergo extensive repair and upgrade work that will take more than 400 days to complete. The shipyard will drydock the ship and perform maintenance of the underwater hull, renovation of crew habitability spaces and upgrades to shipboard systems. The modernization is scheduled to be completed in November 2021.

The Winston S. Churchill will undergo a 390-day maintenance period when the ship arrives in June 2021. The shipyard’s work aboard the 18-year-old ship will include drydocking, replacement of steel structures onboard and support of the electronic systems upgrades. The modernization of the Winston S. Churchill is scheduled to be completed in July 2022.

“The modernization work aboard the Carney and Winston S. Churchill are significant for our Jacksonville maritime team and important for the service lives and mission capability of these combatants,” said Tim Spratto, general manager of BAE Systems Jacksonville Ship Repair. “The back-to-back sequencing of work is efficient and beneficial for our employees, our subcontractors and our Navy customer.”

BAE Systems’ Jacksonville shipyard has posted jobs and is expecting to hire workers in a number of trades, including welders, pipefitters, electricians, and painters, over the next two years to work on the two destroyers and for its ongoing repair and modernization work on other ships. The award of these two ships will also provide work for our team of subcontractor partners and third-party vendors in the port.

Commissioned in 1996, the USS Carney is named after Admiral Robert Carney, who served as chief of naval operations during the Eisenhower administration. The USS Winston S. Churchill is named after the renowned British prime minister and was commissioned in 2001.

BAE Systems is a leading provider of ship repair, maintenance, modernization, conversion, and overhaul services for the Navy, other government agencies, and select commercial customers. The company operates four full-service shipyards in California, Florida, Hawaii and Virginia, and offers a highly skilled, experienced workforce, eight dry docks/marine railways, and significant pier space and ship support services. For information about company jobs, visit www.jobs.baesystems.com.


Contacts

Karl Johnson, BAE Systems
Mobile: 757-375-5086
This email address is being protected from spambots. You need JavaScript enabled to view it.
www.baesystems.com/US
@BAESystemsInc

P97 Networks to enable contactless mobile payments for one of Asia-Pacific’s leading oil companies


SINGAPORE--(BUSINESS WIRE)--P97 Networks, Inc., has been selected by Mobil Oil New Zealand Limited, an affiliate of ExxonMobil Asia Pacific Pte Ltd, to enable mobile payments across its Mobil-branded retail network in New Zealand. ExxonMobil Asia Pacific is the downstream and chemical business hub for the region with over $15 billion of assets under affiliate management. Houston-based P97 Networks is a leader in cloud-based mobile commerce, in-vehicle payments, and frictionless digital marketing solutions. P97’s integrated mobile commerce solution has been enabled at over 170 Mobil Service Stations in New Zealand, its first market for an ExxonMobil affiliate in Asia Pacific, with the platform encompassing secure cloud payments, the Mobil Smiles Driver Rewards program and digital marketing.

“Shoppers around the world have quickly shifted towards the ease, convenience and safety of contactless mobile payments for all of their daily spend categories,” says Paul Clausen, Card Loyalty Payments Manager at Mobil Oil New Zealand. “As a global leader in energy, we looked for similar leadership in mobile commerce so that our customers realise the same benefits when purchasing fuel and in-store products. We chose P97 because they have proven their ability to deliver high levels of services at scale via their mobile commerce and digital marketing platform.”

P97 provides a cloud-based mobile commerce and digital marketing platform that connects shoppers to retail fuel, convenience, quick-serve restaurants, and other merchants by enabling payments and omni-channel offers through any mobile device or connected car. By removing friction from the transaction and enabling merchants to focus on the shopper experience, retailers can increase sales, build greater loyalty, and lower operating costs. Mobile payments also offer greater security for fuel transactions, protecting sensitive cardholder data and avoiding specific forms of fraud.

“We are honoured that ExxonMobil has selected P97 to manage mobile commerce across Mobil New Zealand Stations,” says Brad Jones, Managing Director, Asia Pacific at P97. “The explosive growth of the mobile payments market means consumers have an expectation for frictionless payments at the pump. By going mobile, ExxonMobil further strengthens its position in a highly competitive region and creates experiences that drive greater consumer loyalty.”

About P97

P97 Networks provides secure, cloud-based mobile commerce, in-vehicle payments, and digital marketing solutions for the convenience retail, fuel, and vehicle manufacturing industries under the brand name PetroZone®. P97’s mCommerce solutions enhance the ability to attract and retain customers by securely connecting millions of individual mobile phones and connected cars with merchants using identity, geolocation-based software that creates a unique mobile consumer experience. For more information, follow us on Twitter @p97networks or visit www.p97.com.


Contacts

Aaron Mirales
+1 (713) 588-4216
This email address is being protected from spambots. You need JavaScript enabled to view it.

DUBLIN--(BUSINESS WIRE)--The "Global Pyrolysis Oil Market: Growth, Trends and Forecast (2020-2025)" report has been added to ResearchAndMarkets.com's offering.


The global market for Pyrolysis Oil is expected to grow at a CAGR of over 4% during the forecast period.

Major factors driving the market studied are increasing demand of pyrolysis oil for generating heat & power and rising demand from fuels segment. On the flipside, problems associated with storage and transportation of pyrolysis oil and unfavourable conditions arising due to COVID-19 outbreak are the major restraints, which are expected to hinder the growth of market.

Key Highlights

  • Growing application of pyrolysis oil in biorefineries is expected to offer various lucrative opportunities for the growth of market.
  • By application, heat & power segment is expected to dominate the market owing to the increase in the usage in boilers, gas turbines, and diesel engines.
  • North America region dominated the pyrolysis oil market across the globe with the largest consumption from countries such as United States and Canada.

Market Trends

Increasing Demand from the Heat & Power Segment

  • Pyrolysis oil is a synthetic fuel which is manufactured as a substitute for petroleum. It is also known as biocrude or bio-oil.
  • The growing usage of pyrolysis oil to produce heat by direct combustion in a boiler or furnace is projected to increase the demand of pyrolysis oil and stimulate its market during the forecast period.
  • The application of pyrolysis oil in boiler is expected to grow during the forecast period as the usage of pyrolysis oil can reduce the carbon emissions by 90% due to which it can replace natural gas and heavy & light fuel oils, thus increasing the demand for pyrolysis oil.
  • Additionally, the usage of pyrolysis oil in gas turbines and diesel engines to generate heat & power is likely to provide lucrative opportunities for the growth of pyrolysis oil market during the forecast period.
  • The industrial boilers market is expected to grow at a CAGR of above 5% during the forecast period. Due to this, the demand for pyrolysis oil is expected to increase, which will stimulate its market during the forecast period.
  • Owing to all the above-mentioned factors for pyrolysis oil, its market is expected to grow rapidly over the forecast period.

North America Region to Dominate the World Market

  • North America region is expected to dominate the market for pyrolysis oil during the forecast period. In countries like United States and Canada, owing to the growth in the industrial diesel engines and industrial boilers industry, the demand for pyrolysis oil has been increasing in the region.
  • Pyrolysis oil contains different levels of oxygen. Due to this oxygen, pyrolysis oil is non-corrosive, non-volatile, tends to polymerize when exposed to air, and offers thermal stability. Owing to these superior properties pyrolysis oil can be used as an alternative for fossil fuels, which is likely to increase the demand of pyrolysis oil in the region.
  • Additionally, pyrolysis oil when co-fired in power plants can replace natural gas, heavy oil and coal. This factor is further anticipated to boost the pyrolysis oil market in the region.
  • Furthermore, pyrolysis oil contains a large number of different components which are used to derive new products. Pyrolysis oil can be fractionated into product streams like pyrolytic lignin, pyrolytic sugars, and watery phase containing smaller organic compounds. Owing to this the demand of pyrolysis oil is expected to increase in the region.
  • The United States combined heat & power market is expected to grow at a CAGR of above 7% during the forecast period which is likely to increase the demand of pyrolysis oil and stimulate its market during the forecast period.
  • Some of the major companies operating in North America region are - Klean Fuels (Klean Industries Inc.) and Chevron Phillips Chemical Company.
  • The aforementioned factors, coupled with government support, are contributing to the increasing demand for pyrolysis oil during the forecast period.

Competitive Landscape

The pyrolysis oil market is consolidated with top players accounting for a major share of the market. Some of the major companies in the market include BTG Biomass Technology Group, Divya International, Chevron Phillips Chemical Company, Biogreen (ETIA Group), and Klean Fuels (Klean Industries Inc.).

Key Topics Covered

1 INTRODUCTION

1.1 Study Assumptions

1.2 Scope of the Study

2 RESEARCH METHODOLOGY

3 EXECUTIVE SUMMARY

4 MARKET DYNAMICS

4.1 Drivers

4.1.1 Increasing Demand for Generating Heat & Power

4.1.2 Rising Demand from Fuels Segment

4.2 Restraints

4.2.1 Problems Associated to Storage and Transportation of Pyrolysis Oil

4.2.2 Unfavourable Conditions Arising due to COVID-19 Outbreak

4.3 Industry Value Chain Analysis

4.4 Porters Five Forces Analysis

5 MARKET SEGMENTATION

5.1 Raw Material

5.1.1 Waste Plastic

5.1.2 Waste Tire

5.1.3 Waste Rubber

5.1.4 Oil Sludge

5.2 Application

5.2.1 Fuels

5.2.2 Chemicals

5.2.3 Heat

5.2.4 Power

5.3 Geography

5.3.1 Asia-Pacific

5.3.2 North America

5.3.3 Europe

5.3.4 South America

5.3.5 Middle-East & Africa

6 COMPETITIVE LANDSCAPE

6.1 Mergers & Acquisitions, Joint Ventures, Collaborations, and Agreements

6.2 Market Share (%)/Ranking Analysis

6.3 Strategies Adopted by Leading Players

6.4 Company Profiles

6.4.1 Biogreen (ETIA Group)

6.4.2 BTG Biomass Technology Group

6.4.3 Chevron Phillips Chemical Company

6.4.4 Divya International

6.4.5 Ecomation Oy

6.4.6 Kingtiger (Shanghai) Environmental Technology Co. Ltd.

6.4.7 Klean Fuels (Klean Industries Inc.)

6.4.8 Pyro-Oil Nig. Ltd.

6.4.9 Recor

6.4.10 Trident Fuels Pty. Ltd.

7 MARKET OPPORTUNITIES AND FUTURE TRENDS

7.1 Growing Application in Biorefineries

7.2 Other Opportunities

For more information about this report visit https://www.researchandmarkets.com/r/vqiz0y


Contacts

ResearchAndMarkets.com
Laura Wood, Senior Press Manager
This email address is being protected from spambots. You need JavaScript enabled to view it.

For E.S.T Office Hours Call 1-917-300-0470
For U.S./CAN Toll Free Call 1-800-526-8630
For GMT Office Hours Call +353-1-416-8900

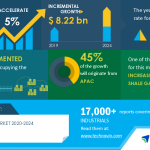
LONDON--(BUSINESS WIRE)--#GlobalSCADAMarket--Technavio has been monitoring the scada market and it is poised to grow by $ 8.22 bn during 2020-2024, progressing at a CAGR of 5% during the forecast period. The report offers an up-to-date analysis regarding the current market scenario, latest trends and drivers, and the overall market environment.


Technavio suggests three forecast scenarios (optimistic, probable, and pessimistic) considering the impact of COVID-19. Please Request Latest Free Sample Report on Covid-19 Impact

The market is fragmented, and the degree of fragmentation will accelerate during the forecast period. ABB Ltd., Emerson Electric Co., General Electric Co., Honeywell International Inc., Mitsubishi Electric Corp., Rockwell Automation Inc., Schneider Electric SE, Siemens AG, Toshiba Corp., and Yokogawa Electric Corp. are some of the major market participants. Although the increased extraction of shale gas will offer immense growth opportunities, high initial cost of implementation will challenge the growth of the market participants. To make the most of the opportunities, market vendors should focus more on the growth prospects in the fast-growing segments, while maintaining their positions in the slow-growing segments.

Increased extraction of shale gas has been instrumental in driving the growth of the market. However, high initial cost of implementation might hamper market growth.

SCADA Market 2020-2024 : Segmentation

SCADA Market is segmented as below:

  • End-user
    • Oil And Gas
    • Manufacturing
    • Power
    • Water And Wastewater Treatment
    • Others
  • Geography
    • APAC
    • North America
    • Europe
    • MEA
    • South America

To learn more about the global trends impacting the future of market research, download a free sample: https://www.technavio.com/talk-to-us?report=IRTNTR43934

SCADA Market 2020-2024 : Scope

Technavio presents a detailed picture of the market by the way of study, synthesis, and summation of data from multiple sources. Our scada market report covers the following areas:

  • SCADA Market size
  • SCADA Market trends
  • SCADA Market industry analysis

This study identifies growing demand for cloud-based SCADA systems as one of the prime reasons driving the scada market growth during the next few years.

SCADA Market 2020-2024 : Vendor Analysis

We provide a detailed analysis of around 25 vendors operating in the scada market, including some of the vendors such as ABB Ltd., Emerson Electric Co., General Electric Co., Honeywell International Inc., Mitsubishi Electric Corp., Rockwell Automation Inc., Schneider Electric SE, Siemens AG, Toshiba Corp., and Yokogawa Electric Corp. Backed with competitive intelligence and benchmarking, our research reports on the SCADA Market are designed to provide entry support, customer profile and M&As as well as go-to-market strategy support.

Register for a free trial today and gain instant access to 17,000+ market research reports.

Technavio's SUBSCRIPTION platform

SCADA Market 2020-2024 : Key Highlights

  • CAGR of the market during the forecast period 2020-2024
  • Detailed information on factors that will assist scada market growth during the next five years
  • Estimation of the scada market size and its contribution to the parent market
  • Predictions on upcoming trends and changes in consumer behavior
  • The growth of the scada market
  • Analysis of the market’s competitive landscape and detailed information on vendors
  • Comprehensive details of factors that will challenge the growth of scada market vendors

Table Of Contents :

Executive Summary

Market Landscape

  • Market ecosystem
  • Value chain analysis

Market Sizing

  • Market definition
  • Market segment analysis
  • Market size 2019
  • Market outlook: Forecast for 2019 - 2024

Five Forces Analysis

  • Five forces summary
  • Bargaining power of buyers
  • Bargaining power of suppliers
  • Threat of new entrants
  • Threat of substitutes
  • Threat of rivalry
  • Market condition

Market Segmentation by End-user

  • Market segments
  • Comparison by End-user
  • Oil and gas - Market size and forecast 2019-2024
  • Manufacturing - Market size and forecast 2019-2024
  • Power - Market size and forecast 2019-2024
  • Water and wastewater treatment - Market size and forecast 2019-2024
  • Others - Market size and forecast 2019-2024
  • Market opportunity by End-user

Market Segmentation by Type

  • Market segments
  • Comparison by Type
  • Solutions - Market size and forecast 2019-2024
  • Services - Market size and forecast 2019-2024
  • Market opportunity by Type

Customer landscape

Geographic Landscape

  • Geographic segmentation
  • Geographic comparison
  • APAC - Market size and forecast 2019-2024
  • North America - Market size and forecast 2019-2024
  • Europe - Market size and forecast 2019-2024
  • MEA - Market size and forecast 2019-2024
  • South America - Market size and forecast 2019-2024
  • Key leading countries
  • Market opportunity by geography
  • Market drivers – Demand led growth
  • Market challenges
  • Market trends

Vendor Landscape

  • Vendor landscape
  • Landscape disruption

Vendor Analysis

  • Vendors covered
  • Market positioning of vendors
  • ABB Ltd.
  • Emerson Electric Co.
  • General Electric Co.
  • Honeywell International Inc.
  • Mitsubishi Electric Corp.
  • Rockwell Automation Inc.
  • Schneider Electric SE
  • Siemens AG
  • Toshiba Corp.
  • Yokogawa Electric Corp.

Appendix

  • Scope of the report
  • Currency conversion rates for US$
  • Research methodology
  • List of abbreviations

About Us

Technavio is a leading global technology research and advisory company. Their research and analysis focuses on emerging market trends and provides actionable insights to help businesses identify market opportunities and develop effective strategies to optimize their market positions. With over 500 specialized analysts, Technavio’s report library consists of more than 17,000 reports and counting, covering 800 technologies, spanning across 50 countries. Their client base consists of enterprises of all sizes, including more than 100 Fortune 500 companies. This growing client base relies on Technavio’s comprehensive coverage, extensive research, and actionable market insights to identify opportunities in existing and potential markets and assess their competitive positions within changing market scenarios.


Contacts

Technavio Research
Jesse Maida
Media & Marketing Executive
US: +1 844 364 1100
UK: +44 203 893 3200
Email: This email address is being protected from spambots. You need JavaScript enabled to view it.
Website: www.technavio.com/

Enhancing support for legacy products, white-labeled versions of the first- and second-generation ALiEn plunger controllers, best-selling Cyclops arrival sensor, and Sasquatch velocity sensor has been a primary focus for ETC as they enter their 20th year in business.

CALGARY, Alberta--(BUSINESS WIRE)--#artificiallift--2020 has been a whopper of a year so far for the North American oil and gas industry. Between regulatory roadblocks, a massive reduction in global demand for natural resources, newly negotiated trade terms, and a whole host of unforeseen challenges related to the COVID-19 outbreak, the entire sector has taken one massive blow after another. The struggles faced by equipment manufacturers, service providers, and producers have greatly impacted several other industries, with hope for a quick recovery seemingly whittling away as we enter the back half the year.


In spite of the hardship that the oil and gas industry has endured in recent months, traditionally change-resistant businesses have pivoted and adjusted to a new normal with an impressive amount of agility. There has been a significant evolution in the way we, our partners, and our customers do business, and there’s no turning back now. The digital revolution began many years ago, but the acceleration in recent months is a huge testament to the adaptability and resilience of the industry.

As a technology company with close ties to the field, ETC understands the demands and challenges service companies and producers face. Optimizing well production requires precise analytics, reliable equipment, and a lot of underlying knowledge and experience. Enhancing support for legacy products, white-labeled versions of the first- and second-generation ALiEn plunger controllers, the best-selling Cyclops arrival sensor, and Sasquatch velocity sensor has been a primary focus for ETC this year. The latest investment to ensure ETC products continue to create value and ROI is a new online Product Support Center. New articles and resources will be added on a regular basis so customers can find all the information needed to get the most of ETC plunger lift controls and sensors. Regularly scheduled live video training sessions are available, with recorded versions available on-demand at support.etcorp.ca.

To help oil and gas companies keep natural gas wells producing at optimal levels for a lower capital investment, ETC is pleased to announce several new programs; Refurbished controllers and replacement faceplates are now available at a reduced price. Please visit etcorp.ca or contact an authorized reseller for information on these programs, available for a limited time only.

ETC is proud to be a leading manufacturer of high quality, low power, certified plunger controls and sensors. Historically white labeled under other brand names, nearly 12,000 ALiEn and ALiEn2 controllers are optimizing gas wells in the field today, while just shy of 60,000 sensors provide acutely accurate plunger arrival alerts. ETC has seen their share of changes and weathered plenty of storms throughout two decades of business. They’ve stood strong and stable while resellers and customers completed acquisitions, mergers, and splits. Despite many unknowns ahead, the team at ETC look to the future with relentless optimism that the grit and determination of the North American oil and gas industry will propel us back into prosperity once again.

If you would like more information, please contact Mark Scantlebury at (403) 290-6300 or This email address is being protected from spambots. You need JavaScript enabled to view it.


Contacts

Mark Scantlebury, CEO
Extreme Telematics Corp
(403) 290-6300
This email address is being protected from spambots. You need JavaScript enabled to view it.

HOUSTON--(BUSINESS WIRE)--Helix Energy Solutions Group, Inc. ("Helix") (NYSE: HLX) announced today it has priced an upsized offering of $200 million principal amount of 6.75% Convertible Senior Notes due 2026 (the “2026 Notes”). The size of the offering was increased from the previously announced $175 million aggregate principal amount. Helix expects to close the offering of the 2026 Notes on or about August 14, 2020, subject to the satisfaction of customary closing conditions. Wells Fargo Securities, LLC and Evercore ISI are acting as joint book-running managers for the offering.


The 2026 Notes are to be issued via an underwritten public offering, resulting in expected net proceeds of approximately $192.5 million, after deducting underwriting fees and estimated offering expenses. Helix intends to use approximately $10.5 million of the net proceeds from the offering to fund the cost of entering into the capped call transactions described below. Helix intends to use approximately $183 million (or approximately $186 million with accrued interest), consisting of the remainder of the net proceeds together with cash on hand, to repurchase approximately $90 million aggregate principal amount of its outstanding 4.25% Convertible Senior Notes due 2022 (the “2022 Notes”) and approximately $95 million aggregate principal amount of its outstanding 4.125% Convertible Senior Notes due 2023 (the “2023 Notes” and, together with the 2022 Notes, the “Outstanding Notes”) in privately negotiated transactions effected through one of the underwriters or its affiliate, as Helix’s agent, concurrently with the offering (the “repurchase transactions”).

Interest on the 2026 Notes will be paid semi-annually on February 15 and August 15 of each year beginning on February 15, 2021. During certain periods and subject to certain conditions, the 2026 Notes will be convertible by holders based on an initial conversion rate of 143.3795 shares of common stock per $1,000 principal amount of 2026 Notes, which is equivalent to an initial conversion price of approximately $6.97 per share of common stock, subject to adjustment. Upon conversion, holders will receive, at Helix’s discretion, cash, shares of Helix’s common stock or a combination thereof.

In addition, the holders of the 2026 Notes may require Helix to repurchase the 2026 Notes under certain circumstances, and Helix may redeem all or any portion of the 2026 Notes, at its option, on or after August 15, 2023 (but, in the case of a partial redemption, no later than the 40th scheduled trading day immediately before the maturity date), subject to certain conditions, at a redemption price payable in cash equal to 100% of the principal amount of the 2026 Notes to be redeemed, plus accrued and unpaid interest and a “make-whole premium” with a value equal to the present value of the remaining scheduled payments of interest on the 2026 Notes to be redeemed through February 15, 2026.

The terms of the repurchase transactions were negotiated individually with holders of the Outstanding Notes based on several factors, including the market price of Helix’s common stock and the trading price of the 2022 Notes and the 2023 Notes at the time of such repurchase(s). The repurchase transactions may affect the market price of Helix’s common stock. Helix also expects that holders of Outstanding Notes that sell such Outstanding Notes to it may enter into or unwind various derivatives with respect to Helix’s common stock and/or purchase or sell shares of its common stock in the market to hedge their exposure in connection with these transactions. In particular, Helix expects that many holders of the Outstanding Notes employ a convertible arbitrage strategy with respect to such Outstanding Notes and have a short position with respect to Helix’s common stock that they would close, through purchases of its common stock, in connection with Helix’s repurchase, if any, of their Outstanding Notes. This activity could increase (or reduce the size of any decrease in) the market price of Helix’s common stock or the 2026 Notes at that time, which could also impact the initial conversion prices of the 2026 Notes.

In connection with the pricing of the 2026 Notes, Helix entered into one or more privately negotiated capped call transactions with one or more of the underwriters of the offering and/or their respective affiliates and/or other financial institutions (the “option counterparties”). The capped call transactions are expected generally to reduce the potential dilution to Helix’s common stock upon any conversion of the 2026 Notes or at the election of Helix (subject to certain conditions) to offset any cash payments that Helix may be required to make in excess of the aggregate principal amount of the converted 2026 Notes, as the case may be, upon any conversion of the 2026 Notes, with such reduction or offset subject to a cap. The cap price of the capped call transactions will initially be $8.4175 per share of Helix's common stock, which represents a premium of 75% over the closing price of Helix’s common stock on the NYSE of $4.81 per share on August 11, 2020.

Helix has been advised that, in connection with establishing their initial hedges of the capped call transactions, the option counterparties or their respective affiliates expect to enter into cash-settled over-the-counter derivative transactions with respect to Helix’s common stock concurrently with, or shortly after, the pricing of the 2026 Notes and may unwind these cash-settled over-the-counter derivative transactions and purchase shares of Helix’s common stock in open market transactions following the pricing of the 2026 Notes. This activity could increase (or reduce the size of any decrease in) the market price of Helix’s common stock, the 2026 Notes or other equity-linked securities of Helix at that time. In addition, the option counterparties or their respective affiliates may modify their hedge positions by entering into or unwinding various derivatives with respect to Helix’s common stock and/or purchasing or selling shares of Helix’s common stock or other securities of Helix in secondary market transactions following the pricing of the 2026 Notes and from time to time prior to the maturity of the 2026 Notes (and are likely to do so on each exercise date of the capped call transactions, which are expected to occur during the observation period prior to the maturity date of the 2026 Notes (the 40 trading day period beginning on the 41st scheduled trading day prior to the maturity date of the 2026 Notes), or following any termination of any portion of the capped call transactions in connection with any repurchase, redemption or conversion of the 2026 Notes if Helix makes the relevant election under the capped call transactions). This activity could also cause or avoid an increase or a decrease in the market price of Helix’s common stock, the 2026 Notes or other equity-linked securities of Helix, which could affect the ability of holders of the 2026 Notes to convert their 2026 Notes and, to the extent the activity occurs during any observation period related to a conversion of the 2026 Notes, it could affect the number of shares of Helix’s common stock and value of the consideration that holders of the 2026 Notes will receive upon conversion thereof.

The 2026 Notes are being offered pursuant to an effective shelf registration statement on Form S-3 filed with the Securities and Exchange Commission (the “SEC”). Copies of the prospectus and prospectus supplement relating to the offering may be obtained from the offices of Wells Fargo Securities, LLC, Attention: Equity Syndicate Department, 500 West 33rd Street, New York, New York 10001, Telephone: 800-326-5897, Email: This email address is being protected from spambots. You need JavaScript enabled to view it. or Evercore Group L.L.C., Attention: Equity Capital Markets, 55 East 52nd Street, 36th Floor, New York, New York 10055, Telephone: 888-474-0200, Email: This email address is being protected from spambots. You need JavaScript enabled to view it.. Electronic copies of the prospectus and prospectus supplement may also be obtained, when available, by visiting EDGAR on the SEC’s website at www.sec.gov.

This announcement shall not constitute an offer to sell or the solicitation of an offer to buy any securities nor shall there be any sale of any securities in any state or jurisdiction in which such offer, solicitation or sale would be unlawful prior to registration or qualification under the securities laws of any such state or jurisdiction.

About Helix

Helix Energy Solutions Group, Inc., headquartered in Houston, Texas, is an international offshore energy services company that provides specialty services to the offshore energy industry, with a focus on well intervention and robotics operations.

Forward-Looking Statements

This press release contains forward-looking statements that involve risks, uncertainties and assumptions that could cause our results to differ materially from those expressed or implied by such forward-looking statements. All statements, other than statements of historical fact, are “forward-looking statements” within the meaning of the Private Securities Litigation Reform Act of 1995, including, without limitation, any statements regarding any repurchases of Outstanding Notes, capped call transactions or other use of proceeds from the offering or effects of the transactions described in this press release; our strategy; any statements regarding visibility and future utilization; any projections of financial items; any statements regarding future operations expenditures; any statements regarding the plans, strategies and objectives of management for future operations; any statements regarding our ability to enter into and/or perform commercial contracts; any statements concerning developments; any statements regarding future economic conditions or performance; any statements regarding the offering and the use of proceeds therefrom; any statements of expectation or belief; and any statements of assumptions underlying any of the foregoing. The forward-looking statements are subject to a number of known and unknown risks, uncertainties and other factors that could cause results to differ materially from those in the forward-looking statements, including but not limited to the potential effects of the transactions described in this press release; the COVID-19 pandemic and actions by governments, customers, suppliers and partners with respect thereto; market conditions; results from acquired properties; demand for our services; the performance of contracts by suppliers, customers and partners; actions by governmental and regulatory authorities; operating hazards and delays, which includes delays in delivery, chartering or customer acceptance of assets or terms of their acceptance; our ultimate ability to realize current backlog; employee management issues; complexities of global political and economic developments; geologic risks; volatility of oil and gas prices and other risks described from time to time in our reports filed with the SEC, including Helix’s most recently filed Annual Report on Form 10-K and in Helix’s other filings with the SEC, which are available free of charge on the SEC’s website at www.sec.gov. We assume no obligation and do not intend to update these forward-looking statements, which speak only as of their respective dates, except as required by the securities laws.


Contacts

Erik Staffeldt, 281-618-0465
Executive Vice President & CFO
This email address is being protected from spambots. You need JavaScript enabled to view it.

BATAVIA, N.Y.--(BUSINESS WIRE)--Graham Corporation (NYSE: GHM), a global business that designs, manufactures and sells critical equipment for the oil refining, petrochemical and defense industries, announced that its Board of Directors declared a quarterly cash dividend of $0.11 per common share.


The dividend will be payable on August 31, 2020 to stockholders of record at the close of business on August 21, 2020.

ABOUT GRAHAM CORPORATION

Graham is a global business that designs, manufactures and sells critical equipment for the energy, defense and chemical/petrochemical industries. Energy markets include oil refining, cogeneration, and alternative power. For the defense industry, the Company’s equipment is used in nuclear propulsion power systems for the U.S. Navy. Graham’s global brand is built upon world-renowned engineering expertise in vacuum and heat transfer technology, responsive and flexible service and unsurpassed quality. Graham designs and manufactures custom-engineered ejectors, vacuum pumping systems, surface condensers and vacuum systems. Graham’s equipment can also be found in other diverse applications such as metal refining, pulp and paper processing, water heating, refrigeration, desalination, food processing, pharmaceutical, heating, ventilating and air conditioning. Graham’s reach spans the globe and its equipment is installed in facilities from North and South America to Europe, Asia, Africa and the Middle East.

Graham routinely posts news and other important information on its website, www.graham-mfg.com, where additional comprehensive information on Graham Corporation and its subsidiaries can be found.


Contacts

Jeffrey F. Glajch
Vice President - Finance and CFO
Phone: (585) 343-2216
This email address is being protected from spambots. You need JavaScript enabled to view it.

Deborah K. Pawlowski / Christopher M Gordon
Kei Advisors LLC
Phone: (716) 843-3908 / (716) 843-3874
This email address is being protected from spambots. You need JavaScript enabled to view it. / This email address is being protected from spambots. You need JavaScript enabled to view it.


Factoring extends innovative QuickPay program to non-Convoy loads and introduces new fuel card to help carriers save an industry-leading $19,000 a year in operating costs.

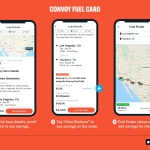
SEATTLE--(BUSINESS WIRE)--Convoy, the nation’s most efficient digital freight network, today announced Convoy Factoring, powered by Apex Capital, a new payment service for carriers that provides same or next day payment, with no hidden fees and no lock-in contracts. Convoy now offers qualified carriers access to immediate payment, at a rate of 0% with QuickPay for Convoy loads and 1% - 2.99% with factoring for non-Convoy loads. A carrier hauling half of their loads with Convoy sees an average rate of 1.45%, which is 57% better than the industry average, saving them $7,000 in factoring costs and associated fees. Additionally, Convoy launched a new fuel card which helps address the single biggest cost to carriers on the road. The Convoy fuel card saves carriers an average of 63* cents per gallon, 3x better than the industry average, putting up to $12,000 per truck per year back in drivers’ pockets.


Over 90% of the carriers in the U.S. are small fleets with 10 or fewer trucks. Some of the biggest over the road expenses for these carriers are fuel and factoring. Today, drivers hauling for traditional brokers face a tough decision, either wait up to 60 days for payment or use a factoring service that costs an average of 3.5%, and can include hidden fees and lengthy lock-in contracts. A carrier can pay more than $9,000 of their take home pay in factoring and associated fees. Meanwhile drivers are at the mercy of fuel costs and typically pay another $52,000 a year just to fill their tanks. While traditional fuel cards offer a modest offset to these costs, they don’t provide a convenient way to line-up fuel saving discounts on the routes carriers are running, and as a result, often go unused.

Driving a truck is one of the most important jobs across our nation. Yet the vast majority of carriers who work with traditional brokers are forced to wait up to 60 days following a job just to get the money they’ve earned, to cover their expenses and provide for their families,” said Dan Lewis, CEO of Convoy. “Our continued focus is to help carriers earn more, and keep more of their hard-earned pay, while removing many of the day-to-day hassles of the job. Extending Convoy QuickPay to cover non-Convoy loads, with low rates and a best-in-class fuel card, provides the industry’s leading option for savings.”

New Convoy Factoring extends innovative QuickPay program to non-Convoy loads

Carriers now gain the convenience of getting paid the same or next day, with Convoy Factoring, at a low rate for non-Convoy loads and at 0% for Convoy loads, with QuickPay. Combined, a carrier’s rate can be up to 57% lower than the industry average when a carrier hauls half of their loads with Convoy.

Convoy Factoring has no contract lock-in, allowing carriers to try the service without risk. With no invoice or transaction fees, carriers can keep their cash flow constant by submitting each invoice individually instead of waiting and submitting multiple invoices together. The Convoy Factoring process has been fully integrated into the Convoy mobile app to enable carriers to submit invoices and find their next load with a few taps, in one place. By partnering with Apex Capital, Convoy provides carriers with the trusted, high-quality service offered by Apex Capital for more than 25 years.

“Convoy was the first to innovate with free QuickPay, allowing tens of thousands of carriers to get paid in two days and with no fees when they drove for Convoy,” said Ziad Ismail, Convoy Chief Product Officer. “This is a benefit that the majority of brokers still do not offer to carriers. Today we take that innovation and support for carriers a major step further with Convoy Factoring, offering carriers the lowest average rate in the industry across all of the loads they haul, which puts more money back in their pockets.”

“Convoy Factoring will be amazing for our business. No haggle, no hidden fees, no stress. The rates are top notch and I will be able to save thousands of dollars this year alone,” said Mike Bhangu, a Kent, Washington-based carrier who has been working with Convoy since 2016. “I love that I will be able to factor directly in the app within seconds. It will be my one stop shop for getting paid for all my loads and finding what I will haul next.”

New Convoy fuel card can save carriers $12,000 per truck per year

Today, Convoy addresses one of the largest expenses for carriers with the introduction of the Convoy fuel card. Carriers who sign up for Convoy’s fuel card can save an industry-leading average of 63* cents per gallon at the pump, 3x more than the industry average of 20 cents. With carriers consuming more than 18,000 gallons per year, the discount offered by the Convoy fuel card can save carriers more than $12,000 per truck per year.

Now, carriers get the best fuel discounts without paying any transaction fees at more than 1,000 participating truck stops across the country, including TA-Petro, Ambest, Roady’s and Sapp Bros. In addition to offering an industry leading discount, Convoy has built a new in-app integration which includes an interactive map of truck stops and fuel prices enabling carriers to consider available fuel discounts on the route when searching for their next load. The ability to plan their route and identify fuel stops, easily and simultaneously, is essential for drivers to maximize their savings.

“Each of our trucks goes through more than 60 gallons per day, so fuel is consistently one of my biggest expenses. With the big savings I will get from using the Convoy fuel card, I’ll save thousands of dollars that I can reinvest back into my business,” said Inderjit Gill, a Manteca, California-based carrier that has been working with Convoy since 2018.

*63¢ per gallon is based on client transactions using participating truck stops for Q2 of 2020

About Convoy

Convoy is the nation’s most efficient digital freight network. We move thousands of truckloads around the country each day through our optimized, connected network of carriers, saving money for shippers, increasing earnings for drivers, and eliminating carbon waste for our planet. We use technology and data to solve problems of waste and inefficiency in the $800B trucking industry, which generates over 72 million metric tons of wasted CO2 emissions from empty trucks. Fortune 500 shippers like Anheuser-Busch, P&G, Niagara, and Unilever trust Convoy to lower costs, increase logistics efficiency, and achieve environmental sustainability targets. Convoy.com


Contacts

Media Contact:
Sam Hallock, Corporate Communications
This email address is being protected from spambots. You need JavaScript enabled to view it.
425-241-8954

WARRENVILLE, Ill.--(BUSINESS WIRE)--Fuel Tech, Inc. (NASDAQ: FTEK), a technology company providing advanced engineering solutions for the optimization of combustion systems, emissions control and water treatment in utility and industrial applications, today reported financial results for the second quarter ended June 30, 2020 (“Q2 2020”).


“We believe that the COVID-19 pandemic affected our Air Pollution Control (“APC”) and FUEL CHEM® operations in the second quarter,” said Vincent J. Arnone, President and CEO. “The delays that we had been experiencing in closing new APC business awards were extended as a result of COVID-19. However, we do have active projects in our current pipeline and we are confident that we will close new awards with an aggregate total value of $10 to $15 million by the end of the year. Our FUEL CHEM segment was impacted by slower activity due to COVID-19, particularly in the months of April and May. A decline in economic activity caused reduced electricity demand which led to a reduction in electricity generation and dispatch, in particular for coal-fired power generation units. Fortunately, the month of June showed improvement and thus far in the third quarter we have returned to normalized run rates for use of our FUEL CHEM programs. Early in the third quarter, we announced a new order for equipment supporting our TIFI® Targeted In-Furnace Injection technology on three coal-fired units in the United States. The equipment installation and startup for these units should occur before the end of the third quarter, and we expect to see contributions from these units throughout the second half of the year.”

Mr. Arnone concluded, “We have collected and repatriated in excess of $1.0 million in cash as of June 30, 2020 following the closure of our underperforming China operation (“Beijing Fuel Tech”) and expect to continue these collections throughout 2020. We ended the quarter with $11.3 million in cash and cash equivalents.”

DGI™ Dissolved Gas Infusion

The Company previously reported that an on-site demonstration of its water technology at a pulp and paper facility in the Midwest planned for early in Q2 2020 had been delayed due to the impact of COVID-19, and this demonstration is still delayed as of this date. In July, the Company signed a new license agreement related to the DGI technology from Kadance Corporation, an entity that purchased the assets from the prior licensor of the technology, NanO2, LLC. Kadance Corporation is a company active in municipal wastewater treatment, with a focus on delivering biological solutions to this market. Under the terms of the new agreement, Fuel Tech has more flexibility regarding non-exclusive market access and now can manufacture all DGI delivery systems on its own. The Company continues to advance conversations with several other potential customers of our DGI technology across a variety of industries.

Q2 2020 Consolidated Results Overview

Consolidated revenues declined to $4.4 million from $8.9 million in Q2 2019, reflecting lower APC and FUEL CHEM revenues. Results for Q2 2020 and Q2 2019 did not include any revenue from Beijing Fuel Tech.

Gross margin for Q2 2020 was 13.7% of revenues compared to 43.6% of revenues in Q2 2019, primarily reflecting lower revenues in the current quarter and a $1.1 million charge in our APC segment (described below). Excluding the APC charge, consolidated gross margin for Q2 2020 was 40%.

SG&A expenses declined by 38.2% to $2.8 million from $4.5 million in Q2 2019. Included in this amount for Q2 2020 is a reversal of $0.5 million in expense related to the allowance for doubtful accounts associated with the aforementioned APC charge.

Net loss from continuing operations was $(2.5) million, or $(0.10) per share, compared to net loss from continuing operations of $(0.9) million, or $(0.04) per share in Q2 2019. Net (loss) from continuing operations in Q2 2020 and Q2 2019 attributable to Beijing Fuel Tech was $(0.1) million and $(0.5) million, respectively.

Capital projects backlog at June 30, 2020 was $8.3 million, $7.2 million of which was domestic. Backlog at December 31, 2019 was $9.7 million, of which $8.6 million was domestic.

APC segment revenues declined to $1.9 million from $4.8 million in Q2 2019, primarily the result of project timing, lower capital projects backlog and a delay in new contract awards. APC gross margin was $(0.4) million reflecting a $1.1 million charge associated with a previously disclosed equipment warranty liability with a U.S. customer. Excluding the charge, APC gross margin for Q2 2020 was $0.7 million, or 39%.

Fuel Tech has submitted a reimbursement request to its insurer for the amount expended in remediation, and such amount is within the coverage limits of its insurance policy. Fuel Tech and the insurance company continue to work amicably to resolve this matter and, upon settlement with its insurer, all amounts received will be applied to reverse the charge.

FUEL CHEM segment revenues were $2.5 million compared to $4.1 million in Q2 2019. This segment’s performance was impacted by a reduced demand for power, extended unscheduled outages, and significantly reduced operations largely caused by the COVID-19 pandemic. Segment gross margin was 40.0% in Q2 2020 and 49.9% in Q2 2019.

Adjusted EBITDA loss was $(2.2) million in Q2 2020 compared to an Adjusted EBITDA loss of $(0.5) million in Q2 2019.

Financial Condition

At June 30, 2020 total cash was $11.3 million including restricted cash of $3.0 million, down from total cash of $13.5 million, including restricted cash of $2.6 million, at December 31, 2019. Stockholders’ equity was $21.1 million, or $0.86 per share.

As previously announced, on April 15, 2020 the Company received $1.6 million in loan proceeds from the Paycheck Protection Program (the “PPP”), established pursuant to the recently enacted Coronavirus Aid, Relief, and Economic Security Act (the “CARES Act”) and administered by the U.S. Small Business Administration (“SBA”). The unsecured loan is evidenced by a promissory note of the Company dated April 15, 2020 (the “Note”) in the principal amount of $1.6 million issued to BMO Harris Bank N.A. (the “Bank”), the lender, pursuant to a loan agreement, dated April 15, 2020, between the Company and the Bank. Under the terms of the Agreement, the Note and the PPP Loan, interest will accrue on the outstanding principal at the rate of 1.0% per annum. Additional information concerning this loan is available in the Company’s Form 10-Q for the period ended June 30, 2020.

Conference Call

Management will host a conference call on Wednesday, August 12, 2020 at 10:00 am ET / 9:00 am CT to discuss the results and business activities.

Interested parties may participate in the call by dialing:

  • (877) 423-9820 (Domestic) or
  • (201) 493-6749 (International)

The conference call will also be accessible via the Upcoming Events section of the Company’s web site at www.ftek.com. Following management’s opening remarks, there will be a question and answer session. Questions may be asked during the live call, or alternatively, you may e-mail questions in advance to This email address is being protected from spambots. You need JavaScript enabled to view it.. For those who cannot listen to the live broadcast, an online replay will be available at www.ftek.com.

About Fuel Tech

Fuel Tech develops and commercializes state-of-the-art proprietary technologies for air pollution control, process optimization, water treatment, and advanced engineering services. These technologies enable customers to operate in a cost-effective and environmentally sustainable manner. Fuel Tech is a leader in nitrogen oxide (NOx) reduction and particulate control technologies and its solutions have been in installed on over 1,200 utility, industrial and municipal units worldwide. The Company’s FUEL CHEM® technology improves the efficiency, reliability, fuel flexibility, boiler heat rate, and environmental status of combustion units by controlling slagging, fouling, corrosion and opacity. Water treatment technologies include DGI™ Dissolved Gas Infusion Systems which utilize a patented nozzle to deliver supersaturated oxygen solutions and other gas-water combinations to target process applications or environmental issues. This infusion process has a variety of applications in the water and wastewater industries, including remediation, aeration, biological treatment and wastewater odor management. Many of Fuel Tech’s products and services rely heavily on the Company’s exceptional Computational Fluid Dynamics modeling capabilities, which are enhanced by internally developed, high-end visualization software. For more information, visit Fuel Tech’s web site at www.ftek.com.

NOTE REGARDING FORWARD-LOOKING STATEMENTS

This press release contains “forward-looking statements” as defined in Section 21E of the Securities Exchange Act of 1934, as amended, which are made pursuant to the safe harbor provisions of the Private Securities Litigation Reform Act of 1995 and reflect Fuel Tech’s current expectations regarding future growth, results of operations, cash flows, performance and business prospects, and opportunities, as well as assumptions made by, and information currently available to, our management. Fuel Tech has tried to identify forward-looking statements by using words such as “anticipate,” “believe,” “plan,” “expect,” “estimate,” “intend,” “will,” and similar expressions, but these words are not the exclusive means of identifying forward-looking statements. These statements are based on information currently available to Fuel Tech and are subject to various risks, uncertainties, and other factors, including, but not limited to, those discussed in Fuel Tech’s Annual Report on Form 10-K in Item 1A under the caption “Risk Factors,” and subsequent filings under the Securities Exchange Act of 1934, as amended, which could cause Fuel Tech’s actual growth, results of operations, financial condition, cash flows, performance and business prospects and opportunities to differ materially from those expressed in, or implied by, these statements. Fuel Tech undertakes no obligation to update such factors or to publicly announce the results of any of the forward-looking statements contained herein to reflect future events, developments, or changed circumstances or for any other reason. Investors are cautioned that all forward-looking statements involve risks and uncertainties, including those detailed in Fuel Tech’s filings with the Securities and Exchange Commission.

FUEL TECH, INC.

CONDENSED CONSOLIDATED BALANCE SHEETS

(Unaudited)

(in thousands, except share and per share data)


June 30,
2020

December 31,
2019

ASSETS


Current assets:


Cash and cash equivalents

$

8,254


$

10,914


Restricted cash

2,639


2,080


Accounts receivable, net

5,658


6,473


Inventories, net

342


264


Prepaid expenses and other current assets

1,410


1,879


Income taxes receivable

69


Total current assets

18,372


21,610


Property and equipment, net of accumulated depreciation of $26,503 and $26,174, respectively

5,437


5,662


Goodwill

2,116


2,116


Other intangible assets, net of accumulated amortization of $6,756 and $6,671, respectively

838


906


Restricted cash

364


507


Right-of-use operating lease assets

1,035


980


Other assets

395


443


Total assets

$

28,557


$

32,224


LIABILITIES AND STOCKHOLDERS' EQUITY


Current liabilities:


Accounts payable

$

1,585


$

2,117


Current portion of long-term borrowings

684


Accrued liabilities:


Operating lease liabilities - current

279


300


Employee compensation

679


519


Income taxes payable

36


Other accrued liabilities

2,104


1,976


Total current liabilities

5,367


4,912


Operating lease liabilities - non-current

738


680


Long-term borrowings, net of current portion

872


Deferred income taxes, net

172


171


Other liabilities

278


286


Total liabilities

7,427


6,049


COMMITMENTS AND CONTINGENCIES (Note 13)


Stockholders’ equity:


Common stock, $.01 par value, 40,000,000 shares authorized, 25,476,420 and 25,053,480 shares issued, and 24,701,159 and 24,592,578 shares outstanding, respectively

255


254


Additional paid-in capital

139,710


139,560


Accumulated deficit

(115,436

)

(110,325

)

Accumulated other comprehensive loss

(1,857

)

(1,778

)

Nil coupon perpetual loan notes

76


76


Treasury stock, at cost

(1,618

)

(1,612

)

Total stockholders’ equity

21,130


26,175


Total liabilities and stockholders’ equity

$

28,557


$

32,224


FUEL TECH, INC.

CONDENSED CONSOLIDATED STATEMENTS OF OPERATIONS

(Unaudited)

(in thousands)


Three Months Ended
June 30,

Six Months Ended
June 30,


2020

2019

2020

2019

Revenues

$

4,401


$

8,948


$

8,179


$

19,103


Costs and expenses:


Cost of sales

3,799


5,050


6,050


11,191


Selling, general and administrative

2,755


4,455


6,641


8,913


Restructuring charge


30


625


Research and development

271


205


595


471


Intangible assets abandonment


51


51


6,825


9,791


13,286


21,251


Operating loss from continuing operations

(2,424

)

(843

)

(5,107

)

(2,148

)

Interest expense

(3

)

(3

)

(6

)

(4

)

Interest income

2


9


13


11


Other income (expense), net

(88

)

(97

)

138


(72

)

Loss from continuing operations before income taxes

(2,513

)

(934

)

(4,962

)

(2,213

)

Income tax expense

(31

)

(2

)

(149

)

(2

)

Net loss from continuing operations

(2,544

)

(936

)

(5,111

)

(2,215

)

Loss from discontinued operations


(9

)


(19

)

Net loss

$

(2,544

)

$

(945

)

$

(5,111

)

$

(2,234

)

Net loss per common share:


Basic


Continuing operations

$

(0.10

)

$

(0.04

)

$

(0.21

)

$

(0.09

)

Discontinued operations

$


$


$


$


Basic net loss per common share

$

(0.10

)

$

(0.04

)

$

(0.21

)

$

(0.09

)

Diluted


Continuing operations

$

(0.10

)

$

(0.04

)

$

(0.21

)

$

(0.09

)

Discontinued operations

$


$


$


$


Diluted net loss per common share

$

(0.10

)

$

(0.04

)

$

(0.21

)

$

(0.09

)

Weighted-average number of common shares outstanding:


Basic

24,668,000


24,187,000


24,633,000


24,182,000


Diluted

24,668,000


24,187,000


24,633,000


24,182,000


FUEL TECH, INC.

CONDENSED CONSOLIDATED STATEMENTS OF COMPREHENSIVE INCOME (LOSS)

(Unaudited)

(in thousands)


Three Months Ended
June 30,

Six Months Ended
June 30,


2020

2019

2020

2019

Net loss

$

(2,544

)

$

(945

)

$

(5,111

)

$

(2,234

)

Other comprehensive income loss:


Foreign currency translation adjustments

152


(43

)

(79

)

61


Comprehensive loss

$

(2,392

)

$

(988

)

$

(5,190

)

$

(2,173

)

FUEL TECH, INC.

CONDENSED CONSOLIDATED STATEMENTS OF CASH FLOWS

(Unaudited)

(in thousands)


Six Months Ended
June 30,


2020

2019

Operating Activities


Net loss

$

(5,111

)

$

(2,234

)

Loss from discontinued operations


19


Net loss from continuing operations

(5,111

)

(2,215

)

Adjustments to reconcile net loss to net cash used in operating activities:


Depreciation

329


478


Amortization

85


68


Loss (gain) on disposal of equipment


2


Provision for doubtful accounts, net of recoveries

(1,082

)


Intangible assets abandonment


51


Stock-based compensation, net of forfeitures

150


219


Changes in operating assets and liabilities:


Accounts receivable

1,863


3,870


Inventories

(78

)

640


Prepaid expenses, other current assets and other non-current assets

424


1,163


Accounts payable

(531

)

(5,595

)

Accrued liabilities and other non-current liabilities

537


(1,485

)

Net cash used in operating activities - continuing operations

(3,414

)

(2,804

)

Net cash used in operating activities - discontinued operations


(19

)

Net cash used in operating activities

(3,414

)

(2,823

)

Investing Activities


Purchases of equipment and patents

(122

)

(359

)

Net cash used in investing activities

(122

)

(359

)

Financing Activities


Proceeds from borrowings

1,556


Taxes paid on behalf of equity award participants

(6

)

(2

)

Net cash used in financing activities

1,550


(2

)

Effect of exchange rate fluctuations on cash

(258

)

44


Net decrease in cash, cash equivalents and restricted cash

(2,244

)

(3,140

)

Cash, cash equivalents, and restricted cash at beginning of period (Note 2)

13,501


18,059


Cash, cash equivalents and restricted cash at end of period (Note 2)

$

11,257


$

14,919


FUEL TECH, INC.

BUSINESS SEGMENT FINANCIAL DATA

(Unaudited)

(in thousands)


Three months ended June 30, 2020

Air Pollution
Control Segment

FUEL CHEM
Segment

Other

Total

Revenues from external customers

$

1,937


$

2,464


$


$

4,401


Cost of sales

(2,320

)

(1,479

)


(3,799

)

Gross margin

(383

)

985


602


Selling, general and administrative


(2,755

)

(2,755

)

Research and development


(271

)

(271

)

Operating (loss) income from continuing operations

$

(383

)

$

985


$

(3,026

)

$

(2,424

)

Three months ended June 30, 2019

Air Pollution
Control Segment

FUEL CHEM
Segment

Other

Total

Revenues from external customers

$

4,803


$

4,145


$


$

8,948


Cost of sales

(2,975

)

(2,075

)


(5,050

)

Gross margin

1,828


2,070


3,898


Selling, general and administrative


(4,455

)

(4,455

)

Restructuring Charge

(30

)


(30

)

Research and development


(205

)

(205

)

Intangible assets abandonment


(51

)

(51

)

Operating income (loss) from continuing operations

$

1,798


$

2,070


$

(4,711

)

$

(843

)

Six months ended June 30, 2020

Air Pollution
Control Segment

FUEL CHEM
Segment

Other

Total

Revenues from external customers

$

3,133


$

5,046


$


$

8,179


Cost of sales

(3,086

)

(2,964

)


(6,050

)

Gross margin

47


2,082


2,129


Selling, general and administrative


(6,641

)

(6,641

)

Research and development


(595

)

(595

)

Operating (loss) income from continuing operations

$

47


$

2,082


$

(7,236

)

$

(5,107

)

Six months ended June 30, 2019

Air Pollution
Control Segment

FUEL CHEM
Segment

Other

Total

Revenues from external customers

$

10,592


$

8,511


$


$

19,103


Cost of sales

(6,864

)

(4,327

)


(11,191

)

Gross margin

3,728


4,184


7,912


Selling, general and administrative


(8,913

)

(8,913

)

Restructuring Charge

(625

)


(625

)

Research and development


(471

)

(471

)

Intangible assets abandonment


(51

)

(51

)

Operating income (loss) from continuing operations

$

3,103


$

4,184


$

(9,435

)

$

(2,148

)

FUEL TECH, INC.

GEOGRAPHIC INFORMATION

(Unaudited)

(in thousands)

Information concerning Fuel Tech’s operations by geographic area is provided below. Revenues are attributed to countries based on the location of the customer. Assets are those directly associated with operations of the geographic area.


Three Months Ended
June 30,

Six Months Ended
June 30,


2020

2019

2020

2019

Revenues:


United States

$

3,310

$

7,562

$

6,407

$

16,377

Foreign


1,091


1,386


1,772


2,726


$

4,401

$

8,948

$

8,179

$

19,103


June 30,
2020

December 31,
2019

Assets:


United States

$

22,090

$

23,460

Foreign


6,467


8,764


$

28,557

$

32,224

FUEL TECH, INC.

RECONCILIATION OF GAAP NET LOSS TO EBITDA AND ADJUSTED EBITDA

(Unaudited)

(in thousands)


Three Months Ended
June 30,

Six Months Ended
June 30,


2020


2019


2020


2019

Net Loss

$

(2,544

)


$

(945

)


$

(5,111

)


$

(2,234

)


Interest (income) expense, net

1


(9

)


(7

)


(10

)

Income tax expense

31


2


149


2


Depreciation expense

166


234


329


478


Amortization expense

42


36


85


68


EBITDA

(2,304

)


(682

)


(4,555

)


(1,696

)


Intangible assets abandonment

-


51


-


51


Stock compensation expense

69


123


150


219


ADJUSTED EBITDA

(2,235

)


(508

)


(4,405

)


(1,426

)


Adjusted EBITDA

To supplement the Company's consolidated financial statements presented in accordance with generally accepted accounting principles in the United States (GAAP), the Company has provided an Adjusted EBITDA disclosure as a measure of financial performance. Adjusted EBITDA is defined as net income (loss) before interest expense, income tax expense (benefit), depreciation expense, amortization expense, stock compensation expense, and intangible assets abandonment and building impairment. The Company's reference to these non-GAAP measures should be considered in addition to results prepared in accordance with GAAP standards, but are not a substitute for, or superior to, GAAP results.

Adjusted EBITDA is provided to enhance investors' overall understanding of the Company's current financial performance and ability to generate cash flow, which we believe is a meaningful measure for our investor and analyst communities. In many cases non-GAAP financial measures are utilized by these individuals to evaluate Company performance and ultimately determine a reasonable valuation for our common stock. A reconciliation of Adjusted EBITDA to the nearest GAAP measure of net income (loss) has been included in the above financial table.


Contacts

Vince Arnone
President and CEO
(630) 845-4500

Devin Sullivan
Senior Vice President
The Equity Group Inc.
(212) 836-9608

DUBLIN--(BUSINESS WIRE)--The "Gas Turbine Market Forecast to 2027 - COVID-19 Impact and Global Analysis by Technology; Capacity; Application; and Geography" report has been added to ResearchAndMarkets.com's offering.


The gas turbine market was valued at US$ 21,015.97 million in 2018 and is projected to reach US$ 29,447.30 million by 2027; it is expected to grow at a CAGR of 3.9% from 2019 to 2027.

Gas Turbine is an internal combustion engine containing combustion chambers, which releases expanding gases that drive the blades of a turbine. The gas turbine converts natural gas and other liquids into mechanical energy. This energy fuels generators to produce electrical energy. There are various advantages associated with gas turbines, such as high power to weight ratio and low operations pressure. Despite being small in size, the gas turbines possess a high power rating. They reduce carbon emissions and release fewer emissions into the air compared to other engines.

Based on application, the gas turbine market is segmented into power generation, oil and gas, and Industrial. The power generation segment accounted for the largest share of the market in 2018. The gas turbines are one of the most widely used technologies deployed in the production of power. A gas turbine is used for converting the liquid fuels or natural gas that is fed to it, into mechanical energy. This mechanical energy further drives the generator to produce electrical energy. The electrical energy is then supplied to homes and businesses via power lines.

The gas turbine heats up a mixture of air and fuel at extremely high temperatures that result in the spinning of turbine blades. These spinning blades in turn drive the generator to produce power. One must not ignore that it is the production of hot gas during fuel combustion and not the fuel itself that spins the turbine blades. The environment friendly properties of gas turbines of using natural gas and producing less gas pollution has favored the power generation segment of gas turbine market worldwide.

Geographically, the gas turbine market is segmented into North America, Europe, Asia Pacific, South America, and the Middle East and Africa. North America held the largest share of the global market in 2018, followed by Europe. The growth of the market in North Americas primarily attributed to rapid growth in the power generation industry in this region. Additionally, the growth of the gas turbine market in this region is primarily attributed to increasing environmental regulations enforced by the government to reduce the rate of carbon footprint along with low shale prices.

A rapid rise in energy demand, especially from manufacturing plants and other related industrial establishments, is further expected to fuel the market growth. Besides this, swift developments in the power generation sector in leading countries such as the US and Canada boosts the demand for gas turbines in the North America region. Low costs related to power generation and technological advancements are also expected to boost the growth of the gas turbine market in the North American region.

Reasons to Buy:

  • Highlights key business priorities to assist companies realign their business strategies.
  • Featureskey findings and crucial progressive industry trends in the global gas turbine market, thereby allowing players to develop effective long-term strategies.
  • Develops/modifies business expansion plans by using substantial growth offering from developed and emerging markets.
  • Scrutinizes in-depth market trends as well askey market drivers and restraints.
  • Enhances the decision-making process by understanding the strategies that underpin commercial interest with respect to products, segmentation, and industry verticals.

Market Dynamics

Drivers

  • Replacement of coal and nuclear driven turbines by gas turbines
  • An upsurge in the demand for electricity

Restraints

  • The interdependencies between gas and electricity sectors

Opportunities

  • Increase in the trend for distributed power generation

Future Trends

  • Changing trends in electricity consumption and growth in aviation industry to Favour gas turbine market

Companies Mentioned

  • AnsaldoEnergiaS.p.A.
  • General Electric Company
  • Harbin Electric Company Limited
  • Kawasaki Heavy Industries, Ltd
  • Man Energy Solutions
  • Mitsubishi Hitachi Power Systems, Ltd.
  • Siemens AG'
  • Solar Turbines Incorporated
  • Wrtsil Corporation
  • Bharat Heavy Electricals Limited (BHEL)

For more information about this report visit https://www.researchandmarkets.com/r/xja8aq


Contacts

ResearchAndMarkets.com
Laura Wood, Senior Press Manager
This email address is being protected from spambots. You need JavaScript enabled to view it.
For E.S.T Office Hours Call 1-917-300-0470
For U.S./CAN Toll Free Call 1-800-526-8630
For GMT Office Hours Call +353-1-416-8900

HOUSTON--(BUSINESS WIRE)--GEOSPACE Technologies (NASDAQ: GEOS) (“Geospace” or the “Company”) today announced several immediate and upcoming changes to its Board of Directors and the implementation of certain governance measures.


Mr. Michael J. Sheen, Senior Vice-President and Chief Technical Officer and executive director will retire from the Board of Directors of the Company effective at the upcoming annual meeting to be held in February 2021. Mr. Sheen informed the Board that he was electing to not stand for re-election at the upcoming Annual Meeting. Mr. Sheen cited his desire to dedicate more time to the development and application of the Company’s existing and new technologies being utilized in oil and gas exploration and development, and the border security sector. The Board extends its gratitude to Mr. Sheen for his board work and the achievements the Board has overseen during his tenure as a director. We look forward to his continued success with the Company.

Mr. William H. Moody (Hank) has elected to retire from the board of directors effective at the end of the Company’s current fiscal year, September 30, 2020. Mr. Moody joined the board in July 2004. He was head of the Audit Committee up until May 2020. During his tenure, Geospace has grown its operations and now provides services globally. These changes required significant oversight by Hank and the Audit Committee as new accounting rules and standards had to be adopted and properly applied. Prior to joining the Geospace Board, Hank was with KPMG and served in several notable capacities including managing partner, audit partner-in-charge, and Securities and Exchange Commission reviewing partner. “Geospace has been very fortunate to have Hank serve on our board for the last 16 years,” stated Gary Owens, Geospace’s Chairman. “He has been a highly effective director, and we will miss his strong leadership and wise counsel. We extend our gratitude and best wishes to Hank and his wife, Jane, in his retirement.”

As previously announced, Mr. Charles H. Still (Hank) elected to retire from the board of directors on June 30, 2020. Mr. Still joined the Board in November 1997 with the Company’s initial public offering. Hank’s service to the Company began in 1980 as the Secretary of various affiliates and predecessors of the Company, and from September 1994 to February 2009 he served as the Secretary of the Company serving in a non-executive capacity. In February 2015 he was appointed Lead Independent Director on the Geospace board. Mr. Still was a partner in Fulbright & Jaworski LLP from 1975 until his retirement in January 2008, at which time he became a partner in Kelly Hart & Hallman LLP until he retired in December 2010. He returned to Fulbright & Jaworski LLP as Of Counsel until his retirement in January 2014. Hank also served on the board of Martin Midstream GP LLC from August 2010 to October 2014. Gary Owens commented, “Hank served Geospace and its predecessors for 40 years. He was a key player in the development and success of Geospace. His extensive legal and financial expertise combined with his in-depth knowledge of the SEC, our business and corporate governance made him a significant resource as a director on the Board. All of us will miss Hank’s counsel and insight. We wish him all the best in his retirement.”

With these changes, the Board will be downsizing and will eliminate the director seats held by Mr. Still and Mr. Moody. Mr. Thomas L. Davis, Ph.D., will replace Mr. Still as the Lead Independent Director.

As a result of the Board’s annual governance review, and based on recommendations from the Nominating and Corporate Governance Committee, the Board has approved two additional governance measures at this time. The Board has instituted a tenure limit of 15 years for all new non-employee directors to hold a seat on the board. In addition, the Board will adopt equity ownership guidelines that will require each of the Company’s directors to maintain a specified minimum equity investment in the Company. The details and level of the ownership requirements will be approved by the Board before fiscal year end 2020.


Contacts

Rick Wheeler
President & CEO
TEL: 713.986.4444
FAX: 713.986.4445

  • Petroleum Independent and Exploration Corporation to jointly develop the Ft. Trinidad Field with Empire Texas LLC
  • Contract Operator, PIE, has identified the first of many workover/recompletion programs to potentially uplift field production
  • Technical Services Agreement integrates geology, geoscience, land, engineering, production, and well supervision
  • Securities Purchase Agreement for PIE to have the opportunity to own up to 40% of Empire equity and two board seats


TULSA, Okla.--(BUSINESS WIRE)--Empire Petroleum Corporation (“Empire”) (OTCQB:EMPR) announced today that it has completed an equity transaction and a field level debt issuance, fully funding a substantial workover/recompletion program at its recently-acquired properties in East Texas, specifically, the Fort Trinidad Field in Houston and Madison Counties. As a result of the investment, Empire Texas LLC has entered into a joint development agreement with The Woodlands, Texas-based Petroleum Independent & Exploration LLC and PIE Operating LLC and their affiliates (collectively, “PIE”) and Mineral Resource Texas, LLC (“MRP”) to execute of series of workovers designed to potentially increase the field’s production from existing wellbores.

The Securities Purchase Agreement outlines a PIE total investment of approximately $3,375,000 for an equity stake of up to 40% of Empire. In addition, PIE will provide up to a $2,000,000 loan (may be amended to $3,000,000) to Empire Texas LLC for workover development within our current East Texas assets.

The properties contain approximately 91% working interest and 83% net revenue interest and have been recently producing from multiple pays of the Glen Rose, Edwards and Buda formations. PIE, led by Phil Mulacek, will contract operate the field and identified workover wells in the program, bringing their experienced carbonate geology, and geophysical, and drilling team that has been responsible for world class discoveries, such as the Elk and Antelope Fields in Papua New Guinea, subsequently bought by Exxon Mobil and Total in 2017.

“As a significant investor in Empire, combined with the operational expertise and capital to implement an initial robust workover program, we believe PIE is a terrific partner aligning with all shareholders,” stated Mike Morrisett, President. “It has been a pleasure working with Phil Mulacek and his team bringing our Joint Development Agreement quickly to fruition.”

“We’re pleased to have the opportunity to work with Phil and his highly experienced technical team at PIE,” stated Tommy Pritchard, CEO. “The enthusiasm shown while working on planning brought forward other potential acquisitions in close proximity to our strong position in the Fort Trinidad Field that we are currently evaluating.”

About Empire Petroleum Corporation (EMPR)
Empire Petroleum Corporation is a publicly-traded, Tulsa-based oil and gas company with current producing assets in Texas, Louisiana, North Dakota and Montana. Management is focused on targeted acquisitions of proved developed assets with synergies with its existing portfolio of wells. Empire looks for assets where its operational team can deploy rigorous field/well management techniques to reduce unit operating costs and improve margins while optimizing production. For more information, please visit: www.empirepetrocorp.com

About Petroleum Independent & Exploration LLC
Petroleum Independent & Exploration LLC (PIE LLC), is a private Oil and Gas company that began in 1981, with Mr. Phil Mulacek as founder. PIE LLC and MRP LLC have operations across the southern USA. Mr. Mulacek and PIE LLC founded InterOil Corporation in 1994/1995 with the acquisition of a former Chevron refinery. Mr. Mulacek developed InterOil from a US$10 million market cap (~0.50/share) to an integrated Oil & Gas company with a market cap over US$5 billion ($109/share NYSE). The business included a refinery, a downstream business (retail gas stations and distribution), and the world class upstream assets of the Elk, Antelope, and Triceratops structures; certified at over 10 tcfe / ~ 1.5 Billion BOE. The Antelope limestone reef structure is ranked as one of the highest quality gas discoveries in the world, and Antelope #2 well was the highest capacity gas well in the world with a total flow of 755 million scfgepd. Mr. Mulacek is a Petroleum Engineer with over 40 years' experience.

About Mineral Resources Partners, LLC
Mineral Resources Partners, LLC is a privately-owned oil and gas exploration and production company that owns over 550,000 net mineral acres in Texas, Louisiana, Alabama and Georgia. The company acquires, develops and operates unconventional and conventional oil and gas fields, with its core areas being in the Permian Basin (Spraberry Trend/WolfCamp), East Texas (Haynesville, Petit, Woodbine, Cotton Valley and James Lime) and Louisiana (Austin Chalk, Frio, Cockfield and Wilcox). MRP was financed in 2016 by Phil Mulacek, of PIE LLC. For more information, please visit: www.mineralresourcespartners.com

FORWARD-LOOKING STATEMENTS
This press release includes certain statements that may be deemed “forward-looking statements” within the meaning of the federal securities laws. All statements, other than statements of historical facts that address activities, events or developments that Empire expects, believes or anticipates will or may occur in the future are forward-looking statements. Such statements are subject to a number of assumptions, risks and uncertainties. Actual results may vary materially from the forward-looking statements. For a list of certain material risks relating to Empire, see Empire’s Form 10-K for the fiscal year ended December 31, 2019.


Contacts

Tommy Pritchard, CEO
Mike Morrisett, President
539-444-8002

Industry Favors the J-Series for Its World-Class Reliability and Efficiency

LAKE MARY, Fla.--(BUSINESS WIRE)--#MHPS--Mitsubishi Hitachi Power Systems, Ltd. (MHPS) continues to lead the power generation industry in global market share year-to-date for heavy duty gas turbines (100 megawatts [MW] and above) according to data from McCoy Power Reports, the industry’s premier reporting agency. Orders for 3,479 MW represent 32 percent global market share in the first half of 2020. Closely watched by industry experts, the heavy duty segment represents the most advanced technology and drives energy production globally.


MHPS also achieved 52 percent global market share for advanced class gas turbines (G-, H- and J-Class), which is a subset of the heavy duty segment. MHPS’ J-Series gas turbines continue to lead the market with their unrivaled combination of efficiency greater than 64 percent and world-class reliability of 99.5 percent. The installed J-Class fleet has surpassed one million hours of commercial operation worldwide, which is nearly double that of competitors’ similar sized gas turbines. As an added benefit, all gas turbines MHPS sells globally will be capable of operating with green hydrogen created using stored renewable energy.

Paul Browning, President and CEO of MHPS Americas, said, “The global gas turbine market strongly prefers MHPS’ JAC gas turbines, which are the industry’s most reliable gas turbines with record-setting fuel efficiency and output. Market preference for our heavy duty gas turbines recognizes our commitment to providing high quality solutions that contribute to the stable supply of flexible power, which combined with renewable power provides an essential path forward to combat climate change and advance human prosperity. Together with our customers, we are achieving a Change in Power.”


About Mitsubishi Hitachi Power Systems Americas, Inc.


Mitsubishi Hitachi Power Systems Americas, Inc. (MHPS Americas) headquartered in Lake Mary, Florida, employs more than 2,000 power generation, energy storage, and digital solutions experts and professionals. Our employees are focused on empowering customers to affordably and reliably combat climate change while also advancing human prosperity throughout North and South America. MHPS Americas’ power generation solutions include natural gas, steam, aero-derivative, geothermal, distributed renewable technologies, environmental controls, and services. Energy storage solutions include green hydrogen and battery energy storage systems. MHPS also offers digital solutions that enable autonomous operations and maintenance of power assets. MHPS Americas is a subsidiary of Mitsubishi Hitachi Power Systems (MHPS), a joint venture between Mitsubishi Heavy Industries, Ltd. and Hitachi, Ltd. integrating their operations in power generation systems. MHPS recently announced that its name will change to Mitsubishi Power on September 1, 2020.


Learn more about MHPS by visiting www.changeinpower.com and https://www.linkedin.com/company/mitsubishi-hitachi-power-systems-americas-inc-/.


Contacts

Sharon Prater
+1 407-688-6200
This email address is being protected from spambots. You need JavaScript enabled to view it.

Electronic Assemblies for Naval Application

TAMPA, Fla.--(BUSINESS WIRE)--$SYPR--Sypris Electronics, LLC, a subsidiary of Sypris Solutions, Inc. (Nasdaq/GM: SYPR), announced today that it has received an initial contract award from the Leonardo DRS Naval Electronics business unit to manufacture and test electronic assemblies for a shipboard system. Production will begin in 2020. Terms of the agreement were not disclosed.


“Sypris Electronics has extensive experience working on mission critical Navy programs,” said Jim Long, Vice President & General Manager of Sypris Electronics. “Leonardo DRS is an industry leader in Naval Electronics and the opportunity to support them on this program is an honor for Sypris Electronics. Our collaborative approach in providing a tailored manufacturing and test solution was an important element to this win. We are excited to support Leonardo DRS on this program and to expand our relationship with Leonardo DRS.”

Sypris Electronics is a trusted provider of electronic solutions, addressing customers’ needs for building complex, mission-critical electronic and electro-mechanical devices and integrated systems. Backed by 50 years of experience, Sypris’ engineering and manufacturing services span our customers’ product life cycle all within a culture of continuous improvement and Six Sigma/Lean thinking. Partners from multiple agencies and tier one companies in Military (DoD), Space, Medical, Undersea, and Industrial markets team with Sypris to deliver high-reliability electronics built with strict adherence to regulated requirements. For more information, please visit www.sypriselectronics.com.

Forward-Looking Statements

This press release contains “forward-looking” statements within the meaning of the federal securities laws. Forward-looking statements include our plans and expectations of future financial and operational performance. Such statements may relate to projections of the Company’s revenue, earnings, and other financial and operational measures, our liquidity, our ability to mitigate or manage disruptions posed by COVID-19, and the impact of COVID-19 and economic conditions on our future operations, among other matters. COVID-19 continues to spread throughout the United States and other countries across the world, and the duration and severity of its effects are currently unknown. The COVID-19 pandemic has resulted, and is likely to continue to result, in significant economic disruption and has and will likely adversely affect our business. The Company has continued to operate at each location and sought to remain compliant with government regulations imposed due to the COVID-19 pandemic.

Each forward-looking statement herein is subject to risks and uncertainties, as detailed in our most recent Form 10-K and Form 10-Q and other SEC filings. Briefly, we currently believe that such risks also include the following: the impact of COVID-19 and economic conditions on our future operations; possible public policy response to the pandemic, including legislation or restrictions that may impact our operations or supply chain; our failure to successfully complete final contract negotiations with regard to our announced contract “orders”, “wins” or “awards”; the cost, quality, timeliness, efficiency and yield of our operations and capital investments, including the impact of employee training, working capital, production schedules, cycle times, scrap rates, wages, overtime costs, freight or expediting costs; disputes or litigation involving governmental, supplier, customer or employee claims; our inability to develop new or improved products or new markets for our products; cost, quality and availability of raw materials and electronic component parts; our reliance on third party vendors and sub-suppliers; continued shortages and extensive lead-times for electronic components; failure to adequately insure or to identify environmental or other insurable risks; volatility of our customers’ forecasts, scheduling demands and production levels which negatively impact our operational capacity and our effectiveness to integrate new customers or suppliers, and in turn cause increases in our inventory and working capital levels; adverse impacts of new technologies or other competitive pressures which increase our costs or erode our margins; U.S. government spending on our products and services, including the timing of budgetary decisions; changes in licenses, security clearances, or other legal rights to operate, manage our work force; cyber security threats and disruptions; inaccurate data about markets, customers or business conditions; or unknown risks and uncertainties. We undertake no obligation to update our forward-looking statements, except as may be required by law.


Contacts

Lawrence J. Bernicky
Vice President of Finance
(813) 972-6040

Offshore Source Logo

Offshore Source keeps you updated with relevant information concerning the Offshore Energy Sector.

Any views or opinions represented on this website belong solely to the author and do not represent those of the people, institutions or organizations that Offshore Source or collaborators may or may not have been associated with in a professional or personal capacity, unless explicitly stated.

Corporate Offices

Technology Systems Corporation
8502 SW Kansas Ave
Stuart, FL 34997

info@tscpublishing.com