Business Wire News

LONDON--(BUSINESS WIRE)--#GlobalOilandGasStorageServiceMarket--Scope of the report


This report provides a detailed analysis of the oil and gas storage service market by service (storage services, ancillary services, and other services) and geography (North America, APAC, Europe, MEA, and South America). Also, the report analyzes the market’s competitive landscape and offers information on several market vendors, including Buckeye Partners LP, CLH, Kinder Morgan Inc., Magellan Midstream Partners LP, Marquard & Bahls AG, NuStar Energy LP, PetroChina Co. Ltd., Koninklijke Vopak NV, SGS SA, and Vitol Netherlands Cooperatief UA. The rising use of natural gas in power generation is a key trend in the global oil and gas storage service market which will lead to significant market growth. Natural gas is increasingly becoming popular across the world as a substitute for fossil fuels in power generation. This is because natural gas emits less carbon dioxide compared to other fossil fuels such as coal. The increased use of natural gas in power generation is creating the need for effective natural gas storage services. All these factors are leading to a positive outlook for the oil and gas storage service market.

To learn more about the global trends impacting the future of market research, download a free sample now

Oil and Gas Storage Service Market: Segmentation by Geography

The market is segmented into five regions encompassing North America, APAC, Europe, MEA, and South America. North America was the largest market for oil and gas storage service in 2019, and the region is expected to offer several growth opportunities to market vendors during the forecast period. About 34% of the market’s growth will originate from North America during the forecast period. The growth in the export of crude oil and refined products from the US has been attracting significant investments in storage terminals. Also, the rise in drilling activities in the US is contributing to the growth of the oil and gas storage service market in North America. The US is the key market for oil and gas storage services in North America.

Oil and Gas Storage Service Market: Segmentation by Service

The oil and gas storage service market is segmented into three segments based on the service comprising of storage services, ancillary services, and other services. The storage services segment emerged as the leading segment during 2019. Storage services act as a buffer between the buyers, sellers, and consumers in the supply chain. This is driving the need for storing oil and gas products. These factors are creating significant growth potential in the segment.

Technavio’s in-depth research has all your needs covered as our research reports include all foreseeable market scenarios, including pre- & post-COVID-19 analysis. Download a Free Sample Report on COVID-19 Impacts

Oil and Gas Storage Service Market: Growth Drivers

Increase in global oil and gas demand will drive market growth. The rising consumption of fuel in the transportation sector, especially in emerging markets such as China, India, and Indonesia has created a strong demand for petroleum products. This is compelling oil producers in the OPEC countries and the US to increase their production and drilling activities. Such activities have resulted in a rise in the production of oil and gas, which is driving investments in oil and gas storage services. Thus, the rising global oil and gas demand will fuel the growth of the global oil and gas storage service market during the forecast period.

Oil and Gas Storage Service Market: Market Overview

The oil and gas storage service market is fragmented with the presence of several domestic and international players. Hence, companies need to adopt advanced technologies and marketing strategies to remain competitive in the market. Buckeye Partners LP, CLH, and Kinder Morgan Inc. are some of the major market participants. Though the accelerating growth momentum will offer immense growth opportunities, volatility in oil and gas prices will challenge the growth of the market participants. To make the most of the opportunities, market vendors should focus more on the growth prospects in the fast-growing segments, while maintaining their position in the slow-growing segments.

Market Sizing Methodology

Technavio uses a robust market sizing approach to estimate the total opportunity size for any market. Some of the examples of methodologies are shown for reference data is collected through both primary research (through industry interview with market participants and industry experts) as well as secondary research (through annual reports, press releases, company and industry presentations, industry associations, journals and in-house data repositories built over past 15 years)

Oil and gas storage service Market: Parent Market Overview

Technavio categorizes the global oil and gas storage service market as a part of the global oil and gas storage and transportation market within the global oil and gas market. The global oil and gas storage and transportation market covers companies engaged in the transportation and/or storage of gas, oil, and/or refined products.

Growth in the global oil and gas storage and transportation market will be driven by factors such as the increase in global energy demand, limited fossil fuel reserves, volatility in fuel prices, and environmental degradation.

Buy 1 Technavio report and get the second for 50% off. Buy 2 Technavio reports and get the third for free.

View market snapshot before purchasing

Technavio Best Practices

Technavio is based on four simple principles: easy-to-access reports, robust industry coverage, a focus on new and emerging technologies, and competitive pricing. We believe in helping companies and executives become better equipped to make faster, sounder, and more effective decisions. Our focus is on emerging markets and technologies, providing insights not available anywhere else. We report on the latest innovations and trends in all the industries we cover. We also create value for our clients by offering a blend of off-the-shelf research reports and customized research, allowing you to get the information you need when you need it.

Who should purchase this report?

Our research and analysis focus on emerging market trends to help businesses identify market opportunities and develop effective strategies to optimize their market positions. Our research reports are designed to provide actionable insights so that you can make quick, effective, and sound decisions.

Are you looking for data that’s tailored specifically for your company? You can rely on Technavio Custom Research Solutions which provide research and insights developed to your exact specifications. We provide flexible engagement models such as on-demand research, a dedicated analyst, an annual research framework, an unlimited program, and more.

About Technavio

Technavio is a leading global technology research and advisory company. Their research and analysis focus on emerging market trends and provides actionable insights to help businesses identify market opportunities and develop effective strategies to optimize their market positions.

With over 500 specialized analysts, Technavio’s report library consists of more than 17,000 reports and counting, covering 800 technologies, spanning across 50 countries. Their client base consists of enterprises of all sizes, including more than 100 Fortune 500 companies. This growing client base relies on Technavio’s comprehensive coverage, extensive research, and actionable market insights to identify opportunities in existing and potential markets and assess their competitive positions within changing market scenarios.


Contacts

Technavio Research
Jesse Maida
Media & Marketing Executive
US: +1 844 364 1100
UK: +44 203 893 3200
Email: This email address is being protected from spambots. You need JavaScript enabled to view it.
Website: https://www.technavio.com

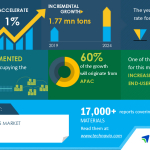
LONDON--(BUSINESS WIRE)--#GlobalLubricantsMarket--The global lubricants market size is expected to grow by 1.77 million tons during 2020-2024, progressing at a CAGR of almost 1% during the forecast period. Download latest version with COVID-19 analysis Free Sample Report


Increasing demand from end-user industries is one of the major factors propelling the market growth. However, factors such as fluctuations in crude oil prices, the environmental impact of lubricants, the high price of synthetic lubricants might challenge the growth of the market.

Lubricants are widely used in various industries such as the automotive, construction, steel and cement, wind energy, agriculture, mining and oil drilling, marine, and aerospace industries. This is due to their characteristics such as anti-wear characteristics, resistance to corrosion, excellent lubricity, water tolerance, and filterability. In the construction industry, hydraulic fluids made of lubricants are used in earthmoving equipment such as crawler excavators, mini excavators, wheeled excavators, wheeled dozers, and skid-steer loaders. Similarly, in the steel and cement industry, lubricants are used to increase the re-greasing intervals of the equipment, improve wear resistance of friction pairs, and enhance the lifespan of the equipment. Many such applications across various industries are increasing the consumption of lubricants, which is driving the growth of the market.

More details: www.technavio.com/report/lubricants-market-industry-analysis

Global Lubricants Market: Product Landscape

Mineral oil-based lubricants were the most consumed type of lubricants in 2019. Their high demand and consumption can be attributed to the low cost and easy availability compared to synthetic and bio-based lubricants. They also offer excellent solubility with additives, enhanced compatibility with seals, high viscosity, and high flash point. These factors are driving the growth of the segment.

Global Lubricants Market: Geographic Landscape

APAC was the largest market for lubricants in 2019 and the region will continue to offer significant growth opportunities for vendors during the forecast period. The growth of end-user industries such as the automotive, construction, and refining in China, India, Japan, and South America is increasing the demand for lubricants. In addition, rising investments in heavy engineering, steel manufacturing, mining and refining, and plastics and polymer industries will continue to drive the growth of the lubricants market in APAC during the forecast period.

Buy 1 Technavio report and get the second for 50% off. Buy 2 Technavio reports and get the third for free.

View market snapshot before purchasing

Companies Covered

  • BP Plc
  • Chevron Corp.
  • Exxon Mobil Corp.
  • FUCHS PETROLUB SE
  • Idemitsu Kosan Co. Ltd.
  • PetroChina Co. Ltd.
  • Petroliam Nasional Berhad
  • Royal Dutch Shell Plc
  • Total SA
  • Valvoline Inc.


What our reports offer:

  • Market share assessments for the regional and country-level segments
  • Strategic recommendations for the new entrants
  • Covers market data for 2019, 2020, till 2024
  • Market trends (drivers, opportunities, threats, challenges, investment opportunities, and recommendations)
  • Strategic recommendations in key business segments based on the market estimations
  • Competitive landscaping mapping the key common trends
  • Company profiling with detailed strategies, financials, and recent developments
  • Supply chain trends mapping the latest technological advancements

Technavio suggests three forecast scenarios (optimistic, probable, and pessimistic) considering the impact of COVID-19. Technavio’s in-depth research has direct and indirect COVID-19 impacted market research reports. Register for a free trial today and gain instant access to 17,000+ market research reports.
Technavio's SUBSCRIPTION platform

Lubricants Market 2020-2024: Key Highlights

  • CAGR of the market during the forecast period 2020-2024
  • Detailed information on factors that will assist in lubricants market growth during the next five years
  • Estimation of the lubricants market size and its contribution to the parent market
  • Predictions on upcoming trends and changes in consumer behavior
  • The growth of the lubricants market
  • Analysis of the market’s competitive landscape and detailed information on vendors
  • Comprehensive details of factors that will challenge the growth of lubricants market vendors

Table of Contents:

Executive Summary

Market Landscape

  • Market ecosystem
  • Value chain analysis

Market Sizing

  • Market definition
  • Market segment analysis
  • Market size 2019
  • Market outlook: Forecast for 2019 - 2024

Five Forces Analysis

  • Five forces summary
  • Bargaining power of buyers
  • Bargaining power of suppliers
  • Threat of new entrants
  • Threat of substitutes
  • Threat of rivalry
  • Market condition

Market Segmentation by Product

  • Market segments
  • Comparison by Product
  • Mineral-oil based lubricants - Market size and forecast 2019-2024
  • Synthetic lubricants - Market size and forecast 2019-2024
  • Bio-based lubricants - Market size and forecast 2019-2024
  • Market opportunity by Product

Market Segmentation by Application

  • Market segments
  • Comparison by Application
  • Automotive oils - Market size and forecast 2019-2024
  • Industrial oils - Market size and forecast 2019-2024
  • Process oils - Market size and forecast 2019-2024
  • Metalworking fluids - Market size and forecast 2019-2024
  • Greases - Market size and forecast 2019-2024
  • Market opportunity by Application

Customer Landscape

Geographic Landscape

  • Geographic segmentation
  • Geographic comparison
  • APAC - Market size and forecast 2019-2024
  • Europe - Market size and forecast 2019-2024
  • North America - Market size and forecast 2019-2024
  • MEA - Market size and forecast 2019-2024
  • South America - Market size and forecast 2019-2024
  • Key leading countries
  • Market opportunity by geography
  • Market drivers
  • Market challenges
  • Market trends

Vendor Landscape

  • Overview
  • Vendor landscape
  • Landscape disruption

Vendor Analysis

  • Vendors covered
  • Market positioning of vendors
  • BP Plc
  • Chevron Corp.
  • Exxon Mobil Corp.
  • FUCHS PETROLUB SE
  • Idemitsu Kosan Co. Ltd.
  • PetroChina Co. Ltd.
  • Petroliam Nasional Berhad
  • Royal Dutch Shell Plc
  • Total SA
  • Valvoline Inc.

Appendix

  • Scope of the report
  • Currency conversion rates for US$
  • Research methodology
  • List of abbreviations

About Us

Technavio is a leading global technology research and advisory company. Their research and analysis focuses on emerging market trends and provides actionable insights to help businesses identify market opportunities and develop effective strategies to optimize their market positions. With over 500 specialized analysts, Technavio’s report library consists of more than 17,000 reports and counting, covering 800 technologies, spanning across 50 countries. Their client base consists of enterprises of all sizes, including more than 100 Fortune 500 companies. This growing client base relies on Technavio’s comprehensive coverage, extensive research, and actionable market insights to identify opportunities in existing and potential markets and assess their competitive positions within changing market scenarios.


Contacts

Technavio Research
Jesse Maida
Media & Marketing Executive
US: +1 844 364 1100
UK: +44 203 893 3200
Email: This email address is being protected from spambots. You need JavaScript enabled to view it.
Website: www.technavio.com/

SAN RAMON, Calif.--(BUSINESS WIRE)--The Board of Directors of Chevron Corporation (NYSE: CVX) declared a quarterly dividend of one dollar and twenty-nine cents ($1.29) per share, payable December 10, 2020, to all holders of common stock as shown on the transfer records of the Corporation at the close of business November 18, 2020.


Contacts

Sean Comey -- +1 925-842-5509

TOKYO--(BUSINESS WIRE)--Mitsubishi Electric Corporation (TOKYO:6503) announced today its consolidated financial results for the first half and second quarter, ended September 30, 2020, of the current fiscal year ending March 31, 2021 (fiscal 2021).


The full document on Mitsubishi Electric’s financial results can be viewed at the following link:
www.MitsubishiElectric.com/news

1. Consolidated Half-year Results (April 1, 2020 – September 30, 2020)

Revenue:

1,902.0

billion yen

(13% decrease from the same period last year)

Operating profit:

61.3

billion yen

(46% decrease from the same period last year)

Profit before income taxes:

75.6

billion yen

(39% decrease from the same period last year)

Net profit attributable to
Mitsubishi Electric Corp. stockholders:

48.2

billion yen

(47% decrease from the same period last year)

The economy in the first half of fiscal 2021, from April through September 2020, generally saw a severe business environment without an economic recovery in Japan, the U.S. and Europe due to the continuing impact of the novel coronavirus diseases (COVID-19), although it is under way owing to the restart of the economy. Meanwhile, China experienced a gradual recovery mainly owing to an increase in capital expenditures for fixed assets, particularly in public investment, as an effect of political measures.

Revenue

Revenue in the first half decreased by 280.5 billion yen from the same period of the previous fiscal year to 1,902.0 billion yen as a result of decreased revenue in all segments. Energy and Electric Systems segment saw a decrease in the building systems business in Japan and Asia due to the impact of COVID-19 causing global stagnation of urban development and construction, while the social infrastructure systems business increased particularly in the transportations systems and the power systems businesses in Japan. Industrial Automation Systems segment saw a significant decrease of the automotive equipment business due to decreased demand for new cars in all regions except for China. The factory automation systems business also decreased due to stagnation in automotive-related demand worldwide and machinery- and building-related demand in Japan. Home Appliances segment saw a decrease in air conditioners due to limited economic activities outside Japan and restrained capital expenditures worldwide.

Operating Profit

Operating profit decreased by 52.8 billion yen from the same period of the previous fiscal year to 61.3 billion yen due mainly to decreased profits in Industrial Automation Systems and Home Appliances segments, while profits increased in Energy and Electric Systems, Electronic Devices and Information and Communication Systems segments. Operating profit ratio decreased by 2.0% from the same period of the previous fiscal year to 3.2%.

The cost ratio increased by 1.2% from the same period of the previous fiscal year due primarily to lowered operation caused by decreased revenue of Industrial Automation Systems and Home Appliances segments. Selling, general and administrative expenses decreased by 50.3 billion yen from the same period of the previous fiscal year due mainly to reduced cost, but selling, general and administrative expenses to revenue ratio increased by 0.8%. Other profit (loss) decreased by 0.2 billion yen from the same period of the previous fiscal year, while other profit (loss) to revenue ratio remained substantially unchanged from the same period of the previous fiscal year.

Profit before income taxes

Profit before income taxes decreased by 48.3 billion yen from the same period of the previous fiscal year to 75.6 billion yen due primarily to a decrease in operating profit despite an improvement in non-operating expenses owing to decreased loss on foreign exchange. Profit before income taxes to revenue ratio was 4.0%.

Net profit attributable to Mitsubishi Electric Corporation stockholders

Net profit attributable to Mitsubishi Electric Corporation stockholders decreased by 43.0 billion yen from the same period of the previous fiscal year to 48.2 billion yen due mainly to decreased profit before income taxes. Net profit attributable to Mitsubishi Electric Corporation stockholders to revenue ratio was 2.5%.

2. Consolidated Second-quarter Results (July 1, 2020 – September 30, 2020)

Revenue:

1,043.8

billion yen

(8% decrease from the same period last year)

Operating profit:

41.1

billion yen

(31% decrease from the same period last year)

Profit before income taxes:

48.5

billion yen

(24% decrease from the same period last year)

Net profit attributable to
Mitsubishi Electric Corp. stockholders:

30.3

billion yen

(37% decrease from the same period last year)

Revenue

Revenue in the second quarter decreased by 87.8 billion yen from the same period of the previous fiscal year to 1,043.8 billion yen as a result of decreased revenue in all segments. Energy and Electric Systems segment saw a decrease in the building systems business in Japan and Asia due to the continuing impact of COVID-19, while the social infrastructure systems business increased particularly in the transportations systems, the power systems and the public utility systems businesses in Japan. Industrial Automation Systems segment saw a decrease of the automotive equipment business due to decreased demand for new cars, although the number increased compared to the first quarter. The factory automation systems business also decreased due to continuing stagnation in automotive-related demand worldwide and machinery- and building-related demand in Japan. Home Appliances segment saw a decrease in air conditioners as demand for industrial air conditioners continued to decrease due to limited economic activities outside Japan and restrained capital expenditures worldwide, while demand for residential air conditioners increased compared to the first quarter.

Operating Profit

Operating profit decreased by 18.1 billion yen from the same period of the previous fiscal year to 41.1 billion yen due mainly to decreased profit in Industrial Automation Systems and Energy and Electric Systems segments, while profit increased in Electronic Devices and Information and Communication Systems segments. Operating profit ratio decreased by 1.3% from the same period of the previous fiscal year to 3.9%.

The cost ratio increased by 1.4% from the same period of the previous fiscal year due primarily to lowered operation caused by decreased revenue of Industrial Automation Systems segment. Selling, general and administrative expenses decreased by 22.6 billion yen from the same period of the previous fiscal year due mainly to reduced cost, and selling, general and administrative expenses to revenue ratio improved by 0.3%. Other profit (loss) deteriorated by 1.0 billion yen from the same period of the previous fiscal year, while other profit (loss) to revenue ratio deteriorated by 0.2%.

Profit before income taxes

Profit before income taxes decreased by 15.7 billion yen from the same period of the previous fiscal year to 48.5 billion yen due primarily to a decrease in operating profit despite an improvement in non-operating expenses owing to decreased loss on foreign exchange. Profit before income taxes to revenue ratio was 4.7%.

Net profit attributable to Mitsubishi Electric Corporation stockholders

Net profit attributable to Mitsubishi Electric Corporation stockholders decreased by 18.1 billion yen from the same period of the previous fiscal year to 30.3 billion yen due mainly to decreased profit before income taxes. Net profit attributable to Mitsubishi Electric Corporation stockholders to revenue ratio was 2.9%.

Forecast for Fiscal 2021(year ending March 31, 2021)

Revenue for fiscal 2021 is expected to fall below the company’s previous forecast, due to the delay in an economic recovery caused by the continuing impact of COVID-19, while the profits are expected to exceed the company’s previous forecast due to the accumulation of positive impact of various business improvement measures, particularly cost reduction. As a result, the company’s consolidated earnings forecast for fiscal 2021 has been revised from the announcement on July 30, 2020 as stated below.

The forecast may be modified depending on the global and local situation of the continuing impact and the re-expansion of COVID-19.

Consolidated forecast for fiscal 2021

Consolidated

Previous forecast
(announced July 30)

Current forecast

Change from previous forecast

Revenue:

4,100.0 billion yen

4,050.0 billion yen

(9% decrease from fiscal 2020)

Down 50.0 billion yen, or 1%

Operating profit:

120.0 billion yen

150.0 billion yen

(42% decrease from fiscal 2020)

Up 30.0 billion yen, or 25%

Profit before income taxes:

145.0 billion yen

175.0 billion yen

(38% decrease from fiscal 2020)

Up 30.0 billion yen, or 21%

Net profit attributable to
Mitsubishi Electric Corp. stockholders:

100.0 billion yen

120.0 billion yen

(46% decrease from fiscal 2020)

Up 20.0 billion yen, or 20%

Exchange rates in and after the third quarter of fiscal 2021 is 105 yen to the U.S. dollar, which is unchanged from the previous announcement; 120 yen to the euro, which is 5 yen weaker from the company’s previous announcement; and 15.0 yen to the Chinese yuan, which is unchanged from the previous announcement.

Note:

The results forecast above is based on assumptions deemed reasonable by the company at the present time, and actual results may differ significantly from forecasts. Please refer to the cautionary statement in the full document.

About Mitsubishi Electric Corporation

With nearly 100 years of experience in providing reliable, high-quality products, Mitsubishi Electric Corporation (TOKYO: 6503) is a recognized world leader in the manufacture, marketing and sales of electrical and electronic equipment used in information processing and communications, space development and satellite communications, consumer electronics, industrial technology, energy, transportation and building equipment. Mitsubishi Electric enriches society with technology in the spirit of its corporate statement, “Changes for the Better,” and environmental statement, “Eco Changes.” The company recorded a revenue of 4,462.5 billion yen (U.S.$ 40.9 billion*) in the fiscal year ended March 31, 2020. For more information, please visit www.MitsubishiElectric.com
*U.S. dollar amounts are translated from yen at the rate of ¥109=U.S.$1, the approximate rate on the Tokyo Foreign Exchange Market on March 31, 2020


Contacts

Investor Relations Inquiries
Investor Relations Group, Corporate Finance Division
Mitsubishi Electric Corporation
Tel: +81-3-3218-2391
This email address is being protected from spambots. You need JavaScript enabled to view it.

Media Inquiries
Sachiko Masuda
Public Relations Division
Mitsubishi Electric Corporation
Tel: +81-3-3218-2848
This email address is being protected from spambots. You need JavaScript enabled to view it.
www.MitsubishiElectric.com/news/

ATHENS, Greece--(BUSINESS WIRE)--Danaos Corporation (NYSE:DAC), one of the world’s largest independent owners of containerships, announced today that it will release its results for the third quarter ended September 30, 2020, after the close of the market in New York on Thursday, November 5, 2020.

The Company’s management team will host a conference call to discuss the results on Friday, November 6, 2020 at 9:00 A.M. ET.

Conference Call Details:
Participants should dial into the call 10 minutes before the scheduled time using the following numbers:

U.S. Toll Free Dial-in: 1 844 802 2437
U.K. Toll Free Dial-in: 0 800 279 9489
Standard International Dial-in: +44 (0) 2075 441 375

Please indicate to the operator that you wish to join the Danaos Corporation earnings call.

A telephonic replay of the conference call will be available until November 13, 2020 by dialing 1 877 344 7529 (US Toll Free Dial In) or 1-412-317-0088 (Standard International Dial In) and using 10149664# as your access code.

Audio Webcast:
A live audio webcast of the conference call will be available through the Danaos Corporation website (www.danaos.com). Participants of the live audio webcast should register on the website approximately 10 minutes prior to the start of the webcast. An archived version of the audio webcast will be available on the website within 48 hours of the completion of the call.

About Danaos Corporation
Danaos Corporation is one of the largest independent owners of modern, large-size containerships. Our current fleet of 63 containerships aggregating 388,562 TEUs, including five vessels owned by Gemini Shipholdings Corporation, a joint venture, ranks Danaos among the largest containership charter owners in the world based on total TEU capacity. Our fleet is chartered to many of the world's largest liner companies on fixed-rate charters. Our long track record of success is predicated on our efficient and rigorous operational standards and environmental controls. Danaos Corporation's shares trade on the New York Stock Exchange under the symbol "DAC".

Visit our website at www.danaos.com.


Contacts

Evangelos Chatzis
Chief Financial Officer
Danaos Corporation
Athens, Greece
+30 210 419 6480
This email address is being protected from spambots. You need JavaScript enabled to view it.

Iraklis Prokopakis
Senior Vice President & Chief Operating Officer
Danaos Corporation
Athens, Greece
+30 210 419 6400
This email address is being protected from spambots. You need JavaScript enabled to view it.

Investor Relations and Financial Media:
Rose & Company
New York
212-359-2228
This email address is being protected from spambots. You need JavaScript enabled to view it.

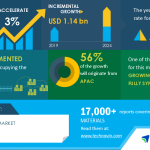
LONDON--(BUSINESS WIRE)--#GearOilMarket--The global gear oil market size is expected to grow by USD 1.14 billion during 2020-2024, progressing at a CAGR of almost 3% during the forecast period. Download latest version with COVID-19 analysis Free Sample Report


The growing demand for fully synthetic gear oil is one of the major factors propelling market growth.

The global gear oil market is driven by the growing demand for advanced gear oils such as semi-synthetic gear oil and fully synthetic gear oil. The addition of advanced additives and chemicals in fully synthetic gear oil increases their demand in the automotive industry. Moreover, the demand for gear oil that withstands very low or high temperatures, extremely high loads, and extraordinary ambient conditions makes synthetic gear oil an ideal choice in industrial applications. Additionally, synthetic gear oil uses a superior quality synthetic base stock, with advanced additives and lubricants. Furthermore, fully synthetic gear oil helps gears combat sludge and carbon deposit build-up within the gearsets. Therefore, the demand for such gear oil has increased owing to the performance advantages and an increase in consumer awareness. Hence, the growing uptake of synthetic gear oil will influence the growth of the gear oil market during the forecast period.

More details: www.technavio.com/report/gear-oil-market-industry-analysis

Global Gear Oil Market: End-user

Gear oil is an essential lubricant for automobiles with a manual transmission as it protects gear components and permits smooth gear-shifting. Moreover, gear oil provides a wide service temperature range, including excellent low-temperature characteristics for cold weather operations. Market growth in the transportation segment will be slower than the growth of the market in the industrial segment.

Global Gear Oil Market: Geographic Landscape

APAC accounted for the largest gear oil market share in 2019, and the region will offer several growth opportunities to market vendors during the forecast period. The strong presence of manufacturing facilities will significantly influence gear oil market growth in this region. 56% of the market’s growth will originate from APAC during the forecast period. China, India, Japan, and South Korea are the key markets for gear oil in APAC. Market growth in this region will be slower than the growth of the market in MEA and South America.

Buy 1 Technavio report and get the second for 50% off. Buy 2 Technavio reports and get the third for free.

View market snapshot before purchasing

Companies Covered

  • BP Plc
  • Chevron Corp.
  • China National Petroleum Corp.
  • China Petroleum & Chemical Corp.
  • Exxon Mobil Corp.
  • FUCHS PETROLUB SE
  • Idemitsu Kosan Co. Ltd.
  • PJSC LUKOIL
  • Royal Dutch Shell Plc
  • TOTAL SA


What our reports offer:

  • Market share assessments for the regional and country-level segments
  • Strategic recommendations for the new entrants
  • Covers market data for 2019, 2020, till 2024
  • Market trends (drivers, opportunities, threats, challenges, investment opportunities, and recommendations)
  • Strategic recommendations in key business segments based on the market estimations
  • Competitive landscaping mapping the key common trends
  • Company profiling with detailed strategies, financials, and recent developments
  • Supply chain trends mapping the latest technological advancements

Technavio suggests three forecast scenarios (optimistic, probable, and pessimistic) considering the impact of COVID-19. Technavio’s in-depth research has direct and indirect COVID-19 impacted market research reports. Register for a free trial today and gain instant access to 17,000+ market research reports. Technavio's SUBSCRIPTION platform

Gear Oil Market 2020-2024: Key Highlights

  • CAGR of the market during the forecast period 2020-2024
  • Detailed information on factors that will assist in gear oil market growth during the next five years
  • Estimation of the gear oil market size and its contribution to the parent market
  • Predictions on upcoming trends and changes in consumer behavior
  • The growth of the gear oil market
  • Analysis of the market’s competitive landscape and detailed information on vendors
  • Comprehensive details of factors that will challenge the growth of gear oil market, vendors

Table of Contents:

PART 01: EXECUTIVE SUMMARY

PART 02: SCOPE OF THE REPORT

PART 03: MARKET LANDSCAPE

  • Market ecosystem
  • Market characteristics
  • Value chain analysis
  • Market segmentation analysis

PART 04: MARKET SIZING

  • Market definition
  • Market sizing 2019
  • Market outlook
  • Market size and forecast 2019-2024

PART 05: FIVE FORCES ANALYSIS

  • Bargaining power of buyers
  • Bargaining power of suppliers
  • Threat of new entrants
  • Threat of substitutes
  • Threat of rivalry
  • Market condition

PART 06: MARKET SEGMENTATION BY END-USER

  • Market segmentation by end-user
  • Comparison by end-user
  • Transportation - Market size and forecast 2019-2024
  • Industrial - Market size and forecast 2019-2024
  • Market opportunity by end-user

PART 07: CUSTOMER LANDSCAPE

PART 08: GEOGRAPHIC LANDSCAPE

  • Geographic segmentation
  • Geographic comparison
  • APAC - Market size and forecast 2019-2024
  • Europe - Market size and forecast 2019-2024
  • North America - Market size and forecast 2019-2024
  • MEA - Market size and forecast 2019-2024
  • South America - Market size and forecast 2019-2024
  • Key leading countries
  • Market opportunity

PART 09: DRIVERS AND CHALLENGES

  • Market drivers
  • Market challenges

PART 10: MARKET TRENDS

  • Growing demand for gear oil from wind turbine applications
  • Development of advanced gear oil
  • Digitalization leading to integrated value chain

PART 11: VENDOR LANDSCAPE

  • Overview
  • Landscape disruption
  • Competitive scenario

PART 12: VENDOR ANALYSIS

  • Vendors covered
  • Vendor classification
  • Market positioning of vendors
  • BP Plc
  • Chevron Corp.
  • China National Petroleum Corp.
  • China Petroleum & Chemical Corp.
  • Exxon Mobil Corp.
  • FUCHS PETROLUB SE
  • Idemitsu Kosan Co. Ltd.
  • PJSC LUKOIL
  • Royal Dutch Shell Plc
  • TOTAL SA

PART 13: APPENDIX

  • Research methodology
  • List of abbreviations
  • Definition of market positioning of vendors

PART 14: EXPLORE TECHNAVIO

About Us

Technavio is a leading global technology research and advisory company. Their research and analysis focuses on emerging market trends and provides actionable insights to help businesses identify market opportunities and develop effective strategies to optimize their market positions. With over 500 specialized analysts, Technavio’s report library consists of more than 17,000 reports and counting, covering 800 technologies, spanning across 50 countries. Their client base consists of enterprises of all sizes, including more than 100 Fortune 500 companies. This growing client base relies on Technavio’s comprehensive coverage, extensive research, and actionable market insights to identify opportunities in existing and potential markets and assess their competitive positions within changing market scenarios.


Contacts

Technavio Research
Jesse Maida
Media & Marketing Executive
US: +1 844 364 1100
UK: +44 203 893 3200
Email: This email address is being protected from spambots. You need JavaScript enabled to view it.
Website: www.technavio.com/

SAN ANTONIO--(BUSINESS WIRE)--The Board of Directors of Valero Energy Corporation (NYSE: VLO, “Valero”) has declared a regular quarterly cash dividend on common stock of $0.98 per share. The dividend is payable on December 9, 2020, to holders of record at the close of business on November 18, 2020.


About Valero

Valero Energy Corporation, through its subsidiaries (collectively, “Valero”), is an international manufacturer and marketer of transportation fuels and petrochemical products. Valero is a Fortune 50 company based in San Antonio, Texas, and it operates 15 petroleum refineries with a combined throughput capacity of approximately 3.2 million barrels per day and 14 ethanol plants with a combined production capacity of approximately 1.73 billion gallons per year. The petroleum refineries are located in the United States (U.S.), Canada and the United Kingdom (U.K.), and the ethanol plants are located in the Mid-Continent region of the U.S. Valero is also a joint venture partner in Diamond Green Diesel, which operates a renewable diesel plant in Norco, Louisiana. Diamond Green Diesel is North America’s largest biomass-based diesel plant. Valero sells its products in the wholesale rack or bulk markets in the U.S., Canada, the U.K., Ireland and Latin America. Approximately 7,000 outlets carry Valero’s brand names. Please visit www.investorvalero.com for more information.

Safe-Harbor Statement

Statements contained in this release that state the company’s or management’s expectations or predictions of the future are forward-looking statements intended to be covered by the safe harbor provisions of the Securities Act of 1933 and the Securities Exchange Act of 1934. The words “believe,” “expect,” “should,” “estimates,” “intend,” “target,” “will,” “plans,” and other similar expressions identify forward-looking statements. It is important to note that actual results could differ materially from those projected in such forward-looking statements based on numerous factors, including those outside of the company’s control, such as delays in construction timing and other factors, including but not limited to the impacts of COVID-19. For more information concerning factors that could cause actual results to differ from those expressed or forecasted, see Valero’s annual reports on Form 10-K, quarterly reports on Form 10-Q, and other reports filed with the Securities and Exchange Commission and available on Valero’s Investor Relations website at www.investorvalero.com.


Contacts

Valero
Investors:
Homer Bhullar, Vice President – Investor Relations, 210-345-1982
Eric Herbort, Senior Manager – Investor Relations, 210-345-3331
Gautam Srivastava, Manager – Investor Relations, 210-345-3992

Media:
Lillian Riojas, Executive Director – Media Relations and Communications, 210-345-5002

Aerial, Vehicle and On-The-Ground Patrols Confirm at Least 72 Instances of Damage or Hazards to Electric Equipment So Far

SAN FRANCISCO--(BUSINESS WIRE)--Pacific Gas and Electric Company (PG&E) restored power by Tuesday night to more than 335,000 of the approximately 345,000 customers impacted by the Public Safety Power Shutoff (PSPS) that started Sunday morning (Oct. 25).

PG&E crews began restoring power to customers where no damage or hazards to electrical equipment were found during patrols that began as early as Monday morning in locations where the weather “all clear” was received. In areas where equipment was damaged by the severe wind event, crews worked safely and as quickly as possible to make the repairs and restore those customers.

Due to continuing high winds and dynamic weather conditions, the weather “all clear” notification for the remaining impacted areas was issued at 1:45 p.m. today. Following this all clear, PG&E crews began power restoration efforts in areas still out of power. Essentially all remaining customers—approximately 10,000—are expected to have power back on by noon on Wednesday.

PG&E crews will have patrolled over 17,000 miles of transmission and distribution lines to inspect for damage or hazards before all customers have been restored. The patrol and inspection efforts include nearly 1,800 ground patrol units, 65 helicopters and one airplane. Preliminary data shows at least 72 identified instances of weather-related damage and hazards in the PSPS-affected areas. Examples include downed lines and vegetation on lines. If PG&E had not de-energized the lines, these types of damage could have caused wildfire ignitions.

PSPS Restoration

PG&E has restored 335,000 customers and expects all remaining customers to have power back on by noon on Wednesday. Restoration may be delayed for some customers if there is significant damage to individual lines, which could be caused by wind-blown branches and other debris.

The restoration process PG&E follows includes:

  1. Patrol – PG&E crews look for potential weather-related damage to the lines, poles and towers. This is done by foot, vehicle and air.
  2. Repair – Where equipment damage is found, PG&E crews isolate the damaged area from the rest of the system so other parts of the system can be energized.
  3. Restore – Once the system is safe to energize, PG&E's Control Center can complete the process and restore power to affected areas.
  4. Notify Customers – Customers are notified that power has been restored.

For more updates on the PSPS event, visit pge.com/pspsupdates.

Top Extreme Winds Recorded

Top 3 highest sustained and maximum recorded wind gusts during this PSPS event:

County


Max recorded sustained winds (mph)


Max recorded wind gusts (mph)

Sonoma


76


89

Napa


54


82

Contra Costa


55


74

More Information on PG&E PSPS Events

PG&E’s goal is to have essentially all customers affected by the PSPS who can receive power restored within 12 daylight hours of the weather “all clear” for each affected area.

PG&E uses a PSPS only as the last resort to protect community and customer safety against wildfires, given dry and windy weather, dry vegetation and an elevated fire risk across portions of its service area.

PG&E will submit a report detailing damage from the severe weather to the California Public Utilities Commission within 10 days of the completion of the PSPS.

About PG&E

Pacific Gas and Electric Company, a subsidiary of PG&E Corporation (NYSE:PCG), is one of the largest combined natural gas and electric energy companies in the United States. Based in San Francisco, with more than 23,000 employees, the company delivers some of the nation's cleanest energy to 16 million people in Northern and Central California. For more information, visit pge.com and pge.com/news.


Contacts

Media Relations
415.973.5930

  • Net Income of $95.8 Million and Earnings Per Share of $8.77 for the Third Quarter
  • Strong Market Recovery in Petroleum Additives
  • Third Quarter Net Income Includes $16.5 Million for Sale of Non-Operating Real Estate

RICHMOND, Va.--(BUSINESS WIRE)--NewMarket Corporation (NYSE:NEU) Chairman and Chief Executive Officer, Thomas E. Gottwald, released the following earnings report of the Company’s operations for the third quarter and first nine months of 2020.

Net income for the third quarter of 2020 was $95.8 million, or $8.77 per share, compared to net income of $67.8 million, or $6.06 per share, for the third quarter of 2019. Third quarter net income includes a gain of $16.5 million related to the sale of a non-operating parcel of real estate. For the first nine months of 2020, net income was $203.7 million, or $18.52 per share, compared to net income of $204.2 million or $18.26 per share, for the first nine months of last year.

Petroleum additives operating profit for the third quarter of 2020 was $102.2 million, compared to $94.8 million for the same period last year. The increase was due to lower raw material costs, selling, general, and administrative costs, and research and development costs, partially offset by changes in selling prices, higher conversion costs, and lower shipments. Petroleum additives operating profit for the first nine months of the year was $248.9 million compared to $285.6 million for the first nine months of 2019. The decrease was due to lower shipments, higher conversion costs, and changes in selling prices, partially offset by lower raw material costs, selling, general, and administrative costs, and research and development costs.

Sales for the petroleum additives segment for the third quarter of 2020 were $510.3 million, down from $550.6 million in the third quarter of 2019. The decrease was due mainly to lower shipments and selling prices. Shipments decreased 3.2% between periods, mainly driven by decreases in fuel additives shipments. Petroleum additives sales for the first nine months of the year were $1.5 billion compared to sales in the first nine months of last year of $1.6 billion. The decrease was due mainly to lower shipments and selling prices. Shipments decreased 7.5% between periods, with decreases in both lubricant additives and fuel additives shipments.

Our third quarter 2020 operating results reflected continued improvement in some of the key drivers that affect the performance of our business, consistent with what we began to see near the end of the second quarter. With gasoline consumption and miles driven continuing to show improvement and industrial production beginning to rebound, specifically related to automobile plants reopening and producing vehicles, demand for both our lubricant and fuel additives has increased steadily throughout the quarter. While our second quarter results were significantly impacted by the economic disruption due to the COVID-19 pandemic and the related government restrictions, these improvements in the third quarter of 2020 helped to drive an increase in shipments compared to the second quarter of over 25%. The pace and stability of improvement will depend heavily on economic recovery and the rate at which government restrictions are lifted and remain lifted.

During the first nine months of 2020, we funded capital expenditures of $60.1 million, paid dividends of $62.7 million, and repurchased 270,963 shares of our common stock for a total of $101.4 million.

Throughout the economic downturn associated with the COVID-19 pandemic, the chemical industry and our products have been recognized as essential for the transportation of goods and services. Our operating facilities have continued to function safely during 2020. We have procedures in place at each of our facilities to help ensure the well-being of our employees, as we see our responsibility to protect their health and safety as a top priority. Because of the commitment and dedication of our employees and our ability to remain operational throughout 2020, we have been able to work closely with our customers to ensure their supply demands are met throughout this unusual period.

As we navigate the current economic downturn, our business decisions will continue to be focused on the long-term success of our company, including emphasis on satisfying customer needs, generating solid operating results, and promoting the greatest long-term value for our shareholders, customers and employees. Those decisions include investing in capital improvements and research and development in support of our customers, using cash prudently to provide shareholder value, including dividends and repurchases of common stock, and ensuring we are well-positioned to stay the course with a strong balance sheet, conservative fiscal policies, and a dedicated team. We believe the fundamentals of how we run our business – a long-term view, safety and people first culture, customer-focused solutions, technology-driven product offerings, and a world-class supply chain capability – will continue to be beneficial for all our stakeholders.

Sincerely,

Thomas E. Gottwald

The petroleum additives segment consists of the North America (the United States and Canada), Latin America (Mexico, Central America, and South America), Asia Pacific, and Europe/Middle East/Africa/India (Europe or EMEAI) regions.

The Company has disclosed the non-GAAP financial measure EBITDA and the related calculation in the schedules included with this earnings release. EBITDA is defined as income from continuing operations before the deduction of interest and financing expenses, income taxes, depreciation (on property, plant and equipment) and amortization (on intangibles and lease right-of-use assets). The Company believes that even though this item is not required by or presented in accordance with United States generally accepted accounting principles (GAAP), this additional measure enhances understanding of the Company’s performance and period to period comparability. The Company believes that this item should not be considered an alternative to net income determined under GAAP.

As a reminder, a conference call and Internet webcast is scheduled for 3:00 p.m. EDT on Thursday, October 29, 2020, to review third quarter 2020 financial results. You can access the conference call live by dialing 1-844-407-9500 (domestic) or 1-862-298-0850 (international) and requesting the NewMarket conference call. To avoid delays, callers should dial in five minutes early. A teleconference replay of the call will be available until November 5, 2020 at 3:00 p.m. EST by dialing 1-877-481-4010 (domestic) or 1-919-882-2331 (international). The replay ID number is 38031. The call will also be broadcast via the Internet and can be accessed through the Company’s website at www.NewMarket.com or www.webcaster4.com/Webcast/Page/2001/38031. A webcast replay will be available for 30 days.

NewMarket Corporation, through its subsidiaries Afton Chemical Corporation and Ethyl Corporation, develops, manufactures, blends, and delivers chemical additives that enhance the performance of petroleum products. From custom-formulated additive packages to market-general additives, the NewMarket family of companies provides the world with the technology to make engines run smoother, machines last longer, and fuels burn cleaner.

Some of the information contained in this press release constitutes forward-looking statements within the meaning of the Private Securities Litigation Reform Act of 1995. Although NewMarket’s management believes its expectations are based on reasonable assumptions within the bounds of its knowledge of its business and operations, there can be no assurance that actual results will not differ materially from expectations.

Factors that could cause actual results to differ materially from expectations include, but are not limited to, the availability of raw materials and distribution systems; disruptions at production facilities, including single-sourced facilities; hazards common to chemical businesses; the ability to respond effectively to technological changes in our industry; failure to protect our intellectual property rights; sudden or sharp raw material price increases; competition from other manufacturers; current and future governmental regulations; the gain or loss of significant customers; failure to attract and retain a highly-qualified workforce; an information technology system failure or security breach; the occurrence or threat of extraordinary events, including natural disasters; terrorist attacks and health-related epidemics such as the COVID-19 pandemic; risks related to operating outside of the United States; political, economic, and regulatory factors concerning our products; the impact of substantial indebtedness on our operational and financial flexibility; the impact of fluctuations in foreign exchange rates; resolution of environmental liabilities or legal proceedings; limitation of our insurance coverage; our inability to realize expected benefits from investment in our infrastructure or from recent or future acquisitions, or our inability to successfully integrate recent or future acquisitions into our business; the underperformance of our pension assets resulting in additional cash contributions to our pension plans; and other factors detailed from time to time in the reports that NewMarket files with the Securities and Exchange Commission, including the risk factors in Item 1A. “Risk Factors” of our 2019 Annual Report on Form 10-K and Part II. Item 1A. “Risk Factors” of our Quarterly Report on Form 10-Q for the quarterly period ended March 31, 2020, which are available to shareholders upon request.

You should keep in mind that any forward-looking statement made by NewMarket in the foregoing discussion speaks only as of the date on which such forward-looking statement is made. New risks and uncertainties arise from time to time, and it is impossible for us to predict these events or how they may affect the Company. We have no duty to, and do not intend to, update or revise the forward-looking statements in this discussion after the date hereof, except as may be required by law. In light of these risks and uncertainties, you should keep in mind that the events described in any forward-looking statement made in this discussion, or elsewhere, might not occur.

NEWMARKET CORPORATION AND SUBSIDIARIES

SEGMENT RESULTS AND OTHER FINANCIAL INFORMATION

(In thousands, except per-share amounts, unaudited)


Third Quarter Ended

September 30,


Nine Months Ended

September 30,


2020


2019


2020


2019

Revenue:


Petroleum additives


$

510,280


$

550,626


$

1,476,355


$

1,644,129


All other


2,589


5,191


6,795


11,721


Total


$

512,869


$

555,817


$

1,483,150


$

1,655,850


Segment operating profit:


Petroleum additives


$

102,186


$

94,765


$

248,918


$

285,620


All other


2,015


(77

)


1,951


92


Segment operating profit


104,201


94,688


250,869


285,712


Corporate unallocated expense


(5,565

)


(6,473

)


(15,263

)


(15,842

)

Interest and financing expenses


(6,466

)


(6,987

)


(20,575

)


(22,740

)

Other income (expense), net


25,448


6,230


39,933


17,827


Income before income tax expense


$

117,618


$

87,458


$

254,964


$

264,957


Net income


$

95,794


$

67,805


$

203,684


$

204,184


Earnings per share - basic and diluted


$

8.77


$

6.06


$

18.52


$

18.26


NEWMARKET CORPORATION AND SUBSIDIARIES

CONSOLIDATED STATEMENTS OF INCOME

(In thousands, except per-share amounts, unaudited)


Third Quarter Ended

September 30,


Nine Months Ended

September 30,


2020


2019


2020


2019

Net sales


$

512,869


$

555,817


$

1,483,150


$

1,655,850


Cost of goods sold


346,262


393,090


1,038,898


1,169,421


Gross profit


166,607


162,727


444,252


486,429


Selling, general, and administrative expenses


34,690


38,122


105,837


109,916


Research, development, and testing expenses


33,113


36,387


102,168


106,748


Operating profit


98,804


88,218


236,247


269,765


Interest and financing expenses, net


6,466


6,987


20,575


22,740


Other income (expense), net


25,280


6,227


39,292


17,932


Income before income tax expense


117,618


87,458


254,964


264,957


Income tax expense


21,824


19,653


51,280


60,773


Net income


$

95,794


$

67,805


$

203,684


$

204,184


Earnings per share - basic and diluted


$

8.77


$

6.06


$

18.52


$

18.26


Cash dividends declared per share


$

1.90


$

1.90


$

5.70


$

5.40


NEWMARKET CORPORATION AND SUBSIDIARIES

CONSOLIDATED BALANCE SHEETS

(In thousands except share amounts, unaudited)


September 30,

2020


December 31,

2019

ASSETS


Current assets:


Cash and cash equivalents


$

117,701


$

144,397


Trade and other accounts receivable, less allowance for credit losses


328,677


335,826


Inventories


370,104


365,938


Prepaid expenses and other current assets


37,880


33,237


Total current assets


854,362


879,398


Property, plant, and equipment, net


648,685


635,439


Intangibles (net of amortization) and goodwill


130,423


131,880


Prepaid pension cost


145,450


133,848


Operating lease right-of-use assets


58,420


60,505


Deferred charges and other assets


42,782


44,062


Total assets


$

1,880,122


$

1,885,132


LIABILITIES AND SHAREHOLDERS' EQUITY


Current liabilities:


Accounts payable


$

187,572


$

178,773


Accrued expenses


74,797


77,350


Dividends payable


18,444


19,217


Income taxes payable


5,362


10,632


Operating lease liabilities


13,270


14,036


Other current liabilities


9,454


8,887


Total current liabilities


308,899


308,895


Long-term debt


608,702


642,941


Operating lease liabilities - noncurrent


45,004


46,792


Other noncurrent liabilities


193,991


203,406


Total liabilities


1,156,596


1,202,034


Shareholders' equity:


Common stock and paid-in capital (with no par value; issued and outstanding shares - 10,921,389 at September 30, 2020 and 11,188,549 at December 31, 2019)


287


1,965


Accumulated other comprehensive loss


(162,898

)


(162,748

)

Retained earnings


886,137


843,881


Total shareholders' equity


723,526


683,098


Total liabilities and shareholders' equity


$

1,880,122


$

1,885,132


NEWMARKET CORPORATION AND SUBSIDIARIES

SELECTED CONSOLIDATED CASH FLOW DATA

(In thousands, unaudited)


Nine Months Ended

September 30,


2020


2019

Net income


$

203,684


$

204,184


Depreciation and amortization


63,045


65,500


Cash pension and postretirement contributions


(7,717

)


(7,308

)

Working capital changes


(33,493

)


(35,997

)

Deferred income tax expense


5,405


3,982


Capital expenditures


(60,133

)


(37,132

)

Net repayments under revolving credit facility


(34,678

)


(126,262

)

Repurchases of common stock


(101,434

)


0


Dividends paid


(62,667

)


(60,418

)

Proceeds from sale of land


20,000


0


Gain on sale of land


(16,483

)


0


All other


(2,225

)


382


(Decrease) increase in cash and cash equivalents


$

(26,696

)


$

6,931


NEWMARKET CORPORATION AND SUBSIDIARIES

NON-GAAP FINANCIAL INFORMATION

(In thousands, unaudited)


Third Quarter Ended

September 30,


Nine Months Ended

September 30,


2020


2019


2020


2019

Net Income


$

95,794


$

67,805


$

203,684


$

204,184


Add:


Interest and financing expenses, net


6,466


6,987


20,575


22,740


Income tax expense


21,824


19,653


51,280


60,773


Depreciation and amortization


20,414


21,500


61,982


64,646


EBITDA


$

144,498


$

115,945


$

337,521


$

352,343


Contacts

FOR INVESTOR INFORMATION CONTACT:
Brian D. Paliotti
Investor Relations
Phone: 804.788.5555
Fax: 804.788.5688
Email: This email address is being protected from spambots. You need JavaScript enabled to view it.

Novel MinE-CAP device dramatically reduces the input bulk capacitor size, reduces in-rush current by up to 95%, eliminates NTC thermistors and associated losses

SAN JOSE, Calif.--(BUSINESS WIRE)--$POWI #GaN--Power Integrations (Nasdaq: POWI), the leader in high-voltage integrated circuits for energy-efficient power conversion, today announced the MinE-CAP™ IC for high power density, universal input AC-DC converters. By halving the size of the high-voltage bulk electrolytic capacitors required in offline power supplies, this new type of IC enables a reduction in adapter size of up to 40%. The MinE-CAP device also dramatically reduces in-rush current making NTC thermistors unnecessary, increasing system efficiency and reducing heat dissipation.


Comments Power Integrations’ product marketing director, Chris Lee: “The MinE-CAP will be a game-changer for compact chargers and adapters. Electrolytic capacitors are physically large, occupy a significant fraction of the internal volume and often constrain form factor options – particularly minimum thickness – of adapter designs. The MinE-CAP IC allows the designer to use predominantly low voltage rated capacitors for a large portion of the energy storage, which shrinks the volume of those components linearly with voltage. USB PD has driven a major market push towards small 65 W chargers and many companies have concentrated on increasing switching frequency to reduce the size of the flyback transformer. MinE-CAP provides more volume saving than doubling the switching frequency, while actually increasing system efficiency.”

The MinE-CAP leverages the small size and low RDSon of PowiGaN™ gallium nitride transistors to actively and automatically connect and disconnect segments of the bulk capacitor network depending on AC line voltage conditions. Designers using MinE-CAP select the smallest high-line rated bulk capacitor required for high AC line voltages, and allocate most of the energy storage to lower voltage capacitors that are protected by the MinE-CAP until needed at low AC line. This approach dramatically shrinks the size of input bulk capacitors without compromising output ripple, operating efficiency, or requiring redesign of the transformer.

Conventional power conversion solutions reduce power supply size by increasing switching frequency to allow the use of a smaller transformer. The innovative MinE-CAP IC achieves just as significant overall power supply size reduction while using fewer components and avoiding the challenges of higher EMI and the increased transformer/clamp dissipation challenges associated with high-frequency designs. Applications include smart mobile chargers, appliances, power tools, lighting and automotive.

Said Bhaskar Thiagaragan, Director of Power Integrations India Ltd.: “MinE-CAP ICs are excellent for all locations with wide ranging input voltages. In India we often design for voltages from 90 VAC to 350 VAC, with a generous surge de-rating above that. Engineers here often complain about the forest of expensive high-voltage capacitors required. MinE-CAP dramatically reduces the number of high-voltage storage components, and shields lower voltage capacitors from the wild mains voltage swings, substantially enhancing robustness while reducing system maintenance and product returns.

Housed in the miniature MinSOP-16A package, the new devices work seamlessly with Power Integrations’ InnoSwitch™ family of power supply ICs with minimal external components. MinE-CAP MIN1072M ICs are available immediately from PI offices and franchised distributors and are priced at $1.75 for 10 Ku. Two initial design example reports (DERs) pair the MinE-CAP IC with Power Integrations’ InnoSwitch3-Pro PowiGaN IC, INN3370C-H302. A 65 W USB PD 3.0 power supply with 3.3 V – 21 V PPS output for mobile phone / laptop chargers is described in DER-626, and DER-822 describes a 60 W USB PD 3.0 power supply for USB PD/PPS power adapters using INN3379C-H302.

Learn more about the family and download the reference designs at the Power Integrations website: https://www.power.com/products/MinE-CAP.

About Power Integrations

Power Integrations, Inc. is a leading innovator in semiconductor technologies for high-voltage power conversion. The company’s products are key building blocks in the clean-power ecosystem, enabling the generation of renewable energy as well as the efficient transmission and consumption of power in applications ranging from milliwatts to megawatts. For more information please visit www.power.com.

Power Integrations, InnoSwitch, PowiGaN, MinE-CAP and the Power Integrations logo are trademarks or registered trademarks of Power Integrations, Inc. All other trademarks are the property of their respective owner.


Contacts

Media Contact
Diane Vanasse
Power Integrations, Inc.
(408) 242-0027
This email address is being protected from spambots. You need JavaScript enabled to view it.

Press Agency Contact
Nick Foot
BWW Communications
+44-1491-636 393
This email address is being protected from spambots. You need JavaScript enabled to view it.

  • Helps reduce provincial greenhouse gas emissions by approximately 112,000 tonnes annually
  • Supplies up to 80 percent of refinery electricity needs, reducing energy draw from the Alberta grid

STRATHCONA COUNTY, Alberta--(BUSINESS WIRE)--Imperial (TSE: IMO, NYSE American: IMO) has started operation of its newly constructed cogeneration unit at its Strathcona refinery near Edmonton, Alberta, increasing energy efficiency at the facility and helping reduce provincial greenhouse gas emissions.


The completion of this project is an important milestone for Imperial,” said Brad Corson, Imperial chairman, president and chief executive officer. “It highlights our commitment to investing in projects that support sustainability and contribute to reducing emissions. An investment in cogeneration is an investment in the future.”

This is great news for our province,” said Alberta Premier Jason Kenney. “Our day-to-day lives are still dependent on our natural resources to provide us with the energy we need to thrive. That’s why I’m so pleased to see made-in-Alberta innovations like this, which help reduce our emissions as we utilize the energy we need.”

In a refinery, cogeneration technology captures heat generated from the production of electricity that would normally go to waste and uses it to produce steam for use in refining operations. Electricity produced by the Strathcona cogeneration unit meets approximately 75 to 80 percent of the refinery’s needs, significantly decreasing energy consumption from the Alberta grid. The unit produces approximately 41 megawatts of power and reduces province-wide greenhouse gas emissions by approximately 112,000 tonnes per year, which is the equivalent to taking nearly 24,000 vehicles off the road annually.

This project has been a great example of team work, particularly navigating some of the unique challenges that come with working in a pandemic environment over the last seven months. I’m proud the team has delivered the project on time and on budget, all while keeping everyone safe and healthy,” said Dave Oldreive, Strathcona refinery manager. “Strathcona continues to be one of the safest, most reliable and competitive refineries in North America and now with our cogeneration capacity, one of the most energy efficient.”

The Strathcona cogeneration unit is now Imperial’s third in Alberta, with cogeneration technology used at its Kearl and Cold Lake oil sands facilities. The positive impact those facilities have on the province-wide greenhouse gas emissions varies depending on annual facility energy consumption. In 2019, those facilities contributed to a reduction in greenhouse gas emissions of approximately 860,000 tonnes, similar to having nearly 186,000 fewer passenger vehicles on the road each year. Imperial also uses cogeneration at its Ontario refineries in Sarnia and Nanticoke.

The investment at Strathcona refinery underscores its strategic importance to Imperial’s operations. As the largest refinery in western Canada, Strathcona provides valuable fuel products that keep our communities and the economy moving.

Cautionary statement: Statements of future events or conditions in this release, including projections, targets, expectations, estimates, and business plans are forward-looking statements. Forward-looking statements in this release include, but are not limited to, references to the impact of the cogeneration facility at Strathcona, including on energy efficiency, electricity production and contribution to refinery electricity needs, and on expected reduction in provincial greenhouse gas emissions; the company’s commitment to investing in projects that support sustainability and contribute to reducing emissions; and Strathcona’s position amongst other refineries in North America.

Forward-looking statements are based on the company's current expectations, estimates, projections and assumptions at the time the statements are made. Actual future financial and operating results, including expectations and assumptions concerning refinery utilization, energy use and greenhouse gas emissions; demand growth and energy source, supply and demand mix; general market conditions; commodity prices; the company’s ability to effectively execute on its project plans and operate the refinery and cogeneration unit; progression of COVID-19 and its impacts on Imperial’s ability to operate its assets, including the possible shutdown of facilities due to COVID-19 outbreaks; the company’s ability to effectively execute on its business continuity plans; the adoption and impact of new facilities or technologies, including on reductions to greenhouse gas emissions intensity; applicable laws and government policies and actions, including climate change and restrictions in response to COVID-19; and capital and environmental expenditures could differ materially depending on a number of factors. These factors include global, regional or local changes in supply and demand for oil, natural gas, and petroleum products and resulting price, differential and margin impacts; environmental regulation, including climate change and greenhouse gas regulation and changes to such regulation; general economic conditions; political or regulatory events, including changes in law or government policy such as actions in response to COVID-19; availability and performance of third-party service providers; unanticipated technical or operational difficulties; management effectiveness and disaster response preparedness, including business continuity plans in response to COVID-19; unexpected technological developments; operational hazards and risks; cybersecurity incidents; and other factors discussed in Item 1A risk factors and Item 7 management’s discussion and analysis of financial condition and results of operations of Imperial’s most recent annual report on Form 10-K and subsequent interim reports of Form 10-Q.

Forward-looking statements are not guarantees of future performance and involve a number of risks and uncertainties, some that are similar to other oil and gas companies and some that are unique to Imperial Oil Limited. Imperial’s actual results may differ materially from those expressed or implied by its forward-looking statements and readers are cautioned not to place undue reliance on them. Imperial undertakes no obligation to update any forward-looking statements contained herein, except as required by applicable law.

After more than a century, Imperial continues to be an industry leader in applying technology and innovation to responsibly develop Canada’s energy resources. As Canada’s largest petroleum refiner, a major producer of crude oil, a key petrochemical producer and a leading fuels marketer from coast to coast, our company remains committed to high standards across all areas of our business.

Source: Imperial


Contacts

Investor relations
(587) 476-4743

Media relations
(587) 476-7010

EV adoption is expected to accelerate as AI makes the EV ecosystem more attractive and competitive


BOULDER, Colo.--(BUSINESS WIRE)--#AI--A new report from Guidehouse Insights describes the AI applications used in the current generation of EV hardware and services as of 2020, providing market forecasts for in-vehicle AI applications, EV fleet AI applications, and utility AI applications for EV planning, through 2029.

While many EV drivers are enthusiastic about their vehicles, prospective customers have legitimate reasons for hesitating to make the switch, including shorter driving range, inconvenient charging, and insufficient knowledge of what to do when problems occur. The EV industry is aware of these concerns, and is aggressively applying AI technology to enhance the EV experience. Click to tweet: According to a new report from @WeAreGHInsights, the market for AI-based applications for EV energy management is expected to grow at a 27.8% compound annual growth rate (CAGR) over the next decade, from $298.7 million in 2020 to $2.7 billion in 2029.

“The use of AI technology is anticipated to play an increasingly important role in enhancing the efficiency and capabilities of EVs, advancing the competitive positioning of EV OEMs, and overcoming the objections of prospective EV buyers,” says William Hughes, principal research analyst with Guidehouse Insights. “Ultimately, EV adoption should accelerate as AI makes the EV ecosystem more attractive and competitive.”

As of 2020, AI applications in use by OEMs include improving lithium battery design and manufacturing. AI can offer EV drivers superior navigation and route planning and help address range anxiety. Also, AI applications can improve the charging station experience and facilitate roadside assistance. These solutions are being developed internally by the EV industry and therefore are not expected to represent a revenue-generating opportunity for third-party solution developers.

The report, AI for EV Energy Management, describes the internal OEM AI applications used in the current generation of EV hardware and services as of 2020. It also documents pending or planned uses of AI in the EV value chain (second generation applications). The report also discusses third generation applications that are expected to offer further enhancements to existing or planned AI capabilities contributing to the overall EV experience, but they have yet to be implemented. In addition to these internal OEM use cases, this report provides an overview of EV-related AI opportunities around commercial fleet management, utility grid management, and EV charging integration. An executive summary of the report is available for free download on the Guidehouse Insights website.

About Guidehouse Insights

Guidehouse Insights, the dedicated market intelligence arm of Guidehouse, provides research, data, and benchmarking services for today’s rapidly changing and highly regulated industries. Our insights are built on in-depth analysis of global clean technology markets. The team’s research methodology combines supply-side industry analysis, end-user primary research, and demand assessment, paired with a deep examination of technology trends, to provide a comprehensive view of emerging resilient infrastructure systems. Additional information about Guidehouse Insights can be found at www.guidehouseinsights.com.

About Guidehouse

Guidehouse is a leading global provider of consulting services to the public and commercial markets with broad capabilities in management, technology, and risk consulting. We help clients address their toughest challenges with a focus on markets and clients facing transformational change, technology-driven innovation and significant regulatory pressure. Across a range of advisory, consulting, outsourcing, and technology/analytics services, we help clients create scalable, innovative solutions that prepare them for future growth and success. Headquartered in Washington DC, the company has more than 7,000 professionals in more than 50 locations. Guidehouse is led by seasoned professionals with proven and diverse expertise in traditional and emerging technologies, markets and agenda-setting issues driving national and global economies. For more information, please visit: www.guidehouse.com.

* The information contained in this press release concerning the report, AI for EV Energy Management, is a summary and reflects the current expectations of Guidehouse Insights based on market data and trend analysis. Market predictions and expectations are inherently uncertain and actual results may differ materially from those contained in this press release or the report. Please refer to the full report for a complete understanding of the assumptions underlying the report’s conclusions and the methodologies used to create the report. Neither Guidehouse Insights nor Guidehouse undertakes any obligation to update any of the information contained in this press release or the report.


Contacts

Lindsay Funicello-Paul
+1.781.270.8456
This email address is being protected from spambots. You need JavaScript enabled to view it.

Aviation Segment Reports Quarter-over-Quarter Revenue Growth, Driven by New Business Wins

New Landing Gear Initiative Accelerated by $100 million Aviation Distribution Contract Award

Positive Net Income and Free Cash Flow from Operations; Second Consecutive Quarter of Debt Reduction

ALEXANDRIA, Va.--(BUSINESS WIRE)--VSE Corporation (NASDAQ: VSEC, “VSE”, or the “Company”), a leading provider of aftermarket distribution and maintenance, repair and overhaul (MRO) services for land, sea and air transportation assets for government and commercial markets, today announced results for the third quarter 2020.


THIRD QUARTER 2020 RESULTS
(as compared to the third quarter 2019)

  • Total Revenues of $165.5 million declined 16.5%
  • Total Revenues, excluding divestitures, declined 12.0% (1)
  • GAAP Net Income of $8.1 million declined $2.4 million
  • Adjusted Net Income of $6.8 million declined $4.1 million
  • Total Adjusted EBITDA of $18.0 million declined $6.5 million
  • GAAP EPS (Diluted) of $0.73/share declined $0.22/share
  • Adjusted EPS (Diluted) of $0.62/share declined $0.37/share
  • Operating Cash Flow of $12.4 million during the third quarter 2020
  • Free Cash Flow of $11.3 million during the third quarter 2020 (2)
  • Total Debt reduced by $10.4 million during the third quarter 2020

(1) Excludes the previously announced divestitures of Prime Turbines and CT Aerospace
(2)
Cash provided by operating activities less capital expenditures

For the three months ended September 30, 2020, the Company reported total revenue of $165.5 million, versus $198.3 million for the same period ended 2019. The Company reported adjusted net income of $6.8 million or $0.62 per adjusted diluted share, compared to $10.9 million or $0.99 per adjusted diluted share in the prior-year period. Adjusted EBITDA declined to $18.0 million in the third quarter 2020, versus $24.5 million for the same period in 2019. The Company generated $11.3 million in free cash flow during the third quarter 2020. VSE reduced total debt outstanding by $10.4 million during the third quarter 2020.

Aviation segment revenue, excluding the previously announced divestiture of Prime Turbines and CT Aerospace assets, declined 26.0% on a year-over-year basis in the third quarter 2020, as lower revenue passenger miles at major airline customers resulted in reduced commercial MRO activity. On a sequential quarter basis, excluding Prime Turbines and CT Aerospace, Aviation segment revenue increased 16.1%, supported by market share gains in our distribution business, and early indications of stabilization within the business and general aviation market customers. Federal & Defense segment revenue declined 21.7% on a year-over-year basis primarily due to the completion of a DoD program during the first quarter 2020. Fleet segment revenue increased 15.1% on a year-over-year basis due to growth within the commercial fleet business, together with a non-recurring order for personal protective equipment (PPE) from a government customer.

STRATEGY UPDATE

VSE continued to execute on a multi-year business transformation strategy during the third quarter, one that includes improved organizational design, rebranding and consolidation of business entities, new business development initiatives, the introduction of new products and services, and a continued focus on disciplined balance sheet management.

  • New business development. Within the Aviation segment, VSE announced an exclusive distribution agreement with a leading global manufacturer of hydraulic landing gear components. The agreement, which is scheduled to commence in the first quarter of 2021, has a total estimated value of approximately $100 million over five years. The Federal & Defense segment won both new contracts and recompete awards during the third quarter. Within this segment, the total number of contract bids increased by more than 46% during the first nine months of 2020 when compared to the same period in 2019. The Fleet segment grew commercial sales by 107.3% in the third quarter, when compared to the prior-year period.
  • Aviation product and service line expansion. Earlier this year, VSE launched an Aviation Landing Gear initiative. The Company is developing a comprehensive landing gear solution suite for global airline and MRO customers that includes services such as gear sales, exchanges and repair management, together with the distribution of proprietary and specialty products, kitting, 24/7 AOG service and other just-in-time value added services. This solution suite, coupled with the newly announced OEM product partnership, simplifies the sourcing process, while reducing working capital requirements for customers.
  • Balance sheet discipline. VSE is committed to maintaining sufficient liquidity to support the long-term growth of the business, while continuing to support a quarterly cash dividend and conservative net leverage profile. As of September 30, 2020, the Company had $190 million in cash and excess availability under its line of credit. During the third quarter, VSE reduced total debt outstanding by $10.4 million, due to free cash flow generated from operations in the period.

MANAGEMENT COMMENTARY

“During the third quarter, we further advanced a multi-year business transformation plan in support of our long-term strategy, while effectively navigating the near-term, pandemic-related disruption to the global aviation market,” stated John Cuomo, President and CEO of VSE Corporation. “In recent months, we streamlined our organizational structure, improved systems and processes to support business expansion, won multiple new customer awards and recompetes, introduced new product and service lines within underserved niche markets, and removed fixed overhead from operations, consistent with cost reductions announced earlier this year.”

“Our Aviation, Federal & Defense and Fleet segments each reported sequential revenue growth in the third quarter, as compared to the second quarter, excluding the previously announced divestitures and a non-recurring PPE order from a government customer,” continued Cuomo. “We generated positive free cash flow from operations for the third consecutive quarter, supporting a $10.4 million reduction in our debt outstanding. With more than $190 million in cash and excess availability on our credit facilities, we believe we are well-capitalized to support the growth of the business.”

“While our team is intensely focused on repositioning the business for long-term growth, we’ve continued to execute against near-term performance objectives, as reflected by our strong third quarter results. Fleet segment commercial sales increased by more than 100% on a year-over-year basis in the third quarter, providing further validation for our commercial market expansion strategy, while in the Federal & Defense segment, we won new contracts and recompete awards, supported by increased bidding and business development activities.”

“Within our Aviation segment, the introduction of new product and service lines in niche markets remains an integral part of our long-term organic growth strategy,” continued Cuomo. “We launched a landing gear solution pilot program for global airline and MRO customers earlier this year, and we enhanced this offering with a recently announced five-year exclusive distribution agreement with a leading global manufacturer of landing gear parts and components. The agreement, which is scheduled to commence during the first quarter of 2021, has a total estimated value of approximately $100 million over five years. We look forward to this new partnership and to providing a full solution suite of landing gear products and service solutions for our global customers.”

“Looking ahead to the fourth quarter, we expect to generate sequential revenue growth within our Aviation segment, as continued market share gains and a continued gradual recovery within our business and general aviation markets serve to offset lower repair activity with commercial airline customers,” continued Cuomo. “During a period of market disruption and uncertainty, our aviation customers continue to focus on reducing fixed overhead and working capital requirements. As a trusted, well-capitalized partner with proven global supply chain and MRO solutions, customers are turning to VSE to help them better compete with next-level operating efficiency. Looking forward, our aviation team remains focused on achieving margin expansion and above-market organic growth through targeted share gains.”

“In October, we announced the appointment of two new senior executives to our leadership team,” continued Cuomo. “We are excited to welcome Steve Griffin, our incoming CFO, and Ben Thomas, our new President of the Aviation segment, as they join a world-class team committed to building market-leading positions in both new and existing markets.”

SEGMENT RESULTS

AVIATION
Distribution & MRO Services

VSE’s Aviation segment provides aftermarket MRO and distribution services to commercial, cargo, business and general aviation, military/defense and rotorcraft customers globally. Core services include parts distribution, component and engine accessory MRO services, rotable exchange and supply chain services.

Aviation segment revenue, less contributions from divested Prime Turbines and CT Aerospace businesses, decreased 26% year-over-year to $36.2 million in the third quarter 2020. The year-over-year revenue decline was attributable to the adverse impact of the COVID-19 pandemic on commercial air traffic, resulting in lower customer demand. On a sequential basis, Aviation segment revenue, less contributions from Prime Turbines and CT Aerospace, increased 16.1%, when compared to the second quarter 2020. The Aviation segment recorded operating income of $1.6 million in the third quarter, versus operating income of $6.6 million in the prior-year period. Adjusted EBITDA decreased 75.9% to $2.4 million in the third quarter 2020. On a sequential basis, Aviation segment Adjusted EBITDA increased 102%.

FLEET
Distribution & Fleet Services

VSE's Fleet segment provides parts, inventory management, e-commerce fulfillment, logistics, supply chain support and other services to support the commercial aftermarket medium- and heavy-duty truck market, the United States Postal Service (USPS), and the United States Department of Defense. Core services include parts distribution, sourcing, IT solutions, customized fleet logistics, warehousing, kitting, just-in-time supply chain management, alternative product sourcing, engineering and technical support.

Fleet segment revenue increased 15.1% year-over-year to $63.7 million in the third quarter 2020. Revenues included pass-through sales of approximately $7.1 million for the completion of a non-recurring $26.6 million order for COVID-19 PPE supplies.

Revenues from commercial customers increased approximately $6.5 million or 107.3%, driven by growth in the e-commerce fulfillment business. Operating income declined 16.0% year-over-year to $6.6 million in the third quarter of 2020 due to customer and product mix for the quarter. Fleet segment Adjusted EBITDA decreased 15.0% year-over-year in the third quarter 2020 to $9.0 million.

FEDERAL & DEFENSE
Logistics & Sustainment Services

VSE's Federal & Defense segment provides aftermarket MRO and logistics services to improve operational readiness and to extend the life cycle of military vehicles, ships and aircraft for the U.S. Armed Forces, federal agencies and international defense customers. Core services include base operations support, procurement, supply chain management, vehicle, maritime and aircraft sustainment services, IT services and energy consulting.

Federal & Defense segment revenue declined 21.7% year-over-year to $65.6 million in the third quarter of 2020 primarily due to the completion of a DoD program during the first quarter 2020. Operating income increased 49.1% year-over-year to $6.7 million in the third quarter. Federal & Defense segment Adjusted EBITDA increased 40.6% year-over-year to $7.4 million in the third quarter.

Federal & Defense segment third quarter bookings increased 23.9% year-over-year to $83 million. Funded backlog declined 29.8% year-over-year to $177 million. The decline in funded backlog was attributable to the expiration of a contract in the first quarter 2020 and the delay of new business awards. The Company continues to be focused on revitalizing this business, with an emphasis on growing backlog and developing a channel of new customer activity.

FINANCIAL RESOURCES AND LIQUIDITY

As of September 30, 2020, the Company had $190 million in cash and unused commitment availability under its $350 million revolving credit facility maturing in 2023. The Company’s existing credit facility includes a $100 million accordion provision, subject to customary lender commitment approvals. As of September 30, 2020, VSE had total net debt outstanding of $250 million and $81 million of trailing-twelve months Adjusted EBITDA.

CONFERENCE CALL

A conference call will be held Thursday, October 29, 2020 at 8:30 A.M. ET to review the Company’s financial results, discuss recent events and conduct a question-and-answer session.

A webcast of the conference call and accompanying presentation materials will be available in the Investor Relations section of VSE’s website at https://ir.vsecorp.com. To listen to a live broadcast, go to the site at least 15 minutes prior to the scheduled start time in order to register, download, and install any necessary audio software.

To participate in the live teleconference:

Domestic Live: (877) 407-0789
International Live: (201) 689-8562
Audio Webcast: http://public.viavid.com/index.php?id=141402

To listen to a replay of the teleconference through November 12, 2020:

Domestic Replay: (844) 512-2921
International Replay: (412) 317-6671
Replay PIN Number: 13709168


THIRD QUARTER RESULTS

(in thousands, except per share data)


Three months ended September 30,


Nine months ended September 30,


2020


2019


% Change


2020


2019


% Change

Revenues


$

165,505


$

198,326


(16.5)

%


$

511,638


$

557,356


(8.2)

%

Operating income


$

14,185


$

17,215


(17.6)

%


$

2,009


$

45,444


(95.6)

%

Net income (loss)


$

8,108


$

10,527


(23.0)

%


$

(11,184)


$

27,028


(141.4)

%

EPS (Diluted)


$

0.73


$

0.95


(23.2)

%


$

(1.01)


$

2.45


(141.2)

%

THIRD QUARTER SEGMENT RESULTS

The following is a summary of revenues and operating income (loss) for the three and nine months ended September 30, 2020 and September 30, 2019:

(in thousands)


Three months ended September 30,


Nine months ended September 30,


2020


2019


% Change


2020


2019


% Change

Revenues:


Aviation


$

36,218


$

59,186


(38.8)

%


$

126,519


$

163,553


(22.6)

%

Fleet


63,719


55,369


15.1

%


188,145


160,878


16.9

%

Federal & Defense


65,568


83,771


(21.7)

%


196,974


232,925


(15.4)

%

Total Revenues


$

165,505


$

198,326


(16.5)

%


$

511,638


$

557,356


(8.2)

%


Operating Income (Loss):


Aviation


$

1,586


$

6,568


(75.9)

%


$

(34,680)


$

14,820


(334.0)

%

Fleet


6,589


7,843


(16.0)

%


20,509


22,388


(8.4)

%

Federal & Defense


6,746


4,524


49.1

%


18,441


12,968


42.2

%

Corporate/unallocated expenses


(736)


(1,720)


(57.2)

%


(2,261)


(4,732)


(52.2)

%

Operating Income


$

14,185


$

17,215


(17.6)

%


$

2,009


$

45,444


(95.6)

%


The Company reported $1.1 million and $3.0 million of total capital expenditures for three and nine months ended September 30, 2020, respectively.

NON-GAAP MEASURES

In addition to the financial measures prepared in accordance with generally accepted accounting principles (GAAP), this earnings release also contains Non-GAAP financial measures. The reasons why we believe these measures provide useful information to investors and a reconciliation of these measures to the most directly comparable GAAP measures and other information relating to these Non-GAAP measures are included in the supplemental schedules attached.

NON-GAAP FINANCIAL INFORMATION

Reconciliation of Adjusted Net Income and Adjusted EPS to Net Income (Loss)


(in thousands)


Three months ended September 30,


Nine months ended September 30,


2020


2019


% Change


2020


2019


% Change

Net Income (Loss)


$

8,108


$

10,527


(23.0

)%


$

(11,184

)


$

27,028


(141.4

)%

Adjustments to Net Income (Loss):


Acquisition and CEO Transition Costs


518


%


2,290


%


Earn-out adjustment


(1,695

)


%


(3,095

)


%


Loss on sale of a business entity and certain assets


%


8,214


%


Gain on sale of property


(1,108

)


%


Severance


%


739


%


Goodwill and intangible impairment


%


33,734


%


6,413


11,045


(41.9

)%


27,300


29,318


(6.9

)%


Tax impact of adjusted items


423


(126

)


%


(4,043

)


(533

)


%

Adjusted Net Income


$

6,836


$

10,919


(37.4

)%


$

23,257


$

28,785


(19.2

)%

Weighted Average Dilutive Shares


11,100


11,060


%


11,028


11,036


%

Adjusted EPS (Diluted)


$

0.62


$

0.99


(37.4

)%


$

2.11


$

2.61


(19.2

)%

Reconciliation of Consolidated EBITDA and Adjusted EBITDA to Net Income (Loss)

(in thousands)


Three months ended September 30,


Nine months ended September 30,


2020


2019


% Change


2020


2019


% Change

Net Income (Loss)


$

8,108


$

10,527


(23.0

)%


$

(11,184

)


$

27,028


(141.4

)%


Interest Expense


3,530


3,706


(4.7

)%


10,088


10,262


(1.7

)%


Income Taxes


2,547


2,982


(14.6

)%


3,105


8,154


(61.9

)%


Amortization of Intangible Assets


4,158


5,014


(17.1

)%


13,345


14,985


(10.9

)%


Depreciation and Other Amortization


1,351


1,739


(22.3

)%


4,103


5,637


(27.2

)%

EBITDA


19,694


23,968


(17.8

)%


19,457


66,066


(70.5

)%


Acquisition and CEO transition costs


518


%


2,290


%


Earn-out adjustment


(1,695

)


%


(3,095

)


%


Loss on sale of a business entity and certain assets


%


8,214


%


Gain on sale of property


%


(1,108

)


%


Severance


%


739


%


Goodwill and intangible impairment


%


33,734


%

Adjusted EBITDA


$

17,999


$

24,486


(26.5

)%


$

57,941


$

68,356


(15.2

)%


Reconciliation of Segment EBITDA and Adjusted EBITDA to Operating Income (Loss)

(in thousands)


Three months ended September 30,


Nine months ended September 30,


2020


2019


% Change


2020


2019


% Change

Aviation


Operating Income (Loss)


$

1,586


$

6,568


(75.9

)%


$

(34,680

)


$

14,820


(334.0

)%


Depreciation and Amortization


2,493


3,314


(24.8

)%


8,031


9,733


(17.5

)%

EBITDA


4,079


9,882


(58.7

)%


(26,649

)


24,553


(208.5

)%


Earn-out adjustment


(1,695

)


%


(3,095

)


%


Loss on sale of a business entity and certain assets


%


8,214


%


Gain on sale of property


%


(1,108

)


%


Severance


%


382


%


Goodwill and intangible asset impairment


%


33,734


%

Adjusted EBITDA


$

2,384


$

9,882


(75.9

)%


$

11,478


$

24,553


(53.3

)%


Fleet


Operating Income


$

6,589


$

7,843


(16.0

)%


$

20,509


$

22,388


(8.4

)%


Depreciation and Amortization


2,378


2,711


(12.3

)%


7,622


8,266


(7.8

)%

EBITDA and Adjusted EBITDA


$

8,967


$

10,554


(15.0

)%


$

28,131


$

30,654


(8.2

)%


Federal & Defense


Operating Income


$

6,746


$

4,524


49.1

%


$

18,441


$

12,968


42.2

%


Depreciation and Amortization


638


728


(12.4

)%


2,026


2,356


(14.0

)%

EBITDA


$

7,384


$

5,252


40.6

%


$

20,467


$

15,324


33.6

%


Severance


%


112


%

Adjusted EBITDA


$

7,384


$

5,252


40.6

%


$

20,579


$

15,324


34.3

%

The non-GAAP Financial Information set forth in this document is not calculated in accordance with U.S. generally accepted accounting principles ("GAAP") under SEC Regulation G. We consider Adjusted Net Income, Adjusted EPS (Diluted), EBITDA, Adjusted EBITDA, trailing-twelve months Adjusted EBITDA and free cash flow as non-GAAP financial measures and important indicators of performance and useful metrics for management and investors to evaluate our business' ongoing operating performance on a consistent basis across reporting periods. These non-GAAP financial measures, however, should not be considered in isolation or as a substitute for performance measures prepared in accordance with GAAP. Adjusted Net Income represents Net Income adjusted for executive succession costs, 1st Choice Aerospace acquisition-related costs including any earn-out adjustments, loss on sale of a business entity and certain assets, gain on sale of property, and related tax impact. Adjusted EPS (Diluted) is computed by dividing net income, adjusted for the discrete items as identified above and the related tax impacts, by the diluted weighted average number of common shares outstanding. EBITDA represents net income before interest expense, income taxes, amortization of intangible assets and depreciation and other amortization. Adjusted EBITDA represents EBITDA (as defined above) adjusted for discrete items as identified above, and trailing-twelve months Adjusted EBITDA is defined as Adjusted EBITDA for the most recent twelve (12) month period ending September 30, 2020. Free cash flow represents operating cash flow less capital expenditures.

ABOUT VSE CORPORATION

VSE is a leading provider of aftermarket distribution and repair services for land, sea and air transportation assets for government and commercial markets. Core services include maintenance, repair and overhaul (MRO) services, parts distribution, supply chain management and logistics, engineering support, and consulting and training services for global commercial, federal, military and defense customers. VSE also provides information technology and energy consulting services. For additional information regarding VSE’s services and products, visit us at www.vsecorp.com.

Please refer to the Form 10-Q that will be filed with the Securities and Exchange Commission (SEC) on or about September 30, 2020 for more details on our third quarter 2020 results. Also, refer to VSE’s Annual Report on Form 10-K for the year ended December 31, 2019 for further information and analysis of VSE’s financial condition and results of operations. VSE encourages investors and others to review the detailed reporting and disclosures contained in VSE’s public filings for additional discussion about the status of customer programs and contract awards, risks, revenue sources and funding, dependence on material customers, and management’s discussion of short- and long-term business challenges and opportunities.

FORWARD LOOKING STATEMENTS

This document contains certain forward-looking statements. These forward-looking statements, which are included in accordance with the safe harbor provisions of the Private Securities Litigation Reform Act of 1995, may involve known and unknown risks, uncertainties and other factors that may cause VSE’s actual results and performance in future periods to be materially different from any future results or performance suggested by the forward-looking statements in this document.


Contacts

INVESTOR CONTACT
Noel Ryan
(720) 778-2415
This email address is being protected from spambots. You need JavaScript enabled to view it.


Read full story here

HOUSTON--(BUSINESS WIRE)--Enterprise Products Partners L.P. (“Enterprise”) (NYSE: EPD) today announced its financial results for the three months ended September 30, 2020.


Third Quarter 2020 Highlights


Three Months Ended
September 30,

($ in millions, except per unit amounts)

2020

2019

Operating income

$

1,383

$

1,474

Net income (1)

$

1,084

$

1,045

Fully diluted earnings per unit (1)

$

0.48

$

0.46

Cash flow from operations (2)

$

1,098

$

1,643

Total gross operating margin (3)

$

1,993

$

2,036

Adjusted EBITDA (3)

$

2,060

$

2,023

Free cash flow (2)(3)

$

430

$

1,025

Distributable cash flow (3)

$

1,647

$

1,640

(1)

Net income and fully diluted earnings per unit for the third quarters of 2020 and 2019 included non-cash asset impairment and related charges of approximately $77 million, or $0.03 per unit, and $40 million, or $0.02 per unit, respectively. For the nine months ended September 30, 2020 and 2019, net income and fully diluted earnings per unit included $90 million, or $0.04 per unit, and $51 million, or $0.02 per unit, respectively, of non-cash asset impairment and related charges.

(2)

Net cash flow provided by operating activities, or cash flow from operations (“CFFO”), and free cash flow (“FCF”) include the impact of the timing of cash receipts and payments related to operations as well as changes in working capital in connection with our marketing activities. The net effect of changes in operating accounts, which are a component of CFFO and FCF, was a decrease of $603 million in the third quarter of 2020 compared to a decrease of $77 million in the third quarter of 2019.

(3)

Total gross operating margin, adjusted earnings before interest, taxes, depreciation and amortization (“Adjusted EBITDA”), FCF and distributable cash flow (“DCF”) are non-generally accepted accounting principle (“non-GAAP”) financial measures that are defined and reconciled later in this press release.

  • Gross operating margin, operating income and net income attributable to common unitholders for the third quarter of 2020 included $38 million of non-cash, mark-to-market net losses on financial instruments used in our hedging activities, compared to $86 million of non-cash, mark-to-market net losses on such instruments for the third quarter of 2019.
  • Enterprise declared a $0.445 per common unit cash distribution with respect to the third quarter of 2020, which represents a 0.6 percent increase compared to the distribution paid for the third quarter of 2019. The cash distribution will be paid November 12, 2020 to common unitholders of record as of the close of business on October 30, 2020.
  • Enterprise reported DCF of $1.6 billion for the third quarter of 2020, which provided 1.7 times coverage of the $0.445 per common unit cash distribution and resulted in $669 million of retained DCF. DCF for the first nine months of 2020 was $4.8 billion, which provided 1.6 times coverage of the aggregate $1.335 per common unit of cash distributions for that period and resulted in $1.8 billion of retained DCF.
  • CFFO was $1.1 billion for the third quarter of 2020, compared to $1.6 billion for the third quarter of 2019. The net effect of changes in operating accounts, including amounts used for working capital related to marketing activities, is responsible for substantially all of the decrease in CFFO between the two periods. FCF for the third quarter of 2020 and twelve months ended September 30, 2020 was $430 million and $2.1 billion, respectively. The net effect of changes in operating accounts reduced FCF by $603 million and $740 million for the third quarter of 2020 and twelve months ended September 30, 2020, respectively.
  • Total capital investments, including sustaining capital, were $705 million in the third quarter of 2020 and $2.7 billion for the first nine months of 2020. Included in these investments were sustaining capital expenditures of $83 million in the third quarter of 2020 and $226 million in the first nine months of 2020.

Third Quarter 2020 Volume Highlights


Three Months Ended
September 30,


2020

2019

NGL, crude oil, refined products & petrochemical pipeline volumes (million BPD)


6.0


6.6

Marine terminal volumes (million BPD)

1.5

1.9

Natural gas pipeline volumes (TBtus/d)

13.1

14.5

NGL fractionation volumes (million BPD)

1.4

1.0

Propylene plant production volumes (MBPD)

83

105

Fee-based natural gas processing volumes (Bcf/d)

4.1

4.7

Equity NGL production volumes (MBPD)

141

111


As used in this press release, “NGL” means natural gas liquids, “BPD” means barrels per day, “MBPD” means thousand barrels per day, “MMcf/d” means million cubic feet per day, “Bcf/d” means billion cubic feet per day, “BBtus/d” means billion British thermal units per day and “TBtus/d” means trillion British thermal units per day.

“Enterprise’s integrated and diversified midstream energy system generated solid operational and financial results despite another challenging quarter for the U.S. energy industry,” said A. J. “Jim” Teague, co-chief executive officer of Enterprise’s general partner. “Similar to the second quarter of 2020, our fee-based businesses, storage assets, marketing activities and cost control efforts led to distributable cash flow of $1.6 billion and provided 1.7 times coverage of our distribution to common unitholders. We also benefitted from cash flows associated with the completion of two NGL fractionators that began service during 2020. Volumetric highlights for the third quarter of 2020 include total equivalent pipeline volumes of approximately 9.5 million BPD, record NGL fractionation volumes of 1.4 million BPD and NGL marine terminal export volumes of 643 MBPD.”

“In comparing the third quarter of 2020 to the third quarter of last year, we generated approximately $2 billion of gross operating margin in both quarters. The performance of our marketing, storage, NGL fractionation, NGL pipeline, petrochemical pipeline and Permian gathering and processing businesses largely offset the impact of lower margins, volumes and earnings from our natural gas gathering and processing assets in the Rockies, South Texas and the Haynesville and our crude oil pipelines and marine terminal. Notably, our petrochemical services segment reported a $124 million sequential improvement from the challenging second quarter of 2020,” stated Teague.

“During the third quarter of 2020, our commercial team responded to customer requests and changing industry dynamics to amend certain agreements that enabled us to increase volumetric commitments over the long-term by utilizing existing pipeline capacity and to cancel the Midland-to-ECHO 4 crude oil pipeline. This action resulted in an $800 million reduction to capital expenditures over the next two years. This was another example of Enterprise working with customers for a ‘win/win’ deal that enabled both Enterprise and our customers to better allocate capital during the current economic cycle while retaining long-term, fee-based volumes and revenues for our assets. In total, we have reduced our planned growth capital expenditures for 2020 and 2021 by approximately $1.5 billion in response to changing industry conditions. We have also focused on cost control. For the first nine months of this year, Enterprise’s operating costs are $260 million below budget and total sustaining capital expenditures for 2020 are expected to be $100 million lower than our original budget. We were able to manage these costs lower without sacrificing safety or operational integrity and reliability,” continued Teague.

“The global economy is in the early stages of reopening from a self-imposed sudden stop due to COVID-19. The pace of the recovery varies country by country, community by community and business by business. The current resurgence of the pandemic may temporarily affect this progress in some regions. The development of vaccines and therapeutic treatments are progressing rapidly. Even though the pace of the pandemic and the economic recovery is still very uncertain, the economic recovery is leading to a remarkable rebound in the demand for energy and energy products from the lows of the second quarter of 2020. Additionally, with the world still adding a billion people every 12 years (the world population is currently 7.8 billion and counting) and populations in developing countries wanting access to cleaner and more convenient sources of energy, we believe demand for reliable U.S. energy, petrochemicals and related products will continue to recover and resume long-term growth,” continued Teague.

“This recovery in demand will also ultimately result in a price signal for crude oil. Given the combination of the record retrenchment in drilling and completion activities by U.S. producers, refocused capital allocation and the effects of steep decline curves resulting in a decrease in shale production, we believe this price signal for higher crude oil prices could occur as early as the second half of next year. In the interim, we believe the midstream industry will be challenged in its producer-facing businesses. The challenges and opportunities will be different for each producing basin. Enterprise is well positioned for the challenges and opportunities that come in this type of environment. We believe our integrated, diversified and fee-based business model, along with our strong balance sheet and financial flexibility will enable us to successfully traverse this period. Enterprise’s most important assets during these times are our employees, their work ethic and their ingenuity. We especially appreciate their resilience in managing through the challenges of 2020,” said Teague.

Review of Third Quarter 2020 Results

Enterprise reported total gross operating margin of $2.0 billion for both the third quarters of 2020 and 2019. Below is a detailed review of each business segment’s quarterly performance.

NGL Pipelines & Services – Gross operating margin from the NGL Pipelines & Services segment was $1.0 billion for both the third quarters of 2020 and 2019.

Enterprise’s natural gas processing and related NGL marketing business reported gross operating margin of $257 million for the third quarter of 2020 compared to $288 million of gross operating margin for the third quarter of 2019. Enterprise’s natural gas processing plants in South Texas, the Rockies, Louisiana and Mississippi reported a $54 million decrease in gross operating margin for the third quarter of 2020 compared to the third quarter of last year, primarily attributable to lower volumes and processing margins, including a $28 million loss related to hedging activities. Certain plants in Louisiana and Mississippi were impacted by lower Gulf of Mexico production as a result of shut-ins associated with Hurricane Laura. The partnership’s natural gas processing plants serving the Permian Basin reported a $5 million increase in gross operating margin for the third quarter of 2020 compared to the third quarter of 2019, primarily attributable to a 345 MMcf/d increase in fee-based volumes including the Mentone plant, which began operations in December 2019. Total fee-based processing volumes were 4.1 Bcf/d in the third quarter of 2020 compared to 4.7 Bcf/d in the third quarter of 2019. Equity NGL production increased 27 percent to 141 MBPD in the third quarter of 2020 from 111 MBPD in the same quarter of 2019.

Gross operating margin from NGL marketing activities increased $17 million, primarily due to a $36 million increase from higher sales volumes, partially offset by an $8 million decrease from lower average sales margins and an $11 million decrease due to non-cash mark-to-market activity. NGL marketing activities this quarter benefited from the utilization of uncontracted storage capacity.

Gross operating margin from the partnership’s NGL pipelines and storage business for the third quarter of 2020 was $603 million, an increase of $10 million compared to the third quarter of 2019. NGL pipeline transportation volumes decreased by 111 MBPD to 3.4 million BPD in the third quarter of 2020. NGL marine terminal volumes increased 7 percent to 643 MBPD in the third quarter of 2020 from 602 MBPD reported for the third quarter of 2019.

The partnership’s Western NGL pipelines that serve the Permian, DJ Basin, and Rocky Mountain producers, which include the Mid-America Pipeline System, Seminole pipeline, Chaparral System, Shin Oak Pipeline, and the Texas Express and Front Range pipelines, on a combined basis had an $11 million increase in gross operating margin, primarily due to higher average transportation fees and lower operating costs. This was partially offset by a combined 43 MBPD decrease in transportation volumes.

Gross operating margin from the Enterprise Hydrocarbons Terminal (“EHT”) and related Channel Pipeline increased $8 million, primarily due to a 45 MBPD increase in liquefied petroleum gas (“LPG”) marine terminal export volumes and a 39 MBPD increase in transportation volumes on the related Channel Pipeline. The partnership completed an expansion of its LPG loading facilities at EHT in the third quarter of 2019.

Gross operating margin for the third quarter of 2020 attributable to the Dixie, South Louisiana NGL and Lou-Tex NGL pipelines decreased by a combined $11 million compared to the same quarter in 2019 on a 154 MBPD decrease in volumes partially attributable to the effects of Hurricane Laura related to shut-ins of Gulf of Mexico production as well as power outages at certain pump stations.

Enterprise’s NGL fractionation business reported gross operating margin of $168 million for the third quarter of 2020 compared to $127 million for the third quarter of 2019. Enterprise’s NGL fractionation business reported a record 1.4 million BPD of fractionation volumes in the third quarter of 2020. This increase was primarily attributable to NGL fractionators in the Mont Belvieu-area, including the partnership’s tenth and eleventh NGL fractionators that were put into service in March and September of 2020, respectively.

Crude Oil Pipelines & Services – Gross operating margin from the Crude Oil Pipelines & Services segment was $482 million for the third quarter of 2020 compared to $496 million for the third quarter of 2019. Gross operating margin for both the third quarters of 2020 and 2019 included $10 million of non-cash, mark-to-market gains related to hedging activities. Total crude oil pipeline transportation volumes were 1.7 million BPD for the third quarter of 2020 compared to 2.3 million BPD for the third quarter of 2019. Total crude oil marine terminal volumes were 662 MBPD for the third quarter of 2020 compared to 987 MBPD for the third quarter of 2019.

Gross operating margin from Enterprise’s Midland-to-ECHO Pipeline System and related activities for the third quarter of 2020 decreased a net $41 million versus the third quarter in 2019, primarily due to a $43 million decrease attributable to related marketing and hedging activities. Total system transportation volumes decreased 53 MBPD, or 8 percent, net to our interest, when compared to the third quarter of 2019.

Gross operating margin from the South Texas Crude Oil Pipeline System was down $16 million in the third quarter of 2020 compared to the same quarter in 2019, due to lower transportation volumes of 83 MBPD. The partnership’s equity investment in the Eagle Ford Crude Oil Pipeline decreased $9 million, also due to lower transportation volumes of 44 MBPD. Enterprise’s share of gross operating margin associated with Seaway Pipeline decreased $18 million, primarily due to lower average transportation fees and volumes. Transportation and marine volumes on the Seaway Pipeline decreased 269 MBPD and 75 MBPD, respectively, on a net basis.

Gross operating margin from crude oil export activities at EHT on the Houston Ship Channel decreased $14 million, primarily due to lower deficiency fees and volumes. Partially offsetting this decrease is a $12 million increase in gross operating margin from higher storage and other revenues, and lower operating costs. Export volumes decreased by a net 183 MBPD.

Gross operating margin from other crude oil marketing activities increased $92 million, primarily due to higher average sales margins, including an $11 million benefit from non-cash, mark-to-market activities.

Natural Gas Pipelines & Services – Gross operating margin from the Natural Gas Pipelines & Services segment was $208 million for the third quarter of 2020 compared to $259 million for the third quarter of 2019. Total natural gas transportation volumes were 13.1 TBtus/d this quarter compared to 14.5 TBtus/d for the third quarter of last year.

Gross operating margin from Enterprise’s natural gas marketing business decreased $35 million, primarily due to lower average sales margins, including a $22 million decrease from non-cash, mark-to-market activities. Sales margins were impacted by lower regional natural gas price spreads across Texas, which were indicatively $0.72 per MMBtu in the third quarter of 2020 versus $1.36 per MMBtu in the third quarter of 2019.

Gross operating margin from the Acadian Gas System for the third quarter of 2020 decreased $19 million, primarily due to $17 million of benefits from settlements received in the third quarter of 2019, and decreased reservation fees on the Haynesville Extension Pipeline. Transportation volumes on the Acadian Pipeline System decreased 302 BBtus/d, or approximately 11 percent.

Enterprise’s Permian Basin Gathering System reported a $9 million increase in gross operating margin for the third quarter of 2020 compared to the same quarter in 2019, primarily due to a 432 BBtus/d increase in gathering volumes, higher condensate sales volumes and lower maintenance expenses.

Gross operating margin from the partnership’s largest natural gas pipeline, the Texas Intrastate System decreased $2 million this quarter compared to the third quarter of last year, primarily due to lower capacity reservation fees and a 276 BBtus/d reduction in transportation volumes, partially offset by lower maintenance costs. Natural gas pipeline volumes for this system were 4.4 TBtus/d in the third quarter of 2020 compared to 4.7 TBtus/d in the third quarter of 2019.

Petrochemical & Refined Products Services – Gross operating margin for the Petrochemical & Refined Products Services segment increased 9 percent to $315 million for the third quarter of 2020 from $288 million for the third quarter of 2019. Gross operating margin for the third quarters of 2020 and 2019 included non-cash, mark-to-market losses of $21 million and $1 million, respectively. Total segment pipeline transportation volumes increased 13 percent to 844 MBPD for the third quarter of this year from 747 MBPD for the third quarter of last year.

The partnership’s propylene production and related businesses reported gross operating margin of $133 million for the third quarter of 2020, a $2 million increase, compared to the same quarter of 2019. Gross operating margin associated with propylene production facilities decreased by a combined $4 million compared to the third quarter of last year. This was more than offset by higher gross operating margin from our propylene marine export terminal and certain propylene pipelines. Total propylene production volumes were 83 MBPD for the third quarter of 2020 compared to 105 MBPD for the third quarter of 2019.

Enterprise’s refined products pipeline and related activities reported a $27 million increase in gross operating margin for the third quarter of 2020 compared to the same quarter in 2019, primarily due to a $31 million increase in gross operating margin from refined products marketing largely attributable to storage optimization activities. The partnership’s TE Products Pipeline System had an $8 million decrease in gross operating margin.

Gross operating margin from ethylene exports, pipelines, and related services increased $14 million this quarter compared to the third quarter of 2019. The partnership’s ethylene export terminal, which was placed into partial service in December 2019, had gross operating margin of $9 million in the third quarter of 2020. Loading volumes for the third quarter were 15 MBPD net to our 50 percent interest at the terminal.

Gross operating margin from Enterprise’s octane enhancement and related operations for the third quarter of 2020 decreased $15 million as a result of lower average sales margins and higher operating expenses.

Capitalization

Total debt principal outstanding at September 30, 2020 was $30.1 billion, including $2.6 billion of junior subordinated notes to which the nationally recognized debt rating agencies ascribe partial equity content. At September 30, 2020, Enterprise had consolidated liquidity of approximately $6.0 billion, which was comprised of $5.0 billion of available borrowing capacity under our revolving credit facilities and $1.0 billion of unrestricted cash on hand.

Total capital investments for the third quarter of 2020 were $705 million, which included $83 million of sustaining capital expenditures. For the first nine months of 2020, Enterprise’s capital investments totaled $2.7 billion, which included $226 million of sustaining capital expenditures. We currently expect our growth capital investments for 2020 to approximate $2.9 billion, net of cash contributions from noncontrolling interests. Sustaining capital expenditures for 2020 are currently estimated to be approximately $300 million. For 2021 and 2022, we currently expect growth capital investments on sanctioned projects to be approximately $1.6 billion and $800 million, respectively. These estimates do not include capital investments associated with the partnership’s proposed deep water offshore crude oil terminal (“SPOT”), which remains subject to governmental approval.

Conference Call to Discuss Third Quarter 2020 Earnings

Today, Enterprise will host a conference call to discuss third quarter 2020 earnings. The call will be broadcast live over the Internet beginning at 9:00 a.m. CT and may be accessed by visiting the partnership’s website at www.enterpriseproducts.com.

Use of Non-GAAP Financial Measures

This press release and accompanying schedules include the non-GAAP financial measures of total gross operating margin, FCF, DCF and Adjusted EBITDA. The accompanying schedules provide definitions of these non-GAAP financial measures and reconciliations to their most directly comparable financial measure calculated and presented in accordance with GAAP. Our non-GAAP financial measures should not be considered as alternatives to GAAP measures such as net income, operating income, net cash flow provided by operating activities or any other measure of financial performance calculated and presented in accordance with GAAP. Our non-GAAP financial measures may not be comparable to similarly-titled measures of other companies because they may not calculate such measures in the same manner as we do.

Company Information and Use of Forward-Looking Statements

Enterprise Products Partners L.P. is one of the largest publicly traded partnerships and a leading North American provider of midstream energy services to producers and consumers of natural gas, NGLs, crude oil, refined products and petrochemicals. Our services include: natural gas gathering, treating, processing, transportation and storage; NGL transportation, fractionation, storage and export and import terminals; crude oil gathering, transportation, storage and export and import terminals; petrochemical and refined products transportation, storage, export and import terminals and related services; and a marine transportation business that operates primarily on the United States inland and Intracoastal Waterway systems.


Contacts

Randy Burkhalter, Vice President, Investor Relations, (713) 381-6812
Rick Rainey, Vice President, Media Relations, (713) 381-3635


Read full story here

IRVING, Texas--(BUSINESS WIRE)--The Board of Directors of Exxon Mobil Corporation (NYSE:XOM) today declared a cash dividend of $0.87 cents per share on the Common Stock, payable on December 10, 2020 to shareholders of record of Common Stock at the close of business on November 12, 2020.


This fourth quarter dividend is at the same level as the dividend paid in the third quarter of 2020.

Through its dividends, the corporation has shared its success with its shareholders for more than 100 years.


Contacts

Media Relations
972-940-6007

  • Babcock & Wilcox Construction Co., LLC provides single-source, in-depth expertise for baseload power generation across North America

AKRON, Ohio--(BUSINESS WIRE)--$BW--Babcock & Wilcox (B&W) (NYSE: BW) announced today that its B&W Thermal segment will perform boiler maintenance and refurbish a bottom ash system for a power plant in North America. The contract is valued at more than $7 million and was awarded to B&W’s subsidiary, Babcock & Wilcox Construction Co., LLC (BWCC).


The work is scheduled for the spring of 2021. The project scope includes boiler and auxiliary equipment repairs, maintenance work and outage support for the plant.

“As an important part of B&W Thermal’s product and service offerings, BWCC is a single-source turnkey supplier of a full range of field construction, construction management, installation, refurbishment and maintenance services,” said B&W Chief Operating Officer Jimmy Morgan. “BWCC’s network of regional service centers and extensive experience with a wide range of projects allows us to respond quickly to customers’ needs and provide safe, reliable solutions at any facility.”

B&W Thermal offers a comprehensive suite of equipment and solutions to keep the power fleet running reliably and efficiently. With more than 150 years’ experience in the power industry, B&W Thermal is one of the few U.S. companies with the technical capabilities needed to service thermal plants, boilers and emissions control equipment, no matter what type of challenges customers may face.

About B&W

Headquartered in Akron, Ohio, B&W is a global leader in energy and environmental technologies and services for the power and industrial markets. Follow B&W on LinkedIn and learn more at www.babcock.com.

About B&W Thermal

Babcock & Wilcox Thermal designs, manufactures and erects steam generation equipment, aftermarket parts, construction, maintenance and field services for plants in the power generation, oil & gas, and industrial sectors. B&W Thermal has an extensive global base of installed equipment for utilities and general industrial applications including refining, petrochemical, food processing, metals and more.

Forward-Looking Statements

B&W cautions that this release contains forward-looking statements, including, without limitation, statements relating to the execution and completion of a contract to perform boiler maintenance and refurbish a bottom ash system for a power plant in North America. These forward-looking statements are based on management’s current expectations and involve a number of risks and uncertainties. For a more complete discussion of these risk factors, see our filings with the Securities and Exchange Commission, including our most recent annual report on Form 10-K. If one or more of these risks or other risks materialize, actual results may vary materially from those expressed. We caution readers not to place undue reliance on these forward-looking statements, which speak only as of the date of this release, and we undertake no obligation to update or revise any forward-looking statement, except to the extent required by applicable law.


Contacts

Investor:
Megan Wilson
Vice President, Corporate Development & Investor Relations
Babcock & Wilcox
704.625.4944 | This email address is being protected from spambots. You need JavaScript enabled to view it.

Media:
Ryan Cornell
Public Relations
Babcock & Wilcox
330.860.1345 | This email address is being protected from spambots. You need JavaScript enabled to view it.

Patrols and Inspections Confirm at Least 76 Instances of Damage or Hazards to Electric Equipment During the Severe Offshore Wind Event Beginning Sunday Oct. 25

PG&E Has Restored Power to Essentially All Customers Affected by the Oct. 25 PSPS

SAN FRANCISCO--(BUSINESS WIRE)--Pacific Gas and Electric Company (PG&E) has restored power to essentially all customers who can receive service that were impacted by the Public Safety Power Shutoff (PSPS) event that began Sunday morning, Oct. 25.

The PSPS event affected approximately 345,000 customers in targeted portions of 34 counties: Alameda, Alpine, Amador, Butte, Calaveras, Colusa, Contra Costa, El Dorado, Fresno, Glenn, Humboldt, Lake, Madera, Marin, Mariposa, Mendocino, Napa, Nevada, Placer, Plumas, San Mateo, Santa Clara, Santa Cruz, Shasta, Sierra, Siskiyou, Solano, Sonoma, Stanislaus, Tehama, Trinity, Tuolumne, Yolo and Yuba. Customers in 17 tribal land communities were also affected.

The weather “all clear” was given for all customers affected by this PSPS event on early Tuesday afternoon, Oct. 27. PG&E crews began patrols on the ground as early as Monday morning in areas where it was safe to do so, and continued patrols into Wednesday to inspect more than 17,000 miles of transmission and distribution lines for damage or hazards. The patrol and inspection efforts include nearly 1,800 ground patrol units, 65 helicopters and one airplane.

PG&E crews began restoring customers in areas where they found no damage or hazards to electrical equipment. In areas where equipment was damaged by the severe wind event, crews worked safely and as quickly as possible to make the repairs and restore those customers.

“We know these power shutoffs are a hardship for our customers, and we greatly appreciate their patience as we worked safely and quickly to restore service. Amid historic weather conditions and the strongest winds of the wildfire season so far, we aimed to minimize the scope and length of the event. Our most important responsibility has been to keep customers and communities safe,” said Michael Lewis, PG&E’s Interim President.

Damage and Hazards Identified

Preliminary data shows at least 76 instances of weather-related damage and hazards in the PSPS-affected areas. Examples include downed lines and vegetation on power lines. If PG&E had not de-energized power lines, these types of damage could have caused wildfire ignitions.

More Information on PG&E PSPS Events

PG&E’s goal is to have essentially all customers affected by the PSPS who can receive power restored within 12 daylight hours of the weather “all clear” for each affected area.

PG&E uses a PSPS only as the last resort to protect community and customer safety against wildfires, given dry and windy weather, dry vegetation and an elevated fire risk across portions of its service area. Wind gusts as high as 89 mph were recorded during this PSPS event.

PG&E will submit a report detailing damage from the severe weather conditions to the California Public Utilities Commission within 10 days of the completion of the PSPS.

For more information on the PSPS event, visit pge.com/pspsupdates.

Prevention, Preparedness and Support

It is important that PG&E has your current contact information so you can be notified and be better prepared if a wildfire or PSPS event may impact your home or business. To set up your alerts, visit pge.com/alerts.

With the increased wildfire threat our state faces, PG&E is enhancing and expanding our efforts to reduce wildfire risks and keep our customers and communities safe. Our Community Wildfire Safety Program includes short, medium and long-term plans to make our system safer. For tips on how to prepare for emergencies and outages, visit our Safety Action Center at safetyactioncenter.pge.com.

About PG&E

Pacific Gas and Electric Company, a subsidiary of PG&E Corporation (NYSE:PCG), is one of the largest combined natural gas and electric energy companies in the United States. Based in San Francisco, with more than 23,000 employees, the company delivers some of the nation's cleanest energy to 16 million people in Northern and Central California. For more information, visit pge.com and pge.com/news.


Contacts

MEDIA RELATIONS:
415-973-5930

  • Second quarter sales of $28 million yielded $0.27 earnings per share
  • Orders were $35.0 million in the quarter; Backlog improved sequentially to $114.9 million
  • Revenue guidance increased to $93 million to $97 million and gross margin expectation improved to 21% to 23%

BATAVIA, N.Y.--(BUSINESS WIRE)--Graham Corporation (NYSE: GHM), a global business that designs, manufactures and sells critical equipment for the oil refining, petrochemical and defense industries, today reported financial results for its second quarter ended September 30, 2020. Graham’s current fiscal year ends March 31, 2021 (“fiscal 2021”).


James R. Lines, Graham’s President and Chief Executive Officer, commented, “Results in the second quarter benefited from strong defense industry sales, including a materials only order. We also had the benefit of improved efficiencies in both our supply chain and our production facilities which enabled us to accelerate conversion of both large and short cycle orders in the quarter. As a result, higher volume drove operating leverage which is inherent in our business model.”

Mr. Lines continued, “We had strong orders in the quarter of $35 million. This order level was driven by our strategy to further our geographic market reach and diversify our end markets, which includes increasing our participation in the defense industry. We remain confident in our ability to achieve the long-term goal of significantly growing our business organically, as well as continuing to consider acquisition opportunities.”

Second Quarter Fiscal 2021 Sales Summary (Compared with the prior-year period unless noted otherwise. See accompanying financial tables for a breakdown of sales by industry and region)

Net sales were $28.0 million compared with $21.6 million in the second quarter of fiscal 2020. The strong increase in sales reflects Graham’s strategy to increase its defense business sales with the U.S. Navy and sales to previously underserved markets.

Sales to the defense markets were up $6.8 million to $9.4 million compared with the prior year period and represented 34% of total sales. Sales to the chemical/petrochemical market were $5.5 million compared with $10.5 million in the prior year. Sales to the refining market increased $4.0 million to $10.3 million and sales to other commercial markets increased $0.6 million to $2.8 million.

From a geographic perspective, domestic sales were 62% of total sales compared with 73% in the second quarter of fiscal 2020. International sales were 38% of total sales, compared with 27% in the prior-year period.

Fluctuations in Graham’s sales among geographic locations and industries can vary measurably from quarter-to-quarter based on the timing and magnitude of projects. Graham does not believe that such quarter-to-quarter fluctuations are indicative of business trends, which it believes are more apparent on a trailing twelve-month basis.

Second Quarter Fiscal 2021 Performance Review*(Compared with the prior-year period unless noted otherwise)

 
($ in millions except per share data)

Q2 FY21


Q2 FY20


Change

Net sales

$

28.0


$

21.6


$

6.4

Gross profit

$

7.7


$

4.9


$

2.8

Gross margin


27.5

%


22.9

%

Operating profit

$

3.4


$

1.1


$

2.3

Operating margin


12.3

%


5.1

%

Net income

$

2.7


$

1.2


$

1.5

Diluted EPS

$

0.27


$

0.12


EBITDA

$

4.0


$

1.7


$

2.3

EBITDA margin


14.2

%


7.8

%

*Graham believes that EBITDA (defined as consolidated net income before net interest income, income taxes, depreciation, and amortization), and EBITDA margin (EBITDA as a percentage of sales), which are non-GAAP measures, help in the understanding of its operating performance. Moreover, Graham’s credit facility also contains ratios based on EBITDA. See the attached table on page 10 for additional important disclosures regarding Graham’s use of EBITDA and EBITDA margin as well as the reconciliation of net income to EBITDA.

Gross margin expanded 460 basis points to 27.5% driven by higher volume level as well as favorable mix of projects.

Selling, general and administrative (“SG&A”) expenses, were $4.3 million, up $0.4 million, or 11%, compared with the prior-year period. SG&A, as a percent of sales for the three-month periods ended September 30, 2020 and 2019 were 15.2% and 17.8%, respectively.

Operating profit was $3.4 million, up from $1.1 million last year. Net income was $2.7 million, or $0.27 per share compared with $1.2 million or $0.12 per share last year.

EBITDA margin expanded 640 basis points on higher volume and lower relative operating expenses.

First Half Fiscal 2021 Performance Review (Compared with the prior-year period unless noted otherwise)

 
($ in millions except per share data) YTD FY21 YTD FY20 Change
Net sales

$

44.7


$

42.2


$

2.5


Gross profit

$

9.3


$

9.7


$

(0.4

)

Gross margin


20.7

%


22.9

%

Operating profit

$

1.1


$

0.7


$

0.4


Operating margin


2.5

%


1.7

%

Net income

$

0.9


$

1.3


$

(0.4

)

Diluted EPS

$

0.09


$

0.13


EBITDA

$

2.2


$

1.9


$

0.3


EBITDA margin


4.9

%


4.5

%

International sales were $18.0 million and represented 40% of total sales, compared with $12.1 million, or 29%, of sales in the same prior-year period. Sales to the U.S. were $26.7 million, or 60%, of first half net sales in fiscal 2021, compared with $30.1 million, or 71%, of fiscal 2020 first half net sales.

Gross profit and margin were down compared with the prior-year period primarily as a result of production capability being significantly reduced in the first quarter fiscal 2021 due to the COVID-19 pandemic. Production during that period was at approximately 50% of normal production.

SG&A was $8.2 million, down 3%, or $0.2 million. As a percent of sales, SG&A was 18% in the quarter down from 20% in the same prior-year period. Included in the first half of 2020 was $0.6 million of SG&A for our divested commercial nuclear utility business

The effective tax rate was 30% compared with 22% in the prior-year period. The higher six-month tax rate in fiscal 2021 was due to the loss incurred in the first quarter.

Strong Balance Sheet with Ample Liquidity

Cash, cash equivalents and investments at September 30, 2020 decreased $5.1 million to $67.9 million from March 31, 2020.

Net cash used by operating activities for the first half of fiscal 2021 was $2.3 million, compared with $1.9 million of cash used for the first half of fiscal 2020. In the most recent quarter, cash used by operating activities was principally due to timing of accounts receivable and accounts payable.

Capital spending was $0.5 million in the second quarter of fiscal 2021 and was $0.8 million year-to-date. The Company expects capital expenditures for fiscal 2021 to be between $2.0 million and $2.5 million, of which 80% to 85% is expected to be for machinery and equipment and the remainder to be used for other items.

As of September 30, 2020, Graham had no debt.

Orders and Backlog

Orders for the quarter increased $2.4 million to $35.0 million. Defense orders increased $11.1 million to $12.6 million in the second quarter of fiscal 2021 more than offsetting the estimated impact the COVID-19 pandemic had on capital spending decisions by Graham’s historic refining and petrochemical customers, primarily in North America, during the quarter. Chemical and petrochemical orders were $3.3 million, compared with $6.2 million in the prior-year period. Refining orders were $16.8 million in the current quarter, compared with $22.6 million in the second quarter of fiscal 2020. The company believes that the pipeline of available opportunities in the defense industry remains strong, and that the timing of orders in this industry can be variable.

Domestic orders were 46% of total net orders in the second quarter of fiscal 2021 and were 33% in the same prior-year period.

Backlog at the end of the second quarter of fiscal 2021 was $114.9, an increase of $7.7 million from June 30, 2020. The increase reflects previously announced orders placed in the second quarter valued at $28.5 million.

Backlog by industry at September 30, 2020 was approximately:

  • 50% for U.S. Navy projects
  • 37% for refinery projects
  • 9% for chemical/petrochemical projects
  • 4% for other industrial applications

The Company expects 60% to 65% of backlog to convert to revenue within the next 12 months.

Increasing Fiscal 2021 Guidance

Mr. Lines concluded, “Nearly all of our expected second half revenue this year is already in backlog, giving us solid confidence to increase guidance for fiscal 2021. Orders in the second quarter add to fiscal 2022 revenue potential. The strength of revenue next fiscal year will depend upon orders during the next three quarters.”

Graham is increasing revenue guidance for fiscal 2021 while raising expectations for gross margin and tightening the range for SG&A expense. This guidance is based on the assumption that Graham is able to operate its production facility at full capacity, has access to its global supply chain including its subcontractors, and experiences minimal or no additional COVID-19 related disruptions or any other unforeseen events.

  • Revenue between $93 million and $97 million
  • Gross margin between 21% and 23%
  • SG&A expense between $17.0 million and $17.5 million
  • Effective tax rate of approximately 22%

Webcast and Conference Call

Graham’s management will host a conference call and live webcast today at 11:00 a.m. Eastern Time to review its financial condition and operating results for the second quarter of fiscal 2021, as well as its strategy and outlook. The review will be accompanied by a slide presentation which will be made available immediately prior to the conference call on Graham’s website at www.graham-mfg.com under the heading “Investor Relations.” A question-and-answer session will follow the formal presentation.

Graham’s conference call can be accessed by calling (201) 689-8560. Alternatively, the webcast can be monitored on Graham’s website at www.graham-mfg.com under the heading “Investor Relations.”

A telephonic replay will be available from 2:00 p.m. ET today through Wednesday, November 4, 2020. To listen to the archived call, dial (412) 317-6671 and enter conference ID number 13710948. A transcript of the call will be placed on Graham’s website, once available.

ABOUT GRAHAM CORPORATION

Graham is a global business that designs, manufactures and sells critical equipment for the energy, defense and chemical/petrochemical industries. Energy markets include oil refining, cogeneration, and alternative power. For the defense industry, the Company’s equipment is used in nuclear propulsion power systems for the U.S. Navy. Graham’s global brand is built upon world-renowned engineering expertise in vacuum and heat transfer technology, responsive and flexible service and unsurpassed quality.

Graham designs and manufactures custom-engineered ejectors, vacuum pumping systems, surface condensers and vacuum systems. Graham’s equipment can also be found in other diverse applications such as metal refining, pulp and paper processing, water heating, refrigeration, desalination, food processing, pharmaceutical, heating, ventilating and air conditioning. Graham’s reach spans the globe and its equipment is installed in facilities from North and South America to Europe, Asia, Africa and the Middle East.

Graham routinely posts news and other important information on its website, www.graham-mfg.com, where additional comprehensive information on Graham Corporation and its subsidiaries can be found.

Safe Harbor Regarding Forward Looking Statements

This news release contains forward-looking statements within the meaning of Section 27A of the Securities Act of 1933, as amended, and Section 21E of the Securities Exchange Act of 1934, as amended.

Forward-looking statements are subject to risks, uncertainties and assumptions and are identified by words such as “expects,” “estimates,” “confidence,” “projects,” “typically,” “outlook,” “anticipates,” “believes,” “appears,” “could,” “opportunities,” “seeking,” “plans,” “aim,” “pursuit,” “look towards” and other similar words. All statements addressing operating performance, events, or developments that Graham Corporation expects or anticipates will occur in the future, including but not limited to, effects of the COVID-19 global pandemic, expected expansion and growth opportunities within its domestic and international markets, anticipated revenue, the timing of conversion of backlog to sales, market presence, profit margins, tax rates, foreign sales operations, its ability to improve cost competitiveness and productivity, customer preferences, changes in market conditions in the industries in which it operates, the effect on its business of volatility in commodities prices, including, but not limited to, the extreme price volatility seen in the first six months of calendar year 2020, changes in general economic conditions and customer behavior, forecasts regarding the timing and scope of the economic recovery in its markets, its acquisition and growth strategy and its operations in China, India and other international locations, are forward-looking statements. Because they are forward-looking, they should be evaluated in light of important risk factors and uncertainties. These risk factors and uncertainties are more fully described in Graham Corporation’s most recent Annual Report filed with the Securities and Exchange Commission, included under the heading entitled “Risk Factors.”

Should one or more of these risks or uncertainties materialize or should any of Graham Corporation’s underlying assumptions prove incorrect, actual results may vary materially from those currently anticipated. In addition, undue reliance should not be placed on Graham Corporation’s forward-looking statements. Except as required by law, Graham Corporation disclaims any obligation to update or publicly announce any revisions to any of the forward-looking statements contained in this news release.


Graham Corporation

Second Quarter Fiscal 2021

Consolidated Statements of Operations - Unaudited

(Amounts in thousands, except per share data)


Three Months Ended


Six Months Ended


September 30,


September 30,


2020


2019


% Change


2020


2019


% Change

Net sales


$

27,954


$

21,643


29

%


$

44,664


$

42,236


6

%

Cost of products sold


20,261


16,695


21

%


35,403


32,574


9

%

Gross profit


7,693


4,948


55

%


9,261


9,662


(4

%)

Gross margin


27.5

%


22.9

%


20.7

%


22.9

%


Other expenses and income:


Selling, general and administrative


4,253


3,847


11

%


8,155


8,403


(3

%)

Selling, general and administrative – amortization


-


-


NA


-


11


NA

Other expense


-


-


NA


-


523


NA

Operating profit


3,440


1,101


212

%


1,106


725


53

%

Operating margin


12.3

%


5.1

%


2.5

%


1.7

%


Other income


(54

)


(87

)


(38

%)


(109

)


(174

)


(37

%)

Interest income


(26

)


(363

)


(93

%)


(120

)


(762

)


(84

%)

Interest expense


3


4


(25

%)


8


7


14

%

Income before provision for income taxes


3,517


1,547


127

%


1,327


1,654


(20

%)

Provision for income taxes


773


342


126

%


401


367


9

%

Net income


$

2,744


$

1,205


128

%


$

926


$

1,287


(28

%)


Per share data:


Basic:


Net income


$

0.27


$

0.12


125

%


$

0.09


$

0.13


(31

%)

Diluted:


Net income


$

0.27


$

0.12


125

%


$

0.09


$

0.13


(31

%)


Weighted average common shares outstanding:


Basic


9,977


9,883


9,936


9,869


Diluted


9,977


9,885


9,936


9,872


Dividends declared per share


$

0.11


$

0.11


$

0.22


$

0.21


N/A: Not Applicable


Graham Corporation

Second Quarter Fiscal 2021

Consolidated Balance Sheets - Unaudited

(Amounts in thousands, except per share data)

September 30,


March 31,

2020


2020

Assets
Current assets:
Cash and cash equivalents

$

62,356


$

32,955


Investments


5,500


40,048


Trade accounts receivable, net of allowances ($41 and $33 at September 30 and March 31, 2020, respectively)


19,276


15,400


Unbilled revenue


13,691


14,592


Inventories


20,615


22,291


Prepaid expenses and other current assets


1,378


906


Income taxes receivable


322


485


Total current assets


123,138


126,677


Property, plant and equipment, net


17,327


17,587


Prepaid pension asset


3,881


3,460


Operating lease assets


171


243


Other assets


105


153


Total assets

$

144,622


$

148,120


Liabilities and stockholders’ equity
Current liabilities:
Current portion of finance lease obligations

$

26


$

40


Accounts payable


11,669


14,253


Accrued compensation


5,082


4,453


Accrued expenses and other current liabilities


3,867


3,352


Customer deposits


24,838


26,983


Operating lease liabilities


110


153


Total current liabilities


45,592


49,234


Finance lease obligations


45


55


Operating lease liabilities


53


82


Deferred income tax liability


988


721


Accrued pension liability


800


747


Accrued postretirement benefits


567


557


Total liabilities


48,045


51,396


Stockholders’ equity:
Preferred stock, $1.00 par value, 500 shares authorized


-


-


Common stock, $0.10 par value, 25,500 shares authorized, 10,780 and 10,689 shares issued and 9,977 and 9,881 shares outstanding at September 30 and March 31, 2020, respectively


1,078


1,069


Capital in excess of par value


26,866


26,361


Retained earnings


90,120


91,389


Accumulated other comprehensive loss


(8,992

)


(9,556

)

Treasury stock (803 and 808 shares at September 30 and March 31, 2020, respectively)


(12,495

)


(12,539

)

Total stockholders’ equity


96,577


96,724


Total liabilities and stockholders’ equity

$

144,622


$

148,120


Graham Corporation

Second Quarter Fiscal 2021

Consolidated Statements of Cash Flows – Unaudited

(Amounts in thousands)

Six Months Ended

September 30,

2020


2019

Operating activities:
Net income

$

926


$

1,287


Adjustments to reconcile net income to net cash used by operating activities:
Depreciation


972


980


Amortization


-


11


Amortization of actuarial losses


533


498


Equity-based compensation expense


494


412


Gain on disposal or sale of property, plant and equipment


3


-


Loss on sale of Energy Steel & Supply Co.


-


87


Deferred income taxes


191


119


(Increase) decrease in operating assets:
Accounts receivable


(3,820

)


5,287


Unbilled revenue


901


(5,514

)

Inventories


1,808


990


Prepaid expenses and other current and non-current assets


(456

)


109


Income taxes receivable


163


233


Operating lease assets


75


138


Prepaid pension asset


(421

)


(435

)

Increase (decrease) in operating liabilities:
Accounts payable


(2,544

)


(4,721

)

Accrued compensation, accrued expenses and other current and non-current liabilities


1,214


(268

)

Customer deposits


(2,285

)


(1,116

)

Operating lease liabilities


(75

)


(64

)

Long-term portion of accrued compensation, accrued pension liability and accrued postretirement benefits


63


52


Net cash used by operating activities


(2,258

)


(1,915

)

 
Investing activities:
Purchase of property, plant and equipment


(797

)


(679

)

Proceeds from disposal of property, plant and equipment


6


-


Proceeds from the sale of Energy Steel & Supply Co.


-


602


Purchase of investments


(31,603

)


(82,414

)

Redemption of investments at maturity


66,151


83,232


Net cash provided by investing activities


33,757


741


Financing activities:
Principal repayments on finance lease obligations


(24

)


(25

)

Principal repayments on long-term debt


(4,599

)


-


Proceeds from the issuance of long-term debt


4,599


-


Dividends paid


(2,195

)


(2,075

)

Purchase of treasury stock


(23

)


(230

)

Net cash used by financing activities


(2,242

)


(2,330

)

Effect of exchange rate changes on cash


144


(187

)

Net increase (decrease) in cash and cash equivalents, including cash classified within current assets held for sale


29,401


(3,691

)

Net decrease in cash classified within current assets held for sale


-


552


Net increase (decrease) in cash and cash equivalents


29,401


(3,139

)

Cash and cash equivalents at beginning of period


32,955


15,021


Cash and cash equivalents at end of period

$

62,356


$

11,882


Graham Corporation

Second Quarter Fiscal 2021

EBITDA Reconciliation - Unaudited

(Amounts in thousands)


Three Months Ended


Six Months Ended

September 30,


September 30,

2020


2019


2020


2019

Net income

$

2,744


$

1,205


$

926


$

1,287


Net interest income


(23

)


(359

)


(112

)


(755

)

Income taxes


773


342


401


367


Depreciation & amortization


486


490


972


991


EBITDA

$

3,980


$

1,678


$

2,187


$

1,890


EBITDA margin %


14.2

%


7.8

%


4.9

%


4.5

%

Non-GAAP Financial Measure:

EBITDA is defined as consolidated net income before net interest income, income taxes, depreciation, and amortization and EBITDA margin is defined as EBITDA as a percentage of sales. EBITDA and EBITDA margin are not measures determined in accordance with generally accepted accounting principles in the United States, commonly known as GAAP. Nevertheless, Graham believes that providing non-GAAP information, such as EBITDA, is important for investors and other readers of Graham's financial statements, as it is used as an analytical indicator by Graham's management to better understand operating performance. Moreover, Graham’s credit facility also contains ratios based on EBITDA. Because EBITDA is a non-GAAP measure and is thus susceptible to varying calculations, EBITDA, as presented, may not be directly comparable to other similarly titled measures used by other companies.

Graham Corporation
Second Quarter Fiscal 2021
Additional Information – Unaudited

ORDER & BACKLOG TREND
($ in millions)
 

Q120


Q220


Q320


Q420


FY2020


Q121


Q221

Total


Total


Total


Total


Total


Total


Total

Orders

$

15.1

$

32.6

$

20.0

$

12.3

$

80.0

$

11.5

$

35.0

Backlog

$

117.2

$

127.8

$

122.9

$

112.4

$

112.4

$

107.2

$

114.9

 
SALES BY INDUSTRY FY 2021
($ in millions)
 
FY 2021 Q1 % of Q2 % of
6/30/20 Total 9/30/20 Total
Refining

$

2.7

16

%

$

10.3

37

%

Chemical/ Petrochemical

$

8.0

48

%

$

5.5

20

%

Defense

$

3.5

21

%

$

9.4

34

%

Other Commercial

$

2.5

15

%

$

2.8

10

%

Total

$

16.7

$

28.0

 
SALES BY INDUSTRY FY 2020
($ in millions)
 
FY 2020

Q1


% of


Q2


% of


Q3


% of


Q4


% of


FY2020


% of

6/30/19


Total


9/30/19


Total


12/31/19


Total


3/31/20


Total


Total

Refining

$

7.5

36

%

$

6.3

29

%

$

12.2

49

%

$

7.4

32

%

$

33.4

37

%

Chemical/ Petrochemical

$

7.1

35

%

$

10.5

48

%

$

6.2

24

%

$

7.1

31

%

$

30.9

34

%

Defense

$

2.1

10

%

$

2.6

12

%

$

4.3

17

%

$

5.6

24

%

$

14.6

16

%

Other Commercial

$

3.9

19

%

$

2.2

11

%

$

2.6

10

%

$

3.0

13

%

$

11.7

13

%

Total

$

20.6

$

21.6

$

25.3

$

23.1

$

90.6


Graham Corporation
Second Quarter Fiscal 2021
Additional Information - Unaudited
(Continued)


SALES BY REGION FY 2021

($ in millions)
 
FY 2021 Q1 % of Q2 % of
6/30/20 Total 9/30/20 Total
United States

$

9.4

56

%

$

17.3

62

%

Middle East

$

0.4

3

%

$

1.0

4

%

Asia

$

5.2

31

%

$

4.5

16

%

Other

$

1.7

10

%

$

5.2

18

%

Total

$

16.7

$

28.0

 
SALES BY REGION FY 2020
($ in millions)
 
FY 2020 Q1 % of Q2 % of Q3 % of Q4 % of FY2020 % of
6/30/19 Total 9/30/19 Total 12/31/19 Total 3/31/20 Total Total
United States

$

14.4

70

%

$

15.7

73

%

$

13.4

53

%

$

14.5

63

%

$

58.0

64

%

Middle East

$

0.8

4

%

$

0.5

2

%

$

7.5

30

%

$

4.3

19

%

$

13.1

14

%

Asia

$

3.2

16

%

$

1.0

5

%

$

0.7

3

%

$

0.6

2

%

$

5.5

6

%

Other

$

2.2

10

%

$

4.4

20

%

$

3.7

14

%

$

3.7

16

%

$

14.0

16

%

Total

$

20.6

$

21.6

$

25.3

$

23.1

$

90.6


Contacts

Jeffrey F. Glajch
Vice President – Finance and CFO
Phone: (585) 343-2216
This email address is being protected from spambots. You need JavaScript enabled to view it.

Deborah K. Pawlowski / Christopher M. Gordon
Kei Advisors LLC
Phone: (716) 843-3908 / (716) 843-3748
This email address is being protected from spambots. You need JavaScript enabled to view it. / This email address is being protected from spambots. You need JavaScript enabled to view it.

LONDON--(BUSINESS WIRE)--#GlobalIndustrialValvesMarketinOilandGasIndustry--Scope of the report


This report provides a detailed analysis of the industrial valves market by product (ball valves, plug valves, gate valves, globe valves, and others) and geography (MEA, North America, Europe, APAC, and South America). Also, the report analyzes the market’s competitive landscape and offers information on several market vendors, including AVK Holding AS, Badger Meter Inc., Emerson Electric Co., Flowserve Corp., ITT Inc., Parker Hannifin Corp., Schlumberger Ltd., SMC Corp., The Dixon Group Inc., and The Weir Group Plc. Increase in oil and gas E&P activities is a key trend in the global industrial valves market which will lead to significant market growth. Technological advances such as the development of data-oriented and sensitive equipment have significantly increased the productivity of oil and gas E&P activities. Besides, countries such as the US and Canada are making huge investments in drilling activities to tap unconventional resources. All these factors are leading to a positive outlook for the industrial valves market.

To learn more about the global trends impacting the future of market research, download a free sample now

Industrial Valves Market in Oil and Gas Industry: Segmentation by Geography

The market is segmented into five regions encompassing MEA, North America, Europe, APAC, and South America. MEA was the largest market for industrial valves in 2019, and the region is expected to offer several growth opportunities to market vendors during the forecast period. About 37% of the market’s growth will originate from MEA during the forecast period. The region is home to many major oil and gas-producing nations such as Saudi Arabia, Iran, the UAE, Nigeria, Iraq, Angola, and Algeria. In addition, the region is witnessing a rise in the number of new refinery projects led by the growing need for increasing domestic gas production. These factors are fueling the growth of the industrial valves market size in MEA. Saudi Arabia and Iran (Islamic Republic of Iran) are the key markets for industrial valves for the oil and gas industry in MEA.

Industrial Valves Market in Oil and Gas Industry: Segmentation by Product

The industrial valves market is segmented into five segments based on the product comprising of ball valves, plug valves, gate valves, globe valves, and others. The market saw increased demand for ball valves in 2019. Ball valves are extensively used in the upstream oil and gas E&P activities owing to their high corrosion resistance to seawater and low-pressure drop in high-pressure applications. With a rise in the number of upstream oil and gas E&P activities, the demand for ball valves will further increase during the forecast period. These factors are creating significant growth potential in the segment.

Technavio’s in-depth research has all your needs covered as our research reports include all foreseeable market scenarios, including pre- & post-COVID-19 analysis. Download a Free Sample Report on COVID-19 Impacts

Industrial Valves Market in Oil and Gas Industry: Growth Drivers

Rise in demand for more efficient valves will drive market growth. The depletion of oil and gas reserves is compelling oil and gas companies to explore opportunities in remote locations and complex terrains with harsh operating conditions. In such conditions, even a small mistake could severely affect the safety and productivity of drilling operations. This has increased the demand for more efficient valves that can withstand hostile operating environments and provide the required level of safety and productivity. In addition, the rising investments in shale oil fields are also creating significant demand for more efficient valves. These factors are creating new opportunities for the manufacturers of industrial valves in the oil and gas industry, thereby fueling market growth.

Industrial Valves Market in Oil and Gas Industry: Market overview

The industrial valves market is fragmented with the presence of several domestic and international players. Hence, companies need to adopt advanced technologies and marketing strategies to remain competitive in the market. AVK Holding AS, Badger Meter Inc., and Emerson Electric Co. are some of the major market participants. Though the accelerating growth momentum will offer immense growth opportunities, the availability of counterfeit and fraudulent valves will challenge the growth of the market participants. To make the most of the opportunities, market vendors should focus more on the growth prospects in the fast-growing segments, while maintaining their position in the slow-growing segments.

Market Sizing Methodology

Technavio uses a robust market sizing approach to estimate the total opportunity size for any market. Some of the examples of methodologies are shown for reference data is collected through both primary research (through industry interview with market participants and industry experts) as well as secondary research (through annual reports, press releases, company and industry presentations, industry associations, journals and in-house data repositories built over past 15 years)

Industrial Valves Market in Oil and Gas Industry: Parent Market Overview

Technavio categorizes the global industrial valves market in oil and gas industry as a part of the global oilfield equipment and services market within the global oil and gas market. The global oilfield equipment and services market covers products and companies engaged in upstream exploration and production (E&P) operations, production of equipment or service contracts, and is an important manufacturing sector, which caters to the needs of the oil and gas upstream sector.

Growth in the oil and gas market will be driven by the increase in global energy demand and robust growth in the power industry.

Buy 1 Technavio report and get the second for 50% off. Buy 2 Technavio reports and get the third for free.

View market snapshot before purchasing

Technavio Best Practices

Technavio is based on four simple principles: easy-to-access reports, robust industry coverage, a focus on new and emerging technologies, and competitive pricing. We believe in helping companies and executives become better equipped to make faster, sounder, and more effective decisions. Our focus is on emerging markets and technologies, providing insights not available anywhere else. We report on the latest innovations and trends in all the industries we cover. We also create value for our clients by offering a blend of off-the-shelf research reports and customized research, allowing you to get the information you need when you need it.

Who should purchase this report?

Our research and analysis focus on emerging market trends to help businesses identify market opportunities and develop effective strategies to optimize their market positions. Our research reports are designed to provide actionable insights so that you can make quick, effective, and sound decisions.

Are you looking for data that are tailored specifically for your company? You can rely on Technavio Custom Research Solutions which provide research and insights developed to your exact specifications. We provide flexible engagement models such as on-demand research, a dedicated analyst, an annual research framework, an unlimited program, and more.

About Technavio

Technavio is a leading global technology research and advisory company. Their research and analysis focus on emerging market trends and provides actionable insights to help businesses identify market opportunities and develop effective strategies to optimize their market positions.

With over 500 specialized analysts, Technavio’s report library consists of more than 17,000 reports and counting, covering 800 technologies, spanning across 50 countries. Their client base consists of enterprises of all sizes, including more than 100 Fortune 500 companies. This growing client base relies on Technavio’s comprehensive coverage, extensive research, and actionable market insights to identify opportunities in existing and potential markets and assess their competitive positions within changing market scenarios.


Contacts

Technavio Research
Jesse Maida
Media & Marketing Executive
US: +1 844 364 1100
UK: +44 203 893 3200
Email: This email address is being protected from spambots. You need JavaScript enabled to view it.
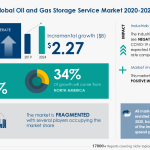
Website: https://www.technavio.com

~Achieves Highest Revenue and Earnings in Company’s History~

~Revenue Approaches $400 Million in Fourth Quarter; 33% Same-Store Sales Growth~

~Fourth Quarter Earnings Per Share More than Tripled to $1.13; Adjusted EPS $1.19~

~Fiscal 2020 Revenue Exceeds $1.5 Billion; 25% Same-Store Sales Growth~

~Fiscal 2020 Earnings Per Share More than Doubled to $3.37; Adjusted EPS $3.42~

~Company Provides Annual Guidance for Fiscal 2021~

CLEARWATER, Fla.--(BUSINESS WIRE)--MarineMax, Inc. (NYSE: HZO), the nation’s largest recreational boat and yacht retailer, today announced record results for its fourth quarter and full year ended September 30, 2020.

Revenue grew over 29% to $398.8 million for the quarter ended September 30, 2020, from $308.1 million for the comparable quarter last year. The increase was driven by strong same-store sales growth of 33%. Included in the quarters ended September 30, 2020 and September 30, 2019, were net charges of $1.5 million or $0.06 per diluted share and $1.6 million, or $0.07 per diluted share, respectively. The charges primarily related to costs associated with the Company’s store optimization plan which resulted in the closure of one store in the current quarter and eight in the comparable quarter last year.

Net income for the quarter ended September 30, 2020, more than tripled to $25.6 million, or $1.13 per diluted share, compared to net income of $6.7 million, or $0.31 per diluted share in the comparable quarter last year. Excluding the charges in both periods, net income for the quarter ended September 30, 2020, grew to $27.1 million, with earnings per diluted share more than tripling to $1.19, as compared to $8.3 million or $0.38 per diluted share in the same period last year.

For the fiscal year ended September 30, 2020, revenue increased 22% to $1.51 billion compared with $1.24 billion for the same period last year. The growth was driven by strong same-store sales growth of 25%. Included in the years ended September 30, 2020 and September 30, 2019, were net charges of $1.3 million, or $0.05 per diluted share and $1.4 million, or $0.06 per diluted share, respectively. The charges primarily related to costs associated with the Company’s store optimization plan.

Net income for the fiscal year ended September 30, 2020, more than doubled to $74.6 million, or $3.37 per diluted share, compared to net income of $36.0 million, or $1.57 per diluted share in the prior year. Excluding the charges in both periods, net income for the year ended September 30, 2020, grew to $75.9 million, with earnings per diluted share more than doubling to $3.42, as compared to $37.3 million or $1.63 per diluted share in the same period last year.

W. Brett McGill, Chief Executive Officer and President stated, “The MarineMax Team generated a record $1.5 billion of revenue and more than doubled our earnings per share while overcoming these extremely uncertain times. We believe this demonstrates the strength and flexibility of our business model. I could not be prouder of the entire Team for their focus, hard work and passion for MarineMax. We also believe that the industry experienced a foundational shift in 2020, and specifically for MarineMax, it resulted in a greatly expanded customer base that is embracing and enjoying the boating lifestyle. We continue to add new customers at a seasonally accelerated pace. This foundational layer should provide sustainable growth for years to come, as many existing and new customers will upgrade to larger boats and need additional services.”

Mr. McGill continued, “Our deep manufacturer relationships and brand strategy provide us with a competitive advantage by supporting our ability to move inventory between stores to help satisfy the growing demand. Looking ahead, our business outlook remains promising as more people are realizing that boating is a safe way for families to spend time together enjoying the boating lifestyle. Our balance sheet is very well capitalized, allowing us to continue to pursue strategic accretive acquisitions, to strengthen and enhance our digital strategy, to expand with marinas and to further grow our higher margin businesses. We are happy that many people have rediscovered the benefits of the boating lifestyle, which gives us increased confidence for the future.”

At September 30, 2020, the Company’s liquidity exceeded $237 million, consisting of cash and cash equivalents along with availability under its credit facility.

Fiscal 2021 Guidance

Based on current business conditions, retail trends and other factors, the Company currently expects earnings per diluted share to be in the range of $3.70 to $3.90 for fiscal 2021. This includes earnings contributed by SkipperBud’s, which the Company acquired on October 1, 2020. This compares to a non-GAAP adjusted, but fully taxed, diluted earnings per share of $3.42 in fiscal 2020.

About MarineMax

Headquartered in Clearwater, Florida, MarineMax is the nation’s largest recreational boat and yacht retailer. Focused on premium brands such as Sea Ray, Boston Whaler, Hatteras, Azimut Yachts, Benetti, Ocean Alexander, Galeon, Grady-White, Harris, Bennington, Crest, MasterCraft, MJM Yachts, NauticStar, Scout, Sailfish, Tige, Yamaha Jet Boats, Aquila, Aviara, and Nautique. MarineMax sells new and used recreational boats and related marine products and services, as well as provides yacht brokerage and charter services. MarineMax currently has 77 retail locations in Alabama, California, Connecticut, Florida, Georgia, Illinois, Maryland, Massachusetts, Michigan, Minnesota, Missouri, New Jersey, New York, North Carolina, Ohio, Oklahoma, Rhode Island, South Carolina, Texas, Washington and Wisconsin. MarineMax also owns Fraser Yachts Group and Northrop & Johnson, leading superyacht brokerage and luxury yacht services companies with operations in multiple countries. The Company also owns and operates MarineMax Vacations in Tortola, British Virgin Islands. MarineMax is a New York Stock Exchange-listed company. For more information, please visit www.marinemax.com.

Forward Looking Statement

Certain statements in this press release are forward-looking as defined in the Private Securities Litigation Reform Act of 1995. Such forward-looking statements include the Company’s anticipated financial results for the fourth quarter and the fiscal year ended September 30, 2020; the foundational shift experienced by the Company and the overall industry and this shift's effects on potential future growth; the Company's competitive advantage and its effect on inventory and sales; the Company's business outlook; the Company's continued efforts to pursue strategic accretive acquisitions, strengthen and enhance its digital strategy, expand with marinas, and to further grow its higher margin businesses; and the Company's fiscal 2021 guidance. These statements are based on current expectations, forecasts, risks, uncertainties and assumptions that may cause actual results to differ materially from expectations as of the date of this release. These risks, assumptions and uncertainties include the Company’s abilities to reduce inventory, manage expenses and accomplish its goals and strategies, the quality of the new product offerings from the Company’s manufacturing partners, the performance and integration of the recently-acquired SkipperBud's business, the impacts (direct and indirect) of COVID-19 on the Company’s business, the Company’s employees, the Company’s manufacturing partners, and the overall economy, general economic conditions, as well as those within the Company's industry, the level of consumer spending, the Company’s ability to integrate acquisitions into existing operations, and numerous other factors identified in the Company’s Form 10-K for the fiscal year ended September 30, 2019 and other filings with the Securities and Exchange Commission. The Company disclaims any intention or obligation to update or revise any forward-looking statements, whether as a result of new information, future events or otherwise.

MarineMax, Inc. and Subsidiaries

Condensed Consolidated Statements of Operations

(Amounts in thousands, except share and per share data)

(Unaudited)


Three Months Ended
September 30,


Fiscal Year Ended
September 30,


2020


2019


2020


2019


Revenue

$ 398,762


$ 308,136


$ 1,509,713


$ 1,237,153

Cost of sales

282,296


220,694


1,111,000


914,321

Gross profit

116,466


87,442


398,713


322,832


Selling, general, and administrative expenses

83,714


74,864


291,998


262,300

Income from operations

32,752


12,578


106,715


60,532


Interest expense

785


3,094


9,275


11,579

Income before income tax provision

31,967


9,484


97,440


48,953


Income tax provision

6,384


2,799


22,806


12,968

Net income

$ 25,583


$ 6,685


$ 74,634


$ 35,985


Basic net income per common share

$ 1.18


$ 0.31


$ 3.46


$ 1.61


Diluted net income per common share

$ 1.13


$ 0.31


$ 3.37


$ 1.57


Weighted average number of common
shares used in computing net income per
common share:


Basic

21,716,081


21,327,669


21,547,665


22,294,114

Diluted

22,604,060


21,896,257


22,125,338


22,881,147

MarineMax, Inc. and Subsidiaries

Condensed Consolidated Balance Sheets

(Amounts in thousands)

(Unaudited)


September 30,
2020


September 30,
2019

ASSETS


CURRENT ASSETS:


Cash and cash equivalents

$ 155,493


$ 38,511

Accounts receivable, net

40,195


42,398

Inventories, net

298,002


477,468

Prepaid expenses and other current assets

9,637


10,206

Total current assets

503,327


568,583


Property and equipment, net

141,934


144,298

Operating lease right-of-use assets, net

37,991


Goodwill and other intangible assets, net

84,293


64,077

Other long-term assets

7,774


7,125

Total assets

$ 775,319


$ 784,083


LIABILITIES AND STOCKHOLDERS’ EQUITY


CURRENT LIABILITIES:


Accounts payable

$ 37,343


$ 33,674

Customer deposits

31,821


24,305

Accrued expenses

52,123


42,849

Current operating lease liabilities

6,854


Short-term borrowings

144,393


312,065

Total current liabilities

272,534


412,893


Noncurrent operating lease liabilities

33,473


Deferred tax liabilities, net

4,509


1,142

Long-term debt, net of current maturities

7,343


Other long-term liabilities

2,063


1,229

Total liabilities

319,922


415,264


STOCKHOLDERS' EQUITY:


Preferred stock


Common stock

28


28

Additional paid-in capital

280,436


269,969

Accumulated other comprehensive income (loss)

829


(669)

Retained earnings

277,699


202,455

Treasury stock

(103,595)


(102,964)

Total stockholders’ equity

455,397


368,819

Total liabilities and stockholders’ equity

$ 775,319


$ 784,083

MarineMax, Inc. and Subsidiaries

Supplemental Financial Information

(Amounts in thousands, except share and per share data)

(Unaudited)


Three Months Ended
September 30,


Fiscal Year Ended
September 30,


2020


2019


2020


2019


Net income

$ 25,583


$ 6,685


$ 74,634


$ 35,985

Gain Deepwater Horizon settlement


(1,252)


(1,252)

Store closing expenses

1,659


3,091


1,659


3,091

Hurricane expenses

196


422


Pro forma tax adjustments for items noted above (1)

(371)


(667)


(388)


(487)

Adjusted net income

$ 27,067


$ 8,279


$ 75,905


$ 37,337


Diluted net income per common share

$ 1.13


$ 0.31


$ 3.37


$ 1.57

Gain Deepwater Horizon Settlement


(0.06)


(0.05)

Store closing expenses

0.07


0.14


0.07


0.14

Hurricane expenses

0.01


0.02


Pro forma tax adjustments for items noted above (1)

(0.02)


(0.03)


(0.02)


(0.03)

Adjusted diluted net income per common share

$ 1.19


$ 0.38


$ 3.42


$ 1.63

____________

(1)

  Adjustments for taxes for unusual items are calculated based on the effective tax rate for each respective period presented. 


Contacts

Michael H. McLamb
Chief Financial Officer
727-531-1700

Media:
Abbey Heimensen
MarineMax, Inc.

Investors:
Brad Cohen or Dawn Francfort
ICR, LLC
This email address is being protected from spambots. You need JavaScript enabled to view it.

Offshore Source Logo

Offshore Source keeps you updated with relevant information concerning the Offshore Energy Sector.

Any views or opinions represented on this website belong solely to the author and do not represent those of the people, institutions or organizations that Offshore Source or collaborators may or may not have been associated with in a professional or personal capacity, unless explicitly stated.

Corporate Offices

Technology Systems Corporation
8502 SW Kansas Ave
Stuart, FL 34997

info@tscpublishing.com