Business Wire News

Low-carbon ammonia key enabler for clean hydrogen energy

World’s largest producer of ammonia decarbonizing global production base

Board approves green ammonia project at Donaldsonville Nitrogen Complex

Comprehensive ESG goals including net-zero carbon emissions by 2050

Briefing call outlining clean energy commitment today at 4:00 pm Eastern

DEERFIELD, Ill.--(BUSINESS WIRE)--CF Industries Holdings, Inc. (NYSE: CF), a leading global manufacturer of hydrogen and nitrogen products, today announced significant steps to support a global hydrogen and clean fuel economy, which is expected to grow significantly over the next decade, through the production of green and low-carbon ammonia.

Highlights:

  • Board-authorized green ammonia project to be built at the Donaldsonville Nitrogen Complex
  • Carbon dioxide (CO2) sequestration and other carbon abatement projects to enable low-carbon ammonia production in development
  • Announces comprehensive ESG goals, covering critical environmental, societal, and workforce imperatives, including a dramatic reduction in carbon emissions across its global network
  • 25% reduction in CO2e emissions intensity by 2030 and net-zero carbon emissions by 2050
  • Executive compensation tied directly to ESG goals
  • Briefing call to outline clean energy commitment at 4:00 pm Eastern today, Thursday, Oct. 29, 2020

“The world needs clean energy and hydrogen is a key to meeting this need. Low-carbon ammonia is the critical enabler for storage and transport of hydrogen and thus has a major role to play,” said Tony Will, president and chief executive officer, CF Industries Holdings, Inc. “Today’s commitment to decarbonize the world’s largest ammonia production network positions CF Industries at the forefront of clean hydrogen supply. Due to our unparalleled manufacturing and distribution network, our competitive advantage in producing low-carbon ammonia at scale is measured in terms of years and billions of dollars.”

Significant Long-term Global Growth

Green hydrogen and ammonia are expected to be critical contributors to the world achieving net-zero carbon emissions by 2050. Industry experts project hydrogen will meet approximately 20% of the world’s energy need by 2050, up from less than 1% today. Ammonia, which is composed of three-parts hydrogen and one-part nitrogen, is a highly efficient transport and storage mechanism for hydrogen as well as a fuel in its own right.

As the world’s largest ammonia producer, CF Industries’ current asset base and technical expertise are well-situated to meet the anticipated demand for hydrogen and ammonia from green and low-carbon sources. The company’s approach will focus on green ammonia production, which refers to ammonia produced through a carbon-free process, and low-carbon ammonia, which relates to ammonia produced by conventional processes but with CO2 removed through carbon capture and sequestration (CCS) and other certified carbon abatement projects.

“Our existing scale and commitment to produce green and low-carbon ammonia establishes CF Industries as the clear leader in providing clean fuels for a sustainable world, while also providing a growth platform to drive long-term shareholder value,” added Will.

Initial Investments in a Clean Energy Future

CF Industries’ Board of Directors approved an initial green ammonia project at the company’s flagship Donaldsonville Nitrogen Complex to produce approximately 20,000 tons per year of green ammonia. The company will install a state-of-the-art electrolysis system at Donaldsonville to generate carbon-free hydrogen from water that will then be supplied to an existing plant to produce green ammonia. The cost of the initial project is expected to fit within the company’s annual capital expenditure budget, which has ranged from $400-$450 million per year.

Additionally, the company is developing CCS and other carbon abatement projects across its production facilities. The implementation of these projects will enable CF to produce low-carbon ammonia. The company estimates that over time it could produce approximately 3.5 million tons of low-carbon ammonia per year, which represents about one-third of its annual ammonia production capacity, without affecting its current product mix.

In order to execute these initiatives, CF is collaborating with leading technology companies, and has signed Memorandums of Understanding with ThyssenKrupp and Haldor Topsoe. The Company is also in discussions with global utilities and maritime transportation providers that have announced their intention to use low-carbon ammonia directly as a fuel.

New Committee of the Board

The CF Board of Directors has established a new committee, the Environmental Sustainability and Community Committee, to oversee all aspects of the progress toward net-zero carbon emissions and the company’s active involvement in the communities in which it operates.

To learn more about CF Industries’ commitment to a clean energy future, visit www.cfindustries.com.

Conference Call

CF Industries Holdings, Inc. is posting a presentation to the investor portion of the company’s website at www.cfindustries.com and will be hosting a conference call at 4:00 pm Eastern on Thursday, Oct. 29, 2020, to provide an overview of the company’s commitment to clean energy and answer analysts’ questions.

Investors can access the call by dialing 866-748-8653 or 678-825-8234. The passcode is 9281559. The conference call also will be available live on the company’s website at www.cfindustries.com. Participants also may pre-register for the webcast on the company’s website. Please log-in or dial-in at least 10 minutes before the start time to ensure a connection. A replay of the call will be available for seven days by calling 855-859-2056 and citing code 9281559.

About CF Industries Holdings, Inc.

CF Industries is a leading global manufacturer of hydrogen and nitrogen products for clean energy, emissions abatement, fertilizer, and other industrial applications. We operate manufacturing complexes in the United States, Canada, and the United Kingdom, which are among the most cost-advantaged, efficient, and flexible in the world and an unparalleled storage, transportation and distribution network in North America. Our 3,000 employees focus on safe and reliable operations, environmental stewardship and disciplined capital and corporate management, driving our strategy to leverage and sustainably grow the world’s most advantaged hydrogen and nitrogen platform to serve customers, creating long-term shareholder value. CF Industries routinely posts investor announcements and additional information on the company’s website at www.cfindustries.com and encourages those interested in the company to check there frequently.

Safe Harbor Statement

All statements in this communication, other than those relating to historical facts, are forward-looking statements, including, but not limited to, statements as to strategic plans and management’s expectations with respect to the production of green and low-carbon ammonia, the development of carbon capture and sequestration projects, the transition to and growth of a hydrogen economy, greenhouse gas reduction targets, projected capital expenditures, and other items described in this communication. Forward-looking statements can generally be identified by their use of terms such as “anticipate,” “believe,” “could,” “estimate,” “expect,” “intend,” “may,” “plan,” “predict,” “project,” “will” or “would” and similar terms and phrases, including references to assumptions. Forward-looking statements are not guarantees of future performance and are subject to a number of assumptions, risks and uncertainties, many of which are beyond our control, which could cause actual results to differ materially from such statements. Important factors that could cause actual results to differ materially from our expectations include, but are not limited to, the failure of cost competitive global renewable energy capacity to increase significantly; realization of technological improvements required to increase the efficiency and lower the costs of production of green and low-carbon ammonia; development and growth of end market demand and applications for low-carbon hydrogen and ammonia; government regulation, incentives, and initiatives; cost overruns; performance of third parties; permitting matters; and other unforeseen difficulties. Important factors that could cause actual results more generally to differ materially from our expectations are discussed in our filings with the Securities and Exchange Commission, including our most recent annual and quarterly reports on Form 10-K and Form 10-Q, which are available in the Investor Relations section of the CF Industries web site.

It is not possible to predict or identify all risks and uncertainties that might affect the accuracy of our forward-looking statements and, consequently, our descriptions of such risks and uncertainties should not be considered exhaustive. There is no guarantee that any of the events, plans or goals anticipated by these forward-looking statements will occur, and if any of the events do occur, there is no guarantee what effect they will have on our business, results of operations, cash flows, financial condition and future prospects. Forward-looking statements are given only as of the date of this communication and the company disclaims any obligation to update or revise the forward-looking statements, whether as a result of new information, future events or otherwise, except as required by law.


Contacts

Media
Chris Close
Director, Corporate Communications
847-405-2542 – This email address is being protected from spambots. You need JavaScript enabled to view it.

Investors
Martin Jarosick
Vice President, Investor Relations
847-405-2045 – This email address is being protected from spambots. You need JavaScript enabled to view it.

SAN DIEGO--(BUSINESS WIRE)--EDF Renewables North America and Pedernales Electric Cooperative Inc. (PEC), the largest distribution electric cooperative in the United States, today announced the signing of a 15-year Power Purchase Agreement (PPA) for a 100 megawatt (MW) share of the King Creek 1 Wind Project. Located on ranch land in Throckmorton and Haskell Counties, Texas, the King Creek project expects to begin delivering clean electricity in Q4 2021.


The project is in the west zone of the Electric Reliability Council of Texas (ERCOT) market and was selected by PEC under its 2020 RFP.

King Creek 1 will consist of 47 wind turbine generators. Construction is expected to start by the end of 2020. The project will create approximately 300 construction related jobs during its peak, and will benefit the local community over its operating life through land lease, tax, and other payments.

“EDF Renewables looks forward to supplying Pedernales with competitively-priced, clean energy through the King Creek 1 Wind Project,” said Ryan Pfaff, Executive Vice President, Grid-Scale Power at EDF Renewables. “Pedernales’ decision to include clean energy in its resource portfolio helped to make the project a reality, which will provide an economic boost to the local economy through new construction and operations jobs, and expanded tax base.”

“We’re excited about the expansion of our power portfolio to include 100 MW of wind power,” said Julie C. Parsley, PEC’s Chief Executive Officer.

With 35 years of experience and 16 gigawatts (GW) of renewable projects developed throughout North America, EDF Renewables provides a fully integrated bundle of energy solutions from grid-scale wind, solar, and solar plus storage projects to electric vehicle charging and energy storage management.

The expected electricity generated at full capacity is enough to meet the consumption of approximately 26,000 average Texas homes1.

1 According to U.S. Energy Information Administration (EIA) 2018 Residential Electricity Sales and U.S. Census Data

About EDF Renewables:

EDF Renewables North America is a market leading independent power producer and service provider with 35 years of expertise in renewable energy. The Company delivers grid-scale power: wind (onshore and offshore), solar photovoltaic, and storage projects; distributed solutions: solar, solar+storage, EV charging and energy management; and asset optimization: technical, operational, and commercial skills to maximize performance of generating projects. EDF Renewables’ North American portfolio consists of 16 GW of developed projects and 11 GW under service contracts. EDF Renewables North America is a subsidiary of EDF Renouvelables, the dedicated renewable energy affiliate of the EDF Group. For more information visit: www.edf-re.com

About Pedernales Electric Cooperative:

Founded in 1938 with the assistance of then-Congressman Lyndon B. Johnson, Pedernales Electric Cooperative Inc. is a member-owned electric cooperative that serves more than 343,000 accounts across Central Texas. An industry-recognized leader providing outstanding member service and reliable electricity, we conduct our business via a transparent and democratic process and highly encourage member participation.


Contacts

EDF Renewables
Sandi Briner, +1 858-521-3525
This email address is being protected from spambots. You need JavaScript enabled to view it.

Pedernales Electric Cooperative, Inc.
Mike Viesca
This email address is being protected from spambots. You need JavaScript enabled to view it.

DUBLIN--(BUSINESS WIRE)--The "Global Offshore Drilling Market 2020-2024" report has been added to ResearchAndMarkets.com's offering.


The offshore drilling market is poised to grow by $ 11.34 bn during 2020-2024 progressing at a CAGR of 6% during the forecast period.

The report on the offshore drilling market provides a holistic analysis, market size and forecast, trends, growth drivers, and challenges, as well as vendor analysis covering around 25 vendors.

The report offers an up-to-date analysis regarding the current global market scenario, latest trends and drivers, and the overall market environment. The market is driven by the growth in demand for oil and natural gas, rise in deepwater and ultra-deepwater E&P activities and increase in global offshore rig count. In addition, growth in demand for oil and natural gas is anticipated to boost the growth of the market as well.

This study identifies the seizing of funding for E&P activities by World Bank as one of the prime reasons driving the offshore drilling market growth during the next few years. Also, declining costs of offshore projects and emergence of next-generation automated drilling rigs will lead to sizable demand in the market.

The robust vendor analysis is designed to help clients improve their market position, and in line with this, this report provides a detailed analysis of several leading offshore drilling market vendors that include Baker Hughes Co., China Oilfield Services Ltd., Halliburton Co., KCA Deutag Alpha Ltd., National Oilwell Varco Inc., Schlumberger Ltd., The Drilling Co. of 1972 AS, Transocean Ltd., Valaris Plc, and Weatherford International Plc.

Also, the offshore drilling market analysis report includes information on upcoming trends and challenges that will influence market growth. This is to help companies strategize and leverage on all forthcoming growth opportunities.

Key Topics Covered:

Executive Summary

  • Market Overview

Market Landscape

  • Market ecosystem
  • Value chain analysis

Market Sizing

  • Market definition
  • Market segment analysis
  • Market size 2019
  • Market outlook: Forecast for 2019 - 2024

Five Forces Analysis

  • Five forces summary
  • Bargaining power of buyers
  • Bargaining power of suppliers
  • Threat of new entrants
  • Threat of substitutes
  • Threat of rivalry
  • Market condition

Market Segmentation by Application

  • Market segments
  • Comparison by Application
  • Shallow water - Market size and forecast 2019-2024
  • Deepwater - Market size and forecast 2019-2024
  • Ultra-deepwater - Market size and forecast 2019-2024
  • Market opportunity by Application

Customer landscape

Geographic Landscape

  • Geographic segmentation
  • Geographic comparison
  • North America - Market size and forecast 2019-2024
  • APAC - Market size and forecast 2019-2024
  • Europe - Market size and forecast 2019-2024
  • MEA - Market size and forecast 2019-2024
  • South America - Market size and forecast 2019-2024
  • Key leading countries
  • Market opportunity by geography
  • Market drivers
  • Market challenges
  • Market trends

Vendor Landscape

  • Vendor landscape
  • Landscape disruption
  • Competitive scenario

Vendor Analysis

  • Vendors covered
  • Market positioning of vendors
  • Baker Hughes Co.
  • China Oilfield Services Ltd.
  • Halliburton Co.
  • KCA Deutag Alpha Ltd.
  • National Oilwell Varco Inc.
  • Schlumberger Ltd.
  • The Drilling Co. of 1972 AS
  • Transocean Ltd.
  • Valaris Plc
  • Weatherford International Plc

Appendix

For more information about this report visit https://www.researchandmarkets.com/r/g314mt


Contacts

ResearchAndMarkets.com
Laura Wood, Senior Press Manager
This email address is being protected from spambots. You need JavaScript enabled to view it.
For E.S.T Office Hours Call 1-917-300-0470
For U.S./CAN Toll Free Call 1-800-526-8630
For GMT Office Hours Call +353-1-416-8900

Reflects the Region’s Economic Strength and Resiliency

HOUSTON--(BUSINESS WIRE)--Business at Port Houston public terminals continues to show strength. “October activity indicates that growth remains strong, signaling a sustained upward trend and resurgence of commerce through our port,” said Port Houston Executive Director Roger Guenther in his report to the Port Commission of the Port Houston Authority during its regular monthly meeting on Tuesday.


Guenther said that the public container terminals are “consistently seeing more than 10,000 transactions through their gates each day” as cargo volume activity continues to increase. “It is truly incredible that we enter into the final quarter of a year with unthinkable hurdles with the opportunity to handle commerce that will very nearly match a record 2019,” he said.

Guenther added that the success was made possible as “our Port Houston Team, our ILA labor, our truckers, our stevedores, and all of our partners, have continued to deliver efficient and competitive service to our customers.”

While total tonnage across the public docks remains 5% below 2019, September container volume exceeded the prior years’ month for the first time since February. The count of twenty-foot-equivalent or TEU units handled at the public terminals increased 1% vs. Sept. 2019. The Executive Director added “more good news” as well, with no new “blank” or canceled sailings to report.

Guenther said that “retailers are catching up and replenishing inventory at the same time that we are in the midst of a robust peak season in preparation for the holidays.” He shared that 26 more “extra loader” vessels were added to the vessel schedule, helping to drive a solid return to business.

Chairman Ric Campo also announced the installation of a channel current meter to support safer navigation of the Houston Ship Channel during heavy flood conditions. Campo said that installing this meter was a “great example of partnership with our industry and community” for “another big win.” He highlighted Port Houston’s Central Maintenance team for their work in its installation.

The Port Commission Budget Workshop is on Nov. 10.

About Port Houston

For more than 100 years, Port Houston has owned and operated the public wharves and terminals of the greater Port of Houston – the nation’s largest port for the foreign waterborne tonnage and an essential economic engine for the Houston region, the state of Texas, and the nation. The Port of Houston supports the creation of nearly 1.35 million jobs in Texas and 3.2 million jobs across the nation, and economic activity totaling $339 billion in Texas – 20.6 % of the Texas total gross domestic product (GDP) – and a total of $801.9 billion in U.S. economic impact. For more information, visit the website at PortHouston.com.


Contacts

Lisa Ashley, Director, Media Relations, Port Houston
Office: 713-670-2644; Mobile: 832-247-8179; E-mail: This email address is being protected from spambots. You need JavaScript enabled to view it.

Texas project is Skyline’s first solar asset, bringing portfolio to more than a gigawatt of wind & solar

NEW YORK & PORTLAND, Ore.--(BUSINESS WIRE)--Skyline Renewables, a leading North American renewables company, backed by Ardian, a world-leading private investment house, announced today that they will finance and manage the construction of a 250 megawatt (MW) solar project in Central West Texas. The Galloway I Solar Project, acquired from 8minute Solar Energy, is scheduled for operation by end of 2021.

“We’re very pleased to be adding such a robust solar project in the dynamic Texas energy market,” said Martin Mugica, Skylines Renewables President & CEO. “This latest project marks another important step forward to becoming a leading North American clean independent energy platform. It helps balance our portfolio’s renewable energy mix, giving us peak power flexibility and diversity within ERCOT and allows us to better assist the market when they need it the most.”

“The Galloway project is an excellent addition to the Skyline portfolio, and the latest example of the Skyline management team’s commitment to building a best-in-class renewable independent power company,” said Mark Voccola, Senior Managing Director and Co-Head of Ardian Infrastructure US. “We’re happy to partner with Skyline on this transaction, which is emblematic of Ardian’s ongoing commitment to investing in clean energy assets and creating a more sustainable energy market.”

With this latest acquisition, Ardian-backed Skyline Renewables will grow its renewable energy portfolio to more than 1050 MW of controlled capacity since the company was formed two years ago. Skyline Renewables announced its first acquisition of Whirlwind Energy, a 60 MW project in NW Texas, in 2018, then acquired Hackberry Wind Farm, a 166 MW farm also in NW Texas. Later that year, Skyline announced the acquisition of Horse Creek and Electra Wind Farms, both 230 MW projects all in the ERCOT market. Last year, Skyline acquired a 117 MW portfolio of wind projects located in Iowa, Kansas, Pennsylvania and Wyoming.

The latest solar project in Texas is part of Ardian’s ongoing commitment to support the energy transition, as outlined in its most recent Augmented Infrastructure report. With $15bn total AUM in infrastructure and 50 employees across eight offices throughout the Americas and Europe, the Ardian Infrastructure team is a world leading Infrastructure Fund Manager focused on the energy and transportation sectors.

“The successful project financing is further proof that the markets see our strategic position and our partnership with Ardian as a strong foundation for further growth,” continued Mr. Mugica. “We’ll continue to take this same approach in all parts of the country actively managing our assets to optimize returns and staying nimble yet smart and innovative with our growth opportunities.”

Morgan Stanley Renewables Inc. is the sole tax equity investor and Morgan Stanley Capital Group Inc. along with an unnamed major energy marketer are off-takers for the project. A consortium of banks led by CIT and joined by Rabobank, Commerzbank, DNB Capital and Siemens Financial are providing construction financing. No additional financing details were disclosed.

ABOUT SKYLINE RENEWABLES

Skyline Renewables was created in 2018 to establish a leading North American renewables platform. With a current wind portfolio of 803 MW and 250MW of solar, Skyline aims to build a total installed capacity of 3 GW in the next few years. Skyline is led by a group of renewables veterans including its CEO, Martin Mugica, a leading executive within the US clean energy sector with expertise in wind, solar, natural gas fired generation and power trading activities. Skyline Renewables’ leadership team features a number of experienced individuals who have been an integral part of the renewable industry development in the US during the last 20 years.

ABOUT ARDIAN

Ardian is a world-leading private investment house with assets of US$100bn managed or advised in Europe, the Americas and Asia. The company is majority-owned by its employees. It keeps entrepreneurship at its heart and focuses on delivering excellent investment performance to its global investor base. Through its commitment to shared outcomes for all stakeholders, Ardian’s activities fuel individual, corporate and economic growth around the world. Holding close its core values of excellence, loyalty and entrepreneurship, Ardian maintains a truly global network, with more than 700 employees working from fifteen offices across Europe (Frankfurt, Jersey, London, Luxembourg, Madrid, Milan, Paris and Zurich), the Americas (New York, San Francisco and Santiago) and Asia (Beijing, Singapore, Tokyo and Seoul). It manages funds on behalf of around 1,000 clients through five pillars of investment expertise: Fund of Funds, Direct Funds, Infrastructure, Real Estate and Private Debt.

www.ardian.com


Contacts

PRESS
ARDIAN US
The Neibart Group
CHARLIE MATHON
Cell + 508 614 0667
This email address is being protected from spambots. You need JavaScript enabled to view it.

SKYLINE RENEWABLES
JOCELYN KANNMACHER
Cell + 503 206 7565
This email address is being protected from spambots. You need JavaScript enabled to view it.

DURHAM, N.C.--(BUSINESS WIRE)--#energyfinance--Cypress Creek Renewables today announced that it has completed a tax equity buyout and refinancing of project-level debt for 92 megawatts (MW) of its solar energy portfolio across North Carolina, making Cypress Creek the sole owner of these projects. BNP Paribas acted as the primary lender and lead arranger for the transaction.


In the renewable energy industry, project sponsors are typically afforded an opportunity to purchase the equity interests held by tax equity investors in projects after the first five years of operations. This is the first such tax equity buyout transaction Cypress Creek has completed to date, and the company plans to pursue similar transactions to acquire sole ownership of more projects in its operating fleet going forward.

Cassidy DeLine, Vice President of Project Finance for Cypress Creek, said: “We approached our first refinancing with a holistic, forward-looking strategy: to set up a new debt facility for our initial 92 MW of operating assets reaching their tax equity buyouts, while also establishing a clear framework to expand that facility to include large portions of the remainder of our 1.6 GW operating fleet. In our efforts to grow into one of the top U.S. independent power producers, it was key for us to capture this efficiency and low cost of capital, helped by today’s low interest rate environment.”

Ravina Advani, Head of Energy Natural Resources & Renewables Coverage at BNP Paribas, stated: “As a bank committed to numerous sustainability initiatives, we were delighted to assist Cypress Creek with this important transaction. It further demonstrates our commitment to the renewable energy sector and global financing target of €18 billion by 2021.”

Cypress Creek was represented by Kirkland & Ellis LLP as its lead transaction counsel and by Kilpatrick Townsend & Stockton LLP as its North Carolina counsel. BNP Paribas was represented by White & Case LLP as its lead transaction counsel with McGuireWoods LLP acting as North Carolina counsel.

Cypress Creek provides ongoing operations and maintenance and asset management for its entire fleet.

About Cypress Creek Renewables

Cypress Creek Renewables is powering a sustainable future, one project at a time. We develop, finance, own and operate utility-scale and distributed facilities across the country. With more than 10.3 gigawatts of solar developed and more than 3.4 gigawatts under management, Cypress Creek is one of the country’s leading solar and storage companies. For more information about Cypress Creek, please visit www.ccrenew.com.


Contacts

MEDIA:
Jamie Nolan for Cypress Creek
This email address is being protected from spambots. You need JavaScript enabled to view it.
410-463-9869

ELMSFORD, N.Y.--(BUSINESS WIRE)--UE Systems, the world leader in ultrasonic instruments & training solutions for predictive maintenance, reliability, condition monitoring and energy saving programs, today announced the release of the OnTrak SmartLube by UE Systems. The new solution from UE Systems uses the power of remote prescriptive monitoring to give lubrication experts a powerful, accurate and easy-to-use software application to monitor bearing friction and remotely lubricate from anywhere, anytime or any supported device.

“We are very excited to announce the release of SmartLube, particularly for businesses that are seeking new ways to avoid the frustrations and costs associated with premature bearing failure,” said Blair Fraser, Global Director, IIoT Solutions at UE Systems. “The availability of SmartLube also gives our customers an incredibly powerful platform to perform lubrication fully remotely. The time savings, safety benefits and simple convenience of being able to identify and perform lubrication tasks without the need to physically attend to a bearing is a tremendous advantage.”

The OnTrak SmartLube system is supported by the market-leading OnTrak IIoT System, a 16 channel IIoT Bearing Monitoring System, and offers access to UE Insights, a cloud-based dashboard and alert-deployment platform. In harmony, with the power of ultrasound technology, the OnTrak SmartLube provides organizations with a game-changing opportunity to monitor, identify and rectify bearing issues independent of time or location. The OnTrak SmartLube is also powered by a unique and powerful learning engine, providing automated suggestions to users ready to partially or totally automate their remote lubrication tasks.

“With the arrival of Covid-19, we are now in a market-space where businesses are being forced like never before to find new ways to balance the health of their staff with the need for operational continuity. This isn’t a puzzle we have put together before and, if we have learned anything, it is that remote enablement is not a fleeting concept. The OnTrak SmartLube is going to help a lot of businesses that are looking to help floor-level employees improve their effectiveness without having to spend unnecessary time in their physical locations,” added Mr. Fraser.

To learn more about UE Systems and the release of the new and transformational OnTrak SmartLube, please visit www.uesystems.com/smartlube or www.uesystems.com.


Contacts

Maureen Gribble, Director of Marketing
Email: This email address is being protected from spambots. You need JavaScript enabled to view it.
Phone: 1-800-223-1325

More truck parking, fuel lanes and showers now available in former Gateway Travel Plaza

WESTLAKE, Ohio--(BUSINESS WIRE)--TravelCenters of America Inc. (Nasdaq: TA), nationwide operator of the TA, Petro Stopping Centers and TA Express travel center network, has opened a new TA Express in Carthage, Texas, a franchise operated by Brian Hatchett. The site, formerly Gateway Travel Plaza, is located on Interstate 20 and U.S. Highway 59.


  • Five diesel fueling positions with RFID and DEF on all lanes
  • 16 Exxon gasoline fueling lanes
  • 50 truck parking and 100 auto parking spaces
  • Four private showers
  • Laundry facilities
  • Travel store
  • Dining options: Denny’s, on-site deli
  • Gaming room
  • Transflo scanning

“We’ve spent many years working hard to build a network of businesses that our customers can trust and rely on,” said Hatchett. “It’s been a pleasure being a franchisee of TravelCenters of America and we look forward to continuing our growth with the company.”

This is the third travel center The Gateway Group has converted to a TA Express in 2020. The team opened a TA Express in Kilgore, Texas in January and another in Nacogdoches, Texas in June. They plan to continue their growth with the company and open a TA travel center in Fairfield, Texas next year.

“With the highest concentration of truck traffic in the nation, we’re pleased to bring more travel centers to the state of Texas,” said Barry Richards, president of TA. “The Gateway Team has a strong, established reputation with professional drivers and we’re proud they chose to align with us as we continue growing our footprint through franchising.”

The opening of TA Express Carthage brings the company’s total nationwide network of travel centers to 271.

About TravelCenters of America

TravelCenters of America Inc. (Nasdaq: TA) is the nation's largest publicly traded full-service travel center network. Founded in 1972 and headquartered in Westlake, Ohio, its more than 20,000 employees serve customers in over 270 locations in 44 states and Canada, principally under the TA®, Petro Stopping Centers® and TA Express® brands. Offerings include diesel and gasoline fuel, truck maintenance and repair, convenience stores, full-service and quick-service restaurants, car and truck parking and other services and amenities dedicated to providing great experiences for professional drivers and the general motoring public. TravelCenters of America operates nearly 650 full-service and quick-service restaurants and 10 proprietary brands, including Quaker Steak and Lube®, Iron Skillet® and Country Pride®. For more information, visit www.ta-petro.com.


Contacts

Tina Arundel
TravelCenters of America
216-389-3028
This email address is being protected from spambots. You need JavaScript enabled to view it.

Releases 2nd Smart Car Operations Report

GUANGZHOU, China--(BUSINESS WIRE)--XPeng Inc. (“XPeng” or the “Company”, NYSE: XPEV), a leading Chinese smart electric vehicle (“Smart EV”) company, this week released its 2nd Smart Car Operations Report, following its 2nd annual Tech Day where the company unveiled its newly developed cutting edge autonomous driving and in-car smart features.


“2020 to 2022 is a period of gaining significant momentum for the Smart EV sector which will rapidly accelerate from 2023 to 2025 and a create massive disruption to traditional ICE vehicles,” said He Xiaopeng, Chairman & CEO of XPeng.

“End-to-end R&D, data-driven capabilities and fast growth are three initiatives needed for a company to gain long-term competitive advantages and dominant market share,” Chairman He added.

At its 2nd Tech Day, XPeng launched 18 firmware OTA updates, adding 82 new features to its vehicles. The voice assistant’s average monthly utilization rate reached 99.74% and in-car navigation utilization rate achieved 92.54%, according to XPeng’s 2020 Smart Car Operations Report.

XPeng’s autonomous driving system XPILOT 3.0, planned for release in the first quarter of 2021, will provide Navigation Guided Pilot (NGP) for highways and memory auto parking for carparks. These new features address some of the major challenges for drivers in China.

Navigation Guided Pilot (NGP)

Built on XPILOT 3.0, the NGP highway solution enables autonomous driving from point A to point B. The solution will be available on all of China’s major highways with high-precision digital maps and will be the most advanced navigation guided autonomous driving system for production models in China.

The NGP system incorporates driving scenarios specific to China such as traffic cone recognition and avoidance, large truck avoidance, night overtaking reminders, faulty vehicle avoidance, and vehicle follow on congested roads. It can also handle adverse weather conditions, complex roads and locations without GPS signals.

The solution will be the only 360° dual-perception system in the industry with optimal identification of automobile surroundings with the most powerful positioning capabilities in production.

Memory Auto Parking

The XPILOT 3.0 will feature a Memory Parking functionality for parking lots. This feature will recognize side-front parking spaces and cover “the last mile” of parking with the ability to avoid obstacles, plan routes and park with extreme precision. The feature is the world's first auto parking system for production vehicles that does not require any car park modifications.

“Our core competitive advantage is our end-to-end in-house developed software for autonomous driving. In the past few years, we have developed a full range of self-developed R&D and implemented these advanced technologies into our models. There are only two auto makers in the world that have end-to-end autonomous driving capabilities and XPeng is one of them,” said XinZhou Wu, Vice President of Autonomous Driving at XPeng.

World’s first All Voice In-car System

XPeng also introduced another update of its Xmart OS operating system with the world’s first All Voice In-car System, able to deliver the majority of in-car functions. The updated system is the world’s first in-car voice system that responds to continuous driver-vehicle dialogues and is able to execute 10 voice commands every 25 seconds.

“Driver-vehicle interaction technology has evolved from physical buttons to touch screens, to today’s voice commands,” said Ji YU, Vice President of Internet at XPeng.

Xmart OS is now the world’s first open-end vehicle hardware system which allows third-party applications to access vehicle status and data to produce tailor-made infotainment. It also has a unique programmable smart lighting system where users can personalize its lighting effects in the future.

Smart Car by Numbers - 2020 Xpeng Operations Report*

XPeng’s 2nd annual Smart Car Operations Report is based on data from XPeng vehicles from Jan 1, 2020 to Sep 30, 2020. The report illustrates the Smart Cars’ most appealing aspects and how customers value smart features.

  • Firmware OTA launched - 18 times in the past 20 months
  • New features added - 82 items
  • Voice assistant monthly average utilization rate - 99.74%
  • In-car navigation utilization rate - 92.54%

Intelligence Makes Driving Easier

Driving range

  • Longest distance driven by a single vehicle - 3,784 km
  • Accumulative monthly mileage driven by all users - 30,300,000 km

Auto Parking

  • Average monthly obstacle avoidance - 9,585 times
  • Average monthly auto parking - 88,000 times
  • Average time taken for auto parking - 32.3 seconds

ACC (Adaptive Cruise Control)

  • Utilization rate/month – 65.59%
  • Average distance driven/month – 2,286,000 km
  • Distance driven/car/day – 24.6 km

LCC (Lane Centering Control)

  • Utilization rate/month – 42.48%
  • Distance driven/month – 1,127,000 km
  • Distance driven/car/day – 21.7 km

Intelligence Makes Interaction Easier

  • Voice Assistant “Xiao P” total activation - 17,910,000 times
  • Intelligent recommendations provided - 4,484,000 items
  • Intelligent navigation routes recommended by voice assistant - 19,170,000 routes

* Data provided by Xpeng Lab based on data from all Xpeng vehicles from 1 January 2020 to 31 September 2020.

About XPeng

XPeng Inc. is a leading Chinese smart electric vehicle company that designs, develops, manufactures, and markets Smart EVs that appeal to the large and growing base of technology-savvy middle-class consumers in China. Its mission is to drive Smart EV transformation with technology and data, shaping the mobility experience of the future. In order to optimize its customers’ mobility experience, XPeng develops in-house its full-stack autonomous driving technology and in-car intelligent operating system, as well as core vehicle systems including powertrain and the electrification/electronic architecture. XPeng is headquartered in Guangzhou, China, with offices in Beijing, Shanghai, Silicon Valley, and San Diego. The Company’s Smart EVs are manufactured at plants in Zhaoqing and Zhengzhou, located in Guangdong and Henan provinces, respectively. For more information, please visit https://en.xiaopeng.com.


Contacts

For Media Enquiries:
Marie Cheung
XPeng Inc.
Tel: +852 9750 5170 / +86 1550 7577 546
E-mail: This email address is being protected from spambots. You need JavaScript enabled to view it.

Capital Investment Projects to Promote Safety and Reliability Through Facility Enhancements

WALL, N.J.--(BUSINESS WIRE)--New Jersey Natural Gas (NJNG), the principal subsidiary of New Jersey Resources (NYSE: NJR), received approval from the New Jersey Board of Public Utilities to invest $150 million over five years on a series of infrastructure projects designed to support the enhanced safety and reliability of its natural gas distribution system.


“As a regulated utility and lifeline service provider, we have a responsibility to provide safe and reliable service. The Board of Public Utilities’ approval today reflects that commitment,” said Steve Westhoven, President and CEO of New Jersey Natural Gas. “Through our Infrastructure Investment Program, we will continue making critical investments to strengthen our world-class delivery system and provide the essential service our customers depend on.”

Originally filed in February 2019, the Infrastructure Investment Program (IIP) consists of a series of 24 natural gas transmission and distribution replacement and enhancement projects, including looping reinforcements, trunk line system upgrades and a regulatory station reconstruction. Other projects include the installation of 47,500 protective devices on regulator vents in flood prone areas, and approximately 8,000 excess flow valves, which automatically restrict the flow of natural gas if a service line is broken. Each of these projects will help further strengthen NJNG’s delivery system and enhance safety, reliability and resiliency

NJNG voluntarily withdrew the information technology (IT) upgrade component of its original filing, and will seek to recover associated costs in a future proceeding. NJNG’s existing IT system was installed between 1994 and 1997 and will no longer have extended support after April 2025. The IT upgrade will update and improve NJNG’s billing, customer service, asset management, work order and accounting systems, as well as strengthen its cybersecurity program.

A typical residential heating customer using 1,000 therms per year could see a cumulative bill impact of 2.4 percent or a total of $28 over the five-year program. Beginning in 2021, NJNG will make annual filings to the BPU to recover the cost for its investments placed in service over the five-year program.

Additionally, NJNG will file a base rate case no later than five years after the implementation of the IIP.

Forward-Looking Statements

Certain statements within this release are forward-looking statements within the meaning of Section 27A of the Securities Act of 1933, as amended, Section 21E of the Securities Exchange Act of 1934, as amended, and the Private Securities Litigation Reform Act of 1995. NJR cautions readers that the assumptions forming the basis for forward-looking statements include many factors that are beyond NJR’s ability to control or estimate precisely, such as estimates of future market conditions and the behavior of other market participants. Words such as “anticipates,” “estimates,” “expects,” “projects,” “may,” “will,” “intends,” “plans,” “believes,” “should” and similar expressions may identify forward-looking statements and such forward-looking statements are made based upon management’s current expectations, assumptions and beliefs as of this date concerning future developments and their potential effect upon NJR. There can be no assurance that future developments will be in accordance with management’s expectations, assumptions and beliefs or that the effect of future developments on NJR will be those anticipated by management. Forward-looking statements in this release include, but are not limited to, certain statements regarding NJNG’s Infrastructure Investment Program, IT upgrade, future rate cases and filings and any impact on residential heating customers’ bills.

Additional information and factors that could cause actual results to differ materially from NJR’s expectations are contained in NJR’s filings with the U.S. Securities and Exchange Commission (SEC), including NJR’s Annual Reports on Form 10-K and subsequent Quarterly Reports on Form 10-Q, recent Current Reports on Form 8-K, and other SEC filings, which are available at the SEC’s web site, http://www.sec.gov. Information included in this release is representative as of today only and while NJR periodically reassesses material trends and uncertainties affecting NJR’s results of operations and financial condition in connection with its preparation of management’s discussion and analysis of results of operations and financial condition contained in its Quarterly and Annual Reports filed with the SEC, NJR does not, by including this statement, assume any obligation to review or revise any particular forward-looking statement referenced herein in light of future events.

About New Jersey Resources

New Jersey Resources (NYSE: NJR) is a Fortune 1000 company that, through its subsidiaries, provides safe and reliable natural gas and clean energy services, including transportation, distribution, asset management and home services. NJR is composed of five primary businesses:

  • New Jersey Natural Gas, NJR’s principal subsidiary, operates and maintains over 7,500 miles of natural gas transportation and distribution infrastructure to serve over half a million customers in New Jersey’s Monmouth, Ocean, Morris, Middlesex and Burlington counties.
  • NJR Clean Energy Venturesinvests in, owns and operates solar projects with a total capacity of more than 350 megawatts, providing residential and commercial customers with low-carbon solutions.
  • NJR Energy Services manages a diversified portfolio of natural gas transportation and storage assets and provides physical natural gas services and customized energy solutions to its customers across North America.
  • NJR Midstream serves customers from local distributors and producers to electric generators and wholesale marketers through its ownership of Leaf River Energy Center and the Adelphia Gateway Pipeline Project, as well as our 50 percent equity ownership in the Steckman Ridge natural gas storage facility, and our 20 percent equity interest in the PennEast Pipeline Project.
  • NJR Home Services provides service contracts as well as heating, central air conditioning, water heaters, standby generators, solar and other indoor and outdoor comfort products to residential homes throughout New Jersey.

NJR and its more than 1,100 employees are committed to helping customers save energy and money by promoting conservation and encouraging efficiency through Conserve to Preserve® and initiatives such as The SAVEGREEN Project® and The Sunlight Advantage®. For more information about NJR: www.njresources.com.

Follow us on Twitter @NJNaturalGas.

“Like” us on facebook.com/NewJerseyNaturalGas.


Contacts

Media:
Michael Kinney
732-938-1031
This email address is being protected from spambots. You need JavaScript enabled to view it.

Investor:
Dennis Puma
732-938-1229
This email address is being protected from spambots. You need JavaScript enabled to view it.

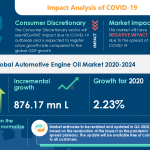
LONDON--(BUSINESS WIRE)--#AutomotiveEngineOilMarket--Technavio has been monitoring the automotive engine oil market and it is poised to grow by 876.17 million L during 2020-2024, progressing at a CAGR of over 3% during the forecast period. The report offers an up-to-date analysis regarding the current market scenario, latest trends and drivers, and the overall market environment. Download a Free Sample Report on COVID-19


Impact of COVID-19

The COVID-19 pandemic continues to transform the growth of various industries. However, the immediate impact of the outbreak is varied. While a few industries will register a drop in demand, numerous others will continue to remain unscathed and show promising growth opportunities. COVID-19 will have a Low impact on the automotive engine oil market. The market growth in 2020 is likely to increase compared to the market growth in 2019.

Frequently Asked Questions-

  • Based on segmentation by vehicle type, which is the leading segment in the market?
  • The passenger vehicles are expected to be the leading segment based on vehicle type in the global market during the forecast period.
  • What are the major trends in the market?
  • APAC driving market revenue is one of the major trends in the market.
  • At what rate is the market projected to grow?
  • Growing at a CAGR of over 3%, the incremental growth of the market is anticipated to be 876.17 million L.
  • Who are the top players in the market?
  • Adolf Würth GmbH & Co. KG, BP Plc, Chevron Corp., China Petroleum & Chemical Corp., Exxon Mobil Corp., MOTUL SA, Petroliam Nasional Berhad, Royal Dutch Shell Plc, TOTAL SA, and Valvoline Inc. are some of the major market participants.
  • What are the key market drivers and challenges?
  • Growing number of vehicles-in-use is one of the major factors driving the market. However, the fluctuating crude oil prices restraints the market growth.
  • How big is the APAC market?
  • The APAC region will contribute 54% of market growth.

Buy 1 Technavio report and get the second for 50% off. Buy 2 Technavio reports and get the third for free.

View market snapshot before purchasing

The market is fragmented, and the degree of fragmentation will accelerate during the forecast period. Adolf Wurth GmbH & Co. KG, BP Plc, Chevron Corp., China Petrochemical Corp., Exxon Mobil Corp., MOTUL SA, Petroliam Nasional Berhad, Royal Dutch Shell Plc, Total SA, and Valvoline Inc. are some of the major market participants. The growing number of vehicles-in-use will offer immense growth opportunities. In a bid to help players strengthen their market foothold, this automotive engine oil market forecast report provides a detailed analysis of the leading market vendors. The report also empowers industry honchos with information on the competitive landscape and insights into the different product offerings offered by various companies.

Technavio's custom research reports offer detailed insights on the impact of COVID-19 at an industry level, a regional level, and subsequent supply chain operations. This customized report will also help clients keep up with new product launches in direct & indirect COVID-19 related markets, upcoming vaccines and pipeline analysis, and significant developments in vendor operations and government regulations.

Automotive Engine Oil Market 2020-2024: Segmentation

Automotive Engine Oil Market is segmented as below:

  • Type
    • Passenger Vehicles
    • Commercial Vehicles
  • Geography
    • APAC
    • Europe
    • North America
    • MEA
    • South America

To learn more about the global trends impacting the future of market research, download a free sample: https://www.technavio.com/talk-to-us?report=IRTNTR43839

Automotive Engine Oil Market 2020-2024: Scope

Technavio presents a detailed picture of the market by the way of study, synthesis, and summation of data from multiple sources. The automotive engine oil market report covers the following areas:

  • Automotive Engine Oil Market Size
  • Automotive Engine Oil Market Trends
  • Automotive Engine Oil Market Analysis

This study identifies APAC driving market revenue as one of the prime reasons driving the automotive engine oil market growth during the next few years.

Technavio suggests three forecast scenarios (optimistic, probable, and pessimistic) considering the impact of COVID-19. Technavio’s in-depth research has direct and indirect COVID-19 impacted market research reports.

Register for a free trial today and gain instant access to 17,000+ market research reports.

Technavio's SUBSCRIPTION platform

Automotive Engine Oil Market 2020-2024: Key Highlights

  • CAGR of the market during the forecast period 2020-2024
  • Detailed information on factors that will assist automotive engine oil market growth during the next five years
  • Estimation of the automotive engine oil market size and its contribution to the parent market
  • Predictions on upcoming trends and changes in consumer behavior
  • The growth of the automotive engine oil market
  • Analysis of the market’s competitive landscape and detailed information on vendors
  • Comprehensive details of factors that will challenge the growth of automotive engine oil market vendors

Table of Contents:

Executive Summary

Market Landscape

  • Market ecosystem
  • Value chain analysis

Market Sizing

  • Market definition
  • Market segment analysis
  • Market size 2019
  • Market outlook: Forecast for 2019 - 2024

Five Forces Analysis

  • Five forces summary
  • Bargaining power of buyers
  • Bargaining power of suppliers
  • Threat of new entrants
  • Threat of substitutes
  • Threat of rivalry
  • Market condition

Market Segmentation by Vehicle Type

  • Market segments
  • Comparison by Vehicle Type
  • Passenger vehicles - Market size and forecast 2019-2024
  • Commercial vehicles - Market size and forecast 2019-2024
  • Market opportunity by Vehicle type

Customer Landscape

Geographic Landscape

  • Geographic segmentation
  • Geographic comparison
  • APAC - Market size and forecast 2019-2024
  • Europe - Market size and forecast 2019-2024
  • North America - Market size and forecast 2019-2024
  • MEA - Market size and forecast 2019-2024
  • South America - Market size and forecast 2019-2024
  • Key leading countries
  • Market opportunity by geography
  • Market drivers
  • Market challenges
  • Market trends

Vendor Landscape

  • Vendor landscape
  • Landscape disruption

Vendor Analysis

  • Vendors covered
  • Market positioning of vendors
  • Adolf Wurth GmbH & Co. KG
  • BP Plc
  • Chevron Corp.
  • China Petrochemical Corp.
  • Exxon Mobil Corp.
  • MOTUL SA
  • Petroliam Nasional Berhad
  • Royal Dutch Shell Plc
  • Total SA
  • Valvoline Inc.

Appendix

  • Scope of the report
  • Currency conversion rates for US$
  • Research methodology
  • List of abbreviations

About Us

Technavio is a leading global technology research and advisory company. Their research and analysis focuses on emerging market trends and provides actionable insights to help businesses identify market opportunities and develop effective strategies to optimize their market positions. With over 500 specialized analysts, Technavio’s report library consists of more than 17,000 reports and counting, covering 800 technologies, spanning across 50 countries. Their client base consists of enterprises of all sizes, including more than 100 Fortune 500 companies. This growing client base relies on Technavio’s comprehensive coverage, extensive research, and actionable market insights to identify opportunities in existing and potential markets and assess their competitive positions within changing market scenarios.


Contacts

Technavio Research
Jesse Maida
Media & Marketing Executive
US: +1 844 364 1100
UK: +44 203 893 3200
Email: This email address is being protected from spambots. You need JavaScript enabled to view it.
Website: www.technavio.com/

VALLEY FORGE, Pa.--(BUSINESS WIRE)--UGI Corporation (NYSE:UGI) will announce the results of its fiscal year 2020 earnings after the market closes on November 18. The company will hold a live internet audio webcast of its conference call to discuss results and other current activities at 9:00 AM ET on Thursday, November 19.


Interested parties may listen to the audio webcast both live and in replay on the Internet at https://edge.media-server.com/mmc/p/9r7ezwun or by visiting the company website https://www.ugicorp.com and clicking on Investors and Presentations.

A telephonic replay will be available from 12:00 PM ET on November 19 through 11:59 PM ET November 26. The replay may be accessed toll free at 855-859-2056 and internationally at 404-537-3406, conference ID 1794805, web PIN 9727.

About UGI

UGI Corporation is a distributor and marketer of energy products and services. Through subsidiaries, UGI operates natural gas and electric utilities in Pennsylvania, distributes LPG both domestically (through AmeriGas) and internationally (through UGI International), manages midstream energy assets in Pennsylvania, Ohio, and West Virginia and electric generation assets in Pennsylvania, and engages in energy marketing in twelve states, the District of Columbia and internationally in France, Belgium, the Netherlands and the UK.

Comprehensive information about UGI Corporation is available on the Internet at https://www.ugicorp.com.


Contacts

CONTACT INVESTOR RELATIONS
610-337-1000
Brendan Heck, ext. 6608
Shelly Oates, ext. 3202
Alanna Zahora, ext. 1004

WASHINGTON & CHICAGO--(BUSINESS WIRE)--Nodal Exchange and IncubEx today announced the upcoming launch of seven new Renewable Energy Certificate (REC) futures and options on November 17, 2020.


Pending regulatory review, Nodal will list physically-delivered futures contracts on:

  • M-RETS® Renewable Energy Certificates from Center for Resource Solutions (CRS) Listed Wind Energy Facilities (front-half and back-half)
  • Texas Compliance Solar Renewable Energy Certificates from CRS Listed Facilities (front-half and back-half) and
  • New York Renewable Energy Certificates Tier 1

Nodal also will add option contracts on Texas Compliance Renewable Energy Certificates from CRS Listed Facilities (front-half and back-half), complementing the corresponding futures contracts listed in December 2019. Since launch, more than 14,000 Texas CRS Listed Wind futures contracts have traded, representing 14 million MWh of wind energy (enough power to serve about 1.3 million homes for a year).

Each of the new futures and options contracts are the first of their kind on any exchange.

"The new M-RETS® CRS Listed Wind Futures, Texas CRS Listed Solar Futures and Options on the Texas CRS Listed Wind contracts are a reflection of the expansion of public and private sustainability commitments and accompanying demand and convergence in voluntary and compliance environmental commodities," said Stephen McComb, Senior Vice President of IncubEx.

The M-RETS® wind futures contracts are based on RECs from M-RETS, a registry that tracks in all North American states and provinces and is the system of record for various state/province Renewable Portfolio Standards (RPS) programs. The M-RETS® wind and Texas solar contracts, along with the existing Texas wind REC contract, each deliver RECs from facilities registered with Center for Resource Solutions (CRS) in accordance with its Green-e® renewable energy certification program.

“As M-RETS continues to grow our footprint across North America, we are leading a transformation in the way environmental commodity markets function. We see the benefits of a more liquid, listed marketplace working with companies like Nodal and IncubEx who share our entrepreneurial spirit and drive to innovate. We continue to advance the data available to consumers about the energy they consume and its impact on the grid and environment. Collaborations that drive liquidity, transparency, and market integrity such as this are critical to meeting the future we envision,” said Ben Gerber, President and CEO of M-RETS.

CRS’s Green-e® certification program is the leading independent consumer protection program for the sale of renewable energy and greenhouse gas reductions in the retail market. In 2018, more than 62 million MWh of clean energy was certified by Green-e Energy, the certification program for clean energy and carbon offset programs offered to businesses and consumers in North America.

The new contracts, developed with Nodal's partner IncubEx, further extends the broadest suite of exchange listed environmental products in the world and builds on the carbon, REC and renewable fuels credit futures and options now offered on Nodal. Including eight previously announced RIN futures and options also due to launch on November 17, 2020 and the new REC contracts, Nodal will feature 82 futures and options contracts on 49 distinct environmental markets.

"In just 24 months, Nodal Exchange has introduced more than 80 environmental market contracts in North America, the largest environmental contract offering in the world," said Paul Cusenza, Chairman and CEO of Nodal Exchange. "Working with our partners at IncubEx, we are proud to be serving the critical environmental markets in North America with our unmatched offering in environmental futures and options."

About M-RETS

M-RETS is a proprietary web-based data platform that tracks Renewable Energy Certificates (“RECs”) and Renewable Thermal Certificates (“RTCs”). M-RETS facilitates environmental attribute transactions by issuing a unique, traceable digital certificate for every unit of renewable energy recorded. M-RETS users can choose to retire certificates either to comply with state mandates or to fulfill their voluntary commitments with our platform ensuring that certificates are not double-counted. M-RETS incorporated in 2007 and now registers projects across all North America.

M-RETS goal is to provide data to market users that enables better decisions about the energy they are consuming and their impact on the grid. In 2019 M-RETS became the first environmental attribute registry with the ability to capture and track hourly generation data. M-RETS is deploying additional ancillary data integrations across North America to help drive innovation. M-RETS empowers regulators and voluntary participants with tools and the capability to increase data granularity, resulting in a better understanding of the carbon impact of greater renewable penetrations.

About IncubEx

IncubEx is an incubator for exchange traded products, services, and technology solutions. At its core, IncubEx is a product and business development firm. The company works in conjunction with its global exchange partner, European Energy Exchange (EEX), Nodal Exchange and other leading service providers and stakeholders to design and develop new financial products in global environmental, reinsurance, and related commodity markets. The company has a specific focus on innovation and continuous improvement of products and services, including technology, trading solutions, and operational efficiencies. The IncubEx team is led by former key Climate Exchange executives and is uniquely positioned to capture these opportunities with its partners. The company was founded in 2016 and currently has offices in Chicago and London.

About Nodal

Nodal Exchange is a derivatives exchange providing price, credit and liquidity risk management solutions to participants in the North American commodities markets. Nodal Exchange is a leader in innovation, having introduced the world’s largest set of electric power locational (nodal) futures contracts. As part of EEX Group, a group of companies serving international commodity markets, Nodal Exchange currently offers over 1,000 contracts on hundreds of unique locations, providing the most effective basis risk management available to market participants. In addition, Nodal Exchange offers natural gas and environmental contracts. All Nodal Exchange contracts are cleared by Nodal Clear which is a CFTC registered derivatives clearing organization. Nodal Exchange is a designated contract market regulated by the CFTC.


Contacts

Jim Kharouf
IncubEx Communications Director
Phone: 773-391-0439
Email: This email address is being protected from spambots. You need JavaScript enabled to view it.

Nicole Ricard
Nodal Exchange Managing Director of Marketing
Phone: 703-962-9816
E-mail: This email address is being protected from spambots. You need JavaScript enabled to view it.

Ben Gerber
M-RETS, President & Chief Executive Officer
Phone: 651-789-3338
E-mail: This email address is being protected from spambots. You need JavaScript enabled to view it.

  • Net Sales of $532 million, up 41% from the second quarter of 2020
  • Net Income of $77 million
  • Diluted EPS of $0.68
  • Adjusted EBITDA of $174 million

INDIANAPOLIS--(BUSINESS WIRE)--Allison Transmission Holdings Inc. (NYSE: ALSN), the largest global manufacturer of medium- and heavy-duty fully automatic transmissions and a supplier of commercial vehicle propulsion solutions, including electric hybrid and fully electric propulsion systems, today reported net sales for the third quarter of $532 million, a 20 percent decrease from the same period in 2019 and a 41 percent increase from the second quarter of 2020.


Net income for the quarter was $77 million. Adjusted EBITDA, a non-GAAP financial measure, for the quarter was $174 million. Net cash provided by operating activities for the quarter was $158 million. Adjusted free cash flow, a non-GAAP financial measure, for the quarter was $136 million.

David S. Graziosi, President and Chief Executive Officer of Allison Transmission commented, “Despite the challenges presented by the pandemic, third quarter results improved significantly, as customer demand and the global economy continued to recover, following the severe disruptions experienced in the second quarter. Furthermore, the commitment, dedication and resilience of Allison’s employees, customers and suppliers have enabled the uninterrupted delivery of our products, and the continued generation of earnings and positive cash flow.”

Graziosi continued, “We will continue to prioritize the health and well-being of Allison’s extended family and align our operations, programs and spending with current end market conditions, while mitigating the risks that we anticipate will persist for the foreseeable future and maintaining the flexibility to respond quickly and appropriately. During the third quarter, we settled $16 million in share repurchases and paid a dividend of $0.17 per share. Allison remains well capitalized and positioned to realize future growth opportunities, due to our long-standing commitment to prudent balance sheet management, ample liquidity and profitable operations.”

Third Quarter Net Sales by End Market


End Market

Q3 2020

Net Sales ($M)

Q3 2019

Net Sales ($M)


% Variance

North America On-Highway

$281

$369

(24%)

North America Off-Highway

$1

$6

(83%)

Defense

$56

$40

40%

Outside North America On-Highway

$71

$99

(28%)

Outside North America Off-Highway

$4

$24

(83%)

Service Parts, Support Equipment & Other

$119

$131

(9%)

Total Net Sales

$532

$669

(20%)

Third Quarter Highlights

North America On-Highway end market net sales were down 24 percent from the same period in 2019 principally driven by lower demand for Rugged Duty Series and Highway Series models as a result of the effects of the pandemic, and up 71 percent on a sequential basis as the severe economic weakness and customer shutdowns experienced during the second quarter abated and a rebound in relevant business activity generated improved demand for both Medium Duty and Class 8 Straight trucks.

North America Off-Highway end market net sales were down $5 million from the same period in 2019 and down $2 million sequentially, in both cases principally driven by lower demand for hydraulic fracturing applications.

Defense end market net sales were up 40 percent from the same period in 2019 and up 33 percent on a sequential basis, in both cases principally driven by tracked vehicle applications, including contracts announced earlier this year for Allison’s X1100 and X200 cross-drive transmissions in support of the U.S. Army’s long-term sustainment and combat readiness efforts.

Outside North America On-Highway end market net sales were down 28 percent from the same period in 2019 principally driven by lower global demand due to the effects of the pandemic and up 18 percent sequentially as global customers resumed production following shutdowns implemented in the second quarter.

Outside North America Off-Highway end market net sales were down $20 million from the same period in 2019 and down $15 million on a sequential basis, in both cases principally driven by lower demand in the energy, mining and construction sectors.

Service Parts, Support Equipment & Other end market net sales were down 9 percent from the same period in 2019 principally driven by lower demand for North America service parts and support equipment partially offset by aluminum die cast component volume associated with the acquisition of Walker Die Casting in September 2019, and up 34 percent sequentially principally driven by higher demand for aluminum die cast component volume, North America On-Highway service parts and support equipment.

Gross profit for the quarter was $254 million, a decrease of 27 percent from $348 million for the same period in 2019. Gross margin for the quarter was 47.7 percent, a decrease of 430 basis points from a gross margin of 52.0 percent for the same period in 2019. The decrease in gross profit was principally driven by lower net sales partially offset by lower manufacturing expense commensurate with decreased net sales, price increases on certain products and lower incentive compensation expense.

Selling, general and administrative expenses for the quarter were $93 million, an increase of $8 million from $85 million for the same period in 2019. The increase was principally driven by unfavorable product warranty adjustments partially offset by lower intangible amortization expense, lower commercial activities spending and lower incentive compensation expense.

During the third quarter, a $23 million product warranty adjustment was recorded to address a transmission performance issue associated with shift quality in a defined population of products.

Engineering – research and development expenses for the quarter were $33 million, a decrease of $6 million from $39 million for the same period in 2019. The decrease was principally driven by the intra-year timing of product initiatives spending.

Net income for the quarter was $77 million, a decrease of $72 million from $149 million for the same period in 2019. The decrease was principally driven by lower net sales and higher selling, general and administrative expenses partially offset by lower manufacturing expense, price increases on certain products and the intra-year timing of product initiatives spending.

Net cash provided by operating activities was $158 million, a decrease of $54 million from $212 million for the same period in 2019. The decrease was principally driven by lower gross profit partially offset by reductions in cash income taxes, operating working capital requirements and commercial activities spending, and the intra-year timing of product initiatives spending.

Third Quarter Non-GAAP Financial Measures

Adjusted EBITDA for the quarter was $174 million, a decrease of $95 million from $269 million for the same period in 2019. The decrease in Adjusted EBITDA was principally driven by lower gross profit and unfavorable product warranty adjustments partially offset by lower commercial activities spending and the intra-year timing of product initiatives spending.

Adjusted free cash flow for the quarter was $136 million, a decrease of $29 million from $165 million for the same period in 2019. The decrease was principally driven by lower net cash provided by operating activities partially offset by lower capital expenditures and the exclusion of cash restructuring charges.

Full Year 2020 Guidance

Allison expects 2020 Net Sales in the range of $2,025 to $2,075 million, Net Income in the range of $285 to $315 million, Adjusted EBITDA in the range of $690 to $730 million, Net Cash Provided by Operating Activities in the range of $490 to $520 million, Adjusted Free Cash Flow in the range of $385 to $425 million and Capital Expenditures in the range of $107 to $117 million.

Our full year 2020 Net Sales guidance reflects lower demand across all end markets except for the Defense end market as a result of the pandemic, partially offset by price increases on certain products.

Conference Call and Webcast

The company will host a conference call at 8:00 a.m. ET on Thursday, October 29 to discuss its third quarter 2020 results. The dial-in phone number for the conference call is 1-877-425-9470 and the international dial-in number is 1-201-389-0878. A live webcast of the conference call will also be available online at http://ir.allisontransmission.com.

For those unable to participate in the conference call, a replay will be available from 11:00 a.m. ET on October 29 until 11:59 p.m. ET on November 5. The replay dial-in phone number is 1-844-512-2921 and the international replay dial-in number is 1-412-317-6671. The replay passcode is 13710663.

About Allison Transmission

Allison Transmission (NYSE: ALSN) is the world’s largest manufacturer of fully automatic transmissions for medium- and heavy-duty commercial vehicles and medium- and heavy-tactical U.S. defense vehicles, as well as a supplier of commercial vehicle propulsion solutions, including electric hybrid and fully electric propulsion systems. Allison products are used in a wide variety of applications, including on-highway trucks (distribution, refuse, construction, fire and emergency), buses (school, transit and coach), motorhomes, off-highway vehicles and equipment (energy, mining and construction applications) and defense vehicles (wheeled and tracked). Founded in 1915, the company is headquartered in Indianapolis, Indiana, USA. With a market presence in more than 80 countries, Allison has regional headquarters in the Netherlands, China and Brazil with manufacturing facilities in the U.S., Hungary and India. Allison also has approximately 1,500 independent distributor and dealer locations worldwide. For more information, visit allisontransmission.com.

Forward-Looking Statements

This press release contains forward-looking statements. All statements other than statements of historical fact contained in this press release are forward-looking statements, including all statements regarding future financial results or expected ability to re-open our facilities promptly. In some cases, you can identify forward-looking statements by terminology such as “may,” “will,” “should,” “expect,” “plans,” “project,” “anticipate,” “believe,” “estimate,” “predict,” “intend,” “forecast,” “could,” “potential,” “continue” or the negative of these terms or other similar terms or phrases. Forward-looking statements are not guarantees of future performance and involve known and unknown risks. Factors which may cause the actual results to differ materially from those anticipated at the time the forward-looking statements are made include, but are not limited to: the duration and spread of the COVID-19 outbreak, mitigating efforts deployed by government agencies and the public at large, and the overall impact from such outbreak on economic conditions, financial market volatility and our business, including but not limited to the operations of our manufacturing and other facilities, our supply chain, our distribution processes and demand for our products and the corresponding impacts to our net sales and cash flow; risks related to our substantial indebtedness; our participation in markets that are competitive; the highly cyclical industries in which certain of our end users operate; uncertainty in the global regulatory and business environments in which we operate; our ability to prepare for, respond to and successfully achieve our objectives relating to technological and market developments, competitive threats and changing customer needs; the concentration of our net sales in our top five customers and the loss of any one of these; the failure of markets outside North America to increase adoption of fully-automatic transmissions; U.S. and foreign defense spending; general economic and industry conditions; increases in cost, disruption of supply or shortage of raw materials or components used in our products; the discovery of defects in our products, resulting in delays in new model launches, recall campaigns and/or increased warranty costs and reduction in future sales or damage to our brand and reputation; risks associated with our international operations, including increased trade protectionism; labor strikes, work stoppages or similar labor disputes, which could significantly disrupt our operations or those of our principal customers; our intention to pay dividends and repurchase shares of our common stock and other risks and uncertainties associated with our business described in our Annual Report on Form 10-K, Quarterly Reports on Form 10-Q and Current Reports on Form 8-K. Although we believe the expectations reflected in such forward-looking statements are based upon reasonable assumptions, we can give no assurance that the expectations will be attained or that any deviation will not be material. All information is as of the date of this press release, and we undertake no obligation to update any forward-looking statement to conform the statement to actual results or changes in expectations.

Use of Non-GAAP Financial Measures

This press release contains information about Allison’s financial results and forward-looking estimates of financial results which are not presented in accordance with accounting principles generally accepted in the United States ("GAAP"). Such non-GAAP financial measures are reconciled to their closest GAAP financial measures at the end of this press release. Non-GAAP financial measures should not be considered in isolation or as a substitute for our reported results prepared in accordance with GAAP and, as calculated, may not be comparable to other similarly titled measures of other companies.

We use Adjusted EBITDA and Adjusted EBITDA as a percent of net sales to measure our operating profitability. We believe that Adjusted EBITDA and Adjusted EBITDA as a percent of net sales provide management, investors and creditors with useful measures of the operational results of our business and increase the period-to-period comparability of our operating profitability and comparability with other companies. Adjusted EBITDA as a percent of net sales is also used in the calculation of management’s incentive compensation program. The most directly comparable GAAP measure to Adjusted EBITDA is Net income. The most directly comparable GAAP measure to Adjusted EBITDA as a percent of net sales is Net Income as a percent of net sales. Adjusted EBITDA is calculated as the earnings before interest expense, income tax expense, amortization of intangible assets, depreciation of property, plant and equipment and other adjustments as defined by Allison Transmission, Inc.’s, the Company’s wholly-owned subsidiary, Second Amended and Restated Credit Agreement. Adjusted EBITDA as a percent of net sales is calculated as Adjusted EBITDA divided by net sales.

We use Adjusted Free Cash Flow to evaluate the amount of cash generated by our business that, after the capital investment needed to maintain and grow our business and certain mandatory debt service requirements, can be used for the repayment of debt, stockholder distributions and strategic opportunities, including investing in our business. We believe that Adjusted Free Cash Flow enhances the understanding of the cash flows of our business for management, investors and creditors. Adjusted Free Cash Flow is also used in the calculation of management’s incentive compensation program. The most directly comparable GAAP measure to Adjusted Free Cash Flow is Net cash provided by operating activities. Adjusted Free Cash Flow is calculated as Net cash provided by operating activities, excluding non-recurring restructuring charges, after additions of long-lived assets.

Attachments

  • Condensed Consolidated Statements of Operations
  • Condensed Consolidated Balance Sheets
  • Condensed Consolidated Statements of Cash Flows
  • Reconciliation of GAAP to Non-GAAP Financial Measures
  • Reconciliation of GAAP to Non-GAAP Financial Measures for Full Year Guidance
Allison Transmission Holdings, Inc.
Condensed Consolidated Statements of Operations
(Unaudited, dollars in millions, except per share data)
 
Three months ended September 30, Nine months ended September 30,


2020


2019


2020


2019


Net sales

$

532


$

669


$

1,546


$

2,081


Cost of sales


278


321


801


985


Gross profit


254


348


745


1,096


Selling, general and administrative


93


85


237


262


Engineering - research and development


33


39


107


107


Operating income


128


224


401


727


Interest expense, net


(34

)


(32

)


(100

)


(101

)

Other income, net


4


2


8


8


Income before income taxes


98


194


309


634


Income tax expense


(21

)


(45

)


(70

)


(137

)

Net income

$

77


$

149


$

239


$

497


Basic earnings per share attributable to common stockholders

$

0.68


$

1.24


$

2.10


$

4.04


Diluted earnings per share attributable to common stockholders

$

0.68


$

1.23


$

2.10


$

4.01


Allison Transmission Holdings, Inc.
Condensed Consolidated Balance Sheets
(Unaudited, dollars in millions)
 
September 30, December 31,


2020


2019

ASSETS
Current Assets
Cash and cash equivalents

$

251

$

192

Accounts receivable, net


245


253

Inventories


177


199

Other current assets


37


42

Total Current Assets


710


686

 
Property, plant and equipment, net


636


616

Intangible assets, net


975


1,042

Goodwill


2,063


2,041

Other non-current assets


62


65

TOTAL ASSETS

$

4,446

$

4,450

 
LIABILITIES
Current Liabilities
Accounts payable

$

133

$

150

Product warranty liability


34


24

Current portion of long-term debt


6


6

Deferred revenue


33


35

Other current liabilities


176


202

Total Current Liabilities


382


417

 
Product warranty liability


31


28

Deferred revenue


107


104

Long-term debt


2,510


2,512

Deferred income taxes


424


387

Other non-current liabilities


246


221

TOTAL LIABILITIES


3,700


3,669

 
TOTAL STOCKHOLDERS' EQUITY


746


781

TOTAL LIABILITIES & STOCKHOLDERS' EQUITY

$

4,446

$

4,450

Allison Transmission Holdings, Inc.
Condensed Consolidated Statements of Cash Flows
(Unaudited, dollars in millions)
 

Three months ended September 30,

Nine months ended September 30,


2020


2019


2020


2019


Net cash provided by operating activities (a)

$

158


$

212


$

398


$

645


Net cash used for investing activities (b) (c)


(31

)


(146

)


(76

)


(323

)

 
Net cash used for financing activities


(312

)


(65

)


(263

)


(399

)

 
Effect of exchange rate changes on cash


2


(2

)


-


(2

)

 
Net (decrease) increase in cash and cash equivalents


(183

)


(1

)


59


(79

)

 
Cash and cash equivalents at beginning of period


434


153


192


231


Cash and cash equivalents at end of period

$

251


$

152


$

251


$

152


Supplemental disclosures:
Interest paid

$

8


$

10


$

73


$

63


Income taxes paid

$

5


$

29


$

13


$

84


(a) Restructuring charges

$

(9

)

$

-


$

(12

)

$

-


(b) Business acquisitions

$

-


$

(99

)

$

4


$

(232

)

(c) Additions of long-lived assets

$

(31

)

$

(47

)

$

(80

)

$

(91

)

Allison Transmission Holdings, Inc.
Reconciliation of GAAP to Non-GAAP Financial Measures
(Unaudited, dollars in millions)
 
Three months ended Nine months ended
September 30, September 30,


2020


2019


2020


2019


Net income (GAAP)

$

77


$

149


$

239


$

497


plus:
Interest expense, net


34


32


100


101


Depreciation of property, plant and equipment


25


20


71


57


Income tax expense


21


45


70


137


Amortization of intangible assets


11


22


40


65


Restructuring charges (a)


-


-


12


-


Stock-based compensation expense (b)


6


2


11


10


Unrealized loss on foreign exchange (c)


-


-


2


-


Acquisition-related earnouts (d)


-


-


1


-


Expenses related to long-term debt refinancing (e)


-


-


-


1


UAW Local 933 retirement incentive (f)


-


(1

)


-


(1

)

Adjusted EBITDA (Non-GAAP)

$

174


$

269


$

546


$

867


Net sales (GAAP)

$

532


$

669


$

1,546


$

2,081


Net income as a percent of net sales (GAAP)


14.5

%


22.3

%


15.5

%


23.9

%

Adjusted EBITDA as a percent of net sales (Non-GAAP)


32.7

%


40.2

%


35.3

%


41.7

%

 
Net cash provided by operating activities (GAAP)

$

158


$

212


$

398


$

645


Deductions to Reconcile to Adjusted Free Cash Flow:
Additions of long-lived assets


(31

)


(47

)


(80

)


(91

)

Restructuring charges (a)


9


-


12


-


Adjusted free cash flow (Non-GAAP)

$

136


$

165


$

330


$

554


(a) Represents restructuring charges (recorded in Cost of sales, Selling, general and administrative, and Engineering – research and development) related to voluntary and involuntary separation programs for hourly and salaried employees in the second quarter of 2020.
(b) Represents stock-based compensation expense (recorded in Cost of sales, Selling, general and administrative, and Engineering – research and development).
(c) Represents losses (recorded in Other income, net) on intercompany financing transactions related to investments in plant assets for our India facility.
(d) Represents expense (recorded in Selling, general and administrative and Engineering - research and development) for earnouts related to our acquisition of Vantage Power Limited.
(e) Represents expenses (recorded in Other income, net) related to the refinancing of the prior term loan due 2022 and prior revolving credit facility due 2021 in the first quarter of 2019.
(f) Represents a charge (recorded in Cost of sales) related to a retirement incentive program for certain employees represented by the International Union, United Automobile, Aerospace and Agricultural Implement Workers of America (“UAW”) pursuant to the UAW Local 933 collective bargaining agreement effective through November 2023.

Allison Transmission Holdings, Inc.

Reconciliation of GAAP to Non-GAAP Financial Measures for Full Year Guidance

(Unaudited, dollars in millions)

 
Guidance
Year Ending December 31, 2020
Low High
Net Income (GAAP)

$

285


$

315


plus:
 
Depreciation and amortization


150


150


Interest expense, net


133


133


Income tax expense


83


93


Stock-based compensation expense (a)


15


15


Restructuring charges (b)


12


12


UAW Local 933 retirement incentive (c)


9


9


Unrealized loss on foreign exchange (d)


2


2


Acquisition-related earnouts (e)


1


1


Adjusted EBITDA (Non-GAAP)

$

690


$

730


Net Cash Provided by Operating Activities (GAAP)

$

490


$

520


(Deductions) or Additions to Reconcile to Adjusted Free Cash Flow:
Additions of long-live assets

$

(117

)

$

(107

)

Restructuring charges (b)


12


12


Adjusted Free Cash Flow (Non-GAAP)

$

385


$

425


(a) Represents stock-based compensation expense (recorded in Cost of sales, Selling, general and administrative, and Engineering – research and development).
(b) Represents restructuring charges (recorded in Cost of sales, Selling, general and administrative, and Engineering – research and development) related to voluntary and involuntary separation programs for hourly and salaried employees in the second quarter of 2020.
(c) Represents a charge (recorded in Cost of sales) related to a retirement incentive program for certain employees represented by the UAW pursuant to the UAW Local 933 collective bargaining agreement effective through November 2023.
(d) Represents losses (recorded in Other income, net) on intercompany financing transactions related to investments in plant assets for our India facility.
(e) Represents expense (recorded in Selling, general and administrative and Engineering - research and development) for earnouts related to our acquisition of Vantage Power Limited.


Contacts

Raymond Posadas
Managing Director, Investor Relations
This email address is being protected from spambots. You need JavaScript enabled to view it.
(317) 242-3078

Media Relations
This email address is being protected from spambots. You need JavaScript enabled to view it.
(317) 242-5000

ORANGE, Conn.--(BUSINESS WIRE)--Today, AVANGRID Inc. (NYSE: AGR) announced that it will hold its 2020 Investor Day virtually on Thursday, November 5, 2020 beginning at 1:00 PM ET. AVANGRID’s Executive team will present an update of the Company’s strategic initiatives, financial outlook and growth strategy, followed by a question and answer session.

“We have concluded a detailed review of operations and updated our financial outlook and now are prepared to share our strategic growth plan at our upcoming Investor Day,” commented Dennis V. Arriola, chief executive officer of AVANGRID. “We look forward to sharing our strategic direction that is driven by our ESG+F goals as well as our key priorities and investment plan. Our strategy will help demonstrate why we believe that AVANGRID can become the leading, sustainable energy company in the U.S.”

Information for virtual attendance for the live video webcast and presentation can be found in the Investor Relations section of the AVANGRID website at www.avangrid.com. Interested parties unable to attend the live webcast will be able to view and listen to an archived copy of the event, which will be available on www.avangrid.com following the conclusion of the event.

About AVANGRID: AVANGRID, Inc. (NYSE: AGR) is a leading, sustainable energy company with approximately $36 billion in assets and operations in 24 U.S. states. With headquarters in Orange, Connecticut, AVANGRID has two primary lines of business: Avangrid Networks and Avangrid Renewables. Avangrid Networks owns eight electric and natural gas utilities, serving more than 3.3 million customers in New York and New England. Avangrid Renewables owns and operates a portfolio of renewable energy generation facilities across the United States. AVANGRID employs approximately 6,600 people. AVANGRID supports the U.N.’s Sustainable Development Goals and was named among the World’s Most Ethical Companies in 2019 and 2020 by the Ethisphere Institute. For more information, visit www.avangrid.com.


Contacts

Analysts: Patricia Cosgel, This email address is being protected from spambots. You need JavaScript enabled to view it., 203-499-2624
Media: Zsoka McDonald, This email address is being protected from spambots. You need JavaScript enabled to view it., 203-997-6892

  • Double Digit Growth in Revenues and Adjusted EBITDA, Led by Construction Products
  • Free Cash Flow of $93 Million, Demonstrating Additional Progress on Cash Culture
  • Long-Term Vision Advanced with Acquisitions in Construction Products and Engineered Structures

DALLAS--(BUSINESS WIRE)--Arcosa, Inc. (NYSE: ACA) (“Arcosa,” the “Company,” “We,” or “Our”), a provider of infrastructure-related products and solutions, today announced results for the third quarter ended September 30, 2020.

Third Quarter Highlights (All comparisons are versus the prior-year quarter unless noted otherwise)

  • Revenues increased 10% to $490.0 million
  • Net income of $31.2 million and Adjusted Net Income of $33.3 million
  • Diluted EPS of $0.64 and Adjusted Diluted EPS of $0.68, unchanged year-over-year
  • Adjusted EBITDA increased 12% to $73.0 million
  • Operating cash flow of $106.4 million; free cash flow of $93.1 million, with free cash flow conversion of 300% of net income
  • Net debt to Adjusted EBITDA of 0.2X, for the trailing twelve months and total liquidity of $563 million, including cash of $189 million

COVID-19 Update

  • The health and safety of our employees and the communities in which we operate remains our top concern
  • Protocols are enhanced continuously to meet or exceed Centers for Disease Control (CDC) standards and other guidelines
  • Plants have continued to operate throughout the crisis
  • Our businesses support critical infrastructure sectors, as defined by the Department of Homeland Security’s Cybersecurity and Infrastructure Security Agency (CISA.gov)

“Our third quarter results demonstrate the overall resilience of our portfolio and our continued progress in repositioning the company around core infrastructure products,” commented Antonio Carrillo, President and Chief Executive Officer. “Our year-over-year revenue and Adjusted EBITDA growth are significant achievements given COVID-related economic uncertainty and an unusual number of major weather events in Houston and on the Gulf Coast.

“Our Construction Products group reported growth across all key metrics, driven by continued strong performance by Cherry and our aggregates business, and our barge business benefitted from significant operating efficiencies that led to impressive margins.

“Order and inquiry activity was mostly positive during the third quarter, with the exception of liquid barges. We received $154 million of wind tower orders and experienced strong demand across utility, traffic, and telecom structures, and construction activity remained robust in most of our key markets. We have also been encouraged by significantly improved fundamentals in the dry barge market, driven by increased grain movements and higher freight rates. On the other hand, the liquid barge market remains weak as refined products, petrochemicals, and crude oil movements have not yet recovered from the pandemic. We are strategically extending our backlog to stay flexible and allow time for a recovery, while also investing in innovation to drive additional traffic on the inland river system.

“I am excited about the ‘cash culture’ we are building at Arcosa. We generated $93 million of free cash flow in the quarter, which helped fund $53 million of complementary acquisitions plus the $87 million Strata Materials acquisition that closed in October. Strata, which builds on the January 2020 acquisition of Cherry with complementary recycled and natural aggregates, is an excellent strategic fit.”

Carrillo concluded, “As we continue to navigate the COVID-19 environment, I want to thank our team for its exceptional work under extraordinary circumstances. On November 1st, we will celebrate our two-year anniversary as an independent public company. I am honored to lead such a fantastic and resilient team that has performed at a high level over the last two years, delivering strong results and making significant progress advancing our long-term vision.”

Third Quarter 2020 Results and Commentary

Construction Products

  • Revenues increased 27% to $146.9 million in the third quarter, despite adverse weather in Houston and on the Gulf Coast that impacted Cherry and other natural aggregates locations.
  • Third quarter Adjusted Segment EBITDA increased 40% to $36.8 million, representing a 25.1% margin compared to a 22.6% margin a year ago. The 250 basis-point increase in margin is primarily due to operational improvements and lower fuel costs.
  • The Cherry acquisition continued to perform well, driven by healthy demand across natural and recycled aggregates in the Houston area.
  • In our natural aggregates business, we experienced strong volumes in Texas from healthy residential and highway demand as well as newly acquired locations. We experienced continued weakness in plants serving oil and gas markets.
  • Revenues were lower in our specialty materials businesses primarily due to reduced volumes in our lightweight aggregates business attributed to continued COVID 19-related construction delays.
  • Revenues in our trench shoring business decreased 5% year-over-year but increased 12% from the second quarter, as volumes improved sequentially. Our customers remain cautious regarding their capital spending outlook, but sentiment has improved since the onset of COVID-19.

Energy Equipment

  • Third quarter revenues were up 6% year-over-year to $222.6 million, driven primarily by higher volumes in wind towers and utility structures and the addition of the traffic and telecom structures businesses acquired this year.
  • Adjusted Segment EBITDA decreased 15% to $28.5 million, representing a 12.8% margin compared to a 15.9% margin a year ago. The year-over-year decrease in EBITDA and margin was primarily due to operational challenges in our utility structures business related to COVID-19.
  • The revenue increase was partially offset by lower steel prices in utility structures and a combination of lower volume and selling prices in our storage tank business.
  • During the quarter, we received wind tower orders of $154 million for 2021 delivery. Orders and inquiry levels for utility structures and the newly acquired traffic structures business remained strong, extending lead times.
  • The combined backlog for wind towers and utility structures increased to $429.3 million from $352.2 million at the end of the second quarter.

Transportation Products

  • Third quarter revenues of $120.7 million were unchanged year-over-year. Barge revenues increased 28% driven by increased hopper barge deliveries. Rail Components revenues declined by 51% year-over-year but were roughly flat with the second quarter.
  • Adjusted Segment EBITDA increased 38% year-over-year to $22.0 million, representing an 18.2% margin compared to a 13.2% margin a year ago. Barge margins increased due to improved profitability in the backlog and strong operational performance that more than offset weakness in the components business.
  • The barge business received orders of $18 million in the quarter, consistent with the level received in the second quarter but well below pre-pandemic levels. We have seen a recent uptick in inquiries, and since the end of the quarter, we have received an additional $32 million of orders for barges to be delivered in 2021.
  • The underlying fundamentals for a dry barge replacement cycle remain in place, and the recent strong harvest and improving grain pricing have improved customer confidence.
  • Lower demand for refined products including gasoline and jet fuel and low oil prices, have negatively impacted order inquiries for liquid barges, and recovery in the tank barge market will likely depend on the shape and timing of a broader economic recovery.
  • The barge backlog was $177.5 million, compared to $258.7 million at the end of the second quarter. Visibility remains solid for the remainder of 2020, and we had approximately $97 million of production visibility for 2021 at the end of the quarter, plus the additional orders we received during October.
  • We are taking steps to reduce our capacity to align with lower anticipated production levels in 2021, while remaining flexible to allow time for the fundamentals of the barge business to overcome COVID-related weakness in the market.

Corporate

  • Corporate expenses increased $5.5 million to $17.0 million in the third quarter, primarily due to a non-recurring increase in legal expenses of $2.5 million, or $0.04 per share, related to a concluded pre-separation matter.
  • Higher non-recurring acquisition-related transaction and integration costs, which are excluded from Adjusted EBITDA and Adjusted EPS, of $1.4 million also contributed to the increase.

Cash Flow and Liquidity

  • Operating cash flow was $106.4 million during the quarter; free cash flow was $93.1 million, with free cash flow conversion of roughly 300% of net income.
  • We invested $13.3 million in capital expenditures during the quarter.
  • We also invested $53.2 million in two complementary acquisitions during the quarter, including the $25.5 million acquisition of a natural aggregates business in Central Texas and the previously announced $27.7 million acquisition of a telecommunications structures business.
  • We returned approximately $4.4 million to shareholders during the third quarter, through $2.4 million in dividends and $2.0 million in share repurchases. At September 30, 2020, we had $32.0 million remaining under our share repurchase authorization.
  • We ended the quarter with total liquidity of $562.9 million, including $189.0 million of cash, and net debt to Adjusted EBITDA of 0.2X for the trailing twelve months.
  • In October, we acquired Strata Materials (“Strata”), a leading provider of recycled aggregates in the Dallas-Fort Worth area, for approximately $87 million.
  • The Strata acquisition was funded with cash resulting in a proforma net debt to Adjusted EBITDA of 0.5X as of quarter end.
  • Cash taxes of $21 million during the quarter included approximately $15 million of federal and state income tax payments that were deferred from the first half of the year, following passage of the Coronavirus Aid Relief, and Economic Security Act and similar state provisions.

Non-GAAP Financial Information

This earnings release contains financial measures that have not been prepared in accordance with U.S. generally accepted accounting principles (“GAAP”). Reconciliations of non-GAAP financial measures to the closest GAAP measure are included in the accompanying tables to this earnings release.

Conference Call Information

A conference call is scheduled for 8:30 a.m. Eastern Time on October 29, 2020 to discuss 2020 third quarter results. To listen to the conference call webcast, please visit the Investor Relations section of Arcosa’s website at https://ir.arcosa.com. A slide presentation for this conference call will be posted on the Company’s website in advance of the call at https://ir.arcosa.com. The audio conference call number is 888-632-3385 for domestic callers and 785-424-1673 for international callers. The conference ID is ARCOSA and the passcode is 272675. An audio playback will be available through 11:59 p.m. Eastern Time on November 12, 2020, by dialing 800-839-5130 for domestic callers and 402-220-2693 for international callers. A replay of the webcast will be available for one year on Arcosa’s website at https://ir.arcosa.com/news-events/events-presentations.

About Arcosa

Arcosa, Inc. (NYSE:ACA), headquartered in Dallas, Texas, is a provider of infrastructure-related products and solutions with leading positions in construction, energy, and transportation markets. Arcosa reports its financial results in three principal business segments: the Construction Products Group, the Energy Equipment Group, and the Transportation Products Group. For more information, visit www.arcosa.com.

Some statements in this release, which are not historical facts, are “forward-looking statements” as defined by the Private Securities Litigation Reform Act of 1995. Forward-looking statements include statements about Arcosa’s estimates, expectations, beliefs, intentions or strategies for the future. Arcosa uses the words “anticipates,” “assumes,” “believes,” “estimates,” “expects,” “intends,” “forecasts,” “may,” “will,” “should,” “guidance,” “outlook,” “strategy,” and similar expressions to identify these forward-looking statements. Forward-looking statements speak only as of the date of this release, and Arcosa expressly disclaims any obligation or undertaking to disseminate any updates or revisions to any forward-looking statement contained herein, except as required by federal securities laws. Forward-looking statements are based on management’s current views and assumptions and involve risks and uncertainties that could cause actual results to differ materially from historical experience or our present expectations, including but not limited to assumptions, risks and uncertainties regarding the impact of the COVID-19 pandemic on Arcosa’s customer demand for Arcosa’s products and services, Arcosa’s supply chain, Arcosa’s employees ability to work because of COVID-19 related illness, the health and safety of our employees, the effect of governmental regulations imposed in response to the COVID-19 pandemic; assumptions, risks and uncertainties regarding achievement of the expected benefits of Arcosa’s spin-off from Trinity; tax treatment of the spin-off; failure to successfully integrate Strata, or failure to achieve the expected benefits of the acquisition; market conditions and customer demand for Arcosa’s business products and services; the cyclical nature of, and seasonal or weather impact on, the industries in which Arcosa competes; competition and other competitive factors; governmental and regulatory factors; changing technologies; availability of growth opportunities; market recovery; ability to improve margins; and Arcosa’s ability to execute its long-term strategy, and such forward-looking statements are not guarantees of future performance. For further discussion of such risks and uncertainties, see "Risk Factors" and the "Forward-Looking Statements" section of "Management's Discussion and Analysis of Financial Condition and Results of Operations" in Arcosa's Form 10-K for the year-ended December 31, 2019, Arcosa's Form 10-Q for the quarter-ended June 30, 2020, Arcosa's Form 10-Q for the quarter-ended September 30, 2020 to be filed on or about October 29, 2020, and as may be revised and updated by Arcosa's Quarterly Reports on Form 10-Q and Current Reports on Form 8-K.


Arcosa, Inc.

Condensed Consolidated Statements of Operations

(in millions, except per share amounts)

(unaudited)


Three Months Ended
September 30,


Nine Months Ended
September 30,


2020


2019


2020


2019

Revenues

$

490.0


$

445.0


$

1,476.7


$

1,290.0


Operating costs:


Cost of revenues

390.3


356.7


1,178.4


1,035.2


Selling, general, and administrative expenses

57.6


45.5


163.3


132.4


447.9


402.2


1,341.7


1,167.6


Operating profit

42.1


42.8


135.0


122.4


Interest expense

2.3


1.6


8.4


5.1


Other, net (income) expense

(0.5

)


(0.7

)


(0.8

)


(1.0

)


1.8


0.9


7.6


4.1


Income before income taxes

40.3


41.9


127.4


118.3


Provision for income taxes

9.1


9.2


31.3


26.1


Net income

$

31.2


$

32.7


$

96.1


$

92.2


Net income per common share:


Basic

$

0.64


$

0.68


$

1.99


$

1.91


Diluted

$

0.64


$

0.67


$

1.97


$

1.89


Weighted average number of shares outstanding:


Basic

48.1


47.9


48.0


47.8


Diluted

48.5


48.3


48.5


48.3


Arcosa, Inc.

Condensed Segment Data

(in millions)

(unaudited)


Three Months Ended
September 30,


Nine Months Ended
September 30,

Revenues:

2020


2019


2020


2019

Construction aggregates

$

128.8


$

96.9


$

393.0


$

278.5


Other

18.1


19.0


51.5


59.0


Construction Products Group

146.9


115.9


444.5


337.5


Wind towers and utility structures

181.5


159.8


534.8


469.4


Other

41.1


50.4


133.8


154.2


Energy Equipment Group

222.6


210.2


668.6


623.6


Inland barges

99.4


77.5


295.4


193.0


Steel components

21.3


43.1


70.5


140.4


Transportation Products Group

120.7


120.6


365.9


333.4


Segment Totals before Eliminations

490.2


446.7


1,479.0


1,294.5


Eliminations

(0.2

)


(1.7

)


(2.3

)


(4.5

)


Consolidated Total

$

490.0


$

445.0


$

1,476.7


$

1,290.0


Three Months Ended
September 30,


Nine Months Ended
September 30,

Operating profit (loss):

2020


2019


2020


2019

Construction Products Group

$

20.8


$

16.5


$

61.9


$

45.3


Energy Equipment Group

20.7


26.6


66.5


79.8


Transportation Products Group

17.6


11.2


47.8


32.1


Segment Totals before Corporate Expenses

59.1


54.3


176.2


157.2


Corporate

(17.0

)


(11.5

)


(41.2

)


(34.8

)


Consolidated Total

$

42.1


$

42.8


$

135.0


$

122.4


Backlog:

September 30, 2020


September 30, 2019

Energy Equipment Group:


Wind towers and utility structures

$

429.3


$

563.6


Other

$

13.3


$

44.3


Transportation Products Group:


Inland barges

$

177.5


$

363.8


Arcosa, Inc.

Condensed Consolidated Balance Sheets

(in millions)

(unaudited)


September 30, 2020


December 31, 2019

Current assets:


Cash and cash equivalents

$

189.0


$

240.4


Receivables, net of allowance

232.9


200.0


Inventories

289.9


283.3


Other

28.8


33.5


Total current assets

740.6


757.2


Property, plant, and equipment, net

894.8


816.2


Goodwill

776.0


621.9


Intangibles, net

163.2


51.7


Deferred income taxes

15.2


14.3


Other assets

45.2


41.2


$

2,635.0


$

2,302.5


Current liabilities:


Accounts payable

$

137.1


$

90.0


Accrued liabilities

116.4


119.4


Advance billings

54.5


70.9


Current portion of long-term debt

4.2


3.7


Total current liabilities

312.2


284.0


Debt

250.4


103.6


Deferred income taxes

106.8


66.4


Other liabilities

84.0


58.1


753.4


512.1


Stockholders' equity:


Common stock

0.5


0.5


Capital in excess of par value

1,695.8


1,686.7


Retained earnings

211.7


122.9


Accumulated other comprehensive loss

(23.0

)


(19.7

)


Treasury stock

(3.4

)


1,881.6


1,790.4


$

2,635.0


$

2,302.5


Arcosa, Inc.

Consolidated Statements of Cash Flows

(in millions)

(unaudited)


Nine Months Ended
September 30,


2020


2019

Operating activities:


Net income

$

96.1


$

92.2


Adjustments to reconcile net income to net cash provided by operating activities:


Depreciation, depletion, and amortization

82.9


63.2


Stock-based compensation expense

14.0


11.1


Provision for deferred income taxes

7.1


14.9


Gains on dispositions of property and other assets

(3.6

)


(2.6

)


(Increase) decrease in other assets

(7.2

)


0.2


Increase (decrease) in other liabilities

7.5


2.4


Other

(0.9

)


(1.9

)


Changes in current assets and liabilities:


(Increase) decrease in receivables

5.1


86.1


(Increase) decrease in inventories

14.9


(47.7

)


(Increase) decrease in other current assets

8.8


(3.2

)


Increase (decrease) in accounts payable

37.3


(3.9

)


Increase (decrease) in advance billings

(22.5

)


(1.2

)


Increase (decrease) in accrued liabilities

(12.8

)


9.4


Net cash provided by operating activities

226.7


219.0


Investing activities:


Proceeds from dispositions of property and other assets

8.9


4.7


Capital expenditures

(56.9

)


(61.0

)


Acquisitions, net of cash acquired

(361.7

)


(31.1

)


Net cash required by investing activities

(409.7

)


(87.4

)


Financing activities:


Payments to retire debt

(103.8

)


(81.0

)


Proceeds from issuance of debt

251.4


Shares repurchased

(4.0

)


(11.0

)


Dividends paid to common stockholders

(7.3

)


(7.4

)


Purchase of shares to satisfy employee tax on vested stock

(3.5

)


(4.1

)


Other

(1.2

)


Net cash provided (required) by financing activities

131.6


(103.5

)


Net increase (decrease) in cash and cash equivalents

(51.4

)


28.1


Cash and cash equivalents at beginning of period

240.4


99.4


Cash and cash equivalents at end of period

$

189.0


$

127.5


Arcosa, Inc.

Reconciliation of Adjusted EBITDA and Adjusted Net Income

($ in millions)

(unaudited)


“EBITDA” is defined as net income plus interest, taxes, depreciation, depletion, and amortization. We adjust EBITDA for certain items that are not reflective of the normal earnings of our business (“Adjusted EBITDA”). GAAP does not define EBITDA or Adjusted EBITDA and they should not be considered as alternatives to earnings measures defined by GAAP, including net income. We use Adjusted EBITDA to assess the operating performance of our consolidated business, as a metric for incentive-based compensation, as a measure within our lending arrangements, and as a basis for strategic planning and forecasting as we believe that it closely correlates to long-term shareholder value. As a widely used metric by analysts, investors, and competitors in our industry, we believe Adjusted EBITDA also assists investors in comparing a company's performance on a consistent basis without regard to depreciation, depletion, amortization, and other items which can vary significantly depending on many factors. “Adjusted EBITDA Margin” is defined as Adjusted EBITDA divided by Revenues.


Three Months Ended
September 30,


Nine Months Ended
September 30,


2020


2019


2020


2019

Revenues

$

490.0


$

445.0


$

1,476.7


$

1,290.0


Net income

31.2


32.7


96.1


92.2


Add:


Interest expense, net

2.2


1.3


8.0


4.1


Provision for income taxes

9.1


9.2


31.3


26.1


Depreciation, depletion, and amortization expense(1)

28.2


21.7


82.9


63.2


EBITDA

70.7


64.9


218.3


185.6


Add:


Impact of acquisition-related expenses(2)

1.9


0.4


6.8


2.0


Impairment charge

0.8


2.6


Other, net (income) expense(3)

(0.4

)


(0.4

)


(0.4

)


Adjusted EBITDA

$

73.0


$

64.9


$

227.3


$

187.6


Adjusted EBITDA Margin

14.9

%


14.6

%


15.4

%


14.5

%

GAAP does not define “Adjusted Net Income” and it should not be considered as an alternative to earnings measures defined by GAAP, including net income. We use this metric to assess the operating performance of our consolidated business. We adjust net income for certain items that are not reflective of the normal operations of our business to provide investors with what we believe is a more consistent comparison of earnings performance from period to period.


Three Months Ended
September 30,


Nine Months Ended
September 30,


2020


2019


2020


2019

Net Income

$

31.2


$

32.7


$

96.1


$

92.2


Impact of acquisition-related expenses, net of tax(2)

1.5


0.3


5.2


1.5


Impairment charge, net of tax

0.6


2.0


Adjusted Net Income

$

33.3


$

33.0


$

103.3


$

93.7


(1) Includes the impact of the fair value markup of acquired long-lived assets.

(2) Expenses associated with acquisitions, including the cost impact of the fair value markup of acquired inventory and other transaction costs.

(3) Included in Other, net (income) expense was the impact of foreign currency exchange transactions of $(0.3) million and $(0.3) million for the three months ended September 30, 2020 and 2019, respectively, and $(0.1) million and $0.7 million for the nine months ended September 30, 2020 and 2019, respectively.


Arcosa, Inc.

Reconciliation of Adjusted Segment EBITDA

($ in millions)

(unaudited)


“Segment EBITDA” is defined as segment operating profit plus depreciation, depletion, and amortization. We adjust Segment EBITDA for certain items that are not reflective of the normal earnings of our business (“Adjusted Segment EBITDA”). GAAP does not define Segment EBITDA or Adjusted Segment EBITDA and they should not be considered as alternatives to earnings measures defined by GAAP, including segment operating profit. We use Adjusted Segment EBITDA to assess the operating performance of our businesses, as a metric for incentive-based compensation, and as a basis for strategic planning and forecasting as we believe that it closely correlates to long-term shareholder value. As a widely used metric by analysts, investors, and competitors in our industry we believe Adjusted Segment EBITDA also assists investors in comparing a company's performance on a consistent basis without regard to depreciation, depletion, amortization, and other items, which can vary significantly depending on many factors. "Adjusted Segment EBITDA Margin" is defined as Adjusted Segment EBITDA divided by Revenues.


Three Months Ended
September 30,


Nine Months Ended
September 30,


2020


2019


2020


2019

Construction Products


Revenues

$

146.9


$

115.9


$

444.5


$

337.5


Operating Profit

20.8


16.5


61.9


45.3


Add: Depreciation, depletion, and amortization expense

15.2


9.7


42.9


27.5


Segment EBITDA

36.0


26.2


104.8


72.8


Add: Impact of acquisition-related expenses(1)


1.9


1.4


Add: Impairment charge

0.8


0.8


Adjusted Segment EBITDA

$

36.8


$

26.2


$

107.5


$

74.2


Adjusted Segment EBITDA Margin

25.1

%


22.6

%


24.2

%


22.0

%


Energy Equipment


Revenues

$

222.6


$

210.2


$

668.6


$

623.6


Operating Profit

20.7


26.6


66.5


79.8


Add: Depreciation and amortization expense

7.3


6.9


22.8


21.2


Segment EBITDA

28.0


33.5


89.3


101.0


Add: Impact of acquisition-related expenses(1)

0.5


1.9


Add: Impairment charge


1.3


Adjusted Segment EBITDA

$

28.5


$

33.5


$

92.5


$

101.0


Adjusted Segment EBITDA Margin

12.8

%


15.9

%


13.8

%


16.2

%


Transportation Products


Revenues

$

120.7


$

120.6


$

365.9


$

333.4


Operating Profit

17.6


11.2


47.8


32.1


Add: Depreciation and amortization expense

4.4


4.3


13.5


12.0


Segment EBITDA

22.0


15.5


61.3


44.1


Add: Impact of acquisition-related expenses(1)


0.4


0.6


Add: Impairment charge


0.5


Adjusted Segment EBITDA

$

22.0


$

15.9


$

61.8


$

44.7


Adjusted Segment EBITDA Margin

18.2

%


13.2

%


16.9

%


13.4

%


Operating Loss - Corporate

$

(17.0

)


$

(11.5

)


$

(41.2

)


$

(34.8

)

Impact of acquisition-related expenses - Corporate(1)

1.4


3.0


Add: Corporate depreciation expense

1.3


0.8


3.7


2.5


Adjusted EBITDA

$

73.0


$

64.9


$

227.3


$

187.6


(1) Expenses associated with acquisitions, including the cost impact of the fair value markup of acquired inventory and other transaction costs.


Contacts

INVESTOR CONTACTS
Scott C. Beasley
Chief Financial Officer
Gail M. Peck
SVP, Finance & Treasurer
T 972.942.6500
This email address is being protected from spambots. You need JavaScript enabled to view it.

David Gold
ADVISIRY Partners
T 212.661.2220
This email address is being protected from spambots. You need JavaScript enabled to view it.

MEDIA CONTACT
This email address is being protected from spambots. You need JavaScript enabled to view it.


Read full story here

ALEXANDRIA, Va.--(BUSINESS WIRE)--VSE Corporation (NASDAQ: VSEC, “VSE”, or the “Company”), a leading provider of aftermarket distribution and maintenance, repair and overhaul (MRO) services for land, sea and air transportation assets for government and commercial markets, has postponed its third quarter 2020 results conference call scheduled for today due to a hurricane-related system-wide outage at its conference call vendor.


Due to the conference call vendor outage, the company will reschedule its third quarter 2020 earnings conference call. Details will be forthcoming on a new conference call date and time.

ABOUT VSE CORPORATION

VSE is a leading provider of aftermarket distribution and repair services for land, sea and air transportation assets for government and commercial markets. Core services include maintenance, repair and overhaul (MRO) services, parts distribution, supply chain management and logistics, engineering support, and consulting and training services for global commercial, federal, military and defense customers. VSE also provides information technology and energy consulting services. For additional information regarding VSE’s services and products, visit us at www.vsecorp.com.

Please refer to the Form 10-Q that will be filed with the Securities and Exchange Commission (SEC) on or about September 30, 2020 for more details on our third quarter 2020 results. Also, refer to VSE’s Annual Report on Form 10-K for the year ended December 31, 2019 for further information and analysis of VSE’s financial condition and results of operations. VSE encourages investors and others to review the detailed reporting and disclosures contained in VSE’s public filings for additional discussion about the status of customer programs and contract awards, risks, revenue sources and funding, dependence on material customers, and management’s discussion of short- and long-term business challenges and opportunities.

FORWARD LOOKING STATEMENTS

This document contains certain forward-looking statements. These forward-looking statements, which are included in accordance with the safe harbor provisions of the Private Securities Litigation Reform Act of 1995, may involve known and unknown risks, uncertainties and other factors that may cause VSE’s actual results and performance in future periods to be materially different from any future results or performance suggested by the forward-looking statements in this document. Although we believe the expectations reflected in such forward-looking statements are based upon reasonable assumptions, we can give no assurance that actual results will not differ materially from these expectations. “Forward-looking” statements, as such term is defined by the Securities Exchange Commission (the “SEC”) in its rules, regulations and releases, represent our expectations or beliefs, including, but not limited to, statements concerning our operations, economic performance, financial condition, the impact of widespread health developments, such as the ongoing COVID-19 outbreak, the health and economic impact thereof, and the governmental, commercial, consumer and other responses thereto, growth and acquisition strategies, investments and future operational plans. Without limiting the generality of the foregoing, words such as “may,” “will,” “expect,” “believe,” “anticipate,” “intend,” “forecast,” “seek,” “plan,” “predict,” “project,” “could,” “estimate,” “might,” “continue,” “seeking” or the negative or other variations thereof or comparable terminology are intended to identify forward-looking statements. These statements, by their nature, involve substantial risks and uncertainties, certain of which are beyond our control, and actual results may differ materially depending on a variety of important factors, including, but not limited to, the uncertainty surrounding the ongoing COVID-19 outbreak and the other factors identified in our reports filed or expected to be filed with the SEC including our Annual Report on Form 10-K for the year ended December 31, 2019. All forward-looking statements made herein are qualified by these cautionary statements and risk factors and there can be no assurance that the actual results, events or developments referenced herein will occur or be realized. Readers are cautioned not to place undue reliance on these forward looking-statements, which reflect management's analysis only as of the date hereof. We undertake no obligation to update or revise forward-looking statements to reflect changed assumptions, the occurrence of unanticipated events or changes to future operating results.


Contacts

INVESTOR CONTACT
Noel Ryan
(720) 778-2415
This email address is being protected from spambots. You need JavaScript enabled to view it.

Third Quarter 2020 Highlights

  • Increased total customer count to 98,600 as of September 30, 2020;
  • Reaffirmed full-year 2020 guidance; and
  • Initiated full-year 2021 guidance.

HOUSTON--(BUSINESS WIRE)--Sunnova Energy International Inc. ("Sunnova") (NYSE: NOVA), one of the leading U.S. residential solar and storage service providers, today announced financial results for the quarter ended September 30, 2020.

"We continue to demonstrate the benefits of our flexible business model and conservative capitalization strategy with our strong third quarter results," said William J. (John) Berger, Chief Executive Officer of Sunnova. "This success is driven by our ability to continue executing and generating high customer growth at attractive customer net margins despite a unique set of macro challenges experienced during 2020.

"We believe we are well-positioned to continue increasing our single customer net margins by further scaling our sales overhead by increasing our nominal per quarter customer growth. Our growth is fueled by the increasing number of dealers and sub-dealers we are partnering with, the growth in the number of services sold to existing customers, and the expansion of services sold to newly acquired customers. All of this growth, plus continued decreases in our cost of capital, will lead to incremental per customer contracted values, which will in turn provide further increases to long term recurring operating cash flows."

Mr. Berger added, "As weather driven instability of regional power grids becomes increasingly intolerable for consumers and the integration of new technologies behind the meter grows, energy service providers like Sunnova will become even more attractive to homeowners. Driven by these rapid changes in technology, and a growing consumer appetite for cleaner, more reliable, and less expensive energy, Sunnova is well positioned to become the leading wireless power provider that consumers choose to power their energy independence."

Third Quarter 2020 Results

Revenue increased to $50.2 million, or by $13.6 million, in the three months ended September 30, 2020 compared to the three months ended September 30, 2019. Revenue increased to $122.8 million, or by $24.9 million, in the nine months ended September 30, 2020 compared to the nine months ended September 30, 2019. These increases were primarily the result of an increase in the number of customers served.

Total operating expense, net increased to $48.5 million, or by $6.0 million, in the three months ended September 30, 2020 compared to the three months ended September 30, 2019. This increase was primarily the result of an increase in the number of customers served and greater depreciation expense.

Total operating expense, net increased to $140.6 million, or by $29.5 million, in the nine months ended September 30, 2020 compared to the nine months ended September 30, 2019. This increase was primarily the result of an increase in the number of customers served, greater depreciation expense, and higher period-over-period general and administrative expenses due to the hiring of personnel to support growth.

Adjusted Operating Expense increased to $24.8 million, or by $4.0 million, in the three months ended September 30, 2020 compared to the three months ended September 30, 2019. This increase was primarily the result of an increase in the number of customers served.

Adjusted Operating Expense increased to $73.2 million, or by $12.8 million, in the nine months ended September 30, 2020 compared to the nine months ended September 30, 2019. This increase was primarily the result of an increase in the number of customers served and higher period-over-period general and administrative expenses due to the hiring of personnel to support growth.

Sunnova incurred a net loss of $73.3 million for the three months ended September 30, 2020 compared to a net loss of $34.4 million for the three months ended September 30, 2019. This larger net loss was primarily the result of a loss on the extinguishment of debt from the select conversion of convertible notes for common stock in the third quarter of 2020.

Sunnova incurred a net loss of $179.0 million for the nine months ended September 30, 2020 compared to a net loss of $119.7 million for the nine months ended September 30, 2019. This larger net loss was primarily the result of a loss on the extinguishment of debt from the select conversion of convertible notes for common stock in the third quarter of 2020 and higher net interest expense.

Adjusted EBITDA was $25.4 million for the three months ended September 30, 2020 compared to $15.9 million for the three months ended September 30, 2019, an increase of $9.5 million. Customer principal (net of amounts recorded in revenue) and interest payments received from solar loans increased to $9.2 million and $5.9 million, respectively, for the three months ended September 30, 2020, or by $4.9 million and $2.8 million, respectively, compared to the three months ended September 30, 2019. Adjusted EBITDA was $49.6 million for the nine months ended September 30, 2020 compared to $37.5 million for the nine months ended September 30, 2019, an increase of $12.1 million. Customer principal (net of amounts recorded in revenue) and interest payments received from solar loans increased to $23.1 million and $16.9 million, respectively, for the nine months ended September 30, 2020, or by $10.1 million and $8.7 million, respectively, compared to the nine months ended September 30, 2019. These overall increases were primarily driven by customer growth increasing at a faster rate than expenses.

Net cash used in operating activities was relatively unchanged at $18.9 million for the three months ended September 30, 2020 compared to $18.8 million for the three months ended September 30, 2019.

Net cash used in operating activities was $101.8 million for the nine months ended September 30, 2020 compared to $74.5 million for the nine months ended September 30, 2019. This increase was primarily the result of an increase in purchases of inventory and prepaid inventory with net outflows of $22.1 million in 2020 compared to $8.2 million in 2019 and an increase in realized loss on interest rate swaps of $26.0 million due to the termination of certain debt facilities in 2020, offset by decreased payments to dealers for exclusivity and other bonus arrangements with net outflows of $24.4 million in 2020 compared to $31.7 million in 2019.

Adjusted Operating Cash Flow was $1.8 million in the three months ended September 30, 2020 compared to $(2.4) million for the three months ended September 30, 2019. Adjusted Operating Cash Flow was $0.5 million in the nine months ended September 30, 2020 compared to $(12.9) million for the nine months ended September 30, 2019. These increases were primarily the result of customer growth increasing at a faster rate than cash expenditures.

Liquidity & Capital Resources

As of September 30, 2020, Sunnova had total cash of $211.7 million, including restricted and unrestricted cash.

2020 Guidance

Management reaffirms existing full-year 2020 guidance.

  • Customer additions of 28,000 - 30,000;
  • Adjusted EBITDA of $58 million - $62 million;
  • Customer principal payments received from solar loans, net of amounts recorded in revenue of $32 million - $36 million;
  • Customer interest payments received from solar loans of $17 million - $21 million;
  • Adjusted Operating Cash Flow of $10 million - $20 million; and
  • Recurring Operating Cash Flow of $(20) million - $(5) million.

2021 Guidance

Management initiates full-year 2021 guidance.

  • Customer additions of 42,000 - 48,000;
  • Adjusted EBITDA of $77 million - $83 million;
  • Customer principal payments received from solar loans, net of amounts recorded in revenue of $57 million - $63 million;
  • Customer interest payments received from solar loans of $28 million - $34 million;
  • Adjusted Operating Cash Flow of $20 million - $30 million; and
  • Recurring Operating Cash Flow of $(15) million - $5 million.

Non-GAAP Financial Measures

We present our operating results in accordance with accounting principles generally accepted in the U.S. ("GAAP"). We believe certain financial measures, such as Adjusted EBITDA, Adjusted Operating Expense, Adjusted Operating Cash Flow, and Recurring Operating Cash Flow, which are non-GAAP measures, provide users of our financial statements with supplemental information that may be useful in evaluating our business. We use Adjusted EBITDA and Adjusted Operating Expense as performance measures, and believe investors and securities analysts also use Adjusted EBITDA and Adjusted Operating Expense in evaluating our performance. While Adjusted EBITDA effectively captures the operating performance of our leases and PPAs, it only reflects the service portion of the operating performance under our loan agreements. Therefore, we separately show customer P&I payments. Adjusted EBITDA is also used by our management for internal planning purposes, including our consolidated operating budget, and by our board of directors in setting performance-based compensation targets. We use Adjusted Operating Cash Flow and Recurring Operating Cash Flow as liquidity measures and believe Adjusted Operating Cash Flow and Recurring Operating Cash Flow are supplemental financial measures useful to management, analysts, investors, lenders and rating agencies as an indicator of our ability to internally fund origination activities, service or incur additional debt and service our contractual obligations. We believe investors and analysts will use Adjusted Operating Cash Flow and Recurring Operating Cash Flow to evaluate our liquidity and ability to service our contractual obligations. Further, we believe that Recurring Operating Cash Flow allows investors to analyze our ability to service the debt and customer obligations associated with our in-service assets. However, Adjusted Operating Cash Flow and Recurring Operating Cash Flow have limitations as analytical tools because they do not account for all future expenditures and financial obligations of the business or reflect unforeseen circumstances that may impact our future cash flows, all of which could have a material effect on our financial condition and results of operations. We believe that such non-GAAP measures, when read in conjunction with our operating results presented under GAAP, can be used both to better assess our business from period to period and to better assess our business against other companies in our industry, without regard to financing methods, historical cost basis or capital structure. Our calculation of these non-GAAP financial measures may differ from similarly-titled non-GAAP measures, if any, reported by other companies. In addition, other companies may not publish these or similar measures. Such non-GAAP measures should be considered as a supplement to, and not as a substitute for, financial measures prepared in accordance with GAAP. Sunnova is unable to reconcile projected Adjusted EBITDA, Adjusted Operating Expense, Adjusted Operating Cash Flow, and Recurring Operating Cash Flow to the most comparable financial measures calculated in accordance with GAAP because of fluctuations in interest rates and their impact on our unrealized and realized interest rate hedge gains or losses. Sunnova provides a range for the forecasts of Adjusted EBITDA, Adjusted Operating Expense, Adjusted Operating Cash Flow, and Recurring Operating Cash Flow to allow for the variability in the timing of cash receipts and disbursements, customer utilization of our assets, and the impact on the related reconciling items, many of which interplay with each other. Therefore, the reconciliation of projected Adjusted EBITDA, Adjusted Operating Expense, Adjusted Operating Cash Flow, and Recurring Operating Cash Flow to projected net income (loss), total operating expense, or net cash provided by (used in) operating activities, as the case may be, is not available without unreasonable effort.

Third Quarter 2020 Financial and Operational Results Conference Call Information

Sunnova is hosting a conference call for analysts and investors to discuss its third quarter 2020 results at 8:30 a.m. Eastern Time, on October 29, 2020. To register for this conference call, please use the link http://www.directeventreg.com/registration/event/9279307.

After registering, a confirmation will be sent through email, including dial-in details and unique conference call codes for entry. To ensure you are connected for the full call we suggest registering at a minimum 10 minutes before the start of the call. A replay will be available two hours after the call and can be accessed by dialing 800-585-8367, or for international callers, 416-621-4642. The conference ID for the live call and the replay is 9279307. The replay will be available until November 11, 2020.

Interested investors and other parties may also listen to a simultaneous webcast of the conference call by logging onto the Investor Relations section of Sunnova’s website at www.sunnova.com.

Forward Looking Statements

This press release contains forward-looking statements within the meaning of Section 27A of the Securities Act of 1933, as amended, and Section 21E of the Securities Exchange Act of 1934, as amended. Forward-looking statements generally relate to future events or Sunnova’s future financial or operating performance. In some cases, you can identify forward-looking statements because they contain words such as "may," "will," "should," "expects," "plans," "anticipates," "going to," "could," "intends," "target," "projects," "contemplates," "believes," "estimates," "predicts," "potential" or "continue" or the negative of these words or other similar terms or expressions that concern Sunnova’s expectations, strategy, priorities, plans or intentions. Forward-looking statements in this release include, but are not limited to, statements regarding our liquidity position and its ability to support our growth, our level of growth, our ability to handle macro challenges, our ability to manage costs, the ability to achieve our 2020 and 2021 operational and financial targets, and references to future rate of customer and dealer additions, Adjusted EBITDA, customer P&I payments from solar loans, Recurring Operating Cash Flow and Adjusted Operating Cash Flow. Sunnova’s expectations and beliefs regarding these matters may not materialize, and actual results in future periods are subject to risks and uncertainties that could cause actual results to differ materially from those projected, including risks regarding our ability to forecast our business due to our limited operating history, the effects of the coronavirus pandemic on our business and operations, results of operations and financial position, our competition, fluctuations in the solar and home-building markets, availability of capital, our ability to attract and retain dealers and customers and manage our dealer and strategic partner relationships. The forward-looking statements contained in this release are also subject to other risks and uncertainties, including those more fully described in Sunnova’s filings with the Securities and Exchange Commission, including Sunnova’s annual report on Form 10-K for the year ended December 31, 2019. The forward-looking statements in this release are based on information available to Sunnova as of the date hereof, and Sunnova disclaims any obligation to update any forward-looking statements, except as required by law.

About Sunnova

Sunnova Energy International Inc. (NYSE: NOVA) is a leading residential solar and energy storage service provider with customers across the U.S. and its territories. Sunnova's goal is to be the source of clean, affordable and reliable energy with a simple mission: to power energy independence so that homeowners have the freedom to live life uninterruptedTM.


SUNNOVA ENERGY INTERNATIONAL INC.

UNAUDITED CONDENSED CONSOLIDATED BALANCE SHEETS

(in thousands, except share amounts and share par values)


As of
September 30, 2020


As of
December 31, 2019

Assets


Current assets:


Cash

$

84,635


$

83,485


Accounts receivable—trade, net

11,799


10,672


Accounts receivable—other

13,354


6,147


Other current assets, net of allowance of $591 and $112 as of September 30, 2020 and December 31, 2019, respectively

199,637


174,016


Total current assets

309,425


274,320


Property and equipment, net

2,172,727


1,745,060


Customer notes receivable, net of allowance of $14,177 and $979 as of September 30, 2020 and December 31, 2019, respectively

428,586


297,975


Other assets

243,548


169,712


Total assets (1)

$

3,154,286


$

2,487,067


Liabilities, Redeemable Noncontrolling Interests and Equity


Current liabilities:


Accounts payable

$

29,288


$

36,190


Accrued expenses

27,944


39,544


Current portion of long-term debt

109,729


97,464


Other current liabilities

18,572


21,804


Total current liabilities

185,533


195,002


Long-term debt, net

1,795,039


1,346,419


Other long-term liabilities

162,395


127,406


Total liabilities (1)

2,142,967


1,668,827


Redeemable noncontrolling interests

135,847


127,129


Stockholders' equity:


Common stock, 91,125,076 and 83,980,885 shares issued as of September 30, 2020 and December 31, 2019, respectively, at $0.0001 par value

9


8


Additional paid-in capital—common stock

1,198,680


1,007,751


Accumulated deficit

(476,095

)


(361,824

)


Total stockholders' equity

722,594


645,935


Noncontrolling interests

152,878


45,176


Total equity

875,472


691,111


Total liabilities, redeemable noncontrolling interests and equity

$

3,154,286


$

2,487,067


(1) The consolidated assets as of September 30, 2020 and December 31, 2019 include $1,254,660 and $790,211, respectively, of assets of variable interest entities ("VIEs") that can only be used to settle obligations of the VIEs. These assets include cash of $12,396 and $7,347 as of September 30, 2020 and December 31, 2019, respectively; accounts receivable—trade, net of $2,719 and $1,460 as of September 30, 2020 and December 31, 2019, respectively; accounts receivable—other of $903 and $4 as of September 30, 2020 and December 31, 2019, respectively; other current assets of $131,242 and $47,606 as of September 30, 2020 and December 31, 2019, respectively; property and equipment, net of $1,094,801 and $726,415 as of September 30, 2020 and December 31, 2019, respectively; and other assets of $12,599 and $7,379 as of September 30, 2020 and December 31, 2019, respectively. The consolidated liabilities as of September 30, 2020 and December 31, 2019 include $20,227 and $13,440, respectively, of liabilities of VIEs whose creditors have no recourse to Sunnova Energy International Inc. These liabilities include accounts payable of $2,133 and $1,926 as of September 30, 2020 and December 31, 2019, respectively; accrued expenses of $603 and $35 as of September 30, 2020 and December 31, 2019, respectively; other current liabilities of $277 and $612 as of September 30, 2020 and December 31, 2019, respectively; and other long-term liabilities of $17,214 and $10,867 as of September 30, 2020 and December 31, 2019, respectively.


SUNNOVA ENERGY INTERNATIONAL INC.

UNAUDITED CONDENSED CONSOLIDATED STATEMENTS OF OPERATIONS

(in thousands, except share and per share amounts)


Three Months Ended
September 30,


Nine Months Ended
September 30,


2020


2019


2020


2019

Revenue

$

50,177


$

36,615


$

122,796


$

97,942


Operating expense:


Cost of revenue—depreciation

15,113


10,942


42,120


30,820


Cost of revenue—other

1,403


1,186


5,315


2,914


Operations and maintenance

3,469


1,925


8,614


6,468


General and administrative

28,549


28,509


84,575


70,984


Other operating income

(6

)


(49

)


(28

)


(129

)


Total operating expense, net

48,528


42,513


140,596


111,057


Operating income (loss)

1,649


(5,898

)


(17,800

)


(13,115

)


Interest expense, net

29,954


30,884


127,804


99,855


Interest expense, net—affiliates


701


4,098


Interest income

(5,999

)


(3,407

)


(17,299

)


(8,868

)


Loss on extinguishment of long-term debt, net

50,721


50,721


Loss on extinguishment of long-term debt, net—affiliates


10,645


Other (income) expense

91


293


(175

)


827


Loss before income tax

(73,118

)


(34,369

)


(178,851

)


(119,672

)


Income tax expense

176


176


Net loss

(73,294

)


(34,369

)


(179,027

)


(119,672

)


Net income (loss) attributable to redeemable noncontrolling interests and noncontrolling interests

(9,113

)


3,221


(18,513

)


7,170


Net loss attributable to stockholders

(64,181

)


(37,590

)


(160,514

)


(126,842

)


Dividends earned on Series A convertible preferred stock


(19,271

)


Dividends earned on Series C convertible preferred stock


(5,454

)


Net loss attributable to common stockholders—basic and diluted

$

(64,181

)


$

(37,590

)


$

(160,514

)


$

(151,567

)


Net loss per share attributable to common stockholders—basic and diluted

$

(0.73

)


$

(0.62

)


$

(1.88

)


$

(5.77

)


Weighted average common shares outstanding—basic and diluted

87,768,712


60,890,129


85,276,841


26,245,493


SUNNOVA ENERGY INTERNATIONAL INC.

UNAUDITED CONDENSED CONSOLIDATED STATEMENTS OF CASH FLOWS

(in thousands)


Nine Months Ended
September 30,


2020


2019

CASH FLOWS FROM OPERATING ACTIVITIES


Net loss

$

(179,027

)


$

(119,672

)


Adjustments to reconcile net loss to net cash used in operating activities:


Depreciation

47,811


34,987


Impairment and loss on disposals, net

1,768


1,236


Amortization of deferred financing costs

6,781


8,795


Amortization of debt discount

12,205


2,027


Non-cash effect of equity-based compensation plans

8,389


6,974


Non-cash payment-in-kind interest on loan

780


Non-cash payment-in-kind interest on loan—affiliates


2,716


Unrealized loss on derivatives

2,755


30,262


Unrealized (gain) loss on fair value option instruments

(165

)


97


Loss on extinguishment of long-term debt, net

50,721


Loss on extinguishment of long-term debt, net—affiliates


10,645


Other non-cash items

10,566


4,637


Changes in components of operating assets and liabilities:


Accounts receivable

(2,785

)


(8,006

)


Other current assets

(10,688

)


(11,753

)


Other assets

(32,541

)


(37,787

)


Accounts payable

(3,274

)


5,156


Accrued expenses

(8,566

)


(2,455

)


Other current liabilities

(2,781

)


75


Long-term debt—paid-in-kind—affiliates


(719

)


Other long-term liabilities

(3,745

)


(1,753

)


Net cash used in operating activities

(101,796

)


(74,538

)


CASH FLOWS FROM INVESTING ACTIVITIES


Purchases of property and equipment

(439,855

)


(299,199

)


Payments for investments and customer notes receivable

(180,725

)


(104,391

)


Proceeds from customer notes receivable

25,028


14,072


State utility rebates and tax credits

327


401


Other, net

950


(584

)


Net cash used in investing activities

(594,275

)


(389,701

)


CASH FLOWS FROM FINANCING ACTIVITIES


Proceeds from long-term debt

1,182,912


588,153


Payments of long-term debt

(667,670

)


(318,855

)


Proceeds of long-term debt from affiliates


15,000


Payments of long-term debt to affiliates


(56,236

)


Payments on notes payable

(3,017

)


(2,177

)


Payments of deferred financing costs

(18,317

)


(10,435

)


Payments of debt discounts

(3,132

)


(1,084

)


Proceeds from issuance of common stock, net

4,269


164,695


Proceeds from equity component of debt instrument, net

73,657


Proceeds from issuance of convertible preferred stock, net


(2,510

)


Contributions from redeemable noncontrolling interests and noncontrolling interests

197,360


119,372


Distributions to redeemable noncontrolling interests and noncontrolling interests

(4,484

)


(6,289

)


Payments of costs related to redeemable noncontrolling interests and noncontrolling interests

(4,108

)


(3,155

)


Other, net

(1

)


(15

)


Net cash provided by financing activities

757,469


486,464


Net increase in cash and restricted cash

61,398


22,225


Cash and restricted cash at beginning of period

150,291


87,046


Cash and restricted cash at end of period

211,689


109,271


Restricted cash included in other current assets

(54,096

)


(16,688

)


Restricted cash included in other assets

(72,958

)


(41,557

)


Cash at end of period

$

84,635


$

51,026


Contacts

Rodney McMahan - Investors
Kelsey Hultberg - Media
This email address is being protected from spambots. You need JavaScript enabled to view it.
877-770-5211


Read full story here

  • Voya contracted Sun Valley Solar Solutions to install 350-kilowatt SunPower® solar carports using photovoltaic (PV) system.
  • The installation is expected to preclude estimated carbon dioxide emissions equal to nearly 520,000 pounds of coal burned or more than 52,000 gallons of gasoline consumed in the first year of operation.*

CHANDLER, Ariz.--(BUSINESS WIRE)--$Voya #Voya--Voya Financial, Inc. (NYSE: VOYA), announced today that its newly constructed Chandler, Arizona, office features solar carports that are expected to offset more than 663,600 kilowatt-hours of electricity in its first year of operation alone.


In the first year of operation, the 350 kilowatt SunPower® solar carports are expected to avert the equivalent of estimated carbon dioxide emissions of nearly 520,000 pounds of coal burned or more than 52,000 gallons of gasoline consumed.* In addition, Voya estimates the solar carport system will provide 32% of the facility’s total energy, offsetting purchased utility power by the same percentage and delivering significant savings over the solar system’s estimated 30-year or longer lifespan.

“Clean energy was the start of our environmental sustainability efforts more than 13 years ago. It has expanded over the years to include a variety of environmental-sustainability aspects in nearly every facility we occupy, as well as every equipment-planning and purchasing decision we make,” said Maggie Parent, EVP and chief administrative officer, Voya Financial, Inc. “Our new Chandler facility advances our commitment to reducing our environmental footprint, while capturing long-term savings – a win for our communities, Voya and the entire team who brought our vision to life.”

Voya worked with Arizona-based companies to design and build the system. Hawkins Design Group in Gilbert was responsible for the parking garage, solar, efficient LED lighting and controls systems. Chandler-based Sun Valley Solar Solutions collaborated with Hawkins during the system’s design phase, and was responsible for the complete installation of the SunPower photovoltaic (PV) system.

“Voya is a forward-thinking organization that understands that going solar is the best way to ensure a healthier bottom line while also contributing to a more sustainable community,” said Russ Patzer, CEO, Sun Valley Solar Solutions. “With this investment, Voya’s leadership sends a strong message that running a healthy business and contributing to a healthier environment are not mutually exclusive goals. Companies can do both. We’re extremely proud to have helped Voya with this important initiative.”

Voya’s new 150,000+-square-foot, state-of-the-art Chandler, Arizona, facility reflects Voya’s commitment to environmental sustainability. Additional eco-friendly features throughout the facility include: LED lighting with automatic controls; open-collaboration workspaces within 15 feet of windows to utilize a daylight-harvesting system that offsets the amount of lighting needed to properly light the space; HVAC temperature controls to allow heating/cooling of individual sections of the facility as occupancy needs change; digital signage to curb printing; building materials made from recycled content for carpeting, wall coverings, ceiling tiles, hardwoods and fabrics; and electric vehicle charging stations.

The Chandler site is one of Voya’s nine major facilities, as well as field offices and virtual employees, across the U.S. that feature environmentally sustainable practices and are home to more than 6,000 employees in total dedicated to helping customers achieve financial wellness. Among various enterprise functions, the Chandler office enables Voya to leverage the time zone difference to provide greater service to Voya’s Retirement and Employee Benefits customers throughout the U.S.

About Voya Financial®

Voya Financial, Inc. (NYSE: VOYA), helps Americans plan, invest and protect their savings — to get ready to retire better. Serving the financial needs of approximately 13.8 million individual and institutional customers in the United States, Voya is a Fortune 500 company that had $7.5 billion in revenue in 2019. The company had $606 billion in total assets under management and administration as of June 30, 2020. With a clear mission to make a secure financial future possible — one person, one family, one institution at a time — Voya’s vision is to be America’s Retirement Company®. Certified as a “Great Place to Work” by the Great Place to Work® Institute, Voya is equally committed to conducting business in a way that is socially, environmentally, economically and ethically responsible. Voya has been recognized as a 2020 World’s Most Admired Company by Fortune magazine; one of the 2020 World’s Most Ethical Companies® by the Ethisphere Institute; as a member of the Bloomberg Gender Equality Index; and as a “Best Place to Work for Disability Inclusion” on the Disability Equality Index by Disability:IN. For more information, visit voya.com. Follow Voya Financial on Facebook, LinkedIn and Twitter @Voya.

About Sun Valley Solar Solutions

Since 2006, Sun Valley Solar Solutions has helped more nearly 9000 Arizona homeowners and businesses turn the state’s most abundant natural resource into immediate savings and a cleaner tomorrow. The company is accredited as a SunPower Authorized Dealer by SunPower Corp., holds an A+ rating with the Better Business Bureau, has won the Angie’s List Super Service Award five times, and was ranked #1 Solar Installer by Ranking Arizona – The Best of Arizona Business. Sun Valley Solar Solutions is NABCEP-certified and a member of the Solar Energy Industries Association, AMICUS, the Electric League of Arizona, the U.S. Green Building Council, and LOCAL FIRST. For more information, visit sunvalleysolar.com.

About Hawkins Design Group

Hawkins Design Group, Inc. is a professional consulting electrical engineering design firm, specializing in electrical, lighting, sustainable design, commissioning and energy audit services. The group has completed more than 6,000 projects, and, as part of each project team, supplies their clients with Electrical System Designs that: maximize their capital investment; fulfill all project requirements; and are constructed within budget. The organization has a wealth of experience with many kinds of businesses and organizations, including industrial, health care, schools, mixed-use facilities, assisted living, commercial/retail, high-rise, hotels, data centers, fire stations, restaurants and churches. Whether for integrated systems or stand-alone projects, Hawkins Design enhances and adds value to their clients’ projects. For more information, visit www.hawkinsdg.com.

About SunPower

Headquartered in California's Silicon Valley, SunPower (NASDAQ:SPWR) is a leading Distributed Generation Storage and Energy Services provider in North America. SunPower offers the only solar + storage solution designed and warranted by one company that gives customers control over electricity consumption and resiliency during power outages while providing cost savings to homeowners, businesses, governments, schools and utilities. For more information, visit www.sunpower.com.

*According to first-operational-year estimates generated using the United States Environmental Protection Agency’s (EPA’s) greenhouse gas equivalency calculator. https://www.epa.gov/energy/greenhouse-gas-equivalencies-calculator

VOYA-CF VOYA-CR


Contacts

Media Contact:
KC Emery
Voya Financial
Office: (860) 580-2981
Cell: (860) 729-8422
This email address is being protected from spambots. You need JavaScript enabled to view it.

ANAHEIM, Calif.--(BUSINESS WIRE)--Willdan Group, Inc. (NASDAQ: WLDN) announced today that it has been selected to design and implement the new Small Commercial Energy Efficiency Program for SDG&E customers. This three-year, $42 million program will provide energy efficiency and demand response to small businesses with peak demand of less than 20 kilowatts.


Willdan has provided energy efficiency and resource procurement programs in Southern California since 2008, including the Lodging Energy Efficiency Program, Healthcare Energy Efficiency Program, Small Business Direct Install Program, Business Energy Solutions Program, Commercial Comprehensive Audit Program, and the Multifamily Energy Savings Assistance Common Area Measures Program. This is Willdan’s first award through the California Investor-Owned Utilities’ new, multi-stage competitive bidding process, which aims to outsource 60% of their energy efficiency programs to third-party implementers by the end of 2022.

“Small businesses were hit the hardest by the economic effects of COVID-19,” said Tom Brisbin, Willdan’s CEO and Chairman. “As they start to recover, their operational costs – such as energy use and time-of-use expenses – are going to be increasingly important. By supporting energy efficiency and demand response, we can reduce energy use and costs, improving their bottom lines.”

The program includes direct install, new financing vehicles tailored for very small customers, and specialized technical assistance. Unique program features include a do-it-yourself installation option, the use of a new online platform to streamline program delivery, and partnership with community-based organizations to assist hard-to-reach customers and customers located in disadvantaged communities.

About Willdan

Willdan is a nationwide provider of professional technical and consulting services to utilities, government agencies, and private industry. Willdan’s service offerings span a broad set of complementary disciplines that include electric grid solutions, energy efficiency and sustainability, engineering and planning, and municipal financial consulting. For additional information, visit Willdan's website at www.willdan.com.

Forward-Looking Statements

Statements in this press release that are not purely historical, including statements regarding Willdan’s intentions, hopes, beliefs, expectations, representations, projections, estimates, plans, or predictions of the future are forward-looking statements within the meaning of the Private Securities Litigation Reform Act of 1995. The forward-looking statements involve risks and uncertainties including, but not limited to, the risk that Willdan will not be able to reduce costs and preserve liquidity to maintain its operations during the continuation of this pandemic nor be able to resume its growth trajectory once pandemic-related restrictions are lifted and the economy begins to recover. It is important to note that Willdan’s actual results could differ materially from those in any such forward-looking statements. Factors that could cause actual results to differ materially include, but are not limited to, the ultimate impact of the COVID-19 pandemic on Willdan’s results, prospects, and opportunities; Willdan’s ability to adequately complete projects in a timely manner; Willdan’s ability to compete successfully in the highly competitive energy efficiency services market; changes in state, local, and regional economies and government budgets; Willdan’s ability to win new contracts, to renew existing contracts, and to compete effectively for contract awards through bidding processes; and Willdan’s ability to successfully integrate its acquisitions and execute on its growth strategy. Willdan’s business could be affected by a number of other factors, including the risk factors listed from time to time in Willdan’s reports filed with the Securities and Exchange Commission, including, but not limited to, the Annual Report on Form 10-K filed for the year ended December 27, 2019. Willdan cautions investors not to place undue reliance on the forward-looking statements contained in this press release. Willdan disclaims any obligation to, and does not undertake to, update or revise any forward-looking statements in this press release.


Contacts

Stacy McLaughlin
Chief Financial Officer
714-940-6300
This email address is being protected from spambots. You need JavaScript enabled to view it.

Al Kaschalk
VP Investor Relations
310-922-5643
This email address is being protected from spambots. You need JavaScript enabled to view it.

Offshore Source Logo

Offshore Source keeps you updated with relevant information concerning the Offshore Energy Sector.

Any views or opinions represented on this website belong solely to the author and do not represent those of the people, institutions or organizations that Offshore Source or collaborators may or may not have been associated with in a professional or personal capacity, unless explicitly stated.

Corporate Offices

Technology Systems Corporation
8502 SW Kansas Ave
Stuart, FL 34997

info@tscpublishing.com