Business Wire News

HOUSTON--(BUSINESS WIRE)--DXP Enterprises, Inc. (NASDAQ:DXPE), a leading products and service distributor that adds value and total cost savings solutions to MRO and OEM customers in virtually every industry, plans to issue a press release announcing its financial results for the third quarter ended September 30, 2020, at 7:00 A.M. Central Time on Friday, November 6, 2020 and to host a conference call to be web cast live on the Company’s website (www.dxpe.com) at 10:30 A.M. Central Time.


Web participants are encouraged to go to the Company’s website (www.dxpe.com) at least 15 minutes prior to the start of the call to register, download and install any necessary audio software. The online archived replay will be available immediately after the conference call at www.dxpe.com and at www.viavid.net.

The Private Securities Litigation Reform Act of 1995 provides a “safe-harbor” for forward-looking statements. Certain information included in this press release (as well as information included in oral statements or other written statements made by or to be made by the Company) contains statements that are forward-looking. Such forward-looking information involves important risks and uncertainties that could significantly affect anticipated results in the future; and accordingly, such results may differ from those expressed in any forward-looking statement made by or on behalf of the Company. These risks and uncertainties include, but are not limited to; ability to obtain needed capital, dependence on existing management, leverage and debt service, domestic or global economic conditions, and changes in customer preferences and attitudes. For more information, review the Company's filings with the Securities and Exchange Commission.


Contacts

DXP Enterprises, Inc.
Kent Yee, 713-996-4700
Chief Financial Officer
www.dxpe.com

NEW YORK--(BUSINESS WIRE)--$PLL #Lithium--Piedmont Lithium Limited (ASX: PLL; NASDAQ: PLL) (“Piedmont” or “Company”) is pleased to present its September 2020 quarterly report. Highlights during and subsequent to the quarter were:


  • Signed binding agreement with Tesla, Inc. (“Tesla”) for the supply of spodumene concentrate from Piedmont’s North Carolina deposit to Tesla for an initial five-year term on a fixed-price binding purchase commitment from the delivery of first product;
  • Completed a bench-scale lithium hydroxide testwork program which demonstrated conversion of Piedmont ore to battery-quality lithium hydroxide. Lithium hydroxide was produced from spodumene concentrate produced from core samples taken from Piedmont’s North Carolina deposit. Quality results compare favorably with current market specifications for battery quality lithium hydroxide;
  • Resumed drilling at Piedmont’s properties located within the world-class Carolina Tin-Spodumene Belt (“TSB”) in North Carolina. The drill program will consist of approximately 5,600 meters with a primary objective to drill Exploration Target areas on the Core and Central properties, as well as previously untested occurrences of spodumene bearing pegmatite on regional properties;
  • Appointed Mr. Austin Devaney as Vice President – Sales & Marketing. Mr. Devaney spent most of the past decade in senior marketing roles with Albemarle Corporation, most recently as Vice President, Strategic Marketing and Customer Excellence; and
  • Completed a U.S. public offering of 2,300,000 of Piedmont’s American Depositary Shares (“ADSs”), with each ADS representing 100 of its ordinary shares, which includes the full exercise of the underwriters’ option, at an issue price of US$25.00 per ADS, to raise aggregate gross proceeds of US$57.5 million (A$81.2 million).

Keith D. Phillips, President and CEO of Piedmont, commented:

“We are extremely proud of the key milestones achieved by Piedmont during the quarter. Our agreement with Tesla highlights the strategic importance of Piedmont’s unique American spodumene deposit and confirms the trend toward spodumene as the preferred feedstock for the lithium hydroxide required in high-nickel batteries. Our relationship with Tesla represents the start of the first U.S. domestic lithium supply chain.

“Additionally, our recent U.S. public offering raised US$57.5 million and brought several strong U.S. cleantech and materials investors into our shareholder base, while strengthening Piedmont’s balance sheet, and enabling us to accelerate our development to become the first new American producer of lithium hydroxide in decades.

“We will soon commence an integrated definitive feasibility study (“DFS”), including a large infill drill campaign and pilot scale metallurgical testwork program, and will also prioritize the procurement of long lead-time items. We will continue to work on marketing arrangements for our lithium hydroxide and quartz by-products, focusing on the electric vehicle and solar panel markets, respectively. The DFS is planned for completion in Q2 2021.”

Click here to view the full ASX Announcement.


Contacts

Keith Phillips
President & CEO
T: +1 973 809 0505
E: This email address is being protected from spambots. You need JavaScript enabled to view it.

Tim McKenna
Investor and Government Relations
T: +1 732 331 6457
E: This email address is being protected from spambots. You need JavaScript enabled to view it.

HOUSTON--(BUSINESS WIRE)--#DNOW--NOW Inc. (NYSE:DNOW) announced today that Dick Alario has stepped down from his short-term role as Executive Vice Chairman of the Company. Mr. Alario previously served as Interim Chief Executive Officer of the Company from November 1, 2019 until the appointment of David Cherechinsky as President and Chief Executive Officer on June 1, 2020. At such time, Mr. Alario was appointed and served as our Executive Vice Chairman on an interim basis to assist with the transition of Mr. Cherechinsky to his new role as the Company’s Chief Executive Officer. Mr. Alario will continue to serve as a director of the Company.


Mr. Alario has been a member of the Board of Directors of NOW Inc. since May 2014, when the Company was spun off from National Oilwell Varco, Inc.

J. Wayne Richards, Chairman of NOW Inc.’s Board of Directors, remarked, “Dick has played a key strategic role advising DistributionNOW’s leadership team. With his wealth of experience in the oilfield services industry, we were very fortunate to have Dick serve as our interim CEO and Executive Vice Chairman during this time.”

Dick Alario stated, “I want to thank all the employees of DistributionNOW for your hard work and continued dedication to the Company. I am excited to see all of the amazing things DistributionNOW will be able to accomplish in the future. I would also like to thank the Board for the confidence they placed in me to help lead DistributionNOW to advance its market position and generate incremental value for our employees, customers and shareholders.”

David Cherechinsky, President and Chief Executive Officer of NOW Inc. remarked that "Dick has been an invaluable leader and incredible mentor to me. I look forward to continuing to work alongside the strong leadership team in place, as well as all the other outstanding women and men at DistributionNOW who support our customers, to ensure we remain focused on delivering one of the most comprehensive product offerings in the energy and industrial sectors, and to drive strong customer relationships and success in our growth initiatives. I am excited about our future and believe we will achieve success together for years to come.”

DistributionNOW is a worldwide supplier of energy and industrial products and engineered equipment solutions. With approximately 2,550 employees and a network of approximately 200 locations worldwide, we offer a suite of digital solutions branded as DigitalNOW® that provide customers world-class technology for digital commerce and data and information management. Our locations provide products and solutions to exploration and production companies, energy transmission and storage companies, refineries, chemical companies, utilities, mining, municipal water, manufacturers and engineering and construction companies. DistributionNOW has a legacy of over 150 years and is headquartered in Houston, Texas.


Contacts

Brad Wise
Vice President, Marketing and Investor Relations
(281) 823-4006
This email address is being protected from spambots. You need JavaScript enabled to view it.

  • Third quarter loss of $207 million; adjusted earnings of $201 million
  • Capital spending down 48 percent; operating expenses down 12 percent
  • Noble Energy acquisition completed in October 2020

SAN RAMON, Calif.--(BUSINESS WIRE)--Chevron Corporation (NYSE: CVX) today reported a loss of $207 million ($(0.12) per share - diluted) for third quarter 2020, compared with earnings of $2.6 billion ($1.36 per share - diluted) in third quarter 2019. Included in the current quarter was a charge of $130 million attributable to a tax item related to an international upstream end-of-contract settlement and a non-cash provision of $90 million for remediation of a former mining asset. Foreign currency effects decreased earnings by $188 million.


Adjusted earnings of $201 million ($0.11 per share - diluted) in third quarter 2020 compares to adjusted earnings of $2.9 billion ($1.55 per share - diluted) in third quarter 2019. For a reconciliation of adjusted earnings/(loss), see Attachment 5.

Sales and other operating revenues in third quarter 2020 were $24 billion, compared to $35 billion in the year-ago period.

Earnings Summary


Three Months
Ended Sept. 30


Nine Months
Ended Sept. 30


Millions of dollars


2020


2019


2020


2019


Earnings by business segment


Upstream


$235


$2,704


$(2,934)


$9,310


Downstream


292


828


385


1,809


All Other


(734)


(952)


(2,329)


(1,585)


Total (1)(2)


$(207)


$2,580


$(4,878)


$9,534


(1) Includes foreign currency effects


$(188)


$74


$(111)


$(48)


(2) Net income attributable to Chevron Corporation (See Attachment 1)


“Third quarter results were down from a year ago, primarily due to lower commodity prices and margins resulting from the impact of COVID-19,” said Michael K. Wirth, Chevron’s chairman of the board and chief executive officer. “The world’s economy continues to operate below pre-pandemic levels, impacting demand for our products which are closely linked to economic activity.”

“We remain focused on what we can control – safe operations, capital discipline and cost management,” Wirth continued. “Compared to last year’s third quarter, organic capital expenditures and operating expenses were down 48 percent and 12 percent, respectively.”

“I’m proud of our employees’ continued focus on safe and reliable operations during these challenging times,” Wirth added. “Our actions are guided by our long-standing financial priorities: to protect the dividend, invest for long term value and maintain a strong balance sheet.”

The company’s acquisition of Noble Energy, Inc. was completed in October following approval by Noble Energy shareholders. Wirth said, “Noble’s high-quality assets, including those in the Eastern Mediterranean, Colorado’s DJ Basin and the Permian Basin, strengthen our portfolio and are expected to increase the long-term value of our company.”

The company’s joint venture, CalBioGas LLC, successfully started production of dairy biomethane, a renewable natural gas (RNG), from dairy farms in California and marketed it as an alternative fuel for heavy-duty trucks and buses. The company also announced the formation of a joint venture with Brightmark LLC to produce and market additional dairy biomethane.

Lastly, the company signed an agreement in October to sell its Appalachia natural gas business. The transaction is expected to close before the end of the year.

UPSTREAM

Worldwide net oil-equivalent production was 2.83 million barrels per day in third quarter 2020, a decrease of 7 percent from a year ago. The decrease was largely a result of curtailed production in response to low commodity prices and asset sales, partially offset by net production increases at a number of properties.

U.S. Upstream


Three Months
Ended Sept. 30


Nine Months
Ended Sept. 30


Millions of dollars


2020


2019


2020


2019


Earnings


$116


$727


$(1,709)


$2,371


U.S. upstream operations earned $116 million in third quarter 2020, compared with $727 million a year earlier. The decrease was primarily due to lower crude oil realizations.

The company’s average sales price per barrel of crude oil and natural gas liquids was $31 in third quarter 2020, down from $47 a year earlier. The average sales price of natural gas was $0.89 per thousand cubic feet in third quarter 2020, down from $0.95 in last year’s third quarter.

Net oil-equivalent production of 982,000 barrels per day in third quarter 2020 was up 48,000 barrels per day from a year earlier. Production increases from shale and tight properties in the Permian Basin in Texas and New Mexico were partially offset by normal field declines and planned maintenance in the Gulf of Mexico. The net liquids component of oil-equivalent production in third quarter 2020 increased 1 percent to 731,000 barrels per day, while net natural gas production increased 21 percent to 1.51 billion cubic feet per day, compared to last year’s third quarter.

International Upstream


Three Months
Ended Sept. 30


Nine Months
Ended Sept. 30


Millions of dollars


2020


2019


2020


2019


Earnings*

$119


$1,977


$(1,225)


$6,939


*Includes foreign currency effects


$(107)


$49


$99


$(97)


International upstream operations earned $119 million in third quarter 2020, compared with $2.0 billion a year ago. The decrease in earnings was primarily due to lower crude oil and natural gas realizations, lower crude oil and natural gas sales volumes, and a tax item related to an end of contract settlement, partially offset by lower depreciation and operating expenses. Foreign currency effects had an unfavorable impact on earnings of $156 million between periods.

The average sales price for crude oil and natural gas liquids in third quarter 2020 was $39 per barrel, down from $56 a year earlier. The average sales price of natural gas was $3.89 per thousand cubic feet in the quarter, compared with $5.62 in last year’s third quarter.

Net oil-equivalent production of 1.85 million barrels per day in third quarter 2020 decreased 247,000 barrels per day from third quarter 2019. The decrease was due to production curtailments associated with OPEC+ restrictions and market conditions combined with asset sale related decreases of 104,000 barrels per day. The net liquids component of oil-equivalent production decreased 12 percent to 976,000 barrels per day in third quarter 2020, while net natural gas production of 5.26 billion cubic feet per day decreased 12 percent, compared to last year’s third quarter.

DOWNSTREAM

U.S. Downstream


Three Months
Ended Sept. 30


Nine Months
Ended Sept. 30


Millions of dollars


2020


2019


2020


2019


Earnings


$141


$389


$(397)


$1,071


U.S. downstream operations earned $141 million in third quarter 2020, compared with $389 million a year earlier. The decrease was mainly due to lower sales volumes and lower margins on refined product sales, partially offset by lower operating expenses.

Refinery crude oil input in third quarter 2020 decreased 17 percent to 820,000 barrels per day from the year-ago period, as the company cut refinery runs in response to the weak refining margin environment.

Refined product sales of 1.00 million barrels per day were down 22 percent from third quarter 2019, mainly due to lower jet fuel, gasoline and diesel demand associated with the COVID-19 pandemic.

International Downstream


Three Months
Ended Sept. 30


Nine Months
Ended Sept. 30


Millions of dollars


2020


2019


2020


2019


Earnings*


$151


$439


$782


$738


*Includes foreign currency effects


$(49)


$27


$(12)


$49


International downstream operations earned $151 million in third quarter 2020, compared with $439 million a year earlier. The decrease in earnings was largely due to lower margins on refined product sales, partially offset by lower operating expenses. Foreign currency effects had an unfavorable impact on earnings of $76 million between periods.

Refinery crude oil input of 570,000 barrels per day in third quarter 2020 decreased 9 percent from the year-ago period, primarily due to the economic slowdowns in response to the COVID-19 pandemic.

Refined product sales of 1.28 million barrels per day in third quarter 2020 were down 6 percent from the year-ago period, mainly due to lower jet fuel demand associated with the COVID-19 pandemic, partially offset by higher diesel sales resulting from the second quarter 2020 acquisition of Puma Energy (Australia) Holdings Pty Ltd.

ALL OTHER


Three Months
Ended Sept. 30


Nine Months
Ended Sept. 30


Millions of dollars


2020


2019


2020


2019


Net Charges*


$(734)


$(952)


$(2,329)


$(1,585)


*Includes foreign currency effects


$(32)


$(2)


$(198)


$0


All Other consists of worldwide cash management and debt financing activities, corporate administrative functions, insurance operations, real estate activities and technology companies.

Net charges in third quarter 2020 were $734 million, compared to $952 million a year earlier. The decrease in net charges between periods was mainly due to the absence of prior year tax charge. Higher corporate expenses partially offset the decrease between periods, primarily from a non-cash provision for remediation of a former mining asset. Foreign currency effects increased net charges by $30 million between periods.

CASH FLOW FROM OPERATIONS

Cash flow from operations in the first nine months of 2020 was $8.3 billion, compared with $21.7 billion in the corresponding 2019 period. Excluding working capital effects, cash flow from operations in the first nine months of 2020 was $8.4 billion, compared with $20.5 billion in the corresponding 2019 period.

CAPITAL AND EXPLORATORY EXPENDITURES

Capital and exploratory expenditures in the first nine months of 2020 were $10.3 billion, compared with $15.0 billion in 2019. The amounts included $3.1 billion in 2020 and $4.6 billion in 2019 for the company’s share of expenditures by affiliates, which did not require cash outlays by the company. Expenditures for upstream represented 82 percent of the company-wide total in 2020. Third quarter 2020 capital expenditures were down 48 percent compared to the prior year period. Included in the first nine months of 2020 were inorganic capital expenditures of $350 million primarily associated with the downstream acquisition of Puma Energy (Australia) Holdings Pty Ltd.

NOTICE

Chevron’s discussion of third quarter 2020 earnings with security analysts will take place on Friday, October 30, 2020, at 8:00 a.m. PDT. A webcast of the meeting will be available in a listen-only mode to individual investors, media, and other interested parties on Chevron’s website at www.chevron.com under the “Investors” section. Additional financial and operating information and other complementary materials will be available under “Events and Presentations” in the “Investors” section on the Chevron website.

As used in this news release, the term “Chevron” and such terms as “the company,” “the corporation,” “our,” “we,” “us” and “its” may refer to Chevron Corporation, one or more of its consolidated subsidiaries, or to all of them taken as a whole. All of these terms are used for convenience only and are not intended as a precise description of any of the separate companies, each of which manages its own affairs.

Please visit Chevron’s website and Investor Relations page at www.chevron.com and www.chevron.com/investors, LinkedIn: www.linkedin.com/company/chevron, Twitter: @Chevron, Facebook: www.facebook.com/chevron, and Instagram: www.instagram.com/chevron, where Chevron often discloses important information about the company, its business, and its results of operations.

This press release includes adjusted earnings/(loss), which reflect earnings or losses excluding significant non-operational items including impairment charges, write-offs, gains on asset sales, unusual tax items, the Anadarko merger termination fee, foreign currency effects and other special items. We believe it is useful for investors to consider these figures in comparing the underlying performance of our business across periods. The presentation of this additional information is not meant to be considered in isolation or as a substitute for net income (loss) as prepared in accordance with U.S. GAAP. A reconciliation to net income (loss) attributable to Chevron Corporation is shown in Attachment 5.

CAUTIONARY STATEMENTS RELEVANT TO FORWARD-LOOKING INFORMATION FOR THE PURPOSE OF “SAFE HARBOR” PROVISIONS OF THE PRIVATE SECURITIES LITIGATION REFORM ACT OF 1995

This news release contains forward-looking statements relating to Chevron’s operations that are based on management's current expectations, estimates and projections about the petroleum, chemicals and other energy-related industries. Words or phrases such as “anticipates,” “expects,” “intends,” “plans,” “targets,” “forecasts,” “projects,” “believes,” “seeks,” “schedules,” “estimates,” “positions,” “pursues,” “may,” “could,” “should,” “will,” “budgets,” “outlook,” “trends,” “guidance,” “focus,” “on schedule,” “on track,” “is slated,” “goals,” “objectives,” “strategies,” “opportunities,” “poised,” “potential” and similar expressions are intended to identify such forward-looking statements. These statements are not guarantees of future performance and are subject to certain risks, uncertainties and other factors, many of which are beyond the company’s control and are difficult to predict. Therefore, actual outcomes and results may differ materially from what is expressed or forecasted in such forward-looking statements. The reader should not place undue reliance on these forward-looking statements, which speak only as of the date of this news release. Unless legally required, Chevron undertakes no obligation to update publicly any forward-looking statements, whether as a result of new information, future events or otherwise.

Among the important factors that could cause actual results to differ materially from those in the forward-looking statements are: changing crude oil and natural gas prices and demand for our products, and production curtailments due to market conditions; crude oil production quotas or other actions that might be imposed by the Organization of Petroleum Exporting Countries and other producing countries; public health crises, such as pandemics (including coronavirus (COVID-19)) and epidemics, and any related government policies and actions; changing economic, regulatory and political environments in the various countries in which the company operates; general domestic and international economic and political conditions; changing refining, marketing and chemicals margins; the company’s ability to realize anticipated cost savings, expenditure reductions and efficiencies associated with enterprise transformation initiatives; actions of competitors or regulators; timing of exploration expenses; timing of crude oil liftings; the competitiveness of alternate-energy sources or product substitutes; technological developments; the results of operations and financial condition of the company’s suppliers, vendors, partners and equity affiliates, particularly during extended periods of low prices for crude oil and natural gas during the COVID-19 pandemic; the inability or failure of the company’s joint-venture partners to fund their share of operations and development activities; the potential failure to achieve expected net production from existing and future crude oil and natural gas development projects; potential delays in the development, construction or start-up of planned projects; the potential disruption or interruption of the company’s operations due to war, accidents, political events, civil unrest, severe weather, cyber threats, terrorist acts, or other natural or human causes beyond the company’s control; the potential liability for remedial actions or assessments under existing or future environmental regulations and litigation; significant operational, investment or product changes required by existing or future environmental statutes and regulations, including international agreements and national or regional legislation and regulatory measures to limit or reduce greenhouse gas emissions; the potential liability resulting from pending or future litigation; the company's ability to successfully integrate the operations of Chevron and Noble Energy and achieve the anticipated benefits from the acquisition of Noble Energy; the company’s future acquisitions or dispositions of assets or shares or the delay or failure of such transactions to close based on required closing conditions; the potential for gains and losses from asset dispositions or impairments; government mandated sales, divestitures, recapitalizations, industry-specific taxes, tariffs, sanctions, changes in fiscal terms or restrictions on scope of company operations; foreign currency movements compared with the U.S. dollar; material reductions in corporate liquidity and access to debt markets; the receipt of required Board authorizations to pay future dividends; the effects of changed accounting rules under generally accepted accounting principles promulgated by rule-setting bodies; the company’s ability to identify and mitigate the risks and hazards inherent in operating in the global energy industry; and the factors set forth under the heading “Risk Factors” on pages 18 through 21 of the company's 2019 Annual Report on Form 10-K, as updated by Part II, Item 1A, "Risk Factors" in the company's subsequently filed Quarterly Reports on Form 10-Q, and in other subsequent filings with the U.S. Securities and Exchange Commission. Other unpredictable or unknown factors not discussed in this news release could also have material adverse effects on forward-looking statements.

CHEVRON CORPORATION - FINANCIAL REVIEW

Attachment 1 

(Millions of Dollars, Except Per-Share Amounts)


(unaudited)


CONSOLIDATED STATEMENT OF INCOME


Three Months
Ended September 30


Nine Months
Ended September 30

REVENUES AND OTHER INCOME


2020


2019


2020


2019


Sales and other operating revenues


$

23,997


$

34,779


$

69,628


$

105,291


Income from equity affiliates


510


1,172


(1,040

)


3,430


Other income


(56

)


165


858


1,445


Total Revenues and Other Income


24,451


36,116


69,446


110,166


COSTS AND OTHER DEDUCTIONS


Purchased crude oil and products


13,448


19,882


37,101


60,420


Operating expenses *


5,658


6,400


18,928


18,731


Exploration expenses


117


168


1,170


498


Depreciation, depletion and amortization


4,017


4,361


15,022


12,789


Taxes other than on income


1,091


1,059


3,223


3,167


Interest and debt expense


164


197


498


620


Total Costs and Other Deductions


24,495


32,067


75,942


96,225


Income (Loss) Before Income Tax Expense


(44

)


4,049


(6,496

)


13,941


Income tax expense (benefit)


165


1,469


(1,591

)


4,429


Net Income (Loss)


(209

)


2,580


(4,905

)


9,512


Less: Net income (loss) attributable to noncontrolling interests


(2

)


(27

)


(22

)


NET INCOME (LOSS) ATTRIBUTABLE TO CHEVRON CORPORATION


$

(207

)


$

2,580


$

(4,878

)


$

9,534


* Includes operating expense, selling, general and administrative expense, and other components of net periodic benefit costs


PER-SHARE OF COMMON STOCK


Net Income (Loss) Attributable to Chevron Corporation


- Basic


$

(0.12

)


$

1.38


$

(2.63

)


$

5.06


- Diluted


$

(0.12

)


$

1.36


$

(2.63

)


$

5.02


Weighted Average Number of Shares Outstanding (000's)


- Basic


1,853,533


1,880,607


1,856,363


1,885,931


- Diluted


1,853,533


1,893,928


1,856,363


1,899,193


CHEVRON CORPORATION - FINANCIAL REVIEW


Attachment 2


(Millions of Dollars)


(unaudited)


 EARNINGS BY MAJOR OPERATING AREA


Three Months
Ended September 30


Nine Months
Ended September 30


2020


2019


2020


2019

Upstream


United States


$

116 


$

727 


$

(1,709)


$

2,371 


International


119 


1,977 


(1,225)


6,939 


Total Upstream


235 


2,704 


(2,934)


9,310 


Downstream


United States


141 


389 


(397)


1,071 


International


151 


439 


782 


738 


Total Downstream


292 


828 


385 


1,809 


All Other (1)


(734)


(952)


(2,329)


(1,585)


Total (2)


$

(207)


$

2,580 


$

(4,878)


$

9,534 


SELECTED BALANCE SHEET ACCOUNT DATA (Preliminary)


Sep 30,
2020


Dec 31,
2019

Cash and Cash Equivalents


$

6,866 


$

5,686 


Marketable Securities


$

28 


$

63 


Total Assets


$

223,063 


$

237,428 


Total Debt


$

34,810 


$

26,973 


Total Chevron Corporation Stockholders' Equity


$

131,774 


$

144,213 


Three Months
Ended September 30


Nine Months
Ended September 30

CAPITAL AND EXPLORATORY EXPENDITURES(3)


2020


2019


2020


2019

United States


Upstream


$

904 


$

2,102 


$

3,932 


$

5,929 


Downstream


296 


327 


750 


1,381 


Other


44 


102 


183 


233 


Total United States


1,244 


2,531 


4,865 


7,543 


International


Upstream


1,119 


2,137 


4,499 


6,873 


Downstream


228 


284 


949 


550 


Other


12 


Total International


1,348 


2,425 


5,457 


7,435 


Worldwide


$

2,592 


$

4,956 


$

10,322 


$

14,978 


(1)    Includes worldwide cash management and debt financing activities, corporate administrative functions, insurance operations, real estate activities, and technology companies.


(2)    Net Income (Loss) Attributable to Chevron Corporation (See Attachment 1).


(3)    Includes interest in affiliates:


United States


$

76 


$

85 


$

251 


$

256 


International


729 


1,349 


2,812 


4,322 


Total


$

805 


$

1,434 


$

3,063 


$

4,578 


CHEVRON CORPORATION - FINANCIAL REVIEW


Attachment 3

(Billions of Dollars)


(unaudited)


SUMMARIZED STATEMENT OF CASH FLOWS (Preliminary)1


Nine Months
Ended September 30

OPERATING ACTIVITIES


2020


2019

Net Income (Loss)


$

(4.9)


$

9.5 


Adjustments


Depreciation, depletion and amortization


15.0 


12.8 


Distributions more (less) than income from equity affiliates


2.2 


(1.9)


Loss (gain) on asset retirements and sales


(0.6)


(0.1)


Net foreign currency effects


0.2 


0.1 


Deferred income tax provision


(3.2)


1.0 


Net decrease (increase) in operating working capital


— 


1.1 


Other operating activity


(0.4)


(0.8)


Net Cash Provided by Operating Activities


$

8.3 


$

21.7 


INVESTING ACTIVITIES


Capital expenditures


(6.9)


(9.9)


Proceeds and deposits related to asset sales and returns of investment


2.0 


1.1 


Net maturities of (investments in) time deposits


— 


1.0 


Other investing activity(2)


(1.4)


(1.0)


Net Cash Used for Investing Activities


$

(6.3)


$

(8.8)


FINANCING ACTIVITIES


Net change in debt


7.7 


(1.9)


Cash dividends — common stock


(7.2)


(6.7)


Net sales (purchases) of treasury shares


(1.5)


(1.8)


Distributions to noncontrolling interests


— 


— 


Net Cash Used for Financing Activities


$

(1.1)


$

(10.5)


EFFECT OF EXCHANGE RATE CHANGES ON CASH, CASH EQUIVALENTS AND RESTRICTED CASH


(0.1)


— 


NET CHANGE IN CASH, CASH EQUIVALENTS AND RESTRICTED CASH


$

0.9 


$

2.3 


(1)  Totals may not match sum of parts due to presentation in billions.


(2)  Primarily borrowings of loans by equity affiliates.


CHEVRON CORPORATION - FINANCIAL REVIEW

Attachment 4

(unaudited)


OPERATING STATISTICS (1)


Three Months
Ended September 30


Nine Months
Ended September 30

NET LIQUIDS PRODUCTION (MB/D): (2)


2020


2019


2020


2019

United States


731


726


760


709


International


976


1,104


1,072


1,147


Worldwide


1,707


1,830


1,832


1,856


NET NATURAL GAS PRODUCTION (MMCF/D): (3)


United States


1,507


1,243


1,511


1,178


International


5,257


5,972


5,609


5,995


Worldwide


6,764


7,215


7,120


7,173


TOTAL NET OIL-EQUIVALENT PRODUCTION (MB/D): (4)


United States


982


934


1,012


906


International


1,852


2,099


2,006


2,146


Worldwide


2,834


3,033


3,018


3,052


SALES OF NATURAL GAS (MMCF/D):


United States


3,776


3,945


4,000


3,980


International


5,513


5,923


5,722


5,922


Worldwide


9,289


9,868


9,722


9,902


SALES OF NATURAL GAS LIQUIDS (MB/D):


United States


230


233


228


213


International


133


102


126


111


Worldwide


363


335


354


324


SALES OF REFINED PRODUCTS (MB/D):


United States


1,004


1,294


997


1,255


International (5)


1,282


1,356


1,219


1,344


Worldwide


2,286


2,650


2,216


2,599


REFINERY INPUT (MB/D):


United States


820


992


789


939


International


570


625


598


630


Worldwide


1,390


1,617


1,387


1,569


(1) Includes interest in affiliates.


(2) Includes net production of synthetic oil:


Canada


35


53


52


51


Venezuela Affiliate


4


(3) Includes natural gas consumed in operations (MMCF/D):


United States


35


34


34


34


International


535


611


571


611


(4) Oil-equivalent production is the sum of net liquids production, net natural gas production and synthetic production. The oil-equivalent gas conversion ratio is 6,000 cubic feet of natural gas = 1 barrel of crude oil.


(5) Includes share of affiliate sales (MB/D):


350


399


352


377


Contacts

Sean Comey -- +1 925-842-5509


Read full story here

LEAWOOD, KS--(BUSINESS WIRE)--This notice provides stockholders of Tortoise Power and Energy Infrastructure Fund, Inc. (NYSE: TPZ) with information regarding the distribution paid on October 30, 2020 and cumulative distributions paid fiscal year-to-date.


The following table sets forth the estimated amounts of the current distribution, payable October 30, 2020, and the cumulative distributions paid this fiscal year to date from the following sources: net investment income, net realized short-term capital gains, net realized long-term capital gains and return of capital. All amounts are expressed per common share.

Estimated Sources of Distributions
 
 
($) Current
Distribution
% Breakdown
of the Current
Distribution
($) Total Cumulative
Distributions for the
Fiscal Year to Date
% Breakdown of the
Total Cumulative
Distributions for the
Fiscal Year to Date
 
Net Investment Income

0.0317


63%


0.3453


35%

Net Realized Short-Term Capital Gains

0.0000


0%


0.0000


0%

Net Realized Long-Term Capital Gains

0.0000


0%


0.0000


0%

Return of Capital

0.0183


37%


0.6547


65%

Total (per common share)

0.0500


100%


1.0000


100%

 
Average annual total return (in relation to NAV) for the 5 years ending on 9/30/2020

-4.32%

Annualized current distribution rate expressed as a percentage of NAV as of 9/30/2020

5.15%


Cumulative total return (in relation to NAV) for the fiscal year through 9/30/2020

-28.71%

Cumulative fiscal year distributions as a percentage of NAV as of 9/30/2020

8.59%

You should not draw any conclusions about TPZ's investment performance from the amount of this distribution or from the terms of TPZ's distribution policy.

TPZ estimates that it has distributed more than its income and net realized capital gains; therefore, a portion of your distribution may be a return of capital. A return of capital may occur, for example, when some or all of the money that you invested in TPZ is paid back to you. A return of capital distribution does not necessarily reflect TPZ’s investment performance and should not be confused with "yield" or "income."

The amounts and sources of distributions reported are only estimates and are not being provided for tax reporting purposes. The actual amounts and sources of the amounts for tax reporting purposes will depend upon TPZ's investment experience during the remainder of its fiscal year and may be subject to changes based on tax regulations. TPZ will send you a Form 1099-DIV for the calendar year that will tell you how to report these distributions for federal income tax purposes.

About Tortoise

Tortoise focuses on energy infrastructure and the transition to cleaner energy. Tortoise’s solid track record of energy value chain investment experience and research dates back more than 20 years. As one of the earliest investors in midstream energy, Tortoise believes it is well-positioned to be at the forefront of the global energy evolution that is underway. With a steady wins approach and a long-term perspective, Tortoise strives to make a positive impact on clients and communities. To learn more, please visit www.TortoiseEcofin.com.

Tortoise Capital Advisors is the Adviser to the Tortoise Power and Energy Infrastructure Fund, Inc.

Cautionary Statement Regarding Forward-Looking Statements

This press release contains certain statements that may include “forward-looking statements” within the meaning of Section 27A of the Securities Act of 1933 and Section 21E of the Securities Exchange Act of 1934. All statements, other than statements of historical fact, included herein are "forward-looking statements." Although the funds and Tortoise Capital Advisors believe that the expectations reflected in these forward-looking statements are reasonable, they do involve assumptions, risks and uncertainties, and these expectations may prove to be incorrect. Actual results could differ materially from those anticipated in these forward-looking statements as a result of a variety of factors, including those discussed in the fund’s reports that are filed with the Securities and Exchange Commission. You should not place undue reliance on these forward-looking statements, which speak only as of the date of this press release. Other than as required by law, the funds and Tortoise Capital Advisors do not assume a duty to update this forward-looking statement.

Safe Harbor Statement

This press release shall not constitute an offer to sell or a solicitation to buy, nor shall there be any sale of these securities in any state or jurisdiction in which such offer or solicitation or sale would be unlawful prior to registration or qualification under the laws of such state or jurisdiction.


Contacts

Maggie Zastrow at (913) 981-1020 or This email address is being protected from spambots. You need JavaScript enabled to view it.

  • Reported a third-quarter loss of $799 million or $1.82 per share; adjusted loss of $1 million or $0.01 per share
  • Generated operating cash flow of $491 million; $795 million excluding working capital
  • Captured improved market conditions in Midstream, Chemicals and Marketing & Specialties
  • Recently started operations of Sweeny Fracs 2 and 3
  • Announced San Francisco Refinery conversion into the world’s largest renewable fuels plant

HOUSTON--(BUSINESS WIRE)--#earnings--Phillips 66 (NYSE: PSX), a diversified energy manufacturing and logistics company, announces a third-quarter 2020 loss of $799 million, compared with a loss of $141 million in the second quarter of 2020. Excluding special items of $798 million in the third quarter, primarily an impairment related to the planned conversion of the San Francisco Refinery to a renewable fuels plant, the company had an adjusted loss of $1 million, compared with a second-quarter adjusted loss of $324 million.


“Our diversified, integrated portfolio helped us navigate a challenging market environment in the third quarter,” said Greg Garland, chairman and CEO of Phillips 66. “Our Midstream, Chemicals and Marketing businesses benefited from improved market conditions, while Refining continued to be impacted by weak margins. We advanced our growth strategy with the recent startup of Sweeny Fracs 2 and 3, marking completion of the Sweeny Hub phase 2 expansion. Also, we announced Rodeo Renewed, a project to reconfigure our San Francisco Refinery into the world’s largest renewable fuels plant, making investments that advance a lower carbon future.

“We are proud of how our employees continue to step up to the challenges of 2020, from the pandemic to the West Coast fires and the Gulf Coast hurricanes. Our response to the storms in particular underscored our commitment to operating excellence, as our facilities were secured and sustained minimal damage. The people of Phillips 66 continue to demonstrate our values of providing energy and improving lives in what has been a very uncertain and challenging environment.

“Our diversified businesses, strong balance sheet and disciplined capital allocation enable us to effectively manage through a low margin environment. We paid $393 million in dividends in the third quarter and are committed to a secure, competitive and growing dividend. We remain focused on creating value for shareholders through operating excellence, financial discipline and return-enhancing investments.”

Midstream


Millions of Dollars


Pre-Tax Income


Adjusted Pre-Tax Income


Q3 2020

Q2 2020


Q3 2020

Q2 2020

Transportation

$

(3)

214


202

130

NGL and Other

99

78


102

83

DCP Midstream

50

32


50

32

Midstream

$

146

324


354

245

Midstream third-quarter pre-tax income was $146 million, compared with $324 million in the second quarter. Midstream results in the third quarter included a $120 million impairment of pipeline and terminal assets related to the planned conversion of the San Francisco Refinery to a renewable fuels plant, an $84 million impairment related to the cancellation of the Red Oak Pipeline project, $3 million of pension settlement expense and $1 million of hurricane-related costs. Second-quarter results included an $84 million gain related to Phillips 66 Partners’ prior-year sale of an interest in the Gray Oak Pipeline, as well as $5 million of pension settlement expense.

Transportation third-quarter adjusted pre-tax income of $202 million was $72 million higher than the second quarter. The increase was primarily due to higher pipeline and terminal volumes, including ramp-up of volumes on the Gray Oak Pipeline.

NGL and Other adjusted pre-tax income was $102 million in the third quarter, compared with $83 million in the second quarter. The improvement was mainly due to higher Sweeny Hub volumes and inventory impacts.

The company’s equity investment in DCP Midstream, LLC generated third-quarter adjusted pre-tax income of $50 million, an $18 million increase from the prior quarter, mainly reflecting hedging impacts.

Chemicals


Millions of Dollars


Pre-Tax Income


Adjusted Pre-Tax Income


Q3 2020

Q2 2020


Q3 2020

Q2 2020

Olefins and Polyolefins

$

241

70


148

106

Specialties, Aromatics and Styrenics

11


5

11

Other

(21)

(28)


(21)

(28)

Chemicals

$

231

42


132

89

The Chemicals segment reflects Phillips 66’s equity investment in Chevron Phillips Chemical Company LLC (CPChem). Chemicals’ third-quarter 2020 pre-tax income was $231 million, compared with $42 million in the second quarter of 2020. Chemicals results in the third quarter included a $101 million benefit to equity earnings from lower-of-cost-or-market inventory adjustments, partially offset by $2 million of hurricane-related costs. Second-quarter results included reductions to equity earnings of $32 million in lower-of-cost-or-market inventory adjustments, as well as a $15 million asset write-off related to an international joint venture.

CPChem’s Olefins and Polyolefins (O&P) business contributed $148 million of adjusted pre-tax income in the third quarter of 2020, compared with $106 million in the second quarter. The $42 million increase was primarily due to higher polyethylene margins, driven by improved sales prices, partially offset by lower polyethylene volumes and higher operating costs. Global O&P utilization was 94% for the quarter, reflecting downtime at U.S. Gulf Coast facilities.

CPChem’s Specialties, Aromatics and Styrenics (SA&S) business contributed third-quarter adjusted pre-tax income of $5 million, compared with $11 million in the second quarter. The decrease was primarily due to lower margins, partially offset by higher volumes.

The $7 million decrease in Other adjusted net costs in the third quarter mainly reflects lower employee-related expenses.

Refining


Millions of Dollars


Pre-Tax Loss

Adjusted Pre-Tax Loss


Q3 2020

Q2 2020

Q3 2020

Q2 2020

Refining

$

(1,903)

(878)

(970)

(867)

Refining had a third-quarter pre-tax loss of $1.9 billion, compared with a pre-tax loss of $878 million in the second quarter. Refining results in the third quarter included a $910 million impairment related to the planned conversion of the San Francisco Refinery to a renewable fuels plant, $12 million of pension settlement expense and $11 million of hurricane-related costs. Second-quarter results included $26 million of pension settlement expense and a $15 million benefit to equity earnings from a lower-of-cost-or-market inventory adjustment.

Refining had an adjusted pre-tax loss of $970 million in the third quarter of 2020, compared with an adjusted pre-tax loss of $867 million in the second quarter of 2020. The decreased results were largely driven by lower realized margins, partially offset by higher volumes. Realized margins were down 32% to $1.78 per barrel in the third quarter, reflecting tightening crude spreads and lower secondary product margins. Phillips 66’s worldwide crude utilization rate was 77% in the third quarter, up from 75% in the second quarter. Improved third-quarter utilization mainly reflects increased refining runs in the Central Corridor and West Coast regions, partially offset by downtime at Gulf Coast refineries, including the impact of hurricane-related third-party power outages at the Lake Charles Refinery.

Pre-tax turnaround costs for the third quarter were $41 million, compared with second-quarter costs of $38 million. Clean product yield was 85% in the third quarter.

Marketing and Specialties


Millions of Dollars


Pre-Tax Income


Adjusted Pre-Tax Income


Q3 2020

Q2 2020


Q3 2020

Q2 2020

Marketing and Other

$

365

255


366

259

Specialties


50

31


51

34

Marketing and Specialties

$

415

286


417

293

Marketing and Specialties (M&S) third-quarter pre-tax income was $415 million, compared with $286 million in the second quarter of 2020. M&S results in the third quarter included hurricane-related costs of $1 million and pension settlement expense of $1 million. Second-quarter results included $4 million of pension settlement expense and a $3 million reduction to equity earnings from a lower-of-cost-or-market inventory adjustment.

Adjusted pre-tax income for Marketing and Other was $366 million in the third quarter of 2020, an increase of $107 million from the second quarter of 2020. The increase primarily reflects higher margins and volumes, driven by improved market conditions and demand recovery. Refined product exports in the third quarter were 139,000 barrels per day (BPD).

Specialties generated third-quarter adjusted pre-tax income of $51 million, up from $34 million in the second quarter. The increase was largely due to higher finished lubricant volumes.

Corporate and Other


Millions of Dollars


Pre-Tax Loss


Adjusted Pre-Tax Loss


Q3 2020

Q2 2020


Q3 2020

Q2 2020

Corporate and Other

$

(239)

(219)


(213)

(224)

Corporate and Other third-quarter pre-tax costs were $239 million, compared with pre-tax costs of $219 million in the second quarter. Pre-tax costs in the third quarter included a $25 million asset impairment, and second-quarter pre-tax costs included $8 million of net interest benefits related to tax audit adjustments. Pre-tax costs also included pension settlement expense of $1 million and $3 million in the third quarter and second quarter, respectively.

The $11 million decrease in Corporate and Other adjusted pre-tax costs in the third quarter was mainly driven by lower employee-related expenses, partially offset by higher net interest expense.

Financial Position, Liquidity and Return of Capital

Phillips 66 generated $491 million in cash from operations during the third quarter, including $305 million of cash distributions from equity affiliates. Excluding working capital impacts, operating cash flow was $795 million.

Capital expenditures and investments in the third quarter were $552 million. Excluding $3 million of capital funded by Gray Oak joint venture partners, adjusted capital spending was $549 million. The company expects 2020 consolidated capital expenditures and investments to be $3 billion, and adjusted capital spending to be $2.9 billion, net of cash capital contributions from joint venture partners. Phillips 66 paid $393 million in dividends in the third quarter.

As of Sept. 30, 2020, Phillips 66 had $7 billion of liquidity, reflecting $1.5 billion of cash and cash equivalents and approximately $5.5 billion of total committed capacity under its revolving credit facilities. Consolidated debt was $14.5 billion at Sept. 30, 2020, including $3.8 billion at Phillips 66 Partners (PSXP). The company’s consolidated debt-to-capital ratio was 39% and its net debt-to-capital ratio was 37%. Excluding PSXP, the debt-to-capital ratio was 35% and the net debt-to-capital ratio was 32%.

Strategic Update

Phillips 66 has completed the two new 150,000 BPD fractionators at its Sweeny Hub, bringing the site’s total fractionation capacity to 400,000 BPD. Frac 2 reached full rates in September, and Frac 3 started operations in October. The fractionators are supported by long-term customer commitments.

Phillips 66 Partners continued construction of the C2G Pipeline, a 16 inch ethane pipeline that will connect its Clemens Caverns storage facility to petrochemical facilities in Gregory, Texas, near Corpus Christi, Texas. The project is backed by long-term commitments and is expected to be completed in mid-2021.

At the South Texas Gateway Terminal, which is being constructed by Buckeye Partners, L.P., the first dock and 5.1 million barrels of storage capacity have been commissioned. Marine and terminal operations will continue to ramp up through the end of this year as additional phases of construction are completed. Upon project completion in the first quarter of 2021, the marine export terminal will have two deepwater docks with up to 800,000 BPD of throughput capacity, along with storage capacity of 8.6 million barrels. Phillips 66 Partners owns a 25% interest in the terminal.

The company is adding a 200,000 BPD dock at its Beaumont Terminal, bringing the terminal’s total dock capacity to 800,000 BPD. The new dock is expected to be completed in the fourth quarter of 2020. The terminal has total crude and product storage capacity of 16.8 million barrels.

In Chemicals, CPChem and Qatar Petroleum are jointly pursuing development of petrochemical facilities on the U.S. Gulf Coast and in Ras Laffan, Qatar. CPChem is closely monitoring economic developments and has deferred final investment decision for its U.S. Gulf Coast project.

In October, CPChem announced its first U.S. commercial-scale production of polyethylene from recycled mixed-waste plastics. CPChem is using advanced recycling technology to convert plastic waste to valuable liquids that can become new petrochemicals. CPChem’s circular polyethylene matches the performance and safety specifications of traditional polymers.

Phillips 66 announced Rodeo Renewed, a project to reconfigure its San Francisco Refinery in Rodeo, California, to meet the growing demand for renewable fuels. The plant would no longer produce fuels from crude oil, but instead would make fuels from used cooking oil, fats, greases, soybean oils and other feedstocks. Upon expected completion in early 2024, the facility would have over 50,000 BPD, or 800 million gallons per year, of renewable fuel production capacity, making it the world’s largest facility of its kind. The conversion is expected to reduce the plant’s greenhouse gas emissions by 50% and help California meet its low carbon objectives.

In Marketing, the company continues its program to roll out updated signature image designs for Phillips 66, 76 and Conoco branded sites in the United States. During the quarter, 284 sites were reimaged. Since the program’s inception in 2015, approximately 5,000 sites have been reimaged.

In Europe, the company continues its program to update signature image designs for JET branded sites. During the quarter, 31 sites were reimaged. Since the program’s inception in 2019, 143 sites have been reimaged.

Investor Webcast

Later today, members of Phillips 66 executive management will host a webcast at noon EDT to discuss the company’s third-quarter performance and provide an update on strategic initiatives. To access the webcast and view related presentation materials, go to www.phillips66.com/investors and click on “Events & Presentations.” For detailed supplemental information, go to www.phillips66.com/supplemental.

Earnings (Loss)


Millions of Dollars


2020


2019


Q3

Q2

Sep
YTD


Q3

Sep
YTD

Midstream

$

146

324

(232)


(460)

279

Chemicals

231

42

442


227

729

Refining

(1,903)

(878)

(5,042)


856

1,641

Marketing and Specialties

415

286

1,214


498

1,056

Corporate and Other

(239)

(219)

(655)


(178)

(593)

Pre-Tax Income (Loss)

(1,350)

(445)

(4,273)


943

3,112

Less: Income tax expense (benefit)

(624)

(378)

(1,053)


150

545

Less: Noncontrolling interests

73

74

216


81

227

Phillips 66

$

(799)

(141)

(3,436)


712

2,340


Adjusted Earnings (Loss)


Millions of Dollars


2020


2019


Q3

Q2

Sep
YTD


Q3

Sep
YTD

Midstream

$

354

245

1,059


440

1,179

Chemicals

132

89

414


269

771

Refining

(970)

(867)

(2,238)


839

1,603

Marketing and Specialties

417

293

1,198


498

1,056

Corporate and Other

(213)

(224)

(634)


(178)

(593)

Pre-Tax Income (Loss)

(280)

(464)

(201)


1,868

4,016

Less: Income tax expense (benefit)

(352)

(190)

(518)


385

821

Less: Noncontrolling interests

73

50

192


81

227

Phillips 66

$

(1)

(324)

125


1,402

2,968

About Phillips 66

Phillips 66 is a diversified energy manufacturing and logistics company. With a portfolio of Midstream, Chemicals, Refining, and Marketing and Specialties businesses, the company processes, transports, stores and markets fuels and products globally. Phillips 66 Partners, the company’s master limited partnership, is integral to the portfolio. Headquartered in Houston, the company has 14,500 employees committed to safety and operating excellence. Phillips 66 had $54 billion of assets as of Sept. 30, 2020. For more information, visit www.phillips66.com or follow us on Twitter @Phillips66Co.

CAUTIONARY STATEMENT FOR THE PURPOSES OF THE “SAFE HARBOR” PROVISIONS OF THE PRIVATE SECURITIES LITIGATION REFORM ACT OF 1995

This news release contains certain forward-looking statements within the meaning of Section 27A of the Securities Act of 1933, as amended, and Section 21E of the Securities Exchange Act of 1934, as amended, which are intended to be covered by the safe harbors created thereby. Words and phrases such as “is anticipated,” “is estimated,” “is expected,” “is planned,” “is scheduled,” “is targeted,” “believes,” “continues,” “intends,” “will,” “would,” “objectives,” “goals,” “projects,” “efforts,” “strategies” and similar expressions are used to identify such forward-looking statements. However, the absence of these words does not mean that a statement is not forward-looking. Forward-looking statements included in this news release are based on management’s expectations, estimates and projections as of the date they are made. These statements are not guarantees of future performance and you should not unduly rely on them as they involve certain risks, uncertainties and assumptions that are difficult to predict. Therefore, actual outcomes and results may differ materially from what is expressed or forecast in such forward-looking statements. Factors that could cause actual results or events to differ materially from those described in the forward-looking statements include: the continuing effects of the COVID-19 pandemic and its negative impact on commercial activity and demand for refined petroleum products; the inability to timely obtain or maintain permits necessary for capital projects; changes to worldwide government policies relating to renewable fuels and greenhouse gas emissions that adversely affect programs like the renewable fuel standards program, low carbon fuel standards and tax credits for biofuels; fluctuations in NGL, crude oil, and natural gas prices, and petrochemical and refining margins; unexpected changes in costs for constructing, modifying or operating our facilities; unexpected difficulties in manufacturing, refining or transporting our products; the level and success of drilling and production volumes around our Midstream assets; risks and uncertainties with respect to the actions of actual or potential competitive suppliers and transporters of refined petroleum products, renewable fuels or specialty products; lack of, or disruptions in, adequate and reliable transportation for our NGL, crude oil, natural gas, and refined products; potential liability from litigation or for remedial actions, including removal and reclamation obligations under environmental regulations; failure to complete construction of capital projects on time and within budget; the inability to comply with governmental regulations or make capital expenditures to maintain compliance; limited access to capital or significantly higher cost of capital related to illiquidity or uncertainty in the domestic or international financial markets; potential disruption of our operations due to accidents, weather events, including as a result of climate change, terrorism or cyberattacks; general domestic and international economic and political developments including armed hostilities, expropriation of assets, and other political, economic or diplomatic developments, including those caused by public health issues and international monetary conditions and exchange controls; changes in governmental policies relating to NGL, crude oil, natural gas, refined petroleum products, or renewable fuels pricing, regulation or taxation, including exports; changes in estimates or projections used to assess fair value of intangible assets, goodwill and property and equipment and/or strategic decisions with respect to our asset portfolio that cause impairment charges; investments required, or reduced demand for products, as a result of environmental rules and regulations; changes in tax, environmental and other laws and regulations (including alternative energy mandates); the operation, financing and distribution decisions of equity affiliates we do not control; the impact of adverse market conditions or other similar risks to those identified herein affecting PSXP, as well as the ability of PSXP to successfully execute its growth plans; and other economic, business, competitive and/or regulatory factors affecting Phillips 66’s businesses generally as set forth in our filings with the Securities and Exchange Commission. Phillips 66 is under no obligation (and expressly disclaims any such obligation) to update or alter its forward-looking statements, whether as a result of new information, future events or otherwise.

Use of Non-GAAP Financial InformationThis news release includes the terms “adjusted earnings (loss),” “adjusted earnings (loss) per share” and “adjusted pre-tax income (loss).” These are non-GAAP financial measures that are included to help facilitate comparisons of operating performance across periods and to help facilitate comparisons with other companies in our industry, by excluding items that do not reflect the core operating results of our businesses in the current period. This release also includes a “debt-to-capital ratio excluding PSXP.” This non-GAAP measure is provided to differentiate the capital structure of Phillips 66 compared with that of Phillips 66 Partners. This release includes “adjusted capital spending,” a non-GAAP financial measure that demonstrates the portion of total consolidated capital expenditures and investments funded by Phillips 66. This release also includes “realized refining margin,” a non-GAAP financial measure that demonstrates how well we performed relative to benchmark industry margins.

References in the release to total consolidated earnings (loss) refer to net income (loss) attributable to Phillips 66.


Millions of Dollars


Except as Indicated


2020

2019


Q3

Q2

Sep
YTD

Q3

Sep
YTD

Reconciliation of Consolidated Earnings (Loss) to Adjusted Earnings (Loss)


Consolidated Earnings (Loss)

$

(799)

(141)

(3,436)


712

2,340

Pre-tax adjustments:


Pending claims and settlements

(37)


(21)

Pension settlement expense

17

38

55


Impairments

1,139

4,145


853

853

Impairments by equity affiliates

15

15


47

47

Lower-of-cost-or-market inventory adjustments

(101)

20

(29)


42

42

Certain tax impacts

(8)

(8)


Asset dispositions

(84)

(84)


(17)

(17)

Hurricane-related costs

15

15


Tax impact of adjustments*

(262)

(208)

(545)


(235)

(231)

Other tax impacts

(10)

20

10


(45)

Noncontrolling interests

24

24


Adjusted earnings (loss)

$

(1)

(324)

125


1,402

2,968

Earnings (loss) per share of common stock (dollars)

$

(1.82)

(0.33)

(7.83)


1.58

5.13

Adjusted earnings (loss) per share of common stock (dollars)

$

(0.01)

(0.74)

0.27


3.11

6.51


Reconciliation of Segment Pre-Tax Income (Loss) to Adjusted Pre-Tax Income (Loss)


Midstream Pre-Tax Income (Loss)

$

146

324

(232)


(460)

279

Pre-tax adjustments:


Impairments

204

1,365


853

853

Pension settlement expense

3

5

8


Lower-of-cost-or-market inventory adjustments

1


Impairments by equity affiliates


47

47

Asset dispositions

(84)

(84)


Hurricane-related costs

1

1


Adjusted pre-tax income

$

354

245

1,059


440

1,179

Chemicals Pre-Tax Income

$

231

42

442


227

729

Pre-tax adjustments:


Lower-of-cost-or-market inventory adjustments

(101)

32

(45)


42

42

Impairments by equity affiliates

15

15


Hurricane-related costs

2

2


Adjusted pre-tax income

$

132

89

414


269

771

Refining Pre-Tax Income (Loss)

$

(1,903)

(878)

(5,042)


856

1,641

Pre-tax adjustments:


Pending claims and settlements


(21)

Asset dispositions


(17)

(17)

Pension settlement expense

12

26

38


Impairments

910

2,755


Lower-of-cost-or-market inventory adjustments

(15)


Hurricane-related costs

11

11


Adjusted pre-tax income (loss)

$

(970)

(867)

(2,238)


839

1,603

Marketing and Specialties Pre-Tax Income

$

415

286

1,214


498

1,056

Pre-tax adjustments:


Lower-of-cost-or-market inventory adjustments

3

15


Pending claims and settlements

(37)


Pension settlement expense

1

4

5


Hurricane-related costs

1

1


Adjusted pre-tax income

$

417

293

1,198


498

1,056

Corporate and Other Pre-Tax Loss

$

(239)

(219)

(655)


(178)

(593)

Pre-tax adjustments:


Impairments

25

25


Pension settlement expense

1

3

4


Certain tax impacts

(8)

(8)


Adjusted pre-tax loss

$

(213)

(224)

(634)


(178)

(593)

*We generally tax effect taxable U.S.-based special items using a combined federal and state annual statutory income tax rate of approximately 25%. Taxable special items attributable to foreign locations likewise use a local statutory income tax rate. Nontaxable events reflect zero income tax. These events include, but are not limited to, most goodwill impairments, transactions legislatively exempt from income tax, transactions related to entities for which we have made an assertion that the undistributed earnings are permanently reinvested, or transactions occurring in jurisdictions with a valuation allowance.

†YTD 2020 is based on adjusted weighted-average diluted shares outstanding of 440,156 thousand, and other periods are based on the same weighted-average diluted shares outstanding as that used in the GAAP diluted earnings per share calculation. Income allocated to participating securities, if applicable, in the adjusted earnings per share calculation is the same as that used in the GAAP diluted earnings per share calculation.


Contacts

Jeff Dietert (investors)
832-765-2297
This email address is being protected from spambots. You need JavaScript enabled to view it.

Shannon Holy (investors)
832-765-2297
This email address is being protected from spambots. You need JavaScript enabled to view it.

Thaddeus Herrick (media)
855-841-2368
This email address is being protected from spambots. You need JavaScript enabled to view it.


Read full story here

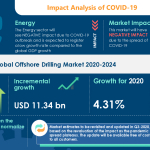
LONDON--(BUSINESS WIRE)--#GlobalOffshoreDrillingMarket--Technavio has been monitoring the offshore drilling market and it is poised to grow by USD 11.34 billion during 2020-2024, progressing at a CAGR of almost 6% during the forecast period. The report offers an up-to-date analysis regarding the current market scenario, latest trends and drivers, and the overall market environment. Download a Free Sample Report on COVID-19


Impact of COVID-19

The COVID-19 pandemic continues to transform the growth of various industries, however, the immediate impact of the outbreak is varied. While a few industries will register a drop in demand, numerous others will continue to remain unscathed and show promising growth opportunities. COVID-19 will have a low impact on the offshore drilling market. The market growth in 2020 is likely to increase compared to market growth in 2019.

Frequently Asked Questions:

  • Based on segmentation by application, which is the leading segment in the market?
    Shallow water.
  • What are the major trends in the market?
    Seizing of funding for E&P activities by the World Bank.
  • At what rate is the market projected to grow?
    The market is projected to grow at a CAGR of almost 6% during 2020-2024.
  • Who are the top players in the market?
    Baker Hughes Co., China Oilfield Services Ltd., Halliburton Co., KCA Deutag Alpha Ltd., National Oilwell Varco Inc., Schlumberger Ltd., The Drilling Co. of 1972 AS, Transocean Ltd., Valaris Plc, and Weatherford International Plc are the top players in the market.
  • What are the key market drivers and challenges?
    The market is driven by the growth in demand for oil and natural gas. However, the growth of alternative gaming platforms will challenge market growth.

Buy 1 Technavio report and get the second for 50% off. Buy 2 Technavio reports and get the third for free.

View market snapshot before purchasing

The market is moderately fragmented, and the degree of fragmentation will accelerate during the forecast period. Baker Hughes Co., China Oilfield Services Ltd., Halliburton Co., KCA Deutag Alpha Ltd., National Oilwell Varco Inc., Schlumberger Ltd., The Drilling Co. of 1972 AS, Transocean Ltd., Valaris Plc, and Weatherford International Plc are some of the major market participants. Although the growth in demand for oil and natural gas will offer immense growth opportunities, the growth of alternative gaming platforms is likely to pose a challenge for the market vendors. In a bid to help players strengthen their market foothold, this offshore drilling market forecast report provides a detailed analysis of the leading market vendors. The report also empowers industry honchos with information on the competitive landscape and insights into the different product offerings offered by various companies.

Technavio's custom research reports offer detailed insights on the impact of COVID-19 at an industry level, a regional level, and subsequent supply chain operations. This customized report will also help clients keep up with new product launches in direct & indirect COVID-19 related markets, upcoming vaccines and pipeline analysis, and significant developments in vendor operations and government regulations.

Offshore Drilling Market 2020-2024: Segmentation

Offshore Drilling Market is segmented as below:

  • Application
    • Shallow Water
    • Deepwater
    • Ultra-deepwater
  • Geography
    • North America
    • APAC
    • Europe
    • MEA
    • South America

To learn more about the global trends impacting the future of market research, download a free sample: https://www.technavio.com/talk-to-us?report=IRTNTR44563

Offshore Drilling Market 2020-2024: Scope

Technavio presents a detailed picture of the market by the way of study, synthesis, and summation of data from multiple sources. The offshore drilling market report covers the following areas:

  • Offshore Drilling Market Size
  • Offshore Drilling Market Trends
  • Offshore Drilling Market Industry Analysis

This study identifies the seizing of funding for E&P activities by World Bank as one of the prime reasons driving the Offshore Drilling Market growth during the next few years.

Technavio suggests three forecast scenarios (optimistic, probable, and pessimistic) considering the impact of COVID-19. Technavio’s in-depth research has direct and indirect COVID-19 impacted market research reports.

Register for a free trial today and gain instant access to 17,000+ market research reports.

Technavio's SUBSCRIPTION platform

Offshore Drilling Market 2020-2024: Key Highlights

  • CAGR of the market during the forecast period 2020-2024
  • Detailed information on factors that will assist offshore drilling market growth during the next five years
  • Estimation of the offshore drilling market size and its contribution to the parent market
  • Predictions on upcoming trends and changes in consumer behavior
  • The growth of the offshore drilling market
  • Analysis of the market’s competitive landscape and detailed information on vendors
  • Comprehensive details of factors that will challenge the growth of offshore drilling market vendors

Table of Contents:

Executive Summary

Market Landscape

  • Market ecosystem
  • Value chain analysis

Market Sizing

  • Market definition
  • Market segment analysis
  • Market size 2019
  • Market outlook: Forecast for 2019 - 2024

Five Forces Analysis

  • Five forces summary
  • Bargaining power of buyers
  • Bargaining power of suppliers
  • Threat of new entrants
  • Threat of substitutes
  • Threat of rivalry
  • Market condition

Market Segmentation by Application

  • Market segments
  • Comparison by Application
  • Shallow water - Market size and forecast 2019-2024
  • Deepwater - Market size and forecast 2019-2024
  • Ultra-deepwater - Market size and forecast 2019-2024
  • Market opportunity by Application

Customer landscape

Geographic Landscape

  • Geographic segmentation
  • Geographic comparison
  • North America - Market size and forecast 2019-2024
  • APAC - Market size and forecast 2019-2024
  • Europe - Market size and forecast 2019-2024
  • MEA - Market size and forecast 2019-2024
  • South America - Market size and forecast 2019-2024
  • Key leading countries
  • Market opportunity by geography
  • Market drivers
  • Market challenges
  • Market trends

Vendor Landscape

  • Vendor landscape
  • Landscape disruption
  • Competitive scenario

Vendor Analysis

  • Vendors covered
  • Market positioning of vendors
  • Baker Hughes Co.
  • China Oilfield Services Ltd.
  • Halliburton Co.
  • KCA Deutag Alpha Ltd.
  • National Oilwell Varco Inc.
  • Schlumberger Ltd.
  • The Drilling Co. of 1972 AS
  • Transocean Ltd.
  • Valaris Plc
  • Weatherford International Plc

Appendix

  • Scope of the report
  • Currency conversion rates for US$
  • Research methodology
  • List of abbreviations


About Us

Technavio is a leading global technology research and advisory company. Their research and analysis focuses on emerging market trends and provides actionable insights to help businesses identify market opportunities and develop effective strategies to optimize their market positions. With over 500 specialized analysts, Technavio’s report library consists of more than 17,000 reports and counting, covering 800 technologies, spanning across 50 countries. Their client base consists of enterprises of all sizes, including more than 100 Fortune 500 companies. This growing client base relies on Technavio’s comprehensive coverage, extensive research, and actionable market insights to identify opportunities in existing and potential markets and assess their competitive positions within changing market scenarios.


Contacts

Technavio Research
Jesse Maida
Media & Marketing Executive
US: +1 844 364 1100
UK: +44 203 893 3200
Email: This email address is being protected from spambots. You need JavaScript enabled to view it.
Website: www.technavio.com/

HOUSTON--(BUSINESS WIRE)--Forum Energy Technologies, Inc. (NYSE: FET) (“Forum” or the “Company”) announced today that its Board of Directors has approved a 1-for-20 reverse stock split of the Company’s issued and outstanding shares of common stock, par value $0.01 per share, accompanied by a corresponding decrease in the Company’s authorized shares of common stock (the “Reverse Stock Split”), such that, following the consummation of the Reverse Stock Split, the number of authorized shares of common stock will be reduced from 296,000,000 to 14,800,000. The Company’s stockholders previously approved the Reverse Stock Split at the Annual Meeting of Stockholders on May 12, 2020.


The Reverse Stock Split will be affected pursuant to an amendment to the Company’s Third Amended and Restated Certificate of Incorporation filed with the Secretary of State of the State of Delaware. The Company anticipates that the effective time of the Reverse Stock Split will be after market close on November 9, 2020, with the common stock trading on a post-split basis under the Company’s existing trading symbol, “FET,” at the market open on November 10, 2020 with a new CUSIP number, 34984V209. The Reverse Stock Split will increase the market price per share of the Company’s common stock, bringing the Company into compliance with the listing requirements of the New York Stock Exchange.

As a result of the Reverse Stock Split, every 20 pre-split shares of common stock outstanding will automatically combine into one new share of common stock without any action on the part of the holders, and the number of outstanding common shares will be reduced from approximately 111.5 million shares to approximately 5.6 million shares. Proportionate adjustments will be made to the conversion rate of the Company’s outstanding 9.000% Convertible Senior Secured Notes due 2025 and to the outstanding awards and number of shares issued and issuable under the Company’s Second Amended and Restated 2016 Stock and Incentive Plan and all predecessor plans. The Reverse Stock Split will not affect the par value of the common stock.

The Reverse Stock Split will affect all stockholders uniformly and will not alter any stockholder’s percentage interest in the Company’s equity, except to the extent that the Reverse Stock Split would result in a shareholder owning a fractional share. In lieu of any fractional shares to which a stockholder of record would otherwise be entitled as a result of the Reverse Stock Split, stockholders will receive an amount in cash (without interest and subject to applicable withholding taxes) equal to such stockholder’s pro rata portion of the net proceeds (after customary brokerage commissions and other expenses) attributable to the sale of such fractional shares following the aggregation and sale by the Company’s transfer agent of all fractional shares otherwise issuable following the Reverse Stock Split.

The Company’s transfer agent, American Stock Transfer & Trust Company, LLC, will provide stockholders of record holding certificates representing pre-split shares of the Company’s common stock as of the effective date, a letter of transmittal providing instructions for the exchange of shares. Registered stockholders holding pre-split shares of the Company’s common stock electronically in book-entry form are not required to take any action to receive post-split shares. Stockholders owning shares via a broker, bank, trust or other nominee will have their positions automatically adjusted to reflect the Reverse Stock Split, subject to such broker’s particular processes, and will not be required to take any action in connection with the Reverse Stock Split. Additional information about the Reverse Stock Split can be found in the Company’s definitive proxy statement (Form DEF 14A) filed with the SEC on April 2, 2020. American Stock Transfer & Trust Company, LLC can be reached by phone at 877-248-6417 (toll free) or 718-921-8317.

About Forum

Forum Energy Technologies, Inc. is a global oilfield products company, serving the drilling, downhole, subsea, completions and production sectors of the oil and natural gas industry. The Company’s products include highly engineered capital equipment as well as products that are consumed in the drilling, well construction, production and transportation of oil and natural gas. Forum is headquartered in Houston, TX with manufacturing and distribution facilities strategically located around the globe. For more information, please visit www.f-e-t.com.

Forward-Looking Statements and Other Legal Disclosure

This press release contains forward-looking statements within the meaning of Section 27A of the Securities Act of 1933 and Section 21E of the Securities Exchange Act of 1934. All statements, other than statements of historical facts, included in this press release that address activities, events or developments that the Company expects, believes or anticipates will or may occur in the future are forward-looking statements. Without limiting the generality of the foregoing, forward-looking statements contained in this press release specifically include statements regarding the consummation of the Reverse Stock Split, including the timing and effects thereof.

These statements are based on certain assumptions made by the Company based on management’s experience and perception of historical trends, current conditions, anticipated future developments and other factors believed to be appropriate. Such statements are subject to a number of assumptions, risks and uncertainties, many of which are beyond the control of the Company, which may cause actual results to differ materially from those implied or expressed by the forward-looking statements. Among other things, these include risks and uncertainties relating to the consummation of the Reverse Stock Split, the volatility of oil and natural gas prices, oilfield development activity levels, the availability of raw materials and specialized equipment, the Company’s ability to deliver backlog in a timely fashion, the availability of skilled and qualified labor, competition in the oil and natural gas industry, governmental regulation and taxation of the oil and natural gas industry, the Company’s ability to implement new technologies and services, the availability and terms of capital, the effects of the COVID-19 pandemic and uncertainties regarding environmental regulations or litigation and other legal or regulatory developments affecting the Company’s business, and other important factors that could cause actual results to differ materially from those projected as described in the Company’s filings with the U.S. Securities and Exchange Commission.


Contacts

Executive Vice President and Chief Financial Officer
Lyle Williams
713.351.7920
This email address is being protected from spambots. You need JavaScript enabled to view it.

LUXEMBOURG--(BUSINESS WIRE)--Pacific Drilling S.A. (NYSE: PACD) announced today that it and certain of its domestic and international subsidiaries have filed voluntary petitions for relief under Chapter 11 of the United States Bankruptcy Code in the United States Bankruptcy Court for the Southern District of Texas and have entered into a restructuring support agreement with an ad hoc group of the largest holders of its outstanding bond debt. This consensual financial restructuring transaction will eliminate the Company’s approximately $1.1 billion in principal amount of outstanding bond debt through the cancellation and exchange of debt for new equity in the reorganized Company.

The Company also announced today that it has repaid its $50 million first lien superpriority revolving credit agreement with Angelo, Gordon Energy Servicer, LLC, as administrative agent and the lenders party thereto.

With approximately $120 million of cash and cash equivalents as of October 30, 2020, and seven of the most advanced high-specification drillships in the world, Pacific Drilling intends to continue its world-wide operations as usual, deliver services for existing and prospective clients and, subject to court approval, pay all obligations incurred during the Chapter 11 case in full. The Company expects to emerge by year-end with access to new capital in the form of an $80 million exit facility and with approximately $100 million of cash and cash equivalents on the balance sheet.

Since the beginning of 2020, the global health crisis caused by COVID-19 and the resulting oil supply and demand imbalance have caused significant disruption in world economies and markets, including a substantial decline in the price of oil. The impact of these market conditions on Pacific Drilling’s business has been direct and significantly negative, rendering our current capital structure unsustainable over the long-term.

Bernie Wolford, Chief Executive Officer, stated, “After spending several months evaluating options for addressing our long-term financial needs in light of challenging market and operational conditions, we are pleased to reach agreement with an ad hoc group of our noteholders that paves the way for an expeditious Chapter 11 restructuring process. This restructuring is intended to enhance our financial flexibility by eliminating our entire prepetition debt and cash interest burden. We expect to emerge from this process in a stronger position to compete in today’s challenging, lower-commodity-price environment. I appreciate the ongoing support of our employees, clients and vendors as we complete this accelerated restructuring process. We remain committed to delivering the safest, most efficient and reliable deepwater drilling services in the industry.”

Additional information regarding the restructuring and Chapter 11 proceedings can be found (i) on our website at www.pacificdrilling.com/restructuring, (ii) on a website administered by our claims agent, Prime Clerk, at http://cases.primeclerk.com/PacificDrilling2020, or (iii) via our dedicated restructuring information line at: +1 877-930-4314 (toll free) or +1 347-897-4073 (international).

Advisors

Greenhill & Co. is acting as financial advisor, Latham & Watkins LLP and Jones Walker LLP are serving as legal counsel, and AlixPartners is acting as restructuring advisor to Pacific Drilling in connection with the restructuring. Houlihan Lokey is acting as financial advisor and Akin Gump Strauss Hauer & Feld LLP is acting as legal advisor to the noteholders.

About Pacific Drilling

With our best-in-class drillships and highly experienced team, Pacific Drilling is committed to exceeding our customers’ expectations by delivering the safest, most efficient and reliable deepwater drilling services in the industry. Pacific Drilling’s fleet of seven drillships represents one of the youngest and most technologically advanced fleets in the world. For more information about Pacific Drilling, including our current Fleet Status, please visit our website at www.pacificdrilling.com.

Forward-Looking Statements

Certain statements and information contained in this press release constitute “forward-looking statements” within the meaning of the safe harbor provisions of the Private Securities Litigation Reform Act of 1995, and are generally identifiable by their use of words such as “anticipate,” “believe,” “could,” “estimate,” “expect,” “forecast,” “intend,” “our ability to,” “may,” “plan,” “potential,” “predict,” “project,” “projected,” “should,” “will,” “would”, or other similar words which are not generally historical in nature. The forward-looking statements speak only as of the date hereof, and we undertake no obligation to publicly update or revise any forward-looking statements after the date they are made, whether as a result of new information, future events or otherwise.

Our forward-looking statements express our current expectations or forecasts of possible future results or events, including the potential outcome of the Chapter 11 proceedings; the future impact of the COVID-19 pandemic on our business, future financial and operational performance and cash balances; our future liquidity position and future efforts to improve our liquidity position; revenue efficiency levels; market outlook; forecasts of trends; future client contract opportunities; future contract dayrates; our business strategies and plans or objectives of management; estimated duration of client contracts; backlog; expected capital expenditures; projected costs and savings; expectations regarding the outcome of the ongoing bankruptcy proceedings of our two subsidiaries against whom the arbitration award related to the drillship known as the Pacific Zonda in favor of Samsung Heavy Industries Co. Ltd. (“SHI”) was rendered and the potential impact of the arbitration tribunal’s decision on our future operations, financial position, results of operations and liquidity.

Although we believe that the assumptions and expectations reflected in our forward-looking statements are reasonable and made in good faith, these statements are not guarantees, and actual future results may differ materially due to a variety of factors. These statements are subject to a number of risks and uncertainties and are based on a number of judgments and assumptions as of the date such statements are made about future events, many of which are beyond our control. Actual events and results may differ materially from those anticipated, estimated, projected or implied by us in such statements due to a variety of factors, including if one or more of these risks or uncertainties materialize, or if our underlying assumptions prove incorrect.

Important factors that could cause actual results to differ materially from our expectations include: the potential outcome of our Chapter 11 proceedings; evolving risks from the COVID-19 outbreak and resulting significant disruption in international economies, and international financial and oil markets, including a substantial decline in the price of oil during 2020, which if sustained would continue to have a material adverse effect on our financial condition, results of operations and cash flow; changes in actual and forecasted worldwide oil and gas supply and demand and prices, and the related impact on demand for our services; the offshore drilling market, including changes in capital expenditures by our clients; rig availability and supply of, and demand for, high-specification drillships and other drilling rigs competing with our fleet; our ability to enter into and negotiate favorable terms for new drilling contracts or extensions of existing drilling contracts; our ability to successfully negotiate and consummate definitive contracts and satisfy other customary conditions with respect to letters of intent and letters of award that the Company receives for our drillships; actual contract commencement dates; possible cancellation, renegotiation, termination or suspension of drilling contracts as a result of mechanical difficulties, performance, market changes or other reasons; costs related to stacking of rigs and costs to reactivate a stacked rig; downtime and other risks associated with offshore rig operations, including unscheduled repairs or maintenance, relocations, severe weather or hurricanes or accidents; our small fleet and reliance on a limited number of clients; the outcome of our subsidiaries’ bankruptcy proceedings and any actions that SHI or others may take in the bankruptcy or other proceedings against the Company and our subsidiaries; our ability to continue as a going concern; our ability to obtain Bankruptcy Court approval with respect to motions or other requests made to the Bankruptcy Court in the Chapter 11 proceedings; our ability to confirm and consummate the prearranged Plan of Reorganization; the effects of the Chapter 11 proceedings on our operations and agreements, including our relationships with employees, regulatory authorities, customers, suppliers, banks and other financing sources, insurance companies and other third parties; the length of time that the Company will operate under Chapter 11 protection and the continued availability of operating capital during the pendency of the Chapter 11 proceedings; risks associated with third-party motions in the Chapter 11 proceedings, which may interfere with our ability to confirm and consummate the prearranged Plan of Reorganization; increased advisory costs to execute the prearranged Plan of Reorganization; the potential adverse effects of the Chapter 11 proceedings on our liquidity, results of operations, or business prospects; increased administrative and legal costs related to the Chapter 11 proceedings and other litigation and the inherent risks involved in a bankruptcy process; the potential effects of the expected delisting of our common shares from trading on the New York Stock Exchange; and the other risk factors described in our 2019 Annual Report on Form 10-K filed with the Securities and Exchange Commission on March 12, 2020, as updated by our Quarterly Reports on Form 10-Q as filed with the SEC on May 8, 2020 and August 7, 2020 and subsequent filings with the SEC. These documents are available through our website at www.pacificdrilling.com or through the SEC’s website at www.sec.gov.


Contacts

Investor Contact:
James Harris
Pacific Drilling S.A.
+713 334 6662
This email address is being protected from spambots. You need JavaScript enabled to view it.

Media Contact:
Amy L. Roddy
Pacific Drilling S.A.
+713 334 6662
This email address is being protected from spambots. You need JavaScript enabled to view it.

  • Reported earnings of $206 million and adjusted EBITDA of $313 million
  • Announced quarterly distribution of $0.875 per common unit
  • Completed Sweeny to Pasadena Pipeline expansion project
  • Continued ramp-up of volumes on the Gray Oak Pipeline
  • Commissioned new storage at South Texas Gateway Terminal

HOUSTON--(BUSINESS WIRE)--#earnings--Phillips 66 Partners LP (NYSE: PSXP) announces third-quarter 2020 earnings of $206 million, or $0.85 per diluted common unit. Cash from operations was $296 million, and distributable cash flow was $243 million. Adjusted EBITDA was $313 million in the third quarter, compared with $269 million in the prior quarter.


“During the quarter, we ran safely and reliably, allowing us to capture improved market conditions,” said Greg Garland, Phillips 66 Partners’ chairman and CEO. “Our results reflect increased pipeline throughput, including ramp-up of volumes on the Gray Oak Pipeline, and startup of the South Texas Gateway Terminal. We will continue to remain disciplined in our approach to capital allocation and to prioritize a strong balance sheet.”

On Oct. 20, 2020, the general partner’s board of directors declared a third-quarter 2020 cash distribution of $0.875 per common unit, a 1% increase over third quarter 2019.

Financial Results

Phillips 66 Partners’ third-quarter 2020 earnings were $206 million, compared with $255 million in the second quarter. The second-quarter results included an $84 million gain related to the Partnership’s prior-year sale of an interest in the Gray Oak Pipeline. The Partnership reported adjusted EBITDA of $313 million in the third quarter, compared with $269 million in the prior quarter, excluding the second-quarter gain. Third-quarter earnings and adjusted EBITDA reflect higher volumes on wholly owned and joint venture assets, driven by increased utilization at Mid-Continent refineries operated by Phillips 66 and ramp-up of volumes on the Gray Oak Pipeline.

Liquidity, Capital Expenditures and Investments

As of Sept. 30, 2020, total debt outstanding was $3.8 billion. The Partnership had $2 million in cash and cash equivalents and $457 million available under its revolving credit facility.

The Partnership’s capital expenditures and investments for the quarter were $184 million. Excluding $3 million of capital spending funded by Gray Oak joint venture partners, adjusted capital spending was $181 million. Growth capital included spend on the C2G Pipeline and investment in the South Texas Gateway Terminal. In addition, the Partnership continued to fund its share of Liberty Pipeline’s previous commitments.

Strategic Update

At the South Texas Gateway Terminal, which is being constructed by Buckeye Partners, L.P., the first dock and 5.1 million barrels of storage capacity have been commissioned. Marine and terminal operations will continue to ramp up through the end of this year as additional phases of construction are completed. Upon project completion in the first quarter of 2021, the marine export terminal will have two deepwater docks with up to 800,000 barrels per day (BPD) of throughput capacity, along with storage capacity of 8.6 million barrels. Phillips 66 Partners owns a 25% interest in the terminal.

Phillips 66 Partners continued construction of the C2G Pipeline, a 16 inch ethane pipeline that will connect its Clemens Caverns storage facility to petrochemical facilities in Gregory, Texas, near Corpus Christi, Texas. The project is backed by long-term commitments and is expected to be completed in mid-2021.

The Sweeny to Pasadena Pipeline expansion project was completed in the third quarter. The expansion adds 80,000 BPD of pipeline capacity, providing additional product offtake from the Sweeny fractionators and refinery. In addition, product storage capacity at the Pasadena Terminal was increased by 300,000 barrels. The project is backed by long-term commitments.

Investor Webcast

Members of Phillips 66 Partners executive management will host a webcast today at 2 p.m. EDT to discuss the Partnership’s third-quarter performance. To listen to the conference call and view related presentation materials, go to www.phillips66partners.com/events. For detailed supplemental information, go to www.phillips66partners.com/reports.

About Phillips 66 Partners

Headquartered in Houston, Phillips 66 Partners is a growth-oriented master limited partnership formed by Phillips 66 to own, operate, develop and acquire primarily fee-based crude oil, refined petroleum products and natural gas liquids pipelines, terminals and other midstream assets. For more information, visit www.phillips66partners.com.

CAUTIONARY STATEMENT REGARDING FORWARD-LOOKING STATEMENTS

This news release contains certain forward-looking statements as defined under the federal securities laws. Words and phrases such as “is anticipated,” “is estimated,” “is expected,” “is planned,” “is scheduled,” “is targeted,” “believes,” “continues,” “intends,” “will,” “would,” “objectives,” “goals,” “projects,” “efforts,” “strategies” and similar expressions are used to identify such forward-looking statements. However, the absence of these words does not mean that a statement is not forward-looking. Forward-looking statements included in this news release are based on management’s expectations, estimates and projections as of the date they are made. These statements are not guarantees of future performance and you should not unduly rely on them as they involve certain risks, uncertainties and assumptions that are difficult to predict. Therefore, actual outcomes and results may differ materially from what is expressed or forecast in such forward-looking statements. Factors that could cause actual results or events to differ materially from those described in the forward-looking statements include: the continued ability of Phillips 66 to satisfy its obligations under our commercial and other agreements; the volume of crude oil, refined petroleum products and NGL we or our equity affiliates transport, fractionate, terminal and store; the tariff rates with respect to volumes transported through our regulated assets, which are subject to review and possible adjustment by federal and state regulators; fluctuations in the prices for crude oil, refined petroleum products and NGL; the continuing effects of the COVID-19 pandemic and its negative impact on the demand for refined products; changes in governmental policies relating to crude oil, refined petroleum products or NGL pricing, regulation, taxation, or exports; liabilities associated with the risks and operational hazards inherent in transporting, fractionating, terminaling and storing crude oil, refined petroleum products and NGL; curtailment of operations due to accidents, severe weather (including as a result of climate change) or natural disasters, riots, strikes or lockouts; the inability to obtain or maintain permits, in a timely manner or at all, and the possible revocation or modification of permits; our ability to successfully execute growth strategies; the operation, financing and distribution decisions of our equity affiliates; costs to comply with environmental laws and safety regulations; failure of information technology due to various causes, including unauthorized access or attacks; changes to the costs to deliver and transport crude oil, refined petroleum products and NGL; potential liability from litigation or for remedial actions, including removal and reclamation obligations under environmental regulations; the failure to complete construction of capital projects on time and within budget; general domestic and international economic and political developments including armed hostilities, expropriation of assets, and other political, economic or diplomatic developments, including those caused by public health issues; our ability to comply with our debt covenants and to incur additional indebtedness on favorable terms; changes in tax, environmental and other laws and regulations; and other economic, business, competitive and/or regulatory factors affecting Phillips 66 Partners’ businesses generally as set forth in our filings with the Securities and Exchange Commission. Phillips 66 Partners is under no obligation (and expressly disclaims any such obligation) to update or alter its forward-looking statements, whether as a result of new information, future events or otherwise.

Use of Non-GAAP Financial InformationThis news release includes the terms “EBITDA,” “adjusted EBITDA,” “distributable cash flow,” “coverage ratio” and “adjusted capital spending.” These are non-GAAP financial measures. EBITDA and adjusted EBITDA are included to help facilitate comparisons of operating performance of the Partnership with other companies in our industry. EBITDA and distributable cash flow help facilitate an assessment of our ability to generate sufficient cash flow to make distributions to our partners. We believe that the presentation of EBITDA, adjusted EBITDA and distributable cash flow provides useful information to investors in assessing our financial condition and results of operations. Our coverage ratio is calculated as distributable cash flow divided by total cash distributions and is included to help indicate the Partnership’s ability to pay cash distributions from current earnings. Additionally, adjusted capital spending is a non-GAAP financial measure that demonstrates Phillips 66 Partners' net share of capital spending. The GAAP performance measure most directly comparable to EBITDA and adjusted EBITDA is net income. The GAAP liquidity measure most comparable to EBITDA and distributable cash flow is net cash provided by operating activities. The GAAP financial measure most comparable to our coverage ratio is calculated as net cash provided by operating activities divided by total cash distributions. The GAAP financial measure most comparable to adjusted capital spending is capital expenditures and investments. These non-GAAP financial measures should not be considered as alternatives to their comparable GAAP measures. They have important limitations as analytical tools because they exclude some but not all items that affect their corresponding GAAP measures. They should not be considered in isolation or as substitutes for analysis of our results as reported under GAAP. Additionally, because EBITDA, adjusted EBITDA, distributable cash flow, coverage ratio and adjusted capital spending may be defined differently by other companies in our industry, our definition of those measures may not be comparable to similarly titled measures of other companies, thereby diminishing their utility.

Reconciliations of these non-GAAP measures to their comparable GAAP measures are included in this release.

References in the release to earnings refer to net income attributable to the Partnership. References to EBITDA refer to earnings before interest, income taxes, depreciation and amortization.

Results of Operations (Unaudited)


Summarized Financial Statement Information


Millions of Dollars
Except as Indicated


Q3 2020


Q2 2020

Selected Income Statement Data


Total revenues and other income


$

394


430

Net income


216


255

Net income attributable to the Partnership


206


255


Adjusted EBITDA


313


269

Distributable cash flow


243


218


Net Income Per Limited Partner Unit—Diluted (Dollars)


Common units


$

0.85


1.05


Selected Balance Sheet Data


Cash and cash equivalents


$

2


7

Equity investments


3,373


3,340

Total assets


7,294


7,203

Total debt


3,783


3,707

Equity held by public


Preferred units


747


746

Common units


2,734


2,735

Equity held by Phillips 66


Common units


(578)


(572)

Statement of Income


Millions of Dollars


Q3 2020


Q2 2020

Revenues and Other Income


Operating revenues—related parties


$

256


236

Operating revenues—third parties


9


5

Equity in earnings of affiliates


129


104

Gain from equity interest transfer


84

Other income


1

Total revenues and other income


394


430


Costs and Expenses


Operating and maintenance expenses


85


84

Depreciation


35


31

General and administrative expenses


16


17

Taxes other than income taxes


9


10

Interest and debt expense


32


28

Other expenses


5

Total costs and expenses


177


175

Income before income taxes


217


255

Income tax expense


1


Net Income


216


255

Less: Net income attributable to noncontrolling interest


10


Net Income Attributable to the Partnership


206


255

Less: Preferred unitholders’ interest in net income attributable to the Partnership


10


9

Limited Partners’ Interest in Net Income Attributable to the Partnership


$

196


246

Selected Operating Data


Q3 2020


Q2 2020

Wholly Owned Operating Data


Pipelines


Pipeline revenues (millions of dollars)


$

117


97

Pipeline volumes(1) (thousands of barrels daily)


Crude oil


867


806

Refined petroleum products and natural gas liquids


907


825

Total


1,774


1,631


Average pipeline revenue per barrel (dollars)


$

0.71


0.65


Terminals


Terminal revenues (millions of dollars)


$

36


33

Terminal throughput (thousands of barrels daily)


Crude oil(2)


296


380

Refined petroleum products


700


690

Total


996


1,070


Average terminaling revenue per barrel (dollars)


$

0.39


0.33


Storage, processing and other revenues (millions of dollars)


$

112


111

Total Operating Revenues (millions of dollars)


$

265


241


Joint Venture Operating Data(3)


Crude oil, refined petroleum products and natural gas liquids (thousands of barrels daily)


1,142


942

(1) Represents the sum of volumes transported through each separately tariffed pipeline segment.


(2) Bayway and Ferndale rail rack volumes included in crude oil terminals.

(3) Proportional share of total pipeline and terminal volumes of joint ventures consistent with recognized equity in earnings of affiliates.

Cash Distributions


Millions of Dollars
Except as Indicated


Q3 2020


Q2 2020

Cash Distributions


Common units—public


$

52


51

Common units—Phillips 66


148


149

Total


$

200


200


Cash Distribution Per Common Unit (Dollars)


$

0.875


0.875


Coverage Ratio*


1.22


1.09

†Cash distributions declared attributable to the indicated periods.


*Calculated as distributable cash flow divided by total cash distributions. Used to indicate the Partnership’s ability to pay cash distributions from current earnings. Net cash provided by operating activities divided by total cash distributions was 1.48x and 1.08x at Q3 2020 and Q2 2020, respectively.

Reconciliation of Adjusted EBITDA and Distributable Cash Flow to Net Income Attributable to the Partnership


Millions of Dollars


Q3 2020


Q2 2020


Net Income Attributable to the Partnership


$

206


255

Plus:


Net income attributable to noncontrolling interest


10


Net Income


216


255

Plus:


Depreciation


35


31

Net interest expense


31


29

Income tax expense


1


EBITDA


283


315

Plus:


Proportional share of equity affiliates’ net interest, taxes and depreciation and amortization


45


38

Expenses indemnified or prefunded by Phillips 66


1


Less:


Gain from equity interest transfer


84

Adjusted EBITDA attributable to noncontrolling interest


16


Adjusted EBITDA


313


269

Plus:


Deferred revenue impacts*


(3)


5

Less:


Equity affiliate distributions less than (more than) proportional EBITDA


4


(10)

Maintenance capital expenditures


21


28

Net interest expense


31


29

Preferred unit distributions


10


9

Income taxes paid


1


Distributable Cash Flow


$

243


218

*Difference between cash receipts and revenue recognition.


†Excludes Merey Sweeny capital reimbursements and turnaround impacts.

Reconciliation of Adjusted EBITDA and Distributable Cash Flow to Net Cash Provided by Operating Activities


Millions of Dollars


Q3 2020


Q2 2020


Net Cash Provided by Operating Activities


$

296


215

Plus:


Net interest expense


31


29

Income tax expense


1


Changes in working capital


(45)


(3)

Undistributed equity earnings


(5)

Gain from equity interest transfer


84

Deferred revenues and other liabilities


1


2

Other


(1)


(7)

EBITDA


283


315

Plus:


Proportional share of equity affiliates’ net interest, taxes and depreciation and amortization


45


38

Expenses indemnified or prefunded by Phillips 66


1


Less:


Gain from equity interest transfer


84

Adjusted EBITDA attributable to noncontrolling interest


16


Adjusted EBITDA


313


269

Plus:


Deferred revenue impacts*


(3)


5

Less:


Equity affiliate distributions less than (more than) proportional EBITDA


4


(10)

Maintenance capital expenditures


21


28

Net interest expense


31


29

Preferred unit distributions


10


9

Income taxes paid


1


Distributable Cash Flow


$

243


218

*Difference between cash receipts and revenue recognition.


†Excludes Merey Sweeny capital reimbursements and turnaround impacts.


Contacts

Jeff Dietert (investors)
832-765-2297
This email address is being protected from spambots. You need JavaScript enabled to view it.

Shannon Holy (investors)
832-765-2297
This email address is being protected from spambots. You need JavaScript enabled to view it.

Thaddeus Herrick (media)
855-841-2368
This email address is being protected from spambots. You need JavaScript enabled to view it.

LONDON--(BUSINESS WIRE)--#GlobalSubseaProductionandProcessingMarket--The subsea production and processing market is poised to grow by USD 6.73 billion during 2020-2024, progressing at a CAGR of almost 6% during the forecast period.


Technavio suggests three forecast scenarios (optimistic, probable, and pessimistic) considering the impact of COVID-19. Download Free Sample Report on COVID-19 Recovery Analysis

The report on the subsea production and processing market provides a holistic update, market size and forecast, trends, growth drivers, and challenges, as well as vendor analysis.

The report offers an up-to-date analysis regarding the current global market scenario, the latest trends and drivers, and the overall market environment. The market is driven by advances in subsea processing.

The subsea production and processing market analysis include the application segment and geography landscape. This study identifies the rise in deepwater and ultra-deepwater E&P activities as one of the prime reasons driving the subsea production and processing market growth during the next few years.

This report presents a detailed picture of the market by the way of study, synthesis, and summation of data from multiple sources by an analysis of key parameters.

The Subsea Production and Processing market cover the following areas:

Subsea Production and Processing Market Sizing
Subsea Production and Processing Market Forecast
Subsea Production and Processing Market Analysis

Companies Mentioned

  • Aker Solutions ASA
  • Baker Hughes Co.
  • Dril-Quip Inc.
  • Hunting Plc
  • National Oilwell Varco Inc.
  • Oceaneering International Inc.
  • Saipem Spa
  • Schlumberger Ltd.
  • TechnipFMC Plc
  • Worldwide Oilfield Machine Inc.

Key Topics Covered:

PART 01: EXECUTIVE SUMMARY

PART 02: SCOPE OF THE REPORT

PART 03: MARKET LANDSCAPE

  • Market ecosystem
  • Market characteristics
  • Value chain analysis
  • Market segmentation analysis

PART 04: MARKET SIZING

  • Market definition
  • Market sizing 2019
  • Market outlook
  • Market size and forecast 2019-2024

PART 05: FIVE FORCES ANALYSIS

  • Bargaining power of buyers
  • Bargaining power of suppliers
  • Threat of new entrants
  • Threat of substitutes
  • Threat of rivalry
  • Market condition

PART 06: MARKET SEGMENTATION BY APPLICATION

  • Market segmentation by application
  • Comparison by application
  • Shallow water - Market size and forecast 2019-2024
  • Deepwater - Market size and forecast 2019-2024
  • Ultra-deepwater - Market size and forecast 2019-2024
  • Market opportunity by application

PART 07: CUSTOMER LANDSCAPE

PART 08: GEOGRAPHIC LANDSCAPE

  • Geographic segmentation
  • Geographic comparison
  • Europe - Market size and forecast 2019-2024
  • APAC - Market size and forecast 2019-2024
  • MEA - Market size and forecast 2019-2024
  • South America - Market size and forecast 2019-2024
  • North America - Market size and forecast 2019-2024
  • Key leading countries
  • Market opportunity

PART 09: DECISION FRAMEWORK

PART 10: DRIVERS AND CHALLENGES

  • Market drivers
  • Market challenges

PART 11: MARKET TRENDS

  • Advances in subsea processing
  • Declining costs of offshore drilling projects
  • Growing adoption of renewable energy

PART 12: VENDOR LANDSCAPE

  • Overview
  • Landscape disruption
  • Competitive scenario

PART 13: VENDOR ANALYSIS

  • Vendors covered
  • Vendor classification
  • Market positioning of vendors
  • Aker Solutions ASA
  • Baker Hughes Co.
  • Dril-Quip Inc.
  • Hunting Plc
  • National Oilwell Varco Inc.
  • Oceaneering International Inc.
  • Saipem Spa
  • Schlumberger Ltd.
  • TechnipFMC Plc
  • Worldwide Oilfield Machine Inc.

PART 14: APPENDIX

  • Research methodology
  • List of abbreviations
  • Definition of market positioning of vendors

PART 15: EXPLORE TECHNAVIO

About Us

Technavio is a leading global technology research and advisory company. Their research and analysis focuses on emerging market trends and provides actionable insights to help businesses identify market opportunities and develop effective strategies to optimize their market positions. With over 500 specialized analysts, Technavio’s report library consists of more than 17,000 reports and counting, covering 800 technologies, spanning across 50 countries. Their client base consists of enterprises of all sizes, including more than 100 Fortune 500 companies. This growing client base relies on Technavio’s comprehensive coverage, extensive research, and actionable market insights to identify opportunities in existing and potential markets and assess their competitive positions within changing market scenarios.


Contacts

Technavio Research
Jesse Maida
Media & Marketing Executive
US: +1 844 364 1100
UK: +44 203 893 3200
Email: This email address is being protected from spambots. You need JavaScript enabled to view it.
Website: www.technavio.com/

Adventure Travel Brand Recognized as Silver Winner for Overall River Cruising and Overall Destinations

AUGUSTA, Ga.--(BUSINESS WIRE)--As announced today by Travel Weekly, Aggressor Adventures has been awarded two silver 2020 Magellan Awards. The Aggressor Nile Queen was honored in the Overall River Cruising category and the Aggressor Safari Lodge in Sri Lanka was honored in the Overall Destinations category.


The Magellan Awards are judged and overseen by a panel of top travel professionals representing prominent travel brands and most accomplished leaders from the industry. In determining winners, entries do not compete with one another; instead they are judged against a standard of excellence based on the extensive experience of Travel Weekly. To uphold this esteemed standard, a category may have multiple winners, or even no winners at all.

“We are grateful to be recognized by the prestigious Magellan Awards. When traveling with Aggressor, our focus and dedication to exceptional service is second to none,” said Aggressor CEO Wayne Brown. “Amid the pandemic, we doubled down on safety policies and procedures. We could not be more proud of what we’ve accomplished this past year and to cap it off with two Magellan Awards is beyond rewarding.”

Aggressor’s Nile Queen is a 155-foot sailing vessel which takes guests back in time to experience the land of the pharaohs as they sail from Luxor to Aswan, Egypt. Guests see breathtaking views during guided tours of Karnak Temple, Luxor Temple, Valley of the Kings, Hatshepsut Temple and many other ancient sites during the five night adventure of a lifetime.

Aggressor’s Safari Lodge is a five-star safari lodge offering luxury accommodations, personalized service and intimate experiences. Guests can enjoy being surrounded by nature from each of the eight beautifully decorated, spacious and air-conditioned tented chalets with en-suite facilities and hotel-room-like luxuries.

About Aggressor Adventures

Since 1984, Aggressor Adventures® has offered travelers liveaboard scuba and snorkeling charters, luxury river cruises and exotic wildlife safaris. Worldwide locations the company explores include Bahamas, Belize, Cayman Islands, Cocos Island, Costa Rica, Cuba, Dominican Republic, Egypt, Galapagos, Hawaii, Indonesia, Maldives, Mexico, Oman, Palau, Red Sea, Roatan, Sri Lanka, Thailand, and Turks and Caicos. For reservations, visit www.aggressor.com or call (800) 348-2628 or +1 (706) 993-2531.


Contacts

For media inquiries or photos, contact:
Aggressor Adventures®
This email address is being protected from spambots. You need JavaScript enabled to view it.
(800) 348-2628 or (706) 993-2531

LONDON--(BUSINESS WIRE)--#GlobalSubmarineMarket--Technavio has been monitoring the submarine market, operating under the industrial sector. The latest report on the submarine market, 2020-2024 estimates it to register an incremental growth of $ 6.22 bn, at a CAGR of over 4% during the forecast period. The report offers an up-to-date analysis regarding the current market scenario, latest trends and drivers, and the overall market environment.


Technavio’s in-depth research has all your needs covered as our research reports include all foreseeable market scenarios, including pre- & post-COVID-19 analysis. Download Latest Free Sample Report on COVID-19 Analysis

The market is concentrated, and the degree of concentration will accelerate during the forecast period. Competitors have to focus on differentiating their product offerings with unique value propositions to strengthen their foothold in the market. Market vendors also have to leverage on the existing growth prospects in the fast-growing segments, while maintaining their positions in the slow-growing segments. BAE Systems Plc, DSME Co. Ltd., Fincantieri Spa, General Dynamics Corp., Huntington Ingalls Industries Inc., Mitsubishi Heavy Industries Ltd., Naval Group, Saab AB, thyssenkrupp AG, and United Shipbuilding Corp. are among some of the major market participants.

Buy 1 Technavio report and get the second for 50% off. Buy 2 Technavio reports and get the third for free.

View market snapshot before purchasing

The growing arms race among countries has been instrumental in driving the growth of the market. However, limitations in submarine building capabilities might hamper the market growth.

Technavio's custom research reports offer detailed insights on the impact of COVID-19 at an industry level, a regional level, and subsequent supply chain operations. This customized report will also help clients keep up with new product launches in direct & indirect COVID-19 related markets, upcoming vaccines and pipeline analysis, and significant developments in vendor operations and government regulations. Download a Free Sample Report on COVID-19 Impacts

Submarine Market 2020-2024: Segmentation

Submarine Market is segmented as below:

Based on geographic segmentation, over 34% of the market’s growth originated from North America during the forecast period. In addition, SSN led the growth under the type segment. This report provides an accurate prediction of the contribution of all the segments to the growth of the submarine market size.

  • Type
    • SSN
    • SSBN
    • SSK
  • Geography
    • North America
    • APAC
    • Europe
    • South America
    • MEA

Submarine Market 2020-2024: Scope

Technavio presents a detailed picture of the market by the way of study, synthesis, and summation of data from multiple sources. The submarine market report covers the following areas:

  • Submarine Market Size
  • Submarine Market Trends
  • Submarine Market Industry Analysis

This study identifies advances in undersea warfare as one of the prime reasons driving the Submarine Market growth during the next few years.

Technavio suggests three forecast scenarios (optimistic, probable, and pessimistic) considering the impact of COVID-19. Technavio’s in-depth research has direct and indirect COVID-19 impacted market research reports.

Register for a free trial today and gain instant access to 17,000+ market research reports.

Technavio's SUBSCRIPTION platform

Submarine Market 2020-2024: Key Highlights

  • CAGR of the market during the forecast period 2020-2024
  • Detailed information on factors that will assist submarine market growth during the next five years
  • Estimation of the submarine market size and its contribution to the parent market
  • Predictions on upcoming trends and changes in consumer behavior
  • The growth of the submarine market
  • Analysis of the market’s competitive landscape and detailed information on vendors
  • Comprehensive details of factors that will challenge the growth of submarine market, vendors

Table of Contents:

Executive Summary

Market Landscape

  • Market ecosystem
  • Market characteristics
  • Value chain analysis

Market Sizing

  • Market definition
  • Market segment analysis
  • Market size 2019
  • Market outlook: Forecast for 2019 - 2024

Five Forces Analysis

  • Five forces summary
  • Bargaining power of buyers
  • Bargaining power of suppliers
  • Threat of new entrants
  • Threat of substitutes
  • Threat of rivalry
  • Market condition

Market Segmentation by Type

  • Market segments
  • Comparison by Type
  • SSN - Market size and forecast 2019-2024
  • SSBN - Market size and forecast 2019-2024
  • SSK - Market size and forecast 2019-2024
  • Market opportunity by Type

Customer Landscape

Geographic Landscape

  • Geographic segmentation
  • Geographic comparison
  • North America - Market size and forecast 2019-2024
  • APAC - Market size and forecast 2019-2024
  • Europe - Market size and forecast 2019-2024
  • South America - Market size and forecast 2019-2024
  • MEA - Market size and forecast 2019-2024
  • Key leading countries
  • Market opportunity by geography
  • Market drivers
  • Market challenges
  • Market trends

Vendor Landscape

  • Vendor landscape
  • Landscape disruption
  • Competitive scenario

Vendor Analysis

  • Vendors covered
  • Market positioning of vendors
  • BAE Systems Plc
  • DSME Co. Ltd.
  • Fincantieri Spa
  • General Dynamics Corp.
  • Huntington Ingalls Industries Inc.
  • Mitsubishi Heavy Industries Ltd.
  • Naval Group
  • Saab AB
  • thyssenkrupp AG
  • United Shipbuilding Corp.

Appendix

  • Scope of the report
  • Currency conversion rates for US$
  • Research methodology
  • List of abbreviations

About Us

Technavio is a leading global technology research and advisory company. Their research and analysis focus on emerging market trends and provides actionable insights to help businesses identify market opportunities and develop effective strategies to optimize their market positions. With over 500 specialized analysts, Technavio’s report library consists of more than 17,000 reports and counting, covering 800 technologies, spanning across 50 countries. Their client base consists of enterprises of all sizes, including more than 100 Fortune 500 companies. This growing client base relies on Technavio’s comprehensive coverage, extensive research, and actionable market insights to identify opportunities in existing and potential markets and assess their competitive positions within changing market scenarios.


Contacts

Technavio Research
Jesse Maida
Media & Marketing Executive
US: +1 844 364 1100
UK: +44 203 893 3200
Email: This email address is being protected from spambots. You need JavaScript enabled to view it.
Website: www.technavio.com/

Third Quarter Revenue of $466.4 Million

Total Backlog of $898.7 Million

Third Quarter GAAP Diluted Earnings Per Share (“EPS”) of $0.46

Third Quarter Adjusted Diluted EPS of $0.64

Re-Initiates Full Year Fiscal 2020 Forward Guidance

ARLINGTON, Va.--(BUSINESS WIRE)--FLIR Systems, Inc. (NASDAQ: FLIR) (“FLIR” or the “Company”), a world leader in the design, manufacture, and marketing of intelligent sensing technologies, today announced financial results for the third quarter ended September 30, 2020.


Commenting on FLIR’s third quarter results, Jim Cannon, President and Chief Executive Officer, said, “I’m pleased with our third quarter results despite dynamic macro-economic conditions arising from the pandemic across some of the end markets we serve. We delivered important program wins, brought innovative new products to market, and on a year over year basis, expanded margins and drove earnings growth. Total backlog of $899 million remained at near-record levels, up 10.9% from the prior year quarter. In addition, we continue to realize expense savings through the ongoing execution of Project Be Ready, which aims to help our business profitably scale over the longer term while reducing costs in the near term. As a result, we improved adjusted operating margins by 110 basis points and adjusted net income by nearly 8% from the third quarter last year. As momentum continues to build across the enterprise, we believe our third quarter performance provides further evidence that the strategic pivot we embarked upon two years ago is working.”

Mr. Cannon concluded, “Based on our learnings from operating in the COVID-19 environment, our results year-to-date and outlook for the remainder of the fourth quarter, today we are re-initiating guidance for the full year 2020. Importantly, we expect to achieve year-over-year improvement in adjusted earnings per diluted share in 2020. Our commitment to driving value for shareholders remains at the forefront of everything we do and I feel confident that FLIR is well-positioned as we look to the future.”

Summary Results

Revenues for the quarter were $466.4 million, compared to $471.2 million the prior year quarter. Bookings totaled $451.2 million in the quarter, representing a book-to-bill ratio of 0.97. Backlog at the end of the quarter was $898.7 million, reflecting a 10.9% increase relative to the prior year quarter.

GAAP Earnings Results

Gross profit for the quarter was $228.9 million, compared to $229.7 million in the prior year quarter. Gross margin increased to 49.1% from 48.8% in the prior year quarter, primarily attributable to favorable product mix in the Industrial Technologies segment, partially offset by the ramp up of lower margin programs in the Defense Technologies segment. Earnings from operations for the quarter was $86.6 million, compared to $74.4 million in the prior year quarter. Operating margin increased to 18.6% from 15.8% in the prior year quarter, primarily as a result of decreases in intangible asset amortization, transaction and integration costs, and other operating expense reductions from Project Be Ready as well as marketing and travel costs, partially offset by an increase in deferred compensation costs. Diluted EPS was $0.46, compared to $0.46 in the prior year quarter. The weighted average diluted share count for the quarter was 132 million, down from 136 million in the prior year quarter primarily due to stock repurchase activity initiated in the first quarter of 2020.

Non-GAAP Earnings Results

Adjusted gross profit for the quarter was $238.5 million, compared to $239.9 million in the prior year quarter. Adjusted gross margin increased to 51.1% from 50.9% in the prior year quarter, primarily attributable to favorable product mix in the Industrial Technologies segment, partially offset by the ramp up of lower margin programs in the Defense Technologies segment. Adjusted operating income for the quarter was $104.8 million, compared to $100.8 million in the prior year quarter. Adjusted operating margin increased to 22.5% from 21.4% in the prior year quarter, primarily as a result of operating expense reductions from Project Be Ready as well as decreases in marketing and travel costs; partially offset by an increase in deferred compensation costs. Adjusted diluted EPS was $0.64, compared to $0.58 in the prior year quarter.

Segment Results

Industrial Technologies Segment

Industrial Technologies revenues for the quarter were $281.1 million, representing an increase of $23.2 million, or 9.0% compared to the prior year quarter. The increase was primarily attributable to heightened demand for EST solutions as a result of the COVID-19 pandemic and an increase in maritime product sales, partially offset by lower volume in other commercial end markets such as security products.

Industrial Technologies segment operating income was $87.7 million, compared to $63.7 million in the prior year quarter. Segment operating margin increased to 31.2% from 24.7% in the prior year quarter, primarily attributable to the aforementioned higher revenue and associated gross profit, favorable product mix, and operating expense reductions from Project Be Ready as well as lower marketing and travel costs.

Industrial Technologies bookings totaled $274.0 million for the quarter, representing a book-to-bill ratio of 0.97. Backlog at the end of the quarter was $342.4 million, reflecting a 25.1% increase relative to the prior year quarter, primarily as a result of award timing and an increased volume of long term orders.

Defense Technologies Segment

Defense Technologies revenues for the quarter of $185.3 million decreased by $28.0 million, or 13.1% compared to the prior year quarter. The revenue decrease was primarily attributable to shipment timing and the completion of certain contracts that contributed to revenue in the prior year quarter, partially offset by increased volumes for unmanned systems.

Defense Technologies segment operating income was $38.8 million, compared to $53.8 million in the prior year quarter. Segment operating margin decreased to 20.9% from 25.2% in the prior year quarter, primarily attributable to the aforementioned lower revenue and associated gross profit, partially offset by operating expense reductions from Project Be Ready as well as lower marketing and travel costs.

Defense Technologies bookings totaled $177.1 million for the quarter, representing a book-to-bill ratio of 0.96. Backlog at the end of the quarter was $556.3 million, reflecting a 3.6% increase relative to the prior year quarter, primarily as a result of increased orders in unmanned systems.

Balance Sheet and Liquidity

FLIR ended the third quarter of 2020 with $320.0 million in cash and cash equivalents and approximately $443 million in borrowing capacity under its credit facility based on current profitability levels and leverage covenants.

On August 3, 2020, the Company completed its previously announced public offering of $500 million aggregate principal amount 2.5% notes due August 1, 2030 (the “2030 Notes”). The aggregate net proceeds from the offering were approximately $494.2 million after deducting underwriting fees, debt discount and transaction issuance costs, which are being amortized over a period of ten years. Interest on the 2030 Notes is payable semiannually in arrears on February 1 and August 1 of each year beginning on February 1, 2021. The proceeds from the sale of the 2030 Notes were used to redeem the Company’s outstanding $425.0 million senior unsecured notes due June 15, 2021 and for general corporate purposes.

COVID-19 Update

As previously announced, FLIR’s businesses have been deemed essential for critical infrastructure under the Cybersecurity and Infrastructure Security Agency exemption, and all of its manufacturing facilities remain operational. FLIR has implemented stringent safety protocols and continues to monitor recommendations and guidelines issued by the Centers for Disease Control, the European Centre for Disease Prevention, and the World Health Organization to ensure the health and safety of its employees.

Given the high degree of uncertainty in the current macroeconomic environment resulting from COVID-19, the Company remains focused on cash optimization activities, disciplined capital allocation, and executing Project Be Ready to simplify its product portfolio and better align resources with higher growth opportunities while reducing costs.

Shareholder Return Activity

FLIR’s Board of Directors has declared a quarterly cash dividend of $0.17 per share on FLIR common stock payable on December 4, 2020 to shareholders of record as of close of business on November 20, 2020.

Forward Guidance

As a result of the Company’s year-to-date performance and updated expectations for the remainder or the year, the Company is re-initiating and updating its originally issued guidance for the full year ending December 31, 2020 as follows:

  • Revenue in the range of $1.880 billion to $1.900 billion, from $1.850 billion to $1.925 billion;
  • Adjusted operating income margins of approximately 22.0%, from 20.0% to 21.0%;
  • Adjusted diluted earnings per share in the range of $2.30 to $2.35, from $2.10 to $2.301

1Adjusted diluted earnings per share assumes an effective tax rate of 21% and weighted average diluted share count of approximately 133 million shares.

The Company’s updated forward guidance reflects the currently expected impacts related to COVID-19, however, the pandemic has generated significant uncertainty, including an overall lack of visibility into future demand trends and economic conditions in some of the markets in which FLIR operates. While the Company has re-initiated guidance for 2020 it cautions that market dynamics and impacts related to COVID-19 are fluid and changes to the current business environment could have a material impact on current expectations.

The forward guidance for 2020 includes forward-looking non-GAAP financial measures, which management uses in measuring performance. FLIR is not able to reconcile full year 2020 projected adjusted operating income or full year 2020 projected adjusted earnings per diluted share to the most comparable GAAP measures without unreasonable efforts because it is not possible to predict with a reasonable degree of certainty the actual impact of the Charges (defined herein) and the exact timing and amount of comparability items throughout 2020. The unavailable information could have a significant impact on full year 2020 GAAP financial results.

Conference Call

FLIR has scheduled a conference call at 9:00 a.m. Eastern Time today to discuss its results for the quarter. The details for the conference call can be found below. A simultaneous webcast of the conference call and the accompanying summary presentation may be accessed online from a link in the Events & Presentations section of the Company’s Investor Relations website at www.FLIR.com/investor. A replay will be available upon completion of the conference call at this same internet address. Summary third quarter and historical financial data may be accessed online from the Financial Info Database link under the Financials & Filings section of the Company’s Investor Relations website.

Third Quarter Financial Results Conference Call

Date:

Friday, October 30, 2020

Time:

9:00 a.m. Eastern Time / 6:00 a.m. Pacific Time

Dial-in:

1-877-407-9039 (Domestic)
1-201-689-8470 (International)

Conference ID:

13711591

Webcast:

http://public.viavid.com/index.php?id=141817

Replay:

For those unable to participate during the live broadcast, a replay of the call will also be available from 12:00 p.m. Eastern Time on October 30, 2020 through 11:59 p.m. Eastern Time on November 13, 2020 by dialing 1-844-512-2921 (domestic) and 1-412-317-6671 (international) and referencing the replay pin number: 13711591.

About FLIR Systems, Inc.

Founded in 1978, FLIR Systems is a world-leading industrial technology company focused on intelligent sensing solutions for defense and industrial applications. FLIR Systems’ vision is to be “The World’s Sixth Sense,” creating technologies to help professionals make more informed decisions that save lives and livelihoods. For more information, please visit www.flir.com and follow @flir.

Forward-Looking Statements

Statements, estimates or projections in this release may constitute forward-looking statements within the meaning of the Private Securities Litigation Reform Act of 1995. Any statements that are not statements of historical fact (including statements containing the words “believes,” “plans,” “anticipates,” “expects,” “estimates,” or similar expressions) should be considered to be forward looking statements. Such statements are based on current expectations, estimates, and projections about FLIR’s business based, in part, on assumptions made by management. These statements are not guarantees of future performance and involve risks and uncertainties that are difficult to predict. Therefore, actual outcomes and results may differ materially from what is expressed or forecasted in such forward-looking statements due to numerous factors, including the following:

  • risks related to United States government spending decisions and applicable procurement rules and regulations;
  • negative impacts to operating margins due to reductions in sales or changes in product mix;
  • impairments in the value of tangible and intangible assets;
  • unfavorable results of legal proceedings;
  • risks associated with international sales and business activities, including the regulation of the export and sale of our products worldwide and our ability to obtain and maintain necessary export licenses, as well as the imposition of significant tariffs or other trade barriers;
  • risks related to subcontractor and supplier performance and financial viability as well as raw material and component availability and pricing;
  • risks related to currency fluctuations;
  • adverse general economic conditions or volatility in our primary markets;
  • our ability to compete effectively and to respond to technological change;
  • risks related to product defects or errors;
  • our ability to protect our intellectual property and proprietary rights
  • cybersecurity and other security threats and technology disruptions
  • our ability to successfully manage acquisitions, investments and divestiture activities and integrate acquired companies;
  • our ability to achieve the intended benefits of our strategic restructuring;
  • our ability to attract and retain key senior management and qualified technical, sales and other personnel;
  • risks to our supply chain, production facilities or other operations, and changes to general, domestic, and foreign economic conditions, due to the COVID-19 pandemic; and
  • other risks discussed from time to time in filings and reports filed with the Securities and Exchange Commission.

COVID-19 may exacerbate one or more of the aforementioned and/or other risks, uncertainties and other factors more fully described in the Company’s reports filed with the SEC. In addition, such statements could be affected by general industry and market conditions and growth rates, and general domestic and international economic conditions. Such forward-looking statements speak only as of the date on which they are made and FLIR does not undertake any obligation to update any forward-looking statement to reflect events or circumstances after the date of this release, or for changes made to this document by wire services or internet service providers.

Definitions and Non-GAAP Financial Measures

Bookings are defined as contractual agreements awarded during the reporting period. Backlog is defined as total estimated amount of future revenues to be recognized under negotiated contracts.

We report our financial results in accordance with United States generally accepted accounting principles (GAAP). As a supplement to our GAAP financial results, this earnings announcement contains some or all of the following non-GAAP financial measures: (i) adjusted gross profit, (ii) adjusted gross margin (defined as adjusted gross profit divided by revenue), (iii) adjusted operating income, (iv) adjusted operating margin (defined as adjusted operating income divided by revenue), (v) adjusted net earnings, and (vi) adjusted diluted EPS. These non-GAAP measures of financial performance are not prepared in accordance with GAAP and computational methods may differ from those used by other companies. Additionally, these non-GAAP measures should not be considered a substitute for any other performance measure determined in accordance with GAAP, and the Company cautions investors and potential investors to consider these measures in addition to, not as a substitute for, its consolidated financial results as presented in accordance with GAAP. Each of the non-GAAP measures is adjusted from GAAP results as outlined in the "GAAP to Non-GAAP Reconciliation" table included within this earnings release.

In calculating non-GAAP financial measures, we exclude certain items to facilitate a review of the comparability of our core operating performance on a period-to-period basis. Items excluded consist of: (i) separation, transaction, and integration costs, (ii) amortization of acquired intangibles, (iii) restructuring expenses and asset impairment charges, (iv) discrete legal and compliance matters, (v) loss on debt extinguishment, and (vi) discrete tax items. We do not consider these items to be directly related to our core operating performance. Non-GAAP measures are used internally to evaluate the core operating performance of our business, for comparison with forecasts and strategic plans, and as a factor for determining incentive compensation for certain employees. Accordingly, supplementing GAAP financial results with these non-GAAP financial measures enables the comparison of our ongoing operating results in a manner consistent with the metrics reviewed by management. We believe that these non-GAAP measures, when read in conjunction with our GAAP financials, provide useful information to investors by facilitating:

  • the comparability of our ongoing operating results over the periods presented;
  • the ability to identify trends in our underlying business; and
  • the comparison of our operating results against analyst financial models and operating results of other public companies that supplement their GAAP results with non-GAAP financial measures.

The following are explanations of each type of adjustment that we incorporate into non-GAAP financial measures:

  • Separation, transaction, and integration costs – Represents transaction and integration costs related to divestiture and acquisition initiatives.
  • Amortization of acquired intangibles – Represents amortization expense associated with acquired intangible assets.
  • Restructuring expenses and asset impairment charges – Represents employee separation expenses, facility termination costs, and other expenses as well as goodwill, intangible asset, and inventory impairment charges associated with Company restructuring activities.
  • Discrete legal and compliance matters – Represents costs incurred associated with certain legal and compliance matters that are not representative of ongoing operational costs. These expenses are primarily attributable to an administrative agreement with the U.S. Department of State (the “Consent Agreement”) to address and remediate certain historical practices associated with U.S. and international trade control laws and regulations. Such costs include a Directorate of Defense Trade Controls penalty, expenses associated with retention of a Special Compliance Officer, and remedial actions required by the terms of the Consent Agreement or otherwise necessary to remedy and achieve full compliance with U.S. and international trade control laws and regulations.
  • Loss on debt extinguishment – Represents the redemption premium and write-off of debt discount and debt issuance costs associated with redemption of the Company’s $425 million unsecured notes due June 15, 2021.
  • Discrete tax items – Represents tax expenses and benefits related to discrete events or transactions that are not representative of the Company’s estimated tax rate related to ongoing operations. These items include charges and reversals of provisions associated with certain unrecognized tax benefits, benefits or charges associated with the windfalls or shortfalls resulting from vesting and exercise activity of share-based compensation, changes in valuation allowances against certain deferred tax assets, and other discrete items not included in the annual effective tax rate associated with our ongoing operations.

Adjusted net earnings and adjusted diluted EPS include an estimate to reflect the tax effect of the discrete items identified above. The tax effect is calculated by applying the Company’s overall estimated effective tax rate, excluding significant discrete items, to earnings before income taxes.

FLIR SYSTEMS, INC.
CONSOLIDATED STATEMENTS OF INCOME
(In thousands, except per share amounts)(Unaudited)
 

Three Months Ended


Nine Months Ended

September 30,


September 30,

2020


2019


2020


2019

 
Revenue

$

466,414


$

471,248


$

1,399,352


$

1,397,982


Cost of goods sold


237,500


241,501


698,870


700,966


Gross profit


228,914


229,747


700,482


697,016


Operating expenses:
Research and development


47,848


49,800


157,707


150,437


Selling, general and administrative


94,196


103,393


299,114


321,596


Restructuring expenses


293


2,166


28,779


5,776


Total operating expenses


142,337


155,359


485,600


477,809


Earnings from operations


86,577


74,388


214,882


219,207


Interest expense


7,273


7,582


21,196


20,370


Interest income


(55

)


(612

)


(531

)


(2,107

)

Loss on debt extinguishment


9,126


-


9,126


-


Other (income) expense, net


(9,688

)


292


78


938


Earnings before income taxes


79,921


67,126


185,013


200,006


Income tax provision


19,258


5,079


47,669


30,093


Net earnings

$

60,663


$

62,047


$

137,344


$

169,913


Net earnings per share:
Basic earnings per share

$

0.46


$

0.46


$

1.04


$

1.26


Diluted earnings per share

$

0.46


$

0.46


$

1.03


$

1.24


Weighted average shares outstanding:
Basic


131,125


134,741


131,848


135,264


Diluted


131,683


136,050


132,841


136,826


Note: The Company made certain reclassifications to the prior years' financial statements to conform them to the presentation as of and for the three and nine months ended September 30, 2020 that management has determined had no material effect for the periods presented.

FLIR SYSTEMS, INC.
CONSOLIDATED BALANCE SHEETS
(In thousands)(Unaudited)
 

September 30,


December 31,

2020


2019

ASSETS
Current assets:
Cash and cash equivalents

$

319,995


$

284,592


Accounts receivable, net


310,989


318,652


Inventories


474,845


388,762


Prepaid expenses and other current assets


122,857


116,728


Total current assets


1,228,686


1,108,734


Property and equipment, net


255,457


255,905


Deferred income taxes, net


37,902


39,983


Goodwill


1,350,647


1,364,596


Intangible assets, net


211,206


247,514


Other assets


129,014


120,809


Total assets

$

3,212,912


$

3,137,541


LIABILITIES AND SHAREHOLDERS' EQUITY
Current liabilities:
Accounts payable

$

148,026


$

158,033


Deferred revenue


25,802


28,587


Accrued payroll and related liabilities


88,097


72,476


Accrued product warranties


16,786


14,611


Advance payments from customers


13,631


28,005


Accrued expenses


35,421


40,815


Accrued income taxes


36,702


14,735


Other current liabilities


45,031


27,349


Credit facility


65,000


16,000


Long-term debt, current portion


12,743


12,444


Total current liabilities


487,239


413,055


Long-term debt, net of current portion


715,220


648,419


Deferred income taxes


38,148


53,544


Accrued income taxes


72,678


55,514


Other long-term liabilities


90,761


95,576


Shareholders’ equity:
Preferred stock, $0.01 par value, 10,000 shares authorized; no shares issued at September 30, 2020 and December 31, 2019


-


-


Common stock, $0.01 par value, 500,000 shares authorized, 131,144 and 134,394 shares issued at September 30, 2020 and December 31, 2019, respectively, and additional paid-in capital


20,994


16,692


Retained earnings


1,964,104


2,020,686


Accumulated other comprehensive loss


(176,232

)


(165,945

)

Total shareholders' equity


1,808,866


1,871,433


Total liabilities and shareholders' equity

$

3,212,912


$

3,137,541


Contacts

Investor Relations
Lasse Glassen
Addo Investor Relations
This email address is being protected from spambots. You need JavaScript enabled to view it.
(424) 238-6249


Read full story here

LONDON--(BUSINESS WIRE)--#GlobalTabularAluminaMarket--Technavio has been monitoring the tabular alumina market, operating under the materials industry. The latest report on tabular alumina market, 2020-2024 estimates it to register an incremental growth of 155.90 th MT, at a CAGR of over 6% during the forecast period. The report offers an up-to-date analysis regarding the current market scenario, latest trends and drivers, and the overall market environment.


Technavio’s in-depth research has all your needs covered as our research reports include all foreseeable market scenarios, including pre- & post-COVID-19 analysis. Download Latest Free Sample Report on COVID-19 Analysis

The market is fragmented, and the degree of fragmentation will accelerate during the forecast period. Competitors have to focus on differentiating their product offerings with unique value propositions to strengthen their foothold in the market. Market vendors also have to leverage on the existing growth prospects in the fast-growing segments, while maintaining their positions in the slow-growing segments. Almatis BV, AluChem Inc., Bisley & Company Pty. Ltd., Imerys Fused Minerals Villach GmbH, KT Refractories US Co., Luoyang Zhongsen Refractory Co., Possehl Erzkontor GmbH & Co. KG, Ransom & Randolph Co., SILKEM Doo, and Zibo Biz-Harmony International Co. Ltd. are among some of the major market participants.

Buy 1 Technavio report and get the second for 50% off. Buy 2 Technavio reports and get the third for free.

View market snapshot before purchasing

Growing use of tabular alumina in several applications has been instrumental in driving the growth of the market. However, growing cost of production might hamper the market growth.

Technavio's custom research reports offer detailed insights on the impact of COVID-19 at an industry level, a regional level, and subsequent supply chain operations. This customized report will also help clients keep up with new product launches in direct & indirect COVID-19 related markets, upcoming vaccines and pipeline analysis, and significant developments in vendor operations and government regulations. Download a Free Sample Report on COVID-19 Impacts

Tabular Alumina Market 2020-2024: Segmentation

Tabular Alumina Market is segmented as below:

Based on geographic segmentation, over 60% of the market’s growth originated from APAC during the forecast period. In addition, the refractory segment led the growth under the application segment. This report provides an accurate prediction of the contribution of all the segments to the growth of the tabular alumina market size.

  • Application
    • Refractory
    • Abrasives
    • Oil And Gas
  • Geography
    • APAC
    • Europe
    • North America
    • MEA
    • South America

Tabular Alumina Market 2020-2024: Scope

Technavio presents a detailed picture of the market by the way of study, synthesis, and summation of data from multiple sources. The tabular alumina market report covers the following areas:

  • Tabular Alumina Market Size
  • Tabular Alumina Market Trends
  • Tabular Alumina Market Industry Analysis

This study identifies as one of the prime reasons driving the Tabular Alumina Market growth during the next few years.

Technavio suggests three forecast scenarios (optimistic, probable, and pessimistic) considering the impact of COVID-19. Technavio’s in-depth research has direct and indirect COVID-19 impacted market research reports.

Register for a free trial today and gain instant access to 17,000+ market research reports.

Technavio's SUBSCRIPTION platform

Tabular Alumina Market 2020-2024: Key Highlights

  • CAGR of the market during the forecast period 2020-2024
  • Detailed information on factors that will assist tabular alumina market growth during the next five years
  • Estimation of the tabular alumina market size and its contribution to the parent market
  • Predictions on upcoming trends and changes in consumer behavior
  • The growth of the tabular alumina market
  • Analysis of the market’s competitive landscape and detailed information on vendors
  • Comprehensive details of factors that will challenge the growth of tabular alumina market, vendors

Table of Contents:

Executive Summary

  • Market Overview

Market Landscape

  • Market ecosystem
  • Value chain analysis

Market Sizing

  • Market definition
  • Market segment analysis
  • Market size 2019
  • Market outlook: Forecast for 2019 - 2024

Five Forces Analysis

  • Five Forces Analysis
  • Bargaining power of buyers
  • Bargaining power of suppliers
  • Threat of new entrants
  • Threat of substitutes
  • Threat of rivalry
  • Market condition

Market Segmentation by Application

  • Market segments
  • Comparison by Application
  • Refractory - Market size and forecast 2019-2024
  • Abrasives - Market size and forecast 2019-2024
  • Oil and gas - Market size and forecast 2019-2024
  • Market opportunity by Application

Customer landscape

  • Overview

Geographic Landscape

  • Geographic segmentation
  • Geographic comparison
  • APAC - Market size and forecast 2019-2024
  • Europe - Market size and forecast 2019-2024
  • North America - Market size and forecast 2019-2024
  • MEA - Market size and forecast 2019-2024
  • South America - Market size and forecast 2019-2024
  • Key leading countries
  • Market opportunity by geography
  • Market drivers
  • Market challenges
  • Market trends

Vendor Landscape

  • Overview
  • Landscape disruption

Vendor Analysis

  • Vendors covered
  • Market positioning of vendors
  • Almatis BV
  • AluChem Inc.
  • Bisley & Company Pty. Ltd.
  • Imerys Fused Minerals Villach GmbH
  • KT Refractories US Co.
  • Luoyang Zhongsen Refractory Co.
  • Possehl Erzkontor GmbH & Co. KG
  • Ransom & Randolph Co.
  • SILKEM Doo
  • Zibo Biz-Harmony International Co. Ltd.

Appendix

  • Scope of the report
  • Currency conversion rates for US$
  • Research methodology
  • List of abbreviations

About Us

Technavio is a leading global technology research and advisory company. Their research and analysis focus on emerging market trends and provides actionable insights to help businesses identify market opportunities and develop effective strategies to optimize their market positions. With over 500 specialized analysts, Technavio’s report library consists of more than 17,000 reports and counting, covering 800 technologies, spanning across 50 countries. Their client base consists of enterprises of all sizes, including more than 100 Fortune 500 companies. This growing client base relies on Technavio’s comprehensive coverage, extensive research, and actionable market insights to identify opportunities in existing and potential markets and assess their competitive positions within changing market scenarios.


Contacts

Technavio Research
Jesse Maida
Media & Marketing Executive
US: +1 844 364 1100
UK: +44 203 893 3200
Email: This email address is being protected from spambots. You need JavaScript enabled to view it.
Website: www.technavio.com/

  • Third quarter results improved by $400 million from the second quarter, primarily driven by early stages of demand recovery; excluding identified items, results improved by $2.2 billion
  • On track to exceed reduction targets for 2020 capital and cash expenses; further reductions anticipated in 2021
  • Continued Guyana progress with third major deepwater development approval and two new discoveries


IRVING, Texas--(BUSINESS WIRE)--Exxon Mobil Corporation (NYSE:XOM):


Second


Third Quarter


Quarter


First Nine Months


2020

2019


2020


2020

2019

Results Summary


(Dollars in millions, except per share data)


Earnings/(Loss) (U.S. GAAP)

(680)

3,170


(1,080)


(2,370)

8,650


Earnings/(Loss) Per Common Share


Assuming Dilution

(0.15)

0.75


(0.26)


(0.55)

2.03


Identified Items Per Common Share


Assuming Dilution

0.03

0.07


0.44


(0.20)

0.19


Earnings/(Loss) Excluding Identified Items


Per Common Share Assuming Dilution

(0.18)

0.68


(0.70)


(0.35)

1.84


Capital and Exploration Expenditures

4,133

7,719


5,327


16,603

22,688


Exxon Mobil Corporation today announced an estimated third quarter 2020 loss of $680 million, or $0.15 per share assuming dilution. Third quarter capital and exploration expenditures were $4.1 billion, bringing year-to-date spending to $16.6 billion, more than $6 billion lower than the prior year period.

Oil-equivalent production was 3.7 million barrels per day, up 1 percent from the second quarter of 2020. Production continued to reflect COVID-19 demand impacts, including economic and government mandated curtailments. Excluding entitlement effects, divestments, and government mandates, liquids production increased 2 percent, while natural gas volumes decreased 1 percent.

“We remain confident in our long-term strategy and the fundamentals of our business, and are taking the necessary actions to preserve value while protecting the balance sheet and dividend,” said Darren W. Woods, chairman and chief executive officer. “We are on pace to achieve our 2020 cost-reduction targets and are progressing additional savings next year as we manage through this unprecedented down cycle.”

The company’s preliminary 2021 capital program, which will be reviewed by the board of directors in the fourth quarter, is expected to be in the range of $16 billion to $19 billion, a reduction from the 2020 target of $23 billion announced in April. The company expects to identify further structural efficiencies as it continues previously announced country-by-country reviews.

Third Quarter 2020 Business Highlights

Upstream

  • Average third quarter realizations for crude oil improved significantly, as market prices increased following the second quarter's challenging environment. Natural gas realizations declined, primarily due to a lag in crude-linked LNG contract pricing.
  • Improved market conditions enabled full recovery of production impacted by economic curtailments. Government mandated curtailments negatively impacted third quarter results and are anticipated to continue in the fourth quarter.

Downstream

  • Supply chain optimization, higher product sales due to increased demand, and higher marketing margins more than offset lower industry fuels margins driven by market oversupply and high product inventory levels.
  • Third quarter saw the best reliability and process performance in the last 10 years, while average refinery utilization increased about 6 percent from the second quarter on demand recovery. Refining capacity sparing decreased to about 25 percent.

Chemical

  • Chemical sales volumes were higher than second quarter, benefiting from resilient packaging demand and recovering automotive and construction markets. Chemical margins were negatively impacted by higher feed costs.
  • The company's Corpus Christi chemical complex joint venture is approximately 80 percent complete, with start-up activities expected to commence in the fourth quarter of 2021.

Strengthening the Portfolio

  • ExxonMobil announced that it has funded the Payara development offshore Guyana, following government and regulatory approvals. The third major project in the Stabroek Block will have the capacity to produce up to 220,000 oil-equivalent barrels per day after expected startup in 2024. The company also made its 17th and 18th discoveries at the Yellowtail-2 and Redtail-1 wells, respectively, increasing the estimated recoverable resource to nearly 9 billion oil-equivalent barrels on the Stabroek block.
  • During the quarter, production volumes in the Permian averaged 401,000 oil-equivalent barrels per day which included full recovery of volumes curtailed in the prior quarter. Full year 2020 production is anticipated to be approximately 360,000 oil-equivalent barrels per day. Focus remains on lowering overall development costs through efficiency gains and technology applications. Compared to 2019, drilling and completion costs decreased more than 20 percent, while drilling rates (lateral feet per day) and fracturing rates (stages per day) both increased more than 30 percent. Rig count reductions continue, with 10-15 rigs expected to be operating by year-end.
  • ExxonMobil continues to improve its industry-leading development opportunities, as illustrated by the growth of the recoverable resource base in Guyana to nearly 9 billion barrels of oil equivalent, and other high-value assets in the U.S. Permian Basin, Mozambique, Papua New Guinea and Brazil. Given the high quality opportunities in ExxonMobil's portfolio and the constraints of the current market environment, the corporation is assessing its full portfolio to prioritize assets with the highest value potential within its broad range of available opportunities. This effort includes an ongoing re-assessment of North American dry gas assets currently included in the corporation’s development plan. Depending on the outcome of the planning process, including in particular any significant future changes to the corporation’s current development plans for its dry gas portfolio, long-lived assets with carrying values of approximately $25 billion to $30 billion could be at risk for significant impairment. If these assets remain in our long-term development plan, similar to previous years, it is unlikely the assets would be subject to material impairment. The company expects to complete this assessment in the fourth quarter.

Disciplined Investing and Cost Management

  • ExxonMobil made significant progress during the quarter on previously announced capital and cash operating expense reductions. Planned reductions to the 2020 capital spending program, from $33 billion to $23 billion, are ahead of schedule, reflecting increased efficiencies, lower market prices, and slower project pace. An expected decrease in cash operating expenses of about 15 percent is also ahead of schedule, capturing savings from increased efficiencies, reduced activity, and lower energy costs and volumes.

Advancing Innovative Technologies and Products

  • The company continued to progress work on scaling carbon-capture technologies aimed at reducing emissions. Following 12 months of technical evaluation, ExxonMobil and Global Thermostat announced an expanded joint development agreement to advance and bring to scale breakthrough technology that removes carbon dioxide directly from the atmosphere. ExxonMobil also announced, in collaboration with the University of California, Berkeley and the Lawrence Berkeley National Laboratory, the discovery of a new material that could capture more than 90 percent of carbon dioxide from industrial sources, such as natural gas-fired power plants.
  • ExxonMobil built on the company's longstanding efforts to develop and deliver products that help meet society's energy needs while reducing environmental impacts. These efforts included an agreement with Global Clean Energy Holdings to purchase 2.5 million barrels of renewable diesel per year for five years from a Bakersfield, CA biorefinery starting in 2022. Based on analysis of California Air Resources Board (CARB) data, renewable diesel from various non-petroleum feedstocks can provide life-cycle greenhouse gas emissions reductions of approximately 40 percent to 80 percent compared to petroleum-based diesel.


Results and Volume Summary


Millions of Dollars


3Q


3Q


(unless noted)


2020


2019


Change


Comments

Upstream


U.S.


(681)


37


-718


Lower prices partly offset by reduced expenses

Non-U.S.


298


2,131


-1,833


Lower prices and one-time tax items, partly offset by reduced expenses

Total


(383)


2,168


-2,551


Prices -2,630, volume -60, expenses +500, other -350, identified item -10

Production (koebd)


3,672


3,899


-227


Liquids -106 kbd: higher entitlements, lower downtime/maintenance, and growth, more than offset by government mandates, divestments, and lower demand including economic curtailments

Gas -729 mcfd: higher entitlements more than offset by divestments, higher downtime/maintenance, and decline

Downstream


U.S.


(136)


673


-809


Lower margins on weaker industry refining conditions, partly offset by reduced expenses and improved manufacturing

Non-U.S.


(95)


557


-652


Lower margins on weaker industry refining conditions and lower market demand, partly offset by reduced expenses and improved manufacturing

Total


(231)


1,230


-1,461


Margins -1,880, market demand -80, expenses +360, other +140

Petroleum Product Sales (kbd)


5,023


5,504


-481


Chemical


U.S.


357


53


+304


Higher margins and lower expenses; favorable identified item (noncash inventory valuation +29)

Non-U.S.


304


188


+116


Lower margins more than offset by lower expenses and favorable identified item (noncash inventory valuation +86)

Total


661


241


+420


Margins +70, volumes +30, expenses +170, identified items +120, forex/other +30

Prime Product Sales (kt)


6,624


6,476


+148


Corporate and financing


(727)


(469)


-258


Absence of prior year identified item (-307, tax)


Results and Volume Summary


Millions of Dollars


3Q


2Q


(unless noted)


2020


2020


Change


Comments

Upstream


U.S.


(681)


(1,197)


+516


Higher liquids prices and lower expenses; unfavorable identified item (noncash inventory valuation -45)

Non-U.S.


298


(454)


+752


Higher liquids prices partly offset by lower LNG prices; favorable volume/mix and lower expenses; unfavorable identified item (noncash inventory valuation -179)

Total


(383)


(1,651)


+1,268


Prices +1,390, volume +140, expenses +110, identified items -220, other -150

Production (koebd)


3,672


3,638


+34


Liquids -20 kbd: higher demand including reduced economic curtailments, more than offset by higher downtime/maintenance, lower entitlements and decline

Gas +326 mcfd: higher entitlements and demand including reduced economic curtailments, partly offset by decline

Downstream


U.S.


(136)


(101)


-35


Higher margins with favorable trading activity more than offsetting weaker industry refining conditions, higher market demand, and improved manufacturing more than offset by unfavorable identified item (noncash inventory valuation -401)

Non-U.S.


(95)


1,077


-1,172


Lower margins on weaker industry refining conditions more than offset by higher market demand and lower expenses; unfavorable forex and unfavorable identified item (noncash inventory valuation -1,184)

Total


(231)


976


-1,207


Margins +70, market demand +300, expenses +60, identified items -1,580, other -60

Petroleum Product Sales (kbd)


5,023


4,437


+586


Chemical


U.S.


357


171


+186


Higher volumes; favorable identified item (noncash inventory valuation +58)

Non-U.S.


304


296


+8


Lower margins more than offset by higher volumes and lower expenses; unfavorable identified item (noncash inventory valuation -58)

Total


661


467


+194


Margins -80, volumes +220, expenses +40, forex/other +10

Prime Product Sales (kt)


6,624


5,945


+679


Corporate and financing


(727)


(872)


+145


Lower financing and corporate costs


Results and Volume Summary


Millions of Dollars


YTD


YTD


(unless noted)


2020


2019


Change


Comments

Upstream


U.S.


(2,582)


468


-3,050


Lower prices partly offset by reduced expenses; unfavorable identified item (impairment -315)

Non-U.S.


1,084


7,837


-6,753


Lower prices and volumes, partly offset by reduced expenses and favorable foreign exchange effects; unfavorable identified items (noncash inventory valuation -61, impairment -41, prior year tax item -487)

Total


(1,498)


8,305


-9,803


Prices -9,050, volume -320, expenses +630, identified items -900, other -160

Production (koebd)


3,785


3,929


-144


Liquids -12 kbd: growth, higher entitlements, and lower downtime/maintenance, more than offset by divestments, government mandates, and lower demand including economic curtailments

Gas -794 mcfd: higher entitlements and growth, more than offset by divestments and lower demand including economic curtailments

Downstream


U.S.


(338)


822


-1,160


Lower margins on weaker industry refining conditions and reduced market demand partly offset by lower expenses and improved manufacturing

Non-U.S.


472


603


-131


Lower margins on weaker industry refining conditions and reduced market demand partly offset by improved manufacturing and lower expenses; unfavorable identified items (-326, mainly impairment)

Total


134


1,425


-1,291


Margins -2,260, market demand -520, manufacturing +920, expenses +860, other +40, identified items -330

Petroleum Product Sales (kbd)


4,916


5,443


-527


Chemical


U.S.


816


208


+608


Higher margins partly offset by lower volumes; lower expenses; unfavorable identified item (-90, impairment)

Non-U.S.


456


739


-283


Lower margins and volumes partly offset by lower expenses

Total


1,272


947


+325


Margins +190, volumes -220, expenses +380, identified items -90, forex/other +60

Prime Product Sales (kt)


18,806


19,947


-1,141


Corporate and financing


(2,278)


(2,027)


-251


Absence of prior year identified items (-332, tax) and higher financing costs partly offset by lower corporate costs


Cash Flow from Operations and Asset Sales excluding Working Capital


Millions of Dollars


3Q


2020


Comments


Net income (loss) including noncontrolling interests


(709)


Including ($29) million noncontrolling interests


Depreciation


4,983


Noncash inventory adjustment


(115)


Including ($2) million noncontrolling interests


Changes in operational working capital


863


Mainly inventory draw


Other


(633)


Includes changes in deferred income taxes


Cash Flow from Operating


4,389


Activities (U.S. GAAP)


Asset sales


100


Cash Flow from Operations


4,489


and Asset Sales


Changes in operational working capital


(863)


Cash Flow from Operations


3,626


and Asset Sales excluding Working Capital


Millions of Dollars


YTD


2020


Comments


Net income (loss) including noncontrolling interests


(2,648)


Including ($278) million noncontrolling interests


Depreciation


15,718


Including impairment impacts


Noncash inventory adjustment


61


Changes in operational working capital


(1,539)


Mainly unfavorable payables


Other


(929)


Includes changes in deferred income taxes


Cash Flow from Operating


10,663


Activities (U.S. GAAP)


Asset sales


229


Cash Flow from Operations


10,892


and Asset Sales


Changes in operational working capital


1,539


Cash Flow from Operations


12,431


and Asset Sales excluding Working Capital


First Nine Months 2020 Financial Updates

During the first nine months of 2020, Exxon Mobil Corporation purchased 6 million shares of its common stock for the treasury at a gross cost of $305 million. These shares were acquired to offset dilution in conjunction with the company’s benefit plans and programs. The corporation will continue to acquire shares to offset dilution in conjunction with its benefit plans and programs.

ExxonMobil will discuss financial and operating results and other matters during a webcast at 8:30 a.m. Central Time on October 30, 2020. To listen to the event or access an archived replay, please visit www.exxonmobil.com.

Cautionary Statement

Outlooks, projections, goals, targets, descriptions of strategic plans and objectives, and other statements of future events or conditions in this release are forward-looking statements. Actual future results, including financial and operating performance; the impact of the COVID-19 pandemic on results; planned capital and cash operating expense reductions and ability to meet or exceed announced reduction objectives; total capital expenditures and mix; cash flow, dividend and shareholder returns; business and project plans, timing, costs and capacities; resource recoveries and production rates; accounting and financial reporting effects resulting from market developments and ExxonMobil’s responsive actions, including potential impairment charges resulting from any significant changes in current development plan strategy or divestments plans; and the impact of new technologies, including to increase capital efficiency and production and to reduce greenhouse gas emissions and intensity, could differ materially due to a number of factors. These include global or regional changes in the supply and demand for oil, natural gas, petrochemicals, and feedstocks and other market conditions that impact prices and differentials; the outcome of government policies and actions, including actions taken to address COVID-19 and to maintain the functioning of national and global economies and markets; the impact of company actions to protect the health and safety of employees, vendors, customers, and communities; actions of competitors and commercial counterparties; the ability to access short- and long-term debt markets on a timely and affordable basis; the severity, length and ultimate impact of COVID-19 on people and economies; reservoir performance; the outcome of exploration projects and timely completion of development and construction projects; changes in law, taxes, or regulation including environmental regulations, and timely granting of governmental permits; war, trade agreements and patterns, shipping blockades or harassment, and other political or security disturbances; opportunities for and regulatory approval of potential investments or divestments; the actions of competitors; the capture of efficiencies within and between business lines and the ability to maintain near-term cost reductions as ongoing efficiencies while maintaining future competitive positioning; unforeseen technical or operating difficulties; the development and competitiveness of alternative energy and emission reduction technologies; the results of research programs; the ability to bring new technologies to commercial scale on a cost-competitive basis; general economic conditions including the occurrence and duration of economic recessions; and other factors discussed under Item 1A. Risk Factors of ExxonMobil’s 2019 Form 10-K and subsequent Forms 10-Q. Statements regarding plans or potential outcomes for the fourth quarter 2020 and 2021 also remain subject to completion of ExxonMobil's annual corporate planning process and approval of the resulting company plan by the Board of Directors, expected in November 2020. We assume no duty to update these statements as of any future date.

Frequently Used Terms and Non-GAAP Measures

This press release includes cash flow from operations and asset sales. Because of the regular nature of our asset management and divestment program, we believe it is useful for investors to consider proceeds associated with the sales of subsidiaries, property, plant and equipment, and sales and returns of investments together with cash provided by operating activities when evaluating cash available for investment in the business and financing activities. A reconciliation to net cash provided by operating activities for 2020 periods is shown on page 7 and for 2020 and 2019 periods in Attachment V.

This press release also includes cash flow from operations and asset sales excluding working capital. We believe it is useful for investors to consider these numbers in comparing the underlying performance of our business across periods when there are significant period-to-period differences in the amount of changes in working capital. A reconciliation to net cash provided by operating activities for 2020 periods is shown on page 7 and for 2020 and 2019 periods in Attachment V.

This press release also includes earnings/(loss) excluding identified items, which are earnings/(loss) excluding individually significant non-operational events with an absolute corporate total earnings impact of at least $250 million in a given quarter. The earnings/(loss) impact of an identified item for an individual segment may be less than $250 million when the item impacts several segments. We believe it is useful for investors to consider these figures in comparing the underlying performance of our business across periods when one, or both, periods include identified items. A reconciliation to earnings is shown for 2020 and 2019 periods in Attachments II-a and II-b. Corresponding per share amounts are shown on page 1 and in attachment II-a, including a reconciliation to earnings/(loss) per common share – assuming dilution (U.S. GAAP).

This press release also includes total taxes including sales-based taxes. This is a broader indicator of the total tax burden on the corporation’s products and earnings, including certain sales and value-added taxes imposed on and concurrent with revenue-producing transactions with customers and collected on behalf of governmental authorities (“sales-based taxes”). It combines “Income taxes” and “Total other taxes and duties” with sales-based taxes, which are reported net in the income statement. We believe it is useful for the corporation and its investors to understand the total tax burden imposed on the corporation’s products and earnings. A reconciliation to total taxes is shown as part of the Estimated Key Financial and Operating Data in Attachment I.

References to the resource base and other quantities of oil, natural gas or condensate may include estimated amounts that are not yet classified as “proved reserves” under SEC definitions, but which are expected to be ultimately recoverable. The term “project” as used in this release can refer to a variety of different activities and does not necessarily have the same meaning as in any government payment transparency reports. Further information on ExxonMobil’s frequently used financial and operating measures and other terms including “Cash flow from operations and asset sales”, and “Total taxes including sales-based taxes” is contained under the heading “Frequently Used Terms” available through the “Investors” section of our website at www.exxonmobil.com.

LIFO Inventory

Crude oil, products and merchandise inventories are carried at the lower of current market value or cost, generally determined under the last-in first-out method (LIFO). The corporation’s results for the first quarter of 2020 included an after-tax earnings charge of $2,096 million from writing down the book value of inventories to their market value at the end of the period.


Contacts

ExxonMobil
Media Relations, 972-940-6007


Read full story here
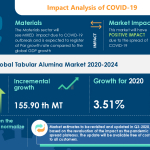
LONDON--(BUSINESS WIRE)--#GlobalOilfieldBiocidesMarket--Scope of the report


This report provides a detailed analysis of the oilfield biocides market by type (glutaraldehyde, chlorine, THPS, quaternary ammonium, and others) and geography (APAC, Europe, MEA, North America, and South America). Also, the report analyzes the market’s competitive landscape and offers information on several market vendors, including Akzo Nobel NV, BASF SE, Clariant International Ltd., Dow Inc., DuPont de Nemours Inc., Evonik Industries AG, Halliburton Co., Kemira Oyj, Solvay SA, and The Lubrizol Corp. The combination of biocides with micro biocides for integrated solutions is a key trend in the global oilfield biocides market which will lead to significant market growth. Combining biocides with micro biocides is known to be effective against bacteria such as APB and SRB. It also helps prevent the formation of souring (H2S), corrosion of assets (microbial influenced), and biofouling. All these factors are leading to a positive outlook for the oilfield biocides market.

To learn more about the global trends impacting the future of market research, download a free sample now

Oilfield Biocides Market: Segmentation by Geography

The market is segmented into five regions encompassing APAC, Europe, MEA, North America, and South America. North America was the largest market for oilfield biocides in 2019, and the region is expected to offer several growth opportunities to market vendors during the forecast period. About 62% of the market’s growth will originate from North America during the forecast period. The growing global demand for energy has led oil and gas companies in Canada to increase unconventional exploration and production activities. In addition, the increasing consumer inclination toward the adoption of eco-friendly products and rising stringent regulations regarding the use of VOCs is driving the demand for oilfield biocides in North America. The US and Canada are the key markets for oilfield biocides in North America.

Oilfield Biocides Market: Segmentation by Type

The oilfield biocides market is segmented into five segments based on the type comprising of glutaraldehyde, chlorine, THPS, quaternary ammonium, and others. Glutaraldehyde was the most consumed type of oilfield biocides in 2019. This is due to the excellent performance of glutaraldehyde in both neutral and alkaline water. The application of glutaraldehyde significantly reduces biofilm accumulation, bacterial population, and metabolic activity in oilfields. These factors are creating significant growth potential in the segment.

Technavio’s in-depth research has all your needs covered as our research reports include all foreseeable market scenarios, including pre- & post-COVID-19 analysis. Download a Free Sample Report on COVID-19 Impacts

Oilfield Biocides Market: Growth Drivers

Increasing adoption of oxidizing oilfield biocides will drive market growth. End-users in the market are increasing the preference for oxidizing oil-field biocides due to their ability to destroy microorganisms in a wide range of applications, including commercial cleaning and industrial applications. They are also preferred in cases where oilfield microbial growth is too high and cannot be controlled by nonoxidizing agents. The growing competition in the oil and gas industry is driving oil and gas companies to continuously focus on discovering new resources, increase profit margins, and stay competitive. This is further increasing the demand for oxidizing oilfield biocides, which is driving the growth of the market.

Oilfield Biocides Market: Market Overview

The oilfield biocides market is fragmented with the presence of several domestic and international players. Hence, companies need to adopt advanced technologies and marketing strategies to remain competitive in the market. Akzo Nobel NV, BASF SE, and Clariant International Ltd. are some of the major market participants. Though the accelerating growth momentum will offer immense growth opportunities, the health hazards associated with exposure to oilfield biocides will challenge the growth of the market participants. To make the most of the opportunities, market vendors should focus more on the growth prospects in the fast-growing segments, while maintaining their position in the slow-growing segments.

Market Sizing Methodology

Technavio uses a robust market sizing approach to estimate the total opportunity size for any market. Some of the examples of methodologies are shown for reference data is collected through both primary research (through industry interview with market participants and industry experts) as well as secondary research (through annual reports, press releases, company and industry presentations, industry associations, journals and in-house data repositories built over past 15 years)

Oilfield Biocides Market: Parent Market Overview

Technavio categorizes the global oilfield biocides market as a part of the global chemicals market. The parent global chemicals market covers companies engaged in the manufacture of various types of products under organic and inorganic chemicals. The global specialty chemicals market covers products and companies engaged in high value-added chemicals used in the manufacture of a wide variety of products, including, but not limited to, fine chemicals, additives, advanced polymers, adhesives, sealants, specialty paints, pigments, and coatings.

Growth in the global specialty chemicals market will be driven by the shift in the preference toward specialty adhesives and sealants.

Buy 1 Technavio report and get the second for 50% off. Buy 2 Technavio reports and get the third for free.

View market snapshot before purchasing

Technavio Best Practices

Technavio is based on four simple principles: easy-to-access reports, robust industry coverage, a focus on new and emerging technologies, and competitive pricing. We believe in helping companies and executives become better equipped to make faster, sounder, and more effective decisions. Our focus is on emerging markets and technologies, providing insights not available anywhere else. We report on the latest innovations and trends in all the industries we cover. We also create value for our clients by offering a blend of off-the-shelf research reports and customized research, allowing you to get the information you need when you need it.

Who should purchase this report?

Our research and analysis focus on emerging market trends to help businesses identify market opportunities and develop effective strategies to optimize their market positions. Our research reports are designed to provide actionable insights so that you can make quick, effective, and sound decisions.

Are you looking for data that are tailored specifically for your company? You can rely on Technavio Custom Research Solutions which provide research and insights developed to your exact specifications. We provide flexible engagement models such as on-demand research, a dedicated analyst, an annual research framework, an unlimited program, and more.

About Technavio

Technavio is a leading global technology research and advisory company. Their research and analysis focus on emerging market trends and provides actionable insights to help businesses identify market opportunities and develop effective strategies to optimize their market positions.

With over 500 specialized analysts, Technavio’s report library consists of more than 17,000 reports and counting, covering 800 technologies, spanning across 50 countries. Their client base consists of enterprises of all sizes, including more than 100 Fortune 500 companies. This growing client base relies on Technavio’s comprehensive coverage, extensive research, and actionable market insights to identify opportunities in existing and potential markets and assess their competitive positions within changing market scenarios.


Contacts

Technavio Research
Jesse Maida
Media & Marketing Executive
US: +1 844 364 1100
UK: +44 203 893 3200
Email: This email address is being protected from spambots. You need JavaScript enabled to view it.
Website: https://www.technavio.com


CALGARY, Alberta--(BUSINESS WIRE)--Imperial Oil Limited (TSX, NYSEAM:IMO):

  • Net earnings of $3 million in the quarter, up significantly from the second quarter
  • Exceeding previously announced capital and expense reduction targets
  • Year-to-date production and manufacturing expenses $813 million below the same period of 2019
  • Full-year 2020 capital expenditures now expected to be about $900 million
  • Cash flow generated from operating activities of $875 million
  • Cash balance of $817 million at the end of the quarter, up $584 million from the second quarter
  • Maintained quarterly dividend at 22 cents per share


Third quarter


Nine months

millions of Canadian dollars, unless noted


2020


2019


2020


2019


Net income (loss) (U.S. GAAP)


3


424


-421


(711)


1,929


-2,640

Net income (loss) per common share, assuming dilution (dollars)


-


0.56


-0.56


(0.97)


2.51


-3.48

Capital and exploration expenditures


141


442


-301


679


1,400


-721


Imperial recorded estimated earnings of $3 million in the third quarter of 2020, an increase of $529 million from the prior quarter. Second quarter 2020 results included a favourable impact of $281 million from the reversal of a non-cash inventory revaluation charge. Despite being impacted by substantial turnaround activities in the quarter and a two-week outage of a third-party pipeline supplying diluent to Kearl, improving market conditions and the company’s continuing focus on reducing costs and enhancing efficiency across its operations allowed it to achieve positive earnings in the ongoing challenging environment.

Third quarter results continue to demonstrate the positive impact of Imperial’s ongoing expense and capital discipline and the resiliency of our company,” said Brad Corson, chairman, president and chief executive officer. “The company generated $875 million of cash from operations in the third quarter, further strengthening Imperial’s balance sheet while covering quarterly capital expenditures and dividend payments.”

Production and manufacturing expenses totalled $1,246 million in the third quarter, a reduction of $355 million compared to the third quarter of 2019. Year-to-date production and manufacturing expenses of $4,098 million are $813 million lower than the prior year, enabling Imperial to already surpass the full-year expense reduction target of $500 million. Capital expenditures of $679 million for the first nine months of the year are down more than 50 percent from 2019 levels for the same period and significantly below prior guidance announced in March. “These expense and capital reductions across virtually all aspects of Imperial’s operations demonstrate our ability to rapidly respond to market conditions and capture structural cost improvements without compromising long-term value and production targets,” said Corson.

Upstream production for the third quarter averaged 365,000 gross oil-equivalent barrels per day, compared to 347,000 barrels per day in the second quarter of 2020. During the quarter, the company advanced and extended a planned turnaround at Kearl and experienced a two-week outage of a third-party pipeline that supplies diluent to the site. During the pipeline outage, site maintenance activities were advanced to reduce planned maintenance impacts during the remainder of the year. Despite impacts from the outage, of approximately 41,000 total gross barrels per day in the third quarter, total gross production at Kearl was 189,000 barrels per day, essentially flat compared to the second quarter of 2020. Site production was quickly restored and achieved a new 15-day production record, reaching average gross production rates of approximately 310,000 barrels per day for the remainder of the quarter. As a result of this strong performance, Imperial maintains its Kearl full-year 2020 gross production outlook of 220,000 barrels per day.

Downstream throughput averaged 341,000 barrels per day in the third quarter, with utilization at 81 percent, up from 278,000 barrels per day and 66 percent utilization in the second quarter of 2020. Petroleum product sales for the third quarter increased to 449,000 barrels per day, up from 357,000 barrels per day in the second quarter of 2020 due to improved product demand.

With the completion of key turnaround activities, recent strong asset performance, and expenses running at a significantly reduced rate, Imperial has substantial momentum as we approach the end of the year - we are well-positioned for strong performance in the fourth quarter.” said Corson.

Third quarter highlights

  • Net income of $3 million or $0.00 per share on a diluted basis, compared to $424 million or $0.56 per share in the third quarter of 2019, driven by lower Upstream realizations and lower margins in the Downstream, partially offset by lower production and manufacturing expenses.
  • Cash flow generated from operating activities was $875 million, compared with $1,376 million in the corresponding period of 2019.
  • Capital and exploration expenditures totalled $141 million, compared with $442 million in the third quarter of 2019, due to the company’s ongoing capital reduction efforts. Capital expenditures for 2020 are now expected to be about $900 million, below the company’s earlier guidance of $1.1 billion to $1.2 billion.
  • Dividends paid totalled $162 million or $0.22 per share, compared to $169 million or $0.22 per share in the third quarter of 2019.
  • Production averaged 365,000 gross oil-equivalent barrels per day, compared to 407,000 barrels per day in the same period of 2019. Production was primarily impacted by a third-party pipeline outage and the planned turnaround at Kearl. Production was up from 347,000 gross oil-equivalent barrels per day in the second quarter of 2020.
  • Total gross bitumen production at Kearl averaged 189,000 barrels per day (134,000 barrels Imperial’s share), compared to 224,000 barrels per day (159,000 barrels Imperial’s share) in the third quarter of 2019 due to the advancement and extension of a planned turnaround at the site and a third-party pipeline outage. Production remained relatively flat compared to gross bitumen production of 190,000 barrels per day (135,000 Imperial’s share) in the second quarter of 2020.
  • Gross bitumen production at Cold Lake averaged 131,000 barrels per day, compared to 142,000 barrels per day in the same period of 2019, due mainly to ongoing steam management. Production was up from 123,000 barrels per day in the second quarter of 2020, mainly due to reduced planned maintenance activities.
  • The company’s share of gross production from Syncrude averaged 67,000 barrels per day, essentially in line with 69,000 barrels per day in the same period of 2019. Production was up from 50,000 barrels per day in the second quarter of 2020, driven mainly by improved demand, partly offset by the revised turnaround schedule.
  • Refinery throughput averaged 341,000 barrels per day, compared to 363,000 barrels per day in the third quarter of 2019. Capacity utilization was 81 percent, compared to 86 percent in the third quarter of 2019. Reduced throughput was due to lower market demand, partially offset by reduced planned maintenance. Throughput increased significantly from 278,000 barrels per day in the second quarter of 2020, driven by stronger product demand.
  • Strathcona refinery cogeneration started operation on October 1, subsequent to the end of the quarter. The newly constructed unit provides approximately 41 megawatts of power, which is approximately 75 to 80 percent of the refinery’s needs. It is anticipated to increase energy efficiency for the facility and help reduce provincial greenhouse gas emissions by approximately 112,000 tonnes per year - the equivalent of taking nearly 24,000 vehicles off the road.
  • Petroleum product sales were 449,000 barrels per day, compared to 488,000 barrels per day in the third quarter of 2019, resulting from reduced demand from the COVID-19 pandemic. Petroleum product sales were up from 357,000 barrels per day in the second quarter of 2020 due to improving demand levels.
  • Chemical earnings were $27 million in the quarter, compared to $38 million in the third quarter of 2019, due to lower margins.
  • Imperial celebrates 140 years applying technology and innovation to responsibly develop and deliver Canada’s energy resources. On September 8, 1880, sixteen Ontario oil refiners created the Imperial Oil Company. In the years since, the company has been responsible for Canada’s first service station, the industry’s first petroleum research centre, and gave rise to the NHL’s “three stars” of the game. Today, Imperial is one of Canada’s largest integrated oil companies with extensive production, refining and marketing operations, including a market-leading retail presence with over 2,000 Esso and Mobil branded stations across the country.

Third quarter 2020 vs. third quarter 2019

The company recorded net income of $3 million or $0.00 per share on a diluted basis in the third quarter of 2020, compared to net income of $424 million or $0.56 per share in the same period of 2019.

Upstream recorded a net loss of $74 million in the third quarter of 2020, compared to net income of $209 million in the same period of 2019. Results were negatively impacted by lower realizations of about $490 million and lower volumes of about $110 million. These items were partially offset by lower royalties of about $150 million and lower operating expenses of about $130 million.

West Texas Intermediate (WTI) averaged US$40.93 per barrel in the third quarter of 2020, down from US$56.44 per barrel in the same quarter of 2019. Western Canada Select (WCS) averaged US$31.81 per barrel and US$44.21 per barrel for the same periods. The WTI / WCS differential averaged approximately US$9 per barrel for the third quarter of 2020, compared to around US$12 in the same period of 2019.

The Canadian dollar averaged US$0.75 in the third quarter of 2020, a decrease of US$0.01 from the third quarter of 2019.

Imperial’s average Canadian dollar realizations for bitumen decreased in the quarter, primarily due to a decrease in WCS. Bitumen realizations averaged $35.95 per barrel in the third quarter of 2020, compared to $51.12 per barrel in the third quarter of 2019. The company’s average Canadian dollar realizations for synthetic crude decreased generally in line with WTI, adjusted for changes in exchange rates and transportation costs. Synthetic crude realizations averaged $50.79 per barrel in the third quarter of 2020, compared to $77.27 per barrel in the same period of 2019.

Total gross production of Kearl bitumen averaged 189,000 barrels per day in the third quarter (134,000 barrels Imperial’s share), compared to 224,000 barrels per day (159,000 barrels Imperial’s share) in the third quarter of 2019. Lower production was due to the advancement and extension of a planned turnaround at the site and a third-party pipeline outage

Gross production of Cold Lake bitumen averaged 131,000 barrels per day in the third quarter, compared to 142,000 barrels per day in the same period of 2019. Lower production was mainly due to production timing associated with steam management.

The company's share of gross production from Syncrude averaged 67,000 barrels per day, compared to 69,000 barrels per day in the third quarter of 2019.

Downstream recorded net income of $77 million in the third quarter of 2020, compared to net income of $221 million in the same period of 2019. Results were negatively impacted by lower margins of about $230 million and lower sales volumes of about $70 million. These items were offset by lower operating expenses of about $70 million, and improved reliability of about $50 million, primarily related to the absence of the Sarnia fractionation tower incident which occurred in April 2019.

Refinery throughput averaged 341,000 barrels per day, compared to 363,000 barrels per day in the third quarter of 2019. Capacity utilization was 81 percent, compared to 86 percent in the third quarter of 2019. Reduced throughput was due to lower market demand, partially offset by reduced planned maintenance.

Petroleum product sales were 449,000 barrels per day, compared to 488,000 barrels per day in the third quarter of 2019. Lower petroleum product sales were mainly due to reduced demand from the COVID-19 pandemic.

Chemical net income was $27 million in the third quarter, compared to $38 million in the same quarter of 2019.

Corporate and other expenses were $27 million in the third quarter, compared to $44 million in the same period of 2019.

Cash flow generated from operating activities was $875 million in the third quarter, compared with cash flow generated from operating activities of $1,376 million in the corresponding period in 2019, primarily reflecting lower realizations in the Upstream and lower margins in the Downstream.

Investing activities used net cash of $125 million in the third quarter, compared with $413 million used in the same period of 2019, primarily reflecting lower additions to property, plant and equipment.

Cash used in financing activities was $166 million in the third quarter, compared with $519 million used in the third quarter of 2019. Dividends paid in the third quarter of 2020 were $162 million. The per share dividend paid in the third quarter was $0.22, consistent with $0.22 in the same period of 2019. The company did not purchase shares during the third quarter. In the third quarter of 2019, the company purchased about 9.8 million shares for $343 million, including shares purchased from Exxon Mobil Corporation.

The company’s cash balance was $817 million at September 30, 2020, versus $1,531 million at the end of third quarter 2019.

Nine months highlights

  • Net loss of $711 million, compared to net income of $1,929 million in 2019.
  • Net loss per share on a diluted basis was $0.97, compared to net income per share of $2.51 in 2019.
  • Cash flow generated from operating activities was $482 million, compared to cash flow generated from operating activities of $3,405 million in 2019.
  • Capital and exploration expenditures totalled $679 million, compared to $1,400 million in 2019.
  • Gross oil-equivalent production averaged 377,000 barrels per day, compared to 398,000 barrels per day in 2019.
  • Refinery throughput averaged 334,000 barrels per day, compared to 363,000 barrels per day in 2019.
  • Petroleum product sales were 423,000 barrels per day, compared to 481,000 barrels per day in 2019.
  • Per share dividends declared during the year totalled $0.66, up from $0.63 per share in 2019.
  • Returned $762 million to shareholders through dividends and share purchases.

Nine months 2020 vs. nine months 2019

Net loss in the first nine months of 2020 was $711 million, or $0.97 per share on a diluted basis, compared to net income of $1,929 million or $2.51 per share in the first nine months of 2019. Current year results include a favourable impact of about $90 million after-tax, associated with the Canada Emergency Wage Subsidy (CEWS), which includes Imperial’s proportionate share of a joint venture. Year-to-date 2019 results included a favourable impact of $662 million associated with the Alberta corporate income tax rate decrease.

Upstream recorded a net loss of $1,126 million for the first nine months of the year, compared to net income of $1,252 million in the same period of 2019. Results were negatively impacted by lower realizations of about $2,330 million, absence of a favourable impact of $689 million associated with the Alberta corporate income tax rate decrease in 2019, and lower volumes of about $300 million. These items were partially offset by lower royalties of about $460 million, lower operating expenses of about $320 million, favourable foreign exchange impacts of about $120 million and about $60 million associated with the CEWS received by the company which includes Imperial's proportionate share of a joint venture.

West Texas Intermediate averaged US$38.10 per barrel in the first nine months of 2020, down from US$57.10 per barrel in the same period of 2019. Western Canada Select averaged US$24.72 per barrel and US$45.32 per barrel for the same periods. The WTI / WCS differential widened to average approximately US$13 per barrel in the first nine months of 2020, from around US$12 per barrel in the same period of 2019.

The Canadian dollar averaged US$0.74 in the first nine months of 2020, a decrease of US$0.01 from the same period in 2019.

Imperial's average Canadian dollar realizations for bitumen decreased in the first nine months of 2020 primarily due to a decrease in WCS. Bitumen realizations averaged $22.24 per barrel, compared to $52.44 per barrel from the same period in 2019. The company's average Canadian dollar realizations for synthetic crude decreased generally in line with WTI in the first nine months of 2020, adjusted for changes in exchange rates and transportation costs. Synthetic crude realizations averaged $49.06 per barrel, compared to $74.59 per barrel from the same period in 2019.

Total gross production of Kearl bitumen averaged 202,000 barrels per day in the first nine months of 2020 (143,000 barrels Imperial's share), down from 204,000 barrels per day (145,000 barrels Imperial's share) in the same period of 2019. Lower production was mainly due to the balancing of near-term production with demand through the advancement and extension of planned turnaround activities and a third-party pipeline outage, partially offset by the addition of supplemental crushing facilities in 2020.

Gross production of Cold Lake bitumen averaged 131,000 barrels per day in the first nine months of 2020, compared to 141,000 barrels per day in the same period of 2019. Lower production was mainly due to production timing associated with steam management.

During the first nine months of 2020, the company's share of gross production from Syncrude averaged 63,000 barrels per day, compared to 76,000 barrels per day in the same period of 2019. Lower production was mainly due to the balancing of near term production with demand.

Downstream net income was $447 million, compared to $736 million in the same period of 2019. Results were negatively impacted by lower margins of about $460 million, and lower sales volumes of about $220 million. These items were offset by improved reliability of $200 million, primarily due to the absence of the Sarnia fractionation tower incident which occurred in April 2019, lower operating expenses of $140 million and lower turnaround costs of $70 million primarily related to reduced turnaround activity in the current year.

Refinery throughput averaged 334,000 barrels per day in the first nine months of 2020, compared to 363,000 barrels per day in the same period of 2019. Capacity utilization was 79 percent, compared to 86 percent in the same period of 2019. Lower throughput was primarily due to reduced demand from the COVID-19 pandemic, partially offset by the absence of impacts from the Sarnia fractionation tower incident which occurred in April 2019.

Petroleum product sales were 423,000 barrels per day in the first nine months of 2020, compared to 481,000 barrels per day in the same period of 2019. Lower petroleum product sales were mainly due to reduced demand resulting from the COVID-19 pandemic.

Chemical net income was $55 million in the first nine months of 2020, compared to $110 million in the same period of 2019. Results were negatively impacted by lower margins of about $60 million.

Corporate and other expenses were $87 million in the first nine months of 2020, compared to $169 million in the same period of 2019, mainly due to lower share-based compensation costs.

Cash flow generated from operating activities was $482 million in the first nine months of 2020, compared with cash flow generated from operating activities of $3,405 million in the same period of 2019, primarily reflecting lower realizations in the Upstream and unfavourable working capital impacts.

Investing activities used net cash of $605 million in the first nine months of 2020, compared with $1,305 million used in the same period of 2019, primarily reflecting lower additions to property, plant and equipment.

Cash used in financing activities was $778 million in the first nine months of 2020, compared with $1,557 million used in the same period of 2019. Dividends paid in the first nine months of 2020 were $488 million. The per share dividend paid in the first nine months of 2020 was $0.66, up from $0.60 in the same period of 2019. During the first nine months of 2020, the company, under its share purchase program, purchased about 9.8 million shares for $274 million. In the first nine months of 2019, the company purchased about 29.6 million shares for $1,072 million.

Key financial and operating data follow.

Current economic conditions

In 2020, the balance of supply and demand for petroleum and petrochemical products experienced two significant disruptive effects. On the demand side, the COVID-19 pandemic spread rapidly across Canada and the world resulting in substantial reductions in consumer and business activity and significantly reduced local and global demand for crude oil, natural gas, and petroleum products. This reduction in demand coincided with announcements of increased production in certain key oil-producing countries which led to increases in inventory levels and sharp declines in prices for crude oil, natural gas, and petroleum products. Throughout the second and third quarters, the effects of COVID-19 continued to have a negative impact on the world’s major economies and demand for the company’s products, and market conditions continue to reflect considerable uncertainty. In Canada, consumer and business activity has exhibited some degree of recovery, but remains lower when compared to prior periods as a result of the pandemic. Despite actions taken by key oil-producing countries to reduce oversupply in the near-term, and improved credit market conditions providing sufficient liquidity to credit-worthy companies, the unfavourable economic impacts appear increasingly likely to persist to some extent well into 2021.

In late March, the company announced significant reductions in 2020 capital and operating expense spending plans. Capital and exploration expenditures in 2020 are now expected to be about $900 million, below the company’s earlier guidance of $1.1 billion to $1.2 billion. In addition, year-to-date production and manufacturing expenses are $813 million lower than the prior year, enabling the company to already surpass the full-year expense reduction target of $500 million.

The effect of COVID-19 and the current business environment on supply and demand patterns has negatively impacted Imperial’s financial and operating results in the first nine months of 2020. Industry conditions seen thus far in 2020 have led to lower realized prices for the company’s products and have resulted in substantially lower earnings and operating cash flow throughout 2020 in comparison to 2019. In response to these conditions, the company operated certain assets at reduced rates in the second and third quarters of 2020. The company advanced and extended planned maintenance and turnaround activities throughout the second and third quarters in an effort to reduce on-site staffing levels and to better balance production with demand. The turnaround activities at Kearl and Syncrude were completed in the third quarter. Refinery utilization rates and petroleum product sales were reduced through the second quarter of 2020, but improved in the third quarter due to improved product demands.


Contacts

Investor relations
(587) 476-4743

Media relations
(587) 476-7010


Read full story here

DULUTH, Minn.--(BUSINESS WIRE)--The ALLETE, Inc. (NYSE:ALE) board of directors has declared a quarterly dividend of 61.75 cents per share of common stock.


On an annual basis the dividend is equivalent to $2.47 per share, unchanged from the previous quarter.

The regular quarterly dividend is payable December 1 to common stock shareholders of record at the close of business November 16, 2020.

ALLETE, Inc. is an energy company headquartered in Duluth, Minnesota. In addition to its electric utilities, Minnesota Power and Superior Water, Light and Power of Wisconsin, ALLETE owns ALLETE Clean Energy, based in Duluth; BNI Energy, based in Bismarck, N.D.; and has an 8 percent equity interest in the American Transmission Co. More information about ALLETE is available at www.allete.com. ALE-CORP

The statements contained in this release and statements that ALLETE may make orally in connection with this release that are not historical facts, are forward-looking statements. These forward-looking statements involve risks and uncertainties and investors are directed to the risks discussed in documents filed by ALLETE with the Securities and Exchange Commission.


Contacts

Investor Contact:
Vince Meyer
218-723-3952
This email address is being protected from spambots. You need JavaScript enabled to view it.

MIDLAND, Texas--(BUSINESS WIRE)--Ring Energy, Inc. (NYSE American: REI) (“Company”) (“Ring”) stated today that the prospective buyer was unable to consummate the closing of the Company’s Delaware Basin (“Delaware”) assets located in Culberson and Reeves Counties, Texas (“Property”).


Mr. Paul McKinney, Ring’s Chief Executive Officer and Chairman of the Board of Directors, commented, “We are very disappointed that the buyer was unable to complete this important and highly anticipated transaction, but believe we have, after six (6) amendments to the original purchase and sale agreement, in good faith, provided them every opportunity to close the transaction. However, Ring has received $5.5 million in non-refundable deposits which have been used to reduce the outstanding balance on our senior credit facility. While the Delaware is not in our core areas of the Central Basin Platform or the Northwest Shelf, these assets have additional development opportunities that could ultimately lead to more value for the Ring Shareholders.”

About Ring Energy, Inc.

Ring Energy, Inc. is an oil and gas exploration, development and production company with current operations in Texas and New Mexico.
www.ringenergy.com

Safe Harbor Statement

This release contains forward-looking within the meaning of Section 27A of the Securities Act of 1933 and Section 21E of the Securities Exchange Act of 1934. Forward-looking statements involve a wide variety of risks and uncertainties, and include, without limitations, statements with respect to the Company’s strategy and prospects. Such statements are subject to certain risks and uncertainties which are disclosed in the Company’s reports filed with the SEC, including its Form 10-K for the fiscal year ended December 31, 2019, its Form 10Q for the quarter ended June 30, 2020 and its other filings with the SEC. Readers and investors are cautioned that the Company’s actual results may differ materially from those described in the forward-looking statements due to a number of factors, including, but not limited to, the Company’s ability to acquire productive oil and/or gas properties or to successfully drill and complete oil and/or gas wells on such properties, general economic conditions both domestically and abroad, and the conduct of business by the Company, and other factors that may be more fully described in additional documents set forth by the Company.


Contacts

Bill Parsons
K M Financial, Inc.
(702) 489-4447

Offshore Source Logo

Offshore Source keeps you updated with relevant information concerning the Offshore Energy Sector.

Any views or opinions represented on this website belong solely to the author and do not represent those of the people, institutions or organizations that Offshore Source or collaborators may or may not have been associated with in a professional or personal capacity, unless explicitly stated.

Corporate Offices

Technology Systems Corporation
8502 SW Kansas Ave
Stuart, FL 34997

info@tscpublishing.com