Business Wire News

CALGARY, Alberta--(BUSINESS WIRE)--Imperial Oil Limited (TSE: IMO, NYSE American: IMO) today declared a quarterly dividend of 22 cents per share on the outstanding common shares of the company, payable on January 1, 2021, to shareholders of record at the close of business on December 3, 2020.


This fourth quarter 2020 dividend compares with the third quarter 2020 dividend of 22 cents per share.

Imperial has a long and successful history of growth and financial stability in Canada as a leading member of the petroleum industry. The company has paid dividends every year for over a century and has increased its annual dividend payment for 26 consecutive years.

Source: Imperial

After more than a century, Imperial continues to be an industry leader in applying technology and innovation to responsibly develop Canada’s energy resources. As Canada’s largest petroleum refiner, a major producer of crude oil, a key petrochemical producer and a leading fuels marketer from coast to coast, our company remains committed to high standards across all areas of our business.


Contacts

Investor relations
(587) 476-4743

Media relations
(587) 476-7010

BAAR, Switzerland--(BUSINESS WIRE)--Blackstone Resources AG (SWX: BLS) Blackstone Resources AG CEO Ulrich Ernst comments today about Blackstone Resources vision and strategy and which has been confirmed by the newly released Tesla’s battery plans of Elon Musk.

Thoughts on Tesla's plans to make its own batteries

Elon Musk has acknowledged the importance of both having access to the next generation of battery technology and the raw materials needed to produce these batteries. The demand for electric cars is likely to quickly outstrip the amount of battery materials that these vehicles require, even with new technologies which aim to reduce the amount to of battery materials needed. What we saw on that day was a lag between what Tesla would like to achieve and what battery technology currently permits.

This constraint could limit the growth of the EV market if not dealt with and this would have a negative knock-on effect on Tesla. By contrast, it will also reward companies that are involved in either producing the next generation of batteries or supplying the materials needed to make them. Tesla hinted on the day that its vision was to become more vertically integrated and have better control over its supply chains in the future and might even invest in producing battery metals such as lithium.

This is exactly what Blackstone Resources strategy is and has been pursued for the last five years. In fact, the company has built it business model to accommodate this exact type of market once it emerges.

We believe that the key to being successful in the battery market is to have a presence from the battery metal to the battery cell.

Blackstone Resources started as a business by building a diversify portfolio of battery metal mining interests that covered both exploration and production projects. Two years ago, the company also launched its battery technology division and set up a subsidiary Blackstone Technology GmbH with its new 6000m2 facility in Saxony, Germany to gain access to where auto manufactures are based.

Blackstone Resources is therefore one of the first vertically integrated battery company in the world.

Tesla needs to improve the battery technology it currently uses in its vehicles

There is now a huge range of different competing companies vying to bring to market the next generation of battery technology. These companies are likely to beat Tesla when it comes to providing the next generation of technologies, which includes solid-state batteries and new advanced manufacturing techniques. This should be an issue for Tesla, which has significant access to capital and could quickly get up to speed through a targeted acquisition.

At Blackstone Resources we have already developed and tested our 3 D printed batteries that offer a significant improvement in terms of battery density, recharge cycles and costs. Furthermore, we have also developed a technology to mass-produce these batteries in 2021 in any shape or form using our own proprietary battery printing technology.

Battery metals will remain an essential component for the foreseeable future

Elon Musk believes that the next generation of batteries will use significantly less battery metals, such as cobalt but much more of nickel and lithium and so on. In reality, demand for these metals is likely to pick up significantly if Tesla and other auto manufactures want to realistically electrify their vehicle fleets.

While it is true that better battery technology can save battery metals significantly but the increase in demand will need more cobalt, nickel, manganese, graphite and lithium since the sheer demand for new electric vehicles will still vastly outstrip supply. The reason is that now large auto manufacturers are also starting to roll out their first electric vehicles and many have plans to completely electrify their entire range of cars. There will be for sure bottle necks and metal price increases.

Blackstone is aligned with Tesla on their vision

Despite the differences that we have with Tesla and its view of the world, Blackstone Resources shares much of its vision. Tesla's acknowledgement that supply chain risk poses a threat to its business model is a clear indication on the foresight Blackstone Resources had in building a vertically integrated battery company. It is Blackstone who started this vision years ago.

Overall, we are glad to see the progress that Tesla as a company has made. For us, it is an indication of what is to come, which will benefit Blackstone Resources. We look forward therefore, to the future developments that are on their way.

About Blackstone Resources AG

Blackstone Resources AG is a Swiss Holding Company, with its legal domicile in Baar, Kanton Zug, and is concentrating on the battery technology and battery metals market. In addition, it sets up, develops and manages refineries used for gold and battery metals. It offers direct exposure to the battery technology and battery metals revolution that is being driven by the demand of electric vehicles that need vast quantities of these metals. These include cobalt, manganese, graphite, nickel, copper and lithium. In addition, Blackstone Resources has started a research program on new battery technologies on solid state batteries and its production process.

The disclaimer is an integral part of this press release. Please ensure you consult the disclaimer for a full understanding of the content within: http://www.blackstoneresources.ch/investors/disclaimer/


Contacts

For more information please visit www.blackstoneresources.ch or contact:

Blackstone Resources AG
Mrs. Doris Suta
Blegistrasse 5
CH-6340 Baar
Switzerland

T: +41 41 449 61 63
F: +41 41 449 61 69
This email address is being protected from spambots. You need JavaScript enabled to view it.

Investor Relations
This email address is being protected from spambots. You need JavaScript enabled to view it.

Media Enquires
This email address is being protected from spambots. You need JavaScript enabled to view it.

ST. CROIX, U.S. Virgin Islands--(BUSINESS WIRE)--Limetree Bay Ventures, LLC (“Limetree Bay” or the “Company”), a world-class refinery, energy storage and logistics hub, today announced that it has appointed Jeffrey Rinker as its Chief Executive Officer, effective November 11, 2020. Mr. Rinker will lead the Company’s combined refinery and terminal organizations. He succeeds Brian Lever, who will remain with the Company through November 30, 2020 to ensure a smooth transition in senior leadership.

We are thrilled to welcome Jeff to Limetree Bay as CEO,” said R. Blair Thomas, Chairman of the Company’s Board of Directors and CEO of EIG Global Energy Partners, Limetree Bay’s controlling shareholder. “Limetree Bay made significant progress in 2020 and we are confident that Jeff’s deep industry experience and strong track record of delivering commercial results and creating shareholder value make him the ideal person to lead the Company during its next chapter of commercial operation.”

I am honored by the opportunity to join Limetree Bay as CEO,” said Mr. Rinker. “Limetree Bay is an exciting project that is well-positioned to succeed given its recent operating momentum, strategic location and world-class partners and facilities. I look forward to getting started and working with Limetree Bay’s talented team to drive further growth for the Company and bring value to all our stakeholders.”

On behalf of the entire Board, I’d like to thank Brian for his hard work and tremendous contributions to the growth and development of Limetree Bay during his tenure,” Mr. Thomas continued. “Brian was brought on two years ago to lead the refinery restart project and its integration with Limetree Bay’s world-class terminal facilities and, as we approached completion of the restart project, Brian and the Board agreed that it was a natural time to transition leadership to a long-term CEO. We are thankful for Brian’s efforts and wish him the best in his retirement.”

Mr. Rinker is a well-respected executive with more than 30 years of industry experience leading large, international energy businesses. He most recently served as Executive Vice President, Downstream and Midstream for Husky Energy, responsible for leadership of Husky's Downstream business, including refining, upgrading, marketing, trading and delivering improved safety, reliability and profitability. Prior to joining Husky Energy in 2017, Mr. Rinker held various roles of increasing responsibilities at OMV Group and BP plc. Mr. Rinker earned a B.S. in Chemical Engineering with honors from Carnegie Mellon University.

About Limetree Bay Ventures

Limetree Bay Ventures, LLC is a large-scale energy complex strategically located in St. Croix, U.S. Virgin Islands. The complex consists of Limetree Bay Refining, a refinery with peak processing capacity of 650 thousand barrels of petroleum feedstock per day, and Limetree Bay Terminal, a 34-million-barrel crude and petroleum products storage and marine terminal facility serving the refinery and third-party customers.

About EIG Global Energy Partners

EIG Global Energy Partners ("EIG"), is a leading institutional investor to the global energy sector with $21.9 billion under management as of September 30, 2020. EIG specializes in private investments in energy and energy-related infrastructure on a global basis. During its 38-year history, EIG has committed over $34.4 billion to the energy sector through more than 360 projects or companies in 36 countries on six continents. EIG's clients include many of the leading pension plans, insurance companies, endowments, foundations and sovereign wealth funds in the U.S., Asia and Europe. EIG is headquartered in Washington, D.C. with offices in Houston, London, Sydney, Rio de Janeiro, Hong Kong and Seoul. For additional information, please visit EIG's website at www.eigpartners.com.


Contacts

Sard Verbinnen & Co.
Kelly Kimberly / Brandon Messina
This email address is being protected from spambots. You need JavaScript enabled to view it.
(212) 687-8080

Titan, a leading cold storage owner and operator will handle the operations, marketing, and sales of the PLRS, a state-of-the-art facility & port terminal operations

LOS ANGELES--(BUSINESS WIRE)--Titan Cold Storage, LLC, a leading provider of refrigerated and cold storage solutions for the middle market, has announced a new strategic partnership with Port Logistics Refrigerated Service (PLRS), a cold storage and port terminal operations facility, located on Hooker’s Point at the Port of Tampa Bay. PLRS Powered By Titan Cold is ideally positioned to serve Central Florida and the Southeast, expansion capabilities into the Midwest by truck and CSX rail service.

PLRS is Tampa Bay’s newest, 135,000-sq.ft. facility, designed for handling large volumes of imported and exported cargo, specializing in fresh produce, proteins, and other perishable food and beverage commodities. Regional imports and exports are currently being shipped to and from Mexico, Costa Rica, and other Central American countries as well as domestic U.S. ports such as Brownsville, Texas. The facility’s temperature-controlled warehouse contains separate refrigerated / frozen rooms containing more than 6,300 gravity-fed pallet positions, 152 reefer plugs, and a fumigation building. PLRS Powered By Titan Cold is a full-service, flexible, and independent self-contained port terminal operation situated on 13.7 acres along BERTH 219 hosting two (2) high-speed Gottwald cranes and its own Radiation Portal Monitor.

Titan Cold’s well-seasoned staff are customer service driven offering the best service in the industry with rates below the major cold storage players. The facility has an on-site customs inspection area, dedicated refrigerated fumigation services, and customs lab, with the ability to expand to add ripening rooms and repacking services. It is conveniently located at Berth 219 which has a channel depth of 41’ feet and can simultaneously accommodate two large ships and barges while offering quick access to CSX railways and the I-75/275 and I-4 transportation corridor. The Tampa/Orlando I-4 Corridor is the state’s largest and fastest growing market, as well as being Florida’s distribution hub for the grocery/food and beverage sector. In addition, other Southeastern markets such as Atlanta and Charlotte are accessible by truck with one day runs, improving supply chain logistics for the Southeast United States.


Contacts

Nadene Gallagher
310.991.0230
This email address is being protected from spambots. You need JavaScript enabled to view it.

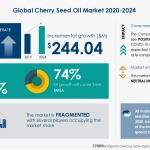
LONDON--(BUSINESS WIRE)--#CherrySeedOilMarket--The cherry seed oil market is poised to grow by USD 244.04 million during 2020-2024, progressing at a CAGR of about 4% during the forecast period.


Technavio suggests three forecast scenarios (optimistic, probable, and pessimistic) considering the impact of COVID-19. Download Free Sample Report on COVID-19 Recovery Analysis

The report on the cherry seed oil market provides a holistic update, market size and forecast, trends, growth drivers, and challenges, as well as vendor analysis.

The report offers an up-to-date analysis regarding the current global market scenario, the latest trends and drivers, and the overall market environment. The market is driven by demand for cherry seed oil in aromatherapy.

The cherry seed oil market analysis includes product segment and geography landscape. This study identifies the increasing demand for organic cherry seed oil as one of the prime reasons driving the cherry seed oil market growth during the next few years.

This report presents a detailed picture of the market by the way of study, synthesis, and summation of data from multiple sources by an analysis of key parameters

The Cherry Seed Oil Market covers the following areas:

Cherry Seed Oil Market Sizing

Cherry Seed Oil Market Forecast

Cherry Seed Oil Market Analysis

Companies Mentioned

  • Akoma International UK Ltd.
  • AvoGlow Pty. Ltd.
  • Biocosmethic, Biopurus Ltd.
  • CHATEAU Cosmetics botanical beauty
  • Interfat SAU
  • Moons Harvest Bath & Body Shop
  • Plant Guru Inc.
  • Podor Oils and Vinegars
  • Ziani Organic Oils.


Key Topics Covered:

PART 01: EXECUTIVE SUMMARY

PART 02: SCOPE OF THE REPORT

PART 03: MARKET LANDSCAPE

  • Market ecosystem
  • Market characteristics
  • Value Chain Analysis
  • Market segmentation analysis

PART 04: MARKET SIZING

  • Market definition
  • Market sizing 2019
  • Market Outlook
  • Market size and forecast 2019-2024

PART 05: FIVE FORCES ANALYSIS

  • Bargaining power of buyers
  • Bargaining power of suppliers
  • Threat of new entrants
  • Threat of substitutes
  • Threat of rivalry
  • Market condition

PART 06: MARKET SEGMENTATION BY PRODUCT

  • Market segmentation by product
  • Comparison by product
  • Conventional cherry seed oil - Market size and forecast 2019-2024
  • Organic cherry seed oil - Market size and forecast 2019-2024
  • Market opportunity by product

PART 07: CUSTOMER LANDSCAPE

PART 08: GEOGRAPHIC LANDSCAPE

  • Geographic segmentation
  • Geographic comparison
  • EMEA - Market size and forecast 2019-2024
  • Americas - Market size and forecast 2019-2024
  • APAC - Market size and forecast 2019-2024
  • Key leading countries
  • Market opportunity

PART 09: DECISION FRAMEWORK

PART 10: DRIVERS AND CHALLENGES

  • Market drivers
  • Market challenges

PART 11: MARKET TRENDS

  • Increasing demand for organic cherry seed oil
  • Expanding retail space
  • Increasing popularity of plant-based food products

PART 12: VENDOR LANDSCAPE

  • Overview
  • Landscape disruption
  • Competitive scenario

PART 13: VENDOR ANALYSIS

  • Vendors covered
  • Vendor classification
  • Market positioning of vendors
  • Akoma International UK Ltd.
  • AvoGlow Pty. Ltd.
  • Biocosmethic
  • Biopurus Ltd.
  • CHATEAU Cosmetics botanical beauty
  • Interfat SAU
  • Moons Harvest Bath & Body Shop
  • Plant Guru Inc.
  • Podor Oils and Vinegars
  • Ziani Organic Oils

PART 14: APPENDIX

  • Research methodology
  • List of abbreviations
  • Definition of market positioning of vendors

PART 15: EXPLORE TECHNAVIO

About Us

Technavio is a leading global technology research and advisory company. Their research and analysis focuses on emerging market trends and provides actionable insights to help businesses identify market opportunities and develop effective strategies to optimize their market positions. With over 500 specialized analysts, Technavio’s report library consists of more than 17,000 reports and counting, covering 800 technologies, spanning across 50 countries. Their client base consists of enterprises of all sizes, including more than 100 Fortune 500 companies. This growing client base relies on Technavio’s comprehensive coverage, extensive research, and actionable market insights to identify opportunities in existing and potential markets and assess their competitive positions within changing market scenarios.


Contacts

Technavio Research
Jesse Maida
Media & Marketing Executive
US: +1 844 364 1100
UK: +44 203 893 3200
Email: This email address is being protected from spambots. You need JavaScript enabled to view it.
Website: www.technavio.com/

SAN FRANCISCO--(BUSINESS WIRE)--CAI International, Inc. (“CAI” or the “Company”) (NYSE: CAI), one of the world’s leading transportation finance companies, today reported results for the third quarter of 2020.


Highlights

  • Net income from continuing operations attributable to CAI common stockholders for the third quarter of 2020 was $14.8 million, or $0.83 per fully diluted share.
  • Adjusted net income from continuing operations attributable to CAI common stockholders1 for the third quarter of 2020 was $18.4 million, or $1.04 per fully diluted share.
  • Container lease revenue for the third quarter of 2020 was $73.9 million, compared to $69.4 million in the second quarter of 2020.
  • CAI’s Board of Directors declared a cash dividend of $0.25 per common share payable on December 24, 2020 to shareholders of record as of December 9, 2020.
  • Average utilization for CAI’s owned container fleet during the third quarter of 2020 was 98.4%, compared to 98.0% for the second quarter of 2020. Current utilization is 99.2%.
  • During the quarter, the Company disposed of its logistics business and continues to explore opportunities to divest of its railcar leasing business.
  • In September 2020, the Company issued $742.7 million of asset-backed notes at a fixed rate averaging 2.3%. The proceeds have been used to refinance $709.4 million of asset-backed debt with an average interest rate of 4.1%.

Financial and Operating Highlights

   Three Months Ended 
  September 30,
2020
  June 30,
2020
  September 30,
2019
           
Container lease revenue

 $

            73,890


 $

            69,443


 $

            75,535


Continuing operations GAAP          
Net income (loss) attributable to common stockholders

 $

            14,758


 $

            13,749


 $

            (7,350

)

Net income per share - diluted

 $

               0.83


 $

               0.78


 $

              (0.42

)

           
Continuing operations non-GAAP 1          
Adjusted net income attributable to common stockholders

 $

            18,399


 $

            14,869


 $

            12,027


Adjusted net income per share - diluted

 $

               1.04


 $

               0.84


 $

               0.69


Return on equity (continuing operations) 2


12.5

%


10.2

%


8.3

%

           
Total container fleet size in CEUs at end of period


           1,732,547


           1,709,697


           1,737,958


Container fleet utilization at end of period


99.0

%


97.8

%


98.4

%

1 Refer to the “Reconciliation of GAAP Amounts to Non-GAAP Amounts” and “Use of Non-GAAP Financial Measures” set forth below.
2 Refer to the “Calculation of Return on Equity” set forth below.

Additional information on CAI's results, as well as comments on market trends, is available in a presentation posted today on the "Investors" section of CAI's website, www.capps.com.

Timothy Page, Interim President and Chief Executive Officer of CAI, commented, “We are very pleased with our results during the third quarter. Adjusted net income from continuing operations attributable to CAI common stockholders was $18.4 million an increase of 24% compared to the second quarter, as the Company benefited from very strong container demand.

“During the third quarter and continuing into the fourth quarter, global containerized trade volumes were ahead of the same period last year. Many shipping lines had significantly reduced the acquisition of new containers last year as a result of uncertainties surrounding the US/China trade disputes and then again in the first half of this year because of uncertainties as result of the global pandemic. Consequently, as trade volumes increased, many shipping lines were in the position of having to add container capacity well in excess of normal growth and fleet attrition. We expect this outsized demand for containers to continue well into next year.

“As global shipping volumes increased, we were able to quickly respond to our customers’ needs for additional containers. CAI’s growth in lease revenue during the quarter benefited from the lease-out of approximately $130 million of new and sale leaseback containers. Customer demand for leasing mid-life and older containers has also been strong. We have a robust forward order book and expect to take delivery of $110 million of new containers during the fourth quarter, with an additional $160 million of new containers scheduled for delivery early next year; in total $400 million of new investment since the end of the second quarter, which represents approximately 17% of our second quarter container book value. Virtually all of this new investment is supported by committed long term leases with attractive mid-teen plus returns.

“The Company continues to maintain its exceptional industry leading utilization. Average utilization in the quarter was 98.4%. Utilization was 99.1% at quarter end and is currently 99.2%. Our continuing strong performance in utilization reflects the long-term nature of our contracts, our focus on tight contract redelivery terms and ongoing fleet management; all of which underscore the long-term committed nature of our cash flow.

“Our average cash interest rate in the second quarter was 2.52%. Approximately 82% of the Company’s debt is now fixed rate. During the quarter, we issued $742.7 million of new ABS notes which carry a cash interest rate of 2.27%. These notes were primarily used to refinance $709.4 million of higher interest rate ABS notes. As a result of this refinancing we expect our average cash interest rate across all of our debt facilities will be in the range of 2.0% in the fourth quarter. The refinancing of the ABS notes is estimated to result in a $11.4 million reduction in cash interest expense in 2021.”

Mr. Page concluded, “The revenue generated from our strong order book combined with our industry-leading utilization, a robust re-sale market and lower interest costs should all result in an expected double-digit growth in net income from continuing operations in the fourth quarter and a significant increase in ROE, setting the stage for a strong beginning to 2021.”

CAI International, Inc.
Consolidated Balance Sheets
(In thousands, except share information)
(UNAUDITED)


September 30,


December 31,


2020


2019


Assets  
Current assets  
Cash  

$

15,516


$

19,870


Current portion of restricted cash  


316,915


-


Cash held by variable interest entities  


26,784


26,594


Accounts receivable, net of allowance for doubtful accounts of $418 and $7,671  
at September 30, 2020 and December 31, 2019, respectively  


65,574


72,984


Current portion of net investment in finance leases  


75,240


71,274


Prepaid expenses and other current assets  


15,746


9,606


Assets held for sale  


-


37,781


Total current assets  


515,775


238,109


Restricted cash  


23,232


26,775


Rental equipment, net of accumulated depreciation of $676,330 and $620,990  
at September 30, 2020 and December 31, 2019, respectively  


2,018,142


2,102,839


Net investment in finance leases  


455,168


496,094


Financing receivable  


51,384


30,693


Other non-current assets  


5,493


7,255


Total assets  

$

3,069,194


$

2,901,765


Liabilities and Stockholders' Equity  
Current liabilities  
Accounts payable  

$

3,868


$

4,534


Accrued expenses and other current liabilities  


26,423


25,206


Unearned revenue  


6,851


6,405


Current portion of debt  


502,013


218,094


Rental equipment payable  


89,634


25,137


Liabilities held for sale  


-


8,752


Total current liabilities  


628,789


288,128


Debt  


1,706,170


1,880,122


Derivative instruments  


1,820


-


Deferred income tax liability  


29,626


35,376


Other non-current liabilities  


3,759


4,899


Total liabilities  


2,370,164


2,208,525


Stockholders' equity  
Preferred stock, par value $.0001 per share; authorized 10,000,000  
8.50% Series A fixed-to-floating rate cumulative redeemable perpetual preferred  
stock, issued and outstanding 2,199,610 shares, at liquidation preference  


54,990


54,990


8.50% Series B fixed-to-floating rate cumulative redeemable perpetual preferred  
stock, issued and outstanding 1,955,000 shares, at liquidation preference  


48,875


48,875


Common stock: par value $.0001 per share; authorized 84,000,000 shares; issued and outstanding  
17,742,443 and 17,479,127 shares at September 30, 2020 and December 31, 2019, respectively  


2


2


Additional paid-in capital  


106,990


102,709


Accumulated other comprehensive loss  


(7,560

)


(6,630

)

Retained earnings  


495,733


493,294


Total stockholders' equity  


699,030


693,240


Total liabilities and stockholders' equity  

$

3,069,194


$

2,901,765


CAI International, Inc.
Consolidated Statements of Operations
(In thousands, except per share data)
(UNAUDITED)


Three Months Ended


Nine Months Ended


September 30,


September 30,


2020


2019


2020


2019


Revenue  
Container lease revenue  

$

73,890


$

75,535


$

212,446


$

225,332


Rail lease revenue  


5,162


5,871


17,247


20,214


Total revenue  


79,052


81,406


229,693


245,546


Operating expenses  
Depreciation of rental equipment  


30,428


28,030


86,322


89,629


Impairment of rental equipment  


-


25,632


19,724


32,955


Storage, handling and other expenses  


6,686


8,125


18,908


18,444


Gain on sale of rental equipment  


(2,729

)


(3,168

)


(6,451

)


(12,265

)

Administrative expenses  


6,388


9,278


21,441


26,501


Total operating expenses  


40,773


67,897


139,944


155,264


Operating income  


38,279


13,509


89,749


90,282


Other expenses  
Net interest expense  


16,630


23,102


54,604


70,165


Write-off of debt issuance costs  


3,641


-


3,641


-


Other (income) expense  


(306

)


380


(157

)


537


Total other expenses  


19,965


23,482


58,088


70,702


Income (loss) before income taxes  


18,314


(9,973

)


31,661


19,580


Income tax expense (benefit)  


1,349


(4,830

)


(594

)


(2,098

)

   
Income (loss) from continuing operations  


16,965


(5,143

)


32,255


21,678


Loss from discontinued operations, net of income taxes  


(1,522

)


(636

)


(18,768

)


(3,389

)

Net income (loss)  


15,443


(5,779

)


13,487


18,289


Preferred stock dividends  


2,207


2,207


6,621


6,621


Net income (loss) attributable to CAI common stockholders  

$

13,236


$

(7,986

)

$

6,866


$

11,668


Amounts attributable to CAI common stockholders  
Net income (loss) from continuing operations  

$

14,758


$

(7,350

)

$

25,634


$

15,057


Net loss from discontinued operations  


(1,522

)


(636

)


(18,768

)


(3,389

)

Net income (loss) attributable to CAI common stockholders  

$

13,236


$

(7,986

)

$

6,866


$

11,668


Net income (loss) per share attributable to  
CAI common stockholders  
Basic  
Continuing operations  

$

0.84


$

(0.42

)

$

1.47


$

0.84


Discontinued operations  


(0.09

)


(0.04

)


(1.08

)


(0.19

)

Total basic  

$

0.75


$

(0.46

)

$

0.39


$

0.65


Diluted  
Continuing operations  

$

0.83


$

(0.42

)

$

1.45


$

0.83


Discontinued operations  


(0.08

)


(0.04

)


(1.06

)


(0.19

)

Total diluted  

$

0.75


$

(0.46

)

$

0.39


$

0.64


Weighted average shares outstanding  
Basic  


17,570


17,330


17,491


17,850


Diluted  


17,706


17,330


17,664


18,122


CAI International, Inc.
Consolidated Statements of Cash Flows
(In thousands, except per share data)
(UNAUDITED)


Nine Months Ended
September 30,


2020


2019


Cash flows from operating activities  
Net income  

$

13,487


$

18,289


Loss from discontinued operations, net of income taxes  


(18,768

)


(3,389

)

Income from continuing operations  


32,255


21,678


Adjustments to reconcile income from continuing operations to net cash provided by operating activities:  
Depreciation  


86,919


89,664


Impairment of rental equipment  


19,724


32,955


Amortization and write-off of debt issuance costs  


6,839


3,579


Stock-based compensation expense  


1,416


2,202


Unrealized (gain) loss on foreign exchange  


(229

)


345


Gain on sale of rental equipment  


(6,451

)


(12,265

)

Deferred income taxes  


(5,021

)


(4,796

)

Bad debt (recovery) expense  


(6,236

)


1,319


Changes in other operating assets and liabilities:  
Accounts receivable  


11,774


4,562


Prepaid expenses and other assets  


(106

)


(40

)

Net investment in finance leases  


54,660


48,653


Accounts payable, accrued expenses and other liabilities  


214


3,541


Unearned revenue  


(437

)


(1,772

)

Net cash provided by operating activities of continuing operations  


195,321


189,625


Net cash provided by (used in) operating activities of discontinued operations  


2,883


(1,423

)

Net cash provided by operating activities  


198,204


188,202


Cash flows from investing activities  
Purchase of rental equipment  


(48,782

)


(335,849

)

Purchase of financing receivable  


(30,846

)


(37,139

)

Proceeds from sale of rental equipment  


87,007


259,002


Receipt of principal payments from financing receivable  


4,052


1,825


Purchase of furniture, fixtures and equipment  


(441

)


(1,416

)

Net cash provided by (used in) investing activities of continuing operations  


10,990


(113,577

)

Net cash provided by (used in) investing activities of discontinued operations  


5,614


(305

)

Net cash provided by (used in) investing activities  


16,604


(113,882

)

Cash flows from financing activities  
Proceeds from debt  


1,025,527


581,582


Principal payments on debt  


(915,157

)


(614,006

)

Debt issuance costs  


(8,304

)


(768

)

Proceeds from issuance of common stock  


116


-


Repurchase of common stock  


-


(34,118

)

Dividends paid to common stockholders  


(4,427

)


-


Dividends paid to preferred stockholders  


(6,621

)


(6,621

)

Exercise of stock options  


3,281


532


Net cash provided by (used in) financing activities of continuing operations  


94,415


(73,399

)

Net cash used in financing activities of discontinued operations  


-


-


Net cash provided by (used in) financing activities  


94,415


(73,399

)

Effect on cash of foreign currency translation  


(15

)


(874

)

Net increase in cash and restricted cash  


309,208


47


Cash and restricted cash at beginning of the period  


73,239


75,983


Cash and restricted cash at end of the period  

$

382,447


$

76,030


CAI International, Inc.
Fleet Data
(UNAUDITED)
 

As of September 30,

2020


2019

 
Owned container fleet in TEUs

1,622,102


1,623,588


Managed container fleet in TEUs

60,085


72,462


Total container fleet in TEUs

1,682,187


1,696,050


Owned container fleet in CEUs

1,657,067


1,649,465


Managed container fleet in CEUs

75,480


88,493


Total container fleet in CEUs

1,732,547


1,737,958


Owned railcar fleet in units

5,039


5,504


Three Months Ended


Nine Months Ended

September 30,


September 30,

2020


2019


2020


2019

Average Utilization
Container fleet utilization in CEUs

98.4

%

98.4

%

98.2

%

98.7

%

Owned container fleet utilization in CEUs

98.4

%

98.6

%

98.3

%

98.7

%

Railcar fleet utilization in units - excluding new units not yet leased

87.8

%

85.3

%

87.5

%

88.1

%

Railcar fleet utilization in units - including new units not yet leased

85.1

%

82.1

%

84.6

%

84.6

%


As of September 30,

2020


2019

Period Ending Utilization
Container fleet utilization in CEUs

99.0

%

98.4

%

Owned container fleet utilization in CEUs

99.1

%

98.5

%

Railcar fleet utilization in units - excluding new units not yet leased

88.7

%

85.3

%

Railcar fleet utilization in units - including new units not yet leased

86.1

%

82.1

%

Utilization of containers is computed by dividing the total units on lease in CEUs (cost equivalent units), by the total units in our fleet in CEUs.
The total container fleet excludes new units not yet leased and off-hire units designated for sale.
Utilization of railcars is computed by dividing the total number of railcars on lease by the total number of railcars in our fleet.
The impact on utilization of including new units not yet leased in the total railcar fleet has been included in the table above.
 
CEU is a ratio used to convert the actual number of containers in our fleet to a figure based on the relative purchase prices of our
various equipment types to that of a standard 20 foot dry van container. For example, the CEU ratio for a standard 40 foot dry van
container is 1.6, and a 40 foot high cube container is 1.7.
CAI International, Inc.
Reconciliation of GAAP Amounts to Non-GAAP Amounts
(In thousands, except per share data)
(UNAUDITED)
 

Three Months Ended

September 30,


June 30,


September 30,


2020


2020


2019


Amounts attributable to CAI common stockholders
 
Net income (loss) from continuing operations

$

14,758


$

13,749


$

(7,350

)

Write-off of debt issuance costs


3,641


432


-


Impairment of rental equipment


-


557


25,362


Tax effect of impairment of rental equipment


-


131


(5,985

)

Adjusted net income from continuing operations

$

18,399


$

14,869


$

12,027


Diluted net income (loss) per share from continuing operations

$

0.83


$

0.78


$

(0.42

)

 
Diluted adjusted net income per share from continuing operations

$

1.04


$

0.84


$

0.69


Weighted average number of common shares used to calculate
Diluted net income (loss) per share from continuing operations


17,706


17,601


17,330


Diluted adjusted net income per share from continuing operations


17,706


17,601


17,525


CAI International, Inc.
Calculation of Return on Equity
(In thousands)
(UNAUDITED)
 

Three Months Ended

September 30,


June 30,


September 30,


2020


2020


2019


Adjusted net income from continuing operations

$

18,399


$

14,869


$

12,027


Annualized adjusted net income from continuing operations


73,596


59,478


48,106


Average shareholders' equity 1

$

589,384


$

584,942


$

580,867


Return on equity


12.5

%


10.2

%


8.3

%

1 Average shareholders' equity was calculated using the quarter's beginning and ending shareholders' equity, excluding preferred stock.

Conference Call

A conference call to discuss the financial results for the third quarter of 2020 will be held on Thursday, October 29, 2020 at 5:00 p.m. ET. The dial-in number for the teleconference is 1-855-327-6837; outside of the U.S., call 1-631-891-4304. The call may be accessed live over the internet (listen only) under the “Investors” section of CAI’s website, www.capps.com, by selecting “Q3 2020 Earnings Conference Call.” A webcast replay will be available for 30 days on the “Investors” section of our website.

Earnings Presentation

A presentation summarizing our third quarter 2020 results is available on the “Investors” section of our website, www.capps.com.

Use of Non-GAAP Financial Measures

This press release contains non-GAAP financial measures, and includes net income and earnings per share adjusted to reflect the impact of a non-recurring write-off of debt issuance costs, the impairment of rental equipment and the tax effects of such impairment. This press release also refers to return on equity, which is calculated using the non-GAAP financial measure, adjusted net income. These measures are not in accordance with, or an alternative for, generally accepted accounting principles, or GAAP, and may be different from non-GAAP financial measures used by other companies. We believe the presentation of non-GAAP financial measures provides useful information to management and investors regarding various financial and business trends relating to our financial condition and results of operations, and that when GAAP financial measures are viewed in conjunction with non-GAAP financial measures, investors are provided with a more meaningful understanding of our ongoing operating performance. Management utilizes return on equity in evaluating how much profit the Company generates on the shareholders’ equity in the Company and believes it is useful for comparing the profitability of companies in the same industry. Non-GAAP financial measures are not intended to be considered in isolation or as a substitute for GAAP financial measures. To the extent this release contains historical non-GAAP financial measures, we have also provided a reconciliation to the corresponding GAAP financial measures for comparative purposes.

About CAI International, Inc.

CAI is one of the world’s leading transportation finance companies. As of September 30, 2020, CAI operated a worldwide fleet of approximately 1.7 million CEUs of containers, and owned a fleet of 5,039 railcars that it leases within North America. CAI operates through 14 offices located in 12 countries including the United States.

Forward-Looking Statements

This press release contains forward-looking statements regarding future events and the future performance of CAI, including but not limited to: management’s business outlook for the container leasing business, management’s decision to divest of CAI’s non-core businesses and management's outlook for growth of CAI’s leasing investments. These statements and others herein are forward-looking statements within the meaning of the safe harbor provisions of Section 21E of the Securities Exchange Act of 1934, as amended, and involve risks and uncertainties that could cause actual results of operations and other performance measures to differ materially from current expectations including, but not limited to: utilization rates, expected economic conditions, expected growth of international trade, availability of credit on commercially favorable terms or at all, customer demand, container investment levels, container prices, lease rates, increased competition, volatility in exchange rates, growth in world trade and world container trade, the ability of CAI to convert letters of intent with its customers to binding contracts, potential to sell CAI’s securities to the public and others.

CAI refers you to the documents that it has filed with the Securities and Exchange Commission, including its Annual Report on Form 10-K for the year ended December 31, 2019, its Quarterly Reports on Form 10-Q and its Current Reports on Form 8-K. These documents contain additional important factors that could cause actual results to differ from current expectations and from forward-looking statements contained in this press release. Furthermore, CAI is under no obligation to (and expressly disclaims any such obligation to) update or alter any of the forward-looking statements contained in this press release whether as a result of new information, future events or otherwise, unless required by law.


Contacts

Tim Page, Interim President and Chief Executive Officer
(415) 788-0100
This email address is being protected from spambots. You need JavaScript enabled to view it.

  • Waste Management’s Acquisition of Advanced Disposal Combines Dedicated and Experienced Teams with Shared Commitments to Safety, Outstanding Customer Service and Operational Excellence
  • Waste Management Continues to be Confident in the Long-Term Value from the Acquisition and Expects Annual Cost and Capital Expenditure Synergies to Exceed $100 Million

HOUSTON--(BUSINESS WIRE)--Waste Management (NYSE: WM) announced today that it completed its acquisition of all outstanding shares of Advanced Disposal on October 30, following the receipt of required regulatory approvals. The previously announced purchase price of $30.30 per share in cash represents a total enterprise value of $4.6 billion when including approximately $1.8 billion of Advanced Disposal’s net debt. Advanced Disposal stock will no longer be traded on the NYSE.


This acquisition grows Waste Management’s footprint and allows the Company to deliver unparalleled access to differentiated, sustainable waste management and recycling services to approximately 3 million new commercial, industrial and residential customers primarily located in 16 states in the eastern half of the United States.

“We are excited to reach the finish line on this compelling acquisition, and I would like to welcome the Advanced Disposal team members to the WM family,” said Jim Fish, President and Chief Executive Officer of Waste Management. “The acquisition expands Waste Management’s reach and positions us for significant earnings and cash flow growth. The hard work our integration teams have done has prepared us to provide a seamless transition for employees and customers.”

Immediately following the completion of the Advanced Disposal acquisition, Waste Management and Advanced Disposal completed the sale to GFL Environmental of all of the assets required by the U.S. Department of Justice to be divested in connection with the Advanced Disposal acquisition.

Waste Management funded the transaction using a combination of credit facilities and commercial paper. Waste Management expects to maintain a strong balance sheet and solid investment-grade credit profile with leverage ratios well within the financial covenants of its credit facilities.

“With integration getting underway, the team is focused on a strong finish to 2020,” Fish concluded. “We look forward to providing our 2021 outlook for the combined organization when we announce fourth quarter and full-year earnings.”

ABOUT WASTE MANAGEMENT

Waste Management, based in Houston, Texas, is the leading provider of comprehensive waste management environmental services in North America. Through its subsidiaries, Waste Management provides collection, transfer, disposal services, and recycling and resource recovery. It is also a leading developer, operator and owner of landfill gas-to-energy facilities in the United States. Waste Management’s customers include residential, commercial, industrial, and municipal customers throughout North America. To learn more information about Waste Management, visit www.wm.com.

CAUTIONARY STATEMENT REGARDING FORWARD-LOOKING STATEMENTS

This press release contains “forward-looking statements” within the meaning of the U.S. federal securities laws about Waste Management, including but not limited to all statements about integration of the acquisition and all outcomes of the acquisition, including future operations, synergies, cost savings, and impact on earnings, cash flow, revenue, return on capital, shareholder returns, strength of the balance sheet and credit ratings; future capital allocation; and future leverage ratio, which are made pursuant to the safe harbor provisions of the Private Securities Litigation Reform Act of 1995. Words such as “expect,” “likely,” “outlook,” “forecast,” “preliminary,” “would,” “could,” “should,” “can,” “will,” “project,” “intend,” “plan,” “goal,” “guidance,” “target,” “continue,” “sustain, “ “synergy,” “on track,” “believe,” “seek,” “estimate,” “anticipate,” “may,” “possible,” “assume,” and variations of such words and similar expressions are intended to identify such forward-looking statements. Potential investors, stockholders, and other readers should view these statements with caution and should not place undue reliance on such statements. They are based on the facts and circumstances known to Waste Management as of the date the statements are made. These forward-looking statements are subject to risks and uncertainties that could cause actual results to be materially different from those set forth in such forward-looking statements, including but not limited to, general economic and capital markets conditions; public health risk and other impacts of COVID-19 or similar pandemic conditions, including increased costs, social and commercial disruption, service reductions and other adverse effects on business, financial condition, results of operations and cash flows; legal proceedings that may be instituted related to the acquisition; unexpected costs, charges or expenses; failure to successfully integrate the acquisition, realize anticipated synergies or obtain the results anticipated; and other risks and uncertainties described in Waste Management’s filings with the SEC, including Part I, Item 1A of its most recently filed Annual Report on Form 10-K and subsequent reports on Form 10-Q, which are incorporated herein by reference, and in other documents that Waste Management shall file or furnish with the SEC. Except to the extent required by law, Waste Management does not assume any obligation to update any forward-looking statement, including financial estimates and forecasts, after it has been made, whether as a result of new information, future events, circumstances or developments or otherwise.


Contacts

Waste Management

Web site
https://www.wm.com

Analysts
Ed Egl
713.265.1656
This email address is being protected from spambots. You need JavaScript enabled to view it.

Media
Janette Micelli
602.579.6152
This email address is being protected from spambots. You need JavaScript enabled to view it.

SEATTLE--(BUSINESS WIRE)--Amazon.com, Inc. (NASDAQ: AMZN) today announced financial results for its third quarter ended September 30, 2020.


  • Operating cash flow increased 56% to $55.3 billion for the trailing twelve months, compared with $35.3 billion for the trailing twelve months ended September 30, 2019.
  • Free cash flow increased to $29.5 billion for the trailing twelve months, compared with $23.5 billion for the trailing twelve months ended September 30, 2019.
  • Free cash flow less principal repayments of finance leases and financing obligations increased to $18.4 billion for the trailing twelve months, compared with $14.6 billion for the trailing twelve months ended September 30, 2019.
  • Free cash flow less equipment finance leases and principal repayments of all other finance leases and financing obligations increased to $17.9 billion for the trailing twelve months, compared with $10.5 billion for the trailing twelve months ended September 30, 2019.
  • Common shares outstanding plus shares underlying stock-based awards totaled 518 million on September 30, 2020, compared with 511 million one year ago.
  • Net sales increased 37% to $96.1 billion in the third quarter, compared with $70.0 billion in third quarter 2019. Excluding the $691 million favorable impact from year-over-year changes in foreign exchange rates throughout the quarter, net sales increased 36% compared with third quarter 2019.
  • Operating income increased to $6.2 billion in the third quarter, compared with operating income of $3.2 billion in third quarter 2019.
  • Net income increased to $6.3 billion in the third quarter, or $12.37 per diluted share, compared with net income of $2.1 billion, or $4.23 per diluted share, in third quarter 2019.

Two years ago, we increased Amazon’s minimum wage to $15 for all full-time, part-time, temporary, and seasonal employees across the U.S. and challenged other large employers to do the same. Best Buy and Target have stepped up, and we hope other large employers will also make the jump to $15. Now would be a great time,” said Jeff Bezos, Amazon founder and CEO. “Offering jobs with industry-leading pay and great healthcare, including to entry-level and front-line employees, is even more meaningful in a time like this, and we’re proud to have created over 400,000 jobs this year alone. We’re seeing more customers than ever shopping early for their holiday gifts, which is just one of the signs that this is going to be an unprecedented holiday season. Big thank you to our employees and selling partners around the world who’ve been busy getting ready to deliver for customers this holiday.”

Highlights

Investing in Jobs and Employees

  • Amazon announced that it is creating hundreds of thousands of new jobs around the world for people at all skill levels and stages of their careers, including:
    • 100,000 new permanent jobs with industry-leading pay of at least $15 per hour, benefits starting on day one, sign-on bonuses of up to $1,000 in select U.S. cities, and access to company-subsidized upskilling programs like Career Choice. This hiring was part of Amazon opening 100 new operations buildings across North America.
    • 100,000 new seasonal jobs with Amazon Air, logistics, fulfillment centers, sortation centers, and global specialty fulfillment teams in the U.S. and Canada.
    • 10,000 corporate and technology jobs in Bellevue, WA as part of the continued expansion of Amazon’s Puget Sound headquarters, and 7,000 new jobs at Tech Hubs in Dallas, Detroit, Denver, New York, Phoenix, San Diego, Toronto, and Vancouver.
    • 10,000 new permanent jobs in the UK, bringing the total in the country to 40,000; and thousands of new permanent jobs in Germany, bringing the total in the country to 16,000.
    • In India, Amazon announced the expansion of its operations network with 10 new fulfillment centers, 5 new sortation centers, nearly 200 delivery stations, and over 100,000 seasonal jobs to help meet customer demand during the festive season. The company also launched an all-women delivery station in the state of Gujarat – the second of its kind in the country and part of the company’s ongoing efforts to provide more opportunities for women to build careers at Amazon.
  • More than 320,000 people attended Amazon’s Career Day, a virtual event that provided insights, tips, and advice to job seekers on how to build their career and apply for more than 130,000 corporate, technology, and operations positions available at Amazon in North America. Amazon received a record 384,000 applications for roles in Canada and the U.S. within a week of announcing the event.
  • Amazon has promoted more than 35,000 people across its U.S. operations network this year, and more than 30,000 people have participated in Career Choice, an innovative program to upskill employees interested in pursuing a future outside Amazon. Over half of the tens of thousands of program participants this year are from underrepresented minority groups.
  • Amazon Studios and Howard University announced they will partner for a second year of the Howard Entertainment Program, which aims to further diversify the entertainment industry by creating a pipeline of underrepresented talent, including Black students, through internships and other educational opportunities.
  • Amazon continues to ramp up its in-house COVID-19 testing program to keep front-line employees safe, with capacity reaching 50,000 tests a day across 650 sites by November.
  • Amazon was named to multiple leading rankings and awards, including: #2 on the Forbes World’s Best Employers, a survey of workers on satisfaction with their employers’ COVID-19 response, talent development, gender equality, social responsibility, and more; #3 on the Axios Harris Poll 100, Amazon’s eighth year in a row in the top 3 of this brand reputation survey; and #4 on Morning Consult’s Most Loved Brands in America, a measure of favorability, trust, and community impact.

Supporting Communities

  • Amazon announced plans to add more than 3,000 new schools to Amazon Future Engineer, a four-part program that funds high-quality, age-appropriate computer science curriculum for students and professional development for teachers. With the addition of these new schools, Amazon Future Engineer will expand to reach over 550,000 K-12 students across more than 5,000 elementary, middle, and high schools in underserved communities.
  • Amazon donated more than one million emergency aid items, including water, generators, air filters, food, KN95 masks, and cleaning supplies, to community partners providing disaster relief to people affected by wildfires in California, Oregon, and Washington, as well as Hurricane Laura along the Gulf Coast.
  • Amid the COVID-19 pandemic, Amazon expanded its Right Now Needs Fund in the Puget Sound region and launched a new fund focused on Northern Virginia. The $3.5 million donation will provide students located near Amazon’s two headquarters with immediate access to food, shelter, clothing, school supplies, and more to help eliminate barriers to learning and ensure students can focus on education throughout the school year.
  • To support communities disproportionately impacted by COVID-19, Amazon announced it will make millions of dollars in product and monetary donations to more than a thousand charities this holiday season in Australia, Canada, China, France, Germany, India, Italy, Japan, Singapore, Spain, the UK, the U.S., and more.

Protecting the Planet

  • Mercedes-Benz, Best Buy, McKinstry, Real Betis, Schneider Electric, and Siemens signed The Climate Pledge, a commitment co-founded by Amazon and Global Optimism to achieve net-zero carbon by 2040, a decade ahead of the Paris Agreement.
  • CarbonCure, Pachama, Redwood Materials, Rivian, and Turntide Technologies were the first companies to receive investments from Amazon as part of The Climate Pledge Fund, a $2 billion fund that invests in visionary companies whose product and service solutions will facilitate the transition to a zero-carbon economy.
  • In Europe, Amazon announced it will add 1,800 electric delivery vehicles from Mercedes-Benz Vans to its delivery fleet—the largest order of electric vehicles from Mercedes-Benz Vans to date.
  • Amazon unveiled its first custom electric delivery vehicle, designed and built in partnership with Rivian. The new vehicles will make their first deliveries to Amazon customers in 2021. As early as 2022, there will be 10,000 of these vehicles on roads in the U.S. and EU, and all 100,000 vehicles are expected to be on the road by 2030.
  • In the U.S. and EU, Amazon launched Climate Pledge Friendly, a new program that identifies products with one or more of 19 different sustainability certifications, making it easy for customers to discover and shop for more sustainable products in Amazon’s store. Products identified as Climate Pledge Friendly meet standards that help preserve the natural world, such as reducing the carbon footprint of shipments to customers. Amazon also announced Compact by Design, a new sustainability certification for products with a more efficient design that leads to carbon emission reductions by requiring less packaging or less frequent purchases by customers.
  • Amazon announced its most sustainable devices ever. The new Echo and Fire TV devices include 100% post-consumer recycled fabric, 100% recycled die-cast aluminum, and 30-50% post-consumer recycled plastic, and new features like Low Power Mode and an energy dashboard will enable customers to understand and reduce the energy consumption of their devices.
  • Amazon is building new wind and solar farms to produce clean energy equivalent to the electricity used by every customer’s Echo device. The company has said it will continue building new renewable energy projects until it accounts for the energy consumption of all Amazon devices.
  • Amazon announced its first operational wind farm outside the U.S. in Bäckhammar, Sweden. The wind farm is expected to deliver 280,000-megawatt hours of clean energy annually into the Swedish grid.

Empowering Small and Medium-Sized Businesses

  • Amazon hosted Amazon Accelerate, its largest-ever U.S. event to share best practices with small businesses on how to serve customers in Amazon’s store and grow their businesses. At the virtual event, Amazon also announced plans to invest billions of dollars to help small and medium-sized businesses succeed, and it outlined plans to onboard an additional 100,000 small and medium-sized businesses in the next year.
  • Amazon hosted its second annual Ignite Digital Festival for more than 1,500 Delivery Service Partners (DSP). The virtual event showcased product and technology innovations to help them succeed, including over 250 logistics program and product changes, from routing updates and navigation improvements on the drivers’ delivery app to state-of-the-art safety technology adjustments. Since the DSP program launched over two years ago, there are now more than 1,700 owners across Canada, Germany, Spain, the UK, and the U.S. who have created over 100,000 jobs in their communities, delivered more than 2.2 billion packages worldwide, and generated over $5 billion in revenue for their small businesses.
  • Amazon India hosted Stand for Handmade, a 10-week program to help boost sales for Indian artisans, weavers, and women entrepreneurs by waiving selling fees and promoting local, handmade products to customers. Participating Karigar (artisans) and Saheli (women) sellers more than doubled their sales during this period, and more than 200 new sellers joined the Karigar program.
  • Amazon Australia launched Amazon Launchpad Innovation Grants, an initiative to celebrate innovation by Australian start-ups, entrepreneurs, and small and medium-sized businesses. The program will offer grant packages to organizations with innovative products that support Australians through the pandemic.

Shopping and Entertainment

  • In 19 countries, Amazon’s Prime Day kicked-off the holiday shopping season on October 13-14 with the two biggest days ever for small and medium businesses in Amazon’s stores. Third-party sellers—most of which are small and medium-sized businesses—surpassed $3.5 billion in sales on Prime Day—a nearly 60% year-over-year increase, growing even more than Amazon’s retail business. Prime members saved more than $1.4 billion, taking advantage of deep discounts and incredible deals over the two-day event.
  • Amazon India kicked off the Great Indian Festival on October 17, a month-long celebration with deals across popular categories such as smartphones, appliances, televisions, and consumer electronics. Sellers and brand partners experienced the biggest two days of sales in the festival’s history. Amazon India also hosted Prime Day on August 6-7, during which twice as many customers became Prime members compared to the previous year.
  • Amazon launched Prime in Turkey, bringing the total number of countries with Prime to 20. Prime in Turkey includes free, fast delivery on thousands of items across 20 categories, as well as access to Prime Video, Prime Gaming, and exclusive deals on Prime Day and throughout the year.
  • Amazon.se launched in Sweden, offering customers more than 150 million products to choose from with everyday low prices and free delivery for eligible orders above SEK 229.
  • Amazon announced that Project Zero—a tool enabling brands to remove potential counterfeit products in Amazon’s store—is available in 17 countries around the world, with Australia, Brazil, the Netherlands, Saudi Arabia, Singapore, Turkey, and the UAE recently added to the program. Project Zero combines Amazon’s advanced technology and machine learning with the sophisticated knowledge that brands have of their own intellectual property to drive counterfeits to zero.
  • Amazon launched Amazon One, a fast, convenient, contactless way for people to use their palm to enter, identify, and pay. The highly-secure service uses custom-built algorithms and hardware to create a person’s unique palm signature. Amazon One is currently available in two Amazon Go stores in Seattle, with plans to expand to additional Amazon stores.
  • The first Amazon Fresh grocery stores opened in Woodland Hills and Irvine, CA. Amazon Fresh offers a seamless grocery shopping experience whether customers are shopping in-store or online, consistently low prices, a wide assortment of national brands and freshly prepared foods made daily, and free same-day delivery and pick-up for Prime members. The stores also offer new ways to make grocery shopping more convenient, including the Amazon Dash Cart, which enables customers to skip the checkout line, and new Alexa features to help customers manage their shopping lists and better navigate aisles.
  • Amazon Fashion announced the launch of Luxury Stores, a new shopping experience for eligible U.S. Prime members, offering established and emerging luxury fashion and beauty brands.
  • The Amazon Studios global original movies slate continues to grow, with additions such as Sacha Baron Cohen’s political satire Borat Subsequent Moviefilm, which recently launched globally on Prime Video, as well as Tom Clancy’s Without Remorse, starring Michael B. Jordan, slated to launch in 2021.
  • Amazon premiered several new and returning Amazon Original series, including The Boys, Breathe into the Shadows, Bandish Bandits, Mirzapur, and Putham Pudhu Kaalai in India, Peep Time and Documental S8 in Japan, Pan y Circo in Mexico, and All or Nothing: Tottenham Hotspur in the UK.
  • Amazon Prime Video announced that live international rugby games will be exclusively available to UK Prime customers this winter with a brand new tournament called the Autumn Nations Cup. The tournament will feature the Six Nations (England, France, Ireland, Italy, Scotland, and Wales) as well as two guest teams from Fiji and Georgia.
  • Amazon Music announced multiple new services and features, including partnering with Twitch to add livestreaming to the Amazon Music app, enabling fans to engage with artists in brand-new ways and move seamlessly between livestreams and recorded music; launching podcasts for customers in Germany, Japan, the UK, and the U.S., across all tiers of service at no additional cost; and expanding its HD streaming tier to Canada, France, Italy, and Spain.
  • Amazon announced the launch of Prime Gaming, a new service that lets Prime members enjoy free, exclusive content for their favorite PC, console, and mobile games, plus a collection of PC games for free every month. Prime Gaming is included with Prime memberships and Prime Video subscriptions in over 200 countries and territories.

Amazon Devices and Alexa

  • Amazon introduced a reimagined family of Echo devices. The new Echo combines the best of Echo and Echo Plus into a single device with an all-new design, built-in smart home hub, and more powerful speakers; Echo Dot and Echo Dot with Clock feature a powerful speaker packed into a compact design; Echo Dot Kids Edition comes in Panda and Tiger designs with even more features for kids to enjoy; and the all-new Echo Show 10 now features a brilliant 10-inch, adaptive HD display that automatically moves to stay in view as you interact with Alexa.
  • Amazon announced the new Fire TV Stick and Fire TV Stick Lite. Customers have purchased over 100 million Fire TV devices globally, and Fire TV customers are streaming billions of hours each month. The new Fire TV devices are 50% more powerful while using 50% less power than the previous Fire TV Stick. Amazon also introduced a redesigned Fire TV experience that provides new content-discovery features, enhanced Alexa voice integration, and user profiles for personalized recommendations.
  • Amazon announced new ways for customers to connect their devices with Amazon Sidewalk, a shared network that helps devices like Amazon Echo, Ring Security Cams, outdoor lights, and motion sensors work better at home and beyond the front door.
  • Amazon announced the latest AI advancements that make Alexa more natural, conversational, and useful. These advancements include a new teaching capability that helps Alexa get smarter by asking questions to fill gaps in her understanding, and natural turn-taking that will allow customers to interact with Alexa at their own pace without using a wake word, even when multiple people are talking.
  • Amazon introduced new features and services that continue to make Alexa smarter, like Guard Plus and the Care Hub, that help customers keep their homes and loved ones safe. Amazon also announced new Alexa privacy controls including the option for customers to not save voice recordings or simply say, “Alexa, delete everything I’ve said” to delete their voice history. Amazon expanded Alexa Calling and Messaging capabilities to help customers stay connected with the addition of group calling and integrations with Zoom and Amazon Chime. AT&T customers can also link eligible mobile numbers to make and receive hands-free calls with Alexa.
  • Amazon announced customers have connected more than 100 million smart home devices to Alexa, and introduced smart home features like additional Hunches, that let customers choose to have Alexa proactively act on their behalf.
  • Amazon introduced new devices and features to help kids and families learn, stay connected, and have fun together. Kids can now make Alexa Announcements with their Fire Kids Edition Tablets, help build reading fluency with Reading Sidekick, and enjoy a custom-built kids experience with the new Echo Dot Kids Edition.
  • Amazon announced Amazon Halo, a new service dedicated to helping customers improve their health and wellness. Amazon Halo combines a suite of AI-powered health features that provide actionable insights into overall wellness via the new Amazon Halo app with the Amazon Halo Band, which uses multiple advanced sensors to provide the information necessary to power Halo insights.
  • Amazon announced Luna, a new cloud gaming service that allows customers to play high-quality games on devices they already own. As part of early access, players will have access to more than 100 games through the Luna+ game channel and Ubisoft channel, with more games to come. Luna is built on AWS and harnesses the power of the industry’s broadest and deepest cloud platform. Amazon also announced Luna Controller, which is Alexa-enabled and connects directly to the cloud for lower latency gaming. Luna will be available on Fire TV, PC, and Mac as well as on web apps for iPhone and iPad, with Android coming soon.
  • Ring announced several new products and features, including a new category of devices for the car (Ring Car Alarm, Ring Car Cam, Ring Car Connect API, and Ring Car Connect for Tesla), the autonomous flying indoor security camera Ring Always Home Cam, and a new Mailbox Sensor.
  • Amazon announced new eero Pro 6 and eero 6 mesh wifi systems that feature Wi-Fi 6 support for faster speeds, higher performance, and better support for simultaneous connected devices.
  • Amazon continues to support developers and startups with new Alexa tools and features, investments, and programs. Amazon announced that Dolby, Facebook, Garmin, and Xiaomi have joined the Voice Interoperability Initiative, a program to ensure voice-enabled products provide customers with choice and flexibility through multiple, interoperable voice services. The Alexa Fund invested in health and fitness companies Tonal and Zwift; enterprise AI company Fiddler Labs; maker of smart sensor chips Aspinity; and creators of personalized sound environments Endel. The investments are in addition to the launch of two new programs in collaboration with Blavity’s AfroTech World and All Raise to support underrepresented founders.
  • The Federal Communications Commission voted unanimously to approve Project Kuiper, a low earth orbit satellite constellation capable of providing reliable, affordable broadband to unserved and underserved communities around the world. Amazon will invest more than $10 billion in the initiative, creating jobs and infrastructure around the U.S. that will enable the team to deliver on its vision for the project.
  • Blink launched Blink Indoor and Outdoor, two new wireless smart home security cameras that offer two-year battery life, HD video, new privacy zones features, and local or cloud storage options for saved clips. Cameras are available for purchase in Canada, France, Germany, Italy, Netherlands, Spain, the UK, and the U.S.

Amazon Web Services

  • AWS announced significant customer momentum with new commitments and migrations, including: leading payments technology company Global Payments, to manage issuer processing and handling of their approximately 27 billion transactions processed annually; biotechnology company Moderna, to accelerate the development of messenger RNA medicines to prevent and fight diseases, including a vaccine candidate against COVID-19; restaurant chain Jack in the Box to enhance digital ordering, dining, and customer service experiences for its guests and to drive operational efficiency across its more than 2,200 restaurants; premier visual effects company Weta Digital to accelerate rendering of graphical visual effects, free up talent and resources, and deliver on its multi-year movie slate; leading job site Indeed to migrate more than 30 petabytes of data to AWS, reducing its global data center footprint by 40% while streamlining its IT operations; household appliance manufacturer Arçelik to use analytics, IoT, and machine learning services to build smart factories, automated production lines, and cloud connected appliances; IT services company and AWS Partner Network (APN) Premier Consulting Partner DXC Technology to replace its legacy contact center technology and drive automation, cutting operational costs by 40%, reducing volume of common calls by up to 60%, and migrating 1,000 service desk seats; hotel franchise Best Western International to migrate largest contact center within one month and move all agents to remote within one week, enabling seamless support for 14 languages in over 35 countries while reducing costs by 40%; and cold chain provider Carrier to transform how temperature-sensitive goods such as food, medicines, and vaccines are moved around the world by enhancing safety, reliability, and efficiency.

Contacts

Amazon Investor Relations
Dave Fildes, This email address is being protected from spambots. You need JavaScript enabled to view it.
amazon.com/ir

Amazon Public Relations
Dan Perlet, This email address is being protected from spambots. You need JavaScript enabled to view it.
amazon.com/pr


Read full story here

COLUMBUS, Ind.--(BUSINESS WIRE)--Today, Cummins Inc. (NYSE: CMI) announced the launch of Cummins Advocating for Racial Equity (CARE). CARE is another step forward in Cummins’ intent to take a leading role in undoing systemic discrimination against the Black community in the U.S.


“Institutional racism is a disease; deeply rooted and longstanding, and makes our society weaker,” said Tom Linebarger, Chairman and CEO, Cummins Inc. “It will take decisive and sustained action to dismantle racism, and Cummins will be part of that action. We are in the midst of a national reckoning on race, and we need awareness, education and accountability to drive results. It’s the right thing to do and we will all benefit when we are cured of this disease.”

The creation of CARE is the first step in Cummins’ effort to undo systemic discrimination; and since its creation in July, the company has developed strategies and initiated work in four identified areas:

  • Achieve police reform
  • Realize criminal justice reform
  • Create economic empowerment by building Black wealth and income
  • Drive social justice reform in healthcare, housing, workforce development and civil rights, including voting rights and education

“Our core value of Diversity and Inclusion demands we recognize and value our differences,” Linebarger added. “Our value of Integrity drives us to do what is right and act against injustice; through CARE, we are focusing our efforts to end racial injustice in selected communities where Cummins has operations.”

“We are using impact assessment tools to select work that will generate meaningful change with measurable results specific to each community,” added Linebarger. He added the company has already begun work and making progress in all four of the focus areas including:

  • In Indianapolis, Cummins recently joined forces with Eli Lilly and Company, Roche Diagnostics, the Indianapolis Urban League, the local American Civil Liberties Union and other Indianapolis business and community organizations, and successfully advocated for the establishment of a first-of-its-kind majority civilian General Orders Board that has the power to create policies and procedures that determine the manner in which policing is conducted in Indianapolis.
  • Cummins will launch four new Technical Education for Communities (TEC) workforce development programs. Two programs will be created in Nashville, Tennessee; one in Charleston, South Carolina; and one in Memphis, Tennessee. Each of the TEC sites will be focused on creating educational pathways for Black residents to good, living wage jobs in transportation, logistics and other industries.
  • Investing in current and future Black-owned suppliers by using Cummins’ industry influence to support their growth and sustainability.
  • Cummins has committed $250,000 towards an Indianapolis Urban League initiative to invest in Black-owned businesses and entrepreneurship, in partnership with Eli Lilly and Company.

As Cummins continues to move forward with CARE, the company will be providing updates on its progress to its employees and communities.

About Cummins Inc.

Cummins Inc., a global power leader, is a corporation of complementary business segments that design, manufacture, distribute and service a broad portfolio of power solutions. The company’s products range from diesel, natural gas, electric and hybrid powertrains and powertrain-related components including filtration, aftertreatment, turbochargers, fuel systems, controls systems, air handling systems, automated transmissions, electric power generation systems, batteries, electrified power systems, hydrogen generation and fuel cell products. Headquartered in Columbus, Indiana (U.S.), since its founding in 1919, Cummins employs approximately 61,600 people committed to powering a more prosperous world through three global corporate responsibility priorities critical to healthy communities: education, environment and equality of opportunity. Cummins serves its customers online, through a network of company-owned and independent distributor locations, and through thousands of dealer locations worldwide and earned about $2.3 billion on sales of $23.6 billion in 2019. See how Cummins is powering a world that’s always on by accessing news releases and more information at https://www.cummins.com/always-on.


Contacts

Jon Mills
Cummins Inc.
Phone: 317-658-4540
Email: This email address is being protected from spambots. You need JavaScript enabled to view it.

Revenues increased six percent year-over-year to $121.1 million; GAAP earnings were $0.24 per diluted share; non-GAAP earnings were $0.40 per diluted share

SAN JOSE, Calif.--(BUSINESS WIRE)--Power Integrations (Nasdaq: POWI) today announced financial results for the quarter ended September 30, 2020. Net revenues for the third quarter were $121.1 million, up 13 percent compared to the prior quarter and up six percent from the third quarter of 2019. Net income for the third quarter was $14.8 million or $0.24 per diluted share compared to $0.22 per diluted share in the prior quarter and $0.29 per diluted share in the third quarter of 2019. (Per-share measures for all periods have been adjusted for the 2:1 stock split effected as a stock dividend in August 2020.) Cash flow from operations for the third quarter was $16.2 million.


In addition to its GAAP results, the company provided certain non-GAAP measures that exclude stock-based compensation, amortization of acquisition-related intangible assets and the tax effects of these items. Non-GAAP net income for the third quarter of 2020 was $24.2 million or $0.40 per diluted share compared with $0.33 per diluted share in the prior quarter and $0.39 per diluted share in the third quarter of 2019. A reconciliation of GAAP to non-GAAP financial results appears at the end of this press release.

Commented Balu Balakrishnan, president and CEO of Power Integrations: “Third-quarter revenues exceeded our expectations as we saw continued growth in fast charging for mobile devices as well as improved demand from the appliance market. Distribution sell-through strengthened considerably compared to the prior quarter, and we expect healthy sequential revenue growth in the fourth quarter. At the midpoint of our fourth-quarter revenue range, we would achieve double-digit revenue growth for the full year.”

Power Integrations paid a cash dividend of $0.11 per share (post-split) on September 30, 2020. The company will pay another dividend of $0.11 per share on December 31, 2020 to stockholders of record as of November 30, 2020.

Financial Outlook

The company issued the following forecast for the fourth quarter of 2020:

  • Revenues are expected to be $130 million plus or minus $5 million.
  • GAAP gross margin is expected to be approximately 49 percent, and non-GAAP gross margin is expected to be approximately 50 percent. (The difference between the expected GAAP and non-GAAP gross margins comprises approximately 0.6 percentage points from amortization of acquisition-related intangible assets and 0.4 percentage points from stock-based compensation.)
  • GAAP operating expenses are expected to be approximately $45 million; non-GAAP operating expenses are expected to be approximately $37 million. (Non-GAAP expenses are expected to exclude approximately $7.8 million of stock-based compensation and $0.2 million of amortization of acquisition-related intangible assets.)

Conference Call Today at 1:30 p.m. Pacific Time

Power Integrations management will hold a conference call today at 1:30 p.m. Pacific time. Members of the investment community can register for the call by visiting the following link: http://www.directeventreg.com/registration/event/5339866. A webcast of the call will also be available on the investor section of the company's website, http://investors.power.com.

About Power Integrations

Power Integrations, Inc. is a leading innovator in semiconductor technologies for high-voltage power conversion. The company’s products are key building blocks in the clean-power ecosystem, enabling the generation of renewable energy as well as the efficient transmission and consumption of power in applications ranging from milliwatts to megawatts. For more information please visit www.power.com.

Note Regarding Use of Non-GAAP Financial Measures

In addition to the company's consolidated financial statements, which are presented according to GAAP, the company provides certain non-GAAP financial information that excludes stock-based compensation expenses recorded under ASC 718-10, amortization of acquisition-related intangible assets, and the tax effects of these items. The company uses these measures in its financial and operational decision-making and, with respect to one measure, in setting performance targets for compensation purposes. The company believes that these non-GAAP measures offer important analytical tools to help investors understand its operating results, and to facilitate comparability with the results of companies that provide similar measures. Non-GAAP measures have limitations as analytical tools and are not meant to be considered in isolation or as a substitute for GAAP financial information. For example, stock-based compensation is an important component of the company’s compensation mix, and will continue to result in significant expenses in the company’s GAAP results for the foreseeable future, but is not reflected in the non-GAAP measures. Also, other companies, including companies in Power Integrations’ industry, may calculate non-GAAP measures differently, limiting their usefulness as comparative measures. Reconciliations of non-GAAP measures to GAAP measures are attached to this press release.

Note Regarding Forward-Looking Statements

The above statements regarding the company’s forecast for its fourth-quarter financial performance are forward-looking statements reflecting management's current expectations and beliefs. These forward-looking statements are based on current information that is, by its nature, subject to rapid and even abrupt change. Due to risks and uncertainties associated with the company's business, actual results could differ materially from those projected or implied by these statements. These risks and uncertainties include, but are not limited to: the impact of the COVID-19 pandemic on demand for the company’s products, its ability to supply products and its ability to conduct other aspects of its business such as competing for new design wins; changes in global macroeconomic conditions, including changing tariffs and uncertainty regarding trade negotiations, which may impact the level of demand for the company’s products; potential changes and shifts in customer demand away from end products that utilize the company's integrated circuits to end products that do not incorporate the company's products; the effects of competition, which may cause the company’s revenues to decrease or cause the company to decrease its selling prices for its products; unforeseen costs and expenses; and unfavorable fluctuations in component costs or operating expenses resulting from changes in commodity prices and/or exchange rates. In addition, new product introductions and design wins are subject to the risks and uncertainties that typically accompany development and delivery of complex technologies to the marketplace, including product development delays and defects and market acceptance of the new products. These and other risk factors that may cause actual results to differ are more fully explained under the caption “Risk Factors” in the company's most recent Annual Report on Form 10-K, filed with the Securities and Exchange Commission (SEC) on February 7, 2020. The company is under no obligation (and expressly disclaims any obligation) to update or alter its forward-looking statements, whether as a result of new information, future events or otherwise, except as otherwise required by law.

Power Integrations and the Power Integrations logo are trademarks or registered trademarks of Power Integrations, Inc.

POWER INTEGRATIONS, INC.

CONSOLIDATED STATEMENTS OF INCOME

(in thousands, except per-share amounts)


Three Months Ended


Nine Months Ended


September 30, 2020

June 30, 2020

September 30, 2019


September 30, 2020

September 30, 2019

NET REVENUES

$

121,129


$

106,832


$

114,159


$

337,625


$

306,212


COST OF REVENUES


61,560


53,296


56,028


168,040


151,035


GROSS PROFIT


59,569


53,536


58,131


169,585


155,177


OPERATING EXPENSES:
Research and development


20,868


19,770


17,957


59,790


55,172


Sales and marketing


13,442


12,807


13,074


39,465


38,479


General and administrative


10,302


7,804


9,224


26,867


26,948


Amortization of acquisition-related intangible assets


216


230


378


703


1,199


Total operating expenses


44,828


40,611


40,633


126,825


121,798


INCOME FROM OPERATIONS


14,741


12,925


17,498


42,760


33,379


OTHER INCOME


877


1,480


1,078


4,134


3,540


INCOME BEFORE INCOME TAXES


15,618


14,405


18,576


46,894


36,919


PROVISION FOR INCOME TAXES


798


1,213


1,477


2,996


1,742


NET INCOME

$

14,820


$

13,192


$

17,099


$

43,898


$

35,177


EARNINGS PER SHARE:
Basic

$

0.25


$

0.22


$

0.29


$

0.74


$

0.60


Diluted

$

0.24


$

0.22


$

0.29


$

0.72


$

0.59


SHARES USED IN PER-SHARE CALCULATION:
Basic


59,823


59,712


58,770


59,582


58,426


Diluted


60,852


60,624


59,732


60,668


59,418


SUPPLEMENTAL INFORMATION: Three Months Ended Nine Months Ended
September 30, 2020 June 30, 2020 September 30, 2019 September 30, 2020 September 30, 2019
Stock-based compensation expenses included in:
Cost of revenues

$

602


$

252


$

280


$

1,250


$

824


Research and development


2,976


2,351


1,893


7,436


5,669


Sales and marketing


1,900


1,258


1,211


4,550


3,413


General and administrative


3,880


2,120


1,722


8,813


5,103


Total stock-based compensation expense

$

9,358


$

5,981


$

5,106


$

22,049


$

15,009


Cost of revenues includes:
Amortization of acquisition-related intangible assets

$

799


$

799


$

940


$

2,397


$

2,528


Three Months Ended Nine Months Ended
REVENUE MIX BY END MARKET September 30, 2020 June 30, 2020 September 30, 2019 September 30, 2020 September 30, 2019
Communications


32

%


28

%


29

%


28

%


24

%

Computer


9

%


6

%


5

%


6

%


5

%

Consumer


31

%


31

%


32

%


34

%


36

%

Industrial


28

%


35

%


34

%


32

%


35

%


POWER INTEGRATIONS, INC.

RECONCILIATION OF NON-GAAP FINANCIAL MEASURES TO GAAP RESULTS

(in thousands, except per-share amounts)


Three Months Ended


Nine Months Ended


September 30, 2020


June 30, 2020


September 30, 2019


September 30, 2020


September 30, 2019

RECONCILIATION OF GROSS PROFIT
GAAP gross profit

$

59,569


$

53,536


$

58,131


$

169,585


$

155,177


GAAP gross margin


49.2

%


50.1

%


50.9

%


50.2

%


50.7

%

 
Stock-based compensation included in cost of revenues


602


252


280


1,250


824


Amortization of acquisition-related intangible assets


799


799


940


2,397


2,528


Non-GAAP gross profit

$

60,970


$

54,587


$

59,351


$

173,232


$

158,529


Non-GAAP gross margin


50.3

%


51.1

%


52.0

%


51.3

%


51.8

%


Three Months Ended


Nine Months Ended

RECONCILIATION OF OPERATING EXPENSES

September 30, 2020


June 30, 2020


September 30, 2019


September 30, 2020


September 30, 2019

GAAP operating expenses

$

44,828


$

40,611


$

40,633


$

126,825


$

121,798


Less:Stock-based compensation expense included in operating expenses
Research and development


2,976


2,351


1,893


7,436


5,669


Sales and marketing


1,900


1,258


1,211


4,550


3,413


General and administrative


3,880


2,120


1,722


8,813


5,103


Total


8,756


5,729


4,826


20,799


14,185


Amortization of acquisition-related intangible assets


216


230


378


703


1,199


Non-GAAP operating expenses

$

35,856


$

34,652


$

35,429


$

105,323


$

106,414


Three Months Ended Nine Months Ended
RECONCILIATION OF INCOME FROM OPERATIONS September 30, 2020 June 30, 2020 September 30, 2019 September 30, 2020 September 30, 2019
GAAP income from operations

$

14,741


$

12,925


$

17,498


$

42,760


$

33,379


GAAP operating margin


12.2

%


12.1

%


15.3

%


12.7

%


10.9

%

 
Add:Total stock-based compensation


9,358


5,981


5,106


22,049


15,009


Amortization of acquisition-related intangible assets


1,015


1,029


1,318


3,100


3,727


Non-GAAP income from operations

$

25,114


$

19,935


$

23,922


$

67,909


$

52,115


Non-GAAP operating margin


20.7

%


18.7

%


21.0

%


20.1

%


17.0

%


Three Months Ended Nine Months Ended
RECONCILIATION OF PROVISION FOR INCOME TAXES September 30, 2020 June 30, 2020 September 30, 2019 September 30, 2020 September 30, 2019
GAAP provision for income taxes

$

798


$

1,213


$

1,477


$

2,996


$

1,742


GAAP effective tax rate


5.1

%


8.4

%


8.0

%


6.4

%


4.7

%

 
Tax effect of adjustments to GAAP results


(971

)


(272

)


(266

)


(1,994

)


(1,902

)

 
Non-GAAP provision for income taxes

$

1,769


$

1,485


$

1,743


$

4,990


$

3,644


Non-GAAP effective tax rate


6.8

%


6.9

%


7.0

%


6.9

%


6.5

%


Three Months Ended Nine Months Ended
RECONCILIATION OF NET INCOME PER SHARE (DILUTED) September 30, 2020 June 30, 2020 September 30, 2019 September 30, 2020 September 30, 2019
GAAP net income

$

14,820


$

13,192


$

17,099


$

43,898


$

35,177


Adjustments to GAAP net income
Stock-based compensation


9,358


5,981


5,106


22,049


15,009


Amortization of acquisition-related intangible assets


1,015


1,029


1,318


3,100


3,727


Tax effect of items excluded from non-GAAP results


(971

)


(272

)


(266

)


(1,994

)


(1,902

)

 
Non-GAAP net income

$

24,222


$

19,930


$

23,257


$

67,053


$

52,011


Average shares outstanding for calculation
of non-GAAP net income per share (diluted)


60,852


60,624


59,732


60,668


59,418


Non-GAAP net income per share (diluted)

$

0.40


$

0.33


$

0.39


$

1.11


$

0.88


GAAP net income per share

$

0.24


$

0.22


$

0.29


$

0.72


$

0.59


POWER INTEGRATIONS, INC.
CONSOLIDATED BALANCE SHEETS
(in thousands)
 
 
September 30, 2020 June 30, 2020 December 31, 2019
ASSETS
CURRENT ASSETS:
Cash and cash equivalents

$

232,014


$

251,325


$

178,690


Short-term marketable securities


211,926


194,556


232,398


Accounts receivable, net


29,447


12,872


24,274


Inventories


104,805


103,963


90,380


Prepaid expenses and other current assets


14,755


14,512


15,597


Total current assets


592,947


577,228


541,339


PROPERTY AND EQUIPMENT, net


147,719


138,572


116,619


INTANGIBLE ASSETS, net


13,582


14,658


16,865


GOODWILL


91,849


91,849


91,849


DEFERRED TAX ASSETS


2,660


1,514


2,836


OTHER ASSETS


27,311


29,956


34,388


Total assets

$

876,068


$

853,777


$

803,896


LIABILITIES AND STOCKHOLDERS’ EQUITY
CURRENT LIABILITIES:
Accounts payable

$

43,623


$

42,871


$

27,433


Accrued payroll and related expenses


12,892


14,365


13,408


Taxes payable


379


363


584


Other accrued liabilities


9,357


7,156


9,051


Total current liabilities


66,251


64,755


50,476


LONG-TERM LIABILITIES:
Income taxes payable


15,497


15,329


14,617


Deferred tax liabilities


87


121


164


Other liabilities


14,436


14,100


14,093


Total liabilities


96,271


94,305


79,350


STOCKHOLDERS' EQUITY:
Common stock


28


28


28


Additional paid-in capital


181,192


168,470


152,117


Accumulated other comprehensive loss


(2,355

)


(1,720

)


(3,130

)

Retained earnings


600,932


592,694


575,531


Total stockholders' equity


779,797


759,472


724,546


Total liabilities and stockholders' equity

$

876,068


$

853,777


$

803,896


POWER INTEGRATIONS, INC.
CONSOLIDATED STATEMENTS OF CASH FLOWS
(in thousands)
 
Three Months Ended Nine Months Ended
September 30, 2020 June 30, 2020 September 30, 2019 September 30, 2020 September 30, 2019
CASH FLOWS FROM OPERATING ACTIVITIES:
Net income

$

14,820


$

13,192


$

17,099


$

43,898


$

35,177


Adjustments to reconcile net income to cash provided by operating activities
Depreciation


6,002


5,581


4,831


17,071


14,262


Amortization of intangible assets


1,076


1,090


1,357


3,283


3,840


Loss on disposal of property and equipment


19


262


62


311


214


Stock-based compensation expense


9,358


5,981


5,106


22,049


15,009


Amortization of premium (accretion of discount) on marketable securities


204


167


(66

)


525


(296

)

Deferred income taxes


(1,179

)


184


(381

)


100


1,278


Increase in accounts receivable allowances for credit losses


309


-


-


155


57


Change in operating assets and liabilities:
Accounts receivable


(16,884

)


7,725


(351

)


(5,328

)


(14,804

)

Inventories


(842

)


(7,330

)


487


(14,425

)


(7,853

)

Prepaid expenses and other assets


2,041


8,084


580


6,133


(3,034

)

Accounts payable


504


(2,967

)


(6,789

)


6,365


(2,636

)

Taxes payable and other accrued liabilities


801


4,684


(91

)


(864

)


1,126


Net cash provided by operating activities


16,229


36,653


21,844


79,273


42,340


CASH FLOWS FROM INVESTING ACTIVITIES:
Purchases of property and equipment


(14,116

)


(10,019

)


(5,977

)


(35,738

)


(14,325

)

Proceeds from sale of property and equipment


-


331


-


331


-


Acquisition of technology licenses


-


-


(100

)


-


(351

)

Purchases of marketable securities


(46,239

)


(2,989

)


(80,864

)


(66,066

)


(135,288

)

Proceeds from sales and maturities of marketable securities


28,033


43,015


46,762


86,995


66,184


Net cash provided by (used in) investing activities


(32,322

)


30,338


(40,179

)


(14,478

)


(83,780

)

 
CASH FLOWS FROM FINANCING ACTIVITIES:
Net proceeds from issuance of common stock


3,364


769


4,005


9,662


9,683


Repurchase of common stock


-


(623

)


-


(2,636

)


(7,302

)

Payments of dividends to stockholders


(6,582

)


(6,271

)


(4,999

)


(18,497

)


(14,916

)

Net cash used in financing activities


(3,218

)


(6,125

)


(994

)


(11,471

)


(12,535

)

 
NET INCREASE (DECREASE) IN CASH AND CASH EQUIVALENTS


(19,311

)


60,866


(19,329

)


53,324


(53,975

)

 
CASH AND CASH EQUIVALENTS AT BEGINNING OF PERIOD


251,325


190,459


99,491


178,690


134,137


CASH AND CASH EQUIVALENTS AT END OF PERIOD

$

232,014


$

251,325


$

80,162


$

232,014


$

80,162


Contacts

Joe Shiffler
Power Integrations, Inc.
(408) 414-8528
This email address is being protected from spambots. You need JavaScript enabled to view it.

ARLINGTON, Va.--(BUSINESS WIRE)--Leaders from the financial and energy sectors today announced the establishment of the Analysis & Resilience Center (ARC) for Systemic Risk, a non-profit, cross-sector organization designed to mitigate systemic risk to the nation’s most critical infrastructure from existing and emerging threats.


The ARC will conduct analysis of systemically important critical systems, assets, and functions; further capabilities to monitor and warn against threats to those systems, assets, and functions; and develop resilience measures. This work will be conducted through private sector-led operational collaboration between ARC’s member companies, sector partners, and the U.S. Government.

The only way to effectively address systemic risk to our nation’s most critical infrastructure is through public-private, cross-sector operational collaboration,” said Scott DePasquale, President and CEO of the ARC. “The ARC will ensure a scalable model is adopted for improving joint risk identification, intelligence cooperation, and early warning with critical infrastructure operators and U.S. Government partners.”

The ARC will build upon the frameworks and models for addressing systemic risk originally developed by the Financial Systemic Analysis & Resilience Center (FSARC), which was launched by the Financial Services Information Sharing and Analysis Center (FS-ISAC) in 2016. FS-ISAC is contributing FSARC’s operations to advance the mission of the ARC and will continue to collaborate with the ARC as appropriate along with the Electricity Information Sharing and Analysis Center (E-ISAC).

FSARC and its members successfully developed an approach to identify and address systemic risk in the financial sector,” said Craig Froelich, Chief Information Security Officer at Bank of America and Chairman of the ARC Board of Directors. “Leveraging this approach to other critical infrastructure sectors will help ensure continued service to customers, clients, partners, and the broader ecosystem through increased resilience.”

The ARC seeks to establish a unified, cross-sector coalition that applies consistent approaches to assess, prioritize, and mitigate risk to critical systems, assets, and functions that are interconnected, interdependent, and digitally exposed.

There must be a hand-in-glove relationship among the operators of systemically important critical infrastructure and the government to enhance the resilience of the systems and assets that underpin national critical functions, and ultimately our national security,” said Tom Fanning, CEO of Southern Company and ARC Board of Directors Executive Committee member. “We see the ARC as the central platform for critical infrastructure sectors to drive private sector and government collaboration and strategy on systemic risk going forward.”

I am proud of the role FS-ISAC played in standing up FSARC and proactively responding to demands for focused collaboration among designated critical infrastructure entities,” said Jerry Perullo, Chief Security Officer at the Intercontinental Exchange, Inc., Chairman of FS-ISAC, and ARC Board of Directors member. “With that mission accomplished, I am excited to see the evolution into the ARC and look forward to collaborating with designated critical infrastructure in other sectors, beginning with energy.”

In the future, the ARC membership will be expanded to other owners and operators of critical infrastructure entities designated as critical to the country’s national security.

About the Analysis & Resilience Center (ARC) for Systemic Risk

The ARC is a non-profit, cross-sector organization designed to mitigate systemic risk to the nation’s most critical infrastructure from existing and emerging threats. We facilitate operational collaboration between our critical infrastructure members from the financial and energy sectors, the U.S. Government, and other key sector partners in a secure environment to assess, prioritize, and mitigate risk to critical systems, assets, and functions.

The ARC was jointly established by leaders from the financial and energy sectors to build upon the frameworks and models for addressing systemic risk originally developed by the Financial Systemic Analysis and Resilience Center (FSARC). The ARC’s members are owners and operators responsible for the systems and assets that underpin national critical functions.


Contacts

Press Contact:
Lauren Archambeault
Keybridge Communications
This email address is being protected from spambots. You need JavaScript enabled to view it.
(202) 471-4228 ext. 113

Revenue of $200.3 million, an increase of 6.6% sequentially from 2Q20, and gross margin of 28%

SAN JOSE, Calif.--(BUSINESS WIRE)--Bloom Energy Corporation (NYSE: BE) today announced financial results for the third quarter ended September 30, 2020. Bloom Energy has issued a shareholder letter discussing its third quarter 2020 financial results, and it may be accessed on the Investor Relations section of Bloom Energy’s website at: https://investor.bloomenergy.com.


Key highlights from the third quarter include:

  • Revenue of $200.3 million, gross margin of 28.0%, and net loss of $12.0 million
  • Adjusted EBITDA of $27.7 million

Commenting on its third quarter results, KR Sridhar, founder, chairman and CEO, Bloom Energy said:

“From the ongoing COVID-19 pandemic, to natural disasters occurring on either coast of the United States, and countries around the globe calling for immediate and necessary shifts to hydrogen and better forms of energy, we continue to see an increasing need for the sustainable and resilient energy power sources that Bloom Energy’s technology provides. As we move forward, we will continue to serve our customers and communities around the world through ground-breaking innovation and access to leading technologies to improve global energy consumption.”

Bloom Energy will hold a conference call today to discuss its financial results for the third quarter of 2020 and to provide an update on the business. The details are included below.

Conference Call Details

Bloom Energy will host a conference call today, October 29, 2020, at 2:00 p.m. Pacific Time (5:00 p.m. Eastern Time) to discuss its third quarter 2020 financial results. To participate in the live call, analysts and investors may call +1 (833) 520-0063 and enter the passcode: 6975469. Those calling from outside the U.S. may dial +1 (236) 714-2197 and enter the same passcode: 6975469. A simultaneous live webcast will also be available under the Investor Relations section on Bloom Energy’s website at https://investor.bloomenergy.com/. Following the webcast, an archived version will be available on Bloom Energy’s website for one year. A telephonic replay of the conference call will be available until November 5, 2020, by dialing +1 (800) 585-8367 or +1 (416) 621-4642 and entering passcode 6975469.

About Bloom Energy

Bloom Energy’s mission is to make clean, reliable energy affordable for everyone in the world. Bloom’s product, the Bloom Energy Server, delivers highly reliable and resilient, always-on electric power that is clean, cost-effective, and ideal for microgrid applications. Bloom’s customers include many Fortune 100 companies and leaders in manufacturing, data centers, healthcare, retail, higher education, utilities, and other industries. For more information, visit www.bloomenergy.com.

Forward-Looking Statements under the Private Securities Litigation Reform Act of 1995

This press release contains forward-looking statements within the meaning of the federal securities laws that involve risks and uncertainties. Words such as “anticipates,” “expects,” “intends,” “plans,” “projects,” “believes,” “seeks,” “estimates,” “can,” “may,” “will,” “would” and similar expressions identify such forward-looking statements. These statements include, but are not limited to statements regarding the demand and value for sustainable and resilient power sources; and Bloom Energy’s ability to innovate and provide leading technologies to improve global energy consumption. These statements should not be taken as guarantees of results and should not be considered an indication of future activity or future performance. Actual events or results may differ materially from those described in this press release due to a number of risks and uncertainties, including those included in the Risk Factor section of Bloom Energy’s Annual Report on Form 10-K for the year ended December 31, 2019, its Quarterly Report (amended) on Form 10-Q for the quarter ended June 30, 2020 and other risks detailed in Bloom’s SEC filings from time to time. Bloom undertakes no obligation to revise or publicly update any forward-looking statements unless if and as required by law.

Use of Non-GAAP Financial Information

This release includes a non-GAAP financial measure as defined by SEC rules. This non-GAAP financial measure is in addition to, and not a substitute for or superior to, measures of financial performance prepared in accordance with U.S. GAAP. There are a number of limitations related to the use of non-GAAP financial measures versus their nearest GAAP equivalents. For example, other companies may calculate non-GAAP financial measures differently or may use other measures to evaluate their performance, all of which could reduce the usefulness of our non-GAAP financial measures as tools for comparison. For a reconciliation of Adjusted EBITDA to the most directly comparable GAAP financial measure, please see the table below.

(In Thousands)

Q3’20

Net loss to Common Stockholders

(11,954)

Loss (gain) on extinguishment of debt

(1,220)

Loss (gain) for non-controlling interests1

(5,922)

Loss (gain) on warrant & derivatives liabilities2

(1,505)

Loss (gain) on the Fair Value Adjustments for certain PPA derivatives3

(726)

Stock-based compensation

15,735

Depreciation & Amortization

13,036

Provision for Income Tax

7

Interest Expense / Other Misc

20,222

Adjusted EBITDA

27,673

  1. Represents the profits and losses allocated to the non-controlling interests under the hypothetical liquidation at book value (HLBV) method
  2. Represents the adjustments to the fair value of the warrants issued or embedded derivatives associated with the convertible notes and other derivatives
  3. Represents the adjustments to the fair value of the derivative forward contract for one PPA entity (our first PPA company)


Contacts

Investor Relations:

Mark Mesler
Bloom Energy
+1 (408) 543-1743
This email address is being protected from spambots. You need JavaScript enabled to view it.

Media:

Jennifer Duffourg
Bloom Energy
+1 (480) 341-5464
This email address is being protected from spambots. You need JavaScript enabled to view it.

LONDON--(BUSINESS WIRE)--#GlobalPumpsMarketforOilandGasIndustry--The new pumps market research for oil and gas industry from Technavio indicates Neutral growth in the short term as the business impact of COVID-19 spreads.


Get detailed insights on the COVID-19 pandemic Crisis and Recovery analysis of the pumps market for oil and gas industry. Download free report sample

"One of the primary growth drivers for this market is the Growing Need for Energy-efficient Pumps,” says a senior analyst for Industrials at Technavio.

The considerably increasing need for energy-efficient pumps is one of the key factors driving pumps market growth for oil and gas industry. With the aging infrastructure and increased focus on reducing operating expenditure (OPEX) by improving production efficiency, there has been a significant rise in the requirement of energy-efficient pumps. Additionally, technological advances in PD pumps have made them a viable choice for consumers in the oil and gas industry as they can replace several small pumps due to their variable frequency drive. Such advantages of pumps are encouraging vendors to develop energy-efficient pumps to improve overall operational efficiency. Furthermore, regulatory authorities across the globe are encouraging the adoption of energy-efficient equipment, including pumps. For instance, the US Department of Energy funded USD 25 million for the development of energy-efficient motor technology. Such initiatives by the governments across the globe will further contribute significantly to the growth of pumps market for oil and gas industry during the forecast period.

As the markets recover Technavio expects the pumps market size for oil and gas industry to grow by USD 2.23 billion during the period 2020-2024.

Pumps Market for Oil and Gas Industry Segment Highlights for 2020

  • The pumps market for oil and gas industry is expected to post a year-over-year growth rate of 3.33%.
  • Centrifugal pumps are preferred for handling large volumes of fluids because of their higher flow rate as compared to PD pumps.
  • Centrifugal pumps can regulate their flow rate with changes in oil and gas piping systems. The resurging investments in shale resources in the US, which is a key oil and gas market, is expected to fuel the growth of the pumps market in this segment.
  • However, market growth in this segment will be slower than the growth of the market in the PD segment.

Regional Analysis

  • 40% of the growth will originate from the North America region.
  • The significant investments in upstream oil and gas activities will significantly influence pumps market growth for oil and gas industry in this region.
  • The US and Mexico are the key markets for pumps in North America. Market growth in this region will be faster than the growth of the market in Europe and South America.

Click here to learn about report detailed analysis and insights on how you can leverage them to grow your business.

Notes:

  • The pumps market for oil and gas industry size is expected to accelerate at a CAGR of almost 4% during the forecast period.
  • The pumps market for oil and gas industry is segmented by Product (centrifugal and PD) and Geographic Landscape (APAC, Europe, MEA, North America, and South America).
  • The market is fragmented due to the presence of many established vendors holding significant market share.
  • The research report offers information on several market vendors, including Danfoss AS, Enerpac Tool Group Corp., Flowserve Corp., General Electric Co., Grundfos Holding AS, Ingersoll Rand Co., ITT Inc., Robert Bosch GmbH, Sulzer Management Ltd., and The Weir Group Plc

Register for a free trial today to access 17,000+ market research reports using Technavio's SUBSCRIPTION platform

About Us

Technavio is a leading global technology research and advisory company. Their research and analysis focuses on emerging market trends and provides actionable insights to help businesses identify market opportunities and develop effective strategies to optimize their market positions. With over 500 specialized analysts, Technavio’s report library consists of more than 17,000 reports and counting, covering 800 technologies, spanning across 50 countries. Their client base consists of enterprises of all sizes, including more than 100 Fortune 500 companies. This growing client base relies on Technavio’s comprehensive coverage, extensive research, and actionable market insights to identify opportunities in existing and potential markets and assess their competitive positions within changing market scenarios.


Contacts

Technavio Research
Jesse Maida
Media & Marketing Executive
US: +1 844 364 1100
UK: +44 203 893 3200
Email: This email address is being protected from spambots. You need JavaScript enabled to view it.
Website: www.technavio.com/

• Net earnings of $225 million; adjusted net earnings of $499 million


• Outstanding results, great execution in all three businesses

• Continued focus on Readiness to drive growth, innovation, sustainability

CHICAGO--(BUSINESS WIRE)--ADM (NYSE: ADM) today reported financial results for the quarter ended September 30, 2020.

“We delivered an outstanding quarter, and I am proud of our team’s continued great performance,” said Chairman and CEO Juan Luciano.

“Across the enterprise, ADM colleagues are doing what it takes to help our customers and our company succeed and grow. Our strategic initiatives, combined with exceptional execution, are driving strong results across all of our businesses. Readiness is enhancing our performance, accelerating our work in areas ranging from operations to sales. Our strong cash generation is allowing us to retire higher-cost debt while retaining balance sheet flexibility. And Nutrition continues its impressive upward trajectory, delivering a fifth consecutive quarter of 20-plus percent year-over-year operating profit growth.

“From our Strive 35 sustainability goals, to our partnership with Spiber to produce plant-based polymers, to the announcement of a significant expansion in probiotics with our new state-of-the art facility in Valencia, we’re advancing our work to enrich the quality of life around the globe. We’re excited about our future as we look ahead to another strong quarter, with positive momentum continuing through 2021.”

Third Quarter 2020 Highlights

(Amounts in millions except per share amounts)

2020


2019

Earnings per share (as reported)

$

0.40


$

0.72


Adjusted earnings per share1

$

0.89


$

0.77


Segment operating profit

$

904


$

758


Adjusted segment operating profit1

$

849


$

764


Ag Services and Oilseeds

436


417


Carbohydrate Solutions

246


182


Nutrition

147


118


Other Business

20


47


  • EPS as reported of $0.40 includes a $0.53 per share charge related to early debt retirement, a $0.03 per share charge related to the mark-to-market adjustment of the exchangeable bond issued in August 2020, a $0.10 per share credit related to the gain on sale of Wilmar shares and certain assets, and other charges totaling $0.03 per share. Adjusted EPS, which excludes these items, was $0.89.1

1 Non-GAAP financial measures; see pages 5, 10, 11 and 13 for explanations and reconciliations, including after-tax amounts.

Results of Operations

Ag Services & Oilseeds results were higher than the third quarter of 2019. Both Ag Services and Crushing saw expanding margins during the quarter, resulting in approximately $155 million in total negative timing effects, which are expected to reverse in the coming quarters.

  • Ag Services executed extremely well to capitalize on strong North American industry export margins and volumes. Results were lower in South America, as the pace of Brazilian farmer selling slowed as expected following the aggressive selling in the first half of the year. Global Trade’s continued focus on serving customers contributed significantly to results, as did a $54 million settlement related to 2019 U.S. high water insurance claims. Negative timing impacts of almost $80 million led to lower overall results versus the prior year.
  • In Crushing, strong execution in an environment of tighter soybean supplies and solid global demand for meal and oil supported improved execution margins in North and South America, partially offset by lower year-over-year margins in EMEAI. Negative timing impacts of approximately $75 million versus a gain of approximately $50 million recognized in the prior-year quarter led to lower year-over-year results.
  • Refined Products and Other delivered significantly higher year-over-year results, driven by improved biodiesel margins around the globe. Packaged oils in South America also contributed.
  • Equity earnings from Wilmar were substantially higher versus the prior-year period.

Carbohydrate Solutions results were significantly higher year over year.

  • Starches and Sweeteners subsegment results were substantially higher versus the third quarter of 2019. In North America, balanced ethanol industry supply and demand drove improved wet mill ethanol margins versus the prior year. Demand for starches in North America was substantially stronger than earlier in the year, and higher than the prior-year quarter. Reduced food service demand affected sweetener and flour volumes, though retail demand for flour remained solid. Strong risk management and improved net corn costs contributed positively to results. EMEAI delivered improved results on higher demand and reduced manufacturing and raw material costs.
  • In Vantage Corn Processors, distribution gains on wet mill ethanol, in addition to significantly improved year-over-year industry ethanol margins, helped to offset fixed costs from the two temporarily idled dry mills, driving higher year-over-year results. Increased volumes and margins of USP-grade industrial alcohol for hand sanitizer also supported improved performance.

Nutrition delivered its fifth consecutive quarter of 20-plus percent year-over-year profit growth.

  • Human Nutrition results were substantially higher versus the prior-year quarter, with improved results across the business portfolio. Flavors delivered another exceptional quarter, driven by increased revenue globally and improved mix and margins. Plant-based proteins helped drive a solid performance in Specialty Ingredients. Sales growth in probiotics, along with income from the Spiber fermentation agreement, contributed to strong results in Health & Wellness.
  • Animal Nutrition was higher year over year. Continued delivery of Neovia synergies, strength in livestock feed and year-over-year improvement in amino acids were partially offset by softer aquaculture feed demand as well as negative foreign currency impacts.

Other Business results were lower, driven by lower ADM Investor Services earnings and captive insurance underwriting losses, including a $17 million settlement impact for the high water claim with Ag Services & Oilseeds.

Other Items of Note

As additional information to help clarify underlying business performance, the table on page 10 includes reported earnings and EPS as well as adjusted earnings and EPS.

Segment operating profit of $904 million for the quarter includes charges related to asset impairment, restructuring, and settlement activities of $2 million and gains on the sale of Wilmar shares and certain assets of $57 million ($0.10 per share).

During the quarter, the company leveraged its strong cash position to re-balance its mix of long- and short-term debt, which will also reduce future interest payments, by economically retiring $1.2 billion of higher-coupon debt, resulting in a debt extinguishment charge of $396 million ($0.53 per share).

In Corporate results, unallocated corporate costs for the quarter were higher year over year due primarily to variable performance-related compensation expense accruals, which were low in the prior year. Other charges increased due to railroad maintenance expenses, partially offset by improved foreign hedging results on intercompany funding and investment gains in ADM Ventures. Corporate results also include the early debt retirement charge referenced above, a mark-to-market loss on the exchangeable bonds issued in August 2020 of $15 million ($0.03 per share), and an impairment charge of $6 million ($0.01 per share).

The effective tax rate for the quarter was a benefit of 13 percent compared to an expense of 19 percent in the prior year. The current quarter rate reflects the effects of the early debt retirement as well as the sale of Wilmar shares and increased year-over-year Wilmar earnings on the annual effective tax rate. The impact of U.S. tax credits, primarily the biodiesel and railroad tax credits, also contributed significantly to the decreased Q3 rate from the prior year; the railroad tax credits have an offsetting expense in cost of products sold. Absent the effect of EPS adjusting items, the effective tax rate for the current quarter was approximately 11 percent.

Note: Additional Facts and Explanations

Additional facts and explanations about results and industry environment can be found at the end of the ADM Q3 Earnings Presentation at www.adm.com/webcast.

Conference Call Information

ADM will host a webcast on October 30, 2020, at 8:00 a.m. Central Time to discuss financial results and provide a company update, including an overview of our Nutrition business. To listen to the webcast, go to www.adm.com/webcast. A replay of the webcast will also be available for an extended period of time at www.adm.com/webcast.

Forward-Looking Statements

Some of our comments and materials in this presentation constitute forward-looking statements that reflect management’s current views and estimates of future economic circumstances, industry conditions, Company performance and financial results. These statements and materials are based on many assumptions and factors that are subject to risk and uncertainties. ADM has provided additional information in its reports on file with the SEC concerning assumptions and factors that could cause actual results to differ materially from those in this presentation, and you should carefully review the assumptions and factors in our SEC reports. To the extent permitted under applicable law, ADM assumes no obligation to update any forward-looking statements as a result of new information or future events.

About ADM

At ADM, we unlock the power of nature to provide access to nutrition worldwide. With industry-advancing innovations, a complete portfolio of ingredients and solutions to meet any taste, and a commitment to sustainability, we give customers an edge in solving the nutritional challenges of today and tomorrow. We’re a global leader in human and animal nutrition and the world’s premier agricultural origination and processing company. Our breadth, depth, insights, facilities and logistical expertise give us unparalleled capabilities to meet needs for food, beverages, health and wellness, and more. From the seed of the idea to the outcome of the solution, we enrich the quality of life the world over. Learn more at www.adm.com.

Financial Tables Follow

Source: Corporate Release

Segment Operating Profit, Adjusted Segment Operating Profit (a non-GAAP financial measure)

and Corporate Results

(unaudited)


Quarter ended


Nine months ended


September 30


September 30


(In millions)

2020

2019

Change


2020

2019

Change


Segment Operating Profit

$

904


$

758


$

146


$

2,316


$

2,014


$

302


Specified items:


(Gains) losses on sales of assets and businesses

(57

)


(57

)


(80

)

(12

)

(68

)

Impairment, restructuring, and settlement charges

2


6


(4

)


60


52


8


Adjusted Segment Operating Profit

$

849


$

764


$

85


$

2,296


$

2,054


$

242


Ag Services and Oilseeds

$

436


$

417


$

19


$

1,271


$

1,196


$

75


Ag Services

147


161


(14

)


482


326


156


Crushing

66


138


(72

)


249


493


(244

)

Refined Products and Other

127


80


47


286


223


63


Wilmar

96


38


58


254


154


100


Carbohydrate Solutions

$

246


$

182


$

64


$

509


$

470


$

39


Starches and Sweeteners

257


197


60


533


547


(14

)

Vantage Corn Processors

(11

)

(15

)

4


(24

)

(77

)

53


Nutrition

$

147


$

118


$

29


$

447


$

316


$

131


Human Nutrition

128


102


26


372


293


79


Animal Nutrition

19


16


3


75


23


52


Other Business

$

20


$

47


$

(27

)


$

69


$

72


$

(3

)


Segment Operating Profit

$

904


$

758


$

146


$

2,316


$

2,014


$

302


Corporate Results

$

(704

)

$

(255

)

$

(449

)


$

(1,189

)

$

(922

)

$

(267

)


Interest expense - net

(83

)

(85

)

2


(246

)

(276

)

30


Unallocated corporate costs

(196

)

(139

)

(57

)


(579

)

(454

)

(125

)

Other charges

(8

)


(8

)


(25

)

(18

)

(7

)

Specified items:


LIFO credit (charge)


16


(16

)


91


(10

)

101


Early debt retirement charges

(396

)


(396

)


(410

)


(410

)

Expenses related to acquisitions


(14

)

14


Loss on debt conversion option

(15

)


(15

)


(15

)


(15

)

Impairment and restructuring charges

(6

)

(47

)

41


(5

)

(150

)

145


Earnings Before Income Taxes

$

200


$

503


$

(303

)


$

1,127


$

1,092


$

35


Segment operating profit is ADM’s consolidated income from operations before income tax excluding corporate items. Adjusted segment operating profit, a non-GAAP financial measure, is segment operating profit excluding specified items. Management believes that segment operating profit and adjusted segment operating profit are useful measures of ADM’s performance because they provide investors information about ADM’s business unit performance excluding corporate overhead costs as well as specified items. Segment operating profit and adjusted segment operating profit are not measures of consolidated operating results under U.S. GAAP and should not be considered alternatives to income before income taxes, the most directly comparable GAAP financial measure, or any other measure of consolidated operating results under U.S. GAAP.

Consolidated Statements of Earnings

(unaudited)


Quarter ended


Nine months ended


September 30


September 30


2020


2019


2020


2019


(in millions, except per share amounts)


Revenues

$

15,126


$

16,726


$

46,377


$

48,327


Cost of products sold (1)

14,084


15,648


43,276


45,349


Gross profit

1,042


1,078


3,101


2,978


Selling, general, and administrative expenses (2)

636


578


1,938


1,839


Asset impairment, exit, and restructuring costs (3)

4


53


61


200


Equity in (earnings) losses of unconsolidated affiliates

(160

)


(88

)


(403

)


(279

)

Interest income

(16

)


(47

)


(71

)


(142

)

Interest expense (4)

100


97


270


307


Other (income) expense - net (5)

278


(18

)


179


(39

)

Earnings before income taxes

200


503


1,127


1,092


Income tax (benefit) expense (6)

(26

)


95


38


212


Net earnings including noncontrolling interests

226


408


1,089


880


Less: Net earnings (losses) attributable to noncontrolling interests

1


1


4


5


Net earnings attributable to ADM

$

225


$

407


$

1,085


$

875


Diluted earnings per common share

$

0.40


$

0.72


$

1.93


$

1.55


Average diluted shares outstanding

562


563


563


565


(1) Includes a charge (credit) related to changes in the Company’s LIFO reserves of $(91) million in the current YTD and $(16) million and $10 million in the prior quarter and YTD, respectively.

(2) Includes a settlement charge of $4 million in the current quarter and YTD and acquisition-related expenses of $14 million in the prior YTD.

(3) Includes charges related to impairment of certain assets and restructuring of $4 million and $61 million in the current quarter and YTD, respectively, and charges related to impairment of certain assets, restructuring, and pension settlement of $53 million and $200 million in the prior quarter and YTD, respectively.

(4) Includes charges related to the mark-to-market adjustment of the conversion option of the exchangeable bond issued in August 2020 of $15 million in the current quarter and YTD.

(5) Includes current quarter and YTD gains related to the sale of Wilmar shares and certain other assets totaling $57 million and $80 million, respectively, and early debt retirement charges of $396 million and $410 million, respectively, and prior YTD gains related to the sale of certain assets and a step-up gain on an equity investment of $12 million and a settlement charge of $2 million.

(6) Includes the tax benefit impact of the above specified items and tax discrete items totaling $88 million and $69 million, in the current quarter and YTD, respectively, and the tax benefit impact of the above specified items and certain discrete items totaling $13 million and $57 million in the prior quarter and YTD, respectively.

Summary of Financial Condition

(unaudited)


September 30,
2020


September 30,
2019


(in millions)

Net Investment In


Cash and cash equivalents (a)


$

948


$

932


Short-term marketable securities (a)


26


Operating working capital (b)


8,122


7,457


Property, plant, and equipment


9,816


10,101


Investments in and advances to affiliates


4,771


5,399


Long-term marketable securities


9


10


Goodwill and other intangibles


5,275


5,401


Other non-current assets


2,158


1,715


$

31,099


$

31,041


Financed By


Short-term debt (a)


$

209


$

1,242


Long-term debt, including current maturities (a)


7,924


7,646


Deferred liabilities


3,540


3,205


Temporary equity


85


53


Shareholders’ equity


19,341


18,895


$

31,099


$

31,041


(a)

Net debt is calculated as short-term debt plus long-term debt (including current maturities) less cash and cash equivalents and short-term marketable securities.

(b)

Current assets (excluding cash and cash equivalents and short-term marketable securities) less current liabilities (excluding short-term debt and current maturities of long-term debt).

Summary of Cash Flows

(unaudited)


Nine months
ended


September 30


2020


2019


(in millions)

Operating Activities


Net earnings


$

1,089


$

880


Depreciation and amortization


727


742


Asset impairment charges


50


50


(Gains) losses on sales of assets


(132

)


(37

)

Loss on debt extinguishment


410


Other - net


151


65


Change in deferred consideration in securitized receivables(a)


(4,603

)


(5,714

)

Other changes in operating assets and liabilities


792


375


Total Operating Activities


(1,516

)


(3,639

)


Investing Activities


Purchases of property, plant and equipment


(558

)


(566

)

Net assets of businesses acquired


(3

)


(1,946

)

Proceeds from sale of business/assets


708


43


Investments in retained interest in securitized receivables(a)


(2,121

)


(3,813

)

Proceeds from retained interest in securitized receivables(a)


6,724


9,527


Marketable securities - net


(1

)


41


Investments in and advances to affiliates


(5

)


(12

)

Other investing activities


(16

)


(23

)

Total Investing Activities


4,728


3,251


Financing Activities


Long-term debt borrowings


1,790


3


Long-term debt payments


(2,032

)


(615

)

Net borrowings (payments) under lines of credit


(993

)


960


Share repurchases


(117

)


(150

)

Cash dividends


(607

)


(592

)

Other


16


(36

)

Total Financing Activities


(1,943

)


(430

)


Increase (decrease) in cash, cash equivalents, restricted cash, and restricted cash equivalents


1,269


(818

)

Cash, cash equivalents, restricted cash, and restricted cash equivalents - beginning of period


2,990


3,843


Cash, cash equivalents, restricted cash, and restricted cash equivalents - end of period


$

4,259


$

3,025


(a)

Cash flows related to the Company’s retained interest in securitized receivables as required by ASU 2016-15 which took effect January 1, 2018.

Segment Operating Analysis

(unaudited)


Quarter ended


Nine months ended


September 30


September 30


2020


2019


2020


2019


(in ‘000s metric tons)

Processed volumes (by commodity)


Oilseeds

8,970


9,062


27,236


27,002


Corn

4,084


5,619


13,717


16,297


Total processed volumes

13,054


14,681


40,953


43,299


Quarter ended


Nine months ended


September 30


September 30


2020


2019


2020


2019


(in millions)

Revenues


Ag Services and Oilseeds

$

11,527


$

12,616


$

35,347


$

36,382


Carbohydrate Solutions

2,064


2,565


6,394


7,409


Nutrition

1,451


1,457


4,359


4,263


Other Business

84


88


277


273


Total revenues

$

15,126


$

16,726


$

46,377


$

48,327


Adjusted Earnings Per Share

A non-GAAP financial measure

(unaudited)


Quarter ended September 30


Nine months ended September 30


2020

2019


2020

2019


In millions

Per share

In millions

Per share


In millions

Per share

In millions

Per share

Net earnings and fully diluted EPS

$

225


$

0.40


$

407


$

0.72


$

1,085


$

1.93


$

875


$

1.55


Adjustments:


LIFO charge (credit) (a)


(12

)

(0.02

)


(69

)

(0.12

)

8


0.01


Losses (gains) on sales of assets and businesses (b)

(54

)

(0.10

)


(72

)

(0.13

)

(9

)

(0.02

)

Impairment, restructuring, and settlement charges (c)

5


0.01


41


0.08


49


0.09


156


0.28


Expenses related to acquisitions (d)


9


0.02


Early debt retirement charges (e)

300


0.53


311


0.55


Loss on debt conversion option (f)

15


0.03


15


0.03


Tax adjustment (g)

8


0.02


(5

)

(0.01

)


16


0.03


(7

)

(0.01

)

Sub-total adjustments

274


0.49


24


0.05


250


0.45


157


0.28


Adjusted net earnings and adjusted EPS

$

499


$

0.89


$

431


$

0.77


$

1,335


$

2.38


$

1,032


$

1.83


(a)


Current YTD changes in the Company’s LIFO reserves of $(91) million pretax ($69 million after tax), tax effected using the Company’s U.S. income tax rate. Prior quarter and YTD changes in the Company’s LIFO reserves of $(16) million and $10 million pretax, respectively ($12 million and $8 million after tax, respectively), tax effected using the Company’s U.S. income tax rate.

(b)


Current quarter and YTD gain of $57 million pretax ($54 million after tax) and $80 million pretax ($72 million after tax), respectively, primarily related to the sale of Wilmar shares and certain other assets, tax effected using the applicable tax rates. Prior YTD gains of $12 million pretax ($9 million after tax) related to the sale of certain assets and a step-up gain on an equity investment, tax effected using the Company’s U.S. income tax rate.

(c)

Current quarter and YTD charges of $8 million pretax ($5 million after tax) and $65 million pretax ($49 million after tax), respectively, related to the impairment of certain assets, restructuring, and a settlement, tax effected using the applicable rates. Prior quarter and YTD charges of $53 million and $202 million pretax, respectively ($41 million and $156 million after tax, respectively), related to the impairment of certain assets, restructuring, and pension settlement, tax effected using the applicable tax rates.

(d)

Prior YTD acquisition expenses of $14 million pretax ($9 million after tax) consisted of expenses primarily related to the Neovia acquisition.

(e)

Current quarter and YTD early debt retirement charges of $396 million pretax ($300 million after tax) and $410 million pretax ($311 million after tax), respectively, tax effected using the Company’s U.S. income tax rate, related to the early repurchase of certain of the Company’s debentures.

(f)

Current quarter and YTD loss on debt conversion option of $15 million pretax ($15 million after tax) related to the mark-to-market adjustment of the conversion option of the exchangeable bonds issued in August 2020.

(g)

Tax adjustment totaling $8 million and $16 million due to certain discrete items in the current quarter and YTD, respectively, and $(5) million and $(7) million due to U.S. tax reform and certain discrete items in the prior quarter and YTD, respectively.

Adjusted net earnings reflects ADM’s reported net earnings after removal of the effect on net earnings of specified items as more fully described above. Adjusted EPS reflects ADM’s fully diluted EPS after removal of the effect on EPS as reported of specified items as more fully described above. Management believes that Adjusted net earnings and Adjusted EPS are useful measures of ADM’s performance because they provide investors additional information about ADM’s operations allowing better evaluation of underlying business performance and better period-to-period comparability. These non-GAAP financial measures are not intended to replace or be alternatives to net earnings and EPS as reported, the most directly comparable GAAP financial measures, or any other measures of operating results under GAAP.


Contacts

Media Relations
Jackie Anderson
312-634-8484

Investor Relations
Victoria de la Huerga
312-634-8457


Read full story here

DUBLIN--(BUSINESS WIRE)--The "Global Bio-Based Chemicals Market 2019-2028" report has been added to ResearchAndMarkets.com's offering.


According to this report, the global market for bio-based chemicals is anticipated to surge at a CAGR of 13.64% during the forecast period of 2019-2028.

The favorable government policies towards bio-based products, growth in the use of eco-friendly products like bioplastics, the high market potential of bio-based chemical products, are key factors driving the global market on a growth path. Additionally, the uncertain prices of crude oil and the focus of the automotive manufacturers to reduce carbon footprints are creating numerous opportunities for the bio-based chemicals market's progress.

However, the high production cost of bio-based chemicals causes cost constraints, further limiting the market's expansion.

REGIONAL OUTLOOK

The global bio-based chemicals market covers the Asia-Pacific, North America, Latin America, Europe, and the Middle East and Africa regions.

The Asia-Pacific is anticipated to become the fast-evolving market globally during the years of 2019-2028. The region's market is expected to be primarily driven by the availability of raw materials, industrial production conditions, consumer demand, and policy adoption. Moreover, the growing demand for green products is an essential factor that is augmenting the demand for bio-based chemical products. This further enhances the development of the bio-based chemicals market in the APAC region.

In the region, China is the largest chemical producer, and ranks second largest globally. The country's interest in the biotechnology sector is a major element responsible for industrial development. China has also adopted several actions, setting guidelines to use marginal land and avoiding environmental damage. Numerous countries in the region have also adopted similar policies. Hence, the APAC region is likely to show growth over the projected phase, especially in China, India, and Japan, owing to rapid industrial demand.

COMPETITIVE OUTLOOK

The key companies involved in the market include NatureWorks LLC, Cargill Incorporated, Corbion NV, Mitsui & Co Ltd, Braskem SA, Teijin Limited, Mitsubishi Chemical Corporation, Royal DSM NV, Abengoa SA, Methanex Corporation, PTT Global Chemical Public Company Limited, Novozymes, BASF SE, and Danimer Scientific Inc.

Cargill Incorporated is involved in providing food, agricultural, financial, and industrial products and services. It also produces commodities for food feed and fuel handles. Further, the company's bio-industrial products comprise industrial vegetable oils, epoxy additives, industrial hydrocolloids, and others. The company has its operations in North America, Latin America, Asia-Pacific, Europe, and the Middle East and Africa regions. It is headquartered in the United States.

Market Dynamics

Drivers

  • Favorable Government Policies Towards Bio-Based Products
  • Growing Use of Eco-Friendly Products Like Bioplastics
  • High Market Potential of Bio-Based Chemical Products

Restraints

  • Cost Constraint

Opportunities

  • Volatile/Uncertain Crude Oil Prices
  • Automotive Manufacturers' Focus on Reducing Carbon Footprint

Challenges

  • Lack of Supply Chain Model in Raw Materials and Feedstock

Companies Mentioned

  • Abengoa Sa
  • Basf Se
  • Braskem Sa
  • Cargill Incorporated
  • Corbion Nv
  • Danimer Scientific Inc
  • Methanex Corporation
  • Mitsubishi Chemical Corporation
  • Mitsui & Co Ltd
  • Natureworks LLC
  • Novozymes
  • PTT Global Chemical Public Company Limited
  • Royal Dsm Nv
  • Teijin Limited

For more information about this report visit https://www.researchandmarkets.com/r/htq72b


Contacts

ResearchAndMarkets.com
Laura Wood, Senior Press Manager
This email address is being protected from spambots. You need JavaScript enabled to view it.

For E.S.T Office Hours Call 1-917-300-0470
For U.S./CAN Toll Free Call 1-800-526-8630
For GMT Office Hours Call +353-1-416-8900

Western Power Recognized at Itron Utility Week 2020 for Smart Lab

LIBERTY LAKE, Wash.--(BUSINESS WIRE)--Itron, Inc. (NASDAQ: ITRI), which is innovating the way utilities and cities manage energy and water, awarded the second annual Itron Innovator Award to Australian energy utility Western Power for its Smart Lab in Perth, Western Australia, which was developed through Itron’s partner enablement program. The award, which was presented virtually at Itron Utility Week 2020, recognizes a customer that leverages Itron’s partner enablement programs and ecosystem to create a breakthrough solution for smart utilities and smart cities.


Western Power Smart Solutions Manager Chris Meneghello said that the collaboration with Itron to build a Smart City Lab inside its head office opens up a multitude of smart opportunities for its customers and communities. Utilizing a variety of Itron’s mains-powered and battery-powered wireless communications modules on the open, standards-based network, Western Power deployed sensors from multiple partners, showcasing the potential of smart city applications, with the objective to clarify the value of smart city solutions for Western Australians.

The applications included TCAM’s data logger for water sensing and environmental monitoring, New Cosmos’ award-winning natural gas detectors, Rongwen’s ambient noise sensor connecting via their 7-pin Networked Lighting Controller and water meter, and Houston Radar’s dynamic lighting solution with peer-to-peer communications. Western Power also connected two smart-enabled streetlights to Itron’s Streetlight Vision (SLV) as part of the Smart Lab.

The interoperable solution pioneered a new approach where the communication modules bridged data from partner sensors to Itron’s SLV Smart City Central Management solution and Itron’s cloud-based mobile data collection solution, Temetra. The solution enables Western Power to manage and collect data and realize numerous smart city use cases.

“We’re honored to be selected as the winner of the Itron Innovator Award – it highlights our vision and drive in leveraging new technologies to provide smarter energy solutions now and in the future,” Meneghello said. “Our multi-partner Smart Lab demonstrates our commitment to building strong relationships with communities and using and exploring exciting solutions to achieve greater efficiency, safety and energy quality for all Western Australians connected to our network.”

“At Itron, we empower our customers organically and through ecosystem partners to improve resourcefulness, enhance safety and connect communities,” said John Marcolini, senior vice president of Networked Solutions at Itron. “We are pleased to present this award to Western Power for their innovative approach to harmonizing solutions from our partner ecosystem to realize multiple smart city use cases.”

About Western Power

Western Power is a Western Australian State Government owned corporation which is responsible for building, maintaining and operating an electricity network which connects more than 2.3 million customers to traditional and renewable energy sources.

About Itron

Itron enables utilities and cities to safely, securely and reliably deliver critical infrastructure solutions to communities in more than 100 countries. Our portfolio of smart networks, software, services, meters and sensors helps our customers better manage electricity, gas and water resources for the people they serve. By working with our customers to ensure their success, we help improve the quality of life, ensure the safety and promote the well-being of millions of people around the globe. Itron is dedicated to creating a more resourceful world. Join us: www.itron.com.

Itron® is a registered trademark of Itron, Inc. All third-party trademarks are property of their respective owners and any usage herein does not suggest or imply any relationship between Itron and the third party unless expressly stated.


Contacts

Itron, Inc.
Alison Mallahan
Senior Manager, Corporate Communications
509-891-3802
This email address is being protected from spambots. You need JavaScript enabled to view it.

MINNEAPOLIS--(BUSINESS WIRE)--Xcel Energy Inc. (NASDAQ: XEL) announced today that it has submitted a redemption notice to the trustee to redeem all of its outstanding 2.60% Senior Notes, Series due March 15, 2022 (Notes) on December 1, 2020, (Redemption Date). The redemption price is equal to the greater of the outstanding principal amount of the Notes and a make-whole premium, which will be calculated three business days prior to the Redemption Date in accordance with the terms of the Notes and related indenture, plus accrued and unpaid interest to the Redemption Date. The aggregate principal amount of Notes currently outstanding is $300,000,000.


This press release does not constitute a notice of redemption of the Notes. Holders of the Notes should refer to the notice of redemption to be delivered to the registered holders of the Notes by Wells Fargo Bank, N.A., the trustee with respect to the Notes.

This press release is not an offer to sell or a solicitation of an offer to buy any securities.

Forward Looking Statements

This release contains forward-looking statements that are subject to certain risks, uncertainties and assumptions. Such forward-looking statements include the company’s plan to redeem the Notes. Actual results may vary materially. Factors that could cause actual results to differ materially include, but are not limited to: general economic conditions, including the availability of credit, actions of rating agencies and their impact on capital expenditures; business conditions in the energy industry: competitive factors; unusual weather; effects of geopolitical events; including war and acts of terrorism; changes in federal or state legislation; regulation; actions of regulatory bodies; and other risk factors listed from time to time by Xcel Energy in its Annual Report on Form 10-K for the fiscal year ended Dec. 31, 2019 (including the items described under Factors Affecting Results of Operations) and the other risk factors listed from time to time by Xcel Energy Inc. in reports filed with the SEC.

About Xcel Energy Inc.

Xcel Energy (NASDAQ: XEL) provides the energy that powers millions of homes and businesses across eight Western and Midwestern states. Headquartered in Minneapolis, the company is an industry leader in responsibly reducing carbon emissions and producing and delivering clean energy solutions from a variety of renewable sources at competitive prices. For more information, visit xcelenergy.com or follow us on Twitter and Facebook.


Contacts

Xcel Energy
Financial analysts:
Paul Johnson, 612-215-4535
Vice President, Investor Relations
or
News media inquiries:
Xcel Energy Media Relations, 612-215-5300

Strategic Market Growth and Operational Execution Drives Strong Financial Results

CHANDLER, Ariz.--(BUSINESS WIRE)--Rogers Corporation (NYSE:ROG) today announced financial results for the third quarter of 2020.


We are encouraged by the growth we saw in many of our strategic markets as well as our strong operational performance, which resulted in revenue and gross margin that exceeded the top end of our guidance expectations,” stated Bruce D. Hoechner, Rogers, President and CEO. “Q3 sales were driven by strength in the EV/HEV, ADAS, portable electronics and defense markets. For the fourth quarter we expect continued strength in these strategic markets, although visibility to a broader market recovery remains less clear. We continue to accelerate our efforts to capitalize on the substantial opportunities in Advanced Mobility markets, while also focusing on growth opportunities across our strong and diversified market portfolio.”


Q3 2020 Financial Overview


GAAP Results

Q3 2020


Q2 2020


Q3 2019

Net Sales ($M)

$201.9


$191.2


$221.8

Gross Margin

37.4%


36.6%


35.6%

Operating Margin

4.4%


11.0%


13.5%

Net Income ($M)

$7.0


$14.5


$23.4

Earnings Per Share

$0.37


$0.78


$1.25


Non-GAAP Results1

Q3 2020


Q2 2020


Q3 2019

Adjusted Operating Margin

17.3%


15.4%


16.3%

Adjusted Net Income ($M)

$27.1


$21.1


$28.2

Adjusted Earnings Per Share

$1.45


$1.13


$1.51

Adjusted EBITDA ($M)

$47.9


$42.5


$47.4

Adjusted EBITDA Margin

23.7%


22.2%


21.4%


Net Sales by Operating Segment (dollars in millions)

Q3 2020


Q2 2020


Q3 2019

Advanced Connectivity Solutions (ACS)

$63.7


$70.9


$79.0

Elastomeric Material Solutions (EMS)

$86.4


$71.6


$94.9

Power Electronic Solutions (PES)

$47.9


$45.2


$43.1

Other

$3.9


$3.4


$4.8


1 - A reconciliation of GAAP to non-GAAP measures is provided in the schedules included below

Q3 2020 Summary of Results

Net sales of $201.9 million increased 5.6% versus the prior quarter. EMS and PES segment sales increased sequentially and were partially offset by lower ACS sales. EMS net sales increased in the portable electronics and EV/HEV battery markets, partially offset by a decline in mass transit market sales. EMS general industrial sales were approximately flat sequentially. PES net sales increased in the EV/HEV and renewable energy markets, partially offset by a decline in the industrial power and mass transit markets. ACS net sales decreased in the wireless infrastructure market, partially offset by higher ADAS sales and strong defense market demand. Currency exchange rates favorably impacted total company net sales in the third quarter of 2020 by $2.7 million compared to prior quarter net sales.

Gross margin was 37.4%, compared to 36.6% in the prior quarter. The increase in gross margin was due to higher volumes, favorable mix and operational cost savings.

Selling, general and administrative expenses increased by $8.5 million sequentially to $50.2 million, primarily due to higher accelerated intangible amortization expense. In line with the Company's expectations, $11.7 million of accelerated intangible amortization expense was incurred related to the DSP business in the third quarter. This compared to $3.9 million of accelerated expense in the prior quarter. An additional $11.7 million of accelerated amortization expense is expected to be recognized in the fourth quarter of 2020.

Restructuring and impairment charges of $9.4 million were recognized in the third quarter related to manufacturing footprint optimization plans involving certain Europe and Asia locations. These changes are planned to better align capacity with end market demand, improve factory utilization and increase cost competitiveness. Additional restructuring charges of between $2.5 and $4.5 million are expected in the fourth quarter of 2020.

GAAP operating margin of 4.4% decreased by approximately 660 basis points sequentially due to incremental accelerated intangible amortization expense of $7.8 million and restructuring related charges of $9.4 million, partially offset by improved gross margin. Adjusted operating margin of 17.3% increased by approximately 190 basis points versus the prior quarter, primarily as a result of improved gross margin.

GAAP earnings per share were $0.37, compared to earnings per share of $0.78 in the second quarter of 2020. The decrease in GAAP earnings resulted from higher restructuring related expenses and an increase in accelerated intangible amortization, partially offset by higher gross margin and lower tax expense. On an adjusted basis, earnings were $1.45 per diluted share compared to adjusted earnings of $1.13 per diluted share in the prior quarter. The increase in adjusted earnings resulted from the improved gross margin and lower tax expense.

Ending cash and cash equivalents was $186.1 million, a decrease of $112.6 million versus the prior quarter. The Company generated strong free cash flow of $47.9 million in the third quarter of 2020. Net cash provided by operating activities of $58.7 million was offset by $163.0 million of principal payments made on the outstanding borrowings under the Company’s revolving credit facility and capital expenditures of $10.8 million. At the end of the third quarter of 2020, cash exceeded borrowings by $126.1 million.


Financial Outlook


Q4 2020

Net Sales ($M)

$195 to $210

Gross Margin

37.0% to 38.0%

Earnings Per Share1

$0.50 to $0.70

Non-GAAP Earnings Per Share2

$1.30 to $1.50


2020

Effective Tax Rate

23% to 24%

Capital Expenditures ($M)

$40 to $45


1 -Includes an expected $11.7 million of accelerated intangible amortization expense associated with the DSP business

2- A reconciliation of GAAP to non-GAAP measures is provided in the schedules included below


About Rogers Corporation

Rogers Corporation (NYSE:ROG) is a global leader in engineered materials to power, protect, and connect our world. With more than 180 years of materials science experience, Rogers delivers high-performance solutions that enable the company’s growth drivers -- advanced connectivity and advanced mobility applications, as well as other technologies where reliability is critical. Rogers delivers Power Electronics Solutions for energy-efficient motor drives, e-Mobility and renewable energy; Elastomeric Material Solutions for sealing, vibration management and impact protection in mobile devices, transportation interiors, industrial equipment and performance apparel; and Advanced Connectivity Solutions for wireless infrastructure, automotive safety and radar systems. Headquartered in Arizona (USA), Rogers operates manufacturing facilities in the United States, China, Germany, Belgium, Hungary, and South Korea, with joint ventures and sales offices worldwide.

Safe Harbor Statement

This release contains forward-looking statements, which concern our plans, objectives, outlook, goals, strategies, future events, future net sales or performance, capital expenditures, future restructuring, plans or intentions relating to expansions, business trends and other information that is not historical information. All forward-looking statements are based upon information available to us on the date of this release and are subject to risks, uncertainties and other factors, many of which are outside of our control, which could cause actual results to differ materially from the results discussed in the forward-looking statements. Risks and uncertainties that could cause such results to differ include: the duration and impacts of the novel coronavirus global pandemic and efforts to contain its transmission, including the effect of these factors on our business, suppliers, customers, end users and economic conditions generally; failure to capitalize on, volatility within, or other adverse changes with respect to the Company's growth drivers, including advanced mobility and advanced connectivity, such as delays in adoption or implementation of new technologies; uncertain business, economic and political conditions in the United States (U.S.) and abroad, particularly in China, South Korea, Germany, Hungary and Belgium, where we maintain significant manufacturing, sales or administrative operations; the trade policy dynamics between the U.S. and China reflected in trade agreement negotiations and the imposition of tariffs and other trade restrictions, including trade restrictions on Huawei Technologies Co., Ltd.; fluctuations in foreign currency exchange rates; our ability to develop innovative products and the extent to which our products are incorporated into end-user products and systems and the extent to which end-user products and systems incorporating our products achieve commercial success; the ability of our sole or limited source suppliers to deliver certain key raw materials, including commodities, to us in a timely and cost-effective manner; intense global competition affecting both our existing products and products currently under development; business interruptions due to catastrophes or other similar events, such as natural disasters, war, terrorism or public health crises; failure to realize, or delays in the realization of anticipated benefits of acquisitions and divestitures due to, among other things, the existence of unknown liabilities or difficulty integrating acquired businesses; our ability to attract and retain management and skilled technical personnel; our ability to protect our proprietary technology from infringement by third parties and/or allegations that our technology infringes third party rights; changes in effective tax rates or tax laws and regulations in the jurisdictions in which we operate; failure to comply with financial and restrictive covenants in our credit agreement or restrictions on our operational and financial flexibility due to such covenants; the outcome of ongoing and future litigation, including our asbestos-related product liability litigation; changes in environmental laws and regulations applicable to our business; and disruptions in, or breaches of, our information technology systems. For additional information about the risks, uncertainties and other factors that may affect our business, please see our most recent annual report on Form 10-K and any subsequent reports filed with the Securities and Exchange Commission, including quarterly reports on Form 10-Q. Rogers Corporation assumes no responsibility to update any forward-looking statements contained herein except as required by law.

Conference call and additional information

A conference call to discuss the results for the third quarter of 2020 will take place today, Thursday, October 29, 2020 at 5pm ET.

A live webcast of the event and the accompanying presentation can be accessed on the Rogers Corporation website at https://www.rogerscorp.com/investors.

To participate, please dial:

1-800-574-8929

Toll-free in the United States

1-973-935-8524

Internationally

The passcode for the live teleconference is 9474445.

If you are unable to attend, a conference call playback will be available from October 29, 2020 at approximately 8 pm ET through November 13, 2020 at 11:59 pm ET, by dialing 1-855-859-2056 from the United States, and 1-404-537-3406 from outside of the US, each with passcode 9474445.

Additionally, the archived webcast will be available on the Rogers website at approximately 8 pm ET October 30, 2020.

Additional information

Please contact the Company directly via email or visit the Rogers website.


(Financial statements follow)


Condensed Consolidated Statements of Operations (Unaudited)


Three Months Ended


Nine Months Ended

(DOLLARS AND SHARES IN THOUSANDS, EXCEPT PER SHARE AMOUNTS)

September 30,

2020


September 30,

2019


September 30,

2020


September 30,

2019

Net sales

$

201,944


$

221,842


$

591,911


$

704,492


Cost of sales


126,426


142,975


380,794


454,403


Gross margin


75,518


78,867


211,117


250,089


Selling, general and administrative expenses


50,230


40,448


132,254


127,349


Research and development expenses


7,085


7,830


22,185


23,282


Restructuring and impairment charges


9,413


580


9,413


2,485


Other operating (income) expense, net


(4

)


124


(96

)


1,075


Operating income


8,794


29,885


47,361


95,898


Equity income in unconsolidated joint ventures


937


1,498


3,177


4,077


Pension settlement charges


(55

)


Other income (expense), net


1,446


(918

)


1,294


(915

)

Interest expense, net


(3,553

)


(1,747

)


(6,539

)


(5,723

)

Income before income tax expense


7,624


28,718


45,238


93,337


Income tax expense


618


5,331


10,453


17,258


Net income

$

7,006


$

23,387


$

34,785


$

76,079


Basic earnings per share

$

0.37


$

1.26


$

1.86


$

4.10


Diluted earnings per share

$

0.37


$

1.25


$

1.86


$

4.07


Shares used in computing:


Basic earnings per share


18,688


18,581


18,678


18,569


Diluted earnings per share


18,713


18,724


18,695


18,715


Condensed Consolidated Statements of Financial Position (Unaudited)

(DOLLARS AND SHARES IN THOUSANDS, EXCEPT PAR VALUE)

September 30,

2020


December 31,

2019

Assets


Current assets


Cash and cash equivalents

$

186,123


$

166,849


Accounts receivable, less allowance for doubtful accounts of $1,366 and $1,691


138,611


122,285


Contract assets


22,061


22,455


Inventories


109,733


132,859


Prepaid income taxes


3,406


4,524


Asbestos-related insurance receivables, current portion


4,292


4,292


Other current assets


10,217


10,838


Total current assets


474,443


464,102


Property, plant and equipment, net of accumulated depreciation of $370,164 and $341,119


266,104


260,246


Investments in unconsolidated joint ventures


12,755


16,461


Deferred income taxes


26,907


17,117


Goodwill


265,781


262,930


Other intangible assets, net of amortization


132,818


158,947


Pension assets


4,337


12,790


Asbestos-related insurance receivables, non-current portion


74,024


74,024


Other long-term assets


14,871


6,564


Total assets

$

1,272,040


$

1,273,181


Liabilities and Shareholders’ Equity


Current liabilities


Accounts payable

$

35,886


$

33,019


Accrued employee benefits and compensation


35,991


29,678


Accrued income taxes payable


6,235


10,649


Asbestos-related liabilities, current portion


5,007


5,007


Other accrued liabilities


23,237


21,872


Total current liabilities


106,356


100,225


Borrowings under revolving credit facility


60,000


123,000


Pension and other postretirement benefits liabilities


1,654


1,567


Asbestos-related liabilities, non-current portion


80,540


80,873


Non-current income tax


15,509


10,423


Deferred income taxes


9,497


9,220


Other long-term liabilities


11,460


13,973


Shareholders’ equity


Capital stock - $1 par value; 50,000 authorized shares; 18,676 and 18,577 shares issued and outstanding


18,676


18,577


Additional paid-in capital


145,010


138,526


Retained earnings


858,487


823,702


Accumulated other comprehensive loss


(35,149

)


(46,905

)

Total shareholders' equity


987,024


933,900


Total liabilities and shareholders' equity

$

1,272,040


$

1,273,181


Reconciliation of non-GAAP financial measures to the comparable GAAP measures

Non-GAAP financial measures:

This earnings release includes the following financial measures that are not presented in accordance with generally accepted accounting principles in the United States of America (“GAAP”):

(1) Adjusted net income, which the Company defines as net income excluding amortization of acquisition intangible assets and discrete items, such as acquisition and related integration costs, environmental accrual adjustment, gains or losses on the sale or disposal of property, plant and equipment, pension settlement charges, restructuring, severance, impairment and other related costs, and the related income tax effect on these items (collectively, “discrete items”), and transition services, net;

(2) Adjusted earnings per diluted share, which the Company defines as earnings per diluted share excluding amortization of acquisition intangible assets, discrete items, transition services, net and the impact of including dilutive securities divided by adjusted weighted average shares outstanding - diluted;

(3) Adjusted EBITDA, which the Company defines as net income excluding interest expense, net, income tax expense, depreciation and amortization, stock-based compensation expense, transition services lease income and discrete items;

(4) Adjusted operating margin, which the Company defines as operating margin excluding acquisition-related amortization of intangible assets, discrete items excluding pension settlement charges, and transition services, net;

(5) Free cash flow, which the Company defines as net cash provided by operating activities less non-acquisition capital expenditures.

Management believes adjusted net income, adjusted earnings per diluted share, adjusted EBITDA and adjusted operating margin are useful to investors because they allow for comparison to the Company’s performance in prior periods without the effect of items that, by their nature, tend to obscure the Company’s core operating results due to potential variability across periods based on the timing, frequency and magnitude of such items. As a result, management believes that these measures enhance the ability of investors to analyze trends in the Company’s business and evaluate the Company’s performance relative to peer companies. Management also believes free cash flow is useful to investors as an additional way of viewing the Company's liquidity and provides a more complete understanding of factors and trends affecting the Company's cash flows. However, non-GAAP financial measures have limitations as analytical tools and should not be considered in isolation from, or solely as alternatives to, financial measures prepared in accordance with GAAP. In addition, these non-GAAP financial measures may differ from similarly named measures used by other companies. Reconciliations of the differences between these non-GAAP financial measures and their most directly comparable financial measures calculated in accordance with GAAP are set forth below.


Reconciliation of GAAP net income to adjusted net income:

(amounts in millions)

2020


2019

Net income

Q3


Q2


Q3

GAAP net income

$

7.0


$

14.5


$

23.4


Acquisition and related integration costs


0.1


0.4


0.5


Environmental accrual adjustment


(0.2

)


Loss on sale or disposal of property, plant and equipment


0.1


Restructuring, severance, impairment and other related costs


10.7


0.6


1.3


Transition services, net


0.1


Acquisition intangible amortization


15.4


7.5


4.4


Income tax effect of non-GAAP adjustments and intangible amortization


(6.1

)


(1.9

)


(1.5

)

Adjusted net income

$

27.1


$

21.1


$

28.2


*Values in table may not add due to rounding.


Reconciliation of GAAP earnings per diluted share to adjusted earnings per diluted share*:


2020


2019

Earnings per diluted share

Q3


Q2


Q3

GAAP earnings per diluted share

$

0.37

$

0.78


$

1.25


Acquisition and related integration costs


0.01


0.02


0.02

Environmental accrual adjustment


(0.01

)


Restructuring, severance, impairment and other related costs


0.43


0.02


0.05

Transition services, net


0.01

Total discrete items

$

0.44

$

0.04


$

0.08


Earnings per diluted share adjusted for discrete items

$

0.81

$

0.82


$

1.33


Acquisition intangible amortization

$

0.64

$

0.31


$

0.18


Adjusted earnings per diluted share

$

1.45

$

1.13


$

1.51

*Values in table may not add due to rounding.


Reconciliation of GAAP net income to adjusted EBITDA*:


2020


2019

(amounts in millions)

Q3


Q2

Q3

GAAP Net income

$

7.0

$

14.5


$

23.4


Interest expense, net


3.6


1.8


1.8


Income tax expense


0.6


6.4


5.3


Depreciation


7.3


7.4


7.6


Amortization


15.4


7.6


4.4


Stock-based compensation expense


3.3


3.9


3.2


Acquisition and related integration costs


0.1


0.4


0.5


Environmental accrual adjustment


(0.2

)


Loss on sale or disposal of property, plant and equipment


0.1


Restructuring, severance, impairment and other related costs


10.6


0.6


1.3


Transition services lease income


(0.1

)

Adjusted EBITDA

$

47.9

$

42.5


$

47.4


*Values in table may not add due to rounding.


Reconciliation of GAAP operating margin to adjusted operating margin*:


2020

2019

Operating margin

Q3


Q2


Q3

GAAP operating margin

4.4

%

11.0

%

13.5

%


Acquisition and related integration costs

0.1

%

0.2

%

0.2

%

Environmental accrual adjustment

0.0

%

(0.1

%)

0.0

%

Restructuring, severance, impairment and other related costs

5.3

%

0.3

%

0.6

%

Total discrete items

5.3

%

0.5

%

0.8

%

Operating margin adjusted for discrete items

9.7

%

11.5

%

14.3

%


Acquisition intangible amortization

7.6

%

3.9

%

2.0

%


Adjusted operating margin

17.3

%

15.4

%

16.3

%

*Percentages in table may not add due to rounding.


Reconciliation of net cash provided by operating activities to free cash flow*:


2020


2019

(amounts in millions)

Q3


Q2


Q3

Net cash provided by operating activities

$

58.7


$

46.3


$

48.2


Non-acquisition capital expenditures


(10.8

)


(7.0

)


(14.8

)

Free cash flow

$

47.9


$

39.3


$

33.4


*Values in table may not add due to rounding.


Reconciliation of GAAP earnings per diluted share to adjusted earnings per diluted share guidance for the 2020 third quarter:


Guidance

Q3 2020

GAAP earnings per diluted share

$0.19 - $0.39


Discrete items

$0.08


Acquisition intangible amortization*

$0.63


Adjusted earnings per diluted share

$0.90 - $1.10

*Includes an expected $11.7 million of accelerated intangible amortization expense associated with the DSP business

Reconciliation of GAAP earnings per diluted share to adjusted earnings per diluted share guidance for the 2020 fourth quarter:


Guidance

Q4 2020

GAAP earnings per diluted share


$0.50 - $0.70


Discrete items


$0.17


Acquisition intangible amortization*


$0.63


Adjusted earnings per diluted share


$1.30 - $1.50

*Includes an expected $11.7 million of accelerated intangible amortization expense associated with the DSP business


Contacts

Investor contact:
Steve Haymore
Phone: 480-917-6026
Email: This email address is being protected from spambots. You need JavaScript enabled to view it.

Website address: http://www.rogerscorp.com

New Time - October 29, 2020 – 5:30 P.M. ET

ALEXANDRIA, Va.--(BUSINESS WIRE)--VSE Corporation (NASDAQ: VSEC, “VSE”, or the “Company”), a leading provider of distribution and repair services for land, sea and air transportation assets in the public and private sectors, today announced that it will conduct a conference call today, October 29, 2020 at 5:30 P.M. ET, to review the Company’s third quarter 2020 financial results, discuss recent events and conduct a question-and-answer session.


As previously disclosed, VSE postponed its quarterly call, initially scheduled for earlier today, due to a hurricane-related system-wide outage at a conference call vendor. Conference call systems at the vendor have since been restored.

A webcast of the conference call and accompanying presentation materials will be available in the Investor Relations section of VSE’s website at ir.vsecorp.com. To listen to a live broadcast, go to the site at least 15 minutes prior to the scheduled start time in order to register, download, and install any necessary audio software.

To participate in the live teleconference:

Domestic Live: 855-327-6837
International Live: 631-891-4304

To listen to a replay of the teleconference, which will be available through November 12, 2020:

Domestic Replay: 844-512-2921
International Replay: 412-317-6671
Conference ID: 10011750

ABOUT VSE CORPORATION

VSE is a leading provider of aftermarket distribution and repair services for land, sea and air transportation assets for government and commercial markets. Core services include maintenance, repair and overhaul (MRO) services, parts distribution, supply chain management and logistics, engineering support, and consulting and training services for global commercial, federal, military and defense customers. VSE also provides information technology and energy consulting services. For additional information regarding VSE’s services and products, visit us at www.vsecorp.com.

FORWARD LOOKING STATEMENTS

This release contains statements that, to the extent they are not recitations of historical fact, constitute “forward-looking statements” as defined in the Private Securities Litigation Reform Act of 1995. All such statements are intended to be subject to the safe harbor protection provided by applicable securities laws. For discussions identifying some important factors that could cause actual VSE results to differ materially from those anticipated in the forward-looking statements in this news release, see VSE’s public filings with the Securities and Exchange Commission. The forward-looking statements included herein are only made as of the date hereof, and VSE specifically disclaims any obligation to update these statements in the future.


Contacts

INVESTOR RELATIONS CONTACT: Noel Ryan | Phone: 720.778.2415


MIAMI--(BUSINESS WIRE)--World Fuel Services Corporation (NYSE: INT)


Third-Quarter 2020 Highlights

  • Total gross profit of $214.0 million, down 30% year-over-year
  • GAAP net income of $82.0 million, or $1.29 per diluted share
  • After-tax gain on sale of Multi Service of $63.9 million, or $1.00 per diluted share
  • Adjusted net income of $20.7 million, or $0.33 per diluted share
  • Adjusted EBITDA of $64.3 million

“Modest improvements in certain areas of our global business, as well as the continued focus on cost containment and portfolio refinement, enabled us to profitably execute in what continues to be a weak operating environment,” stated Michael J. Kasbar, chairman and chief executive officer of World Fuel Services Corporation. “We are continuing to focus on refining our portfolio, actively seeking opportunities to invest in activities such as our World Kinect energy management business to contribute to accelerating the transition to a low carbon world.”

For the third quarter, our aviation segment generated gross profit of $97.6 million, a decrease of 38% year-over-year, driven by the decline in volume as a consequence of the depressed demand for air travel due to the COVID-19 pandemic, together with a reduction in our government-related activity in Afghanistan as a result of the ongoing drawdown of troops. Our marine segment generated gross profit of $32.0 million, a decrease of 40% year-over-year, principally attributable to lower volume and profitability due to a decline in demand as a consequence of the pandemic and lower average fuel prices. Our land segment generated gross profit of $84.3 million, a decrease of 12% year-over-year, primarily resulting from a decline in our retail, commercial and industrial activities in North America and a reduction in our government-related activity in Afghanistan.

“Through continued focus on working capital management, we generated $246 million of cash flow from operations during the third quarter and have now generated nearly $500 million of cash flow from operations during the first nine months of the year,” said Ira M. Birns, executive vice president and chief financial officer. “Combined with the proceeds received from the sale of the Multi Service business, we significantly reduced our debt balance during the quarter, resulting in a record level of liquidity.”

COVID-19 Update

Beginning in the first quarter of 2020, the aviation, marine and land transportation industries, along with global economic conditions generally, have been significantly impacted by the coronavirus pandemic. A large number of our customers in these industries have experienced substantial reductions in their operations, especially commercial airlines and cruise lines, which have been particularly impacted by ongoing travel restrictions. Customers in our marine and land segments have also been adversely affected by these restrictions and the reduction in operations of various businesses in affected regions.

While the COVID-19 pandemic and associated impacts on economic activity had a limited adverse effect on our results of operations and financial condition in the beginning of 2020, we experienced a sharp decline in demand and related sales during the second quarter, as large sectors of the global economy were adversely impacted by the crisis. While demand showed some moderate improvement during the third quarter of 2020, our results remained well below pre-pandemic levels. Since the level of activity in our business and that of our customers has historically been driven by the level of economic activity globally, we generally expect these negative impacts to continue through the balance of the year and into 2021 as the periodic increases in COVID-19 cases have caused delays in the full reopening of various economies around the world.

In addition to the actions we took during the first quarter in light of the unprecedented effects of the COVID-19 pandemic on the global economy, during the second and third quarters of 2020, we continued to focus on reducing costs and restructuring our operations to improve operating efficiencies. While the ultimate duration and impact of the pandemic on our business and our customers' operations remains unclear, we will continue to seek additional opportunities to further enhance our operating efficiencies and reduce costs throughout the current crisis and eventual recovery.

Non-GAAP Financial Measures

This press release contains non-GAAP financial measures (collectively, the “Non-GAAP Measures”), including adjusted net income, adjusted diluted earnings per share, and adjusted earnings before interest, taxes, depreciation and amortization (“EBITDA”). The Non-GAAP Measures exclude acquisition and divestiture related expenses, restructuring costs, impairments, gains or losses on the extinguishment of debt and gains or losses on business dispositions primarily because we do not believe they are reflective of our core operating results. These changes were made to facilitate the evaluation of our current operating performance and comparisons to our past operating performance.

We believe that the Non-GAAP Measures, when considered in conjunction with our financial information prepared in accordance with GAAP, are useful to investors to further aid in evaluating the ongoing financial performance of the Company and to provide greater transparency as supplemental information to our GAAP results.

Non-GAAP financial measures should not be considered in isolation from, or as a substitute for, financial information prepared in accordance with GAAP. In addition, our presentation of the Non-GAAP Measures may not be comparable to the presentation of such metrics by other companies. Non-GAAP diluted earnings per common share is computed by dividing non-GAAP net income attributable to World Fuel Services and available to common shareholders by the sum of the weighted average number of shares of common stock, stock units, restricted stock entitled to dividends not subject to forfeiture and vested restricted stock units outstanding during the period and the number of additional shares of common stock that would have been outstanding if our outstanding potentially dilutive securities had been issued. Investors are encouraged to review the reconciliation of these Non-GAAP Measures to their most directly comparable GAAP financial measures in this press release and on our website.

Information Relating to Forward-Looking Statements

This release includes forward-looking statements within the meaning of the Private Securities Litigation Reform Act of 1995, including statements regarding our beliefs and expectations with respect to our focus on refining our portfolio and the opportunities to invest in activities such as our World Kinect energy management business, our expectations regarding our ability to contribute to the transition to a low carbon world, as well as our expectations about our liquidity and the impact of the coronavirus pandemic on us. These forward-looking statements are qualified in their entirety by cautionary statements and risk factor disclosures contained in the Company’s Securities and Exchange Commission (“SEC”) filings, including the Company’s most recent Annual Report on Form 10-K filed with the SEC. Actual results may differ materially from any forward-looking statements due to risks and uncertainties, including, but not limited to: our ability to effectively manage the effects of the COVID-19 pandemic, the extent of the impact of the pandemic on ours and our customers' sales, profitability, operations and supply chains due to the duration, severity and scope of travel restrictions, customer and counterparty creditworthiness and our ability to collect accounts receivable and settle derivative contracts, particularly for those customers most significantly impacted by the pandemic, sudden changes in the market price of fuel or extremely high or low fuel prices that continue for an extended period of time, the loss of, or reduced sales to a significant government customer, such as the North Atlantic Treaty Organization as a result of the ongoing troop withdrawal in Afghanistan, the availability of cash and sufficient liquidity to fund our working capital and strategic investment needs, particularly in light of the impact of the pandemic on the financial markets, adverse conditions in the markets or industries in which we or our customers and suppliers operate such as the current global economic environment as a result of the coronavirus pandemic, our failure to comply with restrictions and covenants in our senior revolving credit facility and our senior term loans, including our financial covenants, our ability to effectively utilize the proceeds from the sale of the Multi Service business and derive the expected benefits, our ability to manage the changes in supply and other market dynamics in the regions where we operate, our ability to successfully execute and achieve efficiencies, our ability to achieve the expected level of benefit from any restructuring activities and cost reduction initiatives, our ability to successfully implement our growth strategy and integrate acquired businesses and recognize the anticipated benefits, our ability to capitalize on new market opportunities, risks related to the complexity of U.S. Tax Cuts and Jobs Act and any subsequently issued regulations and our ability to accurately predict the impact on our effective tax rate and future earnings, our ability to effectively leverage technology and operating systems and realize the anticipated benefits, unanticipated tax liabilities or adverse results of tax audits, assessments, or disputes, potential liabilities and the extent of any insurance coverage, the outcome of pending litigation and other proceedings, the impact of quarterly fluctuations in results, particularly as a result of seasonality, supply disruptions, border closures and other logistical difficulties that can arise when sourcing and delivering fuel in areas that are actively engaged in war or other military conflicts, our failure to effectively hedge certain financial risks associated with the use of derivatives, uninsured losses, the impact of climate change and natural disasters, adverse results in legal disputes, and other risks detailed from time to time in our SEC filings. In addition, other current or potential risks and uncertainties related to the coronavirus pandemic include, but are not limited to: disruptions resulting from office and facility closures, reductions in operating hours, and changes in operating procedures, including additional cleaning and disinfecting procedures, possible infections or quarantining of our employees which could impact our ability to service our customers or operate our business, notices from customers, suppliers and other third parties asserting force majeure or other bases for their non-performance, losses on hedging transactions with customers arising from the decline in fuel prices and their inability to benefit from the reduced cost of fuel due to substantial reductions in their operations, heightened risk of cybersecurity issues as digital technologies may become more vulnerable and experience a higher rate of cyber-attacks in a remote connectivity environment, reduction of our global workforce to adjust to market conditions, including increased costs associated with severance payments, retention issues, and an inability to hire employees when market conditions improve, the impact of asset impairments, including any impairment of the carrying value of our goodwill in our aviation and land segments, as well as other accounting charges if expected future demand for our products and services materially decreases, a structural shift in the global economy and its demand for fuel and related products and services as a result of changes in the way people work, travel and interact, or in connection with a global recession. New risks emerge from time to time and it is not possible for management to predict all such risk factors or to assess the impact of such risks on our business. Accordingly, we undertake no obligation to publicly update or revise any forward-looking statements, whether as a result of new information, changes in expectations, future events, or otherwise, except as required by law.

About World Fuel Services Corporation

Headquartered in Miami, Florida, World Fuel Services is a global energy management company involved in providing energy procurement advisory services, supply fulfillment and transaction and payment management solutions to commercial and industrial customers, principally in the aviation, marine and land transportation industries. World Fuel Services sells fuel and delivers services to its clients at more than 8,000 locations in more than 200 countries and territories worldwide.

For more information, call 305-428-8000 or visit www.wfscorp.com.

-- Some amounts in this press release may not add due to rounding. All percentages have been calculated using unrounded amounts --

WORLD FUEL SERVICES CORPORATION

CONSOLIDATED BALANCE SHEETS

(Unaudited - In millions, except per share data)


As of


September 30,


December 31,


2020


2019

Assets:


Current assets:


Cash and cash equivalents


$

572.7


$

186.1


Accounts receivable, net


1,244.1


2,891.9


Inventories


291.0


593.3


Prepaid expenses


56.3


80.6


Short-term derivative assets, net


101.4


59.5


Other current assets


269.2


358.8


Total current assets


2,534.8


4,170.1


Property and equipment, net


347.8


360.9


Goodwill


848.2


843.7


Identifiable intangible and other non-current assets


661.5


617.7


Total assets


$

4,392.3


$

5,992.4


Liabilities:


Current liabilities:


Current maturities of long-term debt


$

19.6


$

54.1


Accounts payable


1,085.8


2,602.7


Customer deposits


118.5


126.7


Accrued expenses and other current liabilities


333.0


378.9


Total current liabilities


1,557.0


3,162.4


Long-term debt


506.9


574.7


Non-current income tax liabilities, net


215.6


210.1


Other long-term liabilities


193.0


151.3


Total liabilities


2,472.5


4,098.5


Commitments and contingencies


Equity:


World Fuel shareholders' equity:


Preferred stock, $1.00 par value; 0.1 shares authorized, none issued


Common stock, $0.01 par value; 100.0 shares authorized, 63.3 and 65.2 issued and outstanding as of September 30, 2020 and December 31, 2019, respectively


0.6


0.7


Capital in excess of par value


221.1


274.7


Retained earnings


1,846.6


1,761.3


Accumulated other comprehensive loss


(152.3)


(146.3)


Total World Fuel shareholders' equity


1,916.0


1,890.4


Noncontrolling interest


3.8


3.5


Total equity


1,919.8


1,893.9


Total liabilities and equity


$

4,392.3


$

5,992.4


WORLD FUEL SERVICES CORPORATION

CONSOLIDATED STATEMENTS OF INCOME AND COMPREHENSIVE INCOME

(Unaudited – In millions, except per share data)


For the Three Months Ended


For the Nine Months Ended


September 30,


September 30,


2020


2019


2020


2019

Revenue


$

4,482.7


$

9,322.7


$

15,656.2


$

27,460.9


Cost of revenue


4,268.7


9,017.0


14,969.6


26,635.6


Gross profit


214.0


305.7


686.6


825.3


Operating expenses:


Compensation and employee benefits


91.4


126.7


289.8


347.0


General and administrative


80.9


82.8


249.1


232.9


Asset impairments


18.6


Restructuring charges


2.9


2.6


7.7


6.3


175.2


212.0


565.1


586.2


Income from operations


38.8


93.6


121.5


239.2


Non-operating income (expenses), net:


Interest expense and other financing costs, net


(8.7)


(19.5)


(34.1)


(59.1)


Other income (expense), net


77.7


(3.3)


75.0


(0.3)


69.0


(22.8)


41.0


(59.4)


Income (loss) before income taxes


107.8


70.9


162.4


179.8


Provision for income taxes


25.4


21.5


49.0


55.5


Net income (loss) including noncontrolling interest


82.4


49.4


113.4


124.3


Net income (loss) attributable to noncontrolling interest


0.5


1.2


0.2


1.9


Net income (loss) attributable to World Fuel


$

82.0


$

48.2


$

113.1


$

122.4


Basic earnings per common share


$

1.29


$

0.74


$

1.77


$

1.84


Basic weighted average common shares


63.4


65.3


63.9


66.4


Diluted earnings per common share


$

1.29


$

0.73


$

1.76


$

1.84


Diluted weighted average common shares


63.6


65.7


64.1


66.7


Comprehensive income:


Net income (loss) including noncontrolling interest


$

82.4


$

49.4


$

113.4


$

124.3


Other comprehensive income (loss):


Foreign currency translation adjustments


15.1


(11.5)


(12.9)


(17.4)


Cash flow hedges, net of income tax expense of $2.1 and expense of $2.8 for the three months ended September 30, 2020 and 2019, respectively, and net of income tax expense of $2.3 and benefit of $2.4 for the nine months ended September 30, 2020 and 2019, respectively


6.1


7.9


6.8


(6.8)


Other comprehensive income (loss)


21.2


(3.6)


(6.0)


(24.2)


Comprehensive income (loss) including noncontrolling interest


103.6


45.8


107.3


100.1


Comprehensive income (loss) attributable to noncontrolling interest


(0.8)


(1.5)


Comprehensive income (loss) attributable to World Fuel


$

103.6


$

46.6


$

107.3


$

101.6


WORLD FUEL SERVICES CORPORATION

CONSOLIDATED STATEMENTS OF CASH FLOWS

(Unaudited - In millions)


For the Three Months Ended


For the Nine Months Ended


September 30,


September 30,


2020


2019


2020


2019

Cash flows from operating activities:


Net income including noncontrolling interest


$

82.4


$

49.4


$

113.4


$

124.3


Adjustments to reconcile net income including noncontrolling interest to net cash provided by operating activities:


Depreciation and amortization


22.1


21.1


66.3


64.2


Provision for bad debt


23.3


13.8


57.9


19.6


Share-based payment award compensation costs


1.9


4.6


2.5


12.4


Deferred income tax expense (benefit)


(2.6)


(3.3)


(7.9)


1.4


Foreign currency (gains) losses, net


(2.9)


(2.6)


0.2


(0.5)


Gain on sale of business


(80.0)


(80.0)


Other


12.2


0.6


12.4


0.3


Changes in assets and liabilities, net of acquisitions:


Accounts receivable, net


(179.0)


33.6


1,283.6


21.1


Inventories


16.6


(13.0)


299.4


(53.4)


Prepaid expenses


16.1


22.5


(7.2)


Short-term derivative assets, net


42.1


(40.4)


(68.3)


127.2


Other current assets


55.2


(67.3)


72.3


(58.4)


Cash collateral with counterparties


28.3


34.8


45.8


(3.1)


Other non-current assets


10.9


(5.8)


(7.6)


28.1


Accounts payable


205.5


(33.4)


(1,321.6)


36.6


Customer deposits


(8.2)


(23.3)


(10.6)


(3.8)


Accrued expenses and other current liabilities


(6.3)


84.1


(31.5)


(59.7)


Non-current income tax, net and other long-term liabilities


8.0


(19.8)


41.8


(80.2)


Total adjustments


163.1


(16.4)


377.2


44.4


Net cash provided by (used in) operating activities


245.5


33.0


490.6


168.7


Cash flows from investing activities:


Acquisition of business, net of cash acquired


2.0


(128.6)


Proceeds from sale of business, net of divested cash


268.4


268.4


Capital expenditures


(12.6)


(22.2)


(45.5)


(59.5)


Other investing activities, net


(2.2)


0.7


(7.5)


4.5


Net cash provided by (used in) investing activities


255.6


(21.5)


86.9


(55.1)


Cash flows from financing activities:


Borrowings of debt


15.0


1,254.8


2,095.0


4,452.4


Repayments of debt


(589.1)


(1,249.8)


(2,202.8)


(4,468.4)


Dividends paid on common stock


(6.3)


(6.6)


(19.3)


(14.6)


Repurchases of common stock


(55.6)


(65.4)


Other financing activities, net


(3.3)


(4.5)


(6.0)


(7.1)


Net cash provided by (used in) financing activities


(583.7)


(6.0)


(188.8)


(103.1)


Effect of exchange rate changes on cash and cash equivalents


9.7


(5.0)


(2.0)


(3.7)


Net increase (decrease) in cash and cash equivalents


(72.9)


0.4


386.7


6.7


Cash and cash equivalents, as of the beginning of the period


645.7


218.1


186.1


211.7


Cash and cash equivalents, as of the end of the period


$

572.7


$

218.5


$

572.7


$

218.5


WORLD FUEL SERVICES CORPORATION

RECONCILIATION OF GAAP TO NON-GAAP FINANCIAL MEASURES

(Unaudited - In millions, except per share data)


For the Three Months Ended


For the Nine Months Ended


September 30,


September 30,

Non-GAAP financial measures and reconciliation:


2020


2019


2020


2019

Net income attributable to World Fuel


$

82.0


$

48.2


$

113.1


$

122.4


Loss on extinguishment of debt


0.5


0.5


Acquisition and divestiture related expenses


0.5


0.3


2.7


1.1


Gain on sale of business


(80.0)


(80.0)


Asset impairments


18.6


Restructuring charges


2.9


2.6


7.7


6.3


Income tax impacts


15.4


(0.8)


10.3


(1.8)


Adjusted net income attributable to World Fuel


$

20.7


$

50.7


$

72.4


$

128.4


Diluted earnings per common share


$

1.29


$

0.73


$

1.76


$

1.84


Loss on extinguishment of debt


0.01


0.01


Acquisition and divestiture related expenses


0.01


0.04


0.02


Gain on sale of business


(1.26)


(1.25)


Asset impairments


0.29


Restructuring charges


0.05


0.04


0.12


0.09


Income tax impacts


0.24


(0.01)


0.16


(0.03)


Adjusted diluted earnings per common share


$

0.33


$

0.77


$

1.13


$

1.92


For the Three Months Ended


For the Nine Months Ended


September 30,


September 30,

Non-GAAP financial measures and reconciliation:


2020


2019


2020


2019

Income from operations


$

38.8


$

93.6


$

121.5


$

239.2


Depreciation and amortization


22.1


21.1


66.3


64.2


Acquisition and divestiture related expenses


0.5


0.3


2.7


1.1


Asset impairments


18.6


Restructuring charges


2.9


2.6


7.7


6.3


Adjusted EBITDA (1)


$

64.3


$

117.6


$

216.8


$

310.7


(1)


The Company defines adjusted EBITDA as income from operations, excluding the impact of depreciation and amortization, and items that are considered to be non-operational and not representative of our core business, including those associated with acquisition and divestiture related expenses, asset impairments, and restructuring charges.

WORLD FUEL SERVICES CORPORATION

BUSINESS SEGMENTS INFORMATION

(Unaudited - In millions)


For the Three Months Ended


For the Nine Months Ended


September 30,


September 30,

Revenue:


2020


2019


2020


2019

Aviation segment


$

1,596.2


$

4,743.0


$

6,381.0


$

13,780.8


Land segment


1,645.2


2,555.8


4,948.8


7,712.4


Marine segment


1,241.2


2,023.9


4,326.4


5,967.7


$

4,482.7


$

9,322.7


$

15,656.2


$

27,460.9


Gross profit:


Aviation segment


$

97.6


$

156.9


$

282.6


$

411.7


Land segment


84.3


95.4


275.4


288.6


Marine segment


32.0


53.4


128.6


125.0


$

214.0


$

305.7


$

686.6


$

825.3


Income from operations:


Aviation segment


$

29.2


$

86.3


$

67.3


$

215.4


Land segment


18.8


13.4


54.1


46.2


Marine segment


8.2


20.6


55.4


44.2


56.2


120.3


176.8


305.9


Corporate overhead - unallocated


(17.4)


(26.7)


(55.3)


(66.7)


$

38.8


$

93.6


$

121.5


$

239.2


SALES VOLUME SUPPLEMENTAL INFORMATION

(Unaudited - In millions)


For the Three Months Ended


For the Nine Months Ended


September 30,


September 30,

Volume (Gallons):


2020


2019


2020


2019

Aviation Segment


1,017.4


2,174.6


3,550.2


6,289.1


Land Segment (1)


1,241.6


1,350.7


3,790.8


4,025.9


Marine Segment (2)


1,151.2


1,457.2


3,499.1


4,178.8


Consolidated Total


3,410.1


4,982.5


10,840.1


14,493.9


Contacts

World Fuel Services Corporation
Ira M Birns, 305-428-8000
Executive Vice President & Chief Financial Officer

Glenn Klevitz, 305-428-8000
Vice President, Treasurer & Investor Relations


Read full story here
Offshore Source Logo

Offshore Source keeps you updated with relevant information concerning the Offshore Energy Sector.

Any views or opinions represented on this website belong solely to the author and do not represent those of the people, institutions or organizations that Offshore Source or collaborators may or may not have been associated with in a professional or personal capacity, unless explicitly stated.

Corporate Offices

Technology Systems Corporation
8502 SW Kansas Ave
Stuart, FL 34997

info@tscpublishing.com