Business Wire News

- CEO Kenny Young’s contract extended through end of 2023


- Chief Strategy Officer Henry Bartoli to provide strategic consulting services through 2021

AKRON, Ohio--(BUSINESS WIRE)--Babcock & Wilcox (B&W) (NYSE: BW) announced today a three-year extension of the contract under which Kenny Young serves as B&W’s CEO, through December 31, 2023. Young also serves as Chairman of the B&W Board of Directors.

Since joining B&W as CEO in November 2018, Young has led a significant turnaround of the Company, including its recovery from losses related to several historical European EPC loss projects, a return to its core technology and delivery model, the implementation of $119 million in cost savings initiatives, and the extension of its credit facility for two years. The Company is now executing a strategic organizational and global branding initiative that is driving the expansion of B&W’s sales, service and business development teams globally. This includes expanding in Europe, Asia, and the Middle East with local offices, sales, and service personnel to provide better service to its customers.

“I am fully committed to B&W’s future and look forward to accelerating the significant progress we have made to strengthen our core businesses and provide shareholder returns,” Young said. “I’m also excited about working with our team to unlock the potential of B&W’s global brands as we grow our business profitably and execute quality projects around the world. B&W is an outstanding company – one with industry-leading technology that helps achieve a clean, sustainable energy and industrial infrastructure.”

The Company also announced that the employment agreement with its Chief Strategy Officer Henry Bartoli has been extended to December 31, 2020, after which time Bartoli will serve in a consulting capacity with the company for a one-year term through December 31, 2021. He will also continue to serve as a member of B&W’s Board of Directors.

“B&W has made an incredible transformation over the last few years and I look forward to working with this highly experienced and talented leadership team and employees to further strengthen our business as we capitalize on the strong pipeline of new opportunities around the world,” Bartoli said.

More information on these matters can be found on the related Form 8-K filed with the SEC today.

About B&W

Headquartered in Akron, Ohio, B&W is a global leader in energy and environmental technologies and services for the power and industrial markets. Follow B&W on LinkedIn and learn more at www.babcock.com.

Forward-Looking Statements

B&W cautions that this release contains forward-looking statements, including, without limitation, statements relating to cost savings initiatives, the strategic organization and global branding initiative, and the global project opportunities. These forward-looking statements are based on management’s current expectations and involve a number of risks and uncertainties. For a more complete discussion of these risk factors, see our filings with the Securities and Exchange Commission, including our most recent annual report on Form 10-K. If one or more of these risks or other risks materialize, actual results may vary materially from those expressed. We caution readers not to place undue reliance on these forward-looking statements, which speak only as of the date of this release, and we undertake no obligation to update or revise any forward-looking statement, except to the extent required by applicable law.


Contacts

Investor Contact:
Megan Wilson
Vice President, Corporate Development & Investor Relations
Babcock & Wilcox
704.625.4944 | This email address is being protected from spambots. You need JavaScript enabled to view it.

Media Contact:
Ryan Cornell
Public Relations
Babcock & Wilcox
330.860.1345 | This email address is being protected from spambots. You need JavaScript enabled to view it.

CARLSBAD, Calif. & MINNEAPOLIS--(BUSINESS WIRE)--#positiveimpact--Veteran impact investing firm North Sky Capital, LLC (“North Sky”) and development, technology, and operations partner Anaergia Services, LLC (“Anaergia”), are pleased to announce the start of construction of a renewable natural gas facility at the Victor Valley Wastewater Reclamation Authority (VVWRA), located in San Bernardino County, California.


The Public Private Partnership (P3) involving VVWRA, Anaergia and North Sky demonstrates a replicable model to meet California organic waste recycling mandates and improve wastewater infrastructure resiliency: retrofitting anaerobic digestion infrastructure to convert organic waste and sludge into pipeline quality renewable natural gas.

The project will utilize Anaergia’s Omnivore high solids anaerobic digestion retrofit to triple capacity and increase redundancy of the existing digester infrastructure. Sludge and food waste will be digested to generate biogas that will be conditioned and upgraded into pipeline quality natural gas utilizing systems designed and supplied by Anaergia affiliates. Additionally, Anaergia will operate the gas upgrading facility.

“VVWRA is committed to protecting public health and the environment in the Victor Valley, and this partnership reflects our three core values: collaboration, dedication, and integrity,” said VVWRA General Manager Darron Poulsen. “This project provides operational and capacity resiliency for the future of VVWRA by improving our infrastructure with greater operational flexibility and increased digester redundancy and capacity needed for future growth, while benefiting the agency economically.”

“The VVWRA facility is a great model for use in California: leveraging the existing wastewater treatment plant to meet organic waste recycling requirements, increasing yields of renewable energy, and improving publicly owned infrastructure,” said Andrew Benedek, Anaergia’s Chairman and CEO. “This partnership with North Sky boosts our capability to deliver organics recycling and energy resiliency projects at California wastewater plants, while building a sustainable future for the surrounding communities.”

“The Victor Valley project is a result of the state of California’s steadfast commitment to clean fuels and the waste diversion requirements set forth in Senate Bill 1383. We look forward to our partnership with Anaergia, a market leader with deep experience in this sector, and with the VVWRA to build this sustainable infrastructure project,” added Adam Bernstein, Managing Director at North Sky Capital. “This investment is a good example of the type of impact investments North Sky has completed over the last two decades.”

The project is located in an Opportunity Zone created by the Tax Cuts and Jobs Act of 2017. California Opportunity Zones support new investments in environmental justice, sustainability, climate change, and affordable housing.

The project will beneficially reduce more than 6,000 metric tons of methane (1.5 million CO2 tons equivalent) per year, which otherwise would have been flared or released into the atmosphere. The energy generated will be equivalent to displacing more than two million gallons of diesel fuel per year. Additionally, this project is expected to create approximately 30 prevailing wage jobs via construction and related work.

About Anaergia:

Anaergia is part of Anaergia Inc.: the global technology leader in recovering value from waste for the municipal, industrial, and agriculture sectors. Through its proven portfolio of proprietary technologies, Anaergia’s integrated solutions create value for its customers in the forms of renewable energy, quality fertilizers, and clean water, while dramatically reducing the cost of waste management. Anaergia operates out of eight regional offices as well as three manufacturing plants. Anaergia’s technologies are in use at over a thousand resource recovery facilities worldwide, reducing greenhouse gas emissions while creating new revenue sources for its clients. For more information on Anaergia, please visit www.anaergia.com or contact This email address is being protected from spambots. You need JavaScript enabled to view it..

About North Sky:

North Sky is a 20-year old private markets firm and a recognized thought leader in impact investing. Founded in 2000, North Sky has raised approximately $1.5 billion of commitments across its various strategies, including approximately $1 billion across nine impact funds. Three of North Sky’s impact funds focus on investing in the development, construction, and/or operations of sustainable infrastructure projects in North America. North Sky’s sustainable infrastructure funds have invested an aggregate $565 million across 30 clean energy, waste and water infrastructure investments since 2010. These investments total 2.7 GW of clean energy generating capacity in operation or development, and have produced approximately 2 million hours of high-quality green construction jobs. To learn more about North Sky and download the firm’s 2020 Impact Report, please visit www.northskycapital.com.

About VVWRA:

VVWRA is a regional resource recovery agency that provides wastewater treatment services for Apple Valley, Hesperia, Victorville, Spring Valley Lake and Oro Grande.


Contacts

Jeremy Milner
BackBay Communications
This email address is being protected from spambots. You need JavaScript enabled to view it.
401-862-9422

VANCOUVER, British Columbia--(BUSINESS WIRE)--$GRN #RNG--Greenlane Renewables Inc. (“Greenlane”) (TSXV: GRN / FSE: 52G) will announce its 2020 third quarter financial results on Tuesday, November 17th, 2020 after markets close, followed by a conference call at 5:00 PM ET (2:00 PM PT). Representing management will be Brad Douville, President and Chief Executive Officer and Lynda Freeman, Chief Financial Officer. A question and answer period with analysts will follow brief remarks from management.


Live Conference Call

The public is invited to listen to the conference call in real time by telephone. To access the conference call by telephone, please dial: 1-800-319-4610 (Canada & USA toll-free) or 604-638-5340. Callers should dial in 5-10 minutes prior to the scheduled start time and ask to join the Greenlane Renewables conference call.

Shortly after the conference call, the replay will be archived on the Greenlane Renewables website and replay will be available in streaming audio and a downloadable MP3 file.

About Greenlane Renewables

Greenlane Renewables is a leading global provider of biogas upgrading systems that are helping decarbonize natural gas. Our systems produce clean, low-carbon renewable natural gas from organic waste sources including landfills, wastewater treatment plants, dairy farms, and food waste, suitable for either injection into the natural gas grid or for direct use as vehicle fuel. Greenlane is the only biogas upgrading company offering the three main technologies: water wash, pressure swing adsorption, and membrane separation. With multiple core technologies, more than 110 biogas upgrading systems in 18 countries and counting, 30+ years of industry experience and patented proprietary technology, Greenlane is inspired by a commitment to helping waste producers improve their environmental impact, green credentials, and bottom line. For further information, please visit www.greenlanerenewables.com.

Neither the TSX Venture Exchange nor its Regulation Services Provider (as that term is defined in the policies of the TSX Venture Exchange) accepts responsibility for the adequacy or accuracy of this release or has in any way approved or disapproved of the contents of this news release.


Contacts

Incite Capital Markets
Eric Negraeff / Darren Seed
Ph: 604.493.2004
Brad Douville, President & CEO, Greenlane Renewables
Email: This email address is being protected from spambots. You need JavaScript enabled to view it.

LOS ANGELES--(BUSINESS WIRE)--Romeo Systems, Inc. (“Romeo Power”), a leader in designing and manufacturing lithium-ion battery modules and packs for commercial electric vehicles, announced today that Republic Services, Inc. (“Republic Services”) (NYSE: RSG), a leader in recycling and solid waste solutions, has exercised its option to acquire additional shares of Class A common stock in RMG Acquisition Corp. (“RMG”) (NYSE: RMG), representing less than 5% of the currently outstanding shares of RMG. RMG, a special purpose acquisition company, previously announced a definitive agreement for a business combination that would result in Romeo Power becoming a publicly listed company. Republic Services is the second largest recycling and waste disposal company in the United States, with a fleet of more than 16,000 vehicles. Romeo Power and Republic Services continue to actively work on establishing a strategic alliance to support Republic’s comprehensive electrification and sustainability goals and strategy.


In addition, Tim Stuart, Chief Operating Officer of Republic Services, will join the Board of Directors of Romeo Power upon Romeo Power’s planned business combination with RMG. “Republic Services is excited to increase our investment in and strengthen our partnership with Romeo Power,” commented Tim Stuart. “The establishment of a strategic alliance is an important component of our fleet electrification strategy and will help drive responsible growth and value creation.”

“We are thrilled to further strengthen our relationship with Republic Services. The company is an incredibly well respected organization with a bold sustainability platform, and we appreciate their vote of confidence in our business,” remarked Lionel Selwood, Jr., Chief Executive Officer of Romeo Power. “Tim Stuart’s expertise in corporate strategy and operations will help Romeo Power expand its electrification technology into waste disposal and other markets.”

Through its industry leading technology and energy dense battery packs, Romeo Power enables large-scale sustainable transportation by delivering safer, longer lasting batteries with shorter charge times. The company has a 7 GWh-capable manufacturing facility in Los Angeles, California. Its core product offering is focused on the battery electric vehicle medium duty short haul and heavy duty long haul trucking markets. The merger between Romeo Power and RMG is expected to close later this year and will result in shares of Romeo Power listing on the New York Stock Exchange under the ticker “RMO.”

About Romeo Power

Romeo Power, founded in 2016 in California by Michael Patterson, is an industry leading energy technology company focused on designing and manufacturing lithium-ion battery modules and packs for commercial electric vehicles. Through its energy dense battery modules and packs, Romeo Power enables large-scale sustainable transportation by delivering safer, longer lasting batteries with shorter charge times. With greater energy density, Romeo Power is able to create lightweight and efficient solutions that deliver superior performance, and provide improved acceleration, range, safety and durability. Romeo Power’s modules and packs are customizable and scalable, and they are optimized by its proprietary battery management system. The company has approximately 100 employees and more than 60 battery-specific engineers and a 113,000 square foot manufacturing facility in Los Angeles, California with key battery development capabilities performed in-house. On October 5, 2020, Romeo Power and RMG Acquisition Corp. (“RMG”) (NYSE: RMG), a special purpose acquisition company, announced a definitive agreement for a business combination that would result in Romeo Power becoming a publicly listed company. Upon closing of the transaction, the combined company will be named Romeo Power, Inc. and is expected to remain listed on the NYSE and trade under the new ticker symbol “RMO.” For additional information on Romeo Power, please visit https://romeopower.com

About RMG Acquisition Corp.

RMG Acquisition Corp (NYSE: RMG) is a special purpose acquisition company whose management and board has deep experience in power, renewable energy, environmental services, energy technology and corporate governance. RMG’s team includes top level executives from Goldman Sachs, Carlyle Group, Cogentrix Energy, Deloitte & Touché, Access Industries, Calpine Corporation and Riverside Management Group.

About Republic Services, Inc.

Republic Services, Inc. is an industry leader in U.S. recycling and non-hazardous solid waste disposal. Through its subsidiaries, Republic's collection companies, transfer stations, recycling centers, landfills and environmental services provide effective solutions to make responsible recycling and waste disposal effortless for its customers across the country. Its 36,000 employees are committed to providing a superior experience while fostering a sustainable Blue Planet® for future generations to enjoy a cleaner, safer and healthier world. For more information, visit RepublicServices.com, or follow the company at Facebook.com/RepublicServices, @RepublicService on Twitter and @republic services on Instagram.


Contacts

Romeo Power

For Investors
ICR, Inc.
This email address is being protected from spambots. You need JavaScript enabled to view it.

For Media
ICR, Inc.
This email address is being protected from spambots. You need JavaScript enabled to view it.

Republic Services, Inc.

For Investors
Stacey Mathews
Vice President, Investor Relations
This email address is being protected from spambots. You need JavaScript enabled to view it.
(480) 718-6548

For Media
Donna Egan
Media Relations
This email address is being protected from spambots. You need JavaScript enabled to view it.
(480) 757-9748

RMG Acquisition Corp.
Philip Kassin
Chief Operating Officer
This email address is being protected from spambots. You need JavaScript enabled to view it.
212-785-2579

WARRENVILLE, Ill.--(BUSINESS WIRE)--Fuel Tech, Inc. (NASDAQ: FTEK), a technology company providing advanced engineering solutions for the optimization of combustion systems, emissions control and water treatment in utility and industrial applications, today reported financial results for the third quarter ended September 30, 2020 (“Q3 2020”).


“Although we have experienced some deferred decision-making on the part of some customers due in part to uncertainty created by the effect of COVID-19 pandemic, I am very proud of how our team has continued to navigate these challenging times. As a result of their efforts, we are seeing encouraging signs across our enterprise,” said Vincent J. Arnone, President and CEO. “Within our Air Pollution Control (APC) business segment, we remain intensely focused on providing custom-engineered solutions that fulfill the unique needs of each of our customers, and expect the final decisions to be made on multiple projects by the end of the year which, if Fuel Tech’s bids are selected, would increase backlog for 2021 and beyond by $10 to $15 million."

“Our FUEL CHEM® segment results reflected contributions from the installation of our TIFI® Targeted In-Furnace Injection technology on three new domestic coal-fired units for a repeat customer in the Northeast, as well as a return to normalized run rates across our fleet following a period of slower unit activity in Q2 2020 due to the COVID-19 pandemic. The commercial programs represented by these three new units will generate revenue when the units are dispatched to generate power in their respective geographic areas. If these units are operational and utilizing the technology on a continual basis throughout the year, we would expect to see revenues of $500,000-$750,000 per unit. Longer term, we continue to build on our progress with our partner in Mexico to employ our FUEL CHEM solutions to help mitigate harmful emissions from burning high sulfur fuel oil. Our partner continues to engage with local officials in Mexico to advance this solution and we are continuing to support its efforts in this regard.”

Mr. Arnone concluded, “We have collected and repatriated in excess of $1 million in cash as of September 30, 2020 following the closure of our underperforming China operation (“Beijing Fuel Tech”), and expect to continue these collections throughout 2020. We ended the quarter with $11.8 million in cash and cash equivalents.”

DGI™ Dissolved Gas Infusion

The Company is pursuing three new opportunities to demonstrate its dissolved gas infusion technology, one to a new customer in the pulp and paper business located in the Pacific Northwest and the remaining two for municipal wastewater treatment applications in conjunction with our partner Kadance Corporation. As previously reported, an on-site demonstration of Fuel Tech’s DGI technology at a pulp and paper facility in the Midwest planned for early in Q2 2020 has been delayed due to the impact of COVID-19. The Company is encouraged to see the increase in interest in this technology application and looks forward to providing additional information regarding the progress of these demonstrations in the future. In addition, in Q3 2020 the Company signed a new license agreement related to the DGI technology with Kadance which purchased the assets of our prior licensor of the technology. Kadance is focused primarily on serving the municipal wastewater treatment market and also offers the ability to deliver biological treatment solutions. Under the terms of the new agreement, among other things, Fuel Tech has been provided expanded access to markets outside of municipal wastewater treatment and has the right to independently manufacture DGI systems.

Q3 2020 Consolidated Results Overview

Consolidated revenues increased 26.4% to $8.2 million from $6.5 million in Q3 2019, reflecting higher revenue in both the APC and FUEL CHEM segments.

As previously announced, Fuel Tech reached a settlement with its insurance carrier (“the settlement”) that resulted in the Company receiving $2.6 million in proceeds related to an outstanding claim that was previously reported in 2019. The proceeds of the settlement were received in Q4 2020, however, in Q3 2020 the Company recorded a receivable for the proceeds that reduced cost of sales at the APC business by a like amount.

Gross margin for Q3 2020 was 72.4% of revenues compared to 44.8% of revenues in Q3 2019, primarily reflecting the impact of the settlement on APC costs of sales. Excluding the settlement, consolidated gross margin for Q3 2020 was 40.7%.

SG&A expenses declined by 16.7% to $3.2 million from $3.8 million in Q3 2019, reflecting lower administrative and professional services costs.

Net income from continuing operations was $2.4 million, or $0.10 per share, compared to net loss from continuing operations of $(1.3) million, or $(0.05) per share, primarily due to the impact of the aforementioned settlement in Q3 2020.

Capital projects backlog at September 30, 2020 was $6.4 million, $6.0 million of which was domestic. Backlog at December 31, 2019 was $9.7 million, of which $8.6 million was domestic.

APC segment revenues improved to $2.9 million from $1.8 million in Q3 2019, primarily the result of project timing, and the decrease in new APC orders announced during 2019 and continuing through the first nine months of 2020. APC gross margin was $3.2 million, or 110% of revenue, reflecting the above referenced settlement, compared to gross margin of $0.6 million, or 34.1%, in Q3 2019. Excluding the settlement, APC gross margin for Q3 2020 was 20.8%.

FUEL CHEM segment revenues rose to $5.3 million from to $4.6 million in Q3 2019, primarily reflecting installations of three new units during Q3 2020. Segment gross margin was 51.7% in Q3 2020 and 49.0% in Q3 2019.

Adjusted EBITDA was $2.7 million in Q3 2020 compared to an Adjusted EBITDA loss of $(0.8) million in Q3 2019.

Financial Condition

At September 30, 2020 total cash was $11.8 million including restricted cash of $2.4 million, down from total cash of $13.5 million, including restricted cash of $2.6 million, at December 31, 2019. Stockholders’ equity was $23.8 million, or $0.96 per share.

Conference Call

Management will host a conference call on Wednesday, November 11, 2020 at 10:00 am ET / 9:00 am CT to discuss the results and business activities.

Interested parties may participate in the call by dialing:

  • (877) 423-9820 (Domestic) or
  • (201) 493-6749 (International)

The conference call will also be accessible via the Upcoming Events section of the Company’s web site at www.ftek.com. Following management’s opening remarks, there will be a question and answer session. Questions may be asked during the live call, or alternatively, you may e-mail questions in advance to This email address is being protected from spambots. You need JavaScript enabled to view it.. For those who cannot listen to the live broadcast, an online replay will be available at www.ftek.com.

About Fuel Tech

Fuel Tech develops and commercializes state-of-the-art proprietary technologies for air pollution control, process optimization, water treatment, and advanced engineering services. These technologies enable customers to operate in a cost-effective and environmentally sustainable manner. Fuel Tech is a leader in nitrogen oxide (NOx) reduction and particulate control technologies and its solutions have been in installed on over 1,200 utility, industrial and municipal units worldwide. The Company’s FUEL CHEM® technology improves the efficiency, reliability, fuel flexibility, boiler heat rate, and environmental status of combustion units by controlling slagging, fouling, corrosion and opacity. Water treatment technologies include DGI™ Dissolved Gas Infusion Systems which utilize a patented nozzle to deliver supersaturated oxygen solutions and other gas-water combinations to target process applications or environmental issues. This infusion process has a variety of applications in the water and wastewater industries, including remediation, aeration, biological treatment and wastewater odor management. Many of Fuel Tech’s products and services rely heavily on the Company’s exceptional Computational Fluid Dynamics modeling capabilities, which are enhanced by internally developed, high-end visualization software. For more information, visit Fuel Tech’s web site at www.ftek.com.

NOTE REGARDING FORWARD-LOOKING STATEMENTS

This press release contains “forward-looking statements” as defined in Section 21E of the Securities Exchange Act of 1934, as amended, which are made pursuant to the safe harbor provisions of the Private Securities Litigation Reform Act of 1995 and reflect Fuel Tech’s current expectations regarding future growth, results of operations, cash flows, performance and business prospects, and opportunities, as well as assumptions made by, and information currently available to, our management. Fuel Tech has tried to identify forward-looking statements by using words such as “anticipate,” “believe,” “plan,” “expect,” “estimate,” “intend,” “will,” and similar expressions, but these words are not the exclusive means of identifying forward-looking statements. These statements are based on information currently available to Fuel Tech and are subject to various risks, uncertainties, and other factors, including, but not limited to, those discussed in Fuel Tech’s Annual Report on Form 10-K in Item 1A under the caption “Risk Factors,” and subsequent filings under the Securities Exchange Act of 1934, as amended, which could cause Fuel Tech’s actual growth, results of operations, financial condition, cash flows, performance and business prospects and opportunities to differ materially from those expressed in, or implied by, these statements. Fuel Tech undertakes no obligation to update such factors or to publicly announce the results of any of the forward-looking statements contained herein to reflect future events, developments, or changed circumstances or for any other reason. Investors are cautioned that all forward-looking statements involve risks and uncertainties, including those detailed in Fuel Tech’s filings with the Securities and Exchange Commission.


FUEL TECH, INC.


CONDENSED CONSOLIDATED BALANCE SHEETS

(Unaudited)

(in thousands, except share and per share data)


September 30,
2020


December 31,
2019


ASSETS


Current assets:


Cash and cash equivalents


$

9,418


$

10,914


Restricted cash


2,025


2,080


Accounts receivable, net


5,989


6,473


Insurance Receivable


2,589


Inventories, net


337


264


Prepaid expenses and other current assets


1,678


1,879


Income taxes receivable


69


Total current assets


22,105


21,610


Property and equipment, net of accumulated depreciation of $26,692 and $26,174, respectively


5,347


5,662


Goodwill


2,116


2,116


Other intangible assets, net of accumulated amortization of $6,810 and $6,671, respectively


794


906


Restricted cash


367


507


Right-of-use operating lease assets


430


362


Other assets


366


443


Total assets


$

31,525


$

31,606


LIABILITIES AND STOCKHOLDERS' EQUITY


Current liabilities:


Accounts payable


$

2,963


$

2,117


Current portion of long-term borrowings


945


Accrued liabilities:


Operating lease liabilities - current


175


182


Employee compensation


687


519


Income taxes payable


36


Other accrued liabilities


1,566


1,976


Total current liabilities


6,372


4,794


Operating lease liabilities - non-current


247


180


Long-term borrowings, net of current portion


611


Deferred income taxes, net


172


171


Other liabilities


292


286


Total liabilities


7,694


5,431


COMMITMENTS AND CONTINGENCIES (Note 13)


Stockholders’ equity:


Common stock, $.01 par value, 40,000,000 shares authorized, 25,509,298 and 25,053,480 shares issued, and 24,701,159 and 24,592,578 shares outstanding, respectively


255


254


Additional paid-in capital


139,767


139,560


Accumulated deficit


(113,060

)


(110,325

)

Accumulated other comprehensive loss


(1,589

)


(1,778

)

Nil coupon perpetual loan notes


76


76


Treasury stock, at cost


(1,618

)


(1,612

)

Total stockholders’ equity


23,831


26,175


Total liabilities and stockholders’ equity


$

31,525


$

31,606


FUEL TECH, INC.


CONDENSED CONSOLIDATED STATEMENTS OF OPERATIONS

(Unaudited)

(in thousands)


Three Months Ended
September 30,


Nine Months Ended
September 30,


2020


2019


2020


2019


Revenues


$

8,155


$

6,452


$

16,334


$

25,555


Costs and expenses:


Cost of sales


2,249


3,563


8,299


14,754


Selling, general and administrative


3,184


3,822


9,825


12,735


Restructuring charge


625


Research and development


285


352


880


823


Intangible assets abandonment


76


127


5,718


7,813


19,004


29,064


Operating income (loss) from continuing operations


2,437


(1,361

)


(2,670

)


(3,509

)

Interest expense


(9

)


(4

)


(15

)


(8

)

Interest income


3


19


16


30


Other income (expense), net


(55

)


71


83


(1

)

Income (loss) from continuing operations before income taxes


2,376


(1,275

)


(2,586

)


(3,488

)

Income tax expense


(21

)


(149

)


(23

)

Net income (loss) from continuing operations


2,376


(1,296

)


(2,735

)


(3,511

)

Income (Loss) from discontinued operations


18


(1

)

Net income (loss)


$

2,376


$

(1,278

)


$

(2,735

)


$

(3,512

)

Net income (loss) per common share:


Basic


Continuing operations


$

0.10


$

(0.05

)


$

(0.11

)


$

(0.15

)

Discontinued operations


$


$


$


$


Basic net income (loss) per common share


$

0.10


$

(0.05

)


$

(0.11

)


$

(0.15

)

Diluted


Continuing operations


$

0.09


$

(0.05

)


$

(0.11

)


$

(0.15

)

Discontinued operations


$


$


$


$


Diluted net income (loss) per common share


$

0.09


$

(0.05

)


$

(0.11

)


$

(0.15

)

Weighted-average number of common shares outstanding:


Basic


24,701,000


24,187,000


24,656,000


24,183,000


Diluted


25,120,000


24,187,000


24,656,000


24,183,000


FUEL TECH, INC.


CONDENSED CONSOLIDATED STATEMENTS OF COMPREHENSIVE INCOME (LOSS)

(Unaudited)

(in thousands)


Three Months Ended
September 30,


Nine Months Ended
September 30,


2020


2019


2020


2019


Net income (loss)


$

2,376


$

(1,278

)


$

(2,735

)


$

(3,512

)

Other comprehensive income (loss):


Foreign currency translation adjustments


268


(337

)


189


(276

)

Comprehensive income (loss)


$

2,644


$

(1,615

)


$

(2,546

)


$

(3,788

)


FUEL TECH, INC.


CONDENSED CONSOLIDATED STATEMENTS OF CASH FLOWS

(Unaudited)

(in thousands)


Nine Months Ended
September 30,


2020


2019


Operating Activities


Net loss


$

(2,735

)


$

(3,512

)

Loss from discontinued operations


1


Net loss from continuing operations


(2,735

)


(3,511

)

Adjustments to reconcile net loss to net cash used in operating activities:


Depreciation


495


644


Amortization


139


118


(Gain) loss on disposal of equipment


(3

)


4


Provision for doubtful accounts, net of recoveries


(1,144

)


Adjustment for Operating Lease (Note 2)


(11

)


Intangible assets abandonment


127


Stock-based compensation, net of forfeitures


208


357


Changes in operating assets and liabilities:


Accounts receivable


(863

)


8,601


Inventories


(71

)


654


Prepaid expenses, other current assets and other non-current assets


250


1,804


Accounts payable


820


(6,812

)

Accrued liabilities and other non-current liabilities


(376

)


(4,306

)

Net cash used in operating activities - continuing operations


(3,291

)


(2,320

)

Net cash used in operating activities - discontinued operations


(21

)

Net cash used in operating activities


(3,291

)


(2,341

)

Investing Activities


Purchases of equipment and patents


(206

)


(431

)

Net cash used in investing activities - continuing operations


(206

)


(431

)

Net cash provided by investing activities - discontinued operations


505


Net cash (used in) provided by in investing activities


(206

)


74


Financing Activities


Proceeds from borrowings


1,556


Taxes paid on behalf of equity award participants


(6

)


(2

)

Net cash provided by (used in) financing activities


1,550


(2

)

Effect of exchange rate fluctuations on cash


256


(458

)

Net decrease in cash, cash equivalents and restricted cash


(1,691

)


(2,727

)

Cash, cash equivalents, and restricted cash at beginning of period (Note 2)


13,501


18,059


Cash, cash equivalents and restricted cash at end of period (Note 2)


$

11,810


$

15,332


FUEL TECH, INC.


BUSINESS SEGMENT FINANCIAL DATA

(Unaudited)

(in thousands)


Three months ended September 30, 2020


Air Pollution
Control Segment


FUEL CHEM
Segment


Other


Total


Revenues from external customers


$

2,886


$

5,269


$


$

8,155


Cost of sales


304


(2,553

)


(2,249

)

Gross margin


3,190


2,716


5,906


Selling, general and administrative


(3,184

)


(3,184

)

Research and development


(285

)


(285

)

Operating income (loss) from continuing operations


$

3,190


$

2,716


$

(3,469

)


$

2,437


Three months ended September 30, 2019


Air Pollution
Control Segment


FUEL CHEM
Segment


Other


Total


Revenues from external customers


$

1,816


$

4,636


$


$

6,452


Cost of sales


(1,197

)


(2,366

)


(3,563

)

Gross margin


619


2,270


2,889


Selling, general and administrative


(3,822

)


(3,822

)

Restructuring Charge


Research and development


(352

)


(352

)

Intangible assets abandonment


(76

)


(76

)

Operating income (loss) from continuing operations


$

619


$

2,270


$

(4,250

)


$

(1,361

)

Nine months ended September 30, 2020


Air Pollution
Control Segment


FUEL CHEM
Segment


Other


Total


Revenues from external customers


$

6,019


$

10,315


$


$

16,334


Cost of sales


(2,782

)


(5,517

)


(8,299

)

Gross margin


3,237


4,798


8,035


Selling, general and administrative


(9,825

)


(9,825

)

Research and development


(880

)


(880

)

Operating income (loss) from continuing operations


$

3,237


$

4,798


$

(10,705

)


$

(2,670

)

Nine months ended September 30, 2019


Air Pollution
Control Segment


FUEL CHEM
Segment


Other


Total


Revenues from external customers


$

12,408


$

13,147


$


$

25,555


Cost of sales


(8,061

)


(6,693

)


(14,754

)

Gross margin


4,347


6,454


10,801


Selling, general and administrative


(12,735

)


(12,735

)

Restructuring Charge


(625

)


(625

)

Research and development


(823

)


(823

)

Intangible assets abandonment


(127

)


(127

)

Operating income (loss) from continuing operations


$

4,347


$

6,454


$

(14,310

)


$

(3,509

)

FUEL TECH, INC.
GEOGRAPHIC INFORMATION
(Unaudited)
(in thousands)

Information concerning Fuel Tech’s operations by geographic area is provided below. Revenues are attributed to countries based on the location of the customer. Assets are those directly associated with operations of the geographic area.


Three Months Ended
September 30,


Nine Months Ended
September 30,


2020


2019


2020


2019


United States


$

6,473


$

5,727


$

12,880


$

22,104


Foreign Revenues


1,682


725


3,454


3,451


Total Revenues


$

8,155


$

6,452


$

16,334


$

25,555


September 30,
2020


December 31,
2019


Assets:


United States


$

25,008


$

23,460


Foreign


6,517


8,146


$

31,525


$

31,606


FUEL TECH, INC.


RECONCILIATION OF GAAP NET LOSS TO EBITDA AND ADJUSTED EBITDA

(Unaudited)

(in thousands)


Three Months Ended
September 30,


Nine Months Ended
September 30,


2020


2019


2020


2019


Net Loss


$

2,376


$

(1,278

)


$

(2,735

)


$

(3,512

)

Interest (income) expense, net


6


(15

)


(1

)


(22

)

Income tax expense


--


21


149


23


Depreciation expense


166


166


495


644


Amortization expense


54


50


139


118


EBITDA


2,602


(1,056

)


(1,953

)


(2,749

)

Intangible assets abandonment


-


76


-


127


Stock compensation expense


57


138


207


357


ADJUSTED EBITDA


2,659


(842

)


(1,746

)


(2,265

)

Adjusted EBITDA

To supplement the Company's consolidated financial statements presented in accordance with generally accepted accounting principles in the United States (GAAP), the Company has provided an Adjusted EBITDA disclosure as a measure of financial performance. Adjusted EBITDA is defined as net income (loss) before interest expense, income tax expense (benefit), depreciation expense, amortization expense, stock compensation expense, and intangible assets abandonment and building impairment. The Company's reference to these non-GAAP measures should be considered in addition to results prepared in accordance with GAAP standards, but are not a substitute for, or superior to, GAAP results.

Adjusted EBITDA is provided to enhance investors' overall understanding of the Company's current financial performance and ability to generate cash flow, which we believe is a meaningful measure for our investor and analyst communities. In many cases non-GAAP financial measures are utilized by these individuals to evaluate Company performance and ultimately determine a reasonable valuation for our common stock. A reconciliation of Adjusted EBITDA to the nearest GAAP measure of net income (loss) has been included in the above financial table.


Contacts

Vince Arnone
President and CEO
(630) 845-4500

Devin Sullivan
Senior Vice President
The Equity Group Inc.
(212) 836-9608

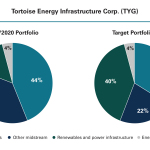
LEAWOOD, KS--(BUSINESS WIRE)--Tortoise today announces that in order to provide Tortoise Energy Infrastructure Corp. (TYG) the ability to increase exposure to renewables and power infrastructure companies, the Board approved a non-fundamental investment policy change eliminating the requirement to invest a specific percentage of total assets in MLPs and midstream equities. This change will be effective 60-days after providing written notice to stockholders.


Positioning for the Future of Energy

“The world is facing competing challenges of meeting growing energy demand while simultaneously reducing global CO2 emissions,” said Matt Sallee, President - Tortoise. “This is leading to a massive disruption around how energy is delivered and consumed. We are convinced the best way to meet the conflicting needs is not an either-or solution. Low- or zero-carbon renewables and natural gas are needed, to work in concert, to replace heavy carbon energy sources. This creates a secular tailwind benefiting renewables and natural gas as they displace coal. As the energy sector and the companies that comprise it evolve, we think it’s in the best interest of our stockholders for the funds to be in a position to benefit from the energy evolution.”

  • As of October 31, 2020, approximately 15% of TYG was allocated to renewable and power infrastructure along with energy technology companies. Tortoise Midstream Energy Fund, Inc. (NTG) has a similar allocation.
  • Furthermore, the midstream companies in each portfolio are actively participating in the energy evolution including exporting low carbon gas and propane to allow developing markets to reduce their dependence on coal, transporting renewable natural gas and renewable diesel, and integrating renewable power into operations.

Below is the current and target TYG portfolio, highlighting the planned strategic shift in the fund’s allocations.


Tortoise Energy Infrastructure Corp. (TYG)


10/31/2020 Portfolio


Target Portfolio

Natural Gas

44

%


34

%

Other Midstream

37

%


22

%

Renewables and Power Infrastructure

15

%


40

%

Energy Technology

4

%


4

%

Total

100

%


100

%

The Board also approved changes to the non-fundamental investment policies for each of TYG and NTG to change the measurements from a percentage of “Total Assets” to a percentage of “Total Investments.” “Total Investments” is defined as the value of all investments that would be reported as total investments in the schedule of investments of the fund. These non-fundamental investment policy changes will also be effective 60-days after providing written notice to stockholders.

Tortoise Capital Advisors, L.L.C. is the adviser to Tortoise Energy Infrastructure Corp. and Tortoise Midstream Energy Fund, Inc.

For additional information on these funds, please visit cef.tortoiseecofin.com.

About Tortoise

Tortoise focuses on energy and power infrastructure and the transition to cleaner energy. Tortoise’s solid track record of energy value chain investment experience and research dates back more than 20 years. As one of the earliest investors in midstream energy, Tortoise believes it is well-positioned to be at the forefront of the global energy evolution that is underway. With a steady wins approach and a long-term perspective, Tortoise strives to make a positive impact on clients and communities. To learn more, visit www.TortoiseEcofin.com.

Cautionary Statement Regarding Forward-Looking Statements

This press release contains certain statements that may include “forward-looking statements” within the meaning of Section 27A of the Securities Act of 1933 and Section 21E of the Securities Exchange Act of 1934. All statements, other than statements of historical fact, included herein are "forward-looking statements." Although the funds and Tortoise Capital Advisors believe that the expectations reflected in these forward-looking statements are reasonable, they do involve assumptions, risks and uncertainties, and these expectations may prove to be incorrect. Actual results could differ materially from those anticipated in these forward-looking statements as a result of a variety of factors, including those discussed in the fund’s reports that are filed with the Securities and Exchange Commission. You should not place undue reliance on these forward-looking statements, which speak only as of the date of this press release. Other than as required by law, the funds and Tortoise Capital Advisors do not assume a duty to update this forward-looking statement.

Safe Harbor Statement

This press release shall not constitute an offer to sell or a solicitation to buy, nor shall there be any sale of these securities in any state or jurisdiction in which such offer or solicitation or sale would be unlawful prior to registration or qualification under the laws of such state or jurisdiction.


Contacts

For more information contact Maggie Zastrow at (913) 981-1020 or This email address is being protected from spambots. You need JavaScript enabled to view it..

HOUSTON--(BUSINESS WIRE)--Enterprise Products Partners L.P. (NYSE: EPD) announced today it will host virtual investor meetings at the BofA Global Energy Conference on Wednesday, November 11, 2020; and the RBC Capital Markets Midstream and Energy Infrastructure Virtual Conference on Thursday, November 19, 2020.


A copy of the slides used in the meetings will be available on the Enterprise website at www.enterpriseproducts.com under the Investors tab.

Enterprise Products Partners L.P. is one of the largest publicly traded partnerships and a leading North American provider of midstream energy services to producers and consumers of natural gas, NGLs, crude oil, petrochemicals and refined products. Our midstream energy operations include: natural gas gathering, treating, processing, transportation and storage; NGL transportation, fractionation, storage and export and import terminals; crude oil gathering, transportation, storage and export and import terminals; petrochemical and refined products transportation, storage, export and import terminals and related services; and a marine transportation business that operates primarily on the United States inland and Intracoastal Waterway systems. The partnership’s assets include approximately 50,000 miles of pipelines; 260 million barrels of storage capacity for NGLs, crude oil, petrochemicals and refined products; and 14 billion cubic feet of natural gas storage capacity.


Contacts

Randy Burkhalter, Investor Relations, (713) 381-6812 or (866) 230-0745
Rick Rainey, Media Relations (713) 381-3635

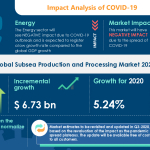
LONDON--(BUSINESS WIRE)--#GlobalSubseaProductionandProcessingMarket--Technavio has been monitoring the subsea production and processing market and it is poised to grow by $ 6.73 bn during 2020-2024, progressing at a CAGR of almost 6% during the forecast period. The report offers an up-to-date analysis regarding the current market scenario, latest trends and drivers, and the overall market environment. Download Latest Free Sample Report 2020 - 2024


Although the COVID-19 pandemic continues to transform the growth of various industries, the immediate impact of the outbreak is varied. While a few industries will register a drop in demand, numerous others will continue to remain unscathed and show promising growth opportunities. Technavio’s in-depth research has all your needs covered as our research reports include all foreseeable market scenarios, including pre- & post-COVID-19 analysis.

Frequently Asked Questions:

  • What are the major trends in the market?
    The rise in deepwater and ultra-deepwater E&P activities is a major trend driving the growth of the market.
  • At what rate is the market projected to grow?
    The market will accelerate at a CAGR of almost 6% and the incremental growth of the market is anticipated to be $ 6.73 bn.
  • Who are the top players in the market?
    Aker Solutions ASA, Baker Hughes Co., Dril-Quip Inc., Hunting Plc, National Oilwell Varco Inc., Oceaneering International Inc., Saipem Spa, Schlumberger Ltd., TechnipFMC Plc, and Worldwide Oilfield Machine Inc., are some of the major market participants.
  • What is the key market driver?
    The advances in subsea processing is one of the major factors driving the market.
  • How big is the APAC market?
    The APAC region will contribute 34% of the market share.

Buy 1 Technavio report and get the second for 50% off. Buy 2 Technavio reports and get the third for free.

View market snapshot before purchasing

The market is fragmented, and the degree of fragmentation will accelerate during the forecast period. Aker Solutions ASA, Baker Hughes Co., Dril-Quip Inc., Hunting Plc, National Oilwell Varco Inc., Oceaneering International Inc., Saipem Spa, Schlumberger Ltd., TechnipFMC Plc, and Worldwide Oilfield Machine Inc. are some of the major market participants. The advances in subsea processing will offer immense growth opportunities. To make most of the opportunities, market vendors should focus more on the growth prospects in the fast-growing segments, while maintaining their positions in the slow-growing segments.

Technavio's custom research reports offer detailed insights on the impact of COVID-19 at an industry level, a regional level, and subsequent supply chain operations. This customized report will also help clients keep up with new product launches in direct & indirect COVID-19 related markets, upcoming vaccines and pipeline analysis, and significant developments in vendor operations and government regulations.

Subsea Production and Processing Market 2020-2024: Segmentation

Subsea Production and Processing Market is segmented as below:

  • Application
    • Shallow Water
    • Deepwater
    • Ultra-deepwater
  • Geographic Landscape
    • APAC
    • Europe
    • MEA
    • North America
    • South America

To learn more about the global trends impacting the future of market research, download a free sample: https://www.technavio.com/talk-to-us?report=IRTNTR40383

Subsea Production and Processing Market 2020-2024: Scope

Technavio presents a detailed picture of the market by the way of study, synthesis, and summation of data from multiple sources. The subsea production and processing market report covers the following areas:

  • Subsea Production and Processing Market Size
  • Subsea Production and Processing Market Trends
  • Subsea Production and Processing Market Industry Analysis

This study identifies the rise in deepwater and ultra-deepwater E&P activities as one of the prime reasons driving the subsea production and processing Market growth during the next few years.

Technavio suggests three forecast scenarios (optimistic, probable, and pessimistic) considering the impact of COVID-19. Technavio’s in-depth research has direct and indirect COVID-19 impacted market research reports.

Register for a free trial today and gain instant access to 17,000+ market research reports. Technavio's SUBSCRIPTION platform

Subsea Production and Processing Market 2020-2024: Key Highlights

  • CAGR of the market during the forecast period 2020-2024
  • Detailed information on factors that will assist subsea production and processing market growth during the next five years
  • Estimation of the subsea production and processing market size and its contribution to the parent market
  • Predictions on upcoming trends and changes in consumer behavior
  • The growth of the subsea production and processing market
  • Analysis of the market’s competitive landscape and detailed information on vendors
  • Comprehensive details of factors that will challenge the growth of subsea production and processing market vendors

Table of Contents:

PART 01: EXECUTIVE SUMMARY

PART 02: SCOPE OF THE REPORT

  • 2.1 Preface
  • 2.2 Preface
  • 2.3 Currency conversion rates for US$

PART 03: MARKET LANDSCAPE

  • Market ecosystem
  • Market characteristics
  • Value chain analysis
  • Market segmentation analysis

PART 04: MARKET SIZING

  • Market definition
  • Market sizing 2019
  • Market outlook
  • Market size and forecast 2019-2024

PART 05: FIVE FORCES ANALYSIS

  • Bargaining power of buyers
  • Bargaining power of suppliers
  • Threat of new entrants
  • Threat of substitutes
  • Threat of rivalry
  • Market condition

PART 06: MARKET SEGMENTATION BY APPLICATION

  • Market segmentation by application
  • Comparison by application
  • Shallow water - Market size and forecast 2019-2024
  • Deepwater - Market size and forecast 2019-2024
  • Ultra-deepwater - Market size and forecast 2019-2024
  • Market opportunity by application

PART 07: CUSTOMER LANDSCAPE

PART 08: GEOGRAPHIC LANDSCAPE

  • Geographic segmentation
  • Geographic comparison
  • Europe - Market size and forecast 2019-2024
  • APAC - Market size and forecast 2019-2024
  • MEA - Market size and forecast 2019-2024
  • South America - Market size and forecast 2019-2024
  • North America - Market size and forecast 2019-2024
  • Key leading countries
  • Market opportunity

PART 09: DECISION FRAMEWORK

PART 10: DRIVERS AND CHALLENGES

  • Market drivers
  • Market challenges

PART 11: MARKET TRENDS

  • Advances in subsea processing
  • Declining costs of offshore drilling projects
  • Growing adoption of renewable energy

PART 12: VENDOR LANDSCAPE

  • Overview
  • Landscape disruption
  • Competitive scenario

PART 13: VENDOR ANALYSIS

  • Vendors covered
  • Vendor classification
  • Market positioning of vendors
  • Aker Solutions ASA
  • Baker Hughes Co.
  • Dril-Quip Inc.
  • Hunting Plc
  • National Oilwell Varco Inc.
  • Oceaneering International Inc.
  • Saipem Spa
  • Schlumberger Ltd.
  • TechnipFMC Plc
  • Worldwide Oilfield Machine Inc.

PART 14: APPENDIX

  • Research methodology
  • List of abbreviations
  • Definition of market positioning of vendors

PART 15: EXPLORE TECHNAVIO

About Us

Technavio is a leading global technology research and advisory company. Their research and analysis focuses on emerging market trends and provides actionable insights to help businesses identify market opportunities and develop effective strategies to optimize their market positions. With over 500 specialized analysts, Technavio’s report library consists of more than 17,000 reports and counting, covering 800 technologies, spanning across 50 countries. Their client base consists of enterprises of all sizes, including more than 100 Fortune 500 companies. This growing client base relies on Technavio’s comprehensive coverage, extensive research, and actionable market insights to identify opportunities in existing and potential markets and assess their competitive positions within changing market scenarios.


Contacts

Technavio Research
Jesse Maida
Media & Marketing Executive
US: +1 844 364 1100
UK: +44 203 893 3200
Email: This email address is being protected from spambots. You need JavaScript enabled to view it.
Website: www.technavio.com/

LONDON--(BUSINESS WIRE)--#BentoniteMarket--The global bentonite market size is expected to grow by 2.75 million MT during 2020-2024, progressing at a CAGR of over 2% during the forecast period.


Worried about the impact of COVID-19 on your Business? Here is an Exclusive report talking about Market scenarios, Estimates, impact of lockdown, and Customer Behaviour. Get a FREE sample PDF report in your inbox within minutes!

The use of bentonite for drilling purposes is one of the major factors propelling market growth. However, factors such as competition from organic binders will hamper market growth.

The increasing consumption of bentonite for drilling purposes will drive the growth prospects for the global bentonite market in the forthcoming years. One of the major factors responsible for the growing demand for bentonite is the increasing technological advancements in drilling technologies, which revolutionizes the oil and gas industry and enables access to the most remote of locations, unconventional formations, deep-water regions, and even the Arctic. Also, since bentonite facilitates drilling of new reservoirs, the growing adoption of lateral drilling techniques will boost the demand for bentonite.

More details: www.technavio.com/report/bentonite-market-industry-analysis

Global Bentonite Market: Product Landscape

Sodium bentonite can absorb a higher amount of water than calcium bentonite. It is capable of expanding up to 15 times its volume. Sodium bentonite has high swelling properties; therefore, it is widely used as a sealant in industries. Sodium bentonite is also used as binders, liner material, and as a suspension agent in concrete, wallboards, cement tiles, and water-proofing building materials. It is also used in healthcare as a poultice or as an external detoxifier of skin and feet. The product is also used for controlling dust on highways and as a hole plug. The growing use of sodium bentonite as an effective sealant is driving the growth of the segment. Market growth in this segment will be faster than the growth of the market in the calcium bentonite and other segments.

Global Bentonite Market: Geographic Landscape

The demand for foundry sand will significantly drive bentonite market growth in this region over the forecast period. 40% of the market’s growth will originate from APAC during the forecast period. China and India are the key markets for bentonite in APAC. Market growth in this region will be faster than the growth of the market in other regions.

Buy 1 Technavio report and get the second for 50% off. Buy 2 Technavio reports and get the third for free.

View market snapshot before purchasing

Companies Covered

  • ASHAPURA MINECHEM Ltd.
  • CIMBAR Performance Minerals
  • Clariant International Ltd.
  • EP Minerals LLC
  • Halliburton Co.
  • Imerys SA
  • KUNIMINE INDUSTRIES Co. Ltd.
  • Luossavaara-Kiirunavaara AB
  • Minerals Technologies Inc.
  • Wyo-Ben Inc.


What our reports offer:

  • Market share assessments for the regional and country-level segments
  • Strategic recommendations for the new entrants
  • Covers market data for 2019, 2020, till 2024
  • Market trends (drivers, opportunities, threats, challenges, investment opportunities, and recommendations)
  • Strategic recommendations in key business segments based on the market estimations
  • Competitive landscaping mapping the key common trends
  • Company profiling with detailed strategies, financials, and recent developments
  • Supply chain trends mapping the latest technological advancements

Technavio suggests three forecast scenarios (optimistic, probable, and pessimistic) considering the impact of COVID-19. Technavio’s in-depth research has direct and indirect COVID-19 impacted market research reports. Register for a free trial today and gain instant access to 17,000+ market research reports. Technavio's SUBSCRIPTION platform

Bentonite Market 2020-2024: Key Highlights

  • CAGR of the market during the forecast period 2020-2024
  • Detailed information on factors that will assist in bentonite market growth during the next five years
  • Estimation of the bentonite market size and its contribution to the parent market
  • Predictions on upcoming trends and changes in consumer behavior
  • The growth of the bentonite market
  • Analysis of the market’s competitive landscape and detailed information on vendors
  • Comprehensive details of factors that will challenge the growth of bentonite market, vendors

Table of Contents:

Executive Summary

Market Landscape

  • Market ecosystem
  • Value chain analysis

Market Sizing

  • Market definition
  • Market segment analysis
  • Market size 2019
  • Market outlook: Forecast for 2019 - 2024

Five Forces Analysis

  • Five forces summary
  • Bargaining power of buyers
  • Bargaining power of suppliers
  • Threat of new entrants
  • Threat of substitutes
  • Threat of rivalry
  • Market condition

Market Segmentation by Product

  • Market segments
  • Comparison by Product
  • Sodium bentonite - Market size and forecast 2019-2024
  • Calcium bentonite - Market size and forecast 2019-2024
  • Others - Market size and forecast 2019-2024
  • Market opportunity by Product

Market Segmentation by Application

  • Market segments
  • Comparison by Application
  • Foundry sands - Market size and forecast 2019-2024
  • Iron ore pelletizing - Market size and forecast 2019-2024
  • Pet litter - Market size and forecast 2019-2024
  • Drilling mud - Market size and forecast 2019-2024
  • Others - Market size and forecast 2019-2024
  • Market opportunity by Application

Customer landscape

Geographic Landscape

  • Geographic segmentation
  • Geographic comparison
  • APAC - Market size and forecast 2019-2024
  • North America - Market size and forecast 2019-2024
  • Europe - Market size and forecast 2019-2024
  • South America - Market size and forecast 2019-2024
  • MEA - Market size and forecast 2019-2024
  • Key leading countries
  • Market opportunity by geography
  • Market drivers
  • Market challenges
  • Market trends

Vendor Landscape

  • Vendor landscape
  • Landscape disruption
  • Competitive Scenario

Vendor Analysis

  • Vendors covered
  • Market positioning of vendors
  • ASHAPURA MINECHEM Ltd.
  • CIMBAR Performance Minerals
  • Clariant International Ltd.
  • EP Minerals LLC
  • Halliburton Co.
  • Imerys SA
  • KUNIMINE INDUSTRIES Co. Ltd.
  • Luossavaara-Kiirunavaara AB
  • Minerals Technologies Inc.
  • Wyo-Ben Inc.

Appendix

  • Scope of the report
  • Currency conversion rates for US$
  • Research methodology
  • List of abbreviations

About Us

Technavio is a leading global technology research and advisory company. Their research and analysis focuses on emerging market trends and provides actionable insights to help businesses identify market opportunities and develop effective strategies to optimize their market positions. With over 500 specialized analysts, Technavio’s report library consists of more than 17,000 reports and counting, covering 800 technologies, spanning across 50 countries. Their client base consists of enterprises of all sizes, including more than 100 Fortune 500 companies. This growing client base relies on Technavio’s comprehensive coverage, extensive research, and actionable market insights to identify opportunities in existing and potential markets and assess their competitive positions within changing market scenarios.


Contacts

Technavio Research
Jesse Maida
Media & Marketing Executive
US: +1 844 364 1100
UK: +44 203 893 3200
Email: This email address is being protected from spambots. You need JavaScript enabled to view it.
Website: www.technavio.com/

PALM BEACH, Fla.--(BUSINESS WIRE)--Chairman & CEO E.W. Letiziano announced that Signet and FIU have come to terms. The company now holds exclusive rights to two dynamic patented technologies. “Despite these critical times, we were able to draft two Exclusive Licensing Agreements; one, our Graphene deice technology; the other, our magnetic perpetual energy device. These Agreements give us the dynamics we need to elbow our way into the big boardrooms, resonate a new era and awaken the world,” says Letiziano.


“Our deIcing™ technology will eliminate the toxic waste we keep spewing in our water supplies. One application to an aircraft, a windmill, a motor will prevent ice. You no longer have to sit in a plane and watch that poison splash all over knowing that one day it may be what we will be drinking.

“Our InCharge™ magnetic battery device will deliver safety and clean emission-free power; a magnetic battery of perpetual energy. That means it recharges itself, instantly. You can drive your car without calculating miles or worry if the car, you and the soccer team will explode.”

Letiziano is unyielding and determined to be heard. He quips: “What else can be said? Our humanity must continue exploring safe care for our families and help our Mother Nature preserve us. Wake up my friends, make your days count…it’s time.”

Signet International Holdings, Inc. is a Public Company - otc symbol SIGN

Forward-Looking Safe Harbor Statement: This press release contains forward-looking statements that are made pursuant to the safe harbor provisions of the Private Securities Litigation Reform Act of 1995. By their nature, forward-looking statements and forecasts involve risks and uncertainties because they relate to events and depend on circumstances that will occur in the near future. There are a number of factors that could cause actual results and developments to differ materially from forecasted results. These risks and uncertainties include product demand, market competition, delays in website development, and risks inherent in our operations. For a discussion of these risks and uncertainties, please see our filings with the Securities and Exchange Commission. Our public filings with the SEC are available from commercial document retrieval services and at the website http://www.sec.gov.


Contacts

Ernie Letiziano, 561-832-2000
This email address is being protected from spambots. You need JavaScript enabled to view it.
http://www.signetinternationalholdings.com

LEAWOOD, KS--(BUSINESS WIRE)--TortoiseEcofin today announced the estimated character of distributions for its open end mutual funds to be paid in the calendar year 2020.


The table below lists estimates based on preliminary information as of October 31, 2020 and are subject to change. This data is for information purposes only and should not be construed as an official tax form, nor should it be considered tax or investment advice. Investors should consult a tax professional for guidance regarding their specific tax situation. The final determination of tax character of the distributions paid in 2020 will be reported to shareholders in January 2021 on Form 1099-DIV.


Estimated ordinary income


Fund name

Ticker

Estimated

short-term

capital gains

Qualified

dividend

Non-qualified

dividend

Estimated

long-term

capital gains

Return of

capital

Tortoise MLP & Pipeline Fund

TORIX/TORTX/TORCX

0%

33%

0%

0%

67%

Tortoise MLP & Energy Income Fund

INFRX/INFFX/INFIX

0%

10%

12%

0%

78%

Tortoise MLP & Energy Infrastructure Fund

MLPPX

0%

10%

15%

0%

75%

Tortoise Energy Evolution Fund

TOPIX/TOPTX/TOPCX

0%

100%

0%

0%

0%

A 2020 capital gains distribution is not expected for the Ecofin Global Renewables Infrastructure Fund (ECOIX/ECOAX).

Returns of capital are non-taxable distributions. The portion of the distribution received by the U.S. shareholder from the Fund that constitutes a return of capital will decrease the U.S. shareholder’s tax basis in his or her Fund shares (but not below zero), which will result in an increase in the amount of gain (or decrease in the amount of loss) that will be recognized by the U.S. shareholder for tax purposes on the later sale of such Fund shares. For a further discussion on the tax treatment of Fund distributions to U.S. shareholders, please see the prospectus or consult your own tax advisors as to the U.S. federal income tax consequences of acquiring, holding and disposing of shares, as well as the effects of state, local and non-U.S. tax laws.

About TortoiseEcofin

TortoiseEcofin focuses on essential assets – those assets and services that are indispensable to the economy and society. We strive to make a positive impact on clients and communities by investing in energy infrastructure and the transition to cleaner energy and by providing capital for social impact projects focused on education and senior housing. TortoiseEcofin brings together strong legacies from Tortoise, with expertise investing across the energy value chain for more than 20 years, and from Ecofin, which unites ecology and finance and has roots back to the early 1990s. For more information, please visit www.TortoiseEcofin.com.

About Tortoise MLP & Energy Income Fund

The Tortoise MLP & Energy Income Fund invests in securities across the capital structure of energy infrastructure companies, including common equity, preferred equity, bonds and MLPs. The fund’s goal is to deliver strong risk-adjusted returns, greater liquidity, lower volatility and high correlation relative to the Alerian MLP Index over a market cycle.

About Tortoise MLP & Energy Infrastructure Fund

The Tortoise MLP & Energy Infrastructure Fund invests in securities across the capital structure of energy infrastructure companies, including common equity, preferred equity, bonds and MLPs. The fund’s goal is to deliver strong risk-adjusted returns, greater liquidity, lower volatility and high correlation relative to the Alerian MLP Index over a market cycle.

About Tortoise MLP & Pipeline Fund

The Tortoise MLP & Pipeline Fund focuses on the large and diverse North American pipeline universe. The fund invests primarily in MLP and pipeline companies that own and operate a network of asset systems that transport, store, distribute, gather and/or process crude oil, refined petroleum products (including biodiesel and ethanol), natural gas or natural gas liquids. The fund is designed to provide access to the sizable pipeline network of one of the world's largest consumers of energy, efficient tax flow-through structure, one 1099 (no K-1s), no unrelated business taxable income (UBTI) and IRA and tax-exempt suitability.

About Tortoise Energy Evolution Fund

The Tortoise Energy Evolution Fund seeks to invest in securities benefiting from the long-term growth associated with the changes in energy supply relating to the energy transition that is currently underway.

About Ecofin Global Renewables Infrastructure Fund

The Ecofin Global Renewables Infrastructure Fund is an impact fund investing in listed companies that own low-carbon power generation assets. The fund invests in companies riding on the high demand growth for clean electricity. The portfolio has the goal of providing a low beta and delivers a measurable decarbonization benefit.

Disclosures

TCA Advisors is the adviser to the Tortoise MLP & Pipeline Fund, Tortoise MLP & Energy Income Fund, Tortoise MLP & Energy Infrastructure Fund, Tortoise Energy Evolution Fund and Ecofin Global Renewables Infrastructure Fund. Ecofin Advisors Limited is the sub-adviser to the Tortoise Energy Evolution Fund and Ecofin Global Renewables Infrastructure Fund.

Quasar Distributors, LLC, distributor.

Nothing contained in this communication constitutes tax, legal, or investment advice. Investors must consult their tax advisor or legal counsel for advice and information concerning their particular situation.

The funds’ investment objectives, risks, charges and expenses must be considered carefully before investing. The summary and statutory prospectus contains this and other important information about the funds and may be obtained by calling 855-TCA-FUND (855-822-3863) or visiting www.TortoiseEcofin.com. Read it carefully before investing.

Mutual fund investing involves risk. Principal loss is possible.

Safe Harbor Statement

This press release shall not constitute an offer to sell or a solicitation to buy, nor shall there be any sale of these securities in any state or jurisdiction in which such offer or solicitation or sale would be unlawful prior to registration or qualification under the laws of such state or jurisdiction.

Forward-looking statement

This press release contains certain statements that may include “forward-looking statements” within the meaning of Section 27A of the Securities Act of 1933 and Section 21E of the Securities Exchange Act of 1934. All statements, other than statements of historical fact, included herein are "forward-looking statements." Although TortoiseEcofin believes that the expectations reflected in these forward-looking statements are reasonable, they do involve assumptions, risks and uncertainties, and these expectations may prove to be incorrect. Actual results could differ materially from those anticipated in these forward-looking statements as a result of a variety of factors, including those discussed in the company’s reports that are filed with the Securities and Exchange Commission. You should not place undue reliance on these forward-looking statements, which speak only as of the date of this press release. Other than as required by law, TortoiseEcofin does not assume a duty to update this forward-looking statement.


Contacts

Maggie Zastrow
(913) 981-1020
This email address is being protected from spambots. You need JavaScript enabled to view it.

Expanded Location Key to Continued Scale-Up

WASHINGTON--(BUSINESS WIRE)--Ion Storage Systems (ISS) today announced that it will move into a new 20,000 square foot headquarters, located in Maryland’s Prince George's County. The space will house essential functions necessary to the continued development of ISS’s groundbreaking batteries that enable customers to break through barriers imposed by legacy chemistries.

The new space marks the next major step in Ion’s scale-up to meet a growing production schedule. The building will include office space for headquarters staff, quality control and research labs, and multi megawatt-scale production facilities scaled to produce millions of batteries per year. Initial production will focus on serving the Department of Defense. Ion recently announced a $2 million contract with the Defense Logistics Agency to commercialize a conformal wearable battery for soldiers in the field.

“Our new site is further indication that we are on track to deliver game changing batteries,” said Ricky Hanna, ISS CEO. “I am proud of my team and grateful to our investors, customers, and government agencies for giving us the support needed to reach this critical milestone.”

“Ion Storage’s office acquisition further proves that Maryland’s tech sector is healthy and thriving,” said Kelly M. Schulz, Maryland Secretary of Commerce. “I am very pleased that this groundbreaking company continues to make our state proud.”

"As a University of Maryland spin-out company, Ion Storage Systems demonstrates how great ideas and innovations can transition from the academic research lab to industry,” said Dr. Laurie Locascio, University of Maryland’s Vice President for Research. “I’m particularly excited for Ion’s founders—Professor Eric Wachsman and University of Maryland alumnus Dr. Greg Hitz—whose persistence and ingenuity led to the commercialization of such an exciting technology breakthrough."

The lease and closing were facilitated by Maryland’s Prince George’s County’s Office of Economic Development Corporation (PGEDC). ISS will move into the new space by the end of the year. The move comes on the heels of new funding from the Defense Logistics Agency (DLA), the Department of Energy’s (DOE) Advanced Research Project Agency–Energy (ARPA-E), DOE’s Office of Energy Efficiency and Renewable Energy (EERE), and Army Research Lab (ARL).

About Ion Storage Systems

Ion Storage Systems creates batteries that are safer, lighter, and enable form factors with tighter packing density that enhance system performance. These innovations empower the world’s innovators to break down barriers in their product development cycles to redefine what’s possible and begin building the products of tomorrow today. At Ion Storage Systems, we’re building better batteries so you can build better products. Build with us. ISS is a spin-out from the University of Maryland–College Park.

Visit www.ionstoragesystems.com for more info.


Contacts

Dwight Langhum
Langhum Mitchell Com.: 202.546.9170

Shape strategic responses through the phases of industry recovery

BASF SE, Exxon Mobil Corp., and IG Petrochemicals Ltd. will emerge as major phthalic anhydride market participants during 2020-2024

LONDON--(BUSINESS WIRE)--#GlobalPhthalicAnhydrideMarket--The phthalic anhydride market is expected to grow by USD 3.52 billion during 2020-2024, according to Technavio. The report offers a detailed analysis of the impact of COVID-19 pandemic on the phthalic anhydride market in optimistic, probable, and pessimistic forecast scenarios.


Enterprises will go through Response, Recovery, and Renew phases. Download a Free Sample Report on COVID-19

The phthalic anhydride market will witness a neutral impact during the forecast period owing to the widespread growth of the COVID-19 pandemic. As per Technavio’s pandemic-focused market research, market growth is likely to increase as compared to 2019.

With the continuing spread of the novel coronavirus pandemic, organizations across the globe are gradually flattening their recessionary curve by leveraging technology. Many businesses will go through response, recovery, and renewal phases. Building business resilience and enabling agility will aid organizations to move forward in their journey out of the COVID-19 crisis towards the Next Normal.

This post-pandemic business planning research will aid clients to:

  • Adjust their strategic planning to move ahead once business stability kicks in.
  • Build Resilience by making effective resource and investment choices for individual business units, products, and service lines.
  • Conceptualize scenario-based planning to mitigate future crisis situations.

Download the Post-Pandemic Business Planning Structure. Click here

Key Considerations for Market Forecast:

  • Impact of lockdowns, supply chain disruptions, demand destruction, and change in customer behavior
  • Optimistic, probable, and pessimistic scenarios for all markets as the impact of pandemic unfolds
  • Pre- as well as post-COVID-19 market estimates
  • Quarterly impact analysis and updates on market estimates

Gain instant access to 17,000+ market research reports by using

Technavio's SUBSCRIPTION platform

Major Three Phthalic Anhydride Market Participants:

BASF SE

BASF SE operates its business through segments such as Agricultural Solutions and Other. O4-35, O4-66, and O4-68 some of the products offered by the company under its PA product line.

Exxon Mobil Corp.

Exxon Mobil Corp. operates its business through segments such as Upstream, Downstream, and Chemical. The company offers PA for plasticizers. It produces PA in its Rotterdam production facility.

IG Petrochemicals Ltd.

IG Petrochemicals Ltd. operates as a single business segment, which includes the manufacturing and sales of organic chemicals such as phthalic anhydride, maleic anhydride, and benzoic acid.

If you purchase a report that is updated in the next 60 days, we will send you the new edition and data extract FREE! Get report snapshot here to get detailed market share analysis of market participants during COVID-19 lockdown: https://www.technavio.com/report/phthalic-anhydride-market-industry-analysis

Phthalic Anhydride Market 2020-2024: Segmentation

Phthalic anhydride market is segmented as below:

  • Application
    • Plasticizers
    • UPR
    • Alkyd Resins
    • Others
  • Geography
    • APAC
    • North America
    • Europe
    • South America
    • MEA


The phthalic anhydride market is driven by the growth of the construction industry. In addition, other factors such as increased use of plasticizers in PVC products are expected to trigger the phthalic anhydride market toward witnessing a CAGR of almost 7% during the forecast period.

Get more insights about the global trends impacting the future of the phthalic anhydride market, Request Free Sample @ https://www.technavio.com/talk-to-us?report=IRTNTR44742

Market Drivers

Market Challenges

Market Trends

Vendor Landscape

  • Vendors covered
  • Vendor classification
  • Market positioning of vendors
  • Competitive scenario

About Us

Technavio is a leading global technology research and advisory company. Their research and analysis focuses on emerging market trends and provides actionable insights to help businesses identify market opportunities and develop effective strategies to optimize their market positions. With over 500 specialized analysts, Technavio’s report library consists of more than 17,000 reports and counting, covering 800 technologies, spanning across 50 countries. Their client base consists of enterprises of all sizes, including more than 100 Fortune 500 companies. This growing client base relies on Technavio’s comprehensive coverage, extensive research, and actionable market insights to identify opportunities in existing and potential markets and assess their competitive positions within changing market scenarios.


Contacts

Technavio Research
Jesse Maida
Media & Marketing Executive
US: +1 844 364 1100
UK: +44 203 893 3200
Email: This email address is being protected from spambots. You need JavaScript enabled to view it.
Website: www.technavio.com/

KANSAS CITY, Mo.--(BUSINESS WIRE)--Kansas City Southern (KCS) (NYSE: KSU) announced that its Board of Directors approved updates to its capital allocation policy. Under this updated policy, the Company intends to continue deploying available cash in the following manner:


  • Approximately 40-50% to capital projects and strategic investments; and
  • Approximately 50-60% to share repurchases and dividends.

In addition, from time to time, the Company also plans to prudently use additional debt to support the revised policy and intends to increase its Debt-to-EBITDA ratio to the mid-2x range, consistent with its current ratings of BBB from Standard & Poor’s and Fitch Ratings and Baa2 from Moody’s.

In connection with this updated policy, the Board also approved the following actions:

  • An increase in the quarterly dividend on KCS’s common stock from $0.40 to $0.44 per share. The board declared a common stock dividend for this increased amount payable on January 20, 2021, to stockholders of record at the close of business on December 31, 2020. In April 2021, KCS will implement a quarterly dividend approach that targets a low 20% range payout; and
  • A new $3.0 billion share repurchase program, expiring December 31, 2023. This new program replaces the $2.0 billion stock repurchase program announced in 2019 under which the Company has purchased approximately $1.4 billion of Company stock, including the $500 million accelerated share repurchase agreement that was announced alongside our third quarter 2020 earnings.

Kansas City Southern’s revenue growth, margin improvement and cash flow generation this year have been remarkable given the economic and operational challenges we have faced,” stated President and Chief Executive Officer, Patrick J. Ottensmeyer. “Our plan to prudently increase the amount of capital returned to shareholders demonstrates management’s and our Board’s confidence in our strong growth prospects, ability to continue delivering on our long-range plan and the long-term operational efficiencies and lower capital spend intensity created by our Precision Scheduled Railroading implementation.”

We believe today’s announcement continues to balance our objectives of delivering meaningful capital returns while investing in future growth opportunities and maintaining a desirable credit profile.”

The Company’s Board also declared a regular dividend of $0.25 per share on the outstanding KCS 4% Non-Cumulative Preferred stock. This dividend is payable on January 19, 2021, to stockholders of record at the close of business on December 31, 2020.

Headquartered in Kansas City, Mo., Kansas City Southern (KCS) (NYSE: KSU) is a transportation holding company that has railroad investments in the U.S., Mexico and Panama. Its primary U.S. holding is The Kansas City Southern Railway Company, serving the central and south central U.S. Its international holdings include Kansas City Southern de Mexico, S.A. de C.V., serving northeastern and central Mexico and the port cities of Lázaro Cárdenas, Tampico and Veracruz, and a 50 percent interest in Panama Canal Railway Company, providing ocean-to-ocean freight and passenger service along the Panama Canal. KCS' North American rail holdings and strategic alliances with other North American rail partners are primary components of a unique railway system, linking the commercial and industrial centers of the U.S., Mexico and Canada. More information about KCS can be found at www.kcsouthern.com

Forward-Looking Information

This news release contains forward-looking statements within the meaning of Section 27A of the Securities Act of 1933, as amended, Section 21E of the Securities Exchange Act of 1934, as amended and the Private Securities Litigation Reform Act of 1995. In addition, management may make forward-looking statements orally or in other writing, including, but not limited to, in press releases, quarterly earnings calls, executive presentations, in the annual report to stockholders and in other filings with the Securities and Exchange Commission. Readers can usually identify these forward-looking statements by the use of such words as "may," "will," "should," "likely," "plans," "projects," "expects," "anticipates," "believes" or similar words. These statements involve a number of risks and uncertainties. Actual results could materially differ from those anticipated by such forward-looking statements as a result of a number of factors or combination of factors including, but not limited: public health threats or outbreaks of communicable diseases, such as the ongoing COVID-19 pandemic and its impact on KCS’s business, suppliers, consumers, customers, employees and supply chains; rail accidents or other incidents or accidents on KCS’s rail network or at KCS’s facilities or customer facilities involving the release of hazardous materials, including toxic inhalation hazards; legislative and regulatory developments and disputes, including environmental regulations; loss of the rail concession of Kansas City Southern’s subsidiary, Kansas City Southern de México, S.A. de C.V.; domestic and international economic, political and social conditions; disruptions to the Company’s technology infrastructure, including its computer systems; increased demand and traffic congestion; the level of trade between the United States and Asia or Mexico; fluctuations in the peso-dollar exchange rate; natural events such as severe weather, hurricanes and floods; the outcome of claims and litigation involving the Company or its subsidiaries; competition and consolidation within the transportation industry; the business environment in industries that produce and use items shipped by rail; the termination of, or failure to renew, agreements with customers, other railroads and third parties; fluctuation in prices or availability of key materials, in particular diesel fuel; access to capital; climate change and the market and regulatory responses to climate change; dependency on certain key suppliers of core rail equipment; changes in securities and capital markets; unavailability of qualified personnel; labor difficulties, including strikes and work stoppages; acts of terrorism or risk of terrorist activities, war or other acts of violence; and other factors affecting the operation of the business; and other risks identified in this news release, in KCS's Annual Report on Form 10-K for the year ended December 31, 2019, and in other reports filed by KCS with the Securities and Exchange Commission.

Forward-looking statements reflect the information only as of the date on which they are made. KCS does not undertake any obligation to update any forward-looking statements to reflect future events, developments, or other information.


Contacts

KCS: Ashley Thorne, 816-983-1530, This email address is being protected from spambots. You need JavaScript enabled to view it.

TAMPA, Fla.--(BUSINESS WIRE)--$talent #RPO--WilsonHCG has once again been recognized as a “Leader” in NelsonHall’s NEAT Vendor Evaluation for RPO. The global talent firm was positioned as a leader in all categories, including innovation in tools and technology, innovation in services, footprint and scalability, candidate experience and talent acquisition transformation journey.


NelsonHall's 2020 RPO NEAT Vendor Evaluation analyzes the performance of vendors offering RPO services. HR decision-makers use the tool to assess the capability of vendors across a range of criteria and to identify the best-performing vendors overall.

“WilsonHCG continues to have a deep understanding of its clients’ talent needs, bringing appropriate innovation in services and technology to enhance its clients’ market competitiveness. It has also developed new/adapted existing offerings to address clients’ unique 2020 hiring and business challenges, putting WilsonHCG in a strong position to meet future challenges in an uncertain world,” said Nikki Edwards, Principal HR Technology & Services Analyst with NelsonHall.

“We're proud to rank as a leader in all categories again this year. It’s a testament to our team’s ongoing commitment to exceptional client service, even under challenging circumstances. We are dedicated to strengthening client partnerships by helping them flourish through any future market fluctuations,” said WilsonHCG’s CEO John Wilson.

Earlier this year, WilsonHCG was the only provider to be named a Leader and Star Performer in Everest Group’s 2020 PEAK Matrix® for Recruitment Process Outsourcing (RPO) in North America. The company’s proprietary analytics platform, Analytics Cloud Exchange (ACE), which collects data from multiple sources and technologies into a single dashboard, was described as a “distinguishing feature of vision and capability advancement.”

WilsonHCG was also recognized in HRO Today magazine’s annual Baker’s Dozen list for RPO for the 10th year in a row.

To learn more about NelsonHall’s 2020 Recruitment Process Outsourcing NEAT Vendor Evaluation, please visit NelsonHall’s website here.

About WilsonHCG

WilsonHCG is an award-winning, global leader in total talent solutions. Operating as a strategic partner, it helps some of the world’s most admired brands build comprehensive talent functions. With a global presence spanning more than 65 countries and six continents, WilsonHCG provides a full suite of configurable talent services including recruitment process outsourcing (RPO), executive search, contingent talent solutions and technology advisory.

TALENT. ™ It’s more than a solution; it’s who we are.

www.wilsonhcg.com


Contacts

Media Contact
Kirsty Hewitt
+44 7889901517
813-418-4479
This email address is being protected from spambots. You need JavaScript enabled to view it.

NEW YORK--(BUSINESS WIRE)--BlackRock Real Assets (“BlackRock”) today announced that it has completed the acquisition from GE Renewable Energy of the remaining 20 percent stake in Distributed Solar Development (“DSD”), a leading commercial and industrial (“C&I”) solar developer and operator in the United States. BlackRock Real Assets now owns 100 percent of DSD, expanding the platform’s footprint and investment pipeline in the fastest-growing renewables sector in the country.


The investment, made through BlackRock’s Global Renewable Power II Fund (“GRP II”), follows an initial investment in July 2019 in which the fund took an 80 percent stake in DSD. It allows for BlackRock to fund greater near-term growth in the platform, which starting in 2021 is expected to consistently deploy over 200 megawatts of renewable energy annually. Launched as a start-up within GE, DSD seeks to make solar more accessible to commercial, industrial and municipal organizations by providing a “one-stop shop” for large-scale, custom solar PV and energy storage solutions.

Martin Torres, Head of the Americas for the Renewable Power Group at BlackRock, said, “We are pleased to acquire the remaining interest in DSD and thank GE for their partnership on this venture. We look forward to continuing to work with the DSD management team to build on the company’s end-to-end capabilities and position as a leading C&I operator in the U.S., and deliver for our clients exposure to long-term, contracted revenues in a rapidly growing market aligned with the global energy transition.”

Erik Schiemann, CEO of DSD, said, “BlackRock has been a tremendous partner for the last 15 months and we are encouraged by their continued collaboration, confidence and investment in DSD. We are looking forward to the exciting times ahead of us over the coming years. We are also incredibly appreciative of GE’s support since our start in 2012 and hope to have future opportunities for collaboration.”

With this investment, GRP II, a $1.65 billion fund, is now fully committed to 16 investments across more than 150 wind and solar projects in North America, Europe and Asia. BlackRock Real Assets continues to invest in diversified, long-term renewable power infrastructure assets through its third-vintage Global Renewable Power III Fund (“GRP III”).

BlackRock Real Assets operates one of the largest renewable power equity investment platforms in the world with $6.5 billion in capital raised, invested in over 250 wind and solar projects across the globe, that produces enough clean energy to power a country the size of Spain.

About BlackRock

BlackRock’s purpose is to help more and more people experience financial well-being. As a fiduciary to investors and a leading provider of financial technology, our clients turn to us for the solutions they need when planning for their most important goals. As of September 30, 2020, the firm managed approximately $7.81 trillion in assets on behalf of investors worldwide.

About BlackRock Real Assets

In today’s dynamic and complex global investing market, we seek to help our clients’ access real assets that could help meet their investment goals by providing a distinct range of well defined, outcome orientated strategies, along the investment risk-return spectrum.

Our dedicated teams of industry and sector specialists deliver global reach, with deep local expertise. They have decades of relevant experience, are deeply embedded in their operating industries by sector and geography and have developed strong partnership networks over time. BlackRock’s culture of risk management, knowledge sharing and investment discipline sets us apart and underpins all that we do. With over 390 professionals in 30 offices managing over US$58 billion in client commitments as of 30 June 2020, BlackRock Real Assets partners with clients to provide solutions tailored to individual portfolio needs such as income, growth, liquid or balanced real assets outcomes.

About Distributed Solar Development

Distributed Solar Development (DSD) is transforming the way organizations harness clean energy. With unparalleled capabilities including development, structured financing, project acquisition and long-term asset ownership, DSD creates significant value for our commercial, industrial and municipal customers and partners. Backed by world-leading financial partners like BlackRock Real Assets and rooted in our founding at GE with a 120+ year legacy of innovation, our team brings a distinct combination of ingenuity, rigor, and accountability to every project we manage, acquire, own and maintain. To learn more, visit dsdrenewables.com.

Disclaimer

This presentation is strictly confidential and may not be reproduced for, disclosed to or otherwise provided in any format to any other person or entity (other than the recipient) without the prior written consent of BlackRock, Inc. or its applicable advisory subsidiaries (collectively, “BlackRock”). This material has not been approved by the SEC, FINRA or any other regulatory authority or securities. This presentation is for informational purposes only and not to be relied upon as investment, legal, tax, or financial advice. The Reader must consult with his or her independent professional advisors as to the legal, tax, financial or other matters relevant to the suitability of any investment.

Certain information contained in this presentation constitutes “forward-looking statements,” which can be identified by the use of forward looking terminology such as “may,” “will,” “should,” “expect,” “anticipate,” “project,” “estimate,” “intend,” “continue,” “target,” “believe,” the negatives thereof, other variations thereon or comparable terminology. Such information may include, among other things, projections, forecasts, and proposed or expected portfolio composition. No representation is made that every assumption made in achieving, calculating or presenting the forward-looking information has been considered or stated in preparing this material. Any changes to assumptions that may have been made in preparing this material could have a material impact on the projections that are presented herein.

Any research in this document has been procured and may have been acted on by BlackRock for its own purpose. The results of such research are being made available only incidentally. The views expressed do not constitute investment or any other advice and are subject to change. They do not necessarily reflect the views of any company in the BlackRock Group or any part thereof and no assurances are made as to their accuracy.

This document is for information purposes only and does not constitute an offer or invitation to anyone to invest in any BlackRock funds and has not been prepared in connection with any such offer.

Securities offered in the US through BlackRock Investments, LLC.

Important Information

This press release is for distribution in the United States only and should not be distributed in any other markets or to any other persons.


Contacts

BlackRock
Christopher Beattie
646-231-8518
This email address is being protected from spambots. You need JavaScript enabled to view it.

Distributed Solar Development
Meghan Gainer
518-369-3692
This email address is being protected from spambots. You need JavaScript enabled to view it.

DUBLIN--(BUSINESS WIRE)--The "Steam Trap Market: Global Industry Trends, Share, Size, Growth, Opportunity and Forecast 2020-2025" report has been added to ResearchAndMarkets.com's offering.


The global steam trap market is currently witnessing stable growth.

A steam trap is a mechanical valve that is used to discharge condensates and non-condensates, such as air and carbon dioxide, from steam lines. Mechanical, thermostatic and thermodynamic traps are the most common types of steam traps available in the market.

They are commonly used in bulk storage tanks, pressure reducing valve stations, steamers, heat exchangers and reboilers. They also act as a separation point between the condensates and the steam system to create latent heat and transfer it to a specific product. Owing to this, stream traps find extensive application across various industries, including oil and gas, power generation, chemicals, pharmaceuticals, pulp and paper, and food and beverages.

Growing industrialization is one of the key factors driving the growth of the market. Stream traps are highly durable, light in weight and have a long shelf life. Owing to this, they are widely adopted for sterilization and enhancing the efficiency of various industrial processes. Furthermore, the increasing oil and gas exploratory activities across the globe are also providing a boost to the market growth.

Additionally, various technological advancements, including the development of wireless monitoring systems, are acting as another growth-inducing factor. Advanced steam traps are equipped with thermocouple sensors to take temperature readings at periodic intervals and transmit the signals to an interface for the user to remotely access it.

Other factors, including the implementation of favorable government policies promoting the sustainable utilization of energy resources and extensive research and development (R&D) activities, along with the rising trend of automation in the oil and gas industry, are projected to drive the market further.

Looking forward, the market to register a CAGR of 3.5% during 2020-2025.

Key Questions Answered in this Report:

  • How has the global steam trap market performed so far and how will it perform in the coming years?
  • What are the key regional markets?
  • What is the breakup of the market based on the product type?
  • What is the breakup of the market based on the application?
  • What is the breakup of the market based on the material type?
  • What is the breakup of the market based on the distribution channel?
  • What is the breakup of the market based on the end-use industry?
  • What are the various stages in the value chain of the industry?
  • What are the key driving factors and challenges in the industry?
  • What is the structure of the global steam trap market and who are the key players?
  • What is the degree of competition in the industry?

Key Topics Covered:

1 Preface

2 Scope and Methodology

2.1 Objectives of the Study

2.2 Stakeholders

2.3 Data Sources

2.4 Market Estimation

2.5 Forecasting Methodology

3 Executive Summary

4 Introduction

4.1 Overview

4.2 Key Industry Trends

5 Global Steam Trap Market

5.1 Market Overview

5.2 Market Performance

5.3 Market Forecast

6 Market Breakup by Product Type

6.1 Thermodynamic

6.1.1 Market Trends

6.1.2 Market Forecast

6.2 Mechanical

6.3 Thermostatic

7 Market Breakup by Application

7.1 Instrument Steam Tracing

7.1.1 Market Trends

7.1.2 Market Forecast

7.2 Line Steam Tracing

7.3 Drip Application

7.4 Process Application

7.5 Others

8 Market Breakup by Material Type

8.1 Steel

8.1.1 Market Trends

8.1.2 Market Forecast

8.2 Iron

8.3 Others

9 Market Breakup by Distribution Channel

9.1 Online

9.1.1 Market Trends

9.1.2 Market Forecast

9.2 Offline

10 Market Breakup by End-Use Industry

10.1 Oil & Gas

10.1.1 Market Trends

10.1.2 Market Forecast

10.2 Power Generation

10.3 Pharmaceuticals

10.4 Food & Beverages

10.5 Pulp & Paper

10.6 Chemical

10.7 Others

11 Market Breakup by Region

12 SWOT Analysis

12.1 Overview

12.2 Strengths

12.3 Weaknesses

12.4 Opportunities

12.5 Threats

13 Value Chain Analysis

14 Porters Five Forces Analysis

14.1 Overview

14.2 Bargaining Power of Buyers

14.3 Bargaining Power of Suppliers

14.4 Degree of Competition

14.5 Threat of New Entrants

14.6 Threat of Substitutes

15 Price Indicators

16 Competitive Landscape

16.1 Market Structure

16.2 Key Players

16.3 Profiles of Key Players

  • Circor International Inc.
  • Emerson Electric Co.
  • Flowserve Corporation
  • Pentair Inc.
  • Schlumberger Limited
  • Spirax-Sarco Engineering
  • Thermax Ltd.
  • Velan Inc.
  • Watts Water Technologies Inc.
  • The Weir Group PLC

For more information about this report visit https://www.researchandmarkets.com/r/fm8sr6


Contacts

ResearchAndMarkets.com
Laura Wood, Senior Press Manager
This email address is being protected from spambots. You need JavaScript enabled to view it.
For E.S.T Office Hours Call 1-917-300-0470
For U.S./CAN Toll Free Call 1-800-526-8630
For GMT Office Hours Call +353-1-416-8900

Based on new analyses, the NuScale Power Module™ is able to increase its power output to 77 MWe

PORTLAND, Ore.--(BUSINESS WIRE)--NuScale Power today announced that through further value engineering efforts, using advanced testing and modeling tools, NuScale analyzed and concluded that the NuScale Power Module™ (NPM) can generate an additional 25 percent more power per module for a total of 77 MWe per module (gross), resulting in about 924 MWe for the flagship 12-module power plant. Additionally, NuScale is announcing options for smaller power plant solutions in four-module (about 308 MWe) and six-module (about 462 MWe) sizes.


“Without impacting the unparalleled safety of our design, our engineers have proven yet again that NuScale’s technology is first-class, and can offer significant cost-savings and customization at a level yet to be seen in the nuclear energy market,” said NuScale Power Chairman and Chief Executive Officer John Hopkins. “With this advancement, NuScale continues to demonstrate that it is the global leader in the race to commercialize small modular reactors.”

Increasing the power generating capacity of a 12-module NuScale small modular reactor (SMR) plant by an additional 25 percent lowers the overnight capital cost of the facility on a per kilowatt basis from an expected $3,600 to approximately $2,850. Furthermore, the scalable, 12-module power plant will now approach a size that makes it a true competitor for the gigawatt-size market. The increased power output comes without any major changes to the NPM technology.

The smaller power plant solutions will give NuScale customers more options in terms of size, power output, operational flexibility and cost. They will also have a smaller and innovative footprint with a focus on simplifying construction, reducing construction duration (schedule) and lowering costs. This new solution allows NuScale to support a larger cross-section of customer needs including power for small grids such as for island nations; remote off-grid communities; industrial and government facilities; and coal power replacements that require less power and help customers meet clean air mandates.

The regulatory process of increasing the level of maximum reactor power at which a nuclear plant can operate is referred to as a power uprate. The power increase will be reviewed by the U.S. Nuclear Regulatory Commission as part of NuScale’s Standard Design Approval (SDA) application, which NuScale is scheduled to submit in 2022.

NuScale’s initial new products will be a four- and six-module power plant solution, although other configurations are possible. These smaller plant solutions are economically competitive and are underpinned by and leverage the industry leading NPM technology and safety case that has already been approved by the U.S. Nuclear Regulatory Commission. Like the flagship NuScale power plant, these smaller configurations will retain the capability to deliver scalable power plant solutions with features, capability and performance not found in other SMRs. NuScale will be able to deliver its first module to a client in 2027.

​​​​​About NuScale Power

NuScale Power has developed a new modular light water reactor nuclear power plant to supply energy for electrical generation, district heating, desalination, and other process heat applications. This groundbreaking small modular reactor (SMR) design features a fully factory-fabricated NuScale Power Module™ capable of generating 77 MW of electricity using a safer, smaller, and scalable version of pressurized water reactor technology. NuScale's scalable design—a power plant can house up to 12 individual power modules—offers the benefits of carbon-free energy and reduces the financial commitments associated with gigawatt-sized nuclear facilities. The majority investor in NuScale is Fluor Corporation, a global engineering, procurement, and construction company with a 60-year history in commercial nuclear power.

NuScale is headquartered in Portland, OR and has offices in Corvallis, OR; Rockville, MD; Charlotte, NC; Richland, WA; and London, UK. Follow us on Twitter: @NuScale_Power, Facebook: NuScale Power, LLC, LinkedIn: NuScale-Power, and Instagram: nuscale_power. NuScale has a new logo, brand, and website. Watch the short video.


Contacts

Media Contact:
Diane Hughes, Vice President, Marketing & Communications, NuScale Power
This email address is being protected from spambots. You need JavaScript enabled to view it.
(C) 503-270-9329

DUBLIN--(BUSINESS WIRE)--The "United States Thermal Power Market - Growth, Trends, and Forecasts (2020 - 2025)" report has been added to ResearchAndMarkets.com's offering.


The United States thermal power market is expected to rise at a CAGR of more than 0.5% during the forecast period of 2020-2025

Factors such as using natural gas plants as a backup for renewable energy are likely to drive the market. However, reducing renewable energy prices has provided an economically viable cleaner alternative, which is expected to restrain the growth of the market.

Many private firms and state governments, especially in the south of the country, are investing in thermal power plants as sources of energy for the future. This is expected to drive the market in the forecast period.

The technological advancements in efficiency and reduction in the harmful emissions from thermal power projects are expected to create ample opportunity for market players.

Natural gas provides for a large amount of electricity in the country and is expected to dominate the thermal power market in the forecast period. The application of natural gas as an intermediary for transitioning to renewable energy is expected to aid the market.

Key Market Trends

Increasing Investments in Thermal Power to Drive the Market

In the United States, the different states are following different paths for the establishment of thermal power plants. For example, the state of California is dominated by Natural gas, but the state is pushing its utilities to replace natural gas power plants with renewables and other resources. Other states like in the mid-west are following a more natural gas-based approach for their energy needs.

  • In 2019, the Florida Public Service Commission approved a pair of new gas-fired power plants needed to serve the future power demand of cooperative electric customers. Regulators say the combined projects will save customers USD 363 million. Seminole Electric Cooperative is expected to construct a new 1.1 GW plant in Putnam County, expected in service in 2022. Shady Hills Energy Center is expected to build a new 573 MW natural gas facility in Pasco County, which is likely to be in service in late 2021.
  • In 2018, Florida-based NTE Energy announced plans for a new 1 GW gas-fired power plant in South Carolina to be operational in 2024. The state of South Carolina is struggling with its generation supply and therefore looking for a cheaper supply of energy, which may be provided through the use of thermal power plants. The increase in investment is expected to aid the growth of the market.
  • Primary energy consumption in the country decreased by 1%, to 94.65 exajoules, in 2019 from 95.60 exajoules, in 2018. The reduction in primary energy consumption in the country is expected to restrain the growth of the market.
  • However, increasing investments in the country are expected to drive the growth in the coming years.

Natural Gas to Dominate the Market

Natural gas is among the cleanest fuels, which can provide electricity at an industrial scale economically. Gas-fired power generation is expected to displace coal capacity in the country in the coming decades. Although investments in renewables are expected to grow significantly, the flexibility afforded by gas-fired power generation is expected to continue to be in demand.

  • Among the most significant drivers of the natural gas thermal power plants is its use as backup power for unreliability in renewable sources like wind and solar. Natural gas plants can start running in short notice, which can increase the utility grid's reliability.
  • Primary energy provided by Natural gas, in the country, increased by 3.39%, to 30.48 exajoules, in 2019 from 29.52 exajoules, in 2018.
  • The country has seen a significant increase in shale oil and gas production, which has drastically reduced the United States' dependence on the global energy supply chains. Reduction in natural gas prices has further aided the growth of the natural gas thermal power market.
  • Hence, natural gas is expected to dominate the market in the forecast period due to rising investments in the field.

Competitive Landscape

The United States thermal power market is partially fragmented. Some of the key players in this market include NextEra Energy, Inc., Dominion Energy, Inc., Duke Energy Corporation, Southern Company, and American Electric Power Company Inc

Key Topics Covered:

1 INTRODUCTION

2 RESEARCH METHODOLOGY

3 EXECUTIVE SUMMARY

4 MARKET OVERVIEW

4.1 Introduction

4.2 Market Size and Demand Forecast, in USD billion till 2025

4.3 Electricity Consumption Forecast, in TWh, till 2025

4.4 Electricity Generation Forecast, in TWh, till 2025

4.5 Recent Trends and Developments

4.6 Government Policies and Regulations

4.7 Market Dynamics

4.7.1 Drivers

4.7.2 Restraints

4.8 Supply Chain Analysis

4.9 PESTLE Analysis

5 MARKET SEGMENTATION

5.1 Type

5.1.1 Coal

5.1.2 Natural Gas

5.1.3 Nuclear

5.1.4 Others

6 COMPETITIVE LANDSCAPE

6.1 Mergers and Acquisitions, Joint Ventures, Collaborations, and Agreements

6.2 Strategies Adopted by Leading Players

6.3 Company Profiles

6.3.1 NextEra Energy Inc

6.3.2 Dominion Energy Inc

6.3.3 Duke Energy Corp

6.3.4 Southern Company

6.3.5 American Electric Power Company Inc

6.3.6 Exelon Corporation

6.3.7 Xcel Energy Inc

6.3.8 Consolidated Edison, Inc.

6.3.9 Public Service Enterprise Group Inc.

7 MARKET OPPORTUNITIES AND FUTURE TRENDS

For more information about this report visit https://www.researchandmarkets.com/r/rw0clh


Contacts

ResearchAndMarkets.com
Laura Wood, Senior Press Manager
This email address is being protected from spambots. You need JavaScript enabled to view it.
For E.S.T Office Hours Call 1-917-300-0470
For U.S./CAN Toll Free Call 1-800-526-8630
For GMT Office Hours Call +353-1-416-8900

DUBLIN--(BUSINESS WIRE)--The "Analyzing the Global Market for Concentrated Solar Power 2020" report has been added to ResearchAndMarkets.com's offering.


This report analyzes the Global Market for Concentrated Solar Power 2020. This research report is a comprehensive analytical compilation which analyzes the global market for CSP along with an analysis of the key markets.

The concentrated solar power industry is bound to be one of the biggest and most efficient in the coming times ahead. If utilized to its full potential, it could end up providing for the world's 25% energy needs by 2050. Currently, there is over 25 GW of installed CSP capacity worldwide and more than 2000 MW under development.

The CSP industry must continue to focus on lowering cost through deployment and technology improvement, particularly efficiency. Those cost reductions must also be clearly demonstrated to stakeholders. Major cost reductions will be achieved by capturing the lessons of early deployment. The CSP Industry should work pro-actively to leverage the lessons gained from publically funded early deployment to ensure they flow to the widest possible base within the constraints of competitive markets.

Concentrating solar power's relatively low cost and ability to deliver power during periods of peak demand - when and where it's needed - means that it can be a major contributor to the world's future needs for distributed sources of energy.

The report begins by taking a look at solar power and the impact of global climate change as well as the challenge of carbon emissions facing the world. We move on to introduce the concept of concentrated solar power (CSP). We also explain the various types of CSP technologies available today.

An analysis of the global market for CSP includes an industry analysis through statistics, a look at industry size, power generation from CSP worldwide as well as the installed capacity of CSP in key markets. Investments in the industry are also looked at, followed by an analysis of the major industry trends and challenges.

Moving on to the analysis of key markets, the author analyzes CSP in Australia, China, India, South Africa, Spain and the US. For each market, the author looks at industry statistics, power generation from CSP, installed capacity of CSP, as well as the regulatory framework affecting the CSP industry in that country.

Competition in the industry and an analysis of the major players wraps up this analytical offering on the global concentrated solar power industry.

Key Topics Covered:

A. Executive Summary

B. Solar Power & Climate Change

B.1 What is Solar Power?

B.2 Pros & Cons of Solar Power

B.3 Readily Available Solar Power

B.4 Rising Energy Consumption & the Challenge of Carbon Emissions

C. Introduction to Concentrated Solar Power (CSP)

C.1 Historical Perspective of Concentrating Solar Power

C.2 Theories Behind Solar Thermal Power Conversion

C.3 Conversion of Solar Heat into Electricity

C.4 Requirement for Concentrating Solar Power

C.4.1 Sustaining the Ecosystem

C.4.2 Sustaining the Economics

D. Types of CSP Technologies

D.1 Technological Overview

D.2 Analysis of Central Receiver or Solar Tower

D.3 Analysis of Parabolic Troughs

D.4 Analysis of Parabolic Dish

D.5 Linear Fresnel Reflectors

E. Global Market for Concentrated Solar Power

E.1 Industry Overview

E.2 Industry Size

E.3 Power Generation from Concentrated Solar Power

E.4 CSP Installed Capacity - Key Markets

E.5 Industry Investments

F. Industry Trends & Challenges

F.1 Overview of Trends

F.2 Challenge of Grid Connectivity

F.3 Regulatory Support & Renewable Portfolio Standards

F.4 Financial Incentives

F.5 Project Cancellations

F.6 Associated Costs

G. Concentrated Solar Power in Australia

G.1 Industry Overview

G.2 Power Generation from CSP in Australia

G.3 Regulatory Framework

H. Concentrated Solar Power in China

H.1 Industry Overview

H.2 Power Generation from CSP in China

H.3 Regulatory Framework

I. Concentrated Solar Power in India

I.1 Industry Overview

I.2 Power Generation from CSP in India

I.3 Regulatory Framework

J. Concentrated Solar Power in South Africa

J.1 Industry Overview

J.2 Power Generation from CSP in South Africa

J.3 Regulatory Framework

K. Concentrated Solar Power in Spain

K.1 Industry Overview

K.2 Power Generation from CSP in Spain

K.3 Regulatory Framework

L. Concentrated Solar Power in the US

L.1 Industry Overview

L.2 Power Generation from CSP in the US

L.3 Regulatory Framework

L.3.1 Federal Regulations

L.3.2 Regulatory Framework in California

L.3.3 Regulatory Framework in Colorado

L.3.4 Regulatory Framework in Iowa

L.3.5 Regulatory Framework in Minnesota

L.3.6 Regulatory Framework in Nevada

L.3.7 Regulatory Framework in New Jersey

L.3.8 Regulatory Framework in New York

L.3.9 Regulatory Framework in Oregon

L.3.10 Regulatory Framework in Texas

L.3.11 Regulatory Framework in Washington

M. Concentrated Solar Power in Other Markets

M.1 Industry Overview

M.2 Power Generation from CSP in Other Markets

N. Concentrated Solar Power & Impact on the Environment

O. Competition in the Industry & Major Players

O.1 Competition in the Industry

O.2 Abengoa Solar SA

O.3 Acciona Energia SA

O.4 Amonix, Inc.

O.5 BrightSource Industries

O.6 Coolearth Solar

O.7 Enel SpA

O.8 Florida Power & Light Company

O.9 Sky Fuel Inc

O.10 Torresol Energy

P. Appendix

For more information about this report visit https://www.researchandmarkets.com/r/r185y7


Contacts

ResearchAndMarkets.com
Laura Wood, Senior Press Manager
This email address is being protected from spambots. You need JavaScript enabled to view it.
For E.S.T Office Hours Call 1-917-300-0470
For U.S./CAN Toll Free Call 1-800-526-8630
For GMT Office Hours Call +353-1-416-8900

Offshore Source Logo

Offshore Source keeps you updated with relevant information concerning the Offshore Energy Sector.

Any views or opinions represented on this website belong solely to the author and do not represent those of the people, institutions or organizations that Offshore Source or collaborators may or may not have been associated with in a professional or personal capacity, unless explicitly stated.

Corporate Offices

Technology Systems Corporation
8502 SW Kansas Ave
Stuart, FL 34997

info@tscpublishing.com