Business Wire News

SCOTTSDALE, Ariz.--(BUSINESS WIRE)--Nuverra Environmental Solutions, Inc. (NYSE American: NES) (“Nuverra,” the “Company,” “we,” “us” or “our”) today announced financial and operating results for the third quarter and nine months ended September 30, 2020.

SUMMARY OF FINANCIAL RESULTS

  • Revenue for the third quarter of 2020 was $23.8 million compared to $43.1 million for the third quarter of 2019.
  • Net loss for the third quarter of 2020 was $7.1 million compared to a net loss of $6.1 million for the third quarter of 2019.
  • For the third quarter of 2020, adjusted EBITDA decreased $3.1 million to $1.5 million versus $4.6 million for the third quarter of 2019 driven by significant commodity price and subsequent activity declines year over year partially offset by meaningful fixed and variable cost reductions.
  • Revenue for the nine months ended September 30, 2020 was $86.2 million compared to $131.0 million for the nine months ended September 30, 2019.
  • Net loss for the nine months ended September 30, 2020 was $36.9 million compared to a net loss of $17.4 million for the nine months ended September 30, 2019, primarily a result of $15.6 million long-lived asset impairment charges taken in the nine months ended September 30, 2020.
  • For the nine months ended September 30, 2020, adjusted EBITDA decreased $8.5 million to $5.9 million versus $14.4 million for the nine months ended September 30, 2019.
  • During the first nine months of 2020, the Company generated net cash provided by operating activities of $11.9 million.
  • Principal payments on debt and finance lease payments during the first nine months of 2020 totaled $7.0 million.
  • The Company invested $2.8 million in gross capital expenditures during the first nine months of 2020.

As the effects of the oil price drop and the pandemic continue, our employees are working very hard to provide reliable and safe service to our customers. They deserve a thank you.

Operationally the quarter was pretty similar to the second quarter. We are fighting for work in the production-related businesses and the drilling and completion businesses are still anemic. We remained in a relatively strong liquidity position and are working to control costs where we can. As the quarter ended, we were seeing an increase in trucking demand in the Bakken as operators are increasing their service rig work, a slowdown in northeast disposal as reuse levels are increasing and a slight softness in the south, partially as a function of the storms.

We are hopeful the recent increases we are seeing in the active rig and frac crew counts translate into a healthier environment for us.” said Charlie Thompson, Chief Executive Officer.

THIRD QUARTER 2020 RESULTS

When compared to the third quarter of 2019, revenue decreased by 44.8%, or $19.3 million, resulting primarily from lower water transport services in the Rocky Mountain and Northeast divisions and lower disposal services in all three divisions partially offset by an increase in water transport services in the Southern division. The major underlying driver for this decrease was lower commodity prices for both crude oil and natural gas, which decreased 27.4% and 16.0%, respectively, over this time. The impact of COVID-19 is the main driver for the decline in demand for gasoline, diesel and jet fuel, which has led to lower drilling and completion activity with fewer rigs operating in all three divisions and significant well shut-ins primarily in the Rocky Mountain division. Rig count at the end of the third quarter of 2020 compared to the end of the third quarter of 2019 declined 81% in the Rocky Mountain division, 57% in the Northeast division and 28% in the Southern division.

The Rocky Mountain division experienced a significant slowdown, with producers shutting in wells due to the decline in WTI crude oil price per barrel, which averaged $40.89 in the third quarter of 2020 versus an average of $56.34 for the same period in 2019, which resulted in rig count declining 81% from 53 at September 30, 2019 to 10 at September 30, 2020. Revenues for the Rocky Mountain division decreased by $16.7 million, or 60%, during the third quarter of 2020 as compared to the third quarter of 2019 primarily due to a $9.3 million, or 53%, decrease in water transport revenues from lower trucking volumes. Third-party trucking revenue decreased 73%, or $4.1 million, and revenue from company-owned trucking revenue declined 37%, or $4.0 million. Average total billable hours were down 28% compared to the prior year. While company-owned trucking activity is more levered to production water volumes, third-party trucking activity is more sensitive to drilling and completion activity, which has declined to historically low levels, thereby resulting in meaningful revenue reduction coupled with an increase in competition for this service that has put pressure on trucking rates. Our rental and landfill businesses are our two service lines most levered to drilling activity, and therefore have declined by the highest percentage versus the prior period. Rental revenues decreased by 74%, or $3.1 million, in the current year due to lower utilization resulting from a significant decline in drilling activity driving the return of rental equipment. Our landfill revenues decreased 95%, or $1.0 million, compared to prior year due primarily to a 95% decrease in disposal volumes at our landfill as rigs working in the vicinity declined materially. Our salt water disposal well revenue decreased $2.0 million, or 61%, compared to prior year as well shut-ins and lower completion activity led to a 48% decrease in average barrels per day disposed during the current year, with water from producing wells continuing to maintain a base level of volume activity.

Revenues for the Northeast division decreased by $2.1 million, or 19%, during the third quarter of 2020 as compared to the third quarter of 2019 due to decreases in water transport services. Natural gas prices per million Btu, as measured by the Henry Hub Natural Gas Index, decreased 16.0% from an average of $2.38 for the three months ended September 30, 2019 to an average of $2.00 for the three months ended September 30, 2020, contributing to a 57% rig count reduction in the Northeast operating area from 75 at September 30, 2019 to 32 at September 30, 2020. Additionally, as a result of the 27.4% decline in WTI crude oil prices experienced during the period, many of our customers who had historically focused on production of liquids-rich wells reduced activity levels and shut in some production in our operating area due to lower realized prices for these products. This led to lower activity levels for water transport services despite the relatively lower decrease in natural gas prices versus crude oil prices. In addition to reduced drilling and completion activity due to commodity prices, our customers continued the industry trend of water reuse during completion activities. Water reuse inherently reduces trucking activity due to shorter hauling distances as water is being transported between well sites rather than to disposal wells. For our trucking services, total billable hours were down 14% from the prior year which was partially offset by a 6% improvement in driver utilization. Disposal volumes increased in our salt water disposal wells resulting in a 7% increase in average barrels per day partially offset by lower revenue per barrel.

The Southern division experienced the lowest revenue decline relative to the other business units, driven by its focus on servicing customers who are themselves focused on dry natural gas, which has experienced a relatively smaller impact from the 2020 downturn in commodity prices. Revenues for the Southern division decreased by $0.5 million, or 12%, during the third quarter of 2020 as compared to the third quarter of 2019. The decrease was due primarily to lower disposal well volumes, whether connected to the pipeline or not, resulting from an activity slowdown in the region, as evidenced by fewer rigs operating in the area as well as lower revenue per barrel. Rig count declined 28% in the area, from 50 at September 30, 2019 to 36 at September 30, 2020. Volumes received in our disposal wells not connected to our pipeline decreased by an average of 7,337 barrels per day (or 31%) during the current year and volumes received in the disposal wells connected to the pipeline decreased by an average of 4,439 barrels per day (or 11%) during the current year.

Total costs and expenses for the third quarter of 2020 and 2019 were $29.9 million and $48.1 million, respectively. Total costs and expenses, adjusted for special items, for the third quarter of 2020 were $29.2 million, or a 38.9% decrease, when compared with $47.7 million in the third quarter of 2019. This is primarily a result of lower volumes and related costs in water transport services and disposal services and company cost cutting initiatives resulting in a 24% decrease in the number of drivers compared to the prior year period in the Rocky Mountain and Northeast divisions as well as declines in third-party hauling costs and fleet-related expenses, including maintenance and repair costs and fuel, and general and administrative expenses.

Net loss for the third quarter of 2020 was $7.1 million, an increase of $1.1 million as compared to a net loss for the third quarter of 2019 of $6.1 million. For the third quarter of 2020, the Company reported a net loss, adjusted for special items, of $6.4 million. This compares with a net loss, adjusted for special items, of $5.7 million in the third quarter of 2019.

Adjusted EBITDA for the third quarter of 2020 was $1.5 million, a decrease of 67.9% as compared to adjusted EBITDA for the third quarter of 2019 of $4.6 million. The decrease is a function of the reasons discussed previously, with primary drivers being lower trucking volumes, salt water disposal volumes and rental equipment utilization in the Rocky Mountain division. Third quarter of 2020 adjusted EBITDA margin was 6.2%, compared with 10.6% in the third quarter of 2019 driven primarily by declines in revenue partially offset by cost reductions in 2020.

YEAR-TO-DATE (“YTD”) RESULTS FOR THE NINE MONTHS ENDED SEPTEMBER 30, 2020

When compared to YTD 2019, YTD 2020 revenue decreased by 34.2%, or $44.8 million, due primarily to decreases in water transport services and disposal services in all three divisions. The major underlying driver for this decrease was lower commodity prices for both crude oil and natural gas, which decreased 33.3% and 28.6%, respectively, over this time period. The impact of COVID-19 is the main driver for the decline in demand for gasoline, diesel and jet fuel, which has led to lower drilling and completion activity with fewer rigs operating in all three divisions and significant well shut-ins primarily in the Rocky Mountain division. Rig count at the end of the third quarter of 2020 compared to the end of the third quarter of 2019 declined 81% in the Rocky Mountain division, 57% in the Northeast division and 28% in the Southern division.

The Rocky Mountain division experienced a significant slowdown, with rig count declining 81% from 53 at September 30, 2019 to 10 at September 30, 2020 in addition to producers shutting in wells due to the decline in WTI crude oil price per barrel, which averaged $38.04 YTD 2020 versus an average of $57.04 for the same period in 2019. Revenues for the Rocky Mountain division decreased by $34.9 million, or 43%, during YTD 2020 as compared to YTD 2019 primarily due to a $20.5 million, or 40%, decrease in water transport revenues from lower trucking volumes. Third-party trucking revenue decreased 67%, or $12.3 million, and company-owned trucking revenue declined 22%, or $7.0 million. Average total billable hours were down 17% compared to the prior year. While company-owned trucking activity is more levered to production water volumes, third-party trucking activity is more sensitive to drilling and completion activity, which has declined to historically low levels, thereby resulting in meaningful revenue reduction. Our rental and landfill businesses are our two service lines most levered to drilling activity, and therefore have declined by the highest percentage versus the prior period. Rental revenues decreased by 48%, or $5.6 million, in the current year due to lower utilization resulting from a significant decline in drilling activity driving the return of rental equipment. Our landfill revenues decreased 55%, or $2.3 million, compared to prior year due primarily to a 53% decrease in disposal volumes at our landfill as rigs working in the vicinity declined materially. Our salt water disposal well revenue decreased $4.6 million, or 49%, compared to prior year as well shut-ins and lower completion activity led to a 34% decrease in average barrels per day disposed during the current year, with water from producing wells continuing to maintain a base level of volume activity.

Revenues for the Northeast division decreased by $6.7 million, or 20%, during YTD 2020 as compared to YTD 2019 due to decreases in water transport services of $3.9 million, or 17%, and disposal services of $2.6 million, or 29%. Natural gas prices per million Btu, as measured by the Henry Hub Natural Gas Index, decreased 28.6% from an average of $2.62 for YTD 2019 to an average of $1.87 for YTD 2020, contributing to a 57% rig count reduction in the Northeast operating area from 75 at September 30, 2019 to 32 at September 30, 2020. Additionally, as a result of the 33.3% decline in WTI crude oil prices experienced during the period, many of our customers who had historically focused on production of liquids-rich wells reduced activity levels and shut-in some production in our operating area due to lower realized prices for these products. This led to lower activity levels for both water transport services and disposal services despite the relatively lower decrease in natural gas prices versus crude oil prices. In addition to reduced drilling and completion activity due to commodity prices, our customers continued the industry trend of water reuse during completion activities. Water reuse inherently reduces trucking activity due to shorter hauling distances as water is being transported between well sites rather than to disposal wells. For our trucking services, total billable hours were down 10% from the prior year and pricing decreases also contributed to the decline, which was partially offset by a 7% improvement in driver utilization. Disposal volumes decreased in our salt water disposal wells resulting in a 7% decrease in average barrels per day.

Revenues for the Southern division decreased by $3.2 million, or 20%, during YTD 2020 as compared to YTD 2019. The decrease was due primarily to lower disposal well volumes, whether connected to the pipeline or not, resulting from an activity slowdown in the region, as evidenced by fewer rigs operating in the area as well as lower revenue per barrel. Rig count declined 28% in the area, from 50 at September 30, 2019 to 36 at September 30, 2020. Volumes received in our disposal wells not connected to our pipeline decreased by an average of 8,974 barrels per day (or 30%) during the current year and volumes received in the disposal wells connected to the pipeline decreased by an average of 7,252 barrels per day (or 16%) during the current year.

Total costs and expenses for YTD 2020 and 2019 were $120.0 million and $144.5 million, respectively. Total costs and expenses, adjusted for special items, for YTD 2020 were $102.4 million, or a 29.1% decrease, when compared with $144.4 million for YTD 2019. This is primarily a result of lower volumes and related costs in water transport services and disposal services and company cost cutting initiatives resulting in a 24% decrease in the number of drivers compared to the prior year period in the Rocky Mountain and Northeast divisions as well as a decline in third-party hauling costs and fleet-related expenses, including maintenance and repair costs and fuel, and general and administrative expenses.

Net loss for YTD 2020 was $36.9 million, an increase of $19.5 million as compared to a net loss for YTD 2019 of $17.4 million. For YTD 2020, the Company reported a net loss, adjusted for special items, of $19.4 million. This compares with a net loss, adjusted for special items, of $17.1 million for YTD 2019.

Adjusted EBITDA for YTD 2020 was $5.9 million, a decrease of 59.1% as compared to adjusted EBITDA for the YTD 2019 of $14.4 million. The decrease is a function of the reasons discussed previously, with primary drivers being lower trucking volumes, salt water disposal volumes and rental equipment utilization in the Rocky Mountain division. YTD 2020 adjusted EBITDA margin was 6.8%, compared with 11.0% in YTD 2019 driven primarily by declines in revenue partially offset by cost reductions in 2020.

CASH FLOW AND LIQUIDITY

Net cash provided by operating activities for the nine months ended September 30, 2020 was $11.9 million, while gross capital expenditures of $2.8 million net of asset sales of $1.6 million consumed cash of $1.2 million. Net cash used in financing activities was $3.0 million for the nine months ended September 30, 2020, consisting primarily of principal payments on debt and finance lease payments partially offset by $4.0 million of proceeds from the Paycheck Protection Program loan (“PPP Loan”).

As of September 30, 2020, total liquidity increased to $19.2 million, primarily due to $9.1 million cash accumulation during 2020 resulting in $13.5 million of cash as of September 30, 2020 plus $5.7 million delayed borrowing capacity under our second lien term loan. As of September 30, 2020, the Company repaid $7.0 million of debt YTD resulting in total debt outstanding of $34.0 million, consisting of $13.0 million under our senior secured term loan facility, $8.5 million under our second lien term loan facility, $4.0 million under our PPP Loan, $0.5 million for a vehicle term loan, $0.2 million for an equipment term loan and $7.9 million of finance leases.

About Nuverra

Nuverra Environmental Solutions, Inc. provides water logistics and oilfield services to customers focused on the development and ongoing production of oil and natural gas from shale formations in the United States. Our services include the delivery, collection, and disposal of solid and liquid materials that are used in and generated by the drilling, completion, and ongoing production of shale oil and natural gas. We provide a suite of solutions to customers who demand safety, environmental compliance and accountability from their service providers. Find additional information about Nuverra in documents filed with the U.S. Securities and Exchange Commission (“SEC”) at http://www.sec.gov.

Forward-Looking Statements

This press release contains forward-looking statements within the meaning of Section 27A of the United States Securities Act of 1933, as amended, and Section 21E of the United States Securities Exchange Act of 1934, as amended. You can identify these and other forward-looking statements by the use of words such as “anticipates,” “expects,” “intends,” “plans,” “predicts,” “believes,” “seeks,” “estimates,” “may,” “might,” “will,” “should,” “would,” “could,” “potential,” “future,” “continue,” “ongoing,” “forecast,” “project,” “target” or similar expressions, and variations or negatives of these words.

These statements relate to our expectations for future events and time periods. All statements other than statements of historical fact are statements that could be deemed to be forward-looking statements, and any forward-looking statements contained herein are based on information available to us as of the date of this press release and our current expectations, forecasts and assumptions, and involve a number of risks and uncertainties. Accordingly, forward-looking statements should not be relied upon as representing our views as of any subsequent date. Future performance cannot be ensured, and actual results may differ materially from those in the forward-looking statements. Some factors that could cause actual results to differ include, among others: the severity, magnitude and duration of the coronavirus disease 2019 ("COVID-19") pandemic and commodity market disruptions; changes in commodity prices or general market conditions; fluctuations in consumer trends, pricing pressures, transportation costs, changes in raw material or labor prices or rates related to our business and changing regulations or political developments in the markets in which we operate; risks associated with our indebtedness, including changes to interest rates, decreases in our borrowing availability, our ability to manage our liquidity needs and to comply with covenants under our credit facilities, including as a result of COVID-19 and oil price declines; the loss of one or more of our larger customers; delays in customer payment of outstanding receivables and customer bankruptcies; natural disasters, such as hurricanes, earthquakes and floods, pandemics (including COVID-19) or acts of terrorism, or extreme weather conditions, that may impact our business locations, assets, including wells or pipelines, distribution channels, or which otherwise disrupt our or our customers' operations or the markets we serve; disruptions impacting crude oil and natural gas transportation, processing, refining, and export systems, including litigation regarding the Dakota Access Pipeline; our ability to attract and retain key executives and qualified employees in strategic areas of our business; our ability to attract and retain a sufficient number of qualified truck drivers; the unfavorable change to credit and payment terms due to changes in industry condition or our financial condition, which could constrain our liquidity and reduce availability under our revolving credit facility; higher than forecasted capital expenditures to maintain and repair our fleet of trucks, tanks, pipeline, equipment and disposal wells; control of costs and expenses; changes in customer drilling, completion and production activities, operating methods and capital expenditure plans, including impacts due to low oil and/or natural gas prices, shut-in production, decline in operating drilling rigs, closures or pending closures of third-party pipelines or the economic or regulatory environment; risks associated with the limited trading volume of our common stock on the NYSE American Stock Exchange, including potential fluctuation in the trading prices of our common stock; risks and uncertainties associated with the outcome of an appeal of the order confirming our previously completed plan of reorganization; risks associated with the reliance on third-party analyst and expert market projections and data for the markets in which we operate that is utilized in our strategy; present and possible future claims, litigation or enforcement actions or investigations; risks associated with changes in industry practices and operational technologies; risks associated with the operation, construction, development and closure of salt water disposal wells, solids and liquids transportation assets, landfills and pipelines, including access to additional locations and rights-of-way, permitting and licensing, environmental remediation obligations, unscheduled delays or inefficiencies and reductions in volume due to micro- and macro-economic factors or the availability of less expensive alternatives; the effects of competition in the markets in which we operate, including the adverse impact of competitive product announcements or new entrants into our markets and transfers of resources by competitors into our markets; changes in economic conditions in the markets in which we operate or in the world generally, including as a result of political uncertainty; reduced demand for our services due to regulatory or other influences related to extraction methods such as hydraulic fracturing, shifts in production among shale areas in which we operate or into shale areas in which we do not currently have operations, and shifts to reuse of water in completion activities; the unknown future impact of changes in laws and regulation on waste management and disposal activities, including those impacting the delivery, storage, collection, transportation, and disposal of waste products, as well as the use or reuse of recycled or treated products or byproducts; and risks involving developments in environmental or other governmental laws and regulations in the markets in which we operate and our ability to effectively respond to those developments including laws and regulations relating to oil and natural gas extraction businesses, particularly relating to water usage, and the disposal and transportation of liquid and solid wastes.


Contacts

Nuverra Environmental Solutions, Inc.
Investor Relations
602-903-7802
This email address is being protected from spambots. You need JavaScript enabled to view it.


Read full story here

Resilience, affordability and environmental pressures to shape industry’s future in Asia


BANGKOK--(BUSINESS WIRE)--Uncertainty of investments caused by a financial downturn and renewable energy are the two biggest concerns of Asia’s electric industry today, according to Black & Veatch’s first-ever Strategic Directions: Electric Industry Asia 2021.

Based on data provided by senior energy industry leaders, the report points to the need to balance affordability and pressure to decarbonize power generation while integrating reliable and resilient systems to cope with natural disasters, extreme weather events and the intermittency of renewable energy. Threats to reliable grid operations and performance across Asian electricity markets include:

  1. Network capacity investment not keeping pace with demand;
  2. Underinvestment in more reliable transmission networks;
  3. Introduction of too much intermittent renewable energy;
  4. Insufficient energy storage capacity;
  5. Natural disasters.

“Financing and integrating renewable energy are of most concern for the region’s electric industry as we continue to manage through the impacts of COVID-19,” said Narsingh Chaudhary, Black & Veatch's Executive Vice President & Managing Director, Asia Power Business. “We see a need for more integrated solutions across generation, transmission and distribution, as well as the expansion of gas-fired generation and energy storage to improve efficiencies and resilience.”

The most significant investment growth in new capacity over the next three to five years is expected in renewable energy. Solar (land), energy storage, solar (floating), wind (offshore) and microgrids represent the top five categories. The lower levelized cost of energy was viewed as the primary driver for renewable energy investments, with improvements in bifacial solar photovoltaic (PV) technology and advanced array configurations yielding greater efficiencies for solar PV facilities globally.

A future for gas-fired power generation is also expected beyond 2035, with 66 percent of respondents believing gas will feature as a significant component of the grid while only 18 percent see a similar role for coal-fired power generation. Often seen as a bridging fuel, gas will serve as baseload generation and stabilize the grid alongside an expected increase in battery energy storage system deployment.

“The industry expects more near-term investments reprioritized to existing assets compared to new builds or even investment deferment,” said Harry Harji, Associate Vice President for Black & Veatch’s management consulting business in Asia. “COVID-19 could serve as an important inflection point that spurs greater digitization, remote diagnostics and monitoring, and more efficient asset management practices as a whole.”

Looking out to an uncertain 2021, government regulators (66%) continue to be viewed as the most influential agent of change, underlining their critical role in the months ahead. For more detailed insights into the Electric Industry Asia 2021, download the report here.

Click here and here to download supporting images.

Editor’s Notes:

  • Strategic Directions: Electric Industry Asia 2021 is Black & Veatch’s first formal report on the Electric Industry in Asia. The report represents the input of 35 senior industry participants with business responsibilities covering South Asia, Southeast Asia and/or East Asia between 23 July 2020 through 21 August 2020.
  • Black & Veatch’s Strategic Directions Report series provides industry insights and analysis based on market-leading research. Encompassing several annual reports, including smart utilities, water and electric, the series serves to inform and educate industry players on key issues, challenges and opportunities. Visit http://bv.com/reports to learn more.

About Black & Veatch

Black & Veatch is an employee-owned engineering, procurement, consulting and construction company with a more than 100-year track record of innovation in sustainable infrastructure. Since 1915, we have helped our clients improve the lives of people in over 100 countries by addressing the resilience and reliability of our world's most important infrastructure assets. Our revenues in 2019 were US$3.7 billion. Follow us on www.bv.com and on social media.


Contacts

Media Contact Information:
EMILY CHIA
+65 6761 3511 p
+65 9875 8907 m
This email address is being protected from spambots. You need JavaScript enabled to view it.

24-HOUR MEDIA HOTLINE
+1 866 496 9149

HOUSTON & CALGARY, Alberta--(BUSINESS WIRE)--Civeo Corporation (NYSE:CVEO) (the “Company” or “Civeo”) announced today that its Board of Directors has approved the implementation of a 1-for-12 reverse share split of the Company’s common shares (the “Common Shares”). The Company’s shareholders previously approved a proposal authorizing the Board of Directors to implement the reverse share split at the 2020 annual meeting. The 1-for-12 reverse share split will be effective as of 5:00 p.m. Eastern Time on November 19, 2020, and the Company’s Common Shares will begin trading on a split-adjusted basis at the market opening on November 20, 2020. Civeo’s Common Shares will continue to trade on the NYSE under the symbol “CVEO.”


When the reverse share split becomes effective, each twelve issued and outstanding Common Shares will be automatically converted into one Common Share (the “Reverse Split”), which also will have the effect of reducing the total number of outstanding Common Shares from 170,582,021 to 14,215,168. In connection with the Reverse Split, the Company also will amend its notice of articles to reduce the total number of authorized Common Shares from 550,000,000 to 46,000,000.

Civeo will not issue any fractional shares in connection with the Reverse Split. In lieu of any fractional share, the aggregate number of common shares that a holder is entitled to will be, if the fraction is less than half a common share, rounded down to the next closest whole number of common shares, and if the fraction is at least half of a common share, rounded up to one whole common share.

Neither the Reverse Split nor the amendment to the Company’s notice of articles will affect the number of authorized or issued and outstanding shares of the Company’s preferred shares. As a result of the Reverse Split, the conversion price for the Company’s outstanding Class A Series 1 preferred shares will be automatically increased to $39.60 per preferred share (previously it was $3.30 per preferred share).

Civeo has retained Computershare as its transfer agent to manage the exchange of the pre-split shares for new, post-split shares. Computershare can be contacted toll free at 1-800-564-6253. Outside the U.S. and Canada, please call 1-514-982-7555. Email inquiries to This email address is being protected from spambots. You need JavaScript enabled to view it.

About Civeo

Civeo Corporation is a leading provider of hospitality services with prominent market positions in the Canadian oil sands and the Australian natural resource regions. Civeo offers comprehensive solutions for lodging hundreds or thousands of workers with its long-term and temporary accommodations and provides food services, housekeeping, facility management, laundry, water and wastewater treatment, power generation, communications systems, security and logistics services. Civeo currently operates a total of 28 lodges and villages in Canada, Australia and the U.S., with an aggregate of approximately 30,000 rooms. Civeo is publicly traded under the symbol CVEO on the New York Stock Exchange. For more information, please visit Civeo's website at www.civeo.com.


Contacts

Carolyn J. Stone
Civeo Corporation
Senior Vice President & Chief Financial Officer
713-510-2400

Jeffrey Spittel
FTI Consulting
832-667-5140

DALLAS--(BUSINESS WIRE)--Kosmos Energy Ltd. (“Kosmos”) (NYSE: KOS) announced today the financial and operating results for the third quarter of 2020. For the quarter, the Company generated a net loss of $37 million, or $0.09 per diluted share. When adjusted for certain items that impact the comparability of results, the Company generated an adjusted net loss(1) of $50 million or $0.12 per diluted share for the third quarter of 2020.


THIRD QUARTER 2020 HIGHLIGHTS

  • Net Production(2) - 56,700 barrels of oil equivalent per day (boepd) with sales of 59,500 boepd
  • Revenues - $225 million, or $41.05 per boe
  • Production expense - $84 million, or $15.39 per boe
  • General and administrative expenses - $18 million, $9 million cash expense and $9 million non-cash equity-based compensation expense
  • Capital expenditures:
    • $53 million Base Business capital expenditures
    • $47 million Mauritania and Senegal accrued non-cash capital expenditures

At quarter end, the Company was in a net underlift position of approximately 0.8 million barrels of oil.

Commenting on the company’s 3Q 2020 performance, Chairman and Chief Executive Officer Andrew G. Inglis said: “Kosmos delivered robust operational performance in the third quarter, despite elevated storm activity driving temporary shut-ins in the Gulf of Mexico. Production in Ghana and Equatorial Guinea was in line with expectations, with the reliability improvements seen in the first half of the year continuing into the second half. With the impact of COVID-19 and one of the worst storm seasons on record in the Gulf of Mexico, full year production is expected to come in at 61,000 - 62,000 barrels of oil equivalent per day.

In Mauritania and Senegal, the partnership continues to make good progress with Phase 1 of the Tortue project expected to be around 50% complete by year end. The operator has put significant effort into optimizing Phase 2, which we believe is now the most competitive brownfield LNG expansion globally. With the prospect of enhanced future returns, now is not the optimal time to reduce our interest in the project and we have established a financing path which funds Kosmos' capital obligations to first gas. This enables Kosmos to retain its current equity stake through to production. With lower costs and an improving LNG market backdrop, the Tortue project is expected to provide an excellent return on investment for Kosmos.

With the recently announced Gulf of Mexico financing facility and frontier exploration asset sale to Shell, we have taken additional steps to bolster the balance sheet and have ample liquidity to navigate the current period of low and volatile commodity prices."

FINANCIAL UPDATE

In September 2020, the Company closed a five-year $200 million Gulf of Mexico term loan with Beal Bank USA and Trafigura Trading LLC, restructuring the previously announced Gulf of Mexico prepayment facility. The agreement includes an accordion feature allowing the term loan to be expanded up to $300 million.

In October 2020, the Company successfully completed its reserve based lending (RBL) re-determination, agreeing with its bank group a borrowing base of $1.32 billion. Following the completion of the Gulf of Mexico term loan and the RBL re-determination, the company had approximately $0.5 billion of available liquidity.

Third quarter cash flow improved by over $100 million versus the second quarter due to higher realized prices, lower costs and a benefit in working capital, offset by the impact of the elevated storms in the Gulf of Mexico. Looking forward to the fourth quarter, with continued reduction in costs, high reliability in Ghana and Equatorial Guinea and improved uptime in the Gulf of Mexico, we expect positive free cash flow from the base business, enhanced by the proceeds from the Shell transaction.

Kosmos exited the third quarter of 2020 with approximately $2.1 billion of net debt. Net debt slightly increased in the third quarter, largely driven by a recategorization of the Gulf of Mexico prepayment facility as debt post restructuring.

Our base business net capital expenditure for 2020 is expected to be approximately $140-$150 million and includes the impact of the Shell proceeds, partially offset by the Winterfell infrastructure-led exploration well in the Gulf of Mexico (formerly Monarch) and the acceleration of the Kodiak completion into the fourth quarter (~$20 million).

OPERATIONAL UPDATE

COVID-19 Update

Kosmos’ response to the COVID-19 pandemic remains focused on safe and reliable operations by protecting the health of our employees and contractors, reducing the risk of the virus spreading in our operations, and minimizing the impact on our business. We are also working with local communities in our host countries to fight transmission of the virus.

Production

Total net production in the third quarter of 2020 averaged approximately 56,700 boepd(2), slightly lower than previous guidance due to the elevated storm activity in the Gulf of Mexico with 2020 being one of the most active years for tropical storms on record. With the impact of COVID-19 and the Gulf of Mexico storms, full year net production is expected to be in the range of 61,000 to 62,000 boepd.

Ghana

Production in Ghana continued to be unaffected by COVID-19 and averaged approximately 28,100 barrels of oil per day (bopd) net in the third quarter of 2020, in line with guidance. As forecasted, Kosmos lifted three cargos from Ghana during the third quarter.

Jubilee continues to perform well with high reliability. Gross production rates averaged approximately 87,700 bopd during the quarter with FPSO uptime of around 98%. TEN production averaged approximately 49,600 bopd gross for the third quarter with FPSO uptime of 98%.

Full year guidance of ten cargos is unchanged.

U.S. Gulf of Mexico

Production in the U.S. Gulf of Mexico averaged approximately 17,500 boepd net (80% oil) during the third quarter, including the impact of 17 days of production shut-ins during the quarter due to the impact of increased tropical storm activity, which caused the shutdown of platforms and infrastructure with personnel evacuated.

During the quarter, the Tornado-4 water injection well came online and initial results have been positive, with the injection providing pressure support to the producing updip wells. Management also took the decision to accelerate the Kodiak completion, which will commence in the fourth quarter. The Winterfell infrastructure-led exploration well (previously named Monarch) is expected to spud this quarter with results early next year.

Equatorial Guinea

Production in Equatorial Guinea continued to be unaffected by COVID-19 and averaged approximately 33,000 bopd gross and 11,100 bopd net in the third quarter of 2020. Kosmos lifted 1 cargo from Equatorial Guinea during the quarter. Full year guidance of 4.5 cargos is unchanged.

Mauritania & Senegal

Phase 1 of the Greater Tortue Ahmeyim project continued to make good progress in the quarter and is expected to be around 50% complete by year end. Throughout 2020, Kosmos has collaborated with operator BP and the national oil companies of Mauritania and Senegal on the optimization of Phase 2. By targeting expansion to 5 million tonnes per annum and leveraging all the major infrastructure from Phase 1, capital costs for Phase 2 have been reduced and the expected returns from the project enhanced.

To fund its current interest, Kosmos has established a financing path for its capital obligations to first gas. Kosmos and BP are engaged in the sale of the FPSO to a Special Purpose Vehicle (SPV) which we plan to close in the first quarter of 2021 for the capital costs paid so far, which total approximately $160 million net, and the FPSO leased back to the project. The SPV is expected to take on the future capital obligations for the FPSO, meaning Kosmos’ future obligations are reduced by a further $160 million. In addition, Kosmos intends to re-finance the national oil company loans with commercial banks in 2021, which should result in a reimbursement of an additional $100 million to Kosmos. The funds provided from these two activities are expected to fund Kosmos’ capital obligations in Mauritania and Senegal through 2021. The outstanding capital balance for Phase 1 is planned to be funded by a direct investment in Kosmos’ Mauritania and Senegal position with Phase 2 largely funded through Phase 1 cash flows. Kosmos plans to secure this financing by the middle of 2021.

Climate Risk and Resilience Report

As part of our commitment to strong Environmental, Social and Governance (ESG) performance, and in accordance with our Climate Change Policy, Kosmos recently published a Climate Risk and Resilience Report that adheres to the recommendations of the Task Force on Climate-related Financial Disclosures (TCFD). The report discusses how we are identifying and managing climate-related risks and opportunities across four categories: Governance, Strategy, Risk Management, and Metrics and Targets. In addition, the report includes a commitment to achieve Scope 1 and Scope 2 carbon neutrality by 2030 or sooner, a full scenario analysis demonstrating the resilience of our portfolio, and a description of innovative nature-based carbon capture projects used to mitigate emissions that cannot be eliminated.

(1) A Non-GAAP measure, see attached reconciliation of non-GAAP measure

(2) Production means net entitlement volumes. In Ghana and Equatorial Guinea, this means those volumes net to Kosmos' working interest or participating interest and net of royalty or production sharing contract effect. In the Gulf of Mexico, this means those volumes net to Kosmos' working interest and net of royalty.

Conference Call and Webcast Information

Kosmos will host a conference call and webcast to discuss third quarter 2020 financial and operating results today at 10:00 a.m. Central time (11:00 a.m. Eastern time). The live webcast of the event can be accessed on the Investors page of Kosmos’ website at http://investors.kosmosenergy.com/investor-events. The dial-in telephone number for the call is +1-877-407-3982. Callers in the United Kingdom should call 0800 756 3429. Callers outside the United States should dial 1-201-493-6780. A replay of the webcast will be available on the Investors page of Kosmos’ website for approximately 90 days following the event.

About Kosmos Energy

Kosmos is a full-cycle deepwater independent oil and gas exploration and production company focused on the Atlantic Margins. Our key assets include production offshore Ghana, Equatorial Guinea and U.S. Gulf of Mexico, as well as a world-class gas development offshore Mauritania and Senegal. We also maintain a proven basin exploration program in Equatorial Guinea, Ghana and U.S. Gulf of Mexico. Kosmos is listed on the New York Stock Exchange and London Stock Exchange and is traded under the ticker symbol KOS. As an ethical and transparent company, Kosmos is committed to doing things the right way. The Company’s Business Principles articulate our commitment to transparency, ethics, human rights, safety and the environment. Read more about this commitment in the Kosmos Corporate Responsibility Report. For additional information, visit www.kosmosenergy.com.

Non-GAAP Financial Measures

EBITDAX, Adjusted net income (loss), Adjusted net income (loss) per share, free cash flow, and net debt are supplemental non-GAAP financial measures used by management and external users of the Company's consolidated financial statements, such as industry analysts, investors, lenders and rating agencies. The Company defines EBITDAX as Net income (loss) plus (i) exploration expense, (ii) depletion, depreciation and amortization expense, (iii) equity based compensation expense, (iv) unrealized (gain) loss on commodity derivatives (realized losses are deducted and realized gains are added back), (v) (gain) loss on sale of oil and gas properties, (vi) interest (income) expense, (vii) income taxes, (viii) loss on extinguishment of debt, (ix) doubtful accounts expense and (x) similar other material items which management believes affect the comparability of operating results. The Company defines Adjusted net income (loss) as Net income (loss) adjusted for certain items that impact the comparability of results. The Company defines free cash flow as net cash provided by operating activities less Oil and gas assets, Other property, and certain other items that may affect the comparability of results. The Company defines net debt as the sum of notes outstanding issued at par and borrowings on the Facility and Corporate revolver less cash and cash equivalents and restricted cash.

We believe that EBITDAX, Adjusted net income (loss), Adjusted net income (loss) per share, free cash flow, Net debt and other similar measures are useful to investors because they are frequently used by securities analysts, investors and other interested parties in the evaluation of companies in the oil and gas sector and will provide investors with a useful tool for assessing the comparability between periods, among securities analysts, as well as company by company. EBITDAX, Adjusted net income (loss), Adjusted net income (loss) per share, free cash flow, and net debt as presented by us may not be comparable to similarly titled measures of other companies.

Forward-Looking Statements

This press release contains forward-looking statements within the meaning of Section 27A of the Securities Act of 1933 and Section 21E of the Securities Exchange Act of 1934. All statements, other than statements of historical facts, included in this press release that address activities, events or developments that Kosmos expects, believes or anticipates will or may occur in the future are forward-looking statements. Kosmos’ estimates and forward-looking statements are mainly based on its current expectations and estimates of future events and trends, which affect or may affect its businesses and operations. Although Kosmos believes that these estimates and forward-looking statements are based upon reasonable assumptions, they are subject to several risks and uncertainties and are made in light of information currently available to Kosmos. When used in this press release, the words “anticipate,” “believe,” “intend,” “expect,” “plan,” “will” or other similar words are intended to identify forward-looking statements. Such statements are subject to a number of assumptions, risks and uncertainties, many of which are beyond the control of Kosmos (including, but not limited to, the impact of the COVID-19 pandemic), which may cause actual results to differ materially from those implied or expressed by the forward-looking statements. Further information on such assumptions, risks and uncertainties is available in Kosmos’ Securities and Exchange Commission (“SEC”) filings. Kosmos undertakes no obligation and does not intend to update or correct these forward-looking statements to reflect events or circumstances occurring after the date of this press release, except as required by applicable law. You are cautioned not to place undue reliance on these forward-looking statements, which speak only as of the date of this press release. All forward-looking statements are qualified in their entirety by this cautionary statement.

Kosmos Energy Ltd.
Consolidated Statements of Operations
(In thousands, except per share amounts, unaudited)


Three Months Ended
September 30,


Nine Months Ended
September 30,


2020


2019


2020


2019

Revenues and other income:


Oil and gas revenue


$

224,786


$

357,036


$

529,880


$

1,049,759


Other income, net


1


(66)


2


(65)


Total revenues and other income


224,787


356,970


529,882


1,049,694


Costs and expenses:


Oil and gas production


84,277


95,540


234,627


266,316


Facilities insurance modifications, net


2,465


12,569


10,555


(5,174)


Exploration expenses


13,977


22,773


74,293


83,022


General and administrative


18,269


24,723


57,366


88,703


Depletion, depreciation and amortization


111,231


146,653


326,390


416,186


Impairment of long-lived assets


150,820


Interest and other financing costs, net


27,068


30,721


83,177


125,565


Derivatives, net


1,187


(27,016)


(34,776)


35,884


Other expenses, net


2,805


11,472


27,962


11,798


Total costs and expenses


261,279


317,435


930,414


1,022,300


Income (loss) before income taxes


(36,492)


39,535


(400,532)


27,394


Income tax expense


892


23,470


19,010


47,398


Net income (loss)


$

(37,384)


$

16,065


$

(419,542)


$

(20,004)


Net income (loss) per share:


Basic


$

(0.09)


$

0.04


$

(1.04)


$

(0.05)


Diluted


$

(0.09)


$

0.04


$

(1.04)


$

(0.05)


Weighted average number of shares used to compute net income (loss) per share:


Basic


405,409


401,466


405,131


401,319


Diluted


405,409


410,992


405,131


401,319


Dividends declared per common share


$


$

0.0452


$

0.0452


$

0.1356


Kosmos Energy Ltd.
Condensed Consolidated Balance Sheets
(In thousands, unaudited)


September 30,
2020


December 31,
2019

Assets


Current assets:


Cash and cash equivalents


$

300,819


$

224,502


Receivables, net


85,283


174,293


Other current assets


206,364


167,762


Total current assets


592,466


566,557


Property and equipment, net


3,366,304


3,642,332


Other non-current assets


134,731


108,343


Total assets


$

4,093,501


$

4,317,232


Liabilities and stockholders’ equity


Current liabilities:


Accounts payable


$

184,086


$

149,483


Accrued liabilities


186,630


380,704


Current maturities of long-term debt


169,905


Other current liabilities


24,589


8,914


Total current liabilities


565,210


539,101


Long-term liabilities:


Long-term debt, net


2,191,433


2,008,063


Deferred tax liabilities


624,156


653,221


Other non-current liabilities


287,138


275,145


Total long-term liabilities


3,102,727


2,936,429


Total stockholders’ equity


425,564


841,702


Total liabilities and stockholders’ equity


$

4,093,501


$

4,317,232


Kosmos Energy Ltd.
Condensed Consolidated Statements of Cash Flow
(In thousands, unaudited)


Three Months Ended
September 30,


Nine Months Ended
September 30,


2020


2019


2020


2019

Operating activities:


Net income (loss)


$

(37,384)


$

16,065


$

(419,542)


$

(20,004)


Adjustments to reconcile net income (loss) to net cash provided by operating activities:


Depletion, depreciation and amortization (including deferred financing costs)


113,486


148,938


333,120


423,160


Deferred income taxes


(19,935)


(13,110)


3,715


(69,840)


Unsuccessful well costs and leasehold impairments


3,483


262


24,338


7,361


Impairment of long-lived assets


150,820


Change in fair value of derivatives


(541)


(31,683)


(32,156)


34,003


Cash settlements on derivatives, net(1)


(17,910)


(3,657)


16,904


(24,701)


Equity-based compensation


8,699


9,450


26,392


27,382


Loss on extinguishment of debt


678


2,893


24,794


Other


144


2,183


6,673


9,600


Changes in assets and liabilities:


Net changes in working capital


32,773


49,438


(92,500)


(11,479)


Net cash provided by operating activities


83,493


177,886


20,657


400,276


Investing activities


Oil and gas assets


(80,183)


(87,374)


(215,425)


(240,642)


Other property


(302)


(3,061)


(1,838)


(8,291)


Proceeds on sale of assets


1,713


Notes receivable from partners


(11,212)


(13,582)


(53,574)


(19,565)


Net cash used in investing activities


(91,697)


(104,017)


(269,124)


(268,498)


Financing activities:


Borrowings on long-term debt


150,000


300,000


175,000


Payments on long-term debt


(25,000)


(325,000)


Advances under production prepayment agreement


50,000


Net proceeds from issuance of senior notes


641,875


Redemption of senior secured notes


(535,338)


Purchase of treasury stock / tax withholdings


(4,947)


(1,983)


Dividends


7


(18,158)


(19,174)


(54,447)


Deferred financing costs


(4,434)


(462)


(4,570)


(2,443)


Net cash provided by (used in) financing activities


145,573


(43,620)


321,309


(102,336)


Net increase in cash, cash equivalents and restricted cash


137,369


30,249


72,842


29,442


Cash, cash equivalents and restricted cash at beginning of period


164,819


184,809


229,346


185,616


Cash, cash equivalents and restricted cash at end of period


$

302,188


$

215,058


$

302,188


$

215,058


____________

(1) Cash settlements on commodity hedges were $(19.6) million and $(8.3) million for the three months ended, September 30, 2020 and 2019, respectively, and $22.8 million and $(27.0) million for the nine months ended September 30, 2020 and 2019, respectively.

Kosmos Energy Ltd.
EBITDAX
(In thousands, unaudited)


Three months ended


Nine months ended


Twelve Months
Ended


September 30,
2020


September 30,
2019


September 30,
2020


September 30,
2019


September 30,
2020

Net income (loss)

$

(37,384)


$

16,065


$

(419,542)


$

(20,004)


$

(455,315)


Exploration expenses

13,977


22,773


74,293


83,022


172,226


Facilities insurance modifications, net

2,465


12,569


10,555


(5,174)


(8,525)


Depletion, depreciation and amortization

111,231


146,653


326,390


416,186


474,065


Impairment of long-lived assets


150,820


150,820


Equity-based compensation

8,699


9,450


26,392


27,382


31,380


Derivatives, net

1,187


(27,016)


(34,776)


35,884


1,225


Cash settlements on commodity derivatives

(19,637)


(8,325)


22,811


(27,017)


13,487


Restructuring and other

1,158


9,981


18,959


10,168


36,141


Other, net

1,542


1,677


5,472


1,663


7,958


Gain on sale of assets


(10,528)


Interest and other financing costs, net

27,068


30,721


83,177


125,565


112,686


Income tax expense

892


23,470


19,010


47,398


52,506


EBITDAX

$

111,198


$

238,018


$

283,561


$

695,073


$

578,126


Kosmos Energy Ltd.
Adjusted Net Income
(In thousands, except per share amounts, unaudited)


Three Months Ended
September 30,


Nine Months Ended
September 30,


2020


2019


2020


2019

Net income (loss)

$

(37,384)


$

16,065


$

(419,542)


$

(20,004)


Derivatives, net

1,187


(27,016)


(34,776)


35,884


Cash settlements on commodity derivatives

(19,637)


(8,325)


22,811


(27,017)


Facilities insurance modifications, net

2,465


12,569


10,555


(5,174)


Impairment of long-lived assets


150,820


Restructuring and other

1,158


9,981


18,959


10,168


Other, net

1,542


1,677


5,472


1,663


Loss on extinguishment of debt

678


2,893


24,794


Total selected items before tax

(12,607)


(11,114)


176,734


40,318


Income tax expense (benefit) on adjustments(1)

335


11,594


5,768


(4,980)


Impact of valuation adjustments and U.S. tax law changes


26,001


Adjusted net income (loss)

$

(49,656)


$

16,545


$

(211,039)


$

15,334


Net income (loss) per diluted share

$

(0.09)


$

0.04


$

(1.04)


$

(0.05)


Derivatives, net


(0.06)


(0.09)


0.09


Cash settlements on commodity derivatives

(0.04)


(0.02)


0.06


(0.07)


Facilities insurance modifications, net

0.01


0.03


0.03


(0.01)


Impairment of long-lived assets


0.37


Restructuring and other


0.02


0.06


0.03


Other, net


0.01


Loss on extinguishment of debt


0.01


0.06


Total selected items before tax

(0.03)


(0.03)


0.45


0.10


Income tax expense (benefit) on adjustments(1)

0.00


0.03


0.01


(0.01)


Impact of valuation adjustments and U.S. tax law changes


0.06


Adjusted net income (loss) per diluted share

$

(0.12)


$

0.04


$

(0.52)


$

0.04


Weighted average number of diluted shares

405,409


410,992


405,131


401,319


Contacts

Investor Relations
Jamie Buckland
+44 (0) 203 954 2831
This email address is being protected from spambots. You need JavaScript enabled to view it.

Media Relations
Thomas Golembeski
+1-214-445-9674
This email address is being protected from spambots. You need JavaScript enabled to view it.


Read full story here

MADISON, Wis.--(BUSINESS WIRE)--MGE Energy, Inc. (Nasdaq: MGEE) senior management will be presenting at the 2020 EEI Virtual Financial Conference November 9-11, 2020.


The presentation is available on MGE Energy's website at:

2020 EEI Presentation

About MGE Energy

MGE Energy is an investor-owned public utility holding company headquartered in the state capital of Madison, Wis. It is the parent company of Madison Gas and Electric, which generates and distributes electricity in Dane County, Wis., and purchases and distributes natural gas in seven south-central and western Wisconsin counties. MGE Energy's assets total approximately $2 billion, and its 2019 revenues were approximately $569 million.


Contacts

Investor relations contact
Ken Frassetto
Director - Shareholder Services and Treasury Management
608-252-4723 | This email address is being protected from spambots. You need JavaScript enabled to view it.

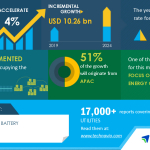
LONDON--(BUSINESS WIRE)--#GlobalLeadacidBattery--The global lead-acid battery market size is expected to grow by USD 10.26 billion during 2020-2024, progressing at a CAGR of over 4% during the forecast period. Download latest version with COVID-19 analysis Free Sample Report


The focus on renewable energy generation is one of the major factors propelling market growth.

The continuous rise in global energy demand, clean energy initiatives, and subsidies for power generation using sustainable sources is promoting the use of renewable energy sources such as solar and wind. Moreover, renewable energy sources are clean, inexhaustive, less-carbon intensive, and more sustainable compared to fossil fuels. The governments are also undertaking several initiatives to mitigate GHG emissions, which are leading to the shift from conventional sources of energy to renewables to reduce the emissions of hazardous gasses. The addition of renewable into the energy mix has increased the need for flexible ESSs to manage the intermittent nature of power generation through renewables such as solar PV and wind. Therefore, intermittent power generation from renewables will increase the need for energy storage solutions, which are based on lead-acid batteries. The changing energy mix has a significant impact on the demand for lead-acid batteries for energy storage applications, driving the market growth.

More details: www.technavio.com/report/lead-acid-battery-market-industry-analysis

Global Lead-acid Battery Market: Application Landscape

The automotive industry requires lead-acid batteries in ICE vehicles and start/stop applications in both conventional vehicles and EVs. Additionally, the low-interest rates, low fuel prices, and increasing spending capacity of the population in the developing countries contribute to the growth of the automotive segment, which in turn, drives the demand for lead-acid batteries. Market growth in this segment will be slower than the growth of the market in the stationary and motive segment.

Global Lead-acid Battery Market: Geographic Landscape

APAC had the largest lead-acid battery market share in 2019, and the region will offer several growth opportunities to market vendors during the forecast period. The increased adoption of automobiles, rising demand for ESSs for utility and motive applications, and the growing number of renewable energy projects will significantly influence lead-acid battery market growth in this region. 51% of the market’s growth will originate from the APAC region during the forecast period. China, Japan, and India are the key markets for lead-acid batteries in APAC. Market growth in this region will be faster than the growth of the market in other regions.

Buy 1 Technavio report and get the second for 50% off. Buy 2 Technavio reports and get the third for free.

View market snapshot before purchasing

Companies Covered

  • Accumulatorenwerke HOPPECKE Carl Zoellner & Sohn GmbH
  • C&D Technologies Inc.
  • Clarios
  • East Penn Manufacturing Co. Inc.
  • EnerSys
  • Exide Industries Ltd.
  • Exide Technologies
  • GS Yuasa Corp.
  • Leoch International Technology Ltd.
  • Narada Power Source Co. Ltd.


What our reports offer:

  • Market share assessments for the regional and country-level segments
  • Strategic recommendations for the new entrants
  • Covers market data for 2019, 2020, till 2024
  • Market trends (drivers, opportunities, threats, challenges, investment opportunities, and recommendations)
  • Strategic recommendations in key business segments based on the market estimations
  • Competitive landscaping mapping the key common trends
  • Company profiling with detailed strategies, financials, and recent developments
  • Supply chain trends mapping the latest technological advancements

Technavio suggests three forecast scenarios (optimistic, probable, and pessimistic) considering the impact of COVID-19. Technavio’s in-depth research has direct and indirect COVID-19 impacted market research reports. Register for a free trial today and gain instant access to 17,000+ market research reports. Technavio's SUBSCRIPTION platform

Lead-acid Battery Market 2020-2024: Key Highlights

  • CAGR of the market during the forecast period 2020-2024
  • Detailed information on factors that will assist in lead-acid battery market growth during the next five years
  • Estimation of the lead-acid battery market size and its contribution to the parent market
  • Predictions on upcoming trends and changes in consumer behavior
  • The growth of the lead-acid battery market
  • Analysis of the market’s competitive landscape and detailed information on vendors
  • Comprehensive details of factors that will challenge the growth of the lead-acid battery market, vendors

Table of Contents:

PART 01: EXECUTIVE SUMMARY

PART 02: SCOPE OF THE REPORT

  • 2.1 Preface
  • 2.2 Currency conversion rates for US$

PART 03: MARKET LANDSCAPE

  • Market ecosystem
  • Market characteristics
  • Value chain analysis
  • Market segmentation analysis

PART 04: MARKET SIZING

  • Market definition
  • Market sizing 2019
  • Market outlook
  • Market size and forecast 2019-2024

PART 05: FIVE FORCES ANALYSIS

  • Bargaining power of buyers
  • Bargaining power of suppliers
  • Threat of new entrants
  • Threat of substitutes
  • Threat of rivalry
  • Market condition

PART 06: MARKET SEGMENTATION BY APPLICATION

  • Market segmentation by application
  • Comparison by application
  • Automotive - Market size and forecast 2019-2024
  • Stationary - Market size and forecast 2019-2024
  • Motive - Market size and forecast 2019-2024
  • Market opportunity by application

PART 07: CUSTOMER LANDSCAPE

PART 08: MARKET SEGMENTATION BY PRODUCT

  • VRLA battery
  • FLA battery

PART 09: GEOGRAPHIC LANDSCAPE

  • Geographic segmentation
  • Geographic comparison
  • APAC - Market size and forecast 2019-2024
  • Europe - Market size and forecast 2019-2024
  • North America - Market size and forecast 2019-2024
  • MEA - Market size and forecast 2019-2024
  • South America - Market size and forecast 2019-2024
  • Key leading countries
  • Market opportunity

PART 10: DRIVERS AND CHALLENGES

  • Market drivers
  • Market challenges

PART 11: MARKET TRENDS

  • Growing need for eco-friendly vehicles
  • Rising vendor collaborations
  • Growing microgrid installations

PART 12: VENDOR LANDSCAPE

  • Overview
  • Landscape disruption
  • Competitive scenario

PART 13: VENDOR ANALYSIS

  • Vendors covered
  • Vendor classification
  • Market positioning of vendors
  • Accumulatorenwerke HOPPECKE Carl Zoellner & Sohn GmbH
  • C&D Technologies Inc.
  • Clarios
  • East Penn Manufacturing Co. Inc.
  • EnerSys
  • Exide Industries Ltd.
  • Exide Technologies
  • GS Yuasa Corp.
  • Leoch International Technology Ltd.
  • Narada Power Source Co. Ltd.

PART 14: APPENDIX

  • Research methodology
  • List of abbreviations
  • Definition of market positioning of vendors

PART 15: EXPLORE TECHNAVIO

About Us

Technavio is a leading global technology research and advisory company. Their research and analysis focuses on emerging market trends and provides actionable insights to help businesses identify market opportunities and develop effective strategies to optimize their market positions. With over 500 specialized analysts, Technavio’s report library consists of more than 17,000 reports and counting, covering 800 technologies, spanning across 50 countries. Their client base consists of enterprises of all sizes, including more than 100 Fortune 500 companies. This growing client base relies on Technavio’s comprehensive coverage, extensive research, and actionable market insights to identify opportunities in existing and potential markets and assess their competitive positions within changing market scenarios.


Contacts

Technavio Research
Jesse Maida
Media & Marketing Executive
US: +1 844 364 1100
UK: +44 203 893 3200
Email: This email address is being protected from spambots. You need JavaScript enabled to view it.
Website: www.technavio.com/


TULSA, Okla.--(BUSINESS WIRE)--NGL Energy Partners LP (NYSE:NGL) (“NGL,” “our,” “we,” or the “Partnership”) today reported its second quarter fiscal 2021 results. Highlights for the quarter include:


  • Income from continuing operations for the second quarter of Fiscal 2021 of $6.0 million, compared to a loss from continuing operations of $15.6 million for the second quarter of Fiscal 2020
  • Adjusted EBITDA from continuing operations for the second quarter of Fiscal 2021 of $138.0 million, compared to $123.5 million for the second quarter of Fiscal 2020
  • Successful completion of our Poker Lake pipeline, which has an initial capacity of over 350,000 barrels per day and connects into our integrated Delaware Basin produced water pipeline infrastructure network
  • New, long-term acreage dedications for water disposal services and a long-term extension and expansion to an existing acreage dedication with leading independent and super major producers in the Delaware Basin

“Our second quarter results reflect the expected increase in Adjusted EBITDA related to the sale of crude oil stored for contango, as well as the sale of skim oil barrels we held during our first fiscal quarter. Our second quarter earnings also reflect the full benefit of reduced operating expenses in the Water Solutions segment, with operating expense averaging $0.27 per barrel, compared to $0.32 per barrel during the first quarter of this fiscal year and $0.40 per barrel during Fiscal 2020. This decrease in expenses is significant as it represents approximately $50 - $60 million in annual cost savings based on average volumes for the quarter,” stated Mike Krimbill, NGL’s CEO. “Additionally during the quarter, we were able to enter into several new, long-term water disposal contracts, as well as extend and expand certain other water disposal contracts, in the Delaware Basin with both high quality, independent and super major producers. Our Crude Logistics segment continued to perform despite the noise around the Extraction bankruptcy process and averaged approximately 123,000 barrels per day on Grand Mesa Pipeline. As previously stated, NGL will continue to vigorously defend the value of its contracts with Extraction and remains amenable to resolving the dispute through commercial considerations. Finally, the Liquids and Refined Products segment is heading into its peak earning season with strong inventory positions and we are looking forward to a successful year in this segment. In addition to maximizing results from operations, we are focused on reducing indebtedness and our bank commitments. We are reducing capital expenditures, further cutting costs and have decreased the common unit distribution, all of which increase our free cash flow. We are also evaluating assets sales and joint venture opportunities. These remain challenging times; however, we continue to manage the things we can control and focus on the future to create value for our stakeholders,” Krimbill concluded.

Quarterly Results of Operations

The following table summarizes operating income (loss) and Adjusted EBITDA from continuing operations by reportable segment for the periods indicated:


Quarter Ended


September 30, 2020


September 30, 2019


Operating

Income (Loss)


Adjusted
EBITDA


Operating
Income (Loss)


Adjusted
EBITDA


(in thousands)

Crude Oil Logistics


$

48,239


$

65,181


$

38,520


$

54,632


Liquids and Refined Products


14,338


21,257


8,798


23,273


Water Solutions


(13,277

)


61,047


21,274


56,879


Corporate and Other


(12,984

)


(9,514

)


(38,477

)


(11,318

)

Total


$

36,316


$

137,971


$

30,115


$

123,466


The tables included in this release reconcile operating income (loss) to Adjusted EBITDA from continuing operations, a non-GAAP financial measure, on a consolidated basis and for each of the Partnership’s reportable segments.

Crude Oil Logistics

Operating income for the second quarter of Fiscal 2021 increased compared to the second quarter of Fiscal 2020 primarily due to increased margins. The increased margin realized during the current quarter was due primarily to the sale of inventory that was purchased at lower prices and held during the three months ended June 30, 2020. During the three months ended September 30, 2020, financial volumes on the Grand Mesa Pipeline averaged approximately 123,000 barrels per day.

In June 2020, Extraction Oil & Gas, Inc. (“Extraction”), a significant shipper on the Grand Mesa Pipeline, filed a petition for bankruptcy protection under Chapter 11 of the United States Bankruptcy Code. Extraction has transportation contracts pursuant to which it has committed to ship crude oil on the pipeline through October 2026. As part of the bankruptcy filing, Extraction filed a motion requesting that the court authorize it to reject these transportation contracts, to which the Partnership filed an objection and took various other legal steps within the bankruptcy to protect the value of the contracts. On November 2, 2020, the bankruptcy court issued a bench ruling granting the motion to reject the transportation contracts effective as of June 14, 2020. As a result, we intend to appeal the bankruptcy court’s ruling and raise what we respectfully believe are numerous infirmities with the ruling.

Liquids and Refined Products

Total product margin per gallon, excluding the impact of derivatives, was $0.036 for the quarter ended September 30, 2020, compared to $0.031 for the quarter ended September 30, 2019. This increase was primarily due to propane inventory values aligning with increased commodity prices. This increase was partially offset by lower margins for butane and refined products due to lower demand resulting from the COVID-19 pandemic.

Refined products volumes decreased by approximately 111.7 million gallons, or 33.6%, during the quarter ended September 30, 2020 compared to the quarter ended September 30, 2019. Propane volumes decreased by approximately 9.5 million gallons, or 3.6%, and butane volumes decreased by approximately 26.8 million gallons, or 15.7%, when compared to the quarter ended September 30, 2019. Other product volumes decreased by approximately 37.1 million gallons, or 24.5%, during the quarter ended September 30, 2020 compared to the same period in the prior year. The decrease in refined products, propane, butane and other product volumes was also primarily due to the continued lower demand as a result of the COVID-19 pandemic.

Water Solutions

The Partnership processed approximately 1.28 million barrels of water per day during the quarter ended September 30, 2020, a 1.9% increase when compared to produced water processed per day during the quarter ended September 30, 2019. This increase was primarily driven by our acquisition of Hillstone Environmental Partners, LLC in November 2019 in the Delaware Basin and was offset by lower disposal volumes in all other basins during the period resulting from lower crude oil prices, drilling activity and production volumes.

Revenues from recovered crude oil, including the impact from realized skim oil hedges, totaled $12.5 million for the quarter ended September 30, 2020, a decrease of $3.9 million from the prior year period. This decrease was the result of lower volumes and lower crude oil prices. The percentage of recovered crude oil per barrel of produced water processed has declined over the past several periods due to an increase in produced water transported through pipelines (which contains less oil per barrel of produced water) and the addition of contract structures that allow producers to keep the skim oil recovered from produced water. This decrease was partially offset by the sale of crude oil during the three months ended September 30, 2020, that we stored as of June 30, 2020 due to the lower crude oil prices.

Operating expenses in the Water Solutions segment decreased to $0.27 per barrel compared to $0.38 per barrel in the comparative quarter last year. The Partnership has taken significant steps to reduce operating costs and continues to evaluate cost saving initiatives in the current environment.

In October 2020, the Partnership successfully completed its Poker Lake pipeline and tie-ins, which has an initial capacity of over 350,000 barrels per day and connects into its integrated Delaware Basin produced water pipeline infrastructure network. NGL began receiving produced water volumes from Exxon’s Poker Lake Development. Additionally, the Partnership recently announced new agreements, including acreage dedications, water transportation and disposal agreements, and water supply agreements, with leading super major producers and other key producers in the Delaware Basin. The Partnership expects to service these customers’ produced water needs with its existing infrastructure with minimal capital expenditure requirements in the foreseeable future.

Corporate and Other

Corporate and Other expenses decreased from the comparable prior year period primarily due to lower compensation expense, in particular cash and non-cash incentive compensation, and a reduction in acquisition related expenses. These decreases were partially offset by legal costs incurred for defending the rejection of our transportation contracts in Extraction bankruptcy proceedings.

Capitalization and Liquidity

Total debt outstanding was $3.29 billion at September 30, 2020 compared to $3.15 billion at March 31, 2020, an increase of $139 million due primarily to the funding of certain capital expenditures incurred prior to and accrued on March 31, 2020 and $83.1 million of the remaining $100.0 million deferred purchase price of Mesquite Disposals Unlimited, LLC (“Mesquite”). Capital expenditures incurred totaled $24.4 million during the second quarter (including $6.8 million in maintenance expenditures) and $54.4 million year-to-date. These expenditures are expected to continue to decrease throughout Fiscal 2021 with full year expectations totaling $100 million or less for both growth and maintenance capital expenditures combined. Total liquidity (cash plus available capacity on our revolving credit facility) was approximately $122.1 million as of September 30, 2020 and the Partnership is in compliance with all of its debt covenants.

The Partnership is currently working with the syndicate of lenders that are a party to its revolving credit facility to extend the maturity of the facility by at least one year. The Partnership’s proposal was submitted to all of the syndicate lenders in October 2020, and remains subject to approval by each lender.

Second Quarter Conference Call Information

A conference call to discuss NGL’s results of operations is scheduled for 4:00 pm Central Time on Monday, November 9, 2020. Analysts, investors, and other interested parties may access the conference call by dialing (800) 291-4083 and providing access code 8880357. An archived audio replay of the conference call will be available for 7 days beginning at 1:00 pm Central Time on November 10, 2020, which can be accessed by dialing (855) 859-2056 and providing access code 8880357.

Non-GAAP Financial Measures

NGL defines EBITDA as net income (loss) attributable to NGL Energy Partners LP, plus interest expense, income tax expense (benefit), and depreciation and amortization expense. NGL defines Adjusted EBITDA as EBITDA excluding net unrealized gains and losses on derivatives, lower of cost or net realizable value adjustments, gains and losses on disposal or impairment of assets, gains and losses on early extinguishment of liabilities, equity-based compensation expense, acquisition expense, revaluation of liabilities, certain legal settlements and other. NGL also includes in Adjusted EBITDA certain inventory valuation adjustments related to TransMontaigne Product Services, LLC (“TPSL”), our refined products business in the mid-continent region of the United States (“Mid-Con”) and our gas blending business in the southeastern and eastern regions of the United States (“Gas Blending”), which are included in discontinued operations, and certain refined products businesses within NGL’s Liquids and Refined Products segment, as discussed below. EBITDA and Adjusted EBITDA should not be considered as alternatives to net income (loss), income (loss) from continuing operations before income taxes, cash flows from operating activities, or any other measure of financial performance calculated in accordance with GAAP, as those items are used to measure operating performance, liquidity or the ability to service debt obligations. NGL believes that EBITDA provides additional information to investors for evaluating NGL’s ability to make quarterly distributions to NGL’s unitholders and is presented solely as a supplemental measure. NGL believes that Adjusted EBITDA provides additional information to investors for evaluating NGL’s financial performance without regard to NGL’s financing methods, capital structure and historical cost basis. Further, EBITDA and Adjusted EBITDA, as NGL defines them, may not be comparable to EBITDA, Adjusted EBITDA, or similarly titled measures used by other entities.

Other than for the TPSL, Mid-Con, and Gas Blending businesses, which are included in discontinued operations, and certain businesses within NGL’s Liquids and Refined Products segment, for purposes of the Adjusted EBITDA calculation, NGL makes a distinction between realized and unrealized gains and losses on derivatives. During the period when a derivative contract is open, NGL records changes in the fair value of the derivative as an unrealized gain or loss. When a derivative contract matures or is settled, NGL reverses the previously recorded unrealized gain or loss and record a realized gain or loss. NGL does not draw such a distinction between realized and unrealized gains and losses on derivatives of the TPSL, Mid-Con, and Gas Blending businesses, which are included in discontinued operations, and certain businesses within NGL’s Liquids and Refined Products segment. The primary hedging strategy of these businesses is to hedge against the risk of declines in the value of inventory over the course of the contract cycle, and many of the hedges cover extended periods of time. The “inventory valuation adjustment” row in the reconciliation table reflects the difference between the market value of the inventory of these businesses at the balance sheet date and its cost, adjusted for the impact of seasonal market movements related to our base inventory and the related hedge. NGL includes this in Adjusted EBITDA because the unrealized gains and losses associated with derivative contracts associated with the inventory of this segment, which are intended primarily to hedge inventory holding risk and are included in net income, also affect Adjusted EBITDA.

Distributable Cash Flow is defined as Adjusted EBITDA minus maintenance capital expenditures, income tax expense, cash interest expense, preferred unit distributions and other. Maintenance capital expenditures represent capital expenditures necessary to maintain the Partnership’s operating capacity. Distributable Cash Flow is a performance metric used by senior management to compare cash flows generated by the Partnership (excluding growth capital expenditures and prior to the establishment of any retained cash reserves by the Board of Directors) to the cash distributions expected to be paid to unitholders. Using this metric, management can quickly compute the coverage ratio of estimated cash flows to planned cash distributions. This financial measure also is important to investors as an indicator of whether the Partnership is generating cash flow at a level that can sustain, or support an increase in, quarterly distribution rates. Actual distribution amounts are set by the Board of Directors.

Forward-Looking Statements

This press release includes “forward-looking statements.” All statements other than statements of historical facts included or incorporated herein may constitute forward-looking statements. Actual results could vary significantly from those expressed or implied in such statements and are subject to a number of risks and uncertainties. While NGL believes such forward-looking statements are reasonable, NGL cannot assure they will prove to be correct. The forward-looking statements involve risks and uncertainties that affect operations, financial performance, and other factors as discussed in filings with the Securities and Exchange Commission. Other factors that could impact any forward-looking statements are those risks described in NGL’s Annual Report on Form 10-K, Quarterly Reports on Form 10-Q, and other public filings. You are urged to carefully review and consider the cautionary statements and other disclosures made in those filings, specifically those under the heading “Risk Factors.” NGL undertakes no obligation to publicly update or revise any forward-looking statements except as required by law.

NGL provides Adjusted EBITDA guidance that does not include certain charges and costs, which in future periods are generally expected to be similar to the kinds of charges and costs excluded from Adjusted EBITDA in prior periods, such as income taxes, interest and other non-operating items, depreciation and amortization, net unrealized gains and losses on derivatives, lower of cost or net realizable value adjustments, gains and losses on disposal or impairment of assets, gains and losses on early extinguishment of liabilities, equity-based compensation expense, acquisition expense, revaluation of liabilities and items that are unusual in nature or infrequently occurring. The exclusion of these charges and costs in future periods will have a significant impact on the Partnership’s Adjusted EBITDA, and the Partnership is not able to provide a reconciliation of its Adjusted EBITDA guidance to net income (loss) without unreasonable efforts due to the uncertainty and variability of the nature and amount of these future charges and costs and the Partnership believes that such reconciliation, if possible, would imply a degree of precision that would be potentially confusing or misleading to investors.

About NGL Energy Partners LP

NGL Energy Partners LP, a Delaware limited partnership, is a diversified midstream energy company that transports, stores, markets and provides other logistics services for crude oil, natural gas liquids and other products and transports, treats and disposes of produced water generated as part of the oil and natural gas production process.

For further information, visit the Partnership’s website at www.nglenergypartners.com.

NGL ENERGY PARTNERS LP AND SUBSIDIARIES

Unaudited Condensed Consolidated Balance Sheets

(in Thousands, except unit amounts)


September 30, 2020


March 31, 2020

ASSETS


CURRENT ASSETS:


Cash and cash equivalents

$

16,912


$

22,704


Accounts receivable-trade, net of allowance for expected credit losses of $3,399 and $4,540, respectively

439,889


566,834


Accounts receivable-affiliates

14,904


12,934


Inventories

182,859


69,634


Prepaid expenses and other current assets

74,150


101,981


Total current assets

728,714


774,087


PROPERTY, PLANT AND EQUIPMENT, net of accumulated depreciation of $619,820 and $529,068, respectively

2,799,725


2,851,555


GOODWILL

982,239


993,587


INTANGIBLE ASSETS, net of accumulated amortization of $706,259 and $631,449, respectively

1,538,417


1,612,480


INVESTMENTS IN UNCONSOLIDATED ENTITIES

21,215


23,182


OPERATING LEASE RIGHT-OF-USE ASSETS

168,349


180,708


OTHER NONCURRENT ASSETS

47,752


63,137


Total assets

$

6,286,411


$

6,498,736


LIABILITIES AND EQUITY


CURRENT LIABILITIES:


Accounts payable-trade

$

379,420


$

515,049


Accounts payable-affiliates

23,985


17,717


Accrued expenses and other payables

138,572


232,062


Advance payments received from customers

24,143


19,536


Current maturities of long-term debt

13,123


4,683


Operating lease obligations

50,709


56,776


Total current liabilities

629,952


845,823


LONG-TERM DEBT, net of debt issuance costs of $22,267 and $19,795, respectively, and current maturities

3,275,166


3,144,848


OPERATING LEASE OBLIGATIONS

114,833


121,013


OTHER NONCURRENT LIABILITIES

105,835


114,079


CLASS D 9.00% PREFERRED UNITS, 600,000 and 600,000 preferred units issued and outstanding, respectively

551,097


537,283


EQUITY:


General partner, representing a 0.1% interest, 128,901 and 128,901 notional units, respectively

(51,518

)


(51,390

)

Limited partners, representing a 99.9% interest, 128,771,715 and 128,771,715 common units issued and outstanding, respectively

1,242,676


1,366,152


Class B preferred limited partners, 12,585,642 and 12,585,642 preferred units issued and outstanding, respectively

305,468


305,468


Class C preferred limited partners, 1,800,000 and 1,800,000 preferred units issued and outstanding, respectively

42,891


42,891


Accumulated other comprehensive loss

(307

)


(385

)

Noncontrolling interests

70,318


72,954


Total equity

1,609,528


1,735,690


Total liabilities and equity

$

6,286,411


$

6,498,736


NGL ENERGY PARTNERS LP AND SUBSIDIARIES

Unaudited Condensed Consolidated Statements of Operations

(in Thousands, except unit and per unit amounts)


Three Months Ended September 30,


Six Months Ended September 30,


2020


2019


2020


2019

REVENUES:


Crude Oil Logistics


$

466,841


$

641,152


$

742,880


$

1,357,312


Water Solutions


88,678


101,249


176,743


173,032


Liquids and Refined Products


612,324


1,061,671


1,092,322


2,145,364


Other


315


264


628


519


Total Revenues


1,168,158


1,804,336


2,012,573


3,676,227


COST OF SALES:


Crude Oil Logistics


386,771


569,699


604,328


1,218,939


Water Solutions


579


(6,496

)


5,279


(9,303

)

Liquids and Refined Products


577,086


1,025,565


1,031,422


2,068,597


Other


454


435


908


900


Total Cost of Sales


964,890


1,589,203


1,641,937


3,279,133


OPERATING COSTS AND EXPENSES:


Operating


56,054


74,886


121,041


136,198


General and administrative


17,475


43,908


34,633


64,250


Depreciation and amortization


87,469


63,113


171,455


116,867


Loss on disposal or impairment of assets, net


5,954


3,111


17,976


2,144


Operating Income


36,316


30,115


25,531


77,635


OTHER INCOME (EXPENSE):


Equity in earnings (loss) of unconsolidated entities


501


(265

)


790


(257

)

Interest expense


(46,935

)


(45,017

)


(90,896

)


(84,894

)

Gain on early extinguishment of liabilities, net


13,747


33,102


Other income, net


1,585


183


2,620


1,193


Income (Loss) From Continuing Operations Before Income Taxes


5,214


(14,984

)


(28,853

)


(6,323

)

INCOME TAX BENEFIT (EXPENSE)


774


(640

)


1,075


(319

)

Income (Loss) From Continuing Operations


5,988


(15,624

)


(27,778

)


(6,642

)

Loss From Discontinued Operations, net of Tax


(153

)


(185,742

)


(1,639

)


(186,685

)

Net Income (Loss)


5,835


(201,366

)


(29,417

)


(193,327

)

LESS: NET (INCOME) LOSS ATTRIBUTABLE TO NONCONTROLLING INTERESTS


(168

)


129


(219

)


397


NET INCOME (LOSS) ATTRIBUTABLE TO NGL ENERGY PARTNERS LP


$

5,667


$

(201,237

)


$

(29,636

)


$

(192,930

)

NET LOSS FROM CONTINUING OPERATIONS ALLOCATED TO COMMON UNITHOLDERS


$

(17,933

)


$

(32,561

)


$

(73,748

)


$

(152,687

)

NET LOSS FROM DISCONTINUED OPERATIONS ALLOCATED TO COMMON UNITHOLDERS


$

(152

)


$

(185,556

)


$

(1,637

)


$

(186,498

)

NET LOSS ALLOCATED TO COMMON UNITHOLDERS


$

(18,085

)


$

(218,117

)


$

(75,385

)


$

(339,185

)

BASIC LOSS PER COMMON UNIT


Loss From Continuing Operations


$

(0.14

)


$

(0.26

)


$

(0.57

)


$

(1.21

)

Loss From Discontinued Operations, net of Tax


$


$

(1.46

)


$

(0.01

)


$

(1.47

)

Net Loss


$

(0.14

)


$

(1.72

)


$

(0.58

)


$

(2.68

)

DILUTED LOSS PER COMMON UNIT


Loss From Continuing Operations


$

(0.14

)


$

(0.26

)


$

(0.57

)


$

(1.21

)

Loss From Discontinued Operations, net of Tax


$


$

(1.46

)


$

(0.01

)


$

(1.47

)

Net Loss


$

(0.14

)


$

(1.72

)


$

(0.58

)


$

(2.68

)

BASIC WEIGHTED AVERAGE COMMON UNITS OUTSTANDING


128,771,715


126,979,034


128,771,715


126,435,870


DILUTED WEIGHTED AVERAGE COMMON UNITS OUTSTANDING


128,771,715


126,979,034


128,771,715


126,435,870


Contacts

NGL Energy Partners LP
Trey Karlovich, 918-481-1119
Chief Financial Officer and Executive Vice President
This email address is being protected from spambots. You need JavaScript enabled to view it.

or

Linda Bridges, 918-481-1119
Senior Vice President - Finance and Treasurer
This email address is being protected from spambots. You need JavaScript enabled to view it.


Read full story here

ABU DHABI, United Arab Emirates--(BUSINESS WIRE)--Intercontinental Exchange, Inc. (NYSE:ICE), a leading operator of global exchanges and clearing houses and provider of mortgage technology, data and listings services, today announced that it plans to launch ICE Futures Abu Dhabi (IFAD) and the world’s first futures contracts based on Murban crude oil on March 29, 2021, subject to the completion of regulatory approvals.


In November 2019, ICE announced its plans to launch IFAD, with the Abu Dhabi National Oil Company (ADNOC) - the producer of Murban crude - and nine of the world’s largest energy traders partnering with ICE on the launch.

ICE Murban Crude Oil Futures will be a physically delivered contract with delivery at Fujairah in the United Arab Emirates (UAE) on a free on board (FOB) basis. ICE Murban Futures will be complemented with a range of cash settled derivatives. These include outright, differential and crack differentials against Brent, WTI, Gasoil and Naphtha among others, as well as inter-commodity spreads, which are planned to launch alongside Murban futures.

Contracts traded at IFAD will be cleared at ICE Clear Europe, a leading energy clearing house, and will clear alongside ICE’s leading global energy futures platform covering oil, natural gas and the environmental complex, allowing customers to benefit from associated margin offsets and delivering meaningful capital efficiencies.

About Intercontinental Exchange

Intercontinental Exchange (NYSE: ICE) is a Fortune 500 company and provider of marketplace infrastructure, data services and technology solutions to a broad range of customers including financial institutions, corporations and government entities. We operate regulated marketplaces, including the New York Stock Exchange, for the listing, trading and clearing of a broad array of derivatives contracts and financial securities across major asset classes. Our comprehensive data services offering supports the trading, investment, risk management and connectivity needs of customers around the world and across asset classes. As a leading technology provider for the U.S. residential mortgage industry, ICE Mortgage Technology provides the technology and infrastructure to transform and digitize U.S. residential mortgages, from application and loan origination through to final settlement.

Trademarks of ICE and/or its affiliates include Intercontinental Exchange, ICE, ICE block design, NYSE and New York Stock Exchange. Information regarding additional trademarks and intellectual property rights of Intercontinental Exchange, Inc. and/or its affiliates is located at http://www.intercontinentalexchange.com/terms-of-use. Key Information Documents for certain products covered by the EU Packaged Retail and Insurance-based Investment Products Regulation can be accessed on the relevant exchange website under the heading “Key Information Documents (KIDS).”

Safe Harbor Statement under the Private Securities Litigation Reform Act of 1995 -- Statements in this press release regarding ICE's business that are not historical facts are "forward-looking statements" that involve risks and uncertainties. For a discussion of additional risks and uncertainties, which could cause actual results to differ from those contained in the forward-looking statements, see ICE's Securities and Exchange Commission (SEC) filings, including, but not limited to, the risk factors in ICE's Annual Report on Form 10-K for the year ended December 31, 2019, as filed with the SEC on February 6, 2020.

About ADNOC

ADNOC is one of the world’s leading diversified energy and petrochemicals groups with a daily production capacity of about 4 million barrels of oil and 10.5 billion cubic feet of natural gas. ADNOC is a primary catalyst for the UAE’s growth and diversification. For further information: This email address is being protected from spambots. You need JavaScript enabled to view it..

Source: Intercontinental Exchange

ICE-CORP


Contacts

ICE Media Contact
Rebecca Mitchell
+44 7951 057351
This email address is being protected from spambots. You need JavaScript enabled to view it.

ICE Investor Contact:
Warren Gardiner
770-835-0114
This email address is being protected from spambots. You need JavaScript enabled to view it.

LONDON--(BUSINESS WIRE)--#GlobalWindTurbineGeneratorMarket--The new wind turbine generator market research report from Technavio indicates negative growth in the short term as the business impact of COVID-19 spreads.


Get detailed insights on the COVID-19 pandemic Crisis and Recovery analysis of the wind turbine generator market. Download free report sample

"One of the primary growth drivers for this market is the rise in wind energy consumption”, says a senior analyst for the Industrials industry at Technavio. As the markets recover, Technavio expects the wind turbine generator market size to grow by USD 7.22 billion during the period 2020-2024.

Wind Turbine Generator MarketSegment Highlights for 2020

  • The wind turbine generator market is expected to post a year-over-year growth rate of 1.72%.
  • Based on the application, the global wind turbine generator market saw the maximum demand for wind turbine generators from the onshore segment.
  • The growth of the market in the onshore application segment is driven by the declining cost of power generation across the globe.

Regional Analysis

  • 57% of the growth will originate from the APAC region.
  • The growth of the market in APAC will be driven by the rising emphasis on renewable energy.
  • China and India are the key markets for wind turbine generators in APAC. Market growth in this region will be faster than the growth of the market in other regions.

Click here to learn about report detailed analysis and insights on how you can leverage them to grow your business.

Notes:

  • The wind turbine generator market size is expected to accelerate at a CAGR of almost 4% during the forecast period.
  • The wind turbine generator market is segmented Application (Onshore and Offshore) and Geography (APAC, Europe, North America, South America, and MEA).
  • The market is fragmented due to the presence of many/few established vendors holding significant market share.
  • The research report offers information on several market vendors, including ABB Ltd., Alxion, AVANTIS Energy Group, Bora Energy, General Electric Co., SANY Group Co. Ltd., Siemens AG, Sinovel Wind Group Co. Ltd., Suzlon Energy Ltd., and Vestas Wind System AS

Register for a free trial today to access 17,000+ market research reports using Technavio's SUBSCRIPTION platform

About Us

Technavio is a leading global technology research and advisory company. Their research and analysis focuses on emerging market trends and provides actionable insights to help businesses identify market opportunities and develop effective strategies to optimize their market positions. With over 500 specialized analysts, Technavio’s report library consists of more than 17,000 reports and counting, covering 800 technologies, spanning across 50 countries. Their client base consists of enterprises of all sizes, including more than 100 Fortune 500 companies. This growing client base relies on Technavio’s comprehensive coverage, extensive research, and actionable market insights to identify opportunities in existing and potential markets and assess their competitive positions within changing market scenarios.


Contacts

Technavio Research
Jesse Maida
Media & Marketing Executive
US: +1 844 364 1100
UK: +44 203 893 3200
Email: This email address is being protected from spambots. You need JavaScript enabled to view it.
Website: www.technavio.com/

LONDON--(BUSINESS WIRE)--#BiomassPowerGenerationMarket--The global biomass power generation market size is expected to grow by 39.21 GW during 2020-2024, progressing at a CAGR of over 5% during the forecast period. Download latest version with COVID-19 analysis Free Sample Report


The growing need for cleaner energy is one of the major factors propelling the market growth. However, factors such as increased project and feedstock costs will hamper market growth.

With the rising GHG levels in the atmosphere, the governments of various countries are taking initiatives to mitigate GHG emissions. As a result, they have started replacing fossil fuels with renewable energy sources, including biomass, geothermal, and solar power. The increasing energy demand, clean energy initiatives, and subsidies granted for power generation using sustainable sources are promoting the use of renewable energy sources. The shift from conventional fuels to renewables to reduce the emission of hazardous gases that affect the environment is also driving the need for a cleaner energy supply. This will subsequently drive biomass power generation market growth over the forecast period.

More details: www.technavio.com/report/biomass-power-generation-market-size-industry-analysis

Global Biomass Power Generation Market: Feedstock Landscape

The increasing use of renewable sources of energy and the demand from power production companies are driving the need for solid biomass. They are also highly preferred by power generation plants to cater to the demand for clean and efficient coal-fired power generation. Market growth in this segment will be slower than the growth of the market in the municipal solid waste segment.

Global Biomass Power Generation Market: Geographic Landscape

APAC was the largest biomass power generation market in 2019, and the region will offer several growth opportunities to market vendors during the forecast period. The abundant supply of diverse forms of wastes such as agro-industrial wastes, woody biomass, agricultural residues, municipal solid wastes, and animal wastes will significantly drive biomass power generation market growth in this region over the forecast period. 50% of the market’s growth will originate from APAC during the forecast period. China and India are the key markets for biomass power generation in APAC. Market growth in this region will be faster than the growth of the market in other regions.

Buy 1 Technavio report and get the second for 50% off. Buy 2 Technavio reports and get the third for free.

View market snapshot before purchasing

Companies Covered

  • Acciona SA
  • Ameresco Inc.
  • Andritz AG
  • Babcock & Wilcox Enterprises Inc.
  • E.ON SE
  • General Electric Co.
  • John Wood Group Plc
  • Thermax Ltd.
  • Valmet Oyj
  • Vattenfall AB

What our reports offer:

  • Market share assessments for the regional and country-level segments
  • Strategic recommendations for the new entrants
  • Covers market data for 2019, 2020, till 2024
  • Market trends (drivers, opportunities, threats, challenges, investment opportunities, and recommendations)
  • Strategic recommendations in key business segments based on the market estimations
  • Competitive landscaping mapping the key common trends
  • Company profiling with detailed strategies, financials, and recent developments
  • Supply chain trends mapping the latest technological advancements

Technavio suggests three forecast scenarios (optimistic, probable, and pessimistic) considering the impact of COVID-19. Technavio’s in-depth research has direct and indirect COVID-19 impacted market research reports. Register for a free trial today and gain instant access to 17,000+ market research reports. Technavio's SUBSCRIPTION platform

Biomass Power Generation Market 2020-2024: Key Highlights

  • CAGR of the market during the forecast period 2020-2024
  • Detailed information on factors that will assist in biomass power generation market growth during the next five years
  • Estimation of the biomass power generation market size and its contribution to the parent market
  • Predictions on upcoming trends and changes in consumer behavior
  • The growth of the biomass power generation market
  • Analysis of the market’s competitive landscape and detailed information on vendors
  • Comprehensive details of factors that will challenge the growth of biomass power generation market, vendors

Table of Contents:

Executive Summary

Market Landscape

  • Market ecosystem
  • Market characteristics
  • Value chain analysis

Market Sizing

  • Market definition
  • Market segment analysis
  • Market size 2019
  • Market outlook: Forecast for 2019 - 2024

Five Forces Analysis

  • Five forces summary
  • Bargaining power of buyers
  • Bargaining power of suppliers
  • Threat of new entrants
  • Threat of substitutes
  • Threat of rivalry
  • Market condition

Market Segmentation by Feedstock

  • Market segments
  • Comparison by Feedstock
  • Solid biomass - Market size and forecast 2019-2024 (GW)
  • Biogas - Market size and forecast 2019-2024 (GW)
  • Municipal solid waste - Market size and forecast 2019-2024 (GW)
  • Liquid biomass - Market size and forecast 2019-2024 (GW)
  • Market opportunity by Feedstock

Customer landscape

Geographic Landscape

  • Geographic segmentation
  • Geographic comparison
  • APAC - Market size and forecast 2019-2024
  • Europe - Market size and forecast 2019-2024
  • North America - Market size and forecast 2019-2024
  • MEA - Market size and forecast 2019-2024
  • South America - Market size and forecast 2019-2024
  • Key leading countries
  • Market opportunity by geography
  • Market drivers
  • Market challenges
  • Market trends

Vendor Landscape

  • Overview
  • Vendor landscape
  • Landscape disruption

Vendor Analysis

  • Vendors covered
  • Market positioning of vendors
  • Acciona SA
  • Ameresco Inc.
  • Andritz AG
  • Babcock & Wilcox Enterprises Inc.
  • E.ON SE
  • General Electric Co.
  • John Wood Group Plc
  • Thermax Ltd.
  • Valmet Oyj
  • Vattenfall AB

Appendix

  • Scope of the report
  • Currency conversion rates for US$
  • Research methodology
  • List of abbreviations

About Us

Technavio is a leading global technology research and advisory company. Their research and analysis focuses on emerging market trends and provides actionable insights to help businesses identify market opportunities and develop effective strategies to optimize their market positions. With over 500 specialized analysts, Technavio’s report library consists of more than 17,000 reports and counting, covering 800 technologies, spanning across 50 countries. Their client base consists of enterprises of all sizes, including more than 100 Fortune 500 companies. This growing client base relies on Technavio’s comprehensive coverage, extensive research, and actionable market insights to identify opportunities in existing and potential markets and assess their competitive positions within changing market scenarios.


Contacts

Technavio Research
Jesse Maida
Media & Marketing Executive
US: +1 844 364 1100
UK: +44 203 893 3200
Email: This email address is being protected from spambots. You need JavaScript enabled to view it.
Website: www.technavio.com/

HOUSTON--(BUSINESS WIRE)--Whiting USA Trust II (the “Trust”) (OTC:WHZT) announced today that it determined there will be no distribution made to unitholders of record on November 19, 2020. This is due to the net profits interest generating a net profit of $0.7 million during the third quarterly payment period, which was not sufficient to fully recover the net profits interest deficit of $0.9 million accumulated during the second quarterly payment period of 2020.

Sales volumes, net profits and selected performance metrics for the quarterly payment period (mainly affected by July 2020 through September 2020 oil prices and June 2020 through August 2020 gas prices) were:


Sales volumes:


Oil (Bbl)(1)


187,631


Natural gas (Mcf)


210,639


Total (BOE)


222,738


Gross proceeds:


Oil sales(1)


$

6,580,003


Natural gas sales


339,909


Total gross proceeds(2)


$

6,919,912


Costs:


Lease operating expenses


$

5,620,331


Production taxes(3)


349,312


Development costs


238,146


Cash settlements on commodity derivatives(4)


-


Reserve for expenditures(5)


-


Total costs


$

6,207,789


Net profits


$

712,123


Percentage allocable to Trust’s Net Profits Interest


90

%

Total cash available for the Trust


$

640,911


Recovery of net profits interest accumulated deficit(6)


(860,648)


Provision for estimated Trust expenses


-


Montana state income taxes withheld


(362)


Cumulative net cash losses(6)


$

(220,099)


Trust units outstanding


18,400,000


Cash loss per Trust unit(7)


$

(0.011962)


Selected performance metrics:


Crude oil average realized price (per Bbl)(1)(2)


$

35.07


Natural gas average realized price (per Mcf)


$

1.61


Lease operating expenses (per BOE)


$

25.23


Production tax rate (percent of total gross proceeds)(3)


5.0

%

__________

(1) Oil includes natural gas liquids.

(2) Total gross proceeds increased $2.8 million (or 70%) during the third quarterly payment period of 2020 as compared to the second quarterly payment period of 2020. The increase in total gross proceeds was mainly due to the higher realized oil and gas prices which increased 70% and 75%, respectively, as a result of the increases in NYMEX prices and decreases in the differentials between periods.

(3) Production taxes and production taxes as a percent of total gross proceeds increased during the third quarterly payment period of 2020 when compared to the second quarterly payment period of 2020 primarily due to certain wells within the Garland Unit being granted a “stripper well” production tax exemption, which reduced the tax rate for production volumes from these wells and resulted in the receipt of tax refunds related to prior periods during the second quarterly payment period of 2020.

(4) All costless collar hedge contracts terminated as of December 31, 2014, and no additional hedges are allowed to be placed on Trust assets. Consequently, there are no further cash settlements on commodity hedges for inclusion in the Trust’s computation of net profits (or net losses, as the case may be), and the Trust has increased exposure to oil and natural gas price volatility.

(5) As provided in the terms of the Trust’s net profits interest (“NPI”), a reserve for expenditures of $1.6 million was established by Whiting Petroleum Corporation (“Whiting”) during the first quarterly payment period of 2020 in response to an expectation that future gross proceeds from the underlying properties may be insufficient to cover the future operating costs of the underlying properties. In the second quarterly payment period of 2020, the $1.6 million reserve was released and applied by Whiting to qualifying expenses incurred during the period. Accordingly, there is no remaining reserve for expenditures to offset future development, maintenance or operating expenses on the underlying properties and related activities.

(6) The net profits interest had accumulated net losses of approximately $0.9 million plus accrued interest of $477 as of September 30, 2020. Approximately $0.7 million of the accumulated net losses were recovered by the net profits from the third quarterly payment period of 2020.

(7) When net losses are generated under the net profits interest, the Trust receives no payment from Whiting; however, neither the Trust nor the Trust unitholders are liable for any such losses. The Trust has $0.2 million in net losses remaining after the third quarterly payment period. All such net losses, plus accrued interest at the prevailing money market rate, will be deducted from gross proceeds in future computation periods for purposes of determining net proceeds (or net losses as the case may be) until the negative net proceeds, including interest, have been recovered in full. The Trust will make no further distributions until that occurs.

The Trust’s NPI, which is the only asset of the Trust other than cash reserves held for future Trust expenses, represents the right to receive 90% of the net proceeds from Whiting’s interests in certain existing oil and natural gas properties located primarily in the Rocky Mountains, Permian Basin, Gulf Coast and Mid-Continent regions of the United States until the NPI terminates.

Status of the Trust

Oil and natural gas prices declined sharply during the first half of 2020. As a result of the decline in commodity prices, the net profits interest generated a net loss during the second quarterly payment period of 2020. While prices began to recover in the third quarterly payment period of 2020, the Trust did not fully recover the net loss generated in the second quarterly payment period of 2020. All accumulated net losses, plus accrued interest, must be repaid to Whiting before any further distributions will be made to Trust unitholders. The Trust is unable to predict future commodity prices or future performance and uncertainties related to demand for oil and natural gas products remain as the COVID-19 pandemic continues to impact the world economy. Lower oil, NGL and natural gas prices could negatively impact future Trust quarterly payment periods, resulting in reduced net proceeds that the Trust is entitled to, which could materially reduce or completely eliminate the amount of cash available for distribution to Trust unitholders.

Previously, no distributions with respect to the first and second quarterly payment periods of 2020 were paid to unitholders of record as of May 20, 2020 and August 20, 2020, respectively.

Trust Termination

During October 2020, the minimum amount of production (11.79 MMBOE) applicable to the NPI was produced from the underlying properties and sold (which amount is the equivalent of 10.61 MMBOE in respect of the Trust’s right to receive 90% of the net proceeds from such reserves pursuant to the NPI). Consequently, the NPI will terminate on December 31, 2021. The Trust will wind up its affairs and terminate after the NPI termination date or sale of the NPI and, after the termination of the Trust, it will pay no further distributions.

The market price of the Trust units will decline to zero at the termination of the Trust, which will occur after the termination or sale of the net profits interest. As described in the Trust’s public filings, since the assets of the Trust are depleting assets, a portion of each cash distribution paid on the Trust units, if any, should be considered by investors as a return of capital, with the remainder being considered as a return on investment.

Forward-Looking Statements

This press release contains forward-looking statements, including all statements made in this press release other than statements of historical fact. No assurances can be given that such statements will prove to be correct. The estimated time when the market price of the Trust units should decline to zero is based on the economic rights of the Trust units. The trading price of the Trust units is affected by factors outside of the control of the Trust or Whiting, including actions of market participants, among others. Other important factors that could cause actual results to differ materially include expenses of the Trust, fluctuations in oil and natural gas prices, the effect, impact, potential duration or other implications of the COVID-19 pandemic, or any government response to such pandemic, actions of the Organization of Petroleum Exporting Countries, uncertainty of estimates of oil and natural gas reserves and production, uncertainty as to the timing of any such production, risks inherent in the operation, production and development of oil and gas, future production and development costs and other risks described in the Trust’s Annual Report on Form 10-K for the year ended December 31, 2019, its Quarterly Report on Form 10-Q for the period ended June 30, 2020 and in its other filings with the Securities and Exchange Commission (the “SEC”). The Trust’s annual, quarterly and other reports filed under the Securities Exchange Act of 1934, as amended, are available electronically from the website maintained by the SEC at http://www.sec.gov. Statements made in this press release are qualified by the cautionary statements made in this press release. The Trustee does not intend, and assumes no obligation, to update any of the statements included in this press release.


Contacts

Whiting USA Trust II
The Bank of New York Mellon Trust Company, N.A., as Trustee
Mike Ulrich
(512) 236-6599
http://whzt.q4web.com/

DUBLIN--(BUSINESS WIRE)--The "Refining Industry Outlook in Middle East to 2024 - Capacity and Capital Expenditure Outlook with Details of All Operating and Planned Refineries" report has been added to ResearchAndMarkets.com's offering.


The report provides refinery details such as the refinery name, country, and refinery operator name, with in-depth coverage on crude distillation unit or, CDU capacity and other major unit capacities for all active and new-build (planned and announced) refineries in the region. The report also provides refinery capital expenditure outlook by key countries, year on year, till 2024 in the region.

The report also provides key country comparisons within the region based on contribution to regional refining capacity. Further the report also offers recent developments and latest contracts awarded in the refining industry across different countries in the region, wherever available.

Scope

  • Updated information on all active and planned refineries in the Middle East
  • Provides key details such as refinery name, operator name, refinery type, and CDU, condensate splitter, coking, catalytic cracker and hydrocracking capacities by refinery and country from 2014 to 2024, wherever available
  • Provides historical data from 2014 to 2019, outlook up to 2024
  • Provides new-build and expansion capital expenditure outlook at the regional level by year and by key countries till 2024
  • Recent developments and contracts related to refineries across in the country, wherever available

Key Topics Covered:

1. Introduction

2. Middle East Refining Industry

2.1. Middle East Refining Industry, Overview of Active Refineries Data

2.2. Middle East Refining Industry, Total Refining Capacity

2.3. Middle East Refining Industry, Overview of Planned and Announced Refineries Data

2.4. Middle East Refining Industry, Planned and Announced Refineries

2.5. Middle East Refining Industry, New Units and Capacity Expansions by Key Countries

3. Refining Industry in Saudi Arabia

3.1. Refining Industry in Saudi Arabia, Crude Distillation Unit Capacity, 2014-2024

3.2. Refining Industry in Saudi Arabia, Condensate Splitter Unit Capacity, 2014-2024

3.3. Refining Industry in Saudi Arabia, Coking Unit Capacity, 2014-2024

3.4. Refining Industry in Saudi Arabia, Catalytic Cracker Unit Capacity, 2014-2024

3.5. Refining Industry in Saudi Arabia, Hydrocracking Unit Capacity, 2014-2024

3.6. Recent Developments

3.7. Recent Contracts

4. Refining Industry in Iran

4.1. Refining Industry in Iran, Crude Distillation Unit Capacity, 2014-2024

4.2. Refining Industry in Iran, Catalytic Cracker Unit Capacity, 2014-2024

4.3. Refining Industry in Iran, Hydrocracking Unit Capacity, 2014-2024

4.4. Recent Developments

4.5. Recent Contracts

5. Refining Industry in United Arab Emirates

5.1. Refining Industry in United Arab Emirates, Crude Distillation Unit Capacity, 2014-2024

5.2. Refining Industry in United Arab Emirates, Condensate Splitter Unit Capacity, 2014-2024

5.3. Refining Industry in United Arab Emirates, Coking Unit Capacity, 2014-2024

5.4. Refining Industry in United Arab Emirates, Catalytic Cracker Unit Capacity, 2014-2024

5.5. Refining Industry in United Arab Emirates, Hydrocracking Unit Capacity, 2014-2024

5.6. Recent Developments

5.7. Recent Contracts

6. Refining Industry in Iraq

7. Refining Industry in Turkey

8. Refining Industry in Kuwait

9. Refining Industry in Qatar

10. Refining Industry in Oman

11. Refining Industry in Israel

12. Refining Industry in Bahrain

13. Refining Industry in Syria

14. Refining Industry in Yemen

15. Refining Industry in Jordan

16. Appendix

For more information about this report visit https://www.researchandmarkets.com/r/vkpr49


Contacts

ResearchAndMarkets.com
Laura Wood, Senior Press Manager
This email address is being protected from spambots. You need JavaScript enabled to view it.
For E.S.T Office Hours Call 1-917-300-0470
For U.S./CAN Toll Free Call 1-800-526-8630
For GMT Office Hours Call +353-1-416-8900

LEAWOOD, KS--(BUSINESS WIRE)--TYG, NTG, TTP, TPZ and TEAF today declared the following distributions:


Fund

Ticker

Distribution
Amount

Tortoise Energy Infrastructure Corp.

TYG

$0.3000

Tortoise Midstream Energy Fund, Inc.

NTG

$0.3100

Tortoise Pipeline & Energy Fund, Inc.

TTP

$0.1600

Tortoise Power and Energy Infrastructure Fund, Inc.

TPZ

$0.0500

Tortoise Essential Assets Income Term Fund

TEAF

$0.0750

The TYG, NTG, TTP and TPZ distributions are payable on November 30, 2020 to shareholders of record on November 23, 2020. TEAF monthly distributions are payable on December 31, 2020, January 29, 2021 and February 26, 2021 to shareholders of record on the respective dates of December 24, 2020, January 22, 2021 and February 19, 2021.

2020 Tax Characterization Information

For tax purposes, 0 to 10% of TYG and NTG’s 2020 distributions are expected to be characterized as qualified dividend income, with the remainder as return of capital; 0 to 10% of TTP and NDP’s 2020 distributions are expected to be characterized as dividend income, with the remainder as return of capital; 50 to 60% of TPZ’s 2020 distributions are expected to be characterized as dividend income with the remainder as return of capital; and 50 to 60% of TEAF’s 2020 distributions are expected to be characterized as dividend income with the remainder as return of capital.

A final determination of the characterization will be made in January 2021 and you will receive a form 1099-DIV for each fund in which you are invested.

For book purposes, the source of distributions for TYG and NTG is estimated to be 100% return of capital, the source of distributions for NDP is estimated to be approximately 90 to 100% ordinary income, with the remainder as return of capital, and the source of distributions for TEAF is estimated to be approximately 65 to 75% ordinary income, with the remainder as return of capital.

You should not draw any conclusions about TTP’s or TPZ’s investment performance from the amount of these distributions or from the terms of TTP’s or TPZ’s distribution policy.

TTP and TPZ estimate that they have distributed more than their income and net realized capital gains; therefore, a portion of the distribution may be return of capital. A return of capital may occur, for example, when some or all of the money that you invested in TTP and TPZ is paid back to you. A return of capital distribution does not necessarily reflect TTP’s and TPZ’s investment performance and should not be confused with “yield” or “income.”

TTP and TPZ will report the sources for their distributions at the time of the payment in the applicable Section 19(a) Notice. The amounts and sources of distributions TTP and TPZ report are only estimates and are not being provided for tax reporting purposes. The actual amounts and sources of the amounts for tax reporting purposes will depend upon TTP’s and TPZ’s investment experience during the remainder of their fiscal years and may be subject to changes based on tax regulations.

Tortoise Capital Advisors, L.L.C. is the adviser to Tortoise Energy Infrastructure Corp., Tortoise Midstream Energy Fund, Inc., Tortoise Pipeline & Energy Fund, Inc., Tortoise Power and Energy Infrastructure Fund, Inc., Tortoise Energy Independence Fund, Inc. and Tortoise Essential Assets Income Term Fund. Ecofin Advisors Limited is a sub-adviser to Tortoise Essential Assets Income Term Fund.

For additional information on these funds, please visit cef.tortoiseecofin.com.

About Tortoise

Tortoise focuses on energy and power infrastructure and the transition to cleaner energy. Tortoise’s solid track record of energy value chain investment experience and research dates back more than 20 years. As one of the earliest investors in midstream energy, Tortoise believes it is well-positioned to be at the forefront of the global energy evolution that is underway. With a steady wins approach and a long-term perspective, Tortoise strives to make a positive impact on clients and communities. To learn more, visit www.TortoiseEcofin.com.

Cautionary Statement Regarding Forward-Looking Statements

This press release contains certain statements that may include “forward-looking statements” within the meaning of Section 27A of the Securities Act of 1933 and Section 21E of the Securities Exchange Act of 1934. All statements, other than statements of historical fact, included herein are "forward-looking statements." Although the funds and Tortoise Capital Advisors believe that the expectations reflected in these forward-looking statements are reasonable, they do involve assumptions, risks and uncertainties, and these expectations may prove to be incorrect. Actual results could differ materially from those anticipated in these forward-looking statements as a result of a variety of factors, including those discussed in the fund’s reports that are filed with the Securities and Exchange Commission. You should not place undue reliance on these forward-looking statements, which speak only as of the date of this press release. Other than as required by law, the funds and Tortoise Capital Advisors do not assume a duty to update this forward-looking statement.

Safe Harbor Statement

This press release shall not constitute an offer to sell or a solicitation to buy, nor shall there be any sale of these securities in any state or jurisdiction in which such offer or solicitation or sale would be unlawful prior to registration or qualification under the laws of such state or jurisdiction.


Contacts

Maggie Zastrow
(913) 981-1020
This email address is being protected from spambots. You need JavaScript enabled to view it.

Reaffirms 2020 earnings guidance range

DULUTH, Minn.--(BUSINESS WIRE)--ALLETE, Inc. (NYSE: ALE) today reported third quarter 2020 earnings of 78 cents per share on net income of $40.7 million. Last year’s results were 60 cents per share on net income of $31.2 million.


“ALLETE’s strong financial performance for this quarter and significant progress made on two of our large renewable energy projects representing over 500 megawatts of new, carbon free wind generation, demonstrate our resilience and resourcefulness while we work to mitigate the effects of the pandemic on our customers and the economy,” said ALLETE President and CEO Bethany Owen. “ALLETE remains focused on delivering essential energy services to our customers and value to our shareholders, while leading the transition to cleaner energy and reducing carbon as part of our sustainability in action strategy.”

ALLETE’s Regulated Operations segment, which includes Minnesota Power, Superior Water, Light and Power and the Company’s investment in the American Transmission Co., recorded net income of $42.4 million, compared to $32.4 million in the third quarter of 2019. Earnings reflect higher net income at Minnesota Power primarily due to higher rates, and year-over-year timing impacts related to income tax expense and fuel adjustment clause recoveries. The quarter also reflects lower kilowatt-hour sales to commercial and industrial customers due to COVID-19 impacts, partially offset by increased residential sales, and lower revenue from other power suppliers due to the expiration of a contract in the second quarter of 2020.

ALLETE Clean Energy recorded third quarter 2020 net income of $1.1 million compared to a net loss of $1.2 million in 2019. Net income in 2020 reflects additional production tax credits, higher kilowatt-hour sales due to higher wind resources compared to 2019, and earnings from the new Glen Ullin and South Peak wind energy facilities.

Corporate and Other, which includes BNI Energy and ALLETE Properties, recorded a loss of $2.8 million in 2020 primarily due to lower earnings on cash and short-term investments and year-over-year timing impacts related to the recording of income tax expense, which varies quarter to quarter based on an estimated annual effective tax rate.

“We continue to expect ALLETE’s 2020 annual adjusted earnings guidance (Non-GAAP) to be in the range of $3.25 to $3.45 per share, excluding the 16 cent per share charge related to the Minnesota Power rate case resolution, net of tax.” said ALLETE Senior Vice President and Chief Financial Officer Bob Adams. “This guidance reflects lower power demand and kilowatt-hour sales related to Keewatin Taconite and Verso Corporation operations that remain idled, as well as lower demand from other customers, partially offset by lower operating and maintenance expense.”

ALLETE’s earnings conference call will be at 10:00 a.m. (EST), November 9, 2020, at which time management will discuss the third quarter of 2020 financial results. Interested parties may listen live by calling 877-303-5852, pass code 5289685, ten minutes prior to the start time, or may listen to the live audio-only webcast and view supporting slides, which will be available on ALLETE’s Investor Relations website http://investor.allete.com/events-presentations. A replay of the call will be available through November 16, 2020 by calling (855) 859-2056, pass code 5289685. The webcast will be accessible for one year at www.allete.com.

ALLETE is an energy company headquartered in Duluth, Minn. In addition to its electric utilities, Minnesota Power and Superior Water, Light and Power of Wisconsin, ALLETE owns ALLETE Clean Energy, based in Duluth, BNI Energy in Bismarck, N.D., and has an eight percent equity interest in the American Transmission Co. More information about ALLETE is available at www.allete.com. ALE-CORP

The statements contained in this release and statements that ALLETE may make orally in connection with this release that are not historical facts, are forward-looking statements. Actual results may differ materially from those projected in the forward-looking statements. These forward-looking statements involve risks and uncertainties and investors are directed to the risks discussed in documents filed by ALLETE with the Securities and Exchange Commission.

ALLETE's press releases and other communications may include certain non-Generally Accepted Accounting Principles (GAAP) financial measures. A "non-GAAP financial measure" is defined as a numerical measure of a company's financial performance, financial position or cash flows that excludes (or includes) amounts that are included in (or excluded from) the most directly comparable measure calculated and presented in accordance with GAAP in the company's financial statements.

Non-GAAP financial measures utilized by the company include presentations of earnings (loss) per share. ALLETE's management believes that these non-GAAP financial measures provide useful information to investors by removing the effect of variances in GAAP reported results of operations that are not indicative of changes in the fundamental earnings power of the company's operations, such as the charge for the recent Minnesota Power rate case resolution. Management believes that the presentation of non-GAAP financial measures is appropriate and enables investors and analysts to more accurately compare the company's ongoing financial performance over the periods presented. See page 4 in this release for a reconciliation of 2020 annual GAAP earnings guidance range to 2020 annual adjusted earnings guidance range (Non-GAAP).

ALLETE, Inc.

Consolidated Statement of Income

Millions Except Per Share Amounts - Unaudited


Quarter Ended

Nine Months Ended


September 30,

September 30,


2020


2019


2020


2019


Operating Revenue


Contracts with Customers – Utility

$255.1


$254.1


$721.2


$786.1


Contracts with Customers – Non-utility

35.9


31.3


119.0


141.1


Other – Non-utility

2.9


2.9


8.5


8.7


Total Operating Revenue

293.9


288.3


848.7


935.9


Operating Expenses


Fuel, Purchased Power and Gas – Utility

93.4


98.2


251.7


295.9


Transmission Services – Utility

14.9


18.3


49.8


55.8


Cost of Sales – Non-utility

15.4


14.7


48.6


61.8


Operating and Maintenance

61.9


58.1


181.9


201.0


Depreciation and Amortization

53.4


49.5


161.3


151.6


Taxes Other than Income Taxes

13.3


12.5


40.9


39.8


Total Operating Expenses

252.3


251.3


734.2


805.9


Operating Income

41.6


37.0


114.5


130.0


Other Income (Expense)


Interest Expense

(16.3

)


(16.1

)


(47.9

)


(48.9

)


Equity Earnings

5.1


4.9


16.7


15.3


Gain on Sale of U.S. Water Services


20.6


Other

2.9


3.0


9.1


14.6


Total Other Income (Expense)

(8.3

)


(8.2

)


(22.1

)


1.6


Income Before Income Taxes

33.3


28.8


92.4


131.6


Income Tax Expense (Benefit)

(5.5

)


(2.4

)


(27.8

)


(4.3

)


Net Income

38.8


31.2


120.2


135.9


Net Loss Attributable to Non-Controlling Interest

(1.9

)


(6.9

)


Net Income Attributable to ALLETE

$40.7


$31.2


$127.1


$135.9


Average Shares of Common Stock


Basic

51.9


51.7


51.8


51.6


Diluted

52.0


51.8


51.9


51.7


Basic Earnings Per Share of Common Stock

$0.78


$0.60


$2.45


$2.63


Diluted Earnings Per Share of Common Stock

$0.78


$0.60


$2.45


$2.63


Dividends Per Share of Common Stock

$0.6175


$0.5875


$1.8525


$1.7625


Consolidated Balance Sheet

Millions - Unaudited


Sep. 30

Dec. 31,


Sep. 30

Dec. 31,


2020

2019


2020

2019

Assets


Liabilities and Equity


Cash and Cash Equivalents

$79.0

$69.3


Current Liabilities

$630.0

$507.4

Other Current Assets

186.1

200.2


Long-Term Debt

1,608.0

1,400.9

Property, Plant and Equipment – Net

4,697.5

4,377.0


Deferred Income Taxes

204.8

212.8

Regulatory Assets

427.9

420.5


Regulatory Liabilities

547.1

560.3

Equity Investments

291.8

197.6


Defined Benefit Pension and Other Postretirement Benefit Plans

157.5

172.8

Other Non-Current Assets

196.2

218.2


Other Non-Current Liabilities

285.5

293.0


Equity

2,445.6

2,335.6

Total Assets

$5,878.5

$5,482.8


Total Liabilities and Equity

$5,878.5

$5,482.8


Quarter Ended

Nine Months Ended

ALLETE, Inc.

September 30,

September 30,

Income (Loss)

2020

2019

2020

2019

Millions


Regulated Operations

$42.4

$32.4

$111.0

$114.2

ALLETE Clean Energy

1.1

(1.2)

16.8

6.5

U.S. Water Services

(1.1)

Corporate and Other

(2.8)

(0.7)

16.3

Net Income Attributable to ALLETE

$40.7

$31.2

$127.1

$135.9

Diluted Earnings Per Share

$0.78

$0.60

$2.45

$2.63

Statistical Data


Corporate


Common Stock


High

$61.32

$88.60

$84.71

$88.60

Low

$49.91

$82.38

$48.22

$72.50

Close

$51.74

$87.41

$51.74

$87.41

Book Value

$43.89

$42.73

$43.89

$42.73

Kilowatt-hours Sold


Millions


Regulated Utility


Retail and Municipal


Residential

268

248

835

829

Commercial

345

361

983

1,043

Industrial

1,410

1,802

4,547

5,389

Municipal

147

146

434

519

Total Retail and Municipal

2,170

2,557

6,799

7,780

Other Power Suppliers

967

758

2,495

2,294

Total Regulated Utility Kilowatt-hours Sold

3,137

3,315

9,294

10,074

Regulated Utility Revenue


Millions


Regulated Utility Revenue


Retail and Municipal Electric Revenue


Residential

$32.2

$27.6

$93.3

$94.0

Commercial

36.5

36.0

99.5

106.1

Industrial

109.3

115.4

315.0

356.0

Municipal

11.2

11.8

30.5

39.4

Total Retail and Municipal Electric Revenue

189.2

190.8

538.3

595.5

Other Power Suppliers

30.9

37.3

96.6

111.9

Other (Includes Water and Gas Revenue)

35.0

26.0

86.3

78.7

Total Regulated Utility Revenue

$255.1

$254.1

$721.2

$786.1


A reconciliation of 2020 annual GAAP earnings guidance range to 2020 annual adjusted earnings guidance range (Non-GAAP) is as follows:


2020 Annual GAAP Earnings Guidance Range


$3.09 - $3.29

Rate Case Settlement Charge


$0.23

Less: Income Tax Benefit


$(0.07)

Rate Case Settlement Charge, Net of Income Tax Benefit


$0.16

2020 Annual Adjusted Earnings Guidance Range (Non-GAAP)


$3.25 - $3.45


Contacts

Investor Contact:
Vince Meyer
218-723-3952
This email address is being protected from spambots. You need JavaScript enabled to view it.

TOKYO--(BUSINESS WIRE)--Diamond WTG Engineering & Services, Inc. (“Diamond”) is pleased to announce the appointment of Mark Tallman as President and Chief Executive Officer, effective October. Mr. Tallman succeeds Harm Toren, who led Diamond with distinction for the past 5 years.


“Mark is an exceptional leader. With more than 35-years of experience in the energy industry, he brings a deep understanding of renewable resources. I’m confident in Mark’s leadership, expertise and ability to drive growth and deliver solutions for our customers,” said Diamond Chairman, Ichiro Matsuura.

“I am honored and excited to have the opportunity to lead Diamond,” said Tallman. “We will continue to focus on safety and customer satisfaction as we grow our ISP business in the United States. As a group company of Mitsubishi Heavy Industries, Ltd., Diamond is uniquely positioned to support our customers based on our technical; supply chain; and asset management capabilities.”

Tallman has been an officer and key member of Diamond since December 2015 as the Vice President of Commercial & Procurement. Previously, he spent more than 30 years at PacifiCorp in roles spanning engineering, energy transactions, and renewable resources.

About Diamond: Diamond WTG Engineering & Services, Inc. is headquartered in Portland, OR and has a Logistics and Operations Center in Snyder, TX and a blade facility in Santa Teresa, NM. Diamond provides technical support, wind turbine parts, and scheduled/elective maintenance services. As a service-oriented company, Diamond provides high quality and competitive solutions for wind turbine owners, as well as independent assessments for prospective or end-of-warranty owners. Diamond provides trained personnel and innovative service solutions empowering asset owners to increase reliability and availability of their wind assets while keeping their operating costs under control.


Contacts

Manami Onoda
Public Relations Group
Corporate Communication Department
Business Strategy Office
Mitsubishi Heavy Industries, Ltd.
This email address is being protected from spambots. You need JavaScript enabled to view it.

NEW YORK & SAN FRANCISCO & LONDON & COLOGNE, Germany & PALM BEACH, Fla.--(BUSINESS WIRE)--Energy Impact Partners LP (EIP), the global private equity platform leading and enabling the transition to a cleaner, more resilient, and more inclusive energy ecosystem, has further cemented its commitments to fighting climate change and advancing ESG integration best practices in private equity by joining the Initiative Climat International (iCI) consortium.


The consortium is made up of 52 of the most forward-looking private equity players, including Harbourvest, Idinvest Partners, Caisse des Dépots, HG Capital and Permira. By signing the iCI, EIP is joining a global community of investors that share in a collective mission to reduce carbon emissions and deliver positive environmental impact alongside market rate returns as an investment strategy. EIP is one of the only members of the iCI whose sole focus is on investing in energy transition and climate change mitigation technologies, and will collaborate, share knowledge, and help establish best practices with other members.

This year, EIP also became a signatory of the UN’s Principles of Responsible Investment (PRI) and adopted a formal ESG policy. EIP is committed to incorporating ESG themes in investment decision-making processes, monitoring and engaging with its portfolio companies on ESG risks and opportunities, and reporting on ESG performance, as well as measuring the quantitative impact outcomes enabled by its portfolio.

Nazo Moosa, Managing Partner at EIP said: “Europe has long blazed a trail when it comes to tackling the causes and challenges surrounding climate change. For EIP, the transition to a sustainable future is central to all of our funds. EIP is already a signatory of the United Nation’s PRI initiative and by joining the iCI consortium we reaffirm our core objectives to deliver investors both strong financial performance, as well as meaningful positive environmental impact.”

“Since EIP’s inception, impact has been core to our strategy and approach, carried out alongside our strategic investor coalition around a shared mission to lead and enable the transition to a clean, resilient, and more inclusive energy ecosystem. This mission aligns incredibly well with that of iCI and its members, and we’re thrilled to be joining a group of likeminded, impact-driven LPs and GPs in our ecosystem,” said Bethany Gorham, Vice President at EIP.

About Energy Impact Partners

Energy Impact Partners (EIP) is a global investment platform leading the transition to a sustainable energy future. EIP brings together entrepreneurs and the world's most forward-looking energy and industrial companies to advance innovation. With over $1.5 billion in assets under management, EIP invests globally across venture, growth, credit and infrastructure – and has a team of more than 45 professionals based in its offices in New York, San Francisco, Palm Beach, London, Cologne and soon Oslo. For more information on EIP, please visit www.energyimpactpartners.com.


Contacts

EU Press
Antonella Scimemi, Burlington
This email address is being protected from spambots. You need JavaScript enabled to view it. +44 (0)7530 815 018

U.S. Press
Tori McDonnell
Silverline Communications
This email address is being protected from spambots. You need JavaScript enabled to view it. +1-703-338-2362

GREENWICH, Conn.--(BUSINESS WIRE)--Diamond S Shipping Inc. (NYSE: DSSI) (the “Company”) announced today that the Company plans to release third quarter 2020 earnings before the market opens on Monday, November 16, 2020. The Company will host a conference call for investors at 8:00 AM ET on the same day.


Conference Call Details

Date: Monday, November 16, 2020

Time: 8:00 AM ET

US Dial-In Number: +1 866 211-4137

International Dial-In Number: +1 647 689-6723

Conference ID: 6646328

A live webcast of the conference call will be available from the Company’s website at www.diamondsshipping.com.

An audio replay of the conference call will be available starting at 11 AM ET on Monday, November 16, 2020, through Monday, November 23, 2020, by dialing +1 800 585-8367 or +1 416 621-4642 and entering the passcode 6646328.

About Diamond S Shipping Inc.

Diamond S Shipping Inc. (NYSE Ticker: DSSI) owns and operates 66 vessels on the water, including 15 Suezmax vessels, one Aframax and 50 medium-range (MR) product tankers. Diamond S Shipping is one of the largest energy shipping companies providing seaborne transportation of crude oil and refined petroleum products in the international shipping markets. The Company is headquartered in Greenwich, CT. More information about the Company can be found at www.diamondsshipping.com.


Contacts

Investor Relations Inquiries:
Robert Brinberg
Tel: +1-212-517-0810
E-mail: This email address is being protected from spambots. You need JavaScript enabled to view it.

Execution drives increase to midpoint of 2020 production guidance, 2021 budget targets stable production and free cash flow

CALGARY, Alberta--(BUSINESS WIRE)--Seven Generations Energy Ltd. (TSX: VII)


THIRD QUARTER 2020 HIGHLIGHTS

  • The company successfully completed its planned three-week turnaround and upgrade at the Karr plant and condensate stabilizer on-time and on-budget, while mitigating the impact to production volumes. Third quarter sales volumes were 168.9 Mboe/d (43% natural gas, 34% condensate, 23% other NGLs). October average field production estimates are in excess of 185 Mboe/d.
  • 7G has increased the lower end of its full-year 2020 production guidance to average 180-185 Mboe/d, compared to its prior guidance of 175-185 Mboe/d. Planned capital investments for 2020 are unchanged at $650 million. Additionally, the upper end of full-year 2020 operating cost guidance has been reduced from $4.50-$5.00/boe to $4.50-$4.75/boe.
  • The company restarted drilling and completion activity early in the third quarter and generated a modest amount of free cash flow despite the capital and volume impacts of the Karr turnaround. For both the fourth quarter and full-year 2020, 7G expects to generate free cash flow given the remaining capital investment, production volumes and hedging profile. 7G’s strategy of free cash flow generation continues despite the multitude of challenges faced in 2020. The company currently has 80% of net condensate volumes hedged in the fourth quarter and 55% hedged in the first quarter of 2021 at an average WTI price of US$44.60/bbl.
  • Third quarter drilling and completions costs averaged $6.5 million dollars per well, an 11% improvement relative to the per-well costs achieved in the first half of 2020. Drilling costs per meter and completion costs per tonne of proppant pumped improved by 5% and 30% respectively compared to the first half of 2020.
  • 7G continues to execute its symbiotic ESG-driven market access strategy. Supported by its Equitable Origin EO100™ certification and its low upstream emissions intensity profile, 7G entered into a supply agreement with Vermont Gas Systems, Inc. (VGS). VGS is an integrated energy services company that will distribute 7G’s responsibly developed natural gas to its consumer base and in return pay 7G a premium that the company will direct towards the 7G Sustainability Fund.
  • The company also entered a combined renewable energy certificate (REC) natural gas supply transaction, that sees a portion of 7G’s Alberta-based natural gas sales receive a REC as part of the sales price in the fourth quarter. This transaction is expected to reduce 7G’s 2020 scope 2 emissions profile to net zero and ties with 7G’s continuing emissions reduction efforts.

2021 BUDGET

  • 2021 production is expected to average 180-185 Mboe/d on capital investments of $650 million. Year-over-year improvements to cash costs and operating efficiencies, combined with moderating corporate decline rates are expected to contribute to 7G’s growing free cash flow profile in 2021 at current strip prices.
  • 7G’s 2021 WTI breakeven price is expected to be $35/bbl at current Henry Hub strip pricing of approximately US$2.75/MMbtu. In a $45/bbl WTI and $3/MMbtu Henry Hub price environment, 7G forecasts its 2021 capital investment plan to represent approximately 75% of forecasted funds flow.

OPERATIONAL AND FINANCIAL HIGHLIGHTS

$ millions, except per share and unit of production amounts

Three months
ended
September 30,


Three months
ended
June 30,


Nine months
ended
September 30,


%

%

%

2020


2019


Change


2020


Change


2020


2019


Change

Financial Results


Funds flow ($)(1)

166.3


340.5


(51

)

138.8


20


580.1

1,034.6


(44

)

Per share - diluted ($)(1)

0.50


0.98


(49

)

0.42


19


1.74

2.94


(41

)

Free cash flow ($)(1)

1.0


55.9


(98

)

69.4


(99

)

79.6

38.0


109


Net income (loss) ($)

(66.8

)

85.1


nm


(116.9

)

(43

)

(1,192.9)

391.2


nm


Per share - diluted ($)

(0.20

)

0.25


nm


(0.35

)

(43

)

(3.58)

1.11


nm


Adjusted net income (loss) ($)(1)

(24.2

)

78.5


nm


(43.1

)

(44

)

(33.3)

259.8


nm


Per share - diluted ($)(1)

(0.07

)

0.23


nm


(0.13

)

(46

)

(0.10)

0.74


nm


Revenue ($)(2)

469.6


718.0


(35

)

306.0


53


1,765.0

2,059.8


(14

)

CROIC (%)(1)

9.0


14.1


(36

)

10.7


(16

)

9.0

14.1


(36

)

ROCE (%)(1)

3.5


8.6


(59

)

5.6


(38

)

3.5

8.6


(59

)

Sales volumes(3)(4)


Condensate (mbbl/d)

57.6


75.5


(24

)

64.3


(10

)

63.6

74.7


(15

)

Natural gas (MMcf/d)

434.6


515.3


(16

)

467.9


(7

)

463.7

496.3


(7

)

Other NGLs (mbbl/d)

38.8


43.2


(10

)

40.9


(5

)

40.9

43.9


(7

)

Total sales volumes (mboe/d)

168.9


204.6


(17

)

183.2


(8

)

181.8

201.3


(10

)

Liquids %

57


58


(2

)

57


57

59


(3

)

Realized prices(4)


Condensate ($/bbl)

47.40


65.59


(28

)

26.59


78


43.82

66.91


(35

)

Natural gas ($/Mcf)

2.61


2.85


(8

)

2.49


5


2.59

3.47


(25

)

Other NGLs ($/bbl)

14.60


2.74


nm


12.01


22


11.73

4.79


145


Total ($/boe)

26.24


31.97


(18

)

18.38


43


24.57

34.42


(29

)

Royalty expense ($/boe)

(1.76

)

(1.99

)

(12

)

(0.97

)

81


(1.68)

(2.16

)

(22

)

Operating expenses ($/boe)

(5.30

)

(4.81

)

10


(4.16

)

27


(4.65)

(4.91

)

(5

)

Transportation, processing and other ($/boe)

(7.86

)

(6.46

)

22


(7.53

)

4


(7.46)

(6.58

)

13


Operating netback before the following ($/boe)(1)(4)

11.32


18.71


(39

)

5.72


98


10.78

20.77


(48

)

Realized hedging gains ($/boe)

2.76


1.63


69


6.44


(57

)

4.27

0.46


nm


Marketing income (loss) ($/boe)(1)

(0.64

)

0.19

nm


(0.80

)

(20

)

(0.63)

0.34


nm


Operating netback ($/boe)(1)

13.44


20.53


(35

)

11.36


18


14.42

21.57


(33

)

Funds flow ($/boe)(1)

10.70


18.09


(41

)

8.33


28


11.65

18.83


(38

)

Balance sheet


Capital investments ($)

165.3


284.6


(42

)

69.4


138


500.5

996.6


(50

)

Available funding ($)(1)

1,113.1


1,277.2


(13

)

1,110.7


1,113.1

1,277.2


(13

)

Net debt ($)(1)

2,178.8


2,213.7


(2

)

2,224.9


(2

)

2,178.8

2,213.7


(2

)

Purchase of common shares ($)


73.8


(100

)


15.6

117.9


(87

)

Common shares outstanding (mm)

333.3


340.5


(2

)

333.2


333.3

340.5


(2

)

Weighted average shares outstanding - basic (mm)

333.3


345.9


(4

)

333.1


333.3

350.2


(5

)

Weighted average shares outstanding - diluted (mm)

334.0


347.0


(4

)

333.8


333.9

352.0


(5

)

(1)


Refer to the Reader Advisory section at the end of this news release for additional information regarding the company's GAAP and non-GAAP measures.

(2)


Represents the total of liquids and natural gas sales, net of royalties, gains (losses) on risk management contracts and other income.

(3)


See "Note Regarding Product Types" in the Reader Advisory section at the end of this news release.

(4)


Excludes realized hedging gains and losses, as well as the purchase and sale of condensate and natural gas in respect to the company's transportation commitment utilization and marketing activities.


Three months ended
September 30,


Nine months ended
September 30,

Nest Activity

2020


2019


% Change


2020


2019


% Change

Drilling(1)


Horizontal wells rig released

9

20

(55

)

35

57

(39

)

Average measured depth (m)

6,416

5,979

7


6,121

6,037

1


Average horizontal length (m)

3,098

2,785

11


2,890

2,785

4


Average drilling days per well

31

25

24


29

28

4


Average drill cost per metre ($)(2)

487

502

(3

)

506

551

(8

)

Average well cost ($ millions)(2)

3.1

3.0

3


3.1

3.3

(6

)

Completion(1)


Wells completed

19

30

(37

)

46

67

(31

)

Average tonnes pumped per metre

2.0

2.1

(5

)

1.9

2.0

(5

)

Average cost per tonne ($)(2)

646

917

(30

)

797

1,058

(25

)

Average cost per lateral metre ($)(2)

1,269

1,884

(33

)

1,543

2,080

(26

)

Average well cost ($ millions)(2)

3.4

5.4

(37

)

3.9

5.8

(33

)

Total D&C cost per well ($ millions)(2)(3)

6.5

8.4

(23

)

7.0

9.1

(23

)

Wells brought on production

23

15

53


49

57

(14

)

(1)


The metrics include all horizontal Montney wells that are tied in for production. Excluded from the metrics are vertical wells re-drilled, abandoned wells, water disposal wells, as well as any delineated and expiring wells not tied in for production. Drilling counts are based on rig release date and on production counts are based on the first production date after the wells are tied-in to permanent facilities.

(2)


Information provided is based on field estimates and is subject to change.

(3)


The number of horizontal wells rig-released do not correspond to the number of wells completed in the table above. Accordingly, the total average D&C costs per well may differ from the actual D&C costs for any individual well.

OPERATIONS AND RESOURCE DEVELOPMENT

Seven Generations resumed field activity in early July 2020 and concluded the quarter with the successful planned turnaround of the Karr plant and upgrade of the Karr condensate stabilizer. The project was completed on-time and on-budget with a smooth post-turnaround start-up that led to average October production in excess of 185 Mboe/d. Importantly, efforts to mitigate the volume impact were successful, although there was a temporary condensate pricing and per unit cost impact.

During a three-week period in September, more than 400 contractors and staff were on site at peak times to complete the maintenance and upgrade work. Work teams adhered to strict small-cohorts, physical distancing measures and rigorous logistics plans to minimize health risks which ensured the project was completed safely during the COVID-19 pandemic. Coincident with the turnaround, the company also invested approximately $20 million to upgrade and enhance the reliability of the stabilizer’s boiler system which is expected to drive improvements to average condensate price realizations, while reducing operating costs and improving safety.

Drilling and completion costs in the quarter averaged $6.5 million per well. The company has continued to achieve record reductions in costs without sacrificing well productivity via a combination of improved drilling performance, advanced completion designs and execution efficiencies, and vendor collaboration. Notable structural cost improvements since the fall of 2019 include continued efficiency improvements to on-the-ground operational logistics, using limited entry plug-and-perf completion design with wider stage spacing, increased perforation clusters and optimized sand and water intensity.

Two additional lower Montney wells were also brought on stream in the Nest 3 region during the quarter. Early stage rates are encouraging relative to other wells in Nest 3, with IP60 sales rates of approximately 2.075 Mboe/d (685 bbl/d condensate, 480 bbl/d other NGLs, 5.5 MMcf/d natural gas) and 1.8 Mboe/d (573 bbl/d condensate, 425 bbl/d other NGLs, 4.8 MMcf/d of natural gas), respectively. Continued lower Montney success underscores 7G’s inventory along with half-cycle economics via the use of existing infrastructure.

2020 OUTLOOK AND 2021 BUDGET

Following the successful turnaround and continued strong execution, the company has increased the lower-end of its full-year 2020 production guidance to now average 180-185 Mboe/d, compared to the prior guidance of 175-185 Mboe/d.

Seven Generations has also released its 2021 budget, with total capital investments expected to total $650 million and production to average 180-185 Mboe/d. 2021 investments are expected to maintain a flat year-over-year production profile that is predicated on maximizing the company’s free cash flow generating capacity. Building on the durable cost efficiencies captured in 2020, the company anticipates ongoing improvements to its cost structure in 2021. The 2021 budget assumes similar well costs on a per metre and per tonne basis to those achieved in late 2020. Due to marginally longer average well lengths in the 2021 program, the company anticipates per well drill and complete costs to average $6.9 million, a 5% improvement relative to 2020 budget assumptions.

Free cash flow generated in the future will initially be prioritized for net debt reduction. The company has reduced its target leverage metric, net debt to adjusted EBITDA to 1.5x from the previous 2.0x target.

The 2021 capital program requires fewer wells brought on-stream than 2020 to maintain production given the company’s flattening decline profile. The company forecasts carrying an in-process inventory of 10-15 additional wells at year-end 2021 that create the option to respond to improved commodity prices in the year or to further reduce 2022 sustaining capital requirements in a “lower for longer” energy price environment.

With the continued moderation of decline rates, improvement in cost structure and expected optimization of natural gas revenues net of transportation costs in late 2022, Seven Generations expects to expand its free cash flow profile independent of commodity prices. 7G believes that returning capital to shareholders is an important component of total shareholder returns and will continue to evaluate the optimal allocation of free cash flow over time.


2021 Budget(1)

2020 Budget(1)

Total Capital Investment

$650 million

$650 million


Average Production(2)

180 - 185 Mboe/d

180 - 185 Mboe/d


Development Wells Drilled (#)

65 - 70


50 - 60

Development Wells On-Stream (#)

50 - 60


65 - 70

Percent Natural Gas(2)

42 - 44%


42 - 44%

Percent Condensate(2)

32 - 36%


32 - 36%

Percent Other NGLs(2)

22 - 24%


22 - 24%

Royalty Rate(3)

5 - 7%


4 - 6%

Operating Expenses ($/boe)

$4.50 - $4.75


$4.50 - $4.75

Transportation ($/boe)

$7.50 - $7.75


$7.50 - $8.25

G&A ($/boe)

$0.80 - $0.90


$0.85 - $0.95

Interest ($/boe)

$1.80 - $2.00


$1.80 - $2.00

(1)


See “Forward-Looking Information Advisory” in the Reader Advisory in this news release.

(2)


See “Note Regarding Product Types” in the Reader Advisory in this news release.

(3)


2021 royalty guidance based on US$40 WTI and US$3.00 Henry Hub pricing.

RISK MANAGEMENT

Seven Generations continues to execute its consistent hedging program that is designed to manage commodity price risk, support returns on invested capital, and ensure a minimum level of cash flow despite fluctuating commodity prices. Details of the company’s liquids and natural gas hedges at the end of the third quarter are shown below:

Q4 2020


2021


2022

WTI Hedges - bbl/d(1)

49,500

17,000

5,750

Floor Price - US$/bbl

$45.22

$45.70

$43.32

Natural Gas Hedges - MMbtu/d(2)

192,793

226,250

145,000

Floor Price - US$/MMbtu

$2.58

$2.55

$2.52

(1)


Combined USD and CAD WTI instruments. 7G also has the following sold puts in place within its hedging portfolio: 4,000 bbl/d for Q4 at US$40 and 1,750 bbl/d for 2021 at US$40.

(2)


Combined Henry Hub, Chicago Citygate and AECO fixed price instruments.

(3)


Complete details of 7G’s hedging program including FX hedges are available in the company’s Q3 November 2020 corporate presentation and MD&A.

ESG UPDATE

Seven Generations continues to advance its symbiotic ESG-driven market diversification strategy with the announcement of a new responsible natural gas supply agreement with Vermont Gas Systems, Inc. (VGS). VGS is an integrated energy services company providing clean, affordable and reliable thermal energy services to more than 53,000 customers in northwest Vermont. 7G continues to pursue additional arrangements with other counterparties interested in securing responsibly produced, low-carbon intensity natural gas, supported by its Equitable Origin EO100™ certification. The company’s commitment to delivering responsibly developed natural gas to consumer markets is an evolution of its market access strategy that is enabled by its diverse, continent-wide natural gas transportation portfolio. The premium received will be directed toward the 7G Sustainability Fund, a fund created to further reduce 7G’s environmental footprint and broaden Indigenous partnerships.

7G has also entered into an Alberta-based natural gas supply arrangement that sees the company receive a REC in addition to standard index based AECO pricing for a portion of its natural gas sales. As a result of this transaction, 7G expects a net zero 2020 Scope 2 emission profile.

CONFERENCE CALL

7G management will hold a conference call to discuss its third quarter results and address investor questions today, November 9, 2020, at 9 a.m. MDT (11 a.m. EDT).

Participant Dial-In Numbers

Dial in – toll-free:

1-888-664-6392

Dial in – toll:

416-764-8659

Webcast link:

https://produceredition.webcasts.com/starthere.jsp?ei=1383306&tp_key=dc0f8a7ad3

Replay dial in toll-free:

1-888-390-0541

Replay dial in toll:

416-764-8677

Conference ID:

023519 #

Available until:

November 16, 2020

Seven Generations is a low supply-cost energy producer dedicated to stakeholder service, responsible development and generating strong returns from its liquids-rich Kakwa River Project in northwest Alberta. 7G’s corporate office is in Calgary, its operations headquarters is in Grande Prairie and its shares trade on the TSX under the symbol VII. Further information is available on the company’s website: www.7genergy.com.

READER ADVISORY

Non-GAAP Measures

This news release includes certain terms or performance measures commonly used in the oil and natural gas industry that are not defined under IFRS, including “adjusted net income”, “adjusted net income per diluted share”, “marketing income”, “operating netback”, “funds flow per diluted share”, “funds flow per boe”, “free cash flow”, “return on capital employed” (or “ROCE”), “cash return on invested capital” (or “CRIOC”) and “available funding”. The data presented is intended to provide additional information and should not be considered in isolation or as a substitute for measures of performance prepared in accordance with IFRS. Such non-GAAP measures should be read in conjunction with the company’s consolidated financial statements for the years ended December 31, 2019 and 2018 and the accompanying notes and the company’s condensed interim consolidated financial statements for the three and nine months ended September 30, 2020 and 2019 and the accompanying notes. Readers are cautioned that the non-GAAP measures do not have any standardized meaning and should not be used to make comparisons between the company and other companies without also taking into account any differences in the way the calculations were prepared. For additional information about these measures, please see “Advisories and Guidance – Non-GAAP measures” in Management’s Discussion and Analysis dated November 6, 2020 for the three and nine months ended September 30, 2020 and 2019.

GAAP Measures

Certain performance measures included in this news release which are utilized by the company and others to assess performance have also been included in the company’s financial statements as they are considered to be relevant to a reader’s understanding of the company's business, performance results and financial condition. Specifically, the company’s “net debt” and “adjusted EBITDA” measures have been included in Note 15 - Capital Management in the consolidated financial statements for the years ended December 31, 2019 and 2018, and in Note 12 of the condensed interim consolidated financial statements for the three and nine months ended September 30, 2020 and 2019. The company has also presented a “funds flow” subtotal in the consolidated cash flow statements in the financial statements. Accordingly, these performance metrics are considered GAAP measures within this news release but would otherwise have been considered to be non-GAAP measures absent their inclusion in the financial statements.

Readers are cautioned that these performance measures do not have any standardized meanings and should not be used to make comparisons between Seven Generations and other companies without also taking into account any differences in the methods by which the calculations were prepared.

For additional information about these measures, please see “Advisories and Guidance – GAAP measures” in Management’s Discussion and Analysis dated November 6, 2020 for the three and nine months ended September 30, 2020 and 2019.

Forward-Looking Information Advisory

This news release contains certain forward-looking information and statements that involve various risks, uncertainties and other factors. The use of any of the words “anticipate”, “continue”, “estimate”, “expect”, “may”, “will”, “should”, “believe”, “plans”, and similar expressions are intended to identify forward looking information or statements. In particular, but without limiting the foregoing, this document contains forward-looking information and statements pertaining to the following: expected production and production guidance; expected capital investments and capital budgets; expected breakeven commodity prices; the number of wells expected to be drilled and brought on-stream; expected royalty rates; expected operating costs, transportation costs, G&A costs, and interest expense; expected free cash flow; the premium pricing expected from sales to VGS and plans to direct such amounts to 7G’s Sustainability Fund; the company’s expected 2020 scope 2 net zero emissions profile; continued emissions reductions efforts; the expectation that year-over-year improvements to cash costs and operating efficiencies, combined with moderating corporate production decline rates will contribute to growing free cash flow in 2021 at current strip prices; the enhanced reliability of the boiler system at the Karr condensate stabilization facility, which is expected to drive improvements to average condensate price realizations and reduce operating costs and improve safety; the expectation that the company’s 2021 investments will maintain a flat year-over-year production profile with allocations that are intended to maximize the company’s free cash flow generating capacity; anticipated improvements to per well drill and complete costs; plans to prioritize the allocation of free cash flow to net debt reduction; targeted net debt to adjusted EBITDA; the expectation that fewer wells will be required in 2021 to maintain production given the company’s flattening corporate production decline profile; plans to carry an in-process inventory of 10-15 additional wells at year-end 2021 to create an option to respond to improved commodity prices or further reduce 2022 sustaining capital requirements (i.e. capital expenditures required to maintain production from existing facilities at current levels); expected drilling inventory; the optimization of natural gas revenues net of transportation costs in late 2022; and the ability to expand the company’s free cash flow profile independent of commodity prices.

With respect to forward-looking information contained in this document, assumptions have been made regarding, among other things: future oil, NGLs and natural gas prices being consistent with current commodity price forecasts after factoring in quality adjustments at the company’s points of sale; the company’s continued ability to obtain qualified staff and equipment in a timely and cost-efficient manner; drilling and completion techniques; infrastructure and facility design concepts that have been successfully applied by the company elsewhere in its Kakwa River Project may be successfully applied to other properties within the Kakwa River Project; the consistency of the regulatory regime and framework governing royalties, taxes and environmental matters in the jurisdictions in which the company conducts its business and any other jurisdictions which may affect the company; the company’s ability to market production of oil, NGLs and natural gas successfully to customers; the company’s future production levels and amount of future capital investment will be consistent with the company’s current development plans and budget; the accuracy of the forecasts provided under “2020 Outlook and 2021 Budget”; forecasted costs and expenses; new technologies for recovery and production of the company’s reserves and resources may improve capital and operational efficiencies in the future; the recoverability of the company’s reserves and resources; sustained future capital investment by the company; future cash flows from production; taxes and royalties will remain consistent with the company's calculated rates; the sources of funding for the company’s capital investment program; the company’s future debt levels; geological and engineering estimates in respect of the company’s reserves and resources; the geography of the areas in which the company is conducting exploration and development activities; the access, economic, regulatory and physical limitations which the company may be affected by from time to time; the impact of competition on the company; and the company’s ability to obtain financing on acceptable terms.


Contacts

Investor & Analyst Inquiries
Brian Newmarch
Vice President, Capital Markets & Stakeholder Engagement
Phone: 403-718-0700
Email: This email address is being protected from spambots. You need JavaScript enabled to view it.

Ryan Galloway
Director, Investor Relations
Phone: 403-718-0709
Email: This email address is being protected from spambots. You need JavaScript enabled to view it.

Media Inquiries
Taryn Bolder
Manager, Communications
Phone: 403-718-0715
Email: This email address is being protected from spambots. You need JavaScript enabled to view it.


Read full story here
LONDON--(BUSINESS WIRE)--#CompressorOilMarket--Technavio has been monitoring the compressor oil market and it is poised to grow by USD 1.09 billion during 2020-2024, progressing at a CAGR of about 2% during the forecast period. The report offers an up-to-date analysis regarding the current market scenario, latest trends and drivers, and the overall market environment. Download a Free Sample Report on COVID-19


Impact of COVID-19

The COVID-19 pandemic continues to transform the growth of various industries, however, the immediate impact of the outbreak is varied. While a few industries will register a drop in demand, numerous others will continue to remain unscathed and show promising growth opportunities. COVID-19 will have a low impact on the compressor oil market. The market growth in 2020 is likely to decrease compared to the market growth in 2019.

Frequently Asked Questions:

  • Based on segmentation by End-user, which is the leading segment in the market?
    Industrial machinery
  • What are the major trends in the market?
    Rising environmental concerns and stringent safety regulations.
  • At what rate is the market projected to grow?
    The market is projected to grow at a CAGR of about 2% during 2020-2024.
  • Who are the top players in the market?
    BP Plc, Chevron Corp., China Petrochemical Corp., Croda International Plc, Exxon Mobil Corp., FUCHS PETROLUB SE, PJSC LUKOIL, Royal Dutch Shell Plc, Total SA, and Valvoline Inc. are the top players in the market.
  • What are the key market drivers and challenges?
    The market will be driven by increasing investments in oil and gas E&P activities. However, the availability of oil-free compressors will challenge growth.

Buy 1 Technavio report and get the second for 50% off. Buy 2 Technavio reports and get the third for free.

View market snapshot before purchasing

The market is fragmented, and the degree of fragmentation will accelerate during the forecast period. BP Plc, Chevron Corp., China Petrochemical Corp., Croda International Plc, Exxon Mobil Corp., FUCHS PETROLUB SE, PJSC LUKOIL, Royal Dutch Shell Plc, Total SA, and Valvoline Inc. are some of the major market participants. Although the increasing investments in oil and gas E&P activities will offer immense growth opportunities, the availability of oil-free compressors is likely to pose a challenge for the market vendors. In a bid to help players strengthen their market foothold, this compressor oil market forecast report provides a detailed analysis of the leading market vendors. The report also empowers industry honchos with information on the competitive landscape and insights into the different product offerings offered by various companies.

Technavio's custom research reports offer detailed insights on the impact of COVID-19 at an industry level, a regional level, and subsequent supply chain operations. This customized report will also help clients keep up with new product launches in direct & indirect COVID-19 related markets, upcoming vaccines and pipeline analysis, and significant developments in vendor operations and government regulations.

Compressor Oil Market 2020-2024: Segmentation

Compressor Oil Market is segmented as below:

  • End-user
    • Industrial Machinery
    • Oil And Gas
    • Power
    • Automotive
    • Others
  • Geography
    • APAC
    • Europe
    • North America
    • MEA
    • South America

To learn more about the global trends impacting the future of market research, download a free sample: https://www.technavio.com/talk-to-us?report=IRTNTR45117

Compressor Oil Market 2020-2024: Scope

Technavio presents a detailed picture of the market by the way of study, synthesis, and summation of data from multiple sources. The compressor oil market report covers the following areas:

  • Compressor Oil Market Size
  • Compressor Oil Market Trends
  • Compressor Oil Market Industry Analysis

This study identifies rising environmental concerns and stringent safety regulations as one of the prime reasons driving the Compressor Oil Market growth during the next few years.

Technavio suggests three forecast scenarios (optimistic, probable, and pessimistic) considering the impact of COVID-19. Technavio’s in-depth research has direct and indirect COVID-19 impacted market research reports.

Register for a free trial today and gain instant access to 17,000+ market research reports.

Technavio's SUBSCRIPTION platform

Compressor Oil Market 2020-2024: Key Highlights

  • CAGR of the market during the forecast period 2020-2024
  • Detailed information on factors that will assist compressor oil market growth during the next five years
  • Estimation of the compressor oil market size and its contribution to the parent market
  • Predictions on upcoming trends and changes in consumer behavior
  • The growth of the compressor oil market
  • Analysis of the market’s competitive landscape and detailed information on vendors
  • Comprehensive details of factors that will challenge the growth of compressor oil market vendors

Table of Contents:

Executive Summary

Market Landscape

  • Market ecosystem
  • Value chain analysis

Market Sizing

  • Market definition
  • Market segment analysis
  • Market size 2019
  • Market outlook: Forecast for 2019 - 2024

Five Forces Analysis

  • Five force summary
  • Bargaining power of buyers
  • Bargaining power of suppliers
  • Threat of new entrants
  • Threat of substitutes
  • Threat of rivalry
  • Market condition

Market Segmentation by End-user

  • Market segments
  • Comparison by End-user
  • Industrial machinery - Market size and forecast 2019-2024
  • Oil and gas - Market size and forecast 2019-2024
  • Power - Market size and forecast 2019-2024
  • Automotive - Market size and forecast 2019-2024
  • Others - Market size and forecast 2019-2024
  • Market opportunity by End-user

Customer landscape

Geographic Landscape

  • Geographic segmentation
  • Geographic comparison
  • APAC - Market size and forecast 2019-2024
  • Europe - Market size and forecast 2019-2024
  • North America - Market size and forecast 2019-2024
  • MEA - Market size and forecast 2019-2024
  • South America - Market size and forecast 2019-2024
  • Key leading countries
  • Market opportunity by geography
  • Market drivers
  • Market challenges
  • Market trends

Vendor Landscape

  • Competitive scenario
  • Vendor landscape
  • Landscape disruption
  • Industry risks

Vendor Analysis

  • Vendors covered
  • Market positioning of vendors
  • BP Plc
  • Chevron Corp.
  • China Petrochemical Corp.
  • Croda International Plc
  • Exxon Mobil Corp.
  • FUCHS PETROLUB SE
  • PJSC LUKOIL
  • Royal Dutch Shell Plc
  • Total SA
  • Valvoline Inc.

Appendix

  • Scope of the report
  • Currency conversion rates for US$
  • Research methodology
  • List of abbreviations


About Us

Technavio is a leading global technology research and advisory company. Their research and analysis focuses on emerging market trends and provides actionable insights to help businesses identify market opportunities and develop effective strategies to optimize their market positions. With over 500 specialized analysts, Technavio’s report library consists of more than 17,000 reports and counting, covering 800 technologies, spanning across 50 countries. Their client base consists of enterprises of all sizes, including more than 100 Fortune 500 companies. This growing client base relies on Technavio’s comprehensive coverage, extensive research, and actionable market insights to identify opportunities in existing and potential markets and assess their competitive positions within changing market scenarios.


Contacts

Technavio Research
Jesse Maida
Media & Marketing Executive
US: +1 844 364 1100
UK: +44 203 893 3200
Email: This email address is being protected from spambots. You need JavaScript enabled to view it.
Website: www.technavio.com/

Newly formed Standard Hydrogen Canada signs agreement to convert thousands of metric tonnes of waste daily into clean-burning hydrogen

BOCA RATON, Fla.--(BUSINESS WIRE)--#HydrogenEconomy--Standard Hydrogen Company, Inc. (www.standardh2.com), announced today it signed a joint venture agreement with EnfraWaste (www.enfrawaste.com) to create a new corporation called Standard Hydrogen Canada, Inc. As part of the agreement, Standard Hydrogen Canada will initially produce more than 140 metric tonnes of zero-emission hydrogen daily from non-recyclable plastics. Toronto-based EnfraWaste and Standard Hydrogen Company will each own 50% of the new entity, a corporation licensed to build and deploy hydrogen plants throughout Canada.


“This landmark agreement keeps massive amounts of non-recyclable plastics out of Canada’s landfills and sets the stage for a hydrogen economy in the country since the volume of hydrogen Standard Hydrogen Canada aims to produce will be enough to fuel four million cars per day,” said Alan Mintzer, Standard Hydrogen CEO. “Standard Hydrogen Canada becomes the pioneer in providing low-cost hydrogen fuel.”

Standard Hydrogen reactors produce white hydrogen--a new category offering a zero-emission, waste-to-energy (WTE) solution for the private sector, infrastructure and government. The reactors will produce hydrogen cleanly and inexpensively by turning non-recyclable plastics into pure hydrogen fuel and valuable carbon products, all without producing any greenhouse gases. This patented process has the potential to clean the land and waterways while eliminating most of the waste being dumped into landfills.

EnfraWaste helps a broad spectrum of manufacturing organizations around the globe lower costs, mitigate risks and environmental issues with WTE solutions. The company has contracts to handle non-recyclable plastics and hydrocarbons with a multinational consumer goods corporation and other companies.

The joint venture between EnfraWaste and Standard Hydrogen anticipates initially converting more than 1,000 metric tonnes of post-manufacturing plastics in southern Ontario daily, commencing in the third quarter of 2021. When the operation is at full-capacity, distributed hydrogen-conversion plants will handle more than 180,000 metric tonnes of material each day—or enough to create nearly 25 million kilograms of hydrogen fuel daily.

“This low-cost hydrogen fuel will be able to power industrial and commercial operations as well as every type of transportation without any emissions,” said Martin Vroegh, EnfraWaste Executive Director. “We are excited about this pollution-free solution to clean the planet and mine non-recyclable plastic from landfills.”

About Standard Hydrogen

Standard Hydrogen Company Inc. is an innovative, breakthrough company that developed and patented technology to economically split hydrogen sulfide derived from hydrocarbon waste into pure, hydrogen and sulfur. The company’s process requires no precious metal catalysts and requires little to no maintenance. The operation is easy, cost efficient, and most importantly, environmentally clean. For more information, visit www.standardh2.com.

About EnfraWaste

Headquartered in Toronto, Canada, EnfraWaste is a professional services firm specializing in the development, finance, ownership, and management of sustainable waste infrastructure projects with a long-term, build and hold strategy delivering secure and stable returns to its investors with a focus on North America and internationally. More information is available at www.enfrawaste.com.

#SustainableEnergy #HydrogenEconomy #WhiteHydrogen #WasteToEnergy


Contacts

SnappConner PR
Paul Murphy
This email address is being protected from spambots. You need JavaScript enabled to view it.
801-971-7247

Offshore Source Logo

Offshore Source keeps you updated with relevant information concerning the Offshore Energy Sector.

Any views or opinions represented on this website belong solely to the author and do not represent those of the people, institutions or organizations that Offshore Source or collaborators may or may not have been associated with in a professional or personal capacity, unless explicitly stated.

Corporate Offices

Technology Systems Corporation
8502 SW Kansas Ave
Stuart, FL 34997

info@tscpublishing.com