Business Wire News

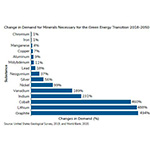
VANCOUVER, British Columbia--(BUSINESS WIRE)--$ALB #BMW--Lomiko Metals Inc. (“Lomiko”) (TSX-V: LMR, OTC: LMRMF, FSE: DH8C) is focused on the exploration and development of flake graphite in Quebec for the new green economy. Lomiko has been monitoring emerging legislation aimed at reducing dependence on Chinese supply of graphite, lithium, and other electric vehicle battery materials. The US Geological Society notes that 100% of graphite anodes are currently imported to the United States as there is no domestic graphite mines able to produce the material used in Electric Vehicles. Please also refer to Lomiko news release October 26, 2020 related to changing government policies regarding critical minerals in the USA and Canada.


Key Elements of Biden-Harris Platform on Clean Energy

The Biden administration will make a historic investment in clean energy and innovation, developing rigorous new fuel economy standards aimed at ensuring 100% of new sales for light- and medium-duty vehicles will be zero emissions and annual improvements for heavy duty vehicles;

Biden will invest $400 billion over ten years, as one part of a broad mobilization of public investment, in clean energy and innovation and aims to create 10 million jobs in the process. The funds will accelerate the deployment of clean technology throughout the US. Biden also sets a target of reducing the carbon footprint of the U.S. building stock 50% by 2035, creating incentives for deep retrofits that combine appliance electrification, efficiency, and on-site clean power generation. The new government will work with governors and mayors to support the deployment of more than 500,000 new public charging outlets by the end of 2030.

Further, the Biden campaign has privately told US miners it would support boosting domestic production of metals used to make electric vehicles, solar panels and other products crucial to his climate plan, according to three sources familiar with the matter. The President-elect also supports bipartisan efforts to foster a domestic supply chain for graphite, lithium, copper, rare earths, nickel and other strategic materials that the United States imports from China and other countries, the sources said. Biden is also well-regarded by the Canadian government on issues of mining and green energy which has a Canada-US supply strategy agreement.

Lomiko’s Opportunity in the Supply Chain

Graphite demand is expected to increase exponentially for the mined natural graphite material, as more is used in the production of spherical graphite for graphite in the anode portion of Electric Vehicle Lithium-ion batteries.

With a completion of a $ 750,000 financing October 23, 2020, Lomiko plans to work on its near-term goals of the company are as follows:

1) Complete 100% Acquisition of the Property, currently 80% owned by Lomiko Metals.

2) Complete metallurgy and graphite characterization to confirm li-ion anode grade material.

3) Complete a Technical Report to confirm the extent of the mineralization equals or surpasses the nearby Imerys Mine, owned by international mining conglomerate.

A "technical report" means a report prepared and filed in accordance with this Instrument and Form 43-101F1 Technical Report, and includes, in summary form, all material scientific and technical information in respect of the subject property as of the effective date of the technical report;

4) Complete Preliminary Economic Assessment (PEA)

A PEA means a study, other than a pre-feasibility or feasibility study, that includes an economic analysis of the potential viability of mineral resources.

For more information on Lomiko Metals, Promethieus, review the website at www.lomiko.com, and www.promethieus.com, contact A. Paul Gill at 604-729-5312 or email: This email address is being protected from spambots. You need JavaScript enabled to view it..

On Behalf of the Board

“A. Paul Gill”

Director, Chief Executive Officer

We seek safe harbor.
Neither TSX Venture Exchange nor its Regulation Services Provider (as that term is defined in the policies of the TSX Venture Exchange), accept responsibility for the adequacy or accuracy of this release.


Contacts

A. Paul Gill
604-729-5312
This email address is being protected from spambots. You need JavaScript enabled to view it.

NEW YORK & SAN JOSE, Calif.--(BUSINESS WIRE)--Today, Blackstone (NYSE: BX) announced that private equity funds managed by Blackstone Energy Partners have entered into a definitive agreement to acquire Therma Holdings LLC (“Therma”), a portfolio company of Gemspring Capital. The acquisition of Therma continues Blackstone’s support for the transition to cleaner, affordable energy.


Therma is a leading specialty mechanical, electrical and controls services company focused on designing, building, and servicing complex systems in mission-critical facilities. Therma’s 2,200 professionals and engineers deliver services that are core to improving and maintaining energy efficiency for leading companies across the technology, life sciences, healthcare and data center sectors.

Private equity funds managed by Blackstone Energy Partners are also acquiring RE Tech Advisors, Inc. (“RE Tech”), a leading energy and sustainability consulting firm. RE Tech will be integrated into Therma and the combined company will offer customers a comprehensive suite of sustainability, carbon reduction, and energy management services. RE Tech designs, administers, and tracks award-winning energy efficiency and environmental, social and governance (ESG) programs for clients – which include leading real estate investors, owners, and governments. In total, their 45+ professionals have delivered more than $200 million of utility cost reductions by implementing approximately 10,000 energy efficiency measures across 3,000+ assets. RE Tech has been working with Blackstone on portfolio company projects since 2014.

We believe an increased focus on and demand for energy efficiency and improved indoor air quality in the coming years should lead to new growth opportunities for Therma. Therma will also have the potential to help Blackstone portfolio companies meet their emissions reduction targets. Blackstone recently expanded its existing environmental sustainability efforts by setting a goal of 15% carbon emissions reduction across all new investments where it controls energy usage.

Commenting on the transaction, Bilal Khan, Senior Managing Director at Blackstone said: “We are strong believers in the continued growth of technology, healthcare and data center end-markets and look forward to partnering with the Therma and RE Tech teams on growing the business and solving the complex energy efficiency needs at mission-critical facilities across the US.”

Jeff Sprau, CEO of Therma, said “Our entire leadership team is thrilled to have the opportunity to partner with Blackstone to continue growing the Therma platform. In collaboration with Blackstone and RE Tech, we will continue providing superior service, design, and installation solutions while growing our geographic presence and expanding our offerings.”

Deb Cloutier, Founder & President of RE Tech, said: “We look forward to deepening our partnership with Blackstone as we drive progress toward its energy emissions reduction targets. Together with Therma, we’ll be in a strong position to expand our services and deliver innovative, cost-effective, and impactful energy efficiency programs to new and existing clients.”

David Foley, Global Head of Blackstone Energy Partners said: “Blackstone Energy Partners has been supporting the transition to cleaner, affordable energy through investments in critical energy infrastructure, renewable power generation, battery storage and the electric transmission grid. We also see opportunities to help companies become more efficient – consuming less energy and generating less carbon dioxide while not compromising productivity, safety and comfort. Therma and RE Tech are doing just that and can help Blackstone achieve its own recently announced goal of reducing emissions.”

Completion of the transaction, which is expected to occur in the fourth quarter of 2020, is subject to regulatory approvals and customary closing conditions.

Guggenheim Securities acted as financial advisor to Blackstone Energy Partners, while Kirkland & Ellis acted as legal advisor. Jefferies Financial Group and Lincoln International are serving as financial advisors and McDermott Will & Emery LLP is serving as legal counsel to Therma.

About Blackstone Energy Partners

Blackstone Energy Partners is Blackstone’s energy-focused private equity business, a leading energy investor with a successful long-term record, having invested over $17 billion of equity globally across a broad range of sectors within the energy industry. Our investment philosophy is based on backing exceptional management teams with flexible capital to provide solutions that help energy companies grow and improve performance, thereby delivering cleaner, more reliable and affordable energy to meet the needs of the global community. In the process, we build stronger, larger scale enterprises, create jobs and generate lasting value for our investors, employees and all stakeholders.

About Therma Holdings LLC

Therma Holdings LLC is a leading mechanical, electrical and plumbing services company focused on designing, building, and servicing custom and complex mechanical systems. Therma provides engineering, estimation, design, building information modeling, energy modeling, design-build, specialty HVAC and pipe fabrication, modular skid and process controls, pre-fabrication and installation work for owners, general contractors, and construction managers in the technology, biopharmaceutical, data center, semiconductor and other industries with complex mechanical requirements. For more information, please visit www.thermaholdings.com.

About RE Tech Advisors, Inc.

RE Tech Advisors provides advisory services to global real estate owners and investors to help them improve performance in a rapidly changing world. Operating at the intersection of sustainability, technology, and buildings, RE Tech’s seasoned professionals have decades of experience improving the operational and financial performance of real asset portfolios with over $1 trillion of assets under management. RE Tech services include program design and implementation, energy auditing, data analytics, climate change and carbon solutions, regulatory compliance, and marketing and communications. RE Tech also authored and helps run some of the world’s largest public-private partnerships, including ENERGY STAR and the Better Buildings Initiative.


Contacts

Kate Holderness
This email address is being protected from spambots. You need JavaScript enabled to view it.
917 318 6818

DUBLIN--(BUSINESS WIRE)--The "Oil Storage Market - Growth, Trends, and Forecasts (2020 - 2025)" report has been added to ResearchAndMarkets.com's offering.


The oil storage market is expected to grow at a CAGR of over 2% during the forecast period of 2020 to 2025.

Oil storage refers to tanks or terminals (a group of tanks) used to store produced oil above or below ground. Also, oil storage is a part of the midstream sector of the oil industry.

Companies Mentioned

  • Koninklijke Vopak NV
  • Vitol Tank Terminals International BV (VTTI)
  • Oiltanking GmbH
  • Buckeye Partners, L.P.
  • Shawcor Ltd.
  • Containment Solutions, Inc.

Key Market Trends

Low Crude Oil Prices to Drive the Market Demand

Decreasing crude oil prices is expected to drive the market because as the price of the oil is reduced, then the demand for oil storage is expected to increase i.e. consumer stores oil in larger volumes only when the prices are low.

  • Globally, the crude oil price in 2019 was 64.21 USD per barrel. A decline of 11% has been observed when compared to 2018 (71.31 USD per barrel).
  • Production costs influence prices, along with storage capacity; although less impactful, the direction of interest rates can also influence the price of commodities.
  • As of Sep 2019, about 50% of storage capacity is being used in Cushing, Okla. However, slowing production and pipeline network improvements are expected to reduce the chance that oil storage reaches its limits, further helping the investors shed their fears of too much supply and a rise in oil prices.
  • Therefore, based on the above-mentioned factors, low crude oil prices are expected to drive the market demand during the forecast period.

North America to Dominate the Market

In 2019, North America has an oil consumption (includes light distillates, middle distillates, fuel oil, and others) of 23536 thousand barrels per day (kb/d) i.e. a decline of 0.7% when compared to 2018 (23692 kb/d).

  • Similarly, the oil consumption for the United States can be given as 19400 kb/d as of 2019. A decline of 0.1% has been observed when compared to 2018 (19428 kb/d). The United States is expected to dominate the market in the North America region, owing to capacity additions and CAPEX on new build oil storage projects, followed by Canada.
  • Growing crude production in Canada has resulted in the complete utilization of storage and pipeline capacities. New oil storage terminals have been planned in the country to cater to the demand of the domestic oil producers.
  • The largest oil storage terminals of North America are Freeport V (United States), West Hackberry (United States), and Big Hill (United States). Also, the largest crude storage fields in the United States were Cushing, Oklahoma (82 million barrels), Louisiana Offshore Oil Port (67 million barrels), Houston, Texas (36 million barrels), etc. As the number of storage terminals or oil fields were increasing, the demand for oil storage market is expected to increase in North America during the forecast period.
  • United States crude storage facilities are falling rapidly, albeit from a low starting level, and tank space is likely to be a problem if the global oil market remains heavily oversupplied. With global lockdowns already sharply reducing demand for oil, a lack of storage would weigh further on already depressed prices, leaving producers with few financial or physical alternatives but to turn off the taps.
  • Therefore, based on the above-mentioned factors, North America is expected to dominate the oil storage market during the forecast period.

Key Topics Covered:

1 INTRODUCTION

1.1 Scope of the Study

1.2 Market Definition

1.3 Study Assumptions

2 RESEARCH METHODOLOGY

3 EXECUTIVE SUMMARY

4 MARKET OVERVIEW

4.1 Introduction

4.2 Market Size and Demand Forecast in USD billion, till 2025

4.3 Recent Trends and Developments

4.4 Government Policies and Regulations

4.5 Market Dynamics

4.5.1 Drivers

4.5.2 Restraints

4.6 Supply Chain Analysis

4.7 Porter's Five Forces Analysis

5 MARKET SEGMENTATION

5.1 Geography

5.1.1 North America

5.1.2 Asia-Pacific

5.1.3 Europe

5.1.4 South America

5.1.5 Middle-East and Africa

6 COMPETITIVE LANDSCAPE

6.1 Mergers and Acquisitions, Joint Ventures, Collaborations, and Agreements

6.2 Strategies Adopted by Leading Players

6.3 Company Profiles

6.3.1 Koninklijke Vopak NV

6.3.2 Vitol Tank Terminals International BV (VTTI)

6.3.3 Oiltanking GmbH

6.3.4 Buckeye Partners, L.P.

6.3.5 Shawcor Ltd.

6.3.6 Containment Solutions, Inc.

7 MARKET OPPORTUNITIES AND FUTURE TRENDS

For more information about this report visit https://www.researchandmarkets.com/r/k4pai3


Contacts

ResearchAndMarkets.com
Laura Wood, Senior Press Manager
This email address is being protected from spambots. You need JavaScript enabled to view it.
For E.S.T Office Hours Call 1-917-300-0470
For U.S./CAN Toll Free Call 1-800-526-8630
For GMT Office Hours Call +353-1-416-8900

Can Established and Start-Up Auto Makers Catch Up?

BOSTON--(BUSINESS WIRE)--Tesla’s market capital is now challenging the largest established auto groups, Volkswagen and Toyota. The latest report “OEM Hybrid and Electric Vehicle Strategies: Tesla Technology Leads; SPACs and Electric Vans Help Start-Ups,” from the Strategy Analytics Powertrain, Body, Safety & Chassis Service (PBCS) service, finds that this financial strength is coupled with technical prowess that leverages an established lead in EV (electric vehicle) development and is being enhanced by continued advancements in battery technology.


2020 has seen Tesla’s market capitalization growth help establish the company as the world’s largest automaker even while only serving up 367,500 vehicles, compared to second place Toyota’s sales of 10.7M vehicles. An expanding product portfolio, new assembly plants and its strategy in lowering battery cost and raising efficiency in its vehicles is helping Tesla to maintain a lead in the battery electric vehicle sector with the company’s SiC (silicon carbide) – based powertrain electronics augmented by advances in battery technology as demonstrated during the company’s Battery Day presentation in September 2020, which previewed its tabless, 4680 large format battery cell. The associated dry-coated electrode technology enables a seven-fold increase in production capacity from the same effort in existing battery cells, thus raising economies of scale even further.

“Efficiency is a key element in Tesla’s success, helping to extend driving range and making Tesla’s offerings more desirable to the consumer from a practical standpoint. These efficiencies can also reduce battery requirements allowing Tesla to be remain cost competitive,” says Kevin Mak, principal analyst in the Global Automotive Practice (GAP). “Only the Hyundai Ioniq and the Lucid Air come close to their equivalents at Tesla in efficiency. Most rivals typically lack faster switching, higher efficiency SiC-based power electronics, while we see Chinese start-ups lacking the requisite electric motor technology expertise to compete with Tesla.”

Strategy Analytics “OEM Hybrid and Electric Vehicle Strategies: Tesla Technology Leads; SPACs and Electric Vans Help Start-Ups” report provides a comprehensive review of OEM strategies in the increasingly important electrified vehicle segment, as well as discussing some of the key technology areas including battery technology, electric motors, charging infrastructure and power electronics, that will drive hybrid and battery electric vehicles into the mainstream.

About Strategy Analytics

Strategy Analytics, Inc. is a global leader in supporting companies across their planning lifecycle through a range of customized market research solutions. Our multi-discipline capabilities include: industry research advisory services, customer insights, user experience design and innovation expertise, mobile consumer on-device tracking and business-to-business consulting competencies. With domain expertise in: smart devices, connected cars, intelligent home, service providers, IoT, strategic components and media, Strategy Analytics can develop a solution to meet your specific planning need. For more information, visit us at www.strategyanalytics.com.

Source: Strategy Analytics, Inc.

#SA_Automotive

For more information about Strategy Analytics
Powertrain, Body, Chassis and Safety (PBCS) Service: Click Here


Contacts

Report contacts:
European Contact: Kevin Mak, +44 (0)1908 423 644, This email address is being protected from spambots. You need JavaScript enabled to view it.
US Contact: Edward Sanchez, +1 617 614 0717, This email address is being protected from spambots. You need JavaScript enabled to view it.
China Contact: Kevin Li, +86 186 0110 3697, This email address is being protected from spambots. You need JavaScript enabled to view it.

RICHMOND, Va.--(BUSINESS WIRE)--Synalloy Corporation (Nasdaq: SYNL), today announced its results for the third quarter of 2020. Net sales for the third quarter of 2020 totaled $59.3 million. This represents a decrease of $14.4 million or 19.5% when compared to net sales for the third quarter of 2019. Net sales for the first nine months of 2020 were $200.1 million, a decrease of $37.1 million or 15.6% from net sales for the first nine months of 2019. Excluding the curtailed Palmer operations, sales in the third quarter were $58.7 million, down 13.7% from the third quarter of 2019 and net sales for the first nine months of 2020 were $195.1 million, down 7.8% from the previous year periods.


The team has done a good job managing the factors that are within our control given the challenges presented by the COVID-19 pandemic, the proxy contest, and a business cycle trough year for our largest subsidiary, Bristol Metals,” said Craig Bram, Synalloy’s President and CEO. “I am proud of how the Company has performed so far this year.”

For the third quarter of 2020, the Company recorded a net loss of $10.5 million, or $1.16 diluted loss per share, compared to a net loss of $1.0 million, or $0.11 diluted loss per share for the third quarter of 2019. The third quarter of 2020 was negatively impacted by:

  • Non-cash goodwill impairment in our Metals Segment of $10.7 million;
  • Operating losses at Palmer totaling $0.9 million;
  • Inventory price change losses which, on a pre-tax basis, totaled $1.6 million;
  • Proxy contest costs of $0.2 million related to the Company's proxy contest and election of directors at the 2020 Annual Meeting of Shareholders; and
  • Costs related to the hotline investigation regarding the accounting for Palmer and other matters of $0.7 million, found within acquisition costs and other.

For the first nine months of 2020, the Company reported a net loss of $18.7 million, or $2.06 diluted loss per share. This compares to a net loss of $2.1 million, or $0.24 diluted loss per share for the first nine months of 2019. The first nine months of 2020 were negatively impacted by:

  • Non-cash goodwill impairment in our Metals Segment of $10.7 million;
  • Operating losses at Palmer totaling $3.6 million and $6.1 million in non-cash, pre-tax asset impairment charges;
  • Inventory price change losses, which on a pre-tax basis totaled $5.5 million, compared to a $5.7 million loss for the first nine months of 2019;
  • Proxy contest costs of $3.1 million related to the Company's proxy contest and election of directors at the 2020 Annual Meeting of Shareholders; and
  • Costs related to the hotline investigation regarding the accounting for Palmer and other matters of $0.7 million, found within acquisition costs and other.

The Company also reports its performance utilizing two non-GAAP financial measures: Adjusted Net (Loss) Income and Adjusted EBITDA. The Company's performance, as calculated under the two measures, is as follows:

  • Adjusted Net Loss for the third quarter of 2020 was $1.0 million, or $0.11 adjusted diluted loss per share compared to an Adjusted Net Loss of $0.7 million, or $0.08 adjusted diluted loss per share for the third quarter of 2019. For the first nine months of 2020, Adjusted Net Loss was $2.9 million, or $0.31 adjusted diluted loss per share, compared to an Adjusted Net Loss of $0.4 million, or $0.04 adjusted diluted loss per share for the first nine months of 2019.
  • Adjusted EBITDA decreased $1.2 million for the third quarter of 2020 to $1.6 million (2.8% of sales), from $2.8 million (3.7% of sales) for the third quarter of 2019. For the first nine months of 2020, Adjusted EBITDA was $6.2 million (3.1% of sales), compared to $10.9 million (4.6% of sales) for the first nine months of 2019.

Both the Adjusted Net Income and Adjusted EBITDA metrics for the first nine months of 2020 include add-backs of the non-cash goodwill impairment of $10.7 million, $6.1 million in non-cash asset impairment charges for the Palmer operation, $3.1 million in costs associated with the Company's proxy contest as noted above and $0.7 million in costs associated with the hotline investigation regarding the accounting for Palmer and other matters, found within acquisition costs and other. These costs were added back due to the nature of the charges as one-time charges unrelated to the ongoing operations of the Company.

The Company's results are periodically impacted by factors that are not included as adjustments to our non-GAAP measures, but which represent items that help explain differences in period to period results. As mentioned above, operating losses at Palmer totaled $0.9 million and $3.6 million for the third quarter and first nine months of 2020, respectively. Additionally results were negatively impacted by inventory price change losses which, on a pre-tax basis, totaled $1.6 million and $5.5 million for the third quarter and first nine months of 2020, respectively.

The third quarter certainly had its challenges, but looking at the core operations of the Company, there was solid improvement over the third quarter of last year. First, we had to overcome a sales decline of $9.4 million from the third quarter of last year, excluding the Palmer business. Inventory price change losses in the third quarter were up $1.0 million over last year, with most of the losses occurring in July 2020. As expected, inventory price change results in September were break-even. With current surcharges, we expect to post inventory price change profits in the fourth quarter. Expenses associated with the proxy contest and the hotline investigation regarding the accounting for Palmer and other matters combined to lower pre-tax results in the third quarter of this year by $0.9 million. In last year’s third quarter, we realized a gain from adjusting the earn-out of $1.2 million, as compared with a gain of $0.1 million in the third quarter of this year. Also in this year's third quarter, we took a $10.7 million non-cash goodwill impairment charge. Excluding the Palmer operations and taking into account the aforementioned items, we showed a $1.9 million improvement in pre-tax income over the third quarter of last year. Achieving this on a sales decline of $9.4 million, speaks to the Company’s cost cutting efforts over the past twelve months,” said Mr. Bram.

Metals Segment

The Metals Segment's net sales for the third quarter of 2020 totaled $47.1 million, a decrease of $13.0 million or 21.7% from the third quarter of 2019. Excluding the Palmer business, net sales for the third quarter of 2020 totaled $46.5 million, a decrease of $8.0 million, or 14.7%, from the same quarter last year.

Net sales for the first nine months of 2020 totaled $159.8 million, a decrease of $36.0 million, or 18.4%, from the first nine months of 2019. Excluding the Palmer business, net sales for the first nine months of 2020 totaled $154.8 million, a decrease of $15.3 million, or 9.0%, from the first nine months of 2019.

Sales of heavy wall seamless carbon pipe and tube were down 31.7% from last year’s third quarter, while pounds were down 26.1%, primarily due to decreased demand in the oil and gas sector. On a year to date basis, this product line contributed $2.8 million in Adjusted EBITDA, before corporate allocations. This was after inventory price change losses of $1.4 million.

Sales of welded pipe and tube in the third quarter of this year were down 11.8% over the third quarter of last year, while pounds were down 17.6%, primarily due to decreased levels of North American consumption of stainless steel welded pipe and tube impacting the Bristol Metals subsidiary. On a year to date basis, welded pipe and tube contributed $7.5 million in Adjusted EBITDA, before corporate allocations. This was after inventory price change losses of $4.1 million.

The backlog for our subsidiary, Bristol Metals, LLC, as of September 30, 2020, was $24.1 million, a decrease of 18.3% when compared to the same period in 2019.

For our largest subsidiary Bristol Metals, 2020 has definitely been a trough year in the business cycle. Data from the Metals Service Center Institute (MSCI) shows that North American consumption of welded stainless-steel pipe is running at an annual pace of just over 93,000 tons in 2020, down about 5% from 2019. This volume is consistent with North American consumption during the previous trough of 2015-2016. During trough years, pricing gets very aggressive as manufacturers fight for critical volume. Bristol Metals has been successful so far this year in taking market share, with an increase of 210 basis points and shipments up about 3% over last year. Profitability between peak and trough years for welded stainless steel pipe is highly volatile. In the peak year of 2018, Bristol Metals contributed Adjusted EBITDA, before corporate overhead allocations, totaling $25.1 million. This was after inventory price change gains of $3.5 million. In the current trough year, Bristol Metals has contributed Adjusted EBITDA for the same nine-month period, before corporate overhead allocations, of $3.7 million. This is after inventory price change losses of $4.5 million,” said Mr. Bram.

The Metals Segment's reported operating losses of $11.6 million for the third quarter of 2020 compared to operating income of $0.4 million for the third quarter of 2019. Excluding the Palmer business, operating losses for the third quarter of 2020 were $10.7 million as compared to operating income of $0.9 million for the same quarter last year.

For the first nine months of 2020, the Metals Segment reported operating losses of $19.8 million compared to operating income of $3.1 million for the same period of 2019. Excluding the Palmer business, operating losses were $16.2 million for the first nine months of 2020 as compared to operating income of $3.5 million for the same period of 2019.

Current quarter operating results were affected by nickel prices and resulting surcharges for 304 and 316 alloys. The third quarter of 2020 proved to be a more unfavorable environment than the third quarter of 2019, with net metal pricing losses of $1.6 million, compared to last year's $0.6 million in metal pricing losses. Net metal pricing losses for the first nine months of 2020 totaled $5.5 million, compared to $5.7 million in metal pricing losses for the same period of 2019.

In light of the decrease in the Company's market capitalization as of September 30, 2020, we concluded that a triggering event had occurred potentially indicating the fair value of certain reporting units was less than their carrying value as of September 30, 2020. Therefore, we performed a quantitative goodwill assessment as of September 30, 2020 that resulted in a non-cash goodwill impairment charge of $10.7 million in our Metals Segment.

"As some of our Metals peer group companies begin reporting their financial results for the September 30th ending quarter, it is apparent that the end markets that we serve have been challenging for everyone. Year over year sales for the quarter were down an average of 29% for our customers and down 33% for our suppliers," said Mr. Bram.

Specialty Chemicals Segment

Net sales for the Specialty Chemicals Segment in the third quarter of 2020 totaled $12.2 million, representing a $1.3 million or 9.9% decrease from the third quarter of 2019. Net sales for the first nine months of 2020 totaled $40.3 million, representing a $1.2 million, or 2.8%, decrease from the same period in 2019.

Operating income for the Specialty Chemicals Segment for the third quarter of 2020 was $1.1 million, an increase of $0.2 million from the same quarter of 2019. Operating income for the first nine months of 2020 totaled $3.5 million, an increase of $1.1 million over the same period of 2019. On a year to date basis, the Specialty Chemicals Segment contributed $5.5 million in Adjusted EBITDA, before corporate overhead allocations.

The U.S. specialty chemical industry continues to face significant downturns in demand due to weak industrial and manufacturing activities related to the COVID-19 pandemic. However, during the first nine months of 2020, the Specialty Chemicals Segment was able to demonstrate relative strength in sales by increasing production of hand sanitizer and cleaning aids to offset reduced production for the oil and gas industry. Additionally, the Specialty Chemicals Segment’s cost cutting efforts have generated a decrease in selling, general and administrative costs of $0.2 million and $0.6 million for the third quarter and first nine months of 2020, respectively. These cost cutting measures have allowed the Specialty Chemicals Segment to generate increased profits on lower sales volume.

Other Items

Unallocated corporate expenses for the third quarter of 2020 decreased $0.9 million or 35.6% to $1.5 million (2.6% of sales) compared to $2.4 million (3.2% of sales) for the same period in the prior year. The third quarter decrease resulted primarily from lower professional fees, incentive bonuses, and travel expenses in the period.

Interest expense was $0.5 million and $0.9 million for the third quarter of 2020 and 2019, respectively. The decrease was related to lower average debt outstanding in the third quarter of 2020 compared to the third quarter of 2019.

The effective tax rate was 19.4% and 10.6% for the three months ended September 30, 2020 and September 30, 2019, respectively, resulting in a tax benefit of $2.5 million and $0.1 million, respectively. The September 30, 2020 effective tax rate was approximately equal to the U.S. statutory rate of 21.0%.

The effective tax rate was 24.4% and 23.6% for the nine months ended September 30, 2020 and 2019, respectively, resulting in a tax benefit of $6.0 million and $0.7 million, respectively. The effective tax rate for the first nine months of 2020 was higher than the statutory rate of 21.0% due to the discrete treatment of costs attributable to our proxy contest, and tax benefits on our stock compensation plan and estimated tax benefits associated with the Coronavirus Aid, Relief and Economic Security Act (“CARES Act”) which was signed into law on March 27, 2020. The CARES Act includes various income and payroll tax provisions, notably enabling us to carry back net operating losses and recover taxes paid in prior years.

The Company's cash balance decreased $0.4 million to $0.2 million as of September 30, 2020 compared to $0.6 million at December 31, 2019. Fluctuations affecting cash flows during the nine months ended September 30, 2020 were comprised of the following:

a)

Net inventories decreased $9.2 million at September 30, 2020 when compared to December 31, 2019, mainly due to efforts to balance inventory with projected business levels and the write-down of inventory related to the Palmer business in the second quarter of 2020. Inventory turns increased from 1.62 turns at December 31, 2019, calculated on a three-month average basis, to 1.73 turns at September 30, 2020;

b)

Accounts payable decreased $1.6 million as of September 30, 2020 as compared to December 31, 2019, primarily due to the reduction of payables at the curtailed Palmer operations. Accounts payable days outstanding, calculated using a nine-month average basis, were approximately 30 days at September 30, 2020 and, also calculated using a nine-month average basis, approximately 36 days at December 31, 2019. Accounts payable days outstanding calculated using a three-month average basis was approximately 38 days at September 30, 2020;

c)

Net accounts receivable decreased $1.9 million at September 30, 2020 as compared to December 31, 2019, due primarily to the reduction of receivables at the curtailed Palmer operations. Days sales outstanding, calculated using a nine-month average basis, was 47 days outstanding at September 30, 2020 and, also using a nine-month average basis, 51 days at December 31, 2019. Days sales outstanding, calculated using a three-month average basis, was approximately 54 days outstanding at September 30, 2020;

d)

Capital expenditures for the first nine months of 2020 were $2.8 million; and

e)

The Company paid $3.2 million during the first nine months of 2020 related to the earn-out liabilities from the 2019 American Stainless, 2018 MUSA-Galvanized and 2017 MUSA-Stainless acquisitions.

The Company had $71.3 million of total borrowings outstanding with its lender as of September 30, 2020. The total is down $4.2 million from the balance at December 31, 2019. As of September 30, 2020, the Company had $7.5 million of remaining available capacity under its line of credit.

Pursuant to the Credit Agreement, the Company is subject to certain covenants including maintaining a minimum fixed charge coverage ratio of not less than 1.25, maintaining a minimum tangible net worth of not less than $60.0 million, and a limitation on the Company’s maximum amount of capital expenditures per year, which is in line with currently projected needs.

The Company notified its bank of a technical default of the fixed charge coverage ratio in its Credit Agreement at the quarter ended September 30, 2020. To address the technical default, the Company entered into an amendment to its Credit Agreement with its bank subsequent to the end of the third quarter. On October 23, 2020, the Company entered into the Fifth Amendment to the Third Amended and Restated Loan Agreement (the "Fifth Amendment") with its bank. The Fifth Amendment amended the definition of the fixed charge coverage ratio to include in the numerator (i) the calculation of losses from the suspended operations of Palmer in the amount of $1,560,000, which is effective for the quarter ended June 30, 2020 and for the directly following three quarters after June 30, 2020, (ii) the calculation of losses from the suspended operations of Palmer in the amount of $740,000, which is effective for the quarter ended September 30, 2020 and for the directly following three quarters after September 30, 2020, and (iii) the extraordinary expenses related to the investigation of a whistleblower complaint in the amount of $636,000, which is effective for the quarter ended September 30, 2020 and for the directly following three quarters after September 30, 2020.

At September 30, 2020, the Company had a minimum fixed charge coverage ratio of 1.47 and a minimum tangible net worth of $67.7 million.

Outlook

The manufacturing sector will continue to face challenges over the next several quarters. As a result of the uncertainty related to the COVID-19 pandemic, we have suspended all Fiscal 2020 guidance and are not providing guidance at this time. With a restart of the economy pending, we cannot predict the impact on our various businesses. We remain diligent and thoughtful in managing profitability and liquidity while navigating these unprecedented times and continuing to execute our strategy.

Synalloy Corporation (Nasdaq: SYNL) is a growth-oriented company that engages in a number of diverse business activities including the production of stainless steel and galvanized pipe and tube, the master distribution of seamless carbon pipe and tube, and the production of specialty chemicals. For more information about Synalloy Corporation, please visit our web site at www.synalloy.com.

Forward-Looking Statements

This earnings release includes and incorporates by reference "forward-looking statements" within the meaning of the federal securities laws. All statements that are not historical facts are "forward-looking statements." The words "estimate," "project," "intend," "expect," "believe," "should," "anticipate," "hope," "optimistic," "plan," "outlook," "should," "could," "may" and similar expressions identify forward-looking statements. The forward-looking statements are subject to certain risks and uncertainties, including without limitation those identified below, which could cause actual results to differ materially from historical results or those anticipated. Readers are cautioned not to place undue reliance on these forward-looking statements. The following factors could cause actual results to differ materially from historical results or those anticipated: adverse economic conditions; the impact of competitive products and pricing; product demand and acceptance risks; raw material and other increased costs; raw materials availability; employee relations; ability to maintain workforce by hiring trained employees; labor efficiencies; customer delays or difficulties in the production of products; new fracking regulations; a prolonged decrease in nickel and oil prices; unforeseen delays in completing the integrations of acquisitions; risks associated with mergers, acquisitions, dispositions and other expansion activities; financial stability of our customers; environmental issues; negative or unexpected results from tax law changes; unavailability of debt financing on acceptable terms and exposure to increased market interest rate risk; inability to comply with covenants and ratios required by our debt financing arrangements; ability to weather an economic downturn; loss of consumer or investor confidence, risks relating to the impact and spread of COVID-19 and other risks detailed from time-to-time in the Company's Securities and Exchange Commission filings. The Company assumes no obligation to update the information included in this release.

Non-GAAP Financial Information

Financial statement information included in this earnings release includes non-GAAP (Generally Accepted Accounting Principles) measures and should be read along with the accompanying tables which provide a reconciliation of non-GAAP measures to GAAP measures.

Adjusted Net (Loss) Income and Adjusted Diluted (Loss) Earnings per Share are non-GAAP measures and exclude discontinued operations, goodwill impairment, asset impairment, gain on lease modification, stock option / grant costs, non-cash lease costs, acquisition costs and other fees, proxy contest costs, shelf registration costs, earn-out adjustments, gain on excess death benefit, realized and unrealized (gains) and losses on investments in equity securities, casualty insurance gain, all (gains) losses associated with a Sale-Leaseback, and retention costs from net income. They also utilize a constant effective tax rate to reflect tax neutral results.

Adjusted EBITDA is a non-GAAP measure and excludes discontinued operations, goodwill impairment, asset impairment, gain on lease modification, interest expense (including change in fair value of interest rate swap), income taxes, depreciation, amortization, stock option / grant costs, non-cash lease cost, acquisition costs and other fees, proxy contest costs, shelf registration costs, earn-out adjustments, gain on excess death benefit, realized and unrealized (gains) and losses on investments in equity securities, casualty insurance gain, all (gains) losses associated with a Sale-Leaseback and retention costs from net income.

Management believes that these non-GAAP measures provide additional useful information to allow readers to compare the financial results between periods. Non-GAAP measures should not be considered as an alternative to any measure of performance or financial condition as promulgated under GAAP, and investors should consider the Company's performance and financial condition as reported under GAAP and all other relevant information when assessing the performance or financial condition of the Company. Non-GAAP measures have limitations as analytical tools, and investors should not consider them in isolation or as a substitute for analysis of the Company's results or financial condition as reported under GAAP.

Synalloy Corporation Comparative Analysis

Condensed Consolidated Statement of Operations


(Amounts in thousands, except per share data)

Three Months Ended
September 30,


Nine Months Ended
September 30,

(unaudited)

2020


2019


2020


2019

Net sales


Metals Segment

47,079


60,121


159,761


195,728


Specialty Chemicals Segment

12,187


13,519


40,338


41,494


$

59,266


$

73,640


$

200,099


$

237,222


Operating (loss) income


Metals Segment

(11,563

)


450


(19,784

)


3,125


Specialty Chemicals Segment

1,061


846


3,508


2,387


Unallocated expense (income)


Corporate

1,526


2,369


5,132


6,622


Acquisition costs and other

656


90


803


438


Proxy contest costs

207


3,105


Earn-out adjustments

(146

)


(1,242

)


(969

)


(1,643

)


Gain on lease modification

(171

)


(171

)


Operating (loss) income

(12,574

)


79


(24,176

)


95


Interest expense

452


944


1,703


2,977


Change in fair value of interest rate swap

(16

)


21


65


145


Other (income) expense, net

59


180


(1,244

)


(224

)


Net loss before income taxes

(13,069

)


(1,066

)


(24,700

)


(2,803

)


Income tax benefit

(2,530

)


(112

)


(6,026

)


(660

)


Net loss

$

(10,539

)


$

(954

)


$

(18,674

)


$

(2,143

)


Net loss per common share


Basic

$

(1.16

)


$

(0.11

)


$

(2.06

)


$

(0.24

)


Diluted

$

(1.16

)


$

(0.11

)


$

(2.06

)


$

(0.24

)


Average shares outstanding


Basic

9,105


8,995


9,079


8,969


Diluted

9,105


8,995


9,079


8,969


Other data:


Adjusted EBITDA (1)

1,640


2,759


6,230


10,933


Contacts

Sally Cunningham, (804) 822-3267


Read full story here

DUBAI, United Arab Emirates--(BUSINESS WIRE)--Dubai Electricity and Water Authority (DEWA) organised the Water, Energy, Technology, and Environment Exhibition (WETEX) and Dubai Solar Show virtually from 26-28 October 2020. The 3D carbon-neutral exhibition attracted 1,076 exhibitors from 52 countries, and 63,058 visitors from around the world. This is the largest number of visitors in the exhibition’s history of 22 years.


HE Saeed Mohammed Al Tayer, MD & CEO of DEWA, Founder and Chairman of WETEX and Dubai Solar Show, was pleased with the exhibition’s success.

“As per the directives of His Highness Sheikh Mohammed bin Rashid Al Maktoum, Vice President and Prime Minister of the UAE and Ruler of Dubai, to transform challenges into opportunities, we organised the exhibition this year on a 3D virtual platform. It has achieved great success, especially as the innovative platform provided an exceptional experience for exhibitors and visitors from around the world. The exhibition reflects Dubai’s commitment to supporting global efforts to increase the share of renewable energy and achieve the environmental, social and economic aspects of sustainability, as well as supporting the Dubai Clean Energy Strategy 2050, to make Dubai a global hub for clean energy and green economy,” said Al Tayer.

WETEX and Dubai Solar Show is the largest exhibition for water, energy, sustainability and innovation in the region and one of the largest specialised exhibitions worldwide. The event has proven its international status as an integrated platform for energy, water and environmental companies to promote their innovative products, services and technologies; and to meet decision-makers, investors, buyers and visitors from around the world to close deals and build partnerships, and to review the latest technologies and developments in these major sectors. The exhibition also provides an opportunity to identify market needs, current and future projects and opportunities in solar power projects in the region.

102 seminars and discussion panels

In collaboration with experts and specialists from leading local and international companies in the energy, water, technology, sustainability and environment sectors, DEWA organised 102 seminars during WETEX and Dubai Solar Show 2020. These seminars attracted a large number of participants from all over the world.

*Source: AETOSWire


Contacts

DEWA
Khuloud Al Ali, +971563974965
This email address is being protected from spambots. You need JavaScript enabled to view it.

Shaikha Almheiri, +971552288228
This email address is being protected from spambots. You need JavaScript enabled to view it.

Mohammad Almheiri, +971552725291
This email address is being protected from spambots. You need JavaScript enabled to view it.

HOUSTON--(BUSINESS WIRE)--Orion Group Holdings, Inc. (NYSE: ORN) (the "Company") a leading specialty construction company, today announced contract awards totaling approximately $52 million.


The Company’s Concrete segment has been awarded three separate contracts to provide concrete and associated paving services for projects in Texas. All three projects call for the construction of large distribution facilities, two of which are located in the Houston area and are valued at approximately $21 million and $17 million, while the third project, valued at approximately $14 million, is in the Dallas Fort Worth market. Work on all three projects is due to begin before the end of this year and is planned to be completed in the first half of 2021.

“These are the types of projects at which we excel and represent a true testament to our team and our reputation as one of the leading providers of concrete construction services in our markets,” said Mark Stauffer, Orion’s President and Chief Executive Officer.

About Orion Group Holdings

Orion Group Holdings, Inc., a leading specialty construction company serving the infrastructure, industrial and building sectors, provides services both on and off the water in the continental United States, Alaska, Canada and the Caribbean Basin through its marine segment and its concrete segment. The Company’s marine segment provides construction and dredging services relating to marine transportation facility construction, marine pipeline construction, marine environmental structures, dredging of waterways, channels and ports, environmental dredging, design, and specialty services. Its concrete segment provides turnkey concrete construction services including pour and finish, dirt work, layout, forming, rebar, and mesh across the light commercial, structural and other associated business areas. The Company is headquartered in Houston, Texas with regional offices throughout its operating areas.

Forward-Looking Statements

The matters discussed in this press release may constitute or include projections or other forward-looking statements within the meaning of the Private Securities Litigation Reform Act of 1995, the provisions of which the Company is availing itself. Certain forward-looking statements can be identified by the use of forward-looking terminology, such as 'believes', 'expects', 'may', 'will', 'could', 'should', 'seeks', 'approximately', 'intends', 'plans', 'estimates', or 'anticipates', or the negative thereof or other comparable terminology, or by discussions of strategy, plans, objectives, intentions, estimates, forecasts, outlook, assumptions, or goals. In particular, statements regarding future operations or results, including those set forth in this press release and any other statement, express or implied, concerning future operating results or the future generation of or ability to generate revenues, income, net income, profit, EBITDA, EBITDA margin, or cash flow, including to service debt, and including any estimates, forecasts or assumptions regarding future revenues or revenue growth, are forward-looking statements. Forward looking statements also include estimated project start date, anticipated revenues, and contract options which may or may not be awarded in the future. Forward looking statements involve risks, including those associated with the Company's fixed price contracts that impacts profits, unforeseen productivity delays that may alter the final profitability of the contract, cancellation of the contract by the customer for unforeseen reasons, delays or decreases in funding by the customer, levels and predictability of government funding or other governmental budgetary constraints and any potential contract options which may or may not be awarded in the future, and are the sole discretion of award by the customer. Past performance is not necessarily an indicator of future results. In light of these and other uncertainties, the inclusion of forward-looking statements in this press release should not be regarded as a representation by the Company that the Company's plans, estimates, forecasts, goals, intentions, or objectives will be achieved or realized. Readers are cautioned not to place undue reliance on these forward-looking statements, which speak only as of the date hereof. The Company assumes no obligation to update information contained in this press release whether as a result of new developments or otherwise.

Please refer to the Company’s Annual Report on Form 10-K, filed on February 28, 2020, which is available on its website at www.oriongroupholdingsinc.com or at the SEC’s website at www.sec.gov, for additional and more detailed discussion of risk factors that could cause actual results to differ materially from our current expectations, estimates or forecasts.


Contacts

Orion Group Holdings Inc.
Francis Okoniewski, Vice President Investor Relations
(346) 616-4138
This email address is being protected from spambots. You need JavaScript enabled to view it.
www.oriongroupholdingsinc.com

Robert Tabb, Vice President & CFO
(713) 852-6500
www.oriongroupholdingsinc.com

Shape strategic responses through the phases of industry recovery

Baker Hughes Co., Berkshire Hathaway Inc., and Cabot Microelectronics Corp. will emerge as major drag reducing agent market participants during 2020-2024

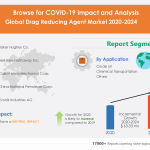
LONDON--(BUSINESS WIRE)--#DragReducingAgentMarket20202024--The drag reducing agent market is expected to grow by USD 63.33 million during 2020-2024, according to Technavio. The report offers a detailed analysis of the impact of the COVID-19 pandemic on the drag reducing agent market in optimistic, probable, and pessimistic forecast scenarios.


Enterprises will go through Response, Recovery, and Renew phases. Download a Free Sample Report on COVID-19

The drag reducing agent market will witness a neutral impact during the forecast period owing to the widespread growth of the COVID-19 pandemic. As per Technavio’s pandemic-focused market research, market growth is likely to increase as compared to 2019.

With the continuing spread of the novel coronavirus pandemic, organizations across the globe are gradually flattening their recessionary curve by leveraging technology. Many businesses will go through response, recovery, and renewal phases. Building business resilience and enabling agility will aid organizations to move forward in their journey out of the COVID-19 crisis towards the Next Normal.

This post-pandemic business planning research will aid clients to:

  • Adjust their strategic planning to move ahead once business stability kicks in.
  • Build Resilience by making effective resource and investment choices for individual business units, products, and service lines.
  • Conceptualize scenario-based planning to mitigate future crisis situations.

Download the Post-Pandemic Business Planning Structure. Click here

Key Considerations for Market Forecast:

  • Impact of lockdowns, supply chain disruptions, demand destruction, and change in customer behavior
  • Optimistic, probable, and pessimistic scenarios for all markets as the impact of pandemic unfolds
  • Pre- as well as post-COVID-19 market estimates
  • Quarterly impact analysis and updates on market estimates

Gain instant access to 17,000+ market research reports by using

Technavio's SUBSCRIPTION platform

Major Three Drag Reducing Agent Market Participants:

Baker Hughes Co.

Baker Hughes Co. operates its business through segments such as Oilfield Services, Oilfield Equipment, Turbomachinery & Process Solutions, and Digital Solutions. The company offers FLO drag reducing agents to decrease frictional pressure loss to throughput and debottleneck pipelines restricted by operating pressure limits.

Berkshire Hathaway Inc.

Berkshire Hathaway Inc. operates its business through segments such as Manufacturing, McLane Company, Service and Retail, BNSF, and Berkshire Hathaway Energy. The company offers a line of flow improver products such as LiquidPower, ExtremePower, and RefinedPower through its subsidiary LiquidPower Specialty Products Inc., to reduce frictional pressure loss during fluid flow in a pipeline.

Cabot Microelectronics Corp.

Cabot Microelectronics Corp. operates its business through segments such as Electronic Materials and Performance Materials. The company offers a line of products such as TURBOFLO that reduce turbulence and frictional pressure losses in the pipeline networks, through its subsidiary Flowchem LLC.

If you purchase a report that is updated in the next 60 days, we will send you the new edition and data extract FREE! Get report snapshot here to get detailed market share analysis of market participants during COVID-19 lockdown: https://www.technvaio.com/report/drag-reducing-agent-market-industry-analysis

Drag Reducing Agent Market 2020-2024: Segmentation

Drag reducing agent market is segmented as below:

  • Application
    • Crude Oil
    • Chemical Transportation
    • Others
  • Geography
    • North America
    • MEA
    • APAC
    • Europe
    • South America

The drag reducing agent market is driven by increasing applications in the oil and gas industry. In addition, other factors such as Friction resistance and other excellent properties are expected to trigger the drag reducing agent market toward witnessing a CAGR of over about 5% during the forecast period.

Get more insights about the global trends impacting the future of drag reducing agent market, Request Free Sample @ https://www.technavio.com/talk-to-us?report=IRTNTR44199

Market Drivers

Market Challenges

Market Trends

Vendor Landscape

  • Vendors covered
  • Vendor classification
  • Market positioning of vendors
  • Competitive scenario

About Us

Technavio is a leading global technology research and advisory company. Their research and analysis focuses on emerging market trends and provides actionable insights to help businesses identify market opportunities and develop effective strategies to optimize their market positions. With over 500 specialized analysts, Technavio’s report library consists of more than 17,000 reports and counting, covering 800 technologies, spanning across 50 countries. Their client base consists of enterprises of all sizes, including more than 100 Fortune 500 companies. This growing client base relies on Technavio’s comprehensive coverage, extensive research, and actionable market insights to identify opportunities in existing and potential markets and assess their competitive positions within changing market scenarios.


Contacts

Technavio Research
Jesse Maida
Media & Marketing Executive
US: +1 844 364 1100
UK: +44 203 893 3200
Email: This email address is being protected from spambots. You need JavaScript enabled to view it.
Website: www.technavio.com/

HAMILTON, Bermuda--(BUSINESS WIRE)--November 9, 2020 – Triton International Limited (NYSE: TRTN) ("Triton") today will host a virtual investor day during which members of the executive team will provide investors and analysts with an overview of Triton’s operating and financial performance, competitive advantages and outlook, followed by a Q&A session.


During the event, the Company will discuss:

  • The sharp rebound in global trade that is driving outstanding current performance;

  • Triton’s long track record of outperformance in terms of earnings, return on equity and total shareholder return;

  • Triton’s strong cash flow and disciplined approach to capital allocation which enables consistent value creation through long-term asset growth, robust dividends and share repurchases;

  • Key competitive advantages, including scale, capability and cost leadership, that drive superior performance; and

  • Attractive market fundamentals and trends underlying Triton’s positive outlook.

Triton also is updating its financial outlook for the fourth quarter of 2020. Triton now expects its Adjusted earnings per share (“Adjusted EPS”) to increase 25% or more from the third to the fourth quarter of 2020.

The event will begin at 10:30 a.m. ET today with a live video webcast accessible by visiting the Investors section of Triton’s website at www.trtn.com. Please allow extra time prior to the start of the event to download any necessary software that may be needed to view the webcast. Presentation materials are available on the website and an archived replay will be available on the website shortly after the event concludes.

About Triton International Limited

Triton International Limited is the world’s largest lessor of intermodal freight containers. With a container fleet of 6.1 million twenty-foot equivalent units ("TEU"), Triton’s global operations include acquisition, leasing, re-leasing and subsequent sale of multiple types of intermodal containers and chassis.

Cautionary Statement Regarding Forward-Looking Statements

Certain statements in this release, other than purely historical information, are "forward-looking statements" within the meaning of Section 27A of the Securities Act of 1933, as amended, and Section 21E of the Securities Exchange Act of 1934, as amended. Statements that include the words "expect," "intend," "plan," "believe," "project," "anticipate," "will," "may," "would" and similar statements of a future or forward-looking nature may be used to identify forward-looking statements. All forward-looking statements address matters that involve risks and uncertainties, many of which are beyond Triton's control. Accordingly, there are or will be important factors that could cause actual results to differ materially from those indicated in such statements and, therefore, you should not place undue reliance on any such statements. These factors include, without limitation, economic, business, competitive, market and regulatory conditions and the following: the impact of COVID-19 on Triton’s business and financial results; decreases in the demand for leased containers; decreases in market leasing rates for containers; difficulties in re-leasing containers after their initial fixed-term leases; our customers' decisions to buy rather than lease containers; our dependence on a limited number of customers for a substantial portion of our revenues; customer defaults; decreases in the selling prices of used containers; extensive competition in the container leasing industry; difficulties stemming from the international nature of our business; decreases in the demand for international trade; disruption to our operations resulting from the political and economic policies of the United States and other countries, particularly China, including but not limited to the impact of trade wars and tariffs; disruption to our operations from failures of, or attacks on, our information technology systems; disruption to our operations as a result of natural disasters; our compliance or failure to comply with laws and regulations related to economic and trade sanctions, security, anti-terrorism, environmental protection and corruption; our ability to obtain sufficient capital to support our growth; restrictions imposed by the terms of our debt agreements; changes in tax laws in, Bermuda, the United States and other countries and other risks and uncertainties, including those described in Triton’s periodic reports on file with the Securities and Exchange Commission. Except to the extent required by applicable law, we undertake no obligation to update publicly or revise any forward-looking statement, whether as a result of new information, future developments or otherwise.

Non-GAAP Financial Measures

To supplement its reporting of financial measures determined in accordance with GAAP, Triton utilizes certain non-GAAP financial measures in this press release, including Adjusted EPS. Adjusted EPS is adjusted for certain items management believes are not representative of our operating performance, including debt termination expenses net of tax, unrealized gains and losses on derivative instruments net of tax, and foreign and other income tax adjustments,. This information is provided only on a non-GAAP basis without a reconciliation of these measures to the mostly directly comparable GAAP measure due to the inherent difficulty in forecasting and quantifying certain amounts that are necessary for such reconciliation. These items depend on highly variable factors, many of which may not be in our control, and which could vary significantly from future GAAP financial results. Non-GAAP financial measures should not be considered as alternatives to, or more meaningful than, financial measures prepared in accordance with GAAP. In addition, the non-GAAP financial measures included in this press release may not be comparable to similarly titled measures reported by other companies.


Contacts

Andrew Greenberg
Senior Vice President
Business Development & Investor Relations
(914) 697-2900

LONDON--(BUSINESS WIRE)--#digitaltwin--The global digital twins for industrial facilities market will grow from $787 million in 2020 to $27.6 billion in 2040 according to a new study from independent research firm Verdantix. The forecasted compound annual growth rate of 19.5% will be driven by operational excellence strategies, enterprise risk initiatives, and cost-cutting programmes. Vendors positioned to benefit from this growth include digital twin solution providers such as Autodesk, Bentley Systems, Cognite, DNV GL, GE Digital, and Siemens as well as services firms like Arcadis, Golder, Kongsberg Digital, and Worley.


“As expected, concerns around the COVID-19 pandemic have accelerated implementation of remote working solutions.” commented Sebastian Winter, Verdantix Industry Analyst. “Digital twins for industrial facilities provide the basis of a number of remote working use cases that help with business continuity as well as safety of operations, such as remote communication between managers and frontline workers using 3D simulations and giving frontline workers better access to granular asset and equipment data.”

The Verdantix report, Market Size And Forecast: Digital Twins For Industrial Facilities 2020 - 2040, provides digital twin solution providers, systems integration services firms, and financial investors with the information they need to take advantage of the market opportunity. The model breaks down market size and forecast trends across 16 industry segments specified by asset classes and 10 geographic regions. In 2020, Infrastructure accounts for 17% of the market with spend of $130m, onshore oil and gas production accounts for 12% of the market with spend of $91m, while manufacturing plants will hit $85 million and Power generation: fossil fuels will hit $42 million.

“The 20-year CAGR of 19.5% reflects two periods growth” continued Winter. “In the next 10-years the market will reach $6.5 billion following current trends. Then from 2030 to 2040 market growth will explode making total spend reach $27.6 billion in 2040, as widespread adoption of the underlying technologies required for more sophisticated twins – enterprise asset management software, APM software, and IoT platforms, to name a few – gathers pace. This in turn significantly drives an increase in spend per customer, creating a second era of growth for the market.”

Register for our webinar on November 18 to get a full overview of the digital twins for industrial facilities market.


Contacts

Isobel Calisse
+44(0)203-371-6782
This email address is being protected from spambots. You need JavaScript enabled to view it.

One of the World’s Largest Shipping Lines Deploys 8x8 Cloud Communications, Contact Center and Voice for Microsoft Teams Solution Across 155 Countries

CAMPBELL, Calif.--(BUSINESS WIRE)--#APIs--8x8, Inc. (NYSE: EGHT), a leading integrated cloud communications platform provider, today announced that MSC Mediterranean Shipping Company, a global leader in transportation and logistics, has selected 8x8 to transform its global communications, collaboration and customer engagement infrastructure onto a single cloud platform, deploying the 8x8 Open Communications Platform™, including 8x8 Voice for Microsoft Teams, internationally across more than 155 countries and 493 locations.


MSC is one of the world’s largest shipping lines in terms of container vessel capacity with more than 70,000 employees around the globe. Following a period of significant business growth and expansion of its international footprint, the company harmonized its approach to systems and software, streamlining IT management and minimizing costs. MSC employees have increasingly relied on Microsoft Teams for communication and collaboration, prompting the company to ensure its telephony capabilities ensure the global reach and ease of management required for an enterprise-grade voice solution.

As part of this streamlining process, MSC selected the 8x8 Open Communications Platform, an integrated cloud voice, team chat, meetings and contact center solution. It also deployed 8x8 Voice for Microsoft Teams, an easy-to-administer global telephony direct routing solution that keeps the Microsoft Teams experience unchanged for end users while delivering worldwide phone connectivity. Employees are now able to connect and collaborate seamlessly using Microsoft Teams with global calling, superior voice quality and advanced telephony features from 8x8.

“As one of the world’s leading container shipping lines, streamlining our communications on to a single cloud platform has transformed our business operations, increasing IT efficiency through improved communication across all our offices around the world," said Fabio Catassi, Global Chief Technology Officer at MSC Mediterranean Shipping Company. “In addition to providing 15,000 employees with a single, global telephony solution they can use directly from any Microsoft Teams interface, including desktop and mobile apps, we will also deploy 8x8 Contact Center for over 2,000 call center agents.”

After moving their very large contact center to the cloud, MSC agents will be able to collaborate internally while offering an omnichannel experience for customers. Combined with 8x8’s centralized administration portal, global deployment, and reporting and analytics capabilities, MSC will be able to save significant time and resources as it shifts to one global system for customer engagement.

"Global organizations recognize the critical role cloud communications have in accelerating business performance and growth, especially as the digital workplace for a remote and mobile workforce has become a top corporate imperative,” said Vik Verma, Chief Executive Officer at 8x8, Inc. “Enterprises of the scale and stature such as MSC Mediterranean Shipping Company are driving success by adopting a single, global open communications platform that provides mix-and-match capabilities and seamless integration with Microsoft Teams. We look forward to continuing to support their global digital transformation journey as they ensure employees and customers stay connected and productive from anywhere.”

About MSC

MSC Mediterranean Shipping Company is a privately-owned global shipping company founded in 1970 by Gianluigi Aponte. As one of the world’s leading container shipping lines, MSC operates 493 offices across 155 countries worldwide with over 70,000 employees. With access to an integrated network of road, rail and sea transport resources which stretches across the globe, the company prides itself on delivering global service with local knowledge. MSC’s shipping line sails on more than 200 trade routes, calling at over 500 ports.

For more information, please visit msc.com, find us on LinkedIn, or follow us @MSCCargo on Twitter or Instagram.

About 8x8, Inc.

8x8, Inc. (NYSE: EGHT) is transforming the future of business communications as a leading Software-as-a-Service provider of voice, video, chat, contact center, and enterprise-class API solutions powered by one global cloud communications platform. 8x8 empowers workforces worldwide to connect individuals and teams so they can collaborate faster and work smarter. Real-time business analytics and intelligence provide businesses unique insights across all interactions and channels so they can delight end-customers and accelerate their business. For additional information, visit www.8x8.com, or follow 8x8 on LinkedIn, Twitter and Facebook.

8x8® and 8x8 X Series™ are trademarks of 8x8, Inc.


Contacts

8x8, Inc. Contacts:

US Media:
John Sun, 1-408-692-7054
This email address is being protected from spambots. You need JavaScript enabled to view it.

UK Media:
Bee Hindocha, 44 (0)20 8059 9230
This email address is being protected from spambots. You need JavaScript enabled to view it.

Investor Relations:
Victoria Hyde-Dunn, 1-669-333-5200
This email address is being protected from spambots. You need JavaScript enabled to view it.

MADISON, Wis.--(BUSINESS WIRE)--MGE Energy, Inc. (Nasdaq: MGEE) today issued its third-quarter 2020 financial update presentation.


The update is available on MGE Energy's website at:

mgeenergy.com/financialupdate

About MGE Energy

MGE Energy is an investor-owned public utility holding company headquartered in the state capital of Madison, Wis. It is the parent company of Madison Gas and Electric, which generates and distributes electricity in Dane County, Wis., and purchases and distributes natural gas in seven south-central and western Wisconsin counties. MGE Energy's assets total approximately $2 billion, and its 2019 revenues were approximately $569 million.


Contacts

Investor relations contact
Ken Frassetto
Director - Shareholder Services and Treasury Management
608-252-4723 | This email address is being protected from spambots. You need JavaScript enabled to view it.

DUBLIN--(BUSINESS WIRE)--The "Shale Oil Market - Growth, Trends, and Forecasts (2020 - 2025)" report has been added to ResearchAndMarkets.com's offering.


The Shale oil market is expected to grow at a CAGR of more than 2% over the period of 2020-2025.

Factors such as an increase in consumption of oil and rising growth in the oil dependent industries are expected to drive the market. However, volatility in the oil market with prices going below the shale oil production cost acts as a restraint to the market.

Companies Mentioned

  • Exxon Mobil Corporation
  • Chevron Corporation
  • ConocoPhillips Company
  • Royal Dutch Shell PLC
  • Continental Resources Inc
  • Murphy Oil Corporation
  • Occidental Petroleum Corporation
  • Marathon Oil Corporation
  • Schlumberger Limited
  • Halliburton Company

Key Market Trends

Growing Petrochemicals Industry to Drive the Market

Many countries have large reserves of shale oil deposits which may be used by to decrease their dependency on imports of oil to suffice the needs of the petrochemical industry in the country. This aids the growth of shale oil industry in the nation by providing an incentive to invest in shale oil production.

  • Moreover, the share of shale oil in transportation and power generation has been reducing due to better and cleaner alternatives replacing it in the market. However, in the petrochemical segment it is the most important chemical, without which synthesizing of the required compounds would be much difficult.
  • Several world-scale projects are currently following a path of configuring a refinery to produce maximum volumes of chemicals, instead of transportation fuels as in a conventional refinery. Facilities under construction in China such as Shenghong Petrochemical Group's planned refining and petrochemical facility in Jiangsu Province, China, with a planned oil refining capacity of 16 Million tons per year. The refinery is expected to fully start by 2021. The demand for the shale oil is expected to depend upon its non-energy applications, in the forecast period.
  • As of 2019, Reliance Industries Ltd (RIL) plans to invest INR 700 Billion for setting up crude-to-chemical projects adjacent to the existing Jamnagar site, an integrated petroleum refinery and petrochemical complex, as part of its oil-to-chemical strategy. It is expected to be among the foremost full crude-to-chemical plant in the world and increase the production of petrochemicals by reducing the generation of petrol and diesel. Large scale investments like these are expected to increase the demand of shale oil in the forecast period.
  • The petrochemical industry is expected to increase significantly in the forecast period due to increasing uses of petrochemical products, introduction of innovative processes like direct crude cracking and increasing investments into the sector are expected to grow the market. Growth in the petrochemical industry is expected to increase the consumption of shale oil thereby aiding the growth of shale oil market.

North America?to Dominate the Market

The United States, in 2019, was the largest producer of shale oil in the world. Many different countries such as Brazil, Canada, China, and Argentina have tried to emulate the American shale boom but have not been able to succeed. However, large progress has been made in China but due to the difficulties posed by the unstable reservoirs, the shale oil production may only rise slightly in the forecast period.

  • The Permian basin is the largest source of shale oil in the United States with Spraberry (TX Permian) field being the most productive shale oil field. In April 2020, the field produced 1.757 million barrels per day, from 1.532 million barrels per day, April 2019.
  • The shale oil production in the United States increased, by 13.87%, from 7.956 million barrels per day (mbpd) in 2019 to 6.986 mbpd in 2018. Shale oil production may increase further due to new wells being drilled across the country.
  • Canada's production of shale oil in the country was approximately 335,000 barrels a day, in 2018. Multinational companies are expected to invest in the market and the production is expected to increase in the forecast period.
  • Hence, North America is expected to dominate the market due to overwhelming production of shale on the continent and further increase in the investment in the sector.

Key Topics Covered:

1 INTRODUCTION

2 RESEARCH METHODOLOGY

3 EXECUTIVE SUMMARY

4 MARKET OVERVIEW

4.1 Introduction

4.2 Shale Oil Production and Forecast, in million barrels per day, till 2025

4.3 Recent Trends and Developments

4.4 Government Policies and Regulations

4.5 Market Dynamics

4.5.1 Drivers

4.5.2 Restraints

4.6 Supply Chain Analysis

4.7 Porter's Five Forces Analysis

5 MARKET SEGMENTATION

5.1 Geography

5.1.1 North America

5.1.2 South America

5.1.3 Europe

5.1.4 Asia-Pacific

5.1.5 Middle-East and Africa

6 COMPETITIVE LANDSCAPE

6.1 Mergers and Acquisitions, Joint Ventures, Collaborations, and Agreements

6.2 Strategies Adopted by Leading Players

6.3 Company Profiles

7 MARKET OPPORTUNITIES AND FUTURE TRENDS

For more information about this report visit https://www.researchandmarkets.com/r/13rjqz


Contacts

ResearchAndMarkets.com
Laura Wood, Senior Press Manager
This email address is being protected from spambots. You need JavaScript enabled to view it.
For E.S.T Office Hours Call 1-917-300-0470
For U.S./CAN Toll Free Call 1-800-526-8630
For GMT Office Hours Call +353-1-416-8900

DALLAS--(BUSINESS WIRE)--Flowserve Corporation (NYSE: FLS), a leading provider of flow control products and services for the global infrastructure markets, today announced that Scott Rowe, president and chief executive officer, will present virtually at the Baird 2020 Global Industrial Conference on November 10, 2020, at 12:15-12:45 p.m. EST.


A webcast of Mr. Rowe’s presentation will be available for shareholders and other interested parties at www.flowserve.com under the “Investor Relations” section.

About Flowserve: Flowserve Corp. is one of the world’s leading providers of fluid motion and control products and services. Operating in more than 55 countries, the company produces engineered and industrial pumps, seals and valves as well as a range of related flow management services. More information about Flowserve can be obtained by visiting the company’s Web site at www.flowserve.com.

Safe Harbor Statement: This news release includes forward-looking statements within the meaning of Section 27A of the Securities Act of 1933 and Section 21E of the Securities Exchange Act of 1934, which are made pursuant to the safe harbor provisions of the Private Securities Litigation Reform Act of 1995, as amended. Words or phrases such as "may," "should," "expects," "could," "intends," "plans," "anticipates," "estimates," "believes," "forecasts," "predicts" or other similar expressions are intended to identify forward-looking statements, which include, without limitation, earnings forecasts, statements relating to our business strategy and statements of expectations, beliefs, future plans and strategies and anticipated developments concerning our industry, business, operations and financial performance and condition.

The forward-looking statements included in this news release are based on our current expectations, projections, estimates and assumptions. These statements are only predictions, not guarantees. Such forward-looking statements are subject to numerous risks and uncertainties that are difficult to predict. These risks and uncertainties may cause actual results to differ materially from what is forecast in such forward-looking statements, and include, without limitation, the following: the impact of the global outbreak of COVID-19 on our business and operations; a portion of our bookings may not lead to completed sales, and our ability to convert bookings into revenues at acceptable profit margins; changes in global economic conditions and the potential for unexpected cancellations or delays of customer orders in our reported backlog; our dependence on our customers’ ability to make required capital investment and maintenance expenditures; if we are not able to successfully execute and realize the expected financial benefits from our strategic transformation and realignment initiatives, our business could be adversely affected; risks associated with cost overruns on fixed-fee projects and in taking customer orders for large complex custom engineered products; the substantial dependence of our sales on the success of the oil and gas, chemical, power generation and water management industries; the adverse impact of volatile raw materials prices on our products and operating margins; economic, political and other risks associated with our international operations, including military actions, trade embargoes, epidemics or pandemics or changes to tariffs or trade agreements that could affect customer markets, particularly North African, Russian and Middle Eastern markets and global oil and gas producers, and non-compliance with U.S. export/re-export control, foreign corrupt practice laws, economic sanctions and import laws and regulations; increased aging and slower collection of receivables, particularly in Latin America and other emerging markets; our exposure to fluctuations in foreign currency exchange rates, including in hyperinflationary countries such as Venezuela and Argentina; our furnishing of products and services to nuclear power plant facilities and other critical processes; potential adverse consequences resulting from litigation to which we are a party, such as litigation involving asbestos-containing material claims; expectations regarding acquisitions and the integration of acquired businesses; our relative geographical profitability and its impact on our utilization of deferred tax assets, including foreign tax credits; the potential adverse impact of an impairment in the carrying value of goodwill or other intangible assets; our dependence upon third-party suppliers whose failure to perform timely could adversely affect our business operations; the highly competitive nature of the markets in which we operate; environmental compliance costs and liabilities; potential work stoppages and other labor matters; access to public and private sources of debt financing; our inability to protect our intellectual property in the U.S., as well as in foreign countries; obligations under our defined benefit pension plans; our internal control over financial reporting may not prevent or detect misstatements because of its inherent limitations, including the possibility of human error, the circumvention or overriding of controls, or fraud; the recording of increased deferred tax asset valuation allowances in the future or the impact of tax law changes on such deferred tax assets could affect our operating results; our information technology infrastructure could be subject to service interruptions, data corruption, cyber-based attacks or network security breaches, which could disrupt our business operations and result in the loss of critical and confidential information; ineffective internal controls could impact the accuracy and timely reporting of our business and financial results; and other factors described from time to time in our filings with the Securities and Exchange Commission.

All forward-looking statements included in this news release are based on information available to us on the date hereof, and we assume no obligation to update any forward-looking statement.


Contacts

Investor Contacts:
Jay Roueche, Vice President, Investor Relations & Treasurer, (972) 443-6560
Mike Mullin, Director, Investor Relations, (972) 443-6636

Media Contact:
Lars Rosene, Vice President, Corporate Communications & Public Affairs, (972) 443-6644

FRAMINGHAM, Mass.--(BUSINESS WIRE)--#efficiency--Ameresco, Inc. (NYSE:AMRC), a leading energy efficiency and renewable energy company, today announced that members of its management team will attend the following investor conferences:


  • On Thursday, November 12, 2020, Ameresco’s Senior Vice President and Chief Financial Officer, Doran Hole, will present at the Baird’s 2020 Global Industrial Conference at 4:20 PM ET. Ameresco’s management will also host virtual investor meetings throughout the day.
  • On Tuesday, November 17, 2020, Ameresco’s Chairman, President and Chief Executive Officer, George Sakellaris, as well as Senior Vice President and Chief Financial Officer, Doran Hole, will participate in the 11th Annual Craig-Hallum Alpha Select Conference virtually. The format of the conference is one-on-one meetings only.

About Ameresco, Inc.

Founded in 2000, Ameresco, Inc. (NYSE:AMRC) is a leading independent provider of comprehensive services, energy efficiency, infrastructure upgrades, asset sustainability and renewable energy solutions for businesses and organizations throughout North America and Europe. Ameresco’s sustainability services include upgrades to a facility’s energy infrastructure and the development, construction and operation of renewable energy plants. Ameresco has successfully completed energy saving, environmentally responsible projects with Federal, state and local governments, healthcare and educational institutions, housing authorities, and commercial and industrial customers. With its corporate headquarters in Framingham, MA, Ameresco has more than 1,000 employees providing local expertise in the United States, Canada, and the United Kingdom. For more information, visit www.ameresco.com.


Contacts

Media:
Ameresco: Leila Dillon, 508.661.2264, This email address is being protected from spambots. You need JavaScript enabled to view it.
Investor Relations: Eric Prouty, AdvisIRy Partners, 212.750.5800, This email address is being protected from spambots. You need JavaScript enabled to view it.
Lynn Morgen, AdvisIRy Partners, 212.750.5800, This email address is being protected from spambots. You need JavaScript enabled to view it.

HOUSTON--(BUSINESS WIRE)--Helix Energy Solutions Group, Inc. (NYSE: HLX) announced today that it will participate in the Bank of America 2020 Virtual Global Energy Conference on Wednesday, November 11, 2020.


Any investor presentation provided during the virtual conference will be publicly available and may be accessed on the “For the Investor” page of Helix’s website, www.HelixESG.com.

About Helix

Helix Energy Solutions Group, Inc., headquartered in Houston, Texas, is an international offshore energy services company that provides specialty services to the offshore energy industry, with a focus on well intervention and robotics operations. For more information about Helix, please visit our website at www.HelixESG.com.


Contacts

Erik Staffeldt
Executive Vice President & CFO
281-618-0465
This email address is being protected from spambots. You need JavaScript enabled to view it.

New solution enables forecourt and backcourt mobile payment options for c-store customers

ATLANTA--(BUSINESS WIRE)--PDI (www.pdisoftware.com), a global provider of ERP, fuel pricing, supply chain logistics, and marketing cloud solutions for the convenience retail and petroleum wholesale industries, today announced they are working with NCR Corporation to provide a mobile payment solution to convenience retailers.


Touch-free payment is becoming the preferred method for consumers during the COVID-19 outbreak. This integration allows convenience retailers with the latest NCR point-of-sale (POS) to use PDI’s mobile payment capabilities for payment methods such as Visa, Mastercard, Venmo, PayPal, or ACH. PDI recently added payments to its Marketing Cloud Solutions offering after acquiring ZipLine, the industry leader for ACH payment and provider of mobile payment technology. The new solution can be used to process mobile payments inside a convenience store or at the pump.

“PDI has a history of providing fit-for-purpose solutions that enable convenience retailers to deliver better experiences for their customers,” said Brian Jefferson, senior vice president and general manager, Retail, Marketing Cloud Solutions at PDI. “Our partnership with NCR is another important milestone as we continue to offer convenient and safe ways for consumers to fuel up and shop during this time.”

About PDI

Professional Datasolutions, Inc. (PDI) helps convenience retailers and petroleum wholesalers thrive through digital transformation and enterprise software that enables them to grow topline revenue, optimize operations and unify their business across the entire value chain. Over 1,500 customers in more than 200,000 locations worldwide count on our leading ERP, logistics, fuel pricing and marketing cloud solutions to provide insights that increase volume, margin and customer loyalty. PDI owns and operates the Fuel Rewards® loyalty program that is consistently ranked as a top-performing fuel savings program year after year. For more than 35 years, our comprehensive suite of solutions and unmatched expertise have helped customers of any size reimagine their enterprise and deliver exceptional customer experiences. For more information about PDI, visit www.pdisoftware.com.


Contacts

Cederick Johnson, PDI
+1 254.410.7600 I This email address is being protected from spambots. You need JavaScript enabled to view it.

LONDON--(BUSINESS WIRE)--#GasTurbinesMarketforPowerIndustry--The new gas turbines market for power industry research from Technavio indicates negative growth in the short term as the business impact of COVID-19 spreads.


Get detailed insights on the COVID-19 pandemic Crisis and Recovery analysis of the gas turbines market for power industry. Download free report sample

"One of the primary growth drivers for this market is the increase in CCGT power plants,” says a senior analyst for the Industrials industry at Technavio. "The demand for combined-cycle gas turbines for power plants is on the rise due to increased efficiency and better output. Also, the introduction of the US government’s Clean Power Plan will further propagate a shift from simple-cycle to combined-cycle plants, which have lower carbon dioxide (CO2) emissions. This is because meeting the new performance standards for CO2 emissions will be difficult with simple cycle plants. Many upcoming projects for the construction of power plants have propelled the demand for CCGT. As the markets recover Technavio expects the gas turbines market for power industry size to grow by USD 1.65 billion during the period 2020-2024."

Gas Turbines Market for Power Industry Segment Highlights for 2020

  • The gas turbines market for power industry is expected to post a year-over-year growth rate of 0.86%.
  • The CCGTs segment led the gas turbines market share for power industry in 2019.
  • The CCGTs segment is mainly driven by the increasing demand for energy-efficient gas turbines and due to the replacement of coal-fired power plants. CCGT consists of both gas turbines and steam turbines. In this system, the natural gas is the primary fuel, which powers the gas turbines to generate electricity.
  • The gas turbines market share growth for the power industry by the CCGTs segment will be significant during the forecast period.

Regional Analysis

  • 56% of the growth will originate from the APAC region.
  • China, Japan, and India are the key markets for Gas Turbines Market for Power Industry in APAC. Market growth in this region will be slower than the growth of the market in other regions.

Click here to learn about report detailed analysis and insights on how you can leverage them to grow your business.

Notes:

  • The gas turbines market for power industry size is expected to accelerate at a CAGR of almost 2% during the forecast period.
  • The gas turbines market for power industry is segmented Technology (CCGT and OCGT) and Geography (APAC, North America, Europe, MEA, and South America).
  • The market is fragmented due to the presence of many established vendors holding significant market share.
  • The research report offers information on several market vendors, including Ansaldo Energia Spa, Bharat Heavy Electricals Ltd., Capstone Turbine Corp., Caterpillar Inc., General Electric Co., IHI Corp., Kawasaki Heavy Industries Ltd., Mitsubishi Heavy Industries Ltd., OPRA Turbines, and Siemens AG.

Register for a free trial today to access 17,000+ market research reports using Technavio's SUBSCRIPTION platform

About Us

Technavio is a leading global technology research and advisory company. Their research and analysis focuses on emerging market trends and provides actionable insights to help businesses identify market opportunities and develop effective strategies to optimize their market positions. With over 500 specialized analysts, Technavio’s report library consists of more than 17,000 reports and counting, covering 800 technologies, spanning across 50 countries. Their client base consists of enterprises of all sizes, including more than 100 Fortune 500 companies. This growing client base relies on Technavio’s comprehensive coverage, extensive research, and actionable market insights to identify opportunities in existing and potential markets and assess their competitive positions within changing market scenarios.


Contacts

Technavio Research
Jesse Maida
Media & Marketing Executive
US: +1 844 364 1100
UK: +44 203 893 3200
Email: This email address is being protected from spambots. You need JavaScript enabled to view it.
Website: www.technavio.com/

Program Will Integrate Detect™ 1000 With X-ray Diffraction Technology

BOXBOROUGH, Mass.--(BUSINESS WIRE)--#IDSS--Integrated Defense and Security Solutions (IDSS) has been awarded the first phase of a contract in support of the Department of Homeland Security (DHS) Science and Technology Directorate (S&T) to integrate its award-winning DETECT™ 1000 computed tomography (CT) scanner with Halo X-ray Technologies, Ltd.’s X-ray Diffraction (XRD) technology, which is intended to enhance detection capability and reduce false alarm rates of airport and narcotics checkpoint scanning systems. This enhancement has the potential to benefit both passengers and Transportation Security Officers (TSOs), providing for quicker returns of bags while reducing the potential need for hand searches, an essential safety measure to minimize exposure to COVID-19.


This integration will, if successful, also create important new enhancements for screening narcotics in international mail. As the winner of the DHS Opioid Challenge – a collaborative effort with the Department of Homeland Security (DHS) Science and Technology Directorate (S&T) and U.S. Customs and Border Protection (CBP), the United States Postal Inspection Service (USPIS) and the Office of National Drug Control Policy (ONDCP) – IDSS is currently collaborating with CBP for the development of Artificial Intelligence (AI) algorithms to detect narcotics in international mail using the DETECT™ 1000 and XRD integrated system. The addition of X-ray Diffraction technology to the CBP mail inspection process has the potential to aid in the prompt resolution of false alarms, increasing the number of possible packages that may be scanned each day while reducing labor costs associated with manual inspections.

“IDSS thanks S&T for the opportunity to further develop the detection and image resolution capability of the DETECT™ 1000 and for the opportunity to work on this important forward-thinking program,” said Jeffrey Hamel, CEO of IDSS. He continued, “Through the integration of technologies from two Opioid Detection Challenge finalists, IDSS and its partner Halo X-ray Technologies, Ltd will demonstrate the efficiencies that a certified CT system combined with XRD will bring to airport screening operations and CBP mail inspection.”

Simon Godber, CEO of HALO X-ray Technologies Ltd said, “We are grateful to S&T for their additional funding of our X-ray Diffraction technology and look forward to our partnership with IDSS on this potentially game-changing screening solution, that may dramatically improve passenger wait times at checkpoints and increase efficiency of the passenger screening process.”

Integrated Defense and Security Solutions is a small business security technology manufacturer based in Boxborough, Massachusetts. The company was founded in 2012 by a team of security experts with the goal of developing security solutions to address current and future threats to aviation. The DETECT™ 1000 has received certification by the Transportation Security Administration (TSA) and the European Civil Aviation Conference (ECAC) for explosives detection.


Contacts

Sissy Pressnell, IDSS
202-365-2476
This email address is being protected from spambots. You need JavaScript enabled to view it.

SAN ANTONIO--(BUSINESS WIRE)--NuStar Energy L.P. (NYSE: NS) announced today that Brad Barron, President and Chief Executive Officer; Tom Shoaf, Executive Vice President and Chief Financial Officer; Danny Oliver, Executive Vice President of Business Development & Engineering; Amy Perry, Executive Vice President of Strategic Development; Pam Schmidt, Vice President of Investor Relations, and other members of management will participate in virtual meetings with members of the investment community at the BofA Securities 2020 Virtual Global Energy Conference on Wednesday, November 11, 2020. The materials to be discussed in the meetings will be available on the partnership’s website at 10:00 a.m. Eastern Time, Wednesday, November 11, 2020.


NuStar Energy L.P., a publicly traded master limited partnership based in San Antonio, is one of the largest independent liquids terminal and pipeline operators in the nation. NuStar currently has approximately 10,000 miles of pipeline and 75 terminal and storage facilities that store and distribute crude oil, refined products and specialty liquids. The partnership’s combined system has approximately 75 million barrels of storage capacity, and the partnership has operations in the United States, Canada and Mexico. For more information, visit NuStar Energy L.P.’s website at www.nustarenergy.com.


Contacts

NuStar Energy, L.P., San Antonio
Investors, Tim Delagarza, Manager, Investor Relations
Investor Relations: 210-918-INVR (4687)
or
Media, Mary Rose Brown, Executive Vice President and Chief Administrative Officer,
Corporate Communications: 210-918-2314
website: http://www.nustarenergy.com

Offshore Source Logo

Offshore Source keeps you updated with relevant information concerning the Offshore Energy Sector.

Any views or opinions represented on this website belong solely to the author and do not represent those of the people, institutions or organizations that Offshore Source or collaborators may or may not have been associated with in a professional or personal capacity, unless explicitly stated.

Corporate Offices

Technology Systems Corporation
8502 SW Kansas Ave
Stuart, FL 34997

info@tscpublishing.com