Business Wire News

HOUSTON--(BUSINESS WIRE)--Tidewater Inc. (NYSE:TDW) announced today revenue for the three and nine months ended September 30, 2020, of $86.5 million and $305.2 million, respectively compared with $119.8 million and $367.8 million, respectively, for the three and nine months ended September 30, 2019. Tidewater also reported net losses for the three and nine months ended September 30, 2020, of $37.9 million ($0.94 per share) and $167.0 million ($4.15 per share), respectively, compared with $44.2 million ($1.15 per share) and $81.9 million ($2.17 per share), respectively, for the three and nine months ended September 30, 2019. Included in the net losses for the three and nine months ended September 30, 2020 were impairment charges related to assets held for sale, affiliate credit losses, affiliate guaranteed obligation, inventory obsolescence and general and administrative severance expenses totaling $2.6 million and $124.4 million, respectively. Excluding these costs, we would have reported a net loss for the three months ended September 30, 2020 of $35.3 million ($0.87 per common share) and a net loss for the nine months ended September 30, 2020 of $42.6 million ($1.06 per common share). Included in the net losses for the three and nine months ended September 30, 2019 were general and administrative expenses for severance and similar expenses related to integrating Tidewater and GulfMark operations of $6.3 million and $10.5 million, respectively. Excluding these costs, net losses for the three and nine months ended September 30, 2019 were $37.9 million (or $0.98 per common share) and $71.4 million (or $1.89 per common share), respectively.


Quintin Kneen, Tidewater’s President and Chief Executive Officer, commented, "Tidewater generated $30.0 million of free cash flow in the third-quarter, its best quarterly performance since its restructuring in 2017. That cash was used to repurchase $27.7 million of our outstanding bonds at 95% of par, and we completed the quarter with $33.7 million of net debt. We recently launched a tender for another $50.0 million of the bonds at 100.5% of par, and we simultaneously launched a consent to relax the financial covenants in 2021.

“We are executing on the plan we laid out on the first quarter call after reassessing our business outlook as a result of the pandemic. As of the third quarter we were positive cash flow from operations and free cash flow positive for the nine-month period. We are dedicated to remaining free cash flow positive for the year, and we are repositioning our shore base operations and our fleet so our business can remain free cash flow positive under the currently depressed market conditions.

“Our quarterly cash generation performance is both important and noteworthy, but the operational impact of the pandemic and overall lower market demand have been both severe and challenging. The Tidewater team has dedicated to our objectives of capital expenditure management, working capital management, and the restructure of our business to accommodate the lower level of demand around the world for our vessels.

“Domestic and international travel restrictions have started to ease in some regions, and as a result we have been able to improve the frequency of crew changes and allow our mariners to return home safely to their families and to more easily return to work. The situation remains far from solved, however, and we continue to urge global government coordination to support open travel for seafarers as designated key workers. For 2020, we continue to see the additional costs associated with managing the travel inefficiencies to be approximately $20.0 million, and this is in addition to the decreased level of profitability from lower overall demand.

“Another key element to our strategy is high-grading our fleet through strategic acquisitions and disposals. We disposed of 22 vessels in the third quarter for $10.6 million and early in the fourth quarter we made an acquisition of 11 modern crew boats for $5.3 million.

“I continue to be humbled by the commitment and resilience of the dedicated women and men across the company during these arduous times. These individuals are who enabled the company to so readily adapt and to progress as much as it has towards achieving its goals in today’s challenging environment.”

In addition to the number of outstanding shares, as of September 30, 2020, the company also has the following in the money warrants.

Common shares outstanding


40,460,982


New Creditor Warrants (strike price $0.001 per common share)


761,395


GulfMark Creditor Warrants (strike price $0.01 per common share)


930,027


Total


42,152,404


Tidewater will hold a conference call to discuss results for the three and nine months ended September 30, 2020 on Friday, November 6, at 8:00 a.m. Central Time. Investors and interested parties may listen to the earnings conference call via telephone by calling +1-888-771-4371 if calling from the U.S. or Canada (+1-847-585-4405 if calling from outside the U.S.) and asking for the “Tidewater” call just prior to the scheduled start time. A live webcast of the call will also be available in the Investor Relations section of Tidewater’s website at investor.tdw.com.

A replay of the conference call will be available beginning at 10:30 a.m. Central Time on November 6, 2020 and will continue until 11:59 p.m. Central Time on December 6, 2020. To access the replay, visit the Investor Relations section of Tidewater’s website at investor.tdw.com.

The conference call will contain forward-looking statements in addition to statements of historical fact. The actual achievement of any forecasted results or the unfolding of future economic or business developments in a way anticipated or projected by the company involves numerous risks and uncertainties that may cause the company’s actual performance to be materially different from that stated or implied in the forward-looking statements. Such risks and uncertainties include, among other things, risks associated with the general nature of the oilfield service industry and other factors discussed within the “Risk Factors” section of Tidewater’s most recent Forms 10-Q and 10-K.

Tidewater owns and operates the largest fleet of Offshore Support Vessels in the industry, with over 60 years of experience supporting offshore energy exploration and production activities worldwide.

Note: all per-share amounts are stated on a diluted basis.

Financial information is displayed beginning on the next page.


TIDEWATER INC.
CONDENSED CONSOLIDATED STATEMENTS OF OPERATIONS
(In thousands, except per share data)


Three Months Ended


Nine Months Ended


September 30, 2020


September 30, 2019


September 30, 2020


September 30, 2019


Revenues:


Vessel revenues


$

85,395


$

117,173


$

298,344


$

360,476


Other operating revenues


1,072


2,592


6,835


7,296


Total revenues


86,467


119,765


305,179


367,772


Costs and expenses:


Vessel operating costs


61,784


80,619


205,383


243,261


Costs of other operating revenue


219


534


3,063


1,884


General and administrative


17,438


30,474


56,455


81,310


Depreciation and amortization


30,777


25,735


86,028


73,705


Long-lived asset impairments


1,945


5,224


67,634


5,224


Affiliate credit loss impairment expense


53,581


Affiliate guarantee obligation


2,000


(Gain) loss on asset dispositions, net


(520

)


(270

)


(7,511

)


(1,047

)


111,643


142,316


466,633


404,337


Operating loss


(25,176

)


(22,551

)


(161,454

)


(36,565

)

Other income (expense):


Foreign exchange gain (loss)


(1,153

)


173


(2,365

)


(324

)

Equity in net losses of unconsolidated companies


(468

)


(435

)

Dividend income from unconsolidated company


17,150


Interest income and other, net


272


1,579


1,084


5,908


Interest and other debt costs, net


(6,071

)


(7,468

)


(18,172

)


(22,786

)


(6,952

)


(6,184

)


(2,303

)


(17,637

)

Loss before income taxes


(32,128

)


(28,735

)


(163,757

)


(54,202

)

Income tax (benefit) expense


5,953


15,071


3,512


26,443


Net loss


$

(38,081

)


$

(43,806

)


$

(167,269

)


$

(80,645

)

Net income (loss) attributable to noncontrolling interests


(154

)


394


(274

)


1,245


Net loss attributable to Tidewater Inc.


$

(37,927

)


$

(44,200

)


$

(166,995

)


$

(81,890

)

Basic loss per common share


$

(0.94

)


$

(1.15

)


$

(4.15

)


$

(2.17

)

Diluted loss per common share


$

(0.94

)


$

(1.15

)


$

(4.15

)


$

(2.17

)

Weighted average common shares outstanding


40,405


38,537


40,271


37,767


Adjusted weighted average common shares


40,405


38,537


40,271


37,767


TIDEWATER INC.
CONDENSED CONSOLIDATED BALANCE SHEETS
(In thousands, except share and par value data)


September 30,


December 31,


ASSETS


2020


2019


Current assets:


Cash and cash equivalents


$

192,243


$

218,290


Restricted cash


26,401


5,755


Trade and other receivables, less allowance for credit losses of $651 as of September 30, 2020 and less allowance for doubtful accounts of $70 as of December 31, 2019.


100,583


110,180


Due from affiliate, less allowance for credit losses of $72,696 as of September 30, 2020 and less due from affiliate allowance of $20,083 as of December 31, 2019


65,692


125,972


Marine operating supplies


17,808


21,856


Assets held for sale


19,163


39,287


Prepaid expenses and other current assets


18,925


15,956


Total current assets


440,815


537,296


Net properties and equipment


820,876


938,961


Deferred drydocking and survey costs


63,975


66,936


Other assets


25,108


36,335


Total assets


$

1,350,774


$

1,579,528


LIABILITIES AND EQUITY


Current liabilities:


Accounts payable


$

12,953


$

27,501


Accrued costs and expenses


55,811


74,000


Due to affiliates


53,355


50,186


Current portion of long-term debt


9,576


9,890


Other current liabilities


31,599


24,100


Total current liabilities


163,294


185,677


Long-term debt


246,179


279,044


Other liabilities and deferred credits


87,724


98,397


Equity:


Common stock


40


40


Additional paid-in-capital


1,370,778


1,367,521


Accumulated deficit


(519,684

)


(352,526

)

Accumulated other comprehensive income (loss)


1,106


(236

)

Total stockholder's equity


852,240


1,014,799


Noncontrolling interests


1,337


1,611


Total equity


853,577


1,016,410


Total liabilities and equity


$

1,350,774


$

1,579,528


TIDEWATER INC.
CONDENSED CONSOLIDATED STATEMENTS OF COMPREHENSIVE LOSS
(In thousands)


Three Months Ended


Nine Months Ended


September 30, 2020


September 30, 2019


September 30, 2020


September 30, 2019


Net loss


$

(38,081

)


$

(43,806

)


$

(167,269

)


$

(80,645

)

Other comprehensive income:


Change in pension plan and supplemental pension plan liability, net of tax of $0.2 million and $0.4 million, respectively


525


1,342


Total comprehensive loss


$

(37,556

)


$

(43,806

)


$

(165,927

)


$

(80,645

)


TIDEWATER INC.
CONDENSED CONSOLIDATED STATEMENTS OF CASH FLOWS
(In thousands)


Nine Months


Nine Months


Ended


Ended


September 30, 2020


September 30, 2019


Operating activities:


Net loss


$

(167,269

)


$

(80,645

)

Adjustments to reconcile net loss to net cash provided by (used in) operating activities:


Depreciation


53,614


57,629


Amortization of deferred drydocking and survey costs


32,414


16,076


Amortization of debt premiums and discounts


2,418


(1,562

)

Provision (benefit) for deferred income taxes


107


759


Gain on asset dispositions, net


(7,511

)


(1,047

)

Affiliate credit loss impairment expense


53,581


Affiliate guarantee obligation


2,000


Long-lived asset impairments


67,634


5,224


Changes in investments in unconsolidated companies


435


Compensation expense - stock based


3,959


16,599


Changes in operating assets and liabilities, net:


Trade and other receivables


9,434


(11,796

)

Changes in due to/from affiliate, net


9,852


14,898


Accounts payable


(14,548

)


(8,267

)

Accrued costs and expenses


(18,189

)


(10,574

)

Cash paid for deferred drydocking and survey costs


(29,499

)


(43,701

)

Other, net


3,809


9,268


Net cash used in operating activities


1,806


(36,704

)

Cash flows from investing activities:


Proceeds from sales of assets


31,498


25,092


Additions to property and equipment


(4,682

)


(13,931

)

Net cash provided by investing activities


26,816


11,161


Cash flows from financing activities:


Principal payments on long-term debt


(33,520

)


(6,458

)

Taxes on share-based awards


(702

)


(3,112

)

Other


1


Net cash used in financing activities


(34,222

)


(9,569

)

Net change in cash, cash equivalents and restricted cash


(5,600

)


(35,112

)

Cash, cash equivalents and restricted cash at beginning of period


227,608


397,744


Cash, cash equivalents and restricted cash at end of period (A)


$

222,008


$

362,632


Supplemental disclosure of cash flow information:


Cash paid during the period for:


Interest, net of amounts capitalized


$

16,169


$

24,482


Income taxes


$

9,940


$

10,386


Note (A):  Cash, cash equivalents and restricted cash at September 30, 2020 includes $3.4 million in long-term restricted cash.


TIDEWATER INC.
CONDENSED CONSOLIDATED STATEMENTS OF EQUITY
(In thousands)


Three Months Ended


Accumulated


Additional


other


Non


Common


paid-in


Accumulated


comprehensive


controlling


stock


capital


deficit


income (loss)


interest


Total


Balance at June 30,2020


$

40


1,369,645


(481,757

)


581


1,491


890,000


Total comprehensive loss


(37,927

)


525


(154

)


(37,556

)

Amortization, net of taxes, on share-based awards


1,133


1,133


Balance at September 30, 2020


$

40


1,370,778


(519,684

)


1,106


1,337


853,577


Balance at June 30, 2019


$

38


1,359,842


(248,473

)


2,194


1,938


1,115,539


Total comprehensive loss


(44,200

)


394


(43,806

)

Issuance of common stock from exercise of warrants


1


(1

)


Amortization/cancellation of restricted stock units


6,031


6,031


Balance at September 30, 2019


$

39


1,365,872


(292,673

)


2,194


2,332


1,077,764


Nine Months Ended


Accumulated


Additional


other


Non


Common


paid-in


Accumulated


comprehensive


controlling


stock


capital


deficit


income (loss)


interest


Total


Balance at December 31, 2019


$

40


1,367,521


(352,526

)


(236

)


1,611


1,016,410


Total comprehensive loss


(166,995

)


1,342


(274

)


(165,927

)

Adoption of credit loss accounting standard


(163

)


(163

)

Amortization, net of taxes, on share-based awards


3,257


3,257


Balance at September 30, 2020


$

40


1,370,778


(519,684

)


1,106


1,337


853,577


Balance at December 31, 2018


$

37


1,352,388


(210,783

)


2,194


1,087


1,144,923


Total comprehensive loss


(81,890

)


1,245


(80,645

)

Issuance of common stock from exercise of warrants


2


2


Amortization/cancellation of restricted stock units


13,484


13,484


Balance at September 30, 2019


$

39


1,365,872


(292,673

)


2,194


2,332


1,077,764


The company’s vessel revenues and vessel operating costs and the related percentage of total vessel revenues, were as follows:


Three Months Ended


Nine Months Ended


September 30, 2020


September 30, 2019


September 30, 2020


September 30, 2019


(In thousands)


%


%


%


%


Vessel revenues:


Americas


$

28,705


34

%


$

33,147


28

%


$

94,608


32

%


$

103,624


29

%

Middle East/Asia Pacific


23,280


27

%


22,765


19

%


72,091


24

%


63,670


18

%

Europe/Mediterranean


17,716


21

%


30,946


26

%


67,827


23

%


94,531


26

%

West Africa


15,694


18

%


30,315


26

%


63,818


21

%


98,651


27

%

Total vessel revenues


$

85,395


100

%


$

117,173


100

%


$

298,344


100

%


$

360,476


100

%

Vessel operating costs:


Crew costs


$

36,686


43

%


$

46,193


39

%


$

119,864


40

%


$

141,528


39

%

Repair and maintenance


5,932


7

%


11,967


10

%


23,186


8

%


32,579


9

%

Insurance


1,953


2

%


2,027


2

%


5,748


2

%


4,955


1

%

Fuel, lube and supplies


6,757


8

%


8,781


7

%


22,892


8

%


26,577


7

%

Other


10,456


12

%


11,651


10

%


33,693


11

%


37,622


10

%

Total vessel operating costs


61,784


72

%


80,619


69

%


205,383


69

%


243,261


67

%

Vessel operating margin (A)


$

23,611


28

%


$

36,554


31

%


$

92,961


31

%


$

117,215


33

%


Note (A):  Vessel operating margin equals revenues less vessel operating costs and excludes general and administrative expenses and depreciation and amortization.


The company’s operating loss and other components of loss before income taxes and its related percentage of total revenues, were as follows:


Three Months Ended


Nine Months Ended


September 30, 2020


September 30, 2019


September 30, 2020


September 30, 2019


(In thousands)


%


%


%


%

Vessel operating profit (loss):


Americas


$

107


0

%


$

(168

)


(0

)%


$

3,448


1

%


$

1,702


0

%

Middle East/Asia Pacific


(2,222

)


(3

)%


(809

)


(1

)%


(2,479

)


(1

)%


(4,098

)


(1

)%

Europe/Mediterranean


(3,883

)


(4

)%


(276

)


(0

)%


(4,086

)


(1

)%


(768

)


(0

)%

West Africa


(10,168

)


(12

)%


678


1

%


(19,015

)


(6

)%


11,891


3

%

Other operating profit


853


1

%


2,052


2

%


3,772


1

%


5,381


1

%


(15,313

)


(18

)%


1,477


1

%


(18,360

)


(6

)%


14,108


4

%


Corporate expenses (A)


(8,438

)


(10

)%


(19,074

)


(16

)%


(27,390

)


(9

)%


(46,496

)


(13

)%

Gain (loss) on asset dispositions, net


520


1

%


270


0

%


7,511


2

%


1,047


1

%

Affiliate credit loss impairment expense


0

%


0

%


(53,581

)


(18

)%


0

%

Affiliate guarantee obligation


0

%


0

%


(2,000

)


(1

)%


0

%

Long-lived asset impairments


(1,945

)


(2

)%


(5,224

)


(4

)%


(67,634

)


(22

)%


(5,224

)


(1

)%

Operating loss


$

(25,176

)


(29

)%


$

(22,551

)


(19

)%


$

(161,454

)


(53

)%


$

(36,565

)


(9

)%


Note (A):  General and administrative expenses for the three and nine months ended September 30, 2020 include stock-based compensation of $1.3 million and $4.0 million, respectively. General and administrative expenses for the three and nine months ended September 30, 2019 includes stock-based compensation of $7.4 million and $16.6 million, respectively. In addition, general and administrative costs for the three months and nine ended September 30, 2020 include $0.6 million and $1.2 million, respectively, of severance and similar costs related to integrating Tidewater and GulfMark operations. General and administrative expenses for the three and nine months ended September 30, 2019 include $6.3 million and $10.5 million, respectively, of severance and other costs related to integrating Tidewater and GulfMark operations.


TIDEWATER INC.
CONSOLIDATED STATEMENTS OF EARNINGS (LOSS) – QUARTERLY DATA
(Unaudited)
(In thousands, except per share data)


Three Months Ended


September 30,


June 30,


March 31,


December 31,


September 30,


2020


2020


2020


2019


2019


Revenues:


Vessel revenues


$

85,395


$

100,975


$

111,974


$

116,539


$

117,173


Other operating revenues


1,072


1,369


4,394


2,237


2,592


Total revenues


86,467


102,344


116,368


118,776


119,765


Costs and expenses:


Vessel operating costs


61,784


64,774


78,825


85,935


80,619


Costs of other operating revenue


219


171


2,673


916


534


General and administrative (A)


17,438


17,597


21,420


22,406


30,474


Depreciation and amortization


30,777


28,144


27,107


28,226


25,735


(Gain) loss on asset dispositions, net


1,945


(1,660

)


(5,331

)


(1,217

)


(270

)

Affiliate credit loss impairment expense


53,581


Affiliate guarantee obligation


2,000


Asset impairments and other


(520

)


55,482


10,207


32,549


5,224


Total operating costs and expenses


111,643


220,089


134,901


168,815


142,316


Operating loss


(25,176

)


(117,745

)


(18,533

)


(50,039

)


(22,551

)

Other income (expense):


Foreign exchange gain (loss)


(1,153

)


(2,076

)


864


(945

)


173


Equity in net (losses) earnings of unconsolidated companies


(2,717

)


(468

)

Dividend income from unconsolidated company


17,150


Interest income and other, net


272


696


116


690


1,579


Interest and other debt costs, net


(6,071

)


(5,959

)


(6,142

)


(6,282

)


(7,468

)

Total other expense


(6,952

)


9,811


(5,162

)


(9,254

)


(6,184

)

Loss before income taxes


(32,128

)


(107,934

)


(23,695

)


(59,293

)


(28,735

)

Income tax (benefit) expense


5,953


2,730


(5,171

)


1,281


15,071


Net loss


$

(38,081

)


$

(110,664

)


$

(18,524

)


$

(60,574

)


$

(43,806

)

Net income (loss) attributable to noncontrolling interests


(154

)


(41

)


(79

)


(721

)


394


Net loss attributable to Tidewater Inc.


$

(37,927

)


$

(110,623

)


$

(18,445

)


$

(59,853

)


$

(44,200

)

Basic loss per common share


$

(0.94

)


$

(2.74

)


$

(0.46

)


$

(1.52

)


$

(1.15

)

Diluted loss per common share


$

(0.94

)


$

(2.74

)


$

(0.46

)


$

(1.52

)


$

(1.15

)

Weighted average common shares outstanding


40,405


40,306


40,101


39,504


38,537


Dilutive effect of stock options and restricted stock


Adjusted weighted average common shares


40,405


40,306


40,101


39,504


38,537


Vessel operating margin


$

23,611


$

36,201


$

33,149


$

30,604


$

36,554


Note (A) Integration related costs related to the business combination with GulfMark


641


446


129


2,123


6,293


TIDEWATER INC.
CONDENSED CONSOLIDATED BALANCE SHEETS
(Unaudited)
(In thousands) 


September 30,


June 30,


March 31,


December 31,


September 30,


ASSETS


2020


2020


2020


2019


2019


Current assets:


Cash and cash equivalents


$

192,243


203,119


187,802


218,290


359,332


Restricted cash


26,401


19,880


12,461


5,755


3,300


Trade and other receivables, net


100,583


115,008


119,455


110,180


123,133


Due from affiliate, less allowances


65,692


65,766


128,204


125,972


124,757


Marine operating supplies


17,808


20,580


21,944


21,856


21,303


Assets held for sale


19,163


29,064


26,142


39,287


Prepaid expenses and other current assets


18,925


20,350


22,185


15,956


13,116


Total current assets


440,815


473,767


518,193


537,296


644,941


Net properties and equipment


820,876


839,912


922,979


938,961


1,022,786


Deferred drydocking and survey costs


63,975


74,585


81,981


66,936


49,025


Other assets


25,108


27,411


29,971


36,335


37,269


Total assets


$

1,350,774


1,415,675


1,553,124


1,579,528


1,754,021


LIABILITIES AND EQUITY


Current liabilities:


Accounts payable


$

12,953


17,111


30,711


27,501


23,672


Accrued costs and expenses


55,811


60,993


72,854


74,000


54,792


Due to affiliates


53,355


48,803


50,013


50,186


41,676


Current portion of long-term debt


9,576


9,437


9,104


9,890


9,689


Other current liabilities


31,599


25,815


26,953


24,100


30,024


Total current liabilities


163,294


162,159


189,635


185,677


159,853


Long-term debt


246,179


273,215


273,015


279,044


419,905


Other liabilities and deferred credits


87,724


90,301


91,578


98,397


96,499


Equity:


Common stock


40


40


40


40


39


Additional paid-in-capital


1,370,778


1,369,645


1,368,325


1,367,521


1,365,872


Accumulated deficit


(519,684

)


(481,757

)


(371,134

)


(352,526

)


(292,673

)

Accumulated other comprehensive income (loss)


1,106


581


133


(236

)


2,194


Total stockholder's equity


852,240


888,509


997,364


1,014,799


1,075,432


Noncontrolling interests


1,337


1,491


1,532


1,611


2,332


Total equity


853,577


890,000


998,896


1,016,410


1,077,764


Total liabilities and equity


$

1,350,774


1,415,675


1,553,124


1,579,528


1,754,021


Supplemental information


Due from related parties, net of due to related parties:


Sonatide (Angola)


$

12,337


16,963


64,184


57,771


64,660


DTDW (Nigeria)


14,007


18,015


18,421


Total


$

12,337


16,963


78,191


75,786


83,081


Contacts

Tidewater Inc.
Jason Stanley
Vice President Investor Relations and ESG
+1.713.470.5292

SOURCE: Tidewater Inc.


Read full story here

LONDON--(BUSINESS WIRE)--#FuelCellCommercialVehicleMarket--Technavio has been monitoring the fuel cell commercial vehicle market and it is poised to grow by 20.14 th units during 2020-2024, progressing at a CAGR of about 45% during the forecast period. The report offers an up-to-date analysis regarding the current market scenario, latest trends and drivers, and the overall market environment.


Technavio suggests three forecast scenarios (optimistic, probable, and pessimistic) considering the impact of COVID-19. Please request Latest Free Sample Report on COVID-19 Impact

The market is fragmented, and the degree of fragmentation will accelerate during the forecast period. AB Volvo, Ashok Leyland Ltd., CNH Industrial NV, Daimler AG, Hyundai Motor Co., Nikola Corp., PACCAR Inc., Tata Motors Ltd., Toyota Motor Corporation, and Volkswagen AG are some of the major market participants. Although the awareness about the benefits of green energy vehicles will offer immense growth opportunities, shortage of hydrogen fuel stations will challenge the growth of the market participants. To make the most of the opportunities, market vendors should focus more on the growth prospects in the fast-growing segments, while maintaining their positions in the slow-growing segments.

Fuel Cell Commercial Vehicle Market 2020-2024 : Segmentation

Fuel Cell Commercial Vehicle Market is segmented as below:

  • Type
    • MCVs And HCVs
    • LCVs
  • Geography
    • APAC
    • North America
    • Europe
    • MEA
    • South America

To learn more about the global trends impacting the future of market research, download a free sample: https://www.technavio.com/talk-to-us?report=IRTNTR44815

Fuel Cell Commercial Vehicle Market 2020-2024 : Scope

Technavio presents a detailed picture of the market by the way of study, synthesis, and summation of data from multiple sources. Our fuel cell commercial vehicle market report covers the following areas:

  • Fuel Cell Commercial Vehicle Market size
  • Fuel Cell Commercial Vehicle Market trends
  • Fuel Cell Commercial Vehicle Market industry analysis

This study identifies a growing focus toward the development of ethanol-based fuel cell technology as one of the prime reasons driving the fuel cell commercial vehicle market growth during the next few years.

Fuel Cell Commercial Vehicle Market 2020-2024 : Vendor Analysis

We provide a detailed analysis of around 25 vendors operating in the fuel cell commercial vehicle market, including some of the vendors such as AB Volvo, Ashok Leyland Ltd., CNH Industrial NV, Daimler AG, Hyundai Motor Co., Nikola Corp., PACCAR Inc., Tata Motors Ltd., Toyota Motor Corporation, and Volkswagen AG. Backed with competitive intelligence and benchmarking, our research reports on the fuel cell commercial vehicle market are designed to provide entry support, customer profile and M&As as well as go-to-market strategy support.

Register for a free trial today and gain instant access to 17,000+ market research reports.

Technavio's SUBSCRIPTION platform

Fuel Cell Commercial Vehicle Market 2020-2024 : Key Highlights

  • CAGR of the market during the forecast period 2020-2024
  • Detailed information on factors that will assist fuel cell commercial vehicle market growth during the next five years
  • Estimation of the fuel cell commercial vehicle market size and its contribution to the parent market
  • Predictions on upcoming trends and changes in consumer behavior
  • The growth of the fuel cell commercial vehicle market
  • Analysis of the market’s competitive landscape and detailed information on vendors
  • Comprehensive details of factors that will challenge the growth of fuel cell commercial vehicle market vendors

Table Of Contents :

Executive Summary

Market Landscape

  • Market ecosystem
  • Value chain analysis

Market Sizing

  • Market definition
  • Market segment analysis
  • Market size 2019
  • Market outlook: Forecast for 2019-2024

Five Forces Analysis

  • Five forces summary
  • Bargaining power of buyers
  • Bargaining power of suppliers
  • Threat of new entrants
  • Threat of substitutes
  • Threat of rivalry
  • Market condition

Market Segmentation by Type

  • Market segments
  • Comparison by Type
  • MCVs and HCVs - Market size and forecast 2019-2024
  • LCVs - Market size and forecast 2019-2024
  • Market opportunity by Type

Customer Landscape

Geographic Landscape

  • Geographic segmentation
  • Geographic comparison
  • APAC - Market size and forecast 2019-2024
  • North America - Market size and forecast 2019-2024
  • Europe - Market size and forecast 2019-2024
  • MEA - Market size and forecast 2019-2024
  • South America - Market size and forecast 2019-2024
  • Key leading countries
  • Market opportunity by geography
  • Market drivers
  • Market challenges
  • Market trends

Vendor Landscape

  • Overview
  • Vendor landscape
  • Landscape disruption

Vendor Analysis

  • Vendors covered
  • Market positioning of vendors
  • AB Volvo
  • Ashok Leyland Ltd.
  • CNH Industrial NV
  • Daimler AG
  • Hyundai Motor Co.
  • Nikola Corp.
  • PACCAR Inc.
  • Tata Motors Ltd.
  • Toyota Motor Corp.
  • Volkswagen AG

Appendix

  • Scope of the report
  • Currency conversion rates for US$
  • Research methodology
  • List of abbreviations

About Us

Technavio is a leading global technology research and advisory company. Their research and analysis focuses on emerging market trends and provides actionable insights to help businesses identify market opportunities and develop effective strategies to optimize their market positions. With over 500 specialized analysts, Technavio’s report library consists of more than 17,000 reports and counting, covering 800 technologies, spanning across 50 countries. Their client base consists of enterprises of all sizes, including more than 100 Fortune 500 companies. This growing client base relies on Technavio’s comprehensive coverage, extensive research, and actionable market insights to identify opportunities in existing and potential markets and assess their competitive positions within changing market scenarios.


Contacts

Technavio Research
Jesse Maida
Media & Marketing Executive
US: +1 844 364 1100
UK: +44 203 893 3200
Email: This email address is being protected from spambots. You need JavaScript enabled to view it.
Website: www.technavio.com/


HOUSTON--(BUSINESS WIRE)--PACIFIC COAST OIL TRUST (OTC Pink: ROYTL) (the “Trust”), a royalty trust formed by Pacific Coast Energy Company LP (“PCEC”), announced today that there will be no cash distribution to the holders of its units of beneficial interest of record on November 16, 2020 based on the Trust’s calculation of net profits generated during September 2020 (the “Current Month”) as provided in the conveyance of net profits interests and overriding royalty interest. If the Trust continues to experience negative monthly net profits, the Trust is expected to terminate by its terms by the end of 2021. As described further below, based on information from PCEC, the likelihood of distributions to the unitholders in the foreseeable future is extremely remote. The Trust may also be terminated upon the occurrence of other events as described in the Trust’s filings with the SEC. All financial and operational information in this press release has been provided to the Trustee by PCEC.

The Current Month’s distribution calculation for the Developed Properties resulted in $0.05 million of operating loss. Revenues from the Developed Properties were $1.5 million, lease operating expenses including property taxes were $1.6 million, and development costs were approximately $1,200. The average realized price for the Developed Properties was $38.19 per Boe for the Current Month, as compared to $40.57 per Boe in August 2020. Commodity prices continue to remain depressed during 2020, primarily attributable to the decrease in demand for crude oil due to the COVID-19 pandemic and oversupply resulting from the dispute over production levels between Russia and the members of the Organization of Petroleum Exporting Countries, including Saudi Arabia. The cumulative net profits deficit amount for the Developed Properties increased slightly at approximately $25.3 million in the current month versus approximately $25.1 million in the prior month.

The Current Month’s calculation included approximately $40,000 for the 7.5% overriding royalty interest on the Remaining Properties from Orcutt Diatomite and Orcutt Field. Average realized prices for the Remaining Properties were $34.57 per Boe in the Current Month, as compared $37.91 per Boe in August 2020. The cumulative net profits deficit for the Remaining Properties decreased by approximately $0.04 million and was approximately $2.8 million for the Current Month.

The monthly operating and services fee of approximately $95,000 payable to PCEC and Trust general and administrative expenses of $88,000 together exceeded the payment of approximately $40,000 received from PCEC from the 7.5% overriding royalty interest on the Remaining Properties, creating a shortfall of approximately $149,000.

PCEC has provided the Trust with a $1 million letter of credit to be used by the Trust if its cash on hand (including available cash reserves) is not sufficient to pay ordinary course administrative expenses as they become due. Further, the trust agreement provides that if the Trust requires more than the $1 million under the letter of credit to pay administrative expenses, PCEC, will, upon written request of the Trustee, loan funds to the Trust in such amount as necessary to pay such expenses. PCEC has informed the Trustee that due to the current economic conditions, including the low commodity prices and market oversupply of oil, for the foreseeable future, PCEC does not expect to loan such funds to the Trust other than the $1 million letter of credit. Under the trust agreement, the Trust may only use funds provided under the letter of credit or loaned by PCEC to pay the Trust’s current accounts or other obligations to trade creditors in connection with obtaining goods or services or for the payment of other accrued current liabilities arising in the ordinary course of the Trust’s business. The Trust will be drawing funds from the letter of credit to pay the expected shortfall of approximately $149,000, which together with prior drawdowns would leave approximately $219,000 remaining of the $1 million. In addition to the funds drawn from the letter of credit, the Trust has outstanding borrowings from PCEC of approximately $270,000, including interest thereon, related to shortfalls from prior months. Consequently, no further distributions may be made to Trust unitholders until the Trust’s indebtedness created by such amounts drawn or borrowed, including interest thereon, has been paid in full.

Sales Volumes and Prices

The following table displays PCEC’s underlying sales volumes and average prices for the Current Month:

Underlying Properties

Sales Volumes

Average Price

(Boe)

(Boe/day)

(per Boe)

Developed Properties (a)

39,921

1,331

$38.19

Remaining Properties (b)

16,892

563

$34.57


(a) Crude oil sales represented 99% of sales volumes

(b) Crude oil sales represented 100% of sales volumes

Update on Estimated Asset Retirement Obligations

As previously disclosed, in November 2019, PCEC informed the Trustee that, as permitted by the agreements governing the conveyances to the Trust, PCEC intended to begin deducting its estimated ARO associated with the West Pico, Orcutt Hill, Orcutt Hill Diatomite, East Coyote and Sawtelle fields reducing the amounts payable to the Trust under its Net Profits Interest. ARO is the accounting recognition related to plugging and abandonment obligations that all operators face. PCEC engaged an accounting firm, Moss Adams LLP (“Moss Adams”), acting as third-party consultants, to assist PCEC in determining its estimated ARO, and on February 27, 2020, PCEC informed the Trustee that based on the analysis performed by its consultants, PCEC’s estimated ARO, as of December 31, 2019, is $45,695,643, which is approximately $10.0 million less than the amount that was originally estimated before PCEC’s consultants completed their analysis, as previously disclosed in the Trust’s Current Report on Form 8‑K filed on November 13, 2019. According to PCEC and its third-party consultants, its estimated ARO, which reflects PCEC’s assessment of current market conditions as of December 31, 2019 and changes in California law, was determined to be approximately $33.2 million for the Developed Properties and approximately $12.5 million for the Remaining Properties, or approximately $26.5 million and approximately $3.1 million net to the Trust, respectively, and PCEC has reflected these amounts beginning with the calculation of the net profits generated during January 2020. As previously disclosed, the Trust engaged Martindale Consultants, Inc. (“Martindale”), a provider of analysis and compliance review services to the oil and gas industry, to perform an independent review of the estimated ARO that PCEC provided to the Trustee, and Martindale is continuing to evaluate that estimate. The Trustee also has engaged an accounting expert to advise the Trustee regarding the accruals that PCEC has booked relating to the ARO estimated by PCEC.

PCEC has informed the Trustee that in accordance with generally accepted accounting principles, PCEC will evaluate the ARO on a quarterly basis. As a result of that re-evaluation, the actual ARO incurred in the future may be greater or less than the estimated amounts provided by PCEC.

Based on PCEC’s estimate of its ARO attributable to the Net Profits Interest, deductions relating to estimated ARO are likely to eliminate the likelihood of any distributions to Trust unitholders for the foreseeable future, as previously disclosed in the Trust’s Current Report on Form 8-K filed on November 13, 2019.

As described in more detail in the Trust’s filings with the SEC, the Trust will terminate if the annual cash proceeds received by the Trust from the Net Profits Interest and Royalty Interest total less than $2.0 million for each of any two consecutive calendar years. PCEC is deducting estimated ARO, thereby reducing the amounts payable to the Trust. Unless significant market changes were to occur, no payments will be made by PCEC to the Trust for the foreseeable future, which would result in the total proceeds received by the Trust to total less than $2.0 million in each of 2020 and 2021.

Production Update

PCEC has informed the Trustee that due to the economic effects of the COVID-19 pandemic and the oversupply of crude oil resulting from the dispute over production levels between Russia and the members of the Organization of Petroleum Exporting Countries, including Saudi Arabia, PCEC’s production has been reduced by roughly 20% since the beginning of the crisis. PCEC continuously evaluates, based on price, whether to curtail production or whether to spend additional amounts to return production from down wells. PCEC has informed the Trustee that unless a substantial number of wells return to production, or oil prices improve significantly or both, any monthly payments that PCEC may make to the Trust may not be sufficient to cover the Trust’s administrative expenses, and therefore the likelihood of distributions to the unitholders in the foreseeable future is extremely remote.

Overview of Trust Structure

Pacific Coast Oil Trust is a Delaware statutory trust formed by PCEC to own interests in certain oil and gas properties in the Santa Maria Basin and the Los Angeles Basin in California (the “Underlying Properties”). The Underlying Properties and the Trust’s net profits, and royalty interests are described in the Trust’s filings with the SEC. As described in the Trust’s filings with the SEC, the amount of any periodic distributions is expected to fluctuate, depending on the proceeds received by the Trust as a result of actual production volumes, oil and gas prices, development expenses, and the amount and timing of the Trust’s administrative expenses, among other factors. For additional information on the Trust, please visit www.pacificcoastoiltrust.com.

Cautionary Statement Regarding Forward-Looking Information

This press release contains statements that are "forward-looking statements" within the meaning of Section 21E of the Securities Exchange Act of 1934, as amended. All statements contained in this press release, other than statements of historical facts, are "forward-looking statements" for purposes of these provisions. These forward-looking statements include estimates of future asset retirement obligations, expectations regarding the impact of deductions for such obligations on future distributions to unitholders, estimates of future total distributions to unitholders in 2020 and 2021, expectations regarding the impact of COVID-19 on the Trust and the impact of the pandemic on future distributions to unitholders, expectations regarding the impact of lower commodity prices on oil and gas reserve estimates, PCEC’s plans to shut in production or to spend additional amounts to return production from down wells, and the amount and date of any anticipated distribution to unitholders. In any case, PCEC’s deductions of its estimated asset retirement obligations will have a material adverse effect on distributions to the unitholders and on the trading price of the Trust units and may result in the termination of the Trust. Any anticipated distribution is based, in part, on the amount of cash received or expected to be received by the Trust from PCEC with respect to the relevant period. Any differences in actual cash receipts by the Trust could affect this distributable amount. The amount of such cash received or expected to be received by the Trust (and its ability to pay distributions) has been and will be significantly and negatively affected by prevailing low commodity prices, which have declined significantly, could decline further and could remain low for an extended period of time in light of the economic effects of the COVID-19 pandemic and the dispute over production levels between Russia and the members of the Organization of Petroleum Exporting Countries, including Saudi Arabia. Other important factors that could cause actual results to differ materially include expenses related to the operation of the Underlying Properties, including lease operating expenses, expenses of the Trust, and reserves for anticipated future expenses. Statements made in this press release are qualified by the cautionary statements made in this press release. Neither PCEC nor the Trustee intends, and neither assumes any obligation, to update any of the statements included in this press release. An investment in units issued by Pacific Coast Oil Trust is subject to the risks described in the Trust's Annual Report on Form 10-K for the year ended December 31, 2018 filed with the SEC on March 8, 2019, and if applicable, the Trust’s subsequent Quarterly Reports on Form 10-Q. The Trust's Annual Reports on Form 10-K and Quarterly Reports on Form 10-Q are available over the Internet at the SEC's website at http://www.sec.gov.


Contacts

Pacific Coast Oil Trust
The Bank of New York Mellon Trust Company, N.A., as Trustee
Sarah Newell
1(512) 236-6555

HOUSTON--(BUSINESS WIRE)--Waste Management (NYSE: WM) today announced today that it has priced a $2.5 billion aggregate public offering of senior notes under an effective shelf registration statement previously filed with the Securities and Exchange Commission (the “SEC”), as follows:


  • $500,000,000 aggregate principal amount of 0.750% senior notes due November 15, 2025;
  • $500,000,000 aggregate principal amount of 1.150% senior notes due March 15, 2028;
  • $1,000,000,000 aggregate principal amount of 1.500% senior notes due March 15, 2031; and
  • $500,000,000 aggregate principal amount of 2.500% senior notes due November 15, 2050.

The notes will be fully and unconditionally guaranteed by the company’s wholly-owned subsidiary, Waste Management Holdings, Inc. The notes have been assigned ratings of A- by Standard & Poor’s, BBB+ by Fitch and Baa1 by Moody’s.

The offering is expected to close on November 17, 2020, subject to the satisfaction of closing conditions. The company intends to use the net proceeds from the offering to repay all of the outstanding borrowings under the company’s $3.0 billion, 364-day, U.S. revolving credit facility (“$3.0 billion revolving credit facility”), to redeem its $400 million aggregate principal amount of 4.60% Senior Notes due March 2021 (the “2021 Notes”), including the payment of accrued and unpaid interest, and for general corporate purposes. Pending such application of the net proceeds, the company may temporarily invest in short-term investments.

All of the outstanding borrowings under the company’s $3.0 billion revolving credit facility were used to pay a portion of the consideration for the previously announced acquisition of Advanced Disposal Services, Inc. (“Advanced Disposal”), and related fees and expenses, including the repayment of certain Advanced Disposal debt in connection with the closing of the acquisition. Also as previously announced, the company issued a notice of redemption under the indenture governing the 2021 Notes on November 3, 2020, and the redemption date will be December 3, 2020. This press release does not constitute a notice of redemption under the indenture governing the 2021 Notes or under any indenture of Advanced Disposal.

Barclays Capital Inc., Mizuho Securities USA LLC, BofA Securities, Inc., J.P. Morgan Securities LLC, Scotia Capital (USA) Inc., BNP Paribas Securities Corp., Citigroup Global Markets Inc., Deutsche Bank Securities Inc., MUFG Securities Americas Inc., SMBC Nikko Securities America, Inc. and U.S. Bancorp Investments, Inc. are acting as joint book-running managers of the offering. In addition, Academy Securities, Inc., Loop Capital Markets LLC, MFR Securities, Inc., Mischler Financial Group, Inc., Siebert Williams Shank & Co., LLC and Stern Brothers & Co. are acting as co-managers of the offering. Copies of the final prospectus supplement and related prospectus for this offering may be obtained by visiting EDGAR on the SEC website at www.sec.gov or, upon request, from any of the joint book-running managers at: Barclays Capital Inc., by mail: c/o Broadridge Financial Solutions, 1155 Long Island Avenue, Edgewood, NY 11717, by phone at 888-603-5847 or by email at This email address is being protected from spambots. You need JavaScript enabled to view it.; Mizuho Securities USA LLC, by mail: Attn: Debt Capital Markets, 320 Park Avenue, New York, NY 10022 or by phone at 1-866-271-7403; BofA Securities, Inc., by mail: Attn: Prospectus Department, 200 North College Street, NC1-004-03-43, Charlotte, NC 28255-0001, by phone at 800-294-1322 or by email at This email address is being protected from spambots. You need JavaScript enabled to view it.; J.P. Morgan Securities LLC, by mail: c/o Broadridge Financial Solutions, 1155 Long Island Avenue, Edgewood, NY 11717, Attention: Prospectus Department or by phone at 1-866-803-9204; or Scotia Capital (USA) Inc., by mail: 250 Vesey Street, New York, NY 10281, or by phone at 1 (800) 372-3930.

This press release does not constitute an offer to sell or the solicitation of an offer to buy the notes described herein, nor shall there be any sale of these notes in any jurisdiction in which such offer, solicitation or sale would be unlawful prior to registration or qualification under the securities laws of any such jurisdiction. The notes will be offered only by means of a prospectus, including the prospectus supplement relating to the notes, and any free writing prospectus prepared by or on behalf of us, each of which meeting the requirements of Section 10 of the Securities Act of 1933, as amended. A securities rating is not a recommendation to buy, sell or hold securities and may be subject to revision, suspension or withdrawal at any time. Each credit rating should be evaluated independently of any other credit rating.

ABOUT WASTE MANAGEMENT

Waste Management, based in Houston, Texas, is the leading provider of comprehensive waste management environmental services in North America. Through its subsidiaries, Waste Management provides collection, transfer, disposal services, and recycling and resource recovery. It is also a leading developer, operator and owner of landfill gas-to-energy facilities in the United States. The Company’s customers include residential, commercial, industrial, and municipal customers throughout North America. To learn more information about Waste Management, visit www.wm.com.

FORWARD-LOOKING STATEMENT

This press release contains forward-looking statements that involve risks and uncertainties. Factors that could cause actual results to differ materially from those expressed or implied by the forward-looking statements in this press release are discussed in Waste Management’s most recent Annual Report on Form 10-K and subsequent reports on Form 10-Q.


Contacts

Waste Management
Web site
https://www.wm.com

Analysts
Ed Egl
713.265.1656
This email address is being protected from spambots. You need JavaScript enabled to view it.

Media
Janette Micelli
602.579.6152
This email address is being protected from spambots. You need JavaScript enabled to view it.

SANTA CLARITA, Calif.--(BUSINESS WIRE)--California Resources Corporation (NYSE: CRC), an independent California-based oil and gas exploration and production company, today reported a net loss attributable to common stock of $29 million for the third quarter of 2020, and adjusted net loss1 of $55 million. GAAP reporting requires the accounting return from the non-controlling interest in the Ares JV upon our emergence from bankruptcy to be taken into account in determining earnings per share. Accordingly, CRC reported net income of $2.20 per diluted share for the third quarter of 2020, or adjusted net income1 of $1.68 per diluted share. Operational and financial highlights for the third quarter of 2020 were as follows:


Highlights

  • Completed a financial restructuring and emerged from Chapter 11 bankruptcy with $535 million of net debt2 and $350 million of liquidity3
  • Reported adjusted EBITDAX1 of $103 million; adjusted EBITDAX margin1 of 25%; net cash provided by operating activities of $48 million; and free cash flow1 of $44 million after internally funded capital
  • Delivered average net production of 106,000 barrels of oil equivalent (BOE) per day including 64,000 barrels per day of oil
  • Optimized CRC and flattened the organization for a leaner structure, reducing costs to enhance profitability in the current Brent price environment
  • Published third annual Sustainability Report showcasing 2030 Sustainability Goals and 2019 ESG Performance data

Todd A. Stevens, CRC's President and Chief Executive Officer, commented, “I am proud of our team's performance as we navigated through the recent Chapter 11 restructuring while continuing to safely operate amidst the ongoing worldwide pandemic. I strongly believe that our new capital structure and organizational design provide a solid foundation to create substantial value and deliver significant shareholder returns. We look forward to further developing our vast portfolio while generating free cash flow, advancing our sustainability projects and ensuring that we can continue to provide energy to California by Californians for decades to come.”

Mr. Stevens continued, "Given the state’s energy challenges, maintaining responsible California production without interruption is more important than ever. California currently imports over 70% of the oil and 90% of the natural gas it uses daily. California needs all of its native oil and gas for personal protective equipment, hand sanitizer, jet fuel and bunker fuel for ships in our ports, in addition to gasoline, diesel and many other products essential to our quality of life."

 
1 See Attachment 3 for the non-GAAP financial measures of adjusted EBITDAX, adjusted EBITDAX margin, production costs per BOE (excluding effects of PSC-type contracts), adjusted net income (loss) and free cash flow after internally funded capital, including reconciliations to their most directly comparable GAAP measure, where applicable.
2 Net debt is net of unrestricted cash of approximately $72 million and $118 million used to cash collateralize on an interim basis certain letters of credit that were outstanding under CRC’s senior debtor-in-possession credit facility at the time of our emergence.
3 Liquidity includes $72 million of unrestricted cash and approximately $278 million of availability on our Revolving Credit Facility.

Third Quarter 2020 Results

For the third quarter of 2020, CRC reported a net loss attributable to common stock (CRC net loss) of $29 million, or net income of $2.20 per diluted share after accounting for a return from the noncontrolling interest in the Ares JV, compared to a net income attributable to common stock of $94 million, or $1.89 per diluted share, for the same period of 2019. Adjusted net loss1 for the third quarter of 2020 was $55 million, or adjusted net income1 of $1.68 per diluted share, compared to adjusted net income1 of $17 million, or $0.35 per diluted share, for the same period in 2019. Third quarter 2020 adjusted net loss1 excluded unusual and infrequent items including a net gain of $66 million from reorganization items, $15 million of Chapter 11 transaction costs, $10 million of severance expenses and other net charges of $15 million. Third quarter 2019 adjusted net income1 excluded a net gain of $82 million on debt repurchases and non-cash losses on commodity derivatives of $6 million.

Adjusted EBITDAX1 for the third quarter of 2020 was $103 million and cash provided by operating activities was $48 million. Free cash flow1 was $44 million after taking into account CRC's internally funded capital of $4 million.

Total daily net production volumes decreased 17% year-over-year, from 128,000 BOE per day for the third quarter of 2019 to 106,000 BOE per day for the third quarter of 2020. The decrease from the same prior-year period over our mid-teens natural decline rate was primarily due to shut-in production driven by the collapse in commodity prices, power outages and reduced well repair work. PSC-type contracts positively impacted our oil production by nearly 1,000 barrels per day in the third quarter of 2020 compared to the same prior-year period. Oil volumes in the third quarter of 2020 averaged 64,000 barrels per day, NGL volumes averaged 14,000 barrels per day and natural gas volumes averaged 168 million cubic feet per day.

Our realized crude oil prices, including the effect of settled hedges, decreased by $26.26 per barrel from $68.41 in the third quarter of 2019 to $42.15 per barrel in the third quarter of 2020. Brent realized prices were lower in the three months ended September 30, 2020 compared to the same prior-year period due to the combination of the supply increase caused by the Saudi-Russia price war that began earlier in the year and the continuation of severe demand decline caused by COVID-19. In the third quarter of 2020, hedge settlements increased our realized crude oil prices by $0.32 per barrel compared to an increase of $5.56 per barrel in the same prior-year period. Realized NGL prices were $25.16 per barrel, up $1.61 per barrel over the prior-year period due to improvements in negotiated sales differentials along with stronger NGL values relative to crude. Realized natural gas prices were $2.22 per thousand cubic feet (Mcf) for the third quarter of 2020, $0.51 per Mcf lower than the same prior-year period increased natural gas production and higher inventories across the U.S. primarily due to shelter-in-place orders related to COVID-19, partially offset by fewer infrastructure constraints within local California markets in 2020 compared to 2019.

Production costs for the third quarter of 2020 were $141 million, compared to $221 million for the third quarter of 2019. The decrease was primarily due to efficiencies and streamlining of our operations, workforce reductions and reduced activity levels, such as well repair work, in response to the current economic environment. On a per barrel basis, for the same comparative periods, production costs were $14.52 and $18.82, respectively. Excluding the effect of PSC-type contracts, production costs per BOE1 for the third quarter of 2020 and 2019 were $13.37 and $17.44, respectively.

G&A expenses were $64 million for the third quarter of 2020, compared to $66 million for the same prior-year period. Third quarter G&A expenses decreased primarily due to ongoing cost saving efforts, workforce reductions and a decline in spending across a number of cost categories. These reductions were offset by an increase in cash costs related to changes to our compensation plans prior to our bankruptcy filing and higher payout on pre-established performance metrics on the incentive portion of these awards in the third quarter of 2020. Excluding the cost of employee incentive awards, the 2020 third quarter G&A was $44 million, down $11 million from $55 million in the third quarter of 2019.

CRC reported taxes other than on income of $42 million for the third quarter of 2020, consistent with the same prior-year period. Exploration expense was $2 million for the third quarter of 2020, $3 million less than the same prior-year period due to lower activity.

Total internally funded capital invested during the third quarter of 2020 was $4 million.

Nine-Month 2020 Results

For the first nine months of 2020, CRC reported a net loss attributable to common stock (CRC net loss) of $2,096 million, or $39.64 per diluted share after accounting for a return from the noncontrolling interest in the Ares JV in the third quarter of 2020, compared to a net income attributable to common stock of $39 million, or $0.77 per diluted share, for the same period of 2019. Adjusted net loss1 for the first nine months of 2020 was $265 million, or $2.57 per diluted share, compared to adjusted net income1 of $34 million, or $0.69 per diluted share, for the same period in 2019. The first nine months of 2020 adjusted net loss1 excluded unusual and infrequent items including $1,736 million of asset impairments, $64 million of Chapter 11 costs, a gain of $66 million on reorganization items, net, and other net losses of $97 million. The first nine months of 2019 adjusted net income1 excluded a net gain of $108 million from debt repurchases, $99 million of non-cash derivative losses, and a net $4 million charge related to other unusual and infrequent items.

Adjusted EBITDAX1 for the first nine months of 2020 was $373 million and cash provided by operating activities was $141 million. Free cash flow1 was $104 million after taking into account CRC's internally funded capital of $37 million.

Total daily net production volumes decreased 13% year-over-year, from 130,000 BOE per day for the first nine months of 2019 to 113,000 BOE per day for the first nine months of 2020. The decrease over the same prior-year period was primarily due to very limited capital investment, approximately 3,000 BOE per day of average shut-in production during the 2020 period, the Lost Hills divestiture, lower well repair work and other factors. PSC-type contracts positively impacted our oil production by over 2,800 barrels per day in the first nine months of 2020 compared to the prior-year period. Oil volumes in the first nine months of 2020 averaged 70,000 barrels per day, NGL volumes averaged 14,000 barrels per day and natural gas volumes averaged 175 million cubic feet per day.

Our realized crude oil prices, including the effect of settled hedges, decreased by $24.89 per barrel from $68.16 in the first nine months of 2019 to $43.27 per barrel in the first nine months of 2020. In the first nine months of 2020, hedge settlements increased our realized crude oil prices by $2.00 per barrel compared to an increase of $3.13 per barrel in the same prior-year period. Realized NGL prices were $25.17 per barrel, down $5.87 per barrel over the prior-year period. Realized natural gas prices were $2.05 per thousand cubic feet (Mcf) for the first nine months of 2020, $0.77 per Mcf lower than the same prior-year period.

Production costs for the first nine months of 2020 were $460 million, compared to $684 million for the first nine months of 2019. The decrease was primarily due to efficiencies and streamlining of our operations, workforce reductions and reduced work schedules, as well as lower activity levels, such as well repair work, in response to the current environment. On a per barrel basis, for the same comparative periods, production costs were $14.85 and $19.32, respectively. Excluding the effect of PSC-type contracts, production costs per BOE1 for the first nine months of 2020 and 2019 were $14.03 and $17.82, respectively.

G&A expenses were $193 million for the first nine months of 2020, compared to $228 million for the same prior-year period. The decrease was primarily attributable to cost saving efforts, workforce reductions and a decline in spending across a number of cost categories.

CRC reported taxes other than on income of $121 million for the first nine months of 2020, consistent with the same prior-year period. Exploration expense was $9 million for the first nine months of 2020, down from $25 million in the same prior-year period due to lower activity.

Total capital invested during the first nine months of 2020 was $131 million. CRC internally funded $37 million. CRC's JV partners Macquarie Infrastructure and Real Assets Inc. (MIRA) and Alpine invested an additional $1 million and $93 million, respectively, which are excluded from CRC's consolidated results.

Emergence and Balance Sheet Update

Subsequent to quarter-end, CRC emerged from Chapter 11 bankruptcy with a new balance sheet. The restructuring eliminated all pre-filing debt and the noncontrolling interests in CRC's midstream JV. As a result, CRC's new capital structure consists of a $1.2 billion reserve-based lending Revolving Credit Facility with a commitment level of $540 million, $300 million of Secured Notes and a $200 million Second Lien Term Loan. CRC has approximately $35 million drawn on the facility at emergence, net of unrestricted cash of approximately $72 million and $118 million used to cash collateralize on an interim basis certain letters of credit that were outstanding under CRC’s senior debtor-in-possession credit facility at the time of our emergence. We expect these letters of credit will be transitioned to our new Revolving Credit Facility and will no longer need to be cash collateralized. We believe that our new Revolving Credit Facility provides CRC with ample liquidity for our operations.

Upon emergence from Chapter 11 bankruptcy on October 27th, 2020, seven new directors were appointed to the Board of Directors. Our Board of Directors currently consists of eight directors as follows: (i) our President and Chief Executive Officer, Todd A. Stevens and (ii) seven non-employee directors, including Douglas E. Brooks, Tiffany (TJ) Thom Cepak, James N. Chapman, Mark A. McFarland, Julio M. Quintana, William B. Roby and Brian Steck.

Operational Update

In the third quarter of 2020, CRC operated no drilling rigs. The San Joaquin basin produced 78,000 net BOE per day. The Los Angeles basin produced 22,000 net BOE per day, the Ventura basin produced 3,000 net BOE per day and the Sacramento basin produced 3,000 net BOE per day.

2020 Capital Budget

Given the current commodity environment, CRC continues to be disciplined with its capital investment and will hold its internally funded capital program to a level that maintains the mechanical integrity of its facilities to continue to operate them in a safe and environmentally responsible manner.

Sustainability Update

CRC remains committed to transparent reporting of our environmental, social and governance (ESG) data which enhances our stakeholder engagement, strengthens our performance, and further supports our role as a dependable and dedicated energy producer in the State of California. Accordingly, we have continued to expand our sustainability disclosures, and have published our third annual Sustainability Report on our website covering our accomplishments in 2019. CRC’s 2030 Sustainability Goals and our ongoing sustainability strategy align with the climate goals of California, a signatory to the Paris Climate Accord, and support the state's sustainable development by providing safe, affordable and reliable energy that is essential for Californians. In addition, our new Board of Directors has reaffirmed the Sustainability – Health, Safety, Environment and Community Committee as a standing committee of the Board.

Hedging Update as of October 31, 2020

For the fourth quarter of 2020, CRC has protected the downside risk of approximately 39% of its volume of third quarter oil production, with approximately 74% of the hedges being in put spreads and put collars at an average Brent price of $44.84 and the remainder in swaps at an average Brent price of $44.75. For the first quarter of 2021, CRC has protected the downside risk of approximately 38% of its third quarter oil production, with approximately 75% of the hedges being in put spreads and put collars at an average Brent price of $45.00 and the remainder in swaps at an average Brent price of $44.75. For the second quarter of 2021, CRC has protected the downside risk of approximately 23% of its third quarter oil production, with approximately 60% of the hedges being in put spreads and put collars at an average Brent price of $40.00 and the remainder in swaps at an average Brent price of $44.75. For July 2021, CRC has protected the downside risk of approximately 22% of its third quarter oil production, with approximately 60% of the hedges being in put spreads and put collars at an average Brent price of $40.00 and the remainder in swaps at an average Brent price of $44.75.

Conference Call Details

To participate in the conference call scheduled for November 5th, 2020 at 5:00 P.M. Eastern Standard Time, either dial (877) 328-5505 (International calls please dial +1 (412) 317-5421) or access via webcast at www.crc.com, fifteen minutes prior to the scheduled start time to register. Participants may also pre-register for the conference call at http://dpregister.com/10140527. A digital replay of the conference call will be archived for approximately 90 days and supplemental slides for the conference call will be available online in the Investor Relations section of www.crc.com.

About California Resources Corporation

California Resources Corporation (CRC) is the largest oil and natural gas exploration and production company in California. CRC operates its world-class resource base exclusively within the State of California, applying complementary and integrated infrastructure to gather, process and market its production. Using advanced technology, CRC focuses on safely and responsibly supplying affordable energy for California by Californians.

Forward-Looking Statements

The information included herein contains forward-looking statements that involve risks and uncertainties that could materially affect our expected results of operations, liquidity, cash flows and business prospects. Such statements include those regarding our expectations as to our future:

  • financial position, liquidity, cash flows and results of operations
  • business prospects
  • transactions and projects
  • operating costs
  • Value Creation Index (VCI) metrics, which are based on certain estimates including future production rates, costs and commodity prices
  • operations and operational results including production, hedging and capital investment
  • budgets and maintenance capital requirements
  • reserves
  • type curves
  • expected synergies from acquisitions and joint ventures

Actual results may differ from anticipated results, sometimes materially, and reported results should not be considered an indication of future performance. While we believe assumptions or bases underlying our expectations are reasonable and make them in good faith, they almost always vary from actual results, sometimes materially. We also believe third-party statements we cite are accurate but have not independently verified them and do not warrant their accuracy or completeness. Factors (but not necessarily all the factors) that could cause results to differ include:

  • our ability to execute our business plan post-emergence
  • the volatility of commodity prices and the potential for sustained low oil, natural gas and NGL prices
  • impact of our recent emergence from bankruptcy on our business and relationships
  • debt limitations on our financial flexibility
  • insufficient cash flow to fund planned investments or changes to our capital plan
  • insufficient capital or liquidity, including as a result of lender restrictions, unavailability of capital markets or inability to attract potential investors
  • limitations on transportation or storage capacity and the need to shut-in wells
  • inability to enter into desirable transactions, including acquisitions, asset sales and joint ventures
  • our ability to utilize our net operating loss carryforwards to reduce our income tax obligations
  • limitations on the liquidity of our new common stock and volatility of its market price
  • legislative or regulatory changes, including those related to drilling, completion, well stimulation, operation, maintenance or abandonment of wells or facilities, managing energy, water, land, greenhouse gases or other emissions, protection of health, safety and the environment, or transportation, marketing and sale of our products
  • joint ventures and acquisitions and our ability to achieve expected synergies
  • the recoverability of resources and unexpected geologic conditions
  • incorrect estimates of reserves and related future cash flows and the inability to replace reserves
  • changes in business strategy
  • PSC effects on production and unit production costs
  • effect of stock price on costs associated with incentive compensation
  • effects of hedging transactions
  • equipment, service or labor price inflation or unavailability
  • availability or timing of, or conditions imposed on, permits and approvals
  • lower-than-expected production, reserves or resources from development projects, joint ventures or acquisitions, or higher-than-expected decline rates
  • disruptions due to accidents, mechanical failures, power outages, transportation or storage constraints, natural disasters, labor difficulties, cyber-attacks or other catastrophic events
  • pandemics, epidemics, outbreaks, or other public health events, such as the coronavirus disease (COVID-19)
  • factors discussed in Item 1A, Risk Factors in CRC's Annual Report on Form 10-K and third quarter 2020 Form 10-Q available at www.crc.com.

Words such as "anticipate," "believe," "continue," "could," "estimate," "expect," "goal," "intend," "likely," "may," "might," "plan," "potential," "project," "seek," "should," "target, "will" or "would" and similar words that reflect the prospective nature of events or outcomes typically identify forward-looking statements. Any forward-looking statement speaks only as of the date on which such statement is made, and we undertake no obligation to correct or update any forward-looking statement, whether as a result of new information, future events or otherwise, except as required by applicable law.


Attachment 1

SUMMARY OF RESULTS


(DEBTOR-IN-POSSESSION: Entity Operating Under Chapter 11)


Third Quarter


Nine Months


($ and shares in millions, except per share amounts)


2020


2019


2020


2019


Statements of Operations:


Revenues


Oil and natural gas sales


$

312


$

541


$

987


$

1,720


Net derivative gain (loss) from commodity contracts


37


75


(31

)


Other revenue


Marketing and trading revenue


50


62


109


230


Electricity sales


43


38


75


88


Other


4


3


12


17


Total revenues


409


681


1,258


2,024


Costs and Other


Production costs


141


221


460


684


General and administrative expenses


64


66


193


228


Depreciation, depletion and amortization


89


118


296


357


Asset impairments


1,736


Taxes other than on income


42


42


121


119


Exploration expense


2


5


9


25


Other expenses, net


Marketing and trading costs


35


45


67


170


Electricity cost of sales


17


18


47


51


Transportation costs


10


10


31


30


Other


22


8


75


33


Total costs and other


422


533


3,035


1,697


Operating (loss) income


(13

)


148


(1,777

)


327


Non-Operating (Loss) Income


Reorganization items, net


66


66


Interest and debt expense, net


(28

)


(95

)


(200

)


(293

)


Net gain on early extinguishment of debt


82


5


108


Gain on asset divestitures


Other non-operating expenses


(32

)


(8

)


(93

)


(18

)


(Loss) Income Before Income Taxes


(7

)


127


(1,999

)


124


Income tax provision


Net (Loss) Income


(7

)


127


(1,999

)


124


Net income attributable to noncontrolling interests


(22

)


(33

)


(97

)


(85

)


Net (Loss) Income Attributable to Common Stock


$

(29

)


$

94


$

(2,096

)


$

39


Net income (loss) attributable to common stock per share - basic 1


$

2.20


$

1.89


$

(39.64

)


$

0.78


Net income (loss) attributable to common stock per share - diluted 1


$

2.20


$

1.89


$

(39.64

)


$

0.77


Adjusted net (loss) income


$

(55

)


$

17


$

(265

)


$

34


Adjusted net income (loss) per share - basic 1


$

1.68


$

0.35


$

(2.57

)


$

0.70


Adjusted net income (loss) per share - diluted 1


$

1.68


$

0.35


$

(2.57

)


$

0.69


Weighted-average common shares outstanding - basic


49.5


49.1


49.4


48.9


Weighted-average common shares outstanding - diluted


49.5


49.2


49.4


49.2


Adjusted EBITDAX


$

103


$

278


$

373


$

834


Effective tax rate


0

%


0

%


0


0

%


1 Net income (loss) and adjusted net income (loss) per diluted share for the three and nine months ended September 30, 2020 include $138 million related to the deemed redemption of the noncontrolling interest in the Ares JV.


Contacts

Scott Espenshade (Investor Relations)
818-661-6010
This email address is being protected from spambots. You need JavaScript enabled to view it.

Margita Thompson (Media)
818-661-6005
This email address is being protected from spambots. You need JavaScript enabled to view it.


Read full story here

LONDON--(BUSINESS WIRE)--#GlobalTransportationManagementSystemsTMSMarket--The transportation management systems (TMS) market is expected to grow by USD 2.04 billion, progressing at a CAGR of over 8% during the forecast period. Download Free Sample Report


The adoption of technologically advanced devices is one of the major factors propelling the market growth. However, factors such as data privacy concerns will hamper the market growth.

More details: https://www.technavio.com/report/transportation-management-systems-market-industry-analysis

Transportation Management Systems (TMS) Market: Geographic Landscape

The report offers an up-to-date analysis regarding the current global market scenario, the latest trends and drivers, and the overall market environment. North America will provide several growth opportunities to market vendors during the forecast period. The advent of smart cities, increasing use of vehicular communication systems, and the emergence of the meta-intelligence concept in transportation management systems will significantly influence the transportation management system's market growth in this region. 36% of the market’s growth will originate from North America during the forecast period. The US is the critical market for transportation management systems in North America. This report provides an accurate prediction of the contribution of all segments to the growth of the transportation management systems market size.

Buy 1 Technavio report and get the second for 50% off. Buy 2 Technavio reports and get the third for free.

View market snapshot before purchasing

Companies Covered:

  • American Software Inc.
  • Blue Yonder Group Inc.
  • BluJay Solutions Inc.
  • Continental Traffic Service Inc.
  • Infor Inc.
  • Manhattan Associates Inc.
  • Oracle Corp.
  • SAP SE
  • The Descartes Systems Group Inc.
  • and Trimble Inc.

What our reports offer:

  • Market share assessments for the regional and country-level segments
  • Strategic recommendations for the new entrants
  • Covers market data for 2019, 2020, until 2024
  • Market trends (drivers, opportunities, threats, challenges, investment opportunities, and recommendations)
  • Strategic recommendations in key business segments based on the market estimations
  • Competitive landscaping mapping the key common trends
  • Company profiling with detailed strategies, financials, and recent developments
  • Supply chain trends mapping the latest technological advancements

Technavio suggests three forecast scenarios (optimistic, probable, and pessimistic) considering the impact of COVID-19. Technavio’s in-depth research has direct and indirect COVID-19 impacted market research reports.

Register for a free trial today and gain instant access to 17,000+ market research reports.

Technavio's SUBSCRIPTION platform

Key Topics Covered:

Executive Summary

Market Landscape

  • Market ecosystem
  • Value chain analysis

Market Sizing

  • Market definition
  • Market segment analysis
  • Market size 2019
  • Market outlook: Forecast for 2019 - 2024

Five Forces Analysis

  • Five forces summary
  • Bargaining power of buyers
  • Bargaining power of suppliers
  • Threat of new entrants
  • Threat of substitutes
  • Threat of rivalry
  • Market condition

Market Segmentation by Solution

  • Market segments
  • Comparison by Solution
  • On-premise - Market size and forecast 2019-2024
  • Cloud-based - Market size and forecast 2019-2024
  • Market opportunity by Solution

Market Segmentation by End-user

  • Market segments

Customer Landscape

Geographic Landscape

  • Geographic segmentation
  • Geographic comparison
  • North America - Market size and forecast 2019-2024
  • Europe - Market size and forecast 2019-2024
  • APAC - Market size and forecast 2019-2024
  • MEA - Market size and forecast 2019-2024
  • South America - Market size and forecast 2019-2024
  • Key leading countries
  • Market opportunity by geography
  • Market drivers – Demand led growth
  • Market challenges
  • Market trends

Vendor Landscape

  • Vendor landscape
  • Landscape disruption

Vendor Analysis

  • Vendors covered
  • Market positioning of vendors
  • American Software Inc.
  • Blue Yonder Group Inc.
  • BluJay Solutions Inc.
  • Continental Traffic Service Inc.
  • Infor Inc.
  • Manhattan Associates Inc.
  • Oracle Corp.
  • SAP SE
  • The Descartes Systems Group Inc.
  • Trimble Inc.

Appendix

  • Scope of the report
  • Currency conversion rates for US$
  • Research methodology
  • List of abbreviations

About Us
Technavio is a leading global technology research and advisory company. Their research and analysis focuses on emerging market trends and provides actionable insights to help businesses identify market opportunities and develop effective strategies to optimize their market positions. With over 500 specialized analysts, Technavio’s report library consists of more than 17,000 reports and counting, covering 800 technologies, spanning across 50 countries. Their client base consists of enterprises of all sizes, including more than 100 Fortune 500 companies. This growing client base relies on Technavio’s comprehensive coverage, extensive research, and actionable market insights to identify opportunities in existing and potential markets and assess their competitive positions within changing market scenarios.


Contacts

Technavio Research
Jesse Maida
Media & Marketing Executive
US: +1 844 364 1100
UK: +44 203 893 3200
Email: This email address is being protected from spambots. You need JavaScript enabled to view it.
Website: www.technavio.com/

IRVING, Texas--(BUSINESS WIRE)--Montage Resources Corporation (NYSE:MR) (the “Company” or “Montage” or “Montage Resources”) today announced its third quarter 2020 operational and financial results.


Third Quarter 2020 Highlights:

  • Merger with Southwestern Energy Company expected to close following Montage Resources shareholder vote on November 12, 2020
  • Average net daily production was 602.6 MMcfe per day, above the high end of the Company’s previously issued guidance range of 580 to 600 MMcfe per day, consisting of 82% natural gas and 18% liquids
  • Average natural gas equivalent realized price was $2.30 per Mcfe, including cash settled commodity derivatives and excluding firm transportation expenses
  • Per unit cash production costs (including lease operating, transportation, gathering and compression, production, and ad valorem taxes) were $1.21 per Mcfe, below the Company’s previously issued guidance range of $1.25 to $1.35 per Mcfe
  • Cash operating margin of $0.93 per Mcfe, or 40%, which was a $0.17 per Mcfe improvement from the second quarter 2020 of $0.76 per Mcfe
  • Capital spending for the quarter was $22.3 million, with cumulative spending for the nine months ended September 30, 2020 of $103.8 million

Operational Discussion

The Company’s net production for the three and nine months ended September 30, 2020 and 2019 is set forth in the following table:


Three Months Ended
September 30,


Nine Months Ended
September 30,


2020


2019


2020


2019


Production:


Natural gas (MMcf)


45,333.6


43,289.9


131,353.1


109,613.9


NGLs (Mbbls)


1,150.6


1,401.1


3,342.7


3,414.9


Oil (Mbbls)


533.3


916.2


1,635.1


2,083.3


Total (MMcfe)


55,437.0


57,193.7


161,219.9


142,603.1


Average daily production volume:


Natural gas (Mcf/d)


492,757


470,542


479,391


401,516


NGLs (Bbls/d)


12,507


15,229


12,200


12,509


Oil (Bbls/d)


5,797


9,959


5,968


7,631


Total (MMcfe/d)


602.6


621.7


588.4


522.4


Financial Discussion

Revenue for the three months ended September 30, 2020 totaled $115.4 million, compared to $163.3 million for the three months ended September 30, 2019. Adjusted Revenue1, which includes the impact of cash settled commodity derivatives and excludes brokered natural gas and marketing revenue and other revenue, totaled $127.3 million for the three months ended September 30, 2020 compared to $164.8 million for the three months ended September 30, 2019. Net Loss for the three months ended September 30, 2020 was ($92.2) million, or $(2.56) per share, compared to Net Income of $4.3 million, or $0.12 per share, for the three months ended September 30, 2019. Adjusted Net Income (Loss)1 for the three months ended September 30, 2020 was $(17.3) million, or $(0.48) per share, compared to $20.5 million, or $0.57 per share for the three months ended September 30, 2019. Adjusted EBITDAX1 was $51.0 million for the three months ended September 30, 2020 compared to $83.6 million for the three months ended September 30, 2019.

1 Adjusted Revenue, Adjusted Net Income and Adjusted EBITDAX are non-GAAP financial measures. Tables reconciling Adjusted Revenue, Adjusted Net Income and Adjusted EBITDAX to the most directly comparable GAAP measures can be found at the end of the financial statements included in this press release.

Average realized price calculations for the three and nine months ended September 30, 2020 and 2019 are set forth in the table below:


Three Months Ended
September 30,


Nine Months Ended
September 30,


2020


2019


2020


2019


Average realized price (excluding cash settled
commodity derivatives and firm transportation)


Natural gas ($/Mcf)


$

1.61


$

2.03


$

1.66


$

2.41


NGLs ($/Bbl)


16.03


14.42


13.45


17.82


Oil ($/Bbl)


32.16


49.09


32.36


49.64


Total average prices ($/Mcfe)


1.96


2.68


1.96


3.00


Average realized price (including cash settled
commodity derivatives, excluding firm transportation)


Natural gas ($/Mcf)


$

1.92


$

2.28


$

2.02


$

2.49


NGLs ($/Bbl)


16.00


14.92


13.70


18.19


Oil ($/Bbl)


40.76


49.53


40.32


50.15


Total average prices ($/Mcfe)


2.30


2.88


2.34


3.08


Average realized price (including firm transportation,
excluding cash settled commodity derivatives)


Natural gas ($/Mcf)


$

1.18


$

1.60


$

1.20


$

1.94


NGLs ($/Bbl)


16.03


14.42


13.45


17.82


Oil ($/Bbl)


32.16


49.09


32.36


49.64


Total average prices ($/Mcfe)


1.61


2.35


1.59


2.64


Average realized price (including cash settled
commodity derivatives and firm transportation)


Natural gas ($/Mcf)


$

1.50


$

1.85


$

1.57


$

2.02


NGLs ($/Bbl)


16.00


14.92


13.70


18.19


Oil ($/Bbl)


40.76


49.53


40.32


50.15


Total average prices ($/Mcfe)


1.95


2.56


1.97


2.72


*rounded to the nearest penny


The Company’s cash production costs (which include lease operating, transportation, gathering and compression, production and ad valorem taxes) are shown in the table below. Per unit cash production costs, which include $0.35 per Mcfe of firm transportation expense, were $1.21 per Mcfe for the third quarter of 2020, a decrease of approximately 2% compared to the third quarter of 2019.

General and administrative expense (including one-time merger-related expenses and severance) was $12.1 million and $14.6 million for the three months ended September 30, 2020 and 2019, respectively, and is shown in the table below. Cash general and administrative expense2 (excluding merger-related expenses, severance and stock-based compensation expense) was $8.7 million and $10.2 million for the three months ended September 30, 2020 and 2019, respectively. General and administrative expense per Mcfe (including one-time merger-related expenses and severance) was $0.22 in the three months ended September 30, 2020 compared to $0.25 in the three months ended September 30, 2019. Cash general and administrative expense2 per Mcfe (excluding merger-related expenses, severance and stock-based compensation expense) decreased approximately 11% to $0.16 in the three months ended September 30, 2020 compared to $0.18 in the three months ended September 30, 2019.

2 Cash general and administrative expense is a non-GAAP financial measure. A table reconciling cash general and administrative expense to the most directly comparable GAAP measure can be found under “Cash General and Administrative Expense” in this press release.


Three Months Ended
September 30,


Nine Months Ended
September 30,


2020


2019


2020


2019


Operating expenses (in thousands):


Lease operating


$

11,494


$

11,986


$

33,436


$

29,651


Transportation, gathering and compression


51,961


57,027


157,472


150,065


Production and ad valorem taxes


3,677


1,660


10,146


8,519


Total cash production costs


$

67,132


$

70,673


$

201,054


$

188,235


Depreciation, depletion, amortization and accretion


53,153


45,456


140,058


113,950


General and administrative1


12,144


14,580


33,594


57,074


Operating expenses per Mcfe:


Lease operating


$

0.21


$

0.21


$

0.21


$

0.21


Transportation, gathering and compression


0.93


0.99


0.98


1.04


Production and ad valorem taxes


0.07


0.03


0.06


0.06


Total cash production costs


$

1.21


$

1.23


$

1.25


$

1.31


Depreciation, depletion, amortization and accretion


0.96


0.79


0.87


0.80


General and administrative2


0.22


0.25


0.21


0.40


  1. Includes stock-based compensation, merger-related expenses and severance of $ 3.5 million and $ 4.4 million for the three months ended September 30, 2020 and 2019, respectively, and $ 9.0 million and $ 29.4 million for the nine months ended September 30, 2020 and 2019, respectively
  2. Includes stock-based compensation, merger-related expenses and severance of $ 0.06 per Mcfe and $ 0.07 per Mcfe for the three months ended September 30, 2020 and 2019, respectively, and $ 0.06 per Mcfe and $ 0.20 per Mcfe for the nine months ended September 30, 2020 and 2019, respectively

Cash Margins

The Company’s cash margins are detailed in the table below:


Three Months Ended


Three Months
Ended


September 30,
2020


September 30,
2019


June 30, 2020


(per Mcfe)


Average realized price (including cash settled commodity
derivatives, excluding firm transportation)


$

2.30


$

2.88


$

2.15


Total cash production costs1


1.21


1.23


1.25


Cash production margin


$

1.09


$

1.65


$

0.90


Cash production margin %


47

%


57

%


42

%


Cash production margin


$

1.09


$

1.65


$

0.90


Cash general and administrative expenses2


0.16


0.18


0.14


Cash operating margin


$

0.93


$

1.47


$

0.76


Cash operating margin %


40

%


51

%


35

%


Cash operating margin


$

0.93


$

1.47


$

0.76


Interest expense


0.26


0.27


0.30


Corporate cash operating margin3


$

0.67


$

1.20


$

0.46


Corporate cash operating margin %


29

%


42

%


22

%

  1. Includes lease operating, transportation, gathering and compression, and production and ad valorem taxes
  2. Cash general and administrative expense is a non-GAAP financial measure which excludes stock-based compensation expense, merger related expenses and severance. See reconciliation to the most comparable GAAP measure under “Cash General and Administrative Expense” in this press release
  3. Includes lease operating, transportation, gathering and compression, production and ad valorem taxes, cash general & administrative expense and interest expense. Cash general and administrative expense is a non-GAAP financial measure which excludes stock-based compensation expense, merger related expenses and severance See reconciliation to the most comparable GAAP measure under “Cash General and Administrative Expense” in this press release

Capital Expenditures

Third quarter 2020 capital expenditures were $22.3 million, including $20.2 million for drilling and completions and $2.1 million for land-related expenditures.

During the third quarter of 2020, the Company commenced drilling 2 gross (1.7 net) operated wells and turned to sales 4 gross (2.4 net) operated wells.

Financial Position and Liquidity

As of September 30, 2020, the Company’s liquidity was $279.8 million, consisting of $4.0 million in cash and cash equivalents and $275.8 million in available borrowing capacity under the Company’s revolving credit facility (after giving effect to outstanding letters of credit issued by the Company of $29.2 million and $170.0 million in outstanding borrowings).

Commodity Derivatives

The Company engages in a number of different commodity trading program strategies as a risk management tool to attempt to mitigate the potential negative impact on cash flows caused by price fluctuations in natural gas, NGL and oil prices. Below is a table that illustrates the Company’s hedging activities as of September 30, 2020:

Natural Gas Derivatives:

Description


Volume
(MMBtu/d)


Production Period


Weighted Average
Price ($/MMBtu)


Natural Gas Swaps:


130,000


October 2020 – December 2020


$

2.42


145,000


October 2020 – March 2021


$

2.58


50,000


January 2021 – March 2022


$

2.51


25,000


April 2021 – March 2022


$

2.47


Natural Gas Collars:


Floor purchase price (put)


25,000


January 2021 – December 2021


$

2.15


Ceiling sold price (call)


25,000


January 2021 – December 2021


$

3.03


Floor purchase price (put)


30,000


April 2021 – March 2022


$

2.40


Ceiling sold price (call)


30,000


April 2021 – March 2022


$

3.05


Floor purchase price (put)


15,000


August 2021 – December 2021


$

2.55


Ceiling sold price (call)


15,000


August 2021 – December 2021


$

3.13


Floor purchase price (put)


15,000


September 2021 – November 2021


$

2.52


Ceiling sold price (call)


15,000


September 2021 – November 2021


$

3.12


Floor purchase price (put)


5,000


August 2021


$

2.50


Ceiling sold price (call)


5,000


August 2021


$

3.05


Floor purchase price (put)


10,000


September 2021


$

2.50


Ceiling sold price (call)


10,000


September 2021


$

3.03


Natural Gas Three-way Collars:


Floor purchase price (put)


80,000


October 2020 – December 2020


$

2.60


Floor sold price (put)


80,000


October 2020 – December 2020


$

1.90


Ceiling sold price (call)


80,000


October 2020 – December 2020


$

2.94


Floor purchase price (put)


45,000


January 2021 – December 2021


$

2.55


Floor sold price (put)


45,000


January 2021 – December 2021


$

2.25


Ceiling sold price (call)


45,000


January 2021 – December 2021


$

2.81


Floor purchase price (put)


20,000


April 2021 – March 2022


$

2.62


Floor sold price (put)


20,000


April 2021 – March 2022


$

2.20


Ceiling sold price (call)


20,000


April 2021 – March 2022


$

3.10


Natural Gas Call/Put Options:


Floor sold price (put)


50,000


October 2020 – December 2020


$

2.30


Swaption sold price (call)


50,000


January 2021 – December 2021


$

2.75


Swaption sold price (call)


50,000


January 2022 – December 2022


$

3.00


Ceiling sold price (call)


50,000


January 2022 – December 2022


$

3.00


Floor sold price (put)


50,000


January 2021 – March 2022


$

2.00


Ceiling sold price (call)


80,000


January 2023 – December 2023


$

3.00


Basis Swaps:


Appalachia - Dominion


42,500


October 2020


$

(0.51

)

Appalachia - Dominion


20,000


October 2020 – December 2020


$

(0.59

)

Oil Derivatives:

Description


Volume
(Bbls/d)


Production Period


Weighted Average
Price ($/Bbl)


Oil Swaps:


2,500


October 2020 – December 2020


$

57.41


250


October 2020 – March 2021


$

53.20


250


January 2021 – March 2021


$

53.00


100


January 2021


$

43.60


Oil Collars:


Floor purchase price (put)


1,000


October 2020 – December 2020


$

51.00


Ceiling sold price (call)


1,000


October 2020 – December 2020


$

62.00


Floor purchase price (put)


500


January 2021 – December 2021


$

37.50


Ceiling sold price (call)


500


January 2021 – December 2021


$

45.50


Floor purchase price (put)


300


April 2021


$

40.00


Ceiling sold price (call)


300


April 2021


$

47.25


Floor purchase price (put)


200


May 2021


$

40.00


Ceiling sold price (call)


200


May 2021


$

47.55


Floor purchase price (put)


100


June 2021


$

40.00


Ceiling sold price (call)


100


June 2021


$

47.75


Oil Three-way Collars:


Floor purchase price (put)


500


January 2021 – December 2021


$

31.25


Floor sold price (put)


500


January 2021 – December 2021


$

22.50


Ceiling sold price (call)


500


January 2021 – December 2021


$

45.00


Oil Call/Put Options:


Floor sold price (put)


500


October 2020 – December 2020


$

45.00


Swaption sold price (call)


500


January 2021 – December 2021


$

42.50


NGL Derivatives:

Description


Volume
(Bbls/d)


Production Period


Weighted Average
Price ($/Bbl)


Propane Swaps:


2,000


October 2020 – December 2020


$

20.94


1,000


January 2021 – December 2021


$

18.87


MONTAGE RESOURCES CORPORATION
CONDENSED CONSOLIDATED BALANCE SHEETS
(In thousands, except share and per share amounts)
(Unaudited)


September 30,
2020


December 31,
2019


ASSETS


CURRENT ASSETS


Cash and cash equivalents


$

4,013


$

12,056


Accounts receivable


63,483


77,402


Assets held for sale


1,544


1,047


Other current assets


8,984


35,509


Total current assets


78,024


126,014


PROPERTY AND EQUIPMENT


Oil and natural gas properties, successful efforts method:


Unproved properties


478,644


508,576


Proved oil and gas properties, net


1,216,836


1,251,105


Other property and equipment, net


10,311


11,226


Total property and equipment, net


1,705,791


1,770,907


OTHER NONCURRENT ASSETS


Other assets


5,353


7,616


Operating lease right-of-use assets


30,830


36,975


Assets held for sale


3,403


9,665


TOTAL ASSETS


$

1,823,401


$

1,951,177


LIABILITIES AND STOCKHOLDERS’ EQUITY


CURRENT LIABILITIES


Accounts payable


$

120,785


$

119,907


Accrued capital expenditures


11,933


43,500


Accrued liabilities


61,963


53,866


Accrued interest payable


9,921


21,308


Liabilities associated with assets held for sale


3,711


2,815


Operating lease liability


12,773


12,666


Total current liabilities


221,086


254,062


NONCURRENT LIABILITIES


Debt, net of unamortized discount and debt issuance costs


502,622


500,541


Revolving credit facility


170,000


130,000


Asset retirement obligations


30,336


29,877


Other liabilities


31,421


8,029


Operating lease liability


18,805


24,569


Liabilities associated with assets held for sale


7,150


7,013


Total liabilities


981,420


954,091


COMMITMENTS AND CONTINGENCIES


STOCKHOLDERS’ EQUITY


Preferred stock, 50,000,000 authorized, no shares issued and outstanding


Common stock, $0.01 par value, 1,000,000,000 authorized, 36,034,837
and 35,770,934 shares issued and outstanding, respectively


386


383


Additional paid in capital


2,355,890


2,352,309


Treasury stock, shares at cost; 2,600,672 and 2,508,485 shares, respectively


(10,511

)


(10,049

)

Accumulated deficit


(1,503,784

)


(1,345,557

)

Total stockholders’ equity


841,981


997,086


TOTAL LIABILITIES AND STOCKHOLDERS’ EQUITY


$

1,823,401


$

1,951,177


MONTAGE RESOURCES CORPORATION
CONDENSED CONSOLIDATED STATEMENTS OF OPERATIONS AND COMPREHENSIVE INCOME (LOSS)
(In thousands, except per share data)
(Unaudited)


For the Three Months Ended
September 30,


For the Nine Months Ended
September 30,


2020


2019


2020


2019


REVENUES


Natural gas, oil and natural gas liquids sales


$

108,518


$

153,021


$

315,471


$

428,278


Brokered natural gas and marketing revenue


6,831


10,228


23,859


31,747


Other revenue


56


46


183


307


Total revenues


115,405


163,295


339,513


460,332


OPERATING EXPENSES


Lease operating


11,494


11,986


33,436


29,651


Transportation, gathering and compression


51,961


57,027


157,472


150,065


Production and ad valorem taxes


3,677


1,660


10,146


8,519


Brokered natural gas and marketing expense


7,345


10,574


24,349


32,017


Depreciation, depletion, amortization and accretion


53,153


45,456


140,058


113,950


Exploration


11,767


16,621


34,112


48,602


General and administrative


12,144


14,580


33,594


57,074


Rig termination and standby


303


1,221


303


1,221


Gain on sale of assets


(62

)


(733

)


(1,419

)


(731

)

Other expense


87


2


121


40


Total operating expenses


151,869


158,394


432,172


440,408


OPERATING INCOME (LOSS)


(36,464

)


4,901


(92,659

)


19,924


OTHER INCOME (EXPENSE)


Gain (loss) on derivative instruments


(40,535

)


15,812


(11,329

)


40,620


Interest expense, net


(14,402

)


(15,192

)


(44,166

)


(44,140

)

Other income


2


19


8


Total other income (expense), net


(54,935

)


620


(55,476

)


(3,512

)

INCOME (LOSS) FROM CONTINUING OPERATIONS

BEFORE INCOME TAXES


(91,399

)


5,521


(148,135

)


16,412


Income tax benefit (expense)


INCOME (LOSS) FROM CONTINUING OPERATIONS


(91,399

)


5,521


(148,135

)


16,412


Income (loss) from discontinued operations, net of income tax


(801

)


(1,237

)


(10,092

)


1,286


NET INCOME (LOSS)


$

(92,200

)


$

4,284


$

(158,227

)


$

17,698


EARNINGS (LOSS) PER SHARE OF COMMON STOCK


Basic:


Weighted average common stock outstanding


36,035


35,684


35,889


32,343


Income (loss) from continuing operations


$

(2.54

)


$

0.15


$

(4.13

)


$

0.51


Income (loss) from discontinued operations


(0.02

)


(0.03

)


(0.28

)


0.04


Net income (loss)


$

(2.56

)


$

0.12


$

(4.41

)


$

0.55


Diluted:


Weighted average common stock outstanding


36,035


35,697


35,889


32,471


Income (loss) from continuing operations


$

(2.54

)


$

0.15


$

(4.13

)


$

0.51


Income (loss) from discontinued operations


(0.02

)


(0.03

)


(0.28

)


0.04


Net income (loss)


$

(2.56

)


$

0.12


$

(4.41

)


$

0.55


Adjusted Revenue

Adjusted revenue is a non-GAAP financial measure. The Company defines adjusted revenue as follows: total revenues plus or minus net cash receipts or payments on settled commodity derivative instruments less brokered natural gas and marketing revenue and other revenue. The Company believes adjusted revenue provides investors with helpful information with respect to the performance of the Company’s operations and management uses adjusted revenue to evaluate its ongoing operations and for internal planning and forecasting purposes. See the table below, which reconciles adjusted revenue and total revenues for the three and nine months ended September 30, 2020 and 2019.


Three Months Ended

September 30,


Nine Months Ended

September 30,


$ thousands


2020


2019


2020


2019


Total revenues


$

115,405


$

163,295


$

339,513


$

460,332


Net cash receipts (payments) on settled commodity derivatives


18,806


11,818


61,829


11,072


Brokered natural gas and marketing revenue


(6,831

)


(10,228

)


(23,859

)


(31,747

)

Other revenue


(56

)


(46

)


(183

)


(307

)

Adjusted revenue


$

127,324


$

164,839


$

377,300


$

439,350


Adjusted Net Income (Loss)

Adjusted net income (loss) represents income (loss) from continuing operations before income taxes adjusted for certain non-cash items as set forth in the table below. We believe adjusted net income (loss) is used by many investors and published research in making investment decisions and evaluating operational trends of the Company and its performance relative to other oil and gas producing companies. Adjusted net income (loss) is not a measure of net income (loss) from continuing operations as determined by GAAP. See the table below for a reconciliation of adjusted net income (loss) and net income (loss) from continuing operations before income taxes for the three and nine months ended September 30, 2020 and 2019.


Three Months Ended
September 30,


Nine Months Ended
September 30,


$ thousands


2020


2019


2020


2019


Income (loss) from continuing operations before income taxes,
as reported


$

(91,399

)


$

5,521


$

(148,135

)


$

16,412


(Gain) loss on derivative instruments


40,535


(15,812

)


11,329


(40,620

)

Net cash receipts (payments) on settled derivatives


18,785


11,818


61,877


11,072


Rig termination and standby


303


1,221


303


1,221


Dry hole and other


135


143


163


Stock-based compensation


961


1,061


3,585


7,614


Impairment of unproved properties


10,952


14,114


30,311


36,157


Gain on sale of assets


(62

)


(733

)


(1,419

)


(731

)

Merger-related expenses


2,520


3,291


2,696


21,812


Severance


2,681


Income (loss) before income taxes, as adjusted


(17,270

)


20,481


(36,629

)


53,100


Adjusted net income (loss)


$

(17,270

)


$

20,481


$

(36,629

)


$

53,100


Net income (loss) per common share


Basic


$

(2.56

)


$

0.12


$

(4.41

)


$

0.55


Diluted


$

(2.56

)


$

0.12


$

(4.41

)


$

0.55


Adjusted net income (loss) per common share


Basic


$

(0.48

)


$

0.57


$

(1.02

)


$

1.64


Diluted


$

(0.48

)


$

0.57


$

(1.02

)


$

1.64


Weighted average common shares outstanding


Basic


36,035


35,684


35,889


32,343


Diluted


36,035


35,697


35,889


32,471


Contacts

Montage Resources Corporation
Douglas Kris, Investor Relations
469-444-1736
This email address is being protected from spambots. You need JavaScript enabled to view it.


Read full story here

SHANGHAI--(BUSINESS WIRE)--INVISTA’s technology and licensing group, INVISTA Performance Technologies (IPT), and Hengli Petrochemical (Huizhou) Co., Ltd, a subsidiary of Hengli Group (Hengli), have reached agreement to license INVISTA’s P8 PTA technology for two PTA lines. These two lines will be installed at Xiachong, Daya Bay, Huizhou City, Guangdong province, China. The kick-off meeting was successfully concluded on October 23, 2020, between Hengli, INVISTA and CTCI (the engineering contractor).


Hengli is also operating another 5 PTA lines on Changxing Island (Dalian), all of which utilise advantaged INVISTA PTA technology, with a total capacity of 12 million tonnes per annum.

Adam Sackett, IPT vice president PTA, commented, “We are very pleased that our industry-leading P8 PTA technology has been selected again by Hengli Group. Our companies have a decade-long cooperation, and we look forward to working together on this new project, leverage the learning on Hengli PTA 4/5 and deliver a successful project.”

INVISTA’s industry-leading PTA technology, including its latest version of P8 technology, is available as a license package from IPT. For more information, please visit the IPT website at www.ipt.invista.com.

About INVISTA:

From the fibers in your carpet to the plastic in your automobiles, INVISTA’s commitment to continuous improvement has led its employees to develop some of the most durable, versatile polymers and fibers in the world. A subsidiary of Koch Industries since 2004, INVISTA brings to market the proprietary ingredients for nylon 6,6 and recognized brands including STAINMASTER®, CORDURA® and ANTRON®. INVISTA also offers specialty chemical intermediates and process technologies. See the bigger picture at INVISTA.com.

About Hengli Group:

Hengli Group is an international company that owns a diversity of business: petrochemical, advanced polyester materials, textiles, trading, finance and thermal power. In 2019, Hengli’s total revenue was 556.7 billion RMB, ranking No. 181 in the Fortune Global 500 list. Hengli operates the largest PTA site in the world combined with the biggest performance fibre textile production base.


Contacts

Shelley Zhang
INVISTA
+8621 6389 9202
This email address is being protected from spambots. You need JavaScript enabled to view it.

ATHENS, Greece--(BUSINESS WIRE)--Danaos Corporation (“Danaos”) (NYSE: DAC), one of the world’s largest independent owners of containerships, today reported unaudited results for the period ended September 30, 2020.

Highlights for the Third Quarter and Nine Months Ended September 30, 2020:

  • Adjusted net income1 of $47.3 million, or $1.91 per share, for the three months ended September 30, 2020 compared to $37.9 million, or $2.46 per share, for the three months ended September 30, 2019, an increase of 24.8%. Adjusted net income1 of $123.1 million, or $4.97 per share, for the nine months ended September 30, 2020 compared to $110.7 million, or $7.23 per share, for the nine months ended September 30, 2019, an increase of 11.2%.
  • Operating revenues of $118.9 million for the three months ended September 30, 2020 compared to $111.8 million for the three months ended September 30, 2019, an increase of 6.4%. Operating revenues of $341.9 million for the nine months ended September 30, 2020 compared to $337.0 million for the nine months ended September 30, 2019, an increase of 1.5%.
  • Adjusted EBITDA1 of $83.3 million for the three months ended September 30, 2020 compared to $79.3 million for the three months ended September 30, 2019, an increase of 5.0%. Adjusted EBITDA1 of $235.3 million for the nine months ended September 30, 2020 compared to $232.4 million for the nine months ended September 30, 2019, an increase of 1.2%.
  • Total contracted operating revenues were $1.1 billion as of September 30, 2020, with charters extending through 2028 and remaining average contracted charter duration of 3.5 years, weighted by aggregate contracted charter hire.
  • Charter coverage of 87% for the next 12 months based on current operating revenues and 64% in terms of contracted operating days.
  • On October 12, 2020, we announced the repurchase of 4,339,271 shares of our common stock for an aggregate purchase price of $31.1 million in privately negotiated transactions, including 2,517,013 shares from the Royal Bank of Scotland and 1,822,258 shares from Sphinx Investment Corp. These transactions resulted in the Company's previously announced share repurchase program being terminated.

Three and Nine Months Ended September 30, 2020

Financial Summary - Unaudited

(Expressed in thousands of United States dollars, except per share amounts)


Three months ended


Three months ended


Nine months ended


Nine months ended

September 30,

September 30,

September 30,

September 30,


2020


2019


2020


2019


Operating revenues

$

118,932


$

111,830


$

341,952


$

337,040

Net income

$

42,786


$

33,855


$

110,371


$

97,436

Adjusted net income1

$

47,303


$

37,882


$

123,078


$

110,706

Earnings per share, diluted

$

1.73


$

2.20


$

4.45


$

6.36

Adjusted earnings per share, diluted1

$

1.91


$

2.46


$

4.97


$

7.23

Diluted weighted average number of shares (in thousands)


24,789


15,373


24,789


15,309

Adjusted EBITDA1

$

83,331


$

79,328


$

235,322


$

232,447

Adjusted net income, adjusted earnings per share and adjusted EBITDA are non-GAAP measures. Refer to the reconciliation of net income to adjusted net income and net income to adjusted EBITDA.

Danaos’ CEO Dr. John Coustas commented:

"We are pleased to report improved performance in the Company’s profitability during this quarter. Container trade has staged a remarkable recovery since the end of May, when 11.4% of the vessels in the global fleet stood idle. Time charter rates have increased across all vessel sizes, and the time charter market is at or close to multi-year highs for all vessel sizes. The ability of the liner companies to consistently manage capacity addressed the swift drop in volumes at the onset of the pandemic, which alleviated pressure on our customers' cash flows and stabilized freight rates. All our customers have reported strong profitability which significantly mitigates our counterparty risk.

Volumes have consistently improved, particularly in Transpacific eastbound, intra-Asia and North-South trade lanes, as volumes have recovered faster than expected. Notably, the increase in rates has been most pronounced in smaller vessel types. Danaos has the greatest amount of leverage to this segment of the market as our larger vessels are contracted on multi-year time charters. From that perspective, the short-term chartering market has been quite dynamic.

Although significant market uncertainty remains, particularly as many countries see increasing spread of COVID-19 cases, global GDP has rebounded swiftly, and IMF has recently revised its 2020 GDP estimates upwards. For 2021, the IMF forecasts global GDP growth of 5.2%, which effectively equals growth of 0.6% compared to 2019, or pre-pandemic levels. The recovery has thus far been primarily concentrated in goods rather than services, which has benefited containerized trade.

We continue to execute our strategy and we are well insulated from near-term volatility due to our high charter coverage of 87% in terms of operating revenues and 64% in terms of operating days over the next 12 months. This provides significant visibility into our cash flows during this period. We also have some leverage to the presently strong market through our smaller vessels. We are also cautiously optimistic about the medium-term market outlook. The orderbook is currently in single digits as a percentage of the world fleet for the first time in 20 years. Combined with an anticipated reduction in speeds due to the various environmental initiatives, the supply side outlook is healthy. Tighter supply will help to maintain momentum in the container market or help to bring about a swift recovery if conditions deteriorate.

Consistent with our growth strategy we have agreed to purchase two 9,000 TEU vessels built in 2009 which are both contracted on two year charters with a major liner company. These vessels are expected to be delivered to us between December 2020 and January 2021 and will be funded with a combination of cash and new credit facilities. With these new deliveries our fleet will for the first time exceed the 400,000 TEU mark.

In the meantime, we are generating strong cash flows from our $1.1 billion charter backlog and have a healthy liquidity position. This enabled us to opportunistically repurchase 4,339,271 shares, or 17.5% of the Company’s outstanding shares, for an aggregate price of $31.1 million in privately negotiated transactions practically tripling our $10 million original buyback program. Given the holding nature of the prior owners of these shares, these repurchases increase our per share results and valuation metrics without impacting trading liquidity.

In light of the continued uncertainty about the duration of the coronavirus pandemic and the ensuing economic recovery, we remain focused on maintaining a conservative financial profile and making thoughtful capital allocation decisions that align with our strategy and market expectations and deliver value to our shareholders."

Three months ended September 30, 2020 compared to the three months ended September 30, 2019

During the three months ended September 30, 2020, Danaos had an average of 58.0 containerships compared to 55.0 containerships during the three months ended September 30, 2019. Our fleet utilization was 98.7% in each of the three months ended September 30, 2020 and September 30, 2019.

Our adjusted net income amounted to $47.3 million, or $1.91 per share, for the three months ended September 30, 2020 compared to $37.9 million, or $2.46 per share, for the three months ended September 30, 2019. We have adjusted our net income in the three months ended September 30, 2020 for amortization of non-cash fees and accrued finance fees charge of $4.5 million. Please refer to the Adjusted Net Income reconciliation table, which appears later in this earnings release.

The increase of $9.4 million in adjusted net income for the three months ended September 30, 2020 compared to the three months ended September 30, 2019 is attributable mainly to a $7.1 million increase in operating revenues, a $6.8 million decrease in net finance expenses and a $0.9 million increase in the operating performance of our equity investment in Gemini Shipholdings Corporation (“Gemini”), which were partially offset by a $5.4 million increase in total operating expenses.

On a non-adjusted basis, our net income amounted to $42.8 million, or $1.73 earnings per diluted share, for the three months ended September 30, 2020 compared to net income of $33.9 million, or $2.20 earnings per diluted share, for the three months ended September 30, 2019.

Operating Revenues

Operating revenues increased by 6.4%, or $7.1 million, to $118.9 million in the three months ended September 30, 2020 from $111.8 million in the three months ended September 30, 2019.

Operating revenues for the three months ended September 30, 2020 reflect:

  • a $11.5 million increase in revenues in the three months ended September 30, 2020 compared to the three months ended September 30, 2019 as a result of contractual increases in charter rates of vessels under long-term charters;
  • a $5.5 million increase in revenues in the three months ended September 30, 2020 compared to the three months ended September 30, 2019 due to the acquisition of new vessels;
  • a $5.6 million decrease in revenues in the three months ended September 30, 2020 compared to the three months ended September 30, 2019 due to lower non-cash revenue recognition in accordance with US GAAP;
  • a $5.1 million decrease in revenues in the three months ended September 30, 2020 compared to the three months ended September 30, 2019 as a result of lower re-chartering rates for certain of our vessels. This decrease is partially due to a $3.9 million decrease in revenues due to the re-chartering of four vessels in our fleet that concluded long-term charters over the last twelve months and were re-deployed at the prevailing lower spot rates at the time these vessels were re-chartered; and
  • a $0.8 million increase in revenues due to higher fleet utilization of our vessels in the three months ended September 30, 2020 compared to the three months ended September 30, 2019.

Vessel Operating Expenses
Vessel operating expenses increased by $2.8 million to $27.7 million in the three months ended September 30, 2020 from $24.9 million in the three months ended September 30, 2019, primarily as a result of the increase in the average number of vessels in our fleet and an overall increase in the average daily operating cost to $5,467 per vessel per day for vessels on time charter for the three months ended September 30, 2020 compared to $5,298 per vessel per day for the three months ended September 30, 2019. Management believes that our daily operating cost are among the most competitive in the industry.

Depreciation & Amortization
Depreciation & Amortization includes Depreciation and Amortization of Deferred Dry-docking and Special Survey Costs.

Depreciation
Depreciation expense increased by 6.2%, or $1.5 million, to $25.8 million in the three months ended September 30, 2020 from $24.3 million in the three months ended September 30, 2019 mainly due to the installation of scrubbers on nine of our vessels and the acquisition of the vessels Niledutch Lion, Phoebe and SM Charleston in the nine months ended September 30, 2020.

Amortization of Deferred Dry-docking and Special Survey Costs
Amortization of deferred dry-docking and special survey costs increased by $0.9 million to $3.2 million in the three months ended September 30, 2020 from $2.3 million in the three months ended September 30, 2019.

General and Administrative Expenses
General and administrative expenses decreased by $0.4 million to $6.0 million in the three months ended September 30, 2020, from $6.4 million in the three months ended September 30, 2019. The decrease was mainly due to decreased non-cash recognition of share-based compensation.

Other Operating Expenses
Other Operating Expenses include Voyage Expenses.

Voyage Expenses
Voyage expenses increased by $0.8 million to $3.6 million in the three months ended September 30, 2020 from $2.8 million in the three months ended September 30, 2019 primarily as a result of the increase in the average number of vessels in our fleet.

Interest Expense and Interest Income
Interest expense decreased by 34.6%, or $6.3 million, to $11.9 million in the three months ended September 30, 2020 from $18.2 million in the three months ended September 30, 2019. The decrease in interest expense is attributable to:

  • a $6.8 million decrease in interest expense due to a decrease in debt service cost of approximately 2.3% and a $84.6 million decrease in our average debt (including leaseback obligations), to $1,518.5 million in the three months ended September 30, 2020, compared to $1,603.1 million in the three months ended September 30, 2019; and
  • a $0.5 million increase in the amortization of deferred finance costs and debt discount related to our 2018 debt refinancing.

As of September 30, 2020, our outstanding bank debt, gross of deferred finance costs, was $1,376.2 million and our leaseback obligation was $129.4 million compared to bank debt of $1,450.0 million and our leaseback obligation of $141.4 million as of September 30, 2019.

Interest income increased to $1.7 million in the three months ended September 30, 2020 compared to $1.6 million in the three months ended September 30, 2019.

Other finance costs, net
Other finance costs, net remained stable at $0.3 million in each of the three months ended September 30, 2020 and September 30, 2019.

Equity income on investments
Equity income on investments increased by $0.9 million to $1.5 million of income on investments in the three months ended September 30, 2020 compared to $0.6 million in the three months ended September 30, 2019 due to the improved operating performance of Gemini, in which the Company has a 49% shareholding interest.

Loss on derivatives
Amortization of deferred realized losses on interest rate swaps remained stable at $0.9 million in each of the three months ended September 30, 2020 and September 30, 2019.

Other income, net
Other income, net was $0.1 million in the three months ended September 30, 2020 compared to nil in the three months ended September 30, 2019.

Adjusted EBITDA
Adjusted EBITDA increased by 5.0%, or $4.0 million, to $83.3 million in the three months ended September 30, 2020 from $79.3 million in the three months ended September 30, 2019. As outlined above, the increase is mainly attributable to a $7.1 million increase in operating revenues and a $0.9 million increase in the operating performance of our equity investees, which were partially offset by a $4.0 million increase in operating expenses. Adjusted EBITDA for the three months ended September 30, 2020 is adjusted for stock based compensation of $0.3 million. Tables reconciling Adjusted EBITDA to Net Income can be found at the end of this earnings release.

Nine months ended September 30, 2020 compared to the nine months ended September 30, 2019

During the nine months ended September 30, 2020, Danaos had an average of 56.9 containerships compared to 55.0 containerships during the nine months ended September 30, 2019. Our fleet utilization for the nine months ended September 30, 2020 was 95.8% compared to 98.8% for the nine months ended September 30, 2019. Adjusted fleet utilization, excluding the effect of 188 days of incremental off-hire due to shipyard delays related to the COVID-19 pandemic, was 97.0% in the nine months ended September 30, 2020.

Our adjusted net income amounted to $123.1 million, or $4.97 per share, for the nine months ended September 30, 2020 compared to $110.7 million, or $7.23 per share, for the nine months ended September 30, 2019. We have adjusted our net income in the nine months ended September 30, 2020 for amortization of non-cash fees and accrued finance fees charge of $12.7 million. Please refer to the Adjusted Net Income reconciliation table, which appears later in this earnings release.

The increase of $12.4 million in adjusted net income for the nine months ended September 30, 2020 compared to the nine months ended September 30, 2019 is attributable mainly to a $13.1 million decrease in net finance expenses, a $4.9 million increase in operating revenues and a $4.2 million increase in the operating performance of our equity investment in Gemini, which were partially offset by a $9.8 million increase in total operating expenses.

On a non-adjusted basis, our net income amounted to $110.4 million, or $4.45 earnings per diluted share, for the nine months ended September 30, 2020 compared to net income of $97.4 million, or $6.36 earnings per diluted share, for the nine months ended September 30, 2019.

Operating Revenues
Operating revenues increased by 1.5%, or $4.9 million, to $341.9 million in the nine months ended September 30, 2020 from $337.0 million in the nine months ended September 30, 2019.

Operating revenues for the nine months ended September 30, 2020 reflect:

  • a $26.2 million increase in revenues in the nine months ended September 30, 2020 compared to the nine months ended September 30, 2019 as a result of contractual increases in charter rates of vessels under long-term charters;
  • a $10.0 million increase in revenues in the nine months ended September 30, 2020 compared to the nine months ended September 30, 2019 due to the acquisition of new vessels;
  • a $6.2 million decrease in revenues due to lower fleet utilization of our vessels in the nine months ended September 30, 2020 compared to the nine months ended September 30, 2019 mainly due to the scheduled installation of scrubbers and dry-dockings of our vessels, of which $3.2 million relates to incremental delays in the Chinese shipyards where these activities were being performed due to the COVID-19 pandemic;
  • a $9.3 million decrease in revenues in the nine months ended September 30, 2020 compared to the nine months ended September 30, 2019 as a result of lower re-chartering rates for certain of our vessels. This decrease is due to a $12.5 million decrease in revenues due to the re-chartering of six vessels in our fleet that concluded long-term charters over the last twelve months and were re-deployed at the prevailing lower spot rates at the time these vessels were re-chartered, partially offset by a $3.2 million improvement from the re-chartering of other vessels in the fleet; and
  • a $15.8 million decrease in revenues in the nine months ended September 30, 2020 compared to the nine months ended September 30, 2019 due to lower non-cash revenue recognition in accordance with US GAAP.

Vessel Operating Expenses
Vessel operating expenses increased by $4.2 million to $82.2 million in the nine months ended September 30, 2020 from $78.0 million in the nine months ended September 30, 2019, primarily as a result of the increase in the average number of vessels in our fleet, partially offset by an overall decrease in the average daily operating cost to $5,592 per vessel per day for vessels on time charter for the nine months ended September 30, 2020 compared to $5,605 per vessel per day for the nine months ended September 30, 2019. Management believes that our daily operating cost are among the most competitive in the industry.

Depreciation & Amortization
Depreciation & Amortization includes Depreciation and Amortization of Deferred Dry-docking and Special Survey Costs.

Depreciation
Depreciation expense increased by 4.9%, or $3.5 million, to $75.6 million in the nine months ended September 30, 2020 from $72.1 million in the nine months ended September 30, 2019 mainly due to the installation of scrubbers on nine of our vessels and the acquisition of the vessels Niledutch Lion, Phoebe and SM Charleston in the nine months ended September 30, 2020.

Amortization of Deferred Dry-docking and Special Survey Costs
Amortization of deferred dry-docking and special survey costs increased by $1.9 million to $8.4 million in the nine months ended September 30, 2020 from $6.5 million in the nine months ended September 30, 2019.

General and Administrative Expenses
General and administrative expenses decreased by $1.9 million to $17.9 million in the nine months ended September 30, 2020, from $19.8 million in the nine months ended September 30, 2019. The decrease was mainly due to decreased non-cash recognition of share-based compensation.

Other Operating Expenses
Other Operating Expenses include Voyage Expenses.

Voyage Expenses
Voyage expenses increased by $2.1 million to $10.9 million in the nine months ended September 30, 2020 from $8.8 million in the nine months ended September 30, 2019 primarily as a result of the increase in the average number of vessels in our fleet.

Interest Expense and Interest Income
Interest expense decreased by 23.7%, or $13.0 million, to $41.9 million in the nine months ended September 30, 2020 from $54.9 million in the nine months ended September 30, 2019. The decrease in interest expense is attributable to:

  • a $12.5 million decrease in interest expense due to a decrease in debt service cost by approximately 1.3% and a $97.3 million decrease in our average debt (including leaseback obligations), to $1,532.5 million in the nine months ended September 30, 2020, compared to $1,629.8 million in the nine months ended September 30, 2019; and
  • a $0.5 million decrease in the amortization of deferred finance costs and debt discount related to our 2018 debt refinancing.

As of September 30, 2020, our outstanding bank debt, gross of deferred finance costs, was $1,376.2 million and our leaseback obligation was $129.4 million compared to bank debt of $1,450.0 million and our leaseback obligation of $141.4 million as of September 30, 2019.

Interest income increased by $0.2 million to $5.0 million in the nine months ended September 30, 2020 compared to $4.8 million in the nine months ended September 30, 2019.

Other finance costs, net
Other finance costs, net decreased by $0.4 million to $2.0 million in the nine months ended September 30, 2020 compared to $2.4 million in the nine months ended September 30, 2019 mainly due to the decrease in finance costs related to the leaseback obligations, partially offset by lease termination fees in the nine months ended September 30, 2020.

Equity income on investments
Equity income on investments increased by $4.2 million to $4.7 million of income on investments in the nine months ended September 30, 2020 compared to $0.5 million in the nine months ended September 30, 2019 due to the improved operating performance of Gemini, in which the Company has a 49% shareholding interest.

Loss on derivatives
Amortization of deferred realized losses on interest rate swaps remained stable at $2.7 million in each of the nine months ended September 30, 2020 and September 30, 2019.

Other income, net
Other income, net was $0.3 million in the nine months ended September 30, 2020 compared to $0.4 million in income in the nine months ended September 30, 2019.

Adjusted EBITDA
Adjusted EBITDA increased by 1.2%, or $2.9 million, to $235.3 million in the nine months ended September 30, 2020 from $232.4 million in the nine months ended September 30, 2019. As outlined above, the increase is mainly attributable to a $4.9 million increase in operating revenues, a $4.2 million increase in the operating performance of our equity investees and a $0.4 million decrease in other finance expenses, which were partially offset by a $6.6 million increase in operating expenses. Adjusted EBITDA for the nine months ended September 30, 2020 is adjusted for stock based compensation of $0.9 million. Tables reconciling Adjusted EBITDA to Net Income can be found at the end of this earnings release.

Recent Developments
On October 12, 2020, we announced the repurchase of 4,339,271 shares of our common stock for an aggregate purchase price of $31.


Contacts

Evangelos Chatzis
Chief Financial Officer
Danaos Corporation
Athens, Greece
Tel.: +30 210 419 6480
E-Mail: This email address is being protected from spambots. You need JavaScript enabled to view it.

Iraklis Prokopakis
Senior Vice President and Chief Operating Officer
Danaos Corporation
Athens, Greece
Tel.: +30 210 419 6400
E-Mail: This email address is being protected from spambots. You need JavaScript enabled to view it.

Investor Relations and Financial Media
Rose & Company
New YorkTel. 212-359-2228
E-Mail: This email address is being protected from spambots. You need JavaScript enabled to view it.


Read full story here

DUBLIN--(BUSINESS WIRE)--The "World - Electric Generating Sets and Rotary Converters - Market Analysis, Forecast, Size, Trends and Insights. Update: COVID-19 Impact" report has been added to ResearchAndMarkets.com's offering.


This report provides an in-depth analysis of the global generator market. Within it, you will discover the latest data on market trends and opportunities by country, consumption, production and price developments, as well as the global trade (imports and exports). The forecast exhibits the market prospects through 2025.

Data coverage:

  • Global market volume and value
  • Per Capita consumption
  • Forecast of the market dynamics in the medium term
  • Global production, split by region and country
  • Global trade (exports and imports)
  • Export and import prices
  • Market trends, drivers and restraints
  • Key market players and their profiles

Reasons to buy this report:

  • Take advantage of the latest data
  • Find deeper insights into current market developments
  • Discover vital success factors affecting the market

This report is designed for manufacturers, distributors, importers, and wholesalers, as well as for investors, consultants and advisors.

In this report, you can find information that helps you to make informed decisions on the following issues:

  1. How to diversify your business and benefit from new market opportunities
  2. How to load your idle production capacity
  3. How to boost your sales on overseas markets
  4. How to increase your profit margins
  5. How to make your supply chain more sustainable
  6. How to reduce your production and supply chain costs
  7. How to outsource production to other countries
  8. How to prepare your business for global expansion

While doing this research, the researchers combined the accumulated expertise of their analysts and the capabilities of artificial intelligence. The AI-based platform, developed by data scientists, constitutes the key working tool for business analysts, empowering them to discover deep insights and ideas from the marketing data.

Key Topics Covered:

1. INTRODUCTION

Making Data-Driven Decisions to Grow Your Business

1.1 REPORT DESCRIPTION

1.2 RESEARCH METHODOLOGY AND AI PLATFORM

1.3 DATA-DRIVEN DECISIONS FOR YOUR BUSINESS

1.4 GLOSSARY AND SPECIFIC TERMS

2. EXECUTIVE SUMMARY

A Quick Overview of Market Performance

2.1 KEY FINDINGS

2.2 MARKET TRENDS

3. MARKET OVERVIEW

Understanding the Current State of The Market and Its Prospects

3.1 MARKET SIZE

3.2 CONSUMPTION BY COUNTRY

3.3 MARKET FORECAST TO 2025

4. MOST PROMISING PRODUCTS

Finding New Products to Diversify Your Business

4.1 TOP PRODUCTS TO DIVERSIFY YOUR BUSINESS

4.2 BEST-SELLING PRODUCTS

4.3 MOST CONSUMED PRODUCT

4.4 MOST TRADED PRODUCT

4.5 MOST PROFITABLE PRODUCT FOR EXPORT

5. MOST PROMISING SUPPLYING COUNTRIES

Choosing the Best Countries to Establish Your Sustainable Supply Chain

This Chapter is Available Only for the Professional Edition

5.1 TOP COUNTRIES TO SOURCE YOUR PRODUCT

5.2 TOP PRODUCING COUNTRIES

5.3 TOP EXPORTING COUNTRIES

5.4 LOW-COST EXPORTING COUNTRIES

6. MOST PROMISING OVERSEAS MARKETS

Choosing the Best Countries to Boost Your Exports

This Chapter is Available Only for the Professional Edition

6.1 TOP OVERSEAS MARKETS FOR EXPORTING YOUR PRODUCT

6.2 TOP CONSUMING MARKETS

6.3 UNSATURATED MARKETS

6.4 TOP IMPORTING MARKETS

6.5 MOST PROFITABLE MARKETS

7. GLOBAL PRODUCTION

The Latest Trends and Insights into The Industry

7.1 PRODUCTION VOLUME AND VALUE

7.2 PRODUCTION BY COUNTRY

8. GLOBAL IMPORTS

The Largest Importers on The Market and How They Succeed

8.1 IMPORTS FROM 2007-2019

8.2 IMPORTS BY COUNTRY

8.3 IMPORT PRICES BY COUNTRY

9. GLOBAL EXPORTS

The Largest Exporters on The Market and How They Succeed

9.1 EXPORTS FROM 2007-2019

9.2 EXPORTS BY COUNTRY

9.3 EXPORT PRICES BY COUNTRY

10. PROFILES OF MAJOR PRODUCERS

The Largest Producers on The Market and Their Profiles

This Chapter is Available Only for the Professional Edition

11. COUNTRY PROFILES

The Largest Markets And Their Profiles

This Chapter is Available Only for the Professional Edition

For more information about this report visit https://www.researchandmarkets.com/r/piz2bf


Contacts

ResearchAndMarkets.com
Laura Wood, Senior Press Manager
This email address is being protected from spambots. You need JavaScript enabled to view it.
For E.S.T Office Hours Call 1-917-300-0470
For U.S./CAN Toll Free Call 1-800-526-8630
For GMT Office Hours Call +353-1-416-8900

FORT WORTH, Texas--(BUSINESS WIRE)--FTS International, Inc. (NYSE American: FTSI) (“FTSI” or the “Company”), today announced that the U.S. Bankruptcy Court for the Southern District of Texas, Houston Division has confirmed its Prepackaged Plan of Reorganization (the "Confirmed Plan").


Under the terms of the Confirmed Plan, which was approved at a hearing on November 4, 2020, the Company accomplished the elimination of all of its prepetition funded debt, approximately $437 million. Importantly, the Confirmed Plan ensures that the Company’s vendors, suppliers, and customers will remain unaffected by the reorganization. The Company’s existing equity holders will also receive a recovery under the Confirmed Plan. Additionally, on November 3, 2020, the Company settled its dispute with Covia Holdings Corporation.

"I am pleased to have reached an agreement with all parties involved and look forward to emerging from Chapter 11 in the next couple of weeks," said Michael Doss, Chief Executive Officer of FTSI. “The overwhelming support by all parties involved and confirmation by the court will allow FTSI to emerge from the process debt-free and in an ideal position to navigate the current environment and take advantage of future opportunities. I appreciate our customers, our vendors, and our employees for working through this process with us and am excited that FTSI will be better positioned than ever before and continue being a leader in the well completions space."

The Company anticipates finalizing the Confirmed Plan over the coming weeks, subject to standard and customary closing procedures and conditions. FTSI anticipates full emergence from Chapter 11 proceedings by the end of November of 2020.

Advisors

Kirkland & Ellis LLP and Winston & Strawn LLP are acting as legal counsel, Lazard is acting as financial advisor, and Alvarez & Marsal LLP is acting as restructuring advisor to the Company in connection with the restructuring. Davis Polk & Wardwell LLP is acting as legal counsel and Ducera Partners LLC and Silver Foundry, LP are acting as financial advisors to the ad hoc group of secured noteholders. Stroock & Stroock & Lavan LLP is acting as legal counsel to the ad hoc group of term lenders.

About FTS International, Inc.

Headquartered in Fort Worth, Texas, FTS is an independent hydraulic fracturing service company and one of the only vertically integrated service providers of its kind in North America.

To learn more, visit www.FTSI.com.

Forward Looking Statements

This press release contains “forward-looking statements” related to future events. Forward-looking statements contain words such as “expect,” “anticipate,” “could,” “should,” “intend,” “plan,” “believe,” “seek,” “see,” “may,” “will,” “would,” or “target.” Forward-looking statements are based on management’s current expectations, beliefs, assumptions and estimates and may include, for example, statements regarding our ability to finalize the Prepackaged Plan and emerge from our Chapter 11 proceedings. These statements are subject to significant risks, uncertainties, and assumptions that are difficult to predict and could cause actual results to differ materially and adversely from those expressed or implied in the forward-looking statements, including risks and uncertainties regarding the Company’s ability to successfully complete a restructuring under Chapter 11, including: consummation of the restructuring; the Company’s ability to meet certain conditions in the RSA; potential adverse effects of pursuing protection under Chapter 11 of the Bankruptcy Code (the “Chapter 11 Cases”) on the Company’s liquidity and results of operations; the Company’s ability to obtain timely approval by the bankruptcy court with respect to the motions filed in the Chapter 11 Cases; objections to the Company’s recapitalization process or other pleadings filed that could protract the Chapter 11 Cases; employee attrition and the Company’s ability to retain senior management and other key personnel due to the distractions and uncertainties; the Company’s ability to comply with financing arrangements; the Company’s ability to maintain relationships with suppliers, customers, employees and other third parties and regulatory authorities as a result of the Chapter 11 Cases and other matters; the effects of the Chapter 11 Cases on the Company and on the interests of various constituents, including holders of the Company’s common stock; the bankruptcy court’s rulings in the Chapter 11 Cases, including the approvals of the terms and conditions of the restructuring and the outcome of the Chapter 11 Cases generally; the length of time that the Company will operate under Chapter 11 protection and the continued availability of operating capital during the pendency of the Chapter 11 Cases; risks associated with third party motions in the Chapter 11 Cases, which may interfere with the Company’s ability to consummate the restructuring or an alternative restructuring transaction; increased administrative and legal costs related to the Chapter 11 process; potential delays in the Chapter 11 process due to the effects of the COVID-19 virus; and other litigation and inherent risks involved in a bankruptcy process. Forward-looking statements are also subject to the risk factors and cautionary language described from time to time in the reports the Company files with the U.S. Securities and Exchange Commission, including those in the Company’s most recent Annual Report on Form 10-K and any updates thereto in the Company’s Quarterly Reports on Form 10-Q and Current Reports on Form 8-K. These risks and uncertainties may cause actual future results to be materially different than those expressed in such forward-looking statements. The Company has no obligation to update or revise these forward-looking statements and does not undertake to do so.


Contacts

Lance Turner
Chief Financial Officer
817-862-2000


Expanded Hedge Coverage, Published 2020 Sustainability Report

HOUSTON--(BUSINESS WIRE)--Murphy Oil Corporation (NYSE: MUR) today announced its financial and operating results for the third quarter ended September 30, 2020, including a net loss attributable to Murphy of $244 million, or $1.59 net loss per diluted share. Adjusted net loss, which excludes discontinued operations and other one-off items, was $24 million, or $0.15 net loss per diluted share.

Unless otherwise noted, the financial and operating highlights and metrics discussed in this commentary exclude noncontrolling interest. 1


Significant items include:

  • Produced 153 thousand barrels of oil equivalent per day in the third quarter, including 56 percent or 86 thousand barrels of oil per day, despite the most severe hurricane season on record  
  • Continued G&A reduction trajectory, with expenses of $29 million in the third quarter compared to $39 million in second quarter 2020
  • Increased 2021 crude oil hedge position, resulting in a total of 18 thousand barrels of oil per day hedged at an average price of $43.31 per barrel
  • Added fixed price forward sales contracts related to the Tupper Montney asset to underpin cash flow in calendar years 2021 through 2024
  • Published 2020 Sustainability Report, with expanded disclosures and greenhouse gas emissions intensity reduction goals

THIRD QUARTER 2020 FINANCIAL RESULTS

The company recorded a net loss, attributable to Murphy, of $244 million, or $1.59 net loss per diluted share, for the third quarter 2020. Adjusted net loss, which excludes both the results of discontinued operations and certain other items that affect comparability of results between periods, was $24 million, or $0.15 net loss per diluted share for the same period. The adjusted loss from continuing operations primarily excludes the following after-tax items: a $55 million non-cash mark-to-market loss on crude oil derivative contracts and an $11 million non-cash mark-to-market loss on liabilities associated with contingent consideration. It also includes an after-tax $146 million non-cash charge for the impairment of certain assets primarily related to the Cascade and Chinook field in the Gulf of Mexico. Details for third quarter results can be found in the attached schedules.

Adjusted earnings before interest, taxes, depreciation and amortization (EBITDA) from continuing operations attributable to Murphy was $249 million, or $17.61 per barrel of oil equivalent (BOE) sold. Adjusted earnings before interest, tax, depreciation, amortization and exploration expenses (EBITDAX) from continuing operations attributable to Murphy was $262 million, or $18.46 per BOE sold. Details for third quarter adjusted EBITDA and EBITDAX reconciliations can be found in the attached schedules.

Third quarter production averaged 153 thousand barrels of oil equivalent per day (MBOEPD) with 56 percent oil and 63 percent liquids. Murphy’s offshore production for the quarter was negatively impacted by an uncharacteristically active hurricane season, resulting in 12.4 MBOEPD of storm-related downtime, compared to 4.8 MBOEPD as guided for storm downtime. Offshore storm downtime was partially offset by stronger performance in the onshore business. Details for third quarter production can be found in the attached schedules.

Murphy, like all Gulf of Mexico operators, experienced the most severe hurricane season on record this year with four major storms during the third quarter causing short-term production shut-ins, as well as two additional storms following in October. Our assets generated strong production aside from these storms and otherwise would have reached the high end of guidance. Our cost structure improvements continue to take hold leading to improving margins. Further, we were able to safely execute evacuating and re-manning processes of our facilities, along with managing COVID-19 concerns with our proven shore base protocols,” stated Roger W. Jenkins, President and Chief Executive Officer of Murphy Oil Corporation.

PROTECTING THE COMPANY’S FINANCIAL POSITION

As of September 30, 2020, Murphy had approximately $1.6 billion of liquidity, comprised of $1.4 billion undrawn under the $1.6 billion senior unsecured credit facility and approximately $220 million of cash and cash equivalents.

At the end of third quarter 2020, Murphy had outstanding debt of $2.8 billion in long-term, fixed-rate notes with a weighted average maturity of 7 years and a weighted average coupon of 5.9 percent. The company also had $200 million drawn under its senior unsecured credit facility.

For third quarter 2020, Murphy incurred a total $120 million of CAPEX, including approximately $19 million for the King’s Quay floating production system (FPS) construction. Note that this total CAPEX figure excludes Gulf of Mexico noncontrolling interest (NCI). Murphy incurred a total $663 million of CAPEX for the nine months ended September 30, 2020, including $81 million for King’s Quay.

The company generated free cash flow of $74 million in the third quarter, including NCI. Excluding the impact of a working capital outflow of $28 million, free cash flow was $102 million.

COMMODITY HEDGE POSITIONS MITIGATE CASH FLOW VOLATILITY

The company employs commodity derivative instruments to manage certain risks associated with commodity price volatility and underpin capital returns associated with certain assets. During the third quarter, Murphy layered on hedges to protect cash flow with the execution of WTI fixed price swaps, resulting in a total 18 thousand barrels of oil per day (MBOPD) hedged for full year 2021 at an average price of $43.31 per barrel. Also during the quarter, the company entered into fixed price forward sales contracts for the delivery of 20 million cubic feet per day (MMCFD) at the Malin hub in Oregon at an average price of $2.60 per thousand cubic feet (MCF) for calendar years 2021 and 2022.

Subsequent to quarter end, Murphy entered into fixed price forward sales contracts for physical delivery at the AECO hub in Canada for calendar year 2021, resulting in total contracts of 96 MMCFD at an average price of C$2.53 per MCF. Murphy further extended its price protection with fixed price forward sales contracts at AECO for full years 2022 through 2024 for the delivery of 71 MMCFD at an average price of C$2.50 per MCF.

Details for the current hedge positions can be found in the attached schedules.

FOURTH QUARTER 2020 GUIDANCE

Murphy reaffirms its previously stated full year 2020 capital budget guidance of $680 million to $720 million, excluding Gulf of Mexico NCI and King’s Quay floating production system (FPS) construction spending. In the fourth quarter, Murphy anticipates production volumes of approximately 146 MBOEPD to 154 MBOEPD. This guidance range is primarily affected by two factors – Gulf of Mexico storm downtime of 8.2 MBOEPD due to impacts from hurricanes Delta and Zeta, as well as 6.4 MBOEPD of planned downtime.

OPERATIONS SUMMARY

North American Onshore
The North American onshore business produced approximately 90 MBOEPD in the third quarter. No operated drilling and completions activity is planned across the onshore business for the remainder of 2020.

Eagle Ford Shale – Production averaged 35 MBOEPD with 71 percent oil volumes in the third quarter. As planned, eight non-operated Karnes wells came online in the quarter. Murphy’s operating partner plans to drill four Karnes wells during the fourth quarter, with completions anticipated in early 2021.

Tupper Montney – For the quarter, natural gas production averaged 235 MMCFD. No drilling or completions activity occurred in the third quarter.

Kaybob Duvernay – Production averaged 13 MBOEPD in the third quarter. Four wells were brought online during the quarter.

Placid Montney – Murphy’s non-operated position produced 3 MBOEPD in the third quarter. As previously disclosed, six non-operated wells resumed production in July after being shut in for May and June due to low commodity prices.

Global Offshore
The offshore business produced 63 MBOEPD in the third quarter, comprised of 82 percent oil. This excludes production from discontinued operations and noncontrolling interest. Gulf of Mexico production in the quarter averaged 59 MBOEPD, consisting of 80 percent oil. Canada offshore production averaged 4 MBOEPD, comprised of 100 percent oil.

EXPLORATION

Gulf of Mexico – The non-operated Highgarden well (Green Canyon 895) was spud in the third quarter for an estimated $11 million cost net to Murphy as a 20 percent working interest owner. Drilling was delayed due to an active Gulf of Mexico storm season.

SUSTAINABILITY REPORT

Subsequent to quarter-end, Murphy published its 2020 Sustainability Report, taking into consideration various third-party reporting standards and ratings, and including additional disclosures spanning climate-related performance metrics to workforce diversity. As part of this report, the company announced its goal of reducing its greenhouse gas emissions intensity by 15 to 20 percent by 2030 from 2019 levels, excluding Malaysia.

CONFERENCE CALL AND WEBCAST SCHEDULED FOR NOVEMBER 5, 2020

Murphy will host a conference call to discuss third quarter 2020 financial and operating results on Thursday, November 5, 2020, at 9:00 a.m. ET. The call can be accessed either via the Internet through the Investor Relations section of Murphy Oil’s website at http://ir.murphyoilcorp.com or via the telephone by dialing toll free 1-888-886-7786, reservation number 19218031.

FINANCIAL DATA

Summary financial data and operating statistics for third quarter 2020, with comparisons to the same period from the previous year, are contained in the following schedules. Additionally, a schedule indicating the impacts of items affecting comparability of results between periods, a reconciliation of EBITDA and EBITDAX between periods, as well as guidance for the fourth quarter 2020, are also included.

1 In accordance with GAAP, Murphy reports the 100 percent interest, including a 20 percent noncontrolling interest (NCI), in its subsidiary, MP Gulf of Mexico, LLC (MP GOM). The GAAP financials include the NCI portion of revenue, costs, assets and liabilities and cash flows. Unless otherwise noted, the financial and operating highlights and metrics discussed in this news release, but not the accompanying schedules, exclude the NCI, thereby representing only the amounts attributable to Murphy.

ABOUT MURPHY OIL CORPORATION

As an independent oil and natural gas exploration and production company, Murphy Oil Corporation believes in providing energy that empowers people by doing right always, staying with it and thinking beyond possible. It challenges the norm, taps into its strong legacy and uses its foresight and financial discipline to deliver inspired energy solutions. Murphy sees a future where it is an industry leader who is positively impacting lives for the next 100 years and beyond. Additional information can be found on the company’s website at www.murphyoilcorp.com.

FORWARD-LOOKING STATEMENTS

This news release contains forward-looking statements within the meaning of the Private Securities Litigation Reform Act of 1995. Forward-looking statements are generally identified through the inclusion of words such as “aim”, “anticipate”, “believe”, “drive”, “estimate”, “expect”, “expressed confidence”, “forecast”, “future”, “goal”, “guidance”, “intend”, “may”, “objective”, “outlook”, “plan”, “position”, “potential”, “project”, “seek”, “should”, “strategy”, “target”, “will” or variations of such words and other similar expressions. These statements, which express management’s current views concerning future events or results, are subject to inherent risks and uncertainties. Factors that could cause one or more of these future events or results not to occur as implied by any forward-looking statement include, but are not limited to: macro conditions in the oil and gas industry, including supply/demand levels, actions taken by major oil exporters and the resulting impacts on commodity prices; increased volatility or deterioration in the success rate of our exploration programs or in our ability to maintain production rates and replace reserves; reduced customer demand for our products due to environmental, regulatory, technological or other reasons; adverse foreign exchange movements; political and regulatory instability in the markets where we do business; the impact on our operations or market of health pandemics such as COVID-19 and related government responses; other natural hazards impacting our operations or markets; any other deterioration in our business, markets or prospects; any failure to obtain necessary regulatory approvals; any inability to service or refinance our outstanding debt or to access debt markets at acceptable prices; or adverse developments in the U.S. or global capital markets, credit markets or economies in general. For further discussion of factors that could cause one or more of these future events or results not to occur as implied by any forward-looking statement, see “Risk Factors” in our most recent Annual Report on Form 10-K filed with the U.S. Securities and Exchange Commission (“SEC”) and any subsequent Quarterly Report on Form 10-Q or Current Report on Form 8-K that we file, available from the SEC’s website and from Murphy Oil Corporation’s website at http://ir.murphyoilcorp.com. Murphy Oil Corporation undertakes no duty to publicly update or revise any forward-looking statements.

NON-GAAP FINANCIAL MEASURES

This news release contains certain non-GAAP financial measures that management believes are useful tools for internal use and the investment community in evaluating Murphy Oil Corporation’s overall financial performance. These non-GAAP financial measures are broadly used to value and compare companies in the crude oil and natural gas industry. Not all companies define these measures in the same way. In addition, these non-GAAP financial measures are not a substitute for financial measures prepared in accordance with GAAP and should therefore be considered only as supplemental to such GAAP financial measures. Please see the attached schedules for reconciliations of the differences between the non-GAAP financial measures used in this news release and the most directly comparable GAAP financial measures.


MURPHY OIL CORPORATION

SUMMARIZED CONSOLIDATED STATEMENTS OF OPERATIONS (unaudited)


Three Months Ended
September 30,


Nine Months Ended
September 30,

(Thousands of dollars, except per share amounts)


2020


2019


2020


2019

Revenues and other income


Revenue from sales to customers


$

425,324


750,337


1,311,627


2,060,127


(Loss) gain on crude contracts


(5,290

)


63,247


319,502


121,163


Gain on sale of assets and other income


1,831


3,493


6,006


10,283


Total revenues and other income


421,865


817,077


1,637,135


2,191,573


Costs and expenses


Lease operating expenses


124,491


147,632


478,283


416,460


Severance and ad valorem taxes


6,781


13,803


22,645


36,972


Transportation, gathering and processing


41,322


54,305


126,779


128,748


Exploration expenses, including undeveloped lease amortization


12,092


12,358


61,686


75,570


Selling and general expenses


28,509


55,366


104,381


176,258


Restructuring expenses


4,982


46,379


Depreciation, depletion and amortization


231,603


325,562


769,151


819,270


Accretion of asset retirement obligations


10,778


10,587


31,213


29,824


Impairment of assets


219,138


1,206,284


Other (benefit) expense


20,224


(29,000

)


(2,957

)


26,442


Total costs and expenses


699,920


590,613


2,843,844


1,709,544


Operating (loss) income from continuing operations


(278,055

)


226,464


(1,206,709

)


482,029


Other (loss)


Interest and other (loss)


(5,177

)


(4,418

)


(10,107

)


(18,134

)

Interest expense, net


(45,182

)


(44,930

)


(124,877

)


(145,095

)

Total other (loss)


(50,359

)


(49,348

)


(134,984

)


(163,229

)

(Loss) income from continuing operations before income taxes


(328,414

)


177,116


(1,341,693

)


318,800


Income tax (benefit) expense


(62,584

)


18,782


(248,890

)


38,719


(Loss) income from continuing operations


(265,830

)


158,334


(1,092,803

)


280,081


(Loss) income from discontinued operations, net of income taxes


(778

)


953,368


(6,907

)


1,027,632


Net (loss) income including noncontrolling interest


(266,608

)


1,111,702


(1,099,710

)


1,307,713


Less: Net (loss) income attributable to noncontrolling interest


(23,055

)


22,700


(122,869

)


86,257


NET (LOSS) INCOME ATTRIBUTABLE TO MURPHY


$

(243,553

)


1,089,002


(976,841

)


1,221,456


(LOSS) INCOME PER COMMON SHARE – BASIC


Continuing operations


$

(1.58

)


0.85


(6.31

)


1.16


Discontinued operations


(0.01

)


5.94


(0.05

)


6.14


Net (loss) income


$

(1.59

)


6.79


(6.36

)


7.30


(LOSS) INCOME PER COMMON SHARE – DILUTED


Continuing operations


$

(1.58

)


0.84


(6.31

)


1.16


Discontinued operations


(0.01

)


5.92


(0.05

)


6.11


Net (loss) income


$

(1.59

)


6.76


(6.36

)


7.27


Cash dividends per Common share


0.125


0.25


0.50


0.75


Average Common shares outstanding (thousands)


Basic


153,596


160,366


153,480


167,310


Diluted


153,596


160,980


153,480


168,105


MURPHY OIL CORPORATION

CONSOLIDATED STATEMENTS OF CASH FLOWS (unaudited)


Three Months Ended
September 30,


Nine Months Ended
September 30,

(Thousands of dollars)


2020


2019


2020


2019

Operating Activities


Net (loss) income including noncontrolling interest


$

(266,608

)


1,111,702


(1,099,710

)


1,307,713


Adjustments to reconcile net (loss) income to net cash provided by continuing operations activities:


Loss (income) from discontinued operations


778


(953,368

)


6,907


(1,027,632

)

Depreciation, depletion and amortization


231,603


325,562


769,151


819,270


Previously suspended exploration costs


578


8,255


12,901


Amortization of undeveloped leases


7,181


6,530


21,951


21,680


Accretion of asset retirement obligations


10,778


10,587


31,213


29,824


Impairment of assets


219,138


1,206,284


Deferred income tax (benefit) expense


(63,846

)


32,596


(231,748

)


50,597


Mark to market (gain) loss on contingent consideration


14,053


(28,378

)


(29,476

)


512


Mark to market (gain) loss of crude contracts


69,385


(49,245

)


(104,463

)


(100,076

)

Noncash restructuring expense


17,565


Long-term non-cash compensation


12,440


15,812


35,200


60,567


Net decrease (increase) in noncash operating working capital


(27,596

)


45,623


(26,261

)


40,257


Other operating activities, net


768


(19,274

)


(26,837

)


(62,386

)

Net cash provided by continuing operations activities


208,652


497,796


578,031


1,153,227


Investing Activities


Property additions and dry hole costs


(111,124

)


(350,340

)


(648,725

)


(995,509

)

Property additions for King's Quay FPS


(23,301

)


(13,637

)


(74,936

)


(13,637

)

Acquisition of oil and gas properties


13,312


(1,212,949

)

Proceeds from sales of property, plant and equipment


2,256


19,072


Net cash required by investing activities


(134,425

)


(348,409

)


(723,661

)


(2,203,023

)

Financing Activities


Borrowings on revolving credit facility


80,000


500,000


450,000


1,575,000


Repayment of revolving credit facility


(50,000

)


(1,900,000

)


(250,000

)


(1,900,000

)

Cash dividends paid


(19,200

)


(39,934

)


(76,790

)


(125,437

)

Distributions to noncontrolling interest


(11,273

)


(28,734

)


(43,673

)


(97,510

)

Early retirement of debt


(12,225

)


Withholding tax on stock-based incentive awards


153


(7,094

)


(6,991

)

Debt issuance, net of cost


(613

)


Repayment of term loan and other loans


(371

)


(500,000

)


Capital lease obligation payments


(178

)


(175

)


(514

)


(510

)

Repurchase of common stock


(106,014

)


(405,938

)

Net cash (required) provided by financing activities


(869

)


(2,074,857

)


59,091


(961,386

)

Cash Flows from Discontinued Operations 1


Operating activities


(47,911

)


(1,202

)


74,361


Investing activities


2,035,000


4,494


1,985,202


Financing activities


(4,914

)

Net cash provided by discontinued operations


1,987,089


3,292


2,054,649


Cash transferred from discontinued operations to continuing operations


2,035,000


2,083,565


Effect of exchange rate changes on cash and cash equivalents


773


(675

)


(585

)


2,593


Net increase (decrease) in cash and cash equivalents


74,131


108,855


(87,124

)


74,976


Cash and cash equivalents at beginning of period


145,505


326,044


306,760


359,923


Cash and cash equivalents at end of period


$

219,636


434,899


219,636


434,899


1 Net cash provided by discontinued operations is not part of the cash flow reconciliation.


MURPHY OIL CORPORATION

SCHEDULE OF ADJUSTED INCOME (LOSS)

(unaudited)


Three Months Ended
September 30,


Nine Months Ended
September 30,

(Millions of dollars, except per share amounts)


2020


2019


2020


2019

Net (loss) income attributable to Murphy (GAAP)


$

(243.6

)


1,089.0


(976.8

)


1,221.5


Discontinued operations loss (income)


0.8


(953.4

)


6.9


(1,027.6

)

(Loss) income from continuing operations


(242.8

)


135.6


(969.9

)


193.9


Adjustments (after tax):


Impairment of assets


145.9


854.2


Mark-to-market loss (gain) on crude oil derivative contracts


54.8


(38.9

)


(82.5

)


(79.1

)

Mark-to-market loss (gain) on contingent consideration


11.1


(22.4

)


(23.3

)


0.4


Restructuring expenses


3.9


35.5


Unutilized rig charges


4.1


10.4


(Gain) loss on extinguishment of debt


(4.2

)


Inventory loss


3.8


Foreign exchange losses (gains)


0.8


0.8


(1.7

)


5.9


Business development transaction costs


3.3


19.3


Write-off of previously suspended exploration wells


13.2


Impact of tax reform


(13.0

)

Tax benefits on investments in foreign areas


(15.0

)


(15.0

)

Seal insurance proceeds


(1.3

)


(6.2

)


(1.3

)


(6.2

)

Total adjustments after taxes


219.3


(78.4

)


790.9


(74.5

)

Adjusted (loss) income from continuing operations attributable to Murphy


$

(23.5

)


57.2


(179.0

)


119.4


Adjusted (loss) income from continuing operations per average diluted share


$

(0.15

)


0.36


(1.17

)


0.71


Non-GAAP Financial Measures

Presented above is a reconciliation of Net (loss) income to Adjusted (loss) income from continuing operations attributable to Murphy. Adjusted (loss) income excludes certain items that management believes affect the comparability of results between periods. Management believes this is important information to provide because it is used by management to evaluate the Company’s operational performance and trends between periods and relative to its industry competitors. Management also believes this information may be useful to investors and analysts to gain a better understanding of the Company’s financial results. Adjusted (loss) income is a non-GAAP financial measure and should not be considered a substitute for Net (loss) income as determined in accordance with accounting principles generally accepted in the United States of America.


Contacts

Investor Contacts:
Kelly Whitley, This email address is being protected from spambots. You need JavaScript enabled to view it., 281-675-9107
Megan Larson, This email address is being protected from spambots. You need JavaScript enabled to view it., 281-675-9470


Read full story here

Conference Call with Bloom Executives to Discuss Bloom Energy’s Approach to Hydrogen

SAN JOSE, Calif.--(BUSINESS WIRE)--Bloom Energy Corporation (NYSE: BE) today announced it will host an investor conference call and question and answer session on November 18, 2020 at 4:30 p.m. EST/ 1:30 p.m. PST. Venkat Venkataraman, EVP, engineering and chief technology officer, and Sharelynn Moore, EVP and chief marketing officer, will join Scott Reynolds, global head of structured finance, for an in-depth discussion about the company’s approach to hydrogen and to provide an update on Bloom’s entry into the commercial hydrogen market and its hydrogen-powered fuel cells.

Conference Call Details
Date: November 18, 2020
Time: 4:30 PM ET / 1:30 PM PT
US Dial-in (Toll-free): 1-844-828-0524
International Dial-in (Toll): 1-647-689-5146
Conference ID: 4376034

A telephonic replay will be available until November 25, 2020 by dialing US toll-free 1-800-585-8367, or by international toll 1-416-621-4642, and entering passcode 4376034.

A simultaneous live webcast will also be available under the Investor Relations section on Bloom Energy’s website at https://investor.bloomenergy.com/. Following the webcast, an archived version will be available on Bloom Energy’s website for one year.

About Bloom Energy

Bloom Energy’s mission is to make clean, reliable energy affordable for everyone in the world. Bloom Energy’s product, the Bloom Energy Server, delivers highly reliable and resilient, always-on electric power that is clean, cost-effective, and ideal for microgrid applications. Bloom’s customers include many Fortune 100 companies and leaders in manufacturing, data centers, healthcare, retail, higher education, utilities, and other industries. For more information, visit www.bloomenergy.com.


Contacts

Investor Relations:
This email address is being protected from spambots. You need JavaScript enabled to view it.

Media Relations
Jennifer Duffourg
Bloom Energy
+1 (480) 341-5464
This email address is being protected from spambots. You need JavaScript enabled to view it.

  • Utilities led company with strong third quarter results
  • Raising 2020 Utility EPS guidance range to $1.12 - $1.20 and reiterating 5% - 7% Utility EPS guidance basis growth rate target
  • Third quarter 2020 GAAP results include after-tax non-cash impairment charges of $92 million or $0.15 per diluted share for the company's share of impairment charges recorded by Enable

HOUSTON--(BUSINESS WIRE)--CenterPoint Energy, Inc. (NYSE: CNP) today reported income available to common shareholders of $69 million, or $0.13 per diluted share, for the third quarter of 2020, compared to income available to common shareholders of $241 million, or $0.47 per diluted share, for the third quarter of 2019. The third quarter 2020 results included after-tax non-cash impairment charges of $92 million or $0.15 per diluted share for the company’s share of impairment charges recorded by Enable Midstream Partners, LP (“Enable”).


On a guidance basis, third quarter 2020 earnings were $0.34 per diluted share, with $0.29 per diluted share from utility operations, and $0.05 per diluted share from midstream investments, excluding non-cash impairment charges. Third quarter 2019 earnings, on a guidance basis, were $0.47 per diluted share, with $0.39 per diluted share from utility operations and $0.08 per diluted share from midstream investments. See “Reconciliation of Consolidated income (loss) available to common shareholders and diluted earnings (loss) per share (GAAP) to guidance basis income and guidance basis diluted earnings per share (Non-GAAP)” and “Earnings Outlook and Non-GAAP Considerations” below.

Our strong third quarter results confirm our commitment to delivering value for our customers and shareholders,” said Dave Lesar, President and Chief Executive Officer of CenterPoint Energy. “Given the strength of our results, we are raising our 2020 guidance basis Utility EPS range to $1.12 - $1.20.”

Lesar added, “We also recently concluded the work of the Business Review and Evaluation Committee of the Board. We are eager to share our strategy and invite investors to join management for a virtual Investor Day on December 7, 2020.”

During our Investor Day, we will highlight our updated long-term annual rate base growth projection of approximately 10%. This rate base growth is central to our strategy to deliver consistent year-over-year earnings growth to investors and improve service to our customers. The projected additional capital expenditures driving this 10% annual rate base growth not only put us in a position to reiterate our 5% - 7% five-year guidance basis Utility EPS annual growth target, but gives us confidence in being able to deliver results at the top end of that range. I remain greatly energized about CenterPoint Energy’s future and will continue to work tirelessly to drive maximum value for all of our stakeholders.”

Earnings Outlook and Non-GAAP Considerations

To provide greater transparency on utility earnings, 2020 guidance will be presented in two components, a guidance basis Utility EPS range and a Midstream Investments EPS expected range.

In addition to presenting its financial results in accordance with GAAP, including presentation of income (loss) available to common shareholders and diluted earnings (loss) per share, CenterPoint Energy provides guidance based on guidance basis income and guidance basis diluted earnings per share, which are non-GAAP financial measures. Generally, a non-GAAP financial measure is a numerical measure of a company’s historical or future financial performance that excludes or includes amounts that are not normally excluded or included in the most directly comparable GAAP financial measure.

Management evaluates CenterPoint Energy’s financial performance in part based on guidance basis earnings per share. Management believes that presenting these non-GAAP financial measures enhances an investor’s understanding of CenterPoint Energy’s overall financial performance, including the impact of its Enable investment, by providing them with an additional meaningful and relevant comparison of current and anticipated future results across periods. The adjustments made in these non-GAAP financial measures exclude items that Management believes do not most accurately reflect the company’s fundamental business performance. These excluded items are reflected in the reconciliation tables of this news release, where applicable. CenterPoint Energy’s guidance basis income and guidance basis diluted earnings per share non-GAAP financial measures should be considered as a supplement to, and not as a substitute for, or superior to, income available to common shareholders and diluted earnings per share, which respectively are the most directly comparable GAAP financial measures. These non-GAAP financial measures also may be different than non-GAAP financial measures used by other companies.

(1) Utility EPS Guidance Range

  • The Utility EPS guidance range includes net income from Houston Electric, Indiana Electric and Natural Gas Distribution segments, as well as after tax Corporate and Other operating income.
  • The 2020 Utility EPS guidance range reflects dilution and earnings as if the Series C preferred stock were issued as common stock.
  • The Utility EPS guidance excludes:
    • Earnings or losses from the change in value of ZENS and related securities
    • Certain expenses associated with merger integration and Business Review and Evaluation Committee activities
    • Severance costs
    • Results related to Infrastructure Services and Energy Services, including costs and impairment resulting from the sale of those businesses
    • Midstream Investments and allocation of associated corporate overhead

In providing this guidance, CenterPoint Energy does not consider the items noted above and other potential impacts such as changes in accounting standards, impairments or other unusual items, which could have a material impact on GAAP reported results for the applicable guidance period. The 2020 Utility EPS guidance range also considers operations performance to date and assumptions for certain significant variables that may impact earnings, such as customer growth (above 2% for electric operations and 1% for natural gas distribution) and usage including normal weather, throughput, recovery of capital invested, effective tax rates, financing activities and related interest rates, regulatory and judicial proceedings, and anticipated cost savings as a result of the merger. In addition, the Utility EPS guidance range incorporates a full-year COVID-19 scenario range of $0.10 - $0.15 which assumes reduced demand levels and miscellaneous revenues with the second quarter as the peak and reflects anticipated deferral and recovery of certain incremental expenses, including bad debt. The COVID-19 scenario range also assumes a gradual re-opening of the economy in CenterPoint Energy's service territories, with anticipated reduced demand and lower miscellaneous revenues over the remainder of 2020. The 2020 Utility EPS guidance range also assumes an allocation of corporate overhead based upon its relative earnings contribution. Corporate overhead consists of interest expense, preferred stock dividend requirements, income on Enable preferred units and other items directly attributable to the parent along with the associated income taxes. CenterPoint Energy is unable to present a quantitative reconciliation of forward-looking guidance basis diluted earnings per share because changes in the value of ZENS and related securities, future impairments, and other unusual items are not estimable and are difficult to predict due to various factors outside of management’s control.

(2) Midstream Investments EPS Expected Range

The 2020 Midstream Investments EPS expected range is $0.15 - $0.18. In providing this EPS expected range for Midstream Investments, CenterPoint Energy assumes a 53.7 percent ownership of Enable's common units and includes the amortization of its basis differential in Enable and assumes an allocation of its corporate overhead based upon Midstream Investments relative earnings contribution. The Midstream Investments EPS expected range reflects dilution and earnings as if CenterPoint Energy's Series C preferred stock were issued as common stock. The Midstream Investments EPS expected range takes into account such factors as Enable’s most recent public outlook for 2020 dated November 4, 2020, and effective tax rates. In providing this 2020 guidance, CenterPoint Energy uses a non-GAAP measure of guidance basis diluted earnings per share that does not consider other potential impacts such as changes in accounting standards, impairments or Enable’s unusual items, which could have a material impact on GAAP reported results for the applicable guidance period. CenterPoint Energy is unable to present a quantitative reconciliation of forward looking guidance basis diluted earnings per share because changes in Enable’s outlook, future impairments related to Midstream Investments or Enable’s unusual items are not estimable and are difficult to predict due to various factors outside of CenterPoint Energy management’s control.

Reconciliation of Consolidated income (loss) available to common shareholders and diluted earnings (loss) per share (GAAP) to guidance basis income and guidance basis diluted earnings per share (Non-GAAP)


Quarter Ended

September 30, 2020


Utility Operations


Midstream
Investments


Corporate and
Other (6)


CES(1) & CIS(2)

(Disc. Operations)


Consolidated


Dollars
in
millions

Diluted
EPS (3)


Dollars
in
millions

Diluted
EPS (3)


Dollars
in
millions

Diluted
EPS (3)


Dollars
in
millions

Diluted
EPS (3)


Dollars
in
millions

Diluted
EPS (3)

Consolidated income (loss) available to common shareholders and diluted EPS


$

193


$

0.35


$

(62)


$

(0.11)


$

(56)


$

(0.10)


$

(6)


$

(0.01)


$

69


$

0.13


ZENS-related mark-to-market (gains) losses:


Marketable securities (net of taxes of $18)(4)(5)


(65)


(0.12)


(65)


(0.12)


Indexed debt securities (net of taxes of $18)(4)


66


0.12


66


0.12


Impacts associated with the Vectren merger (net of taxes of $0, $1)(4)


2


2


0.01


4


0.01


Severance costs (net of taxes of $1)(4)


4


0.01


4


0.01


Impacts associated with the sales of CES (1) and CIS (2) (net of taxes of $0)(4)


7


0.01


7


0.01


Impacts associated with Series C preferred stock


Preferred stock dividend requirement and amortization of beneficial conversion feature


23


0.04


23


0.04


Impact of increased share count on EPS if issued as common stock


(0.03)


0.01


0.01


(0.01)


Total Series C preferred stock impacts


(0.03)


0.01


23


0.05


23


0.03


Loss on impairment (net of taxes of $29)(4)


92


0.15


92


0.15


Corporate and Other Allocation


(26)


(0.04)


(3)


30


0.04


(1)


Consolidated on a guidance basis


$

173


$

0.29


$

27


$

0.05


$


$


$


$


$

200


$

0.34


(1) Energy Services segment

(2) Infrastructure Services segment

(3) Quarterly diluted EPS on both a GAAP and guidance basis are based on the weighted average number of shares of common stock outstanding during the quarter, and the sum of the quarters may not equal year-to-date diluted EPS

(4) Taxes are computed based on the impact removing such item would have on tax expense

(5) Comprised of common stock of AT&T Inc. and Charter Communications, Inc.

(6) Corporate and Other, plus income allocated to preferred shareholders

Quarter Ended

September 30, 2019


Utility Operations


Midstream
Investments


Corporate and
Other (6)


CES(1) & CIS(2)

(Disc. Operations)


Consolidated


Dollars
in
millions

Diluted
EPS (3)


Dollars
in
millions

Diluted
EPS (3)


Dollars
in
millions

Diluted
EPS (3)


Dollars
in
millions

Diluted
EPS (3)


Dollars
in
millions

Diluted
EPS (3)

Consolidated income (loss) available to common shareholders and diluted EPS


$

225


$

0.44


$

50


$

0.10


$

(53

$

(0.10))


$

19


$

0.03


$

241


$

0.47


Timing effects impacting CES (1):


Mark-to-market (gains) losses (net of taxes of $1)(4)


1


1


ZENS-related mark-to-market (gains) losses:


Marketable securities (net of taxes of $12)(4)(5)


(47

(0.09


(47

(0.09

Indexed debt securities (net of taxes of $12) (4)


50


0.10


50


0.10


Impacts associated with the Vectren merger (net of taxes of $2, $7, $1)(4)


3


0.01


13


0.03


4


0.01


20


0.05


Corporate and Other Allocation


(34

(0.06


(8

(0.02


37


0.06


5


0.02


Exclusion of Discontinued Operations (7)


(29

(0.06


(29

(0.06


Consolidated on a guidance basis


$

194


$

0.39


$

42


$

0.08


$


$


$


$


$

236


$

0.47


(1) Energy Services segment

(2) Infrastructure Services segment

(3) Quarterly diluted EPS on both a GAAP and guidance basis are based on the weighted average number of shares of common stock outstanding during the quarter, and the sum of the quarters may not equal year-to-date diluted EPS

(4) Taxes are computed based on the impact removing such item would have on tax expense

(5) Comprised of common stock of AT&T Inc. and Charter Communications, Inc.

(6) Corporate and Other, plus income allocated to preferred shareholders

(7) Results related to discontinued operations are excluded from the company's guidance basis results

Filing of Form 10-Q for CenterPoint Energy, Inc.

Today, CenterPoint Energy, Inc. filed with the Securities and Exchange Commission (SEC) its Quarterly Report on Form 10-Q for the quarter ended September 30, 2020. A copy of that report is available on the company’s website, under the Investors section. Investors and others should note that we may announce material information using SEC filings, press releases, public conference calls, webcasts, and the Investor Relations page of our website. In the future, we will continue to use these channels to distribute material information about the company and to communicate important information about the company, key personnel, corporate initiatives, regulatory updates and other matters. Information that we post on our website could be deemed material; therefore we encourage investors, the media, our customers, business partners and others interested in our company to review the information we post on our website.

Webcast of Earnings Conference Call

CenterPoint Energy’s management will host an earnings conference call on Thursday, November 5, 2020, at 7:00 a.m. Central time/8:00 a.m. Eastern time. Interested parties may listen to a live audio broadcast of the conference call on the company’s website under the Investors section. A replay of the call can be accessed approximately two hours after the completion of the call and will be archived on the website for at least one year.

About CenterPoint Energy, Inc.

As the only investor owned electric and gas utility based in Texas, CenterPoint Energy, Inc. (NYSE: CNP) is an energy delivery company with electric transmission and distribution, power generation and natural gas distribution operations that serve more than 7 million metered customers in Arkansas, Indiana, Louisiana, Minnesota, Mississippi, Ohio, Oklahoma and Texas. As of September 30, 2020, the company owned approximately $33 billion in assets and also owned 53.7 percent of the common units representing limited partner interests in Enable Midstream Partners, LP, a publicly traded master limited partnership that owns, operates and develops strategically located natural gas and crude oil infrastructure assets. With approximately 9,600 employees, CenterPoint Energy and its predecessor companies have been in business for more than 150 years. For more information, visit CenterPointEnergy.com.

Forward-looking Statements

This news release includes, and the earnings conference call will include, forward-looking statements within the meaning of the Private Securities Litigation Reform Act of 1995. When used in this news release, the words "anticipate," "believe," "continue," "could," "estimate," "expect," "forecast," "goal," "intend," "may," "objective," "plan," "potential," "predict," "projection," "should," "target," "will" or other similar words are intended to identify forward-looking statements. These forward-looking statements are based upon assumptions of management which are believed to be reasonable at the time made and are subject to significant risks and uncertainties. Actual events and results may differ materially from those expressed or implied by these forward-looking statements. Any statements in this news release or on the earnings conference call regarding capital investments, rate base growth and our ability to achieve it, future earnings and guidance, including long-term growth rate, and future financial performance and results of operations, including, but not limited to the impact of COVID-19, including with respect to regulatory actions and the COVID-19 scenario range discussed in this news release, the Business Review and Evaluation Committee’s review process and outcomes, value creation, opportunities and expectations and any other statements that are not historical facts are forward-looking statements. Each forward-looking statement contained in this news release or discussed on the earnings conference call speaks only as of the date of this release or the earnings conference call.

Important factors that could cause actual results to differ materially from those indicated by the provided forward-looking information include, but are not limited to, risks and uncertainties relating to: (1) the performance of Enable, the amount of cash distributions CenterPoint Energy receives from Enable, and the value of CenterPoint Energy’s interest in Enable; (2) CenterPoint Energy's expected benefits of the merger with Vectren Corporation (Vectren) and integration, including the ability to successfully integrate the Vectren businesses and to realize anticipated benefits and commercial opportunities; (3) financial market and general economic conditions, including access to debt and equity capital and the effect on sales, prices and costs; (4) industrial, commercial and residential growth in CenterPoint Energy’s service territories and changes in market demand; (5) actions by credit rating agencies, including any potential downgrades to credit ratings; (6) the timing and impact of future regulatory and legal proceedings; (7) legislative decisions, including tax and developments related to the environment such as global climate change, air emissions, carbon, waste water discharges and the handling of coal combustion residuals, among others, and CenterPoint Energy’s carbon reduction targets; (8) the impact of the COVID-19 pandemic; (9) the recording of impairment charges, including any impairments related to CenterPoint Energy’s investment in Enable; (10) weather variations and CenterPoint Energy’s ability to mitigate weather impacts; (11) changes in business plans; (12) CenterPoint Energy's ability to fund and invest planned capital, including timely and appropriate rate actions that allow recovery of costs and a reasonable return on investment; (13) CenterPoint Energy’s or Enable’s potential business strategies and strategic initiatives, including the recommendations and outcomes of the Business Review and Evaluation Committee, restructurings, joint ventures and acquisitions or dispositions of assets or businesses, which may not be completed or result in the benefits anticipated by CenterPoint Energy or Enable; (14) CenterPoint Energy’s ability to execute operations and maintenance management initiatives; and (15) other factors discussed in CenterPoint Energy’s Annual Report on Form 10-K for the fiscal year ended December 31, 2019, CenterPoint Energy’s Quarterly Report on Form 10-Q for the quarters ended March 31, 2020, June 30, 2020 and September 30, 2020, including in the “Risk Factors” and “Cautionary Statement Regarding Forward-Looking Information” sections of such reports, and other reports CenterPoint Energy or its subsidiaries may file from time to time with the Securities and Exchange Commission.

CenterPoint Energy, Inc. and Subsidiaries

Condensed Statements of Consolidated Income

(Millions of Dollars)

(Unaudited)


Three Months Ended September 30,


Nine Months Ended September 30,


2020


2019


2020


2019

Revenues:


Utility revenues


$

1,538


$

1,548


$

5,087


$

5,284


Non-utility revenues


84


110


277


261


Total


1,622


1,658


5,364


5,545


Expenses:


Utility natural gas, fuel and purchased power


170


171


981


1,228


Non-utility cost of revenues, including natural gas


63


80


196


188


Operation and maintenance


659


621


1,976


2,042


Depreciation and amortization


306


316


885


938


Taxes other than income taxes


122


113


387


352


Goodwill Impairment


185


Total


1,320


1,301


4,610


4,748


Operating Income


302


357


754


797


Other Income (Expense):


Gain on marketable securities


83


59


14


206


Loss on indexed debt securities


(84

)


(62

)


(25

)


(216

)

Interest expense and other finance charges


(121

)


(134

)


(388

)


(389

)

Interest expense on Securitization Bonds


(7

)


(9

)


(22

)


(31

)

Equity in earnings (loss) of unconsolidated affiliates, net


(67

)


77


(1,499

)


213


Interest income


1


3


2


16


Interest income from Securitization Bonds


1


1


4


Other income, net


10


5


44


20


Total


(185

)


(60

)


(1,873

)


(177

)

Income (Loss) from Continuing Operations Before Income Taxes


117


297


(1,119

)


620


Income tax expense (benefit)


(10

)


46


(328

)


75


Income (Loss) from Continuing Operations


127


251


(791

)


545


Income (Loss) from Discontinued Operations (net of tax expense of $-0-, $16, $21 and $38, respectively)


(6

)


19


(182

)


89


Net Income (Loss)


121


270


(973

)


634


Income allocated to preferred shareholders


52


29


127


88


Income (Loss) Available to Common Shareholders


$

69


$

241


$

(1,100

)


$

546


Reference is made to the Combined Notes to Unaudited Condensed Consolidated Financial Statements contained in the Quarterly Report on Form 10-Q of CenterPoint Energy, Inc.

CenterPoint Energy, Inc. and Subsidiaries

Selected Data From Statements of Consolidated Income

(Millions of Dollars, Except Share and Per Share Amounts)

(Unaudited)


Three Months Ended September 30,


Nine Months Ended September 30,


2020


2019


2020


2019


Basic earnings (loss) per common share - continuing operations


$

0.14


$

0.44


$

(1.75

)


$

0.91


Basic earnings (loss) per common share - discontinued operations


(0.01

)


0.04


(0.35

)


0.18


Basic Earnings (loss) Per Common Share


$

0.13


$

0.48


$

(2.10

)


$

1.09


Diluted earnings (loss) per common share - continuing operations


$

0.14


$

0.44


$

(1.75

)


$

0.91


Diluted earnings (loss) per common share - discontinued operations


(0.01

)


0.03


(0.35

)


0.17


Diluted Earnings Per Common Share


$

0.13


$

0.47


$

(2.10

)


$

1.08


Dividends Declared per Common Share


$

0.1500


$

0.2875


$

0.5900


$

0.5750


Dividends Paid per Common Share


$

0.1500


$

0.2875


$

0.5900


$

0.8625


Weighted Average Common Shares Outstanding (in millions):


- Basic


545


502


525


502


- Diluted


548


505


525


505


Net Income (Loss) by Segment


Houston Electric T&D


$

157


$

185


$

281


$

315


Indiana Electric Integrated


31


34


(121

)


41


Natural Gas Distribution


5


6


242


149


Total Utility Operations


193


225


402


505


Midstream Investments


(62

)


50


(1,165

)


124


Corporate and Other


(4

)


(24

)


(28

)


(84

)

Income (Loss) from Continuing Operations


127


251


(791

)


545


Income (loss) from Discontinued Operations, net of tax


(6

)


19


(182

)


89


Net Income (Loss)


$

121


$

270


$

(973

)


$

634


Contacts

Media:
Natalie Hedde
Phone: 812.491.5105

Investors:
David Mordy
Phone: 713.207.6500


Read full story here

FORT WORTH, Texas--(BUSINESS WIRE)--Basic Energy Services, Inc. (OTCQX: BASX) (“Basic” or the “Company”) today announced that it is commencing a private exchange offer (the “Exchange Offer”) with respect to its 10.75% Senior Secured Notes due 2023 (the “Existing Notes”) and related rights offering (the “Rights Offering”) and consent solicitation (the “Consent Solicitation”).


Pursuant to the Exchange Offer, Basic is offering to issue, in a private offering to eligible noteholders, new 11.00% Senior Secured Notes due 2025 (the “New Notes”) in exchange for the Existing Notes. The aggregate maximum principal amount of New Notes to be issued in the Exchange Offer is limited to $80.0 million (the “New Notes Cap”). The New Notes will at issuance be fully and unconditionally guaranteed on a joint and several basis by each of Basic’s domestic subsidiaries, other than certain subsidiaries that engage in no activities other than in connection with the financing of accounts receivable, and will be secured by liens, junior only to the liens securing the New Super Priority Notes and certain other obligations, on substantially all of the property and assets of the Company and the subsidiary guarantors other than the assets that secure the obligations of the Company and the guarantors under the Company’s ABL credit agreement.

Pursuant to the Rights Offering, Basic is offering, in a private offering to eligible noteholders who validly tender their Existing Notes on or prior to the Early Deadline (as defined herein), the right to subscribe (each, a “Subscription Right”) to purchase its pro rata portion of 9.75% Super Priority Lien Senior Secured Notes due 2025 in an aggregate principal amount of $20.0 million (the “New Super Priority Notes”) to be issued by Basic. The New Super Priority Notes will at issuance be fully and unconditionally guaranteed on a joint and several basis by each of Basic’s domestic subsidiaries that guarantees the New Notes, and will be secured by first priority liens subject to limited exceptions on all of the property and assets of the Company and the subsidiary guarantors that secure the New Notes. Ascribe Investments III LLC (“Ascribe”) has provided a commitment to purchase $15.0 million aggregate principal amount of the New Super Priority Notes not otherwise validly subscribed and paid for pursuant to the Rights Offering. As consideration for its commitment, Ascribe shall be entitled to receive a commitment cash premium of 1.25% of the aggregate principal amount of the New Super Priority Notes issued to it. Each eligible holder that participates in the Rights Offering will also receive a commitment cash premium of 1.25% of the aggregate principal amount of the New Super Priority Notes issued to such holder. Neither Ascribe nor any participating holders will be entitled to the commitment cash premium if the Exchange Offer is not completed.

The following table set forth certain terms of the Exchange Offer:


Principal Amount of New Notes(1)

CUSIP Number and
ISIN of Existing Notes


Title of Existing
Notes


Principal Amount
of Existing Notes
Outstanding


Early Exchange
Consideration if Tendered
prior to the Early Deadline


Exchange
Consideration if
Tendered after the
Early Deadline

CUSIP: 06985PAN0 / U06858AG6
ISIN: US06985PAN06 / USU06858AG62)


10.75% Senior
Secured Notes
due 2023


$300,000,000


$400 principal amount
of New Notes.


$350 principal
amount of New
Notes.

(1)

For each $1,000 principal amount of Existing Notes, as applicable.

The Exchange Offer, Rights Offering and Consent Solicitation are being made upon the terms and conditions set forth in the Confidential Offering Memorandum dated November 5, 2020 (the “Offering Memorandum”), copies of which will be made available to holders of the Existing Notes eligible to participate in the Exchange Offer. The Exchange Offer and Consent Solicitation will expire at 11:59 p.m., New York City time, on December 4, 2020, unless such date is extended or earlier terminated (such date and time, as they may be extended, the “Expiration Time”). Eligible holders that validly tender their Existing Notes and do not validly withdraw such Existing Notes at or prior to 5:00 p.m., New York City time, on November 19, 2020 (such date and time, as it may be extended, the “Early Deadline”) will receive the Early Exchange Consideration for the applicable Existing Notes accepted in the Exchange Offer. “Early Exchange Consideration” means, for each $1,000 principal amount of Existing Notes validly tendered by the eligible holder and accepted by Basic, the consideration set forth in the table above under the heading “Early Exchange Consideration if Tendered prior to the Early Deadline.” Eligible holders who validly tender Existing Notes after the Early Deadline, but prior to the Expiration Time, will receive the consideration set forth in the table above under the column heading “Exchange Consideration if Tendered after the Early Deadline” (the “Exchange Consideration”). In each case, the consideration received will be subject to the New Notes Cap and, if applicable, proration. If the aggregate principal amount of the New Notes required to exchange all Existing Notes validly tendered and not validly withdrawn at or prior to the Early Deadline exceeds the New Notes Cap, then holders who validly tender their Existing Notes after the Early Deadline will not have their Existing Notes accepted in the Exchange Offer.

In addition to the Early Exchange Consideration or the Exchange Consideration, as applicable, Basic will pay in the form of New Notes (rounded down to the nearest $1,000) accrued and unpaid interest on the Existing Notes accepted for exchange in the Exchange Offer from the last interest payment date to, but not including, the applicable Settlement Date (as defined herein) (subject to the right of holders on the relevant record date to receive interest due on the relevant interest payment date).

Tendered Existing Notes may not be withdrawn and consents may not be revoked after 5:00 p.m., New York City time, on November 19, 2020, except as required by applicable law; provided that consents cannot be withdrawn after the Consent Effective Date (i.e., promptly upon the receipt of Requisite Consents) and consents may be revoked only by validly withdrawing the associated tendered Existing Notes. Basic reserves the right to terminate, withdraw, amend or extend the Exchange Offer, Rights Offering and Consent Solicitation at any time and for any reason, subject to the terms and conditions set forth in the Offering Memorandum.

Upon the terms and subject to the conditions of the Exchange Offer, the settlement date for the Exchange Offer will occur promptly after the Expiration Time (the “Final Settlement Date”) and is expected to occur on December 9, 2020. Basic may elect, in its sole discretion, to settle the Exchange Offer and issue the New Notes with respect to such Existing Notes validly tendered at or prior to the Early Deadline (and not validly withdrawn) at any time after the Early Deadline and at or prior to the Expiration Time (the “Early Settlement Date” and, together with the Final Settlement Date, the “Settlement Dates”). Such Early Settlement Date will be determined at Basic’s option and, if Basic elects to have an Early Settlement Date, Basic expects that it would occur on or after November 30, 2020, subject to the satisfaction or waiver by Basic of all the conditions to the Exchange Offer.

Basic’s obligation to accept and exchange the Existing Notes validly tendered pursuant to the Exchange Offer is subject to customary conditions, as set forth in the Offering Memorandum, including a minimum tender condition of 66-2/3% in aggregate principal amount of the Existing Notes.

Concurrently with the Exchange Offer, Basic is soliciting the consents of eligible holders of the Existing Notes to amend the indenture governing the Existing Notes and the related security documents to (1) eliminate substantially all of the covenants, restrictive provisions and events of default and to release the existing subsidiary guarantees of the Existing Notes, (2) modify the description of the secured obligations under the security documents to reflect the refinancing of the Existing Notes with the New Notes and (3) cause the Existing Notes remaining outstanding after the Settlement Date to be unsecured, without the benefit of any liens on the collateral (the “Proposed Amendments”). The consents of eligible holders representing at least 66-2/3% of the aggregate principal amount of the Existing Notes outstanding will be required (the “Requisite Consents”) in order to adopt the Proposed Amendments to the indenture and security documents.

Each eligible holder who validly tenders Existing Notes will be deemed to have delivered consents with respect to the aggregate principal amount of such tendered Existing Notes, to the Proposed Amendments. Eligible holders may not deliver consents without tendering their Existing Notes and may not tender their Existing Notes without delivering consents.

This press release is issued pursuant to Rule 135c under the Securities Act of 1933, as amended (the “Securities Act”). This press release is neither an offer to sell nor the solicitation of an offer to buy the New Notes, the New Super Priority Notes, the Subscription Rights or any other securities and shall not constitute an offer, solicitation or sale in any jurisdiction in which, or to any person to whom, such an offer, solicitation or sale is unlawful. The New Notes, the New Super Priority Notes and the Subscription Rights have not been, and will not be, registered under the Securities Act or any state securities laws, or the securities laws of any other jurisdiction and may not be offered or sold in the United Stated absent registration or an applicable exemption from registration requirements. The Exchange Offer and Rights Offering, and the offering of the New Notes, the New Super Priority Notes and the Subscription Rights, are being made only (1) to persons reasonably believed to be “qualified institutional buyers” as defined in Rule 144A under the Securities Act, in a private transaction in reliance upon the exemption from the registration requirements of the Securities Act provided by Section 4(a)(2) thereof and (2) outside the United States, to persons other than “U.S. persons” as defined in Rule 902 under the Securities Act in offshore transactions in compliance with Regulation S under the Securities Act.

The Exchange Offer, Rights Offering and Consent Solicitation are being made only pursuant to the Offering Memorandum. The Offering Memorandum and other documents relating to the Exchange Offer, Rights Offering and Consent Solicitation will be distributed only to eligible holders. The Exchange Offer is not being made to holders of Existing Notes in any jurisdiction in which the making or acceptance thereof would not be in compliance with the securities, blue sky or other laws of such jurisdiction. The New Notes, the New Super Priority Notes and the Subscription Rights have not been approved or disapproved by any regulatory authority, nor has any such authority passed upon the accuracy or adequacy of the Offering Memorandum. None of Basic, the dealer manager, the solicitation agent, the exchange agent, the information agent or any trustee (or its agents) of the Existing Notes, the New Notes or the New Super Priority Notes makes any recommendation as to whether holders of Existing Notes should participate in the Exchange Offer or the Rights Offering or consent to the Proposed Amendments.

Holders who desire a copy of the eligibility letter should contact D.F. King & Co., Inc., the information agent for the Exchange Offer and Consent Solicitation, at (800) 431-9646 (U.S. Toll-free) or email at This email address is being protected from spambots. You need JavaScript enabled to view it.. Banks and brokers should call (212) 269-5550. The eligibility letter may also be found here: www.dfking.com/basicenergy. D.F. King & Co., Inc. will provide copies of the Offering Memorandum to eligible holders.

There are no registration rights associated with the New Notes or the New Super Priority Notes, and Basic has no intention to offer to exchange the New Notes or New Super Priority Notes for notes registered under the Securities Act or to file a registration statement with respect to the New Notes or the New Super Priority Notes.

The New Notes and the New Super Priority Notes are not intended to be offered, sold or otherwise made available to and should not be offered, sold or otherwise made available to any retail investor in the European Economic Area (“EEA”). For these purposes, a retail investor means a person who is one (or more) of: (i) a retail client as defined in point (11) of Article 4(1) of Directive 2014/65/EU (as amended, “MiFID II”); or (ii) a customer within the meaning of Directive 2002/92/EC (as amended, the “Insurance Mediation Directive”), where that customer would not qualify as a professional client as defined in point (10) of Article 4(1) of MiFID II; or (iii) not a qualified investor as defined in 2017/1129/EC (as amended or superseded, the “Prospectus Regulation”). Consequently, no key information document required by Regulation (EU) No 1286/2014 (as amended, the “PRIIPs Regulation”) for offering or selling the New Notes and the New Super Priority Notes or otherwise making them available to retail investors in the EEA or in the United Kingdom has been prepared and therefore offering or selling the New Notes or the New Super Priority Notes or otherwise making them available to any retail investor in the EEA or in the United Kingdom may be unlawful under the PRIIPS Regulation. This press release, the Offering Memorandum and any other documents or materials relating to the Exchange Offer, Rights Offering and Consent Solicitation have been prepared on the basis that any offer of the New Notes or the New Super Priority Notes in any member state of the EEA or in the United Kingdom will be made pursuant to an exemption under the Prospectus Regulation from the requirement to publish a prospectus for offers of notes. The Offering Memorandum is not a prospectus for the purposes of the Prospectus Regulation.

This press release, the Offering Memorandum and any other documents or materials relating to the Exchange Offer, Rights Offering and Consent Solicitation may only be communicated to persons in the United Kingdom in circumstances where Section 21 of the Financial Services and Markets Act 2000 (the “FSMA”) does not apply. Accordingly, this press release and the Offering Memorandum are only for circulation to (i) persons who are outside the United Kingdom, (ii) investment professionals falling within Article 19(5) of the FSMA (Financial Promotion) Order 2005, as amended (the “Order”), (iii) high net worth entities, and other persons to whom the communication may lawfully be communicated, falling within Article 49(2)(a) to (d) of the Order or (iv) persons to whom an invitation or inducement to engage in investment activity (within the meaning of Section 21 of the FSMA) in connection with the communication may otherwise lawfully be communicated or caused to be communicated (all such persons together being referred to for purposes of this paragraph as “relevant persons”). The New Notes and the New Super Priority Notes will only be available to, and any invitation, offer or agreement to subscribe, purchase or otherwise acquire such New Notes and New Super Priority Notes will be engaged in only with, relevant persons. Any person who is not a relevant person should not act or rely on the Offering Memorandum or any of its contents and may not participate in the Exchange Offer.

Safe Harbor Statement

This release includes “forward-looking statements” within the meaning of the federal and securities laws. Forward-looking statements are not statements of historical fact and reflect Basic’s current views about future events. The words “believe,” “estimate,” “expect,” “anticipate,” “project,” “intend,” “seek,” “could,” “should,” “may,” “potential” and similar expressions are intended to identify forward-looking statements. However, the absence of these words does not mean that the statements are not forward-looking. Although Basic believes the expectations reflected in its forward-looking statements are reasonable and are based on reasonable assumptions and estimates, certain risks and uncertainties could cause actual results to differ materially from the projections, anticipated results or other expectations expressed in this release. These risks and uncertainties include, without limitation, our ability to successfully execute, manage and integrate acquisitions, including the recent acquisition of C&J Well Services, Inc., reductions in our customers’ capital budgets, our own capital budget, limitations on the availability of capital or higher costs of capital, volatility in commodity prices for crude oil, including the recent significant decline in oil prices, and natural gas, local and global impacts of the COVID-19 virus, and the negative impacts of the delisting of the Company’s common stock from the NYSE. Additional important risk factors that could cause actual results to differ materially from expectations are disclosed in Item 1A of the Company’s most recent Annual Report on Form 10-K and other filings with the Securities and Exchange Commission. While Basic makes these statements and projections in good faith, neither Basic nor its management can guarantee that the transactions will be consummated or that anticipated future results will be achieved. Any forward-looking statement speaks only as of the date on which such statement is made and Basic assumes no obligation to publicly update or revise any forward-looking statements made herein or any other forward-looking statements made by Basic, whether as a result of new information, future events, or otherwise, except as required by applicable law.


Contacts

Trey Stolz
Director of Financial Planning & Analysis
Basic Energy Services, Inc.
817-334-4100

PORTLAND, Ore.--(BUSINESS WIRE)--Northwest Natural Holding Company, (NYSE: NWN) (NW Natural Holdings), reported financial results and highlights including:


  • Reported a net loss of $0.61 per share from continuing operations for the third quarter of 2020, compared to a net loss of $0.61 per share for the same period in 2019
  • Earned net income of $0.80 per share from continuing operations for the first nine months of 2020, compared to earnings of $0.91 per share and adjusted earnings1 of $1.13 per share for the same period in 2019
  • Continued to provide customers with essential natural gas and water utility services and assist our most vulnerable community members during COVID-19
  • Scored second in the West for large utilities in 2020 J.D. Power Gas Utility Residential Customer Satisfaction Study
  • Added more than 14,000 natural gas meters over the last 12 months equating to a 1.9% growth rate
  • Invested $193 million in our utility systems in the first nine months of 2020 for greater reliability and resiliency
  • Received Oregon general rate case order providing an estimated annual pre-tax earnings benefit of $45.1 million
  • Announced a public-private partnership that is working toward a renewable hydrogen facility in Oregon
  • Increased dividends for the 65th consecutive year with an annual indicated dividend rate of $1.92 per share
  • Reaffirmed 2020 GAAP earnings guidance from continuing operations in the range of $2.25 to $2.45 per share and guided toward the lower end of the range given effects from COVID-19

"This is a year of significant accomplishments despite the very unusual circumstances. We continued to execute on all aspects of our long-term strategy and taking care of our employees and customers when they need us the most. At the same time, we're building on our legacy of environmental stewardship and addressing the climate imperative. I'm proud of our efforts underway,” said David H. Anderson, president and CEO of NW Natural Holdings.

For the third quarter of 2020, net loss from continuing operations increased $0.2 million to a net loss of $18.7 million (or $0.61 per share), compared to a net loss from continuing operations of $18.5 million (or $0.61 per share) for the same period in 2019. Results reflect the seasonal nature of the gas utility's earnings, higher depreciation and general tax expenses as we continued to invest in our gas utility system, partially offset by the recognition of a regulatory deferral asset for certain COVID-19 expenses incurred during the first nine months of 2020 related to our Oregon utility operations and higher earnings at our water and wastewater utilities.

Year-to-date net income from continuing operations decreased $2.5 million to $24.5 million (or $0.80 per share), compared to $27.0 million (or $0.91 per share) for the same period in 2019. Results for 2019 included a regulatory pension disallowance of $10.5 million (or $6.6 million after-tax and $0.22 per share). Excluding this disallowance on a non-GAAP basis1, adjusted net income from continuing operations for 2019 was $33.6 million (or $1.13 per share). On this adjusted basis, net income declined $9.1 million to $24.5 million for the first nine months of 2020. Results reflected an increase in operations and maintenance expense, depreciation and property tax expenses as we continued to invest in our gas utility system, and the financial effects resulting from COVID-19.

__________

1


Adjusted 2019 metrics are non-GAAP financial measures and exclude the regulatory pension disallowance of $10.5 million pre-tax (or $6.6 million and $0.22 cents per share after-tax). See "Reconciliation to GAAP" for additional information.

KEY EVENTS AND INITIATIVES

Coronavirus (COVID-19) Implications

NW Natural Holdings continues to operate during the COVID-19 pandemic with a focus on the safety of our employees and customers, while providing essential services without interruption. To protect our customers and employees, we continue to follow CDC, OSHA, and state specific guidance.

We continue to benefit from our resilient business model with about 87% of our natural gas utility margin coming from the residential and commercial sectors and a majority of our utility margin decoupled and weather normalized. NW Natural has not seen a substantial reduction in overall sales volumes as of September 30, 2020 attributed to COVID-19. Customer growth from construction and conversions remained strong during 2020, and we experienced a lower level of customer losses as we suspended customer disconnections when the pandemic began. This lower level of disconnections is reflected in the customer growth rate of 1.9% for the twelve months ended September 30, 2020. We continued to forgo late and reconnection fee revenues from customers, and bad debt expense is higher than the prior period as we estimate the effects of COVID-19 on accounts receivable. Interest expense was elevated in the second quarter as a result of additional short-term financings undertaken to strengthen our liquidity position as the pandemic unfolded. For the first nine months of 2020, we estimate the combined financial effects of COVID-19 to be approximately $7 million pre-tax.

As of September 30, 2020, we estimated that $4.4 million pre-tax of the financial effects related to COVID-19 could be recoverable, including $4.1 million for Oregon. In September 2020, the Oregon Public Utility Commission (OPUC) approved a comprehensive solution for COVID with a term sheet outlining the types of costs that may be deferred. Subsequently in October the OPUC approved NW Natural's deferral application. Pursuant to the term sheet, we recorded a regulatory asset of $3.1 million pre-tax in the third quarter of 2020. We expect to recognize and recover an additional $1.0 million related to forgone late fee revenue approved by the OPUC in a future period when the amounts are billed to customers per accounting guidance.

Oregon General Rate Case Order

On Oct. 16, 2020, the OPUC issued an order approving the all-party settlement in NW Natural's general rate case, increasing the utility's revenue requirement by $45.1 million (or $33.1 million after-tax), compared to a requested $71.4 million. The order also approved a capital structure of 50% debt and 50% equity; a return on equity of 9.4%; and a cost of capital of 6.965%. In addition, the order approved an average rate base of $1.44 billion or an increase of $242.1 million compared to the last rate case. New rates in Oregon were effective beginning Nov. 1, 2020.

Renewable Hydrogen Project

NW Natural along with a local electric public utility district (PUD) in Eugene and the Bonneville Environmental Foundation have signed a memorandum of understanding (MOU) to explore developing a renewable hydrogen facility. The facility could demonstrate hydrogen's ability to help decarbonize heating and transportation loads.

The MOU contemplates the potential for a facility in Eugene, Oregon that could range in size from 30,000 up to 150,000 MMBtu per year (equivalent to 2 megawatts up to 10 megawatts). We believe renewable hydrogen will be critical to the long-term decarbonization of the world’s energy systems, including transportation, heating, manufacturing and other processes. For the Pacific Northwest, renewable hydrogen could help with grid balancing and long-term storage opportunities for renewable sources such as wind and hydro, which have significant seasonal variation.

2019 Environment, Social, and Governance (ESG) Report Issued

On October 6, 2020 we issued our inaugural ESG report, which outlines some of the important work NW Natural Holdings is focused on. The report highlights our longstanding commitments and progress related to safety, environmental stewardship, and taking care of our employees and communities. It also features goals that we're aggressively pursuing related to a renewable future and carbon neutral vision for our gas utility, diversifying into and growing our water and wastewater utility business, and actively continuing to advance diversity, equity and inclusion in our workplace and our wider community. In addition, we’ve provided the information recommended for our industry by the Sustainability Accounting Standards Board and the American Gas Association reporting template. Additional information is available at ir.nwnaturalholdings.com.

Water Utilities and Acquisitions

To date in 2020, NW Natural Water Company, LLC (NW Natural Water) has closed the following acquisitions: the Suncadia water and wastewater utilities in Washington, the T&W water utility in Texas, a water utility with two systems in Northern Idaho near our existing Gem State footprint, and our first water utility acquisition in the municipal sector with water and wastewater utilities near our Falls Water, Idaho systems. In July 2020, NW Natural Water signed a purchase and sale agreement to acquire another utility near Idaho Falls, which is expected to close in 2020.

NW Natural Water currently serves about 66,000 people through about 26,000 connections in the Pacific Northwest and Texas. NW Natural Water has invested approximately $110 million in the water sector to date.

THIRD QUARTER RESULTS

The following financial comparisons are for the third quarter of 2020 and 2019 with individual year-over-year drivers below presented on an after-tax basis using a statutory tax rate of 26.5% unless otherwise noted.

NW Natural Holdings' third quarter results are summarized by business segment in the table below:


Three Months Ended September 30,


2020


2019


Change

In thousands, except per share data

Amount

Per Share


Amount

Per Share


Amount

Per Share

Net income (loss) from continuing operations:


Natural Gas Distribution segment

$

(22,120

)


$

(0.72

)


$

(19,570

)


$

(0.64

)


$

(2,550

)


$

(0.08

)


Other

3,443


0.11


1,064


0.03


2,379


0.08


Consolidated

$

(18,677

)


$

(0.61

)


$

(18,506

)


$

(0.61

)


$

(171

)


$


Diluted Shares


30,555


30,429


126


Natural Gas Distribution Segment

Natural Gas Distribution segment net loss increased $2.6 million (or $0.08 per share) reflecting higher depreciation and general taxes as we invested in our natural gas system.

Margin decreased $0.3 million reflecting lower revenues from fees as we suspended collections processes and disconnections during the COVID-19 pandemic and lower usage from industrial and large commercial customers, partially offset by contributions from new rates in Washington and customer growth of 1.9% over the last 12 months.

Operations and maintenance expense increased $0.7 million as a result of higher expenses mainly from increased compensation costs and non-payroll expenses, partially offset by $1.1 million related to deferring to a regulatory asset a portion of COVID-19 expenses for our Oregon utility operations and $1.5 million related to temporary cost savings measures enacted to mitigate the unrecoverable financial implications of COVID-19. Of the $1.1 million deferred in the third quarter, $0.8 million was related to COVID-19 expenses incurred primarily during the second quarter of 2020.

Depreciation expense and general taxes increased $2.4 million related to higher property, plant, and equipment.

Interest expense decreased $1.2 million as a result of deferring to a regulatory asset $1.2 million of interest costs incurred on financings undertaken in March 2020 to strengthen our liquidity position as the pandemic unfolded. Of the $1.2 million deferred in the third quarter, $1.0 million was related to costs incurred primarily during the second quarter of 2020.

Other

Other net income increased $2.4 million (or $0.08 per share) primarily reflecting higher revenues from our water and wastewater utilities and lower holding company expenses.

YEAR-TO-DATE RESULTS

The following financial comparisons are for the first nine months of 2020 and 2019 with individual year-over-year drivers below presented on an after-tax basis using a statutory tax rate of 26.5% unless otherwise noted. Non-GAAP financial measures exclude the effects of the regulatory pension disallowance in 2019 as these adjusted metrics provide a clearer view of operations, reflect how Management views financial results, and provide comparability to prior year results. See "Reconciliation to GAAP" for a detailed reconciliation of adjusted amounts.

Financial Implications of March 2019 Regulatory Order

In March 2019, NW Natural received a regulatory order from the OPUC that outlined the recovery of a pension balancing deferral, a disallowance of a portion of this deferral, and the application of tax reform benefits.

NW Natural recognized a $10.5 million pre-tax (or $6.6 million after-tax) regulatory disallowance for amounts in the pension balancing account. This resulted in $3.9 million pre-tax ($2.8 million after-tax) of additional operations and maintenance expense, $6.6 million of pre-tax ($4.9 million after-tax) other expense, and an offsetting tax benefit of $3.9 million. In addition, as a result of beginning collections of the pension balancing account, $3.8 million of regulatory interest income ($2.8 million after-tax) was recognized related to the equity interest component of financing costs on the pension balancing account.

The order required the application of tax reform benefits to the pension balancing deferral account in March 2019, which resulted in the following offsetting adjustments with no material effect on net income:

  • $7.1 million pre-tax ($5.2 million after-tax) increase in margin;
  • $4.6 million pre-tax ($3.4 million after-tax) increase in operations and maintenance expense;
  • $7.9 million pre-tax ($5.8 million after-tax) increase in other expense; and
  • $5.9 million decrease in income tax expense.

NW Natural Holdings' year-to-date results are summarized by business segment in the table below:


Nine Months Ended September 30,


2020


2019


Change

In thousands, except per share data

Amount

Per Share


Amount

Per Share


Amount

Per Share

Net income from continuing operations:


Natural Gas Distribution segment

$

19,476


$

0.64


$

22,848


$

0.77


$

(3,372

)


$

(0.13

)


Regulatory pension disallowance, net


6,588


0.22


(6,588

)


(0.22

)


Adjusted Natural Gas Distribution segment1

$

19,476


$

0.64


$

29,436


$

0.99


$

(9,960

)


$

(0.35

)


Other

$

4,991


$

0.16


$

4,115


$

0.14


$

876


$

0.02


Consolidated

$

24,467


$

0.80


$

26,963


$

0.91


$

(2,496

)


$

(0.11

)


Adjusted Consolidated1

24,467


0.80


33,551


1.13


(9,084

)


(0.33

)


Diluted Shares


30,575


29,628


947


1


The 2019 adjusted natural gas distribution segment and adjusted consolidated net income from continuing operations are non-GAAP financial measures and exclude the effects of a regulatory disallowance of NW Natural's pension balancing account of $10.5 million pre-tax (or $6.6 million after-tax). See "Reconciliation to GAAP" for additional information.

Natural Gas Distribution Segment

Natural Gas Distribution segment net income decreased $3.4 million (or $0.13 per share). First quarter 2019 results include a $6.6 million non-cash after-tax regulatory disallowance of costs in NW Natural's pension balancing account. Excluding the effects of this disallowance, net income decreased $10.0 million (or $0.35 per share) reflecting higher operations and maintenance expense, depreciation expense, and the financial effects of COVID-19 including lower revenues from fees and lower commercial and industrial customer usage in rate schedules that are not decoupled. Earnings per share was affected by share issuances in June 2019.

Margin decreased $0.1 million related to several offsetting items including: a combined $4.8 million decrease in margin from lower entitlement and curtailment fees as the first quarter of 2019 included fees related to pipeline constraints and the effect of warmer than average weather in the first nine months of 2020 compared to the same period in 2019. Margin also declined $1.1 million related to lower fee revenues as we did not charge customers late or reconnection fees during the COVID-19 pandemic. New rates in Washington, customer growth of 1.9% over the last 12 months, and beginning North Mist storage services collectively contributed $10.4 million to margin. Finally, as a result of the Oregon order related to pension as described above, margin decreased $5.2 million with no significant effect on net income as offsetting adjustments were recognized through expenses and income taxes.

Operations and maintenance expense decreased $0.3 million as a result of 2019 incorporating several nonrecurring items related to the Oregon pension order described above, specifically a $2.8 million expense related to the disallowance of costs in the pension balancing account and $3.4 million of costs that were recognized with no significant effect on net income due to offsetting adjustments in margin and income taxes. Excluding these pension expenses, operations and maintenance expense increased $6.4 million related to higher compensation costs, contractor and professional service expenses, and moving costs to a new headquarter and operations center. This was partially offset by temporary cost savings measures intended to mitigate the financial implications of COVID-19 that are not expected to be recovered through our regulated rates.

Depreciation expense and general taxes increased $7.3 million related to higher property, plant, and equipment, including our North Mist gas storage facility.

Other expense, net decreased $6.1 million primarily due to several items related to the pension order in 2019 as described above including a $4.9 million expense related to the disallowance of costs in the pension balancing account, $5.8 million of costs that were offset with higher revenues and tax benefits in 2019, and $2.8 million of equity interest income recognized in 2019 when we began collecting deferred pension costs from customers. In addition, pension expenses increased $2.2 million in 2020 as this expense is recovered in rates instead of a portion recovered through the pension balancing account.

Tax expense reflected a $5.9 million detriment related to implementing the March 2019 order described above; however, as this offset higher expense, there was no significant resulting effect on net income.

Other

Other net income increased $0.9 million (or $0.02 per share) primarily reflecting higher revenues from our water and wastewater utilities and lower holding company expenses, partially offset by lower asset management revenues.

BALANCE SHEET AND CASH FLOWS

During the first nine months of 2020, the Company generated $148.5 million in operating cash flows and invested $193.3 million in utility capital expenditures and $38.1 million to acquire water and wastewater utilities. Net cash provided by financing activities was $104.5 million for the first nine months of 2020 or an increase of $36.6 million compared to the same period in 2019 primarily due to several financings undertaken in March 2020 that strengthened our liquidity position as a precaution as the COVID-19 pandemic unfolded. At September 30, 2020, NW Natural Holdings held cash of $35.9 million.

2020 GUIDANCE

NW Natural Holdings reaffirmed 2020 earnings guidance from continuing operations in the range of $2.25 to $2.45 per share and guided toward the lower end of the range due to potential implications from COVID-19. This guidance assumes continued customer growth, average weather conditions, and no significant changes in prevailing regulatory policies, mechanisms, or outcomes, or significant local, state or federal laws, legislation or regulations. The expected sale of Gill Ranch and the related gain, and any operating loss associated with it, are not included in this guidance range, as they are, and are expected to continue to be, reported as Discontinued Operations.

DIVIDEND DECLARED

NW Natural Holdings' Board of Directors previously declared a quarterly dividend of 48 cents per share on NW Natural Holdings' common stock. The dividend is payable on November 13, 2020 to shareholders of record on October 30, 2020, reflecting an annual indicated dividend rate of $1.92 per share.

CONFERENCE CALL AND WEBCAST

As previously announced, NW Natural Holdings will host a conference call and webcast today to discuss its third quarter and year-to-date 2020 financial and operating results.

Date and Time:


Thursday, November 5

8 a.m. PT (11 a.m. ET)

Phone Numbers:


United States: 1-866-267-6789

Canada: 1-855-669-9657

International: 1-412-902-4110

The call will also be webcast in a listen-only format for the media and general public and can be accessed at ir.nwnaturalholdings.com. A replay of the conference call will be available on our website and by dialing 1-877-344-7529 (U.S.), 1-855-669-9658 (Canada), and 1-412-317-0088 (international). The replay access code is 10148700.

ABOUT NW NATURAL HOLDINGS

Northwest Natural Holding Company, (NYSE: NWN) (NW Natural Holdings), is headquartered in Portland, Oregon, and through its subsidiaries has been doing business for over 160 years in the Pacific Northwest. It owns NW Natural Gas Company (NW Natural), NW Natural Water Company (NW Natural Water), and other business interests and activities.

NW Natural is a local distribution company that currently provides natural gas service to approximately 2.5 million people in more than 140 communities through nearly 770,000 meters in Oregon and Southwest Washington with one of the most modern pipeline systems in the nation. NW Natural consistently leads the industry with high J.D. Power & Associates customer satisfaction scores.

NW Natural Holdings’ subsidiaries own and operate 35 Bcf of underground gas storage capacity with NW Natural operating 20 Bcf in Oregon.

NW Natural Water provides water distribution and wastewater services to communities throughout the Pacific Northwest and Texas. NW Natural Water currently serves approximately 66,000 people through about 26,000 connections. Learn more about our water business at nwnaturalwater.com.

Additional information is available at nwnaturalholdings.com.

Forward-Looking Statements

This report, and other presentations made by NW Holdings from time to time, may contain forward-looking statements within the meaning of the U.S. Private Securities Litigation Reform Act of 1995. Forward-looking statements can be identified by words such as "anticipates," "assumes," "intends," "plans," "seeks," "believes," "estimates," "expects" and similar references to future periods. Examples of forward-looking statements include, but are not limited to, statements regarding the following: plans, objectives, assumptions, estimates, expectations, timing, goals, strategies, commitments, future events, investments, capital expenditures, targeted capital structure, risks, risk profile, stability, acquisitions and timing, completion and integration thereof, dispositions and timing, completion and outcomes thereof, utility system and infrastructure investments, system modernization, reliability and resiliency, global, national and local economies, customer and business growth, customer satisfaction ratings, weather, customer rates or rate recovery and the timing and magnitude of potential rate changes, environmental remediation cost recoveries, environmental initiatives, decarbonization and the role of natural gas and the gas delivery system, including use of renewable sources, renewable hydrogen projects or investments and timing, magnitude and completion thereof, strategic goals and visions, the water utility strategy and financial effects of the related pending water acquisitions, diversity, equity and inclusion initiatives, operating plans of third parties, financial results, including estimated income, availability and sources of liquidity, expenses, positions, revenues, returns, cost of capital, timing, and earnings and earnings guidance, dividends, performance, timing, outcome, or effects of regulatory proceedings or mechanisms or approvals, regulatory prudence reviews, anticipated regulatory actions or filings, accounting treatment of future events, effects of changes in laws or regulations, effects, extent, severity and duration of COVID-19 and resulting economic disruption, the impact of mitigating factors and other efforts to mitigate risks posed by its spread, ability of our workforce, customers or suppliers to operate or conduct business, COVID-19 expenses, cost savings measures and cost recovery including through regulatory deferrals and the timing and magnitude thereof, impact on capital projects, governmental actions and timing thereof, including actions to reopen the economy, and other statements that are other than statements of historical facts.


Contacts

Investor Contact:
Nikki Sparley
Phone: 503-721-2530
Email: This email address is being protected from spambots. You need JavaScript enabled to view it.

Media Contact:
Melissa Moore
Phone: 503-220-2436
Email: This email address is being protected from spambots. You need JavaScript enabled to view it.


Read full story here
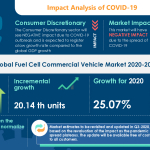
ST. PAUL, Minn.--(BUSINESS WIRE)--PolyMet Mining Corp (“PolyMet” or the “company”) TSX: POM; NYSE American: PLM – today reported it has filed its financial results for the three and nine months ended September 30, 2020.


The financial statements are filed at www.polymetmining.com and on SEDAR and EDGAR and are prepared in accordance with International Financial Reporting Standards. All amounts are in U.S. funds. Copies can be obtained free of charge by contacting the company at First Canadian Place, 100 King Street West, Suite 5700, Toronto, Ontario M5X 1C7 or by e-mail at This email address is being protected from spambots. You need JavaScript enabled to view it.

In the most recent quarter, the company continued to progress through the legal process in defense of its operating permits. A number of challenges have been filed contesting various aspects of federal and state decisions; the company has received favorable final decisions in six of these cases to date.

In two pending cases, PolyMet successfully petitioned the Minnesota Supreme Court to review lower court decisions. The court heard oral arguments on the Permit to Mine and dam safety permits on October 13, and on the air permit earlier today. Rulings in both cases are anticipated in the first half of 2021.

In a separate legal victory, a Ramsey County District Court judge ruled on September 3, following a court of appeals-ordered evidentiary hearing in January, that PolyMet’s water permit was issued with proper procedures by the Minnesota Pollution Control Agency.

In addition to successfully defending legal challenges to our permits, project optimization and engineering efforts are expected to remain a company focus through the remainder of the year.

Also in the reporting period, effective August 26, 2020, PolyMet completed consolidation of its common shares at a ratio of ten pre-consolidation common shares for one post-consolidation common share. All common share numbers, numbers of shares issuable under options, warrants and restricted share units and related per share amounts are retrospectively adjusted to reflect the share consolidation.

Key Balance Sheet Statistics

(in ‘000 US dollars)


September 30, 2020


December 31, 2019


Cash & equivalents

$

9,817

$

7,401

Working capital


5,711


3,043

Total assets


467,822


457,315

Total liabilities


94,545


73,175

Shareholders’ equity

$

373,277

$

384,140

Key Income and Cash Flow Statement Statistics

(in ‘000 US dollars, except per share amounts)


Three months ended


Nine months ended


September 30, 2020


September 30, 2019


September 30, 2020


September 30, 2019

General & administrative expense

$

4,296

$

1,287

$

16,085

$

5,052

Other (Income) expenses:


Finance income & other

(1,475)

(380)

(845)

(277)

Non-cash rehabilitiation accretion

520

671

1,561

1,527

Non-cash loss on debenture modification

-

-

-

2,004

Loss for the period:


3,341


1,578


16,801


8,306

Loss for the period ($/share)


0.03


0.02


0.17


0.15


Cash used in investing activities


$


1,682


$


4,749


$


6,685


$


14,551


Weighted average shares outstanding


100,699,716


100,517,759


100,642,313


55,982,436

  • Loss for the three months ended September 30, 2020, was $3.3 million compared with $1.6 million for the prior year period primarily due to additional studies related to engineering and further evaluation of the mineral resource.
  • Loss for the nine months ended September 30, 2020, was $16.8 million compared with $8.3 million for the prior year period primarily due to additional studies related to engineering and further evaluation of the mineral resource.

About PolyMet

PolyMet is a mine development company that owns 100% of the NorthMet Project, the first large-scale project to be permitted within the Duluth Complex in northeastern Minnesota, one of the world’s major, undeveloped mining regions. NorthMet has significant proven and probable reserves of copper, nickel and palladium – metals vital to global carbon reduction efforts – in addition to marketable reserves of cobalt, platinum and gold. When operational, NorthMet will become one of the leading producers of nickel, palladium and cobalt in the U.S., providing a much needed, responsibly mined source of these critical and essential metals.

Located in the Mesabi Iron Range, the project will provide economic diversity while leveraging the region’s established supplier network and skilled workforce, and generate a level of activity that will have a significant effect in the local economy. For more information: www.polymetmining.com.

PolyMet Disclosures

This news release contains certain forward-looking statements concerning anticipated developments in PolyMet’s operations in the future. Forward-looking statements are frequently, but not always, identified by words such as “expects,” “anticipates,” “believes,” “intends,” “estimates,” “potential,” “possible,” “projects,” “plans,” and similar expressions, or statements that events, conditions or results “will,” “may,” “could,” or “should” occur or be achieved or their negatives or other comparable words. These forward-looking statements may include statements regarding the ability to receive environmental and operating permits, job creation, and the effect on the local economy, or other statements that are not a statement of fact. Forward-looking statements address future events and conditions and therefore involve inherent known and unknown risks and uncertainties. Actual results may differ materially from those in the forward-looking statements due to risks facing PolyMet or due to actual facts differing from the assumptions underlying its predictions.

PolyMet’s forward-looking statements are based on the beliefs, expectations and opinions of management on the date the statements are made, and PolyMet does not assume any obligation to update forward-looking statements if circumstances or management’s beliefs, expectations and opinions should change.

Specific reference is made to risk factors and other considerations underlying forward-looking statements discussed in PolyMet’s most recent Annual Report on Form 40-F for the fiscal year ended December 31, 2019, and in our other filings with Canadian securities authorities and the U.S. Securities and Exchange Commission.

The Annual Report on Form 40-F also contains the company’s mineral resource and other data as required under National Instrument 43-101.

The TSX has not reviewed and does not accept responsibility for the adequacy or accuracy of this release.


Contacts

For further information, please contact:
Media
Bruce Richardson
Corporate Communications
Tel: +1 (651) 389-4111
This email address is being protected from spambots. You need JavaScript enabled to view it.

Investor Relations
Tony Gikas
Investor Relations
Tel: +1 (651) 389-4110
This email address is being protected from spambots. You need JavaScript enabled to view it.

HOUSTON--(BUSINESS WIRE)--Genesis Energy, L.P. (NYSE: GEL) today announced its third quarter results.


We generated the following financial results for the third quarter of 2020:

  • Net Loss Attributable to Genesis Energy, L.P. of $29.7 million for the third quarter of 2020, compared to Net Income Attributable to Genesis Energy, L.P. of $17.6 million for the same period in 2019.
  • Cash Flows from Operating Activities of $143.5 million for the third quarter of 2020 compared to $136.1 million for the same period in 2019.
  • Total Segment Margin in the third quarter of 2020 of $161.9 million.
  • Available Cash before Reserves to common unitholders of $70.7 million for the third quarter of 2020, which provided 3.84X coverage for the quarterly distribution of $0.15 per common unit attributable to the third quarter.
  • We declared cash distributions on our preferred units of $0.7374 for each preferred unit, which equates to a cash distribution of approximately $18.7 million and is reflected as a reduction to Available Cash before Reserves to common unitholders.
  • Adjusted EBITDA of $151.5 million in the third quarter of 2020. Our bank leverage ratio, calculated consistent with our credit agreement, is 5.25X as of September 30, 2020 and is discussed further in this release.

Grant Sims, CEO of Genesis Energy, said, "During the quarter, we paid down total outstanding debt by approximately $70 million, in spite of continuing, but improving, macro challenges from the worldwide Covid-19 pandemic as well as the most disruptive hurricane season since 2005. We are continuing to realize the benefits of the actions we took earlier this year to maintain and improve our financial flexibility. We have clear and defined opportunities to realize improving financial results in future periods as the upstream community gets back to normalized operations in the Gulf of Mexico and the demand for some of our goods and services continues its return to pre-pandemic levels, which will more than likely grow from there.

Hurricanes Marco and Laura combined for basically two weeks of complete temporary cessation of production in the central Gulf of Mexico during the quarter. As we have previously discussed, a platform that our CHOPS pipeline goes up and over incurred some limited structural issues which has required investigation and analyses. As a result, this quarter’s financial results include approximately $5 million of non-recurring expense associated with such efforts. We would not expect significant additional capital requirements, and any additional dollars required to be spent will in all likelihood be capitalized.

To date, we have been successful in routing affected volumes through our Poseidon pipeline system and are close to revenue neutral, although the financial impact from Poseidon is on a one month lag due to it being effectively a joint venture. We continue to work with the Bureau of Safety and Environmental Enforcement to determine how best to return to normal, safe and responsible operations on CHOPS as soon as practicable.

While we had Hurricanes Delta and Zeta disrupt producers’ operations for some 15 days in the fourth quarter, I would point everyone to the first quarter of this year’s financial results. Those results of approximately $85 million represent the normalized quarterly earning capability of our industry critical infrastructure assets in the Gulf of Mexico. Nothing has occurred to lose production or reserves or otherwise detract from that run rate. In fact, quite the contrary as we have seen increased achievable production from Atlantis and Katmai, both as anticipated. Also, we are now just some 12-18 months from initial flows from Argos and Kings Quay, which required minimal capital from us. These two fields alone, when fully ramped up, will likely generate in excess of $25 million a quarter, or over $100 million a year, in incremental segment margin, EBITDA and importantly cash flow to us in the very near future. We remain confident that the Gulf of Mexico will be an important producing province for the U.S. and the world as a whole for decades and decades to come.

Our sodium minerals and sulfur services segment continues to improve from the depths of the second quarter. Recent data points would suggest the soda ash market is definitely re-balancing and improving. Early indications would suggest we will be sold out this quarter from our Westvaco facility and continuing into and throughout 2021. Not only will we realize higher sales, but this is very important given the loss of fixed cost absorption and other inefficiencies of not running at full design capacity as we have over the last 6 months or so.

This near-term improvement in world-wide supply and demand balances for soda ash is currently occurring as the world’s economies begin to re-open along with certain supply responses, like our near-term furloughing of Granger and more permanent reductions in capacity in China as well as short-term supply disruptions from flooding in central China. In other words, the market is working through inventories and existing bulges in the soda ash supply chain that developed at the end of last year and became materially worse as a result of the economic reaction to Covid-19. While one would expect to see prices rise under these developing market conditions, we are taking a conservative view and expect price action to be reasonably muted entering 2021 but see prices increasing, perhaps meaningfully, as we move through next year, provided we do not see a second shut down of economic activity in response to the virus.

Longer term, it would be hard to conceive of a brighter future than what we envision for this segment. Whether it is general fiscal stimulus, general infrastructure expenditures or spending targeted at energy conservation and a lengthy process of transitioning from hydrocarbons as the primary transportation fuel, these businesses will materially benefit.

Soda ash, among others, is an essential component used in glass manufacturing and the production of lithium ion/phosphate batteries. Construction of new homes and new automobiles, as well as the retro-fitting of older buildings with new LEED certified glass windows, will continue to drive increasing soda ash demand. The demand from the production of new batteries to facilitate the storage and usage of developing renewable sources of energy is likely to be a major contributor to increasing demand for soda ash. By some accounts, the demand for soda ash to produce new batteries alone may be an additional 6 to 7 million tons a year by 2030. This alone represents more than a 15% increase in demand for soda ash outside of China relative to today. All of these growth drivers are in addition to the intrinsic growth of 2-3% per year we would expect as the developing countries resume their inexorable path of growth towards the per capita consumption levels of the more mature OECD economies. Mining for copper, the primary metal used in everything from phones to automobiles to bridges, is the primary market and use for the sodium and sulfur based product we make at refineries while helping them limit air pollution given our proprietary process is a closed chemical reaction as opposed to their conventional combustion processes to remove sulfur from their finished products.

Our marine segment performed in-line with our expectations for the quarter. We are starting to see the impact of lower refinery runs in the Midwest and Gulf Coast which is putting pressure on both rates and utilization, especially in the inland world. We do expect to see an acceleration in asset retirements beginning this year, into and throughout 2021, which will help balance supply with the current reduced demand for marine tonnage. At the end of the quarter, we successfully re-contracted the American Phoenix with a credit-worthy new customer, albeit at a lower rate. We only re-contracted her, inclusive of our customer’s options, through next year, as we believe the market will tighten given expected asset retirements and a recovery of demand as we move through 2021.

Our onshore facilities and transportation segment also performed in-line with our expectations. As previously disclosed, we received approximately $41 million in cash from a subsidiary of Denbury Inc. ("Denbury") which was included in segment margin and Adjusted Consolidated EBITDA in the quarter. As also previously disclosed, we have finalized an agreement with Denbury which allows us to totally exit the CO2 pipeline business, a non-core business for us. During the fourth quarter, we received proceeds of $22.5 million for the Free State CO2 pipeline and we are scheduled to receive an additional $70 million in cash, to be paid over four equal quarterly installments of $17.5 million, starting in the first quarter of 2021 for the remaining amounts owed under the NEJD financing lease. Combined, we will receive approximately $134 million in cash from Denbury which we will use to pay down debt. Additionally, we will recognize all of that $134 million as Adjusted Consolidated EBITDA under our bank revolving credit facility for purposes of complying with the two financial covenants therein.

We expect Adjusted Consolidated EBITDA for the full year to come in a range of $590-610 million, despite the active hurricane season and the continuing macroeconomic challenges presented by Covid-19. We will continue to evaluate additional sales of non-core assets and examine our general, administrative and operating expenses in the context of the economic operating environment.

Accordingly, we find it difficult to see any scenarios where we have the risk of not comfortably complying with all of our financial covenants, and look forward to the improving financial performance of our core businesses as previously described. With this accelerating ability to pay down debt and with relatively de minimus capital requirements to realize the financial benefits of these improving business conditions, we foresee no issues in extending our senior secured credit facility and re-financing our near-term un-secured maturity, which is still some two and a half years out.

I would like to once again recognize our entire workforce, and especially our miners, mariners and offshore personnel who live and work in close quarters during this time of social distancing. I am extremely proud to say we have safely operated our assets under our own Covid-19 safety procedures and protocols with no impact to our business partners and customers with limited confirmed cases amongst our some 2,000 employees and with no known cases of community transmission at any of our work locations. As always, we intend to be prudent, diligent and intelligent and focus on delivering long-term value for everyone in our capital structure without ever losing our commitment to safe, reliable and responsible operations."

Financial Results

Segment Margin

Variances between the third quarter of 2020 (the “2020 Quarter”) and the third quarter of 2019 (the “2019 Quarter”) in these components are explained below.

Segment margin results for the 2020 Quarter and 2019 Quarter were as follows:


Three Months Ended
September 30,


2020


2019


(in thousands)

Offshore pipeline transportation

$

57,380


$

81,060


Sodium minerals and sulfur services

27,592


55,258


Onshore facilities and transportation

61,298


24,829


Marine transportation

15,587


14,672


Total Segment Margin

$

161,857


$

175,819


Offshore pipeline transportation Segment Margin for the 2020 Quarter decreased $23.7 million, or 29%, from the 2019 Quarter, primarily due to lower overall volumes on our crude oil and natural gas pipeline systems and a relative increase in operating costs. During the 2020 Quarter, our Gulf of Mexico assets experienced unplanned downtime and interruption from Hurricanes Laura and Marco as a result of producers shutting in during the storm and us taking the necessary precautions to remove all personnel from the platform assets that we operate and maintain. While the 2019 Quarter was negatively impacted by Hurricane Barry, the effects during the 2020 Quarter on our assets were more significant and longer lasting. In addition to the majority of our assets being shut in for approximately one to two weeks, our 100% owned CHOPS pipeline, although not damaged, has been out of service since August 26, 2020 due to damage at a junction platform that the CHOPS system goes up and over. We are currently in the process of undergoing the required regulatory inspections and analysis to address any platform issues caused by Hurricane Laura in an effort to safely return our assets to operation as soon as possible, and we incurred approximately $5 million of incremental operating costs in the 2020 Quarter associated with these efforts. During this time, we have successfully diverted all CHOPS barrels to our 64% owned and operated Poseidon oil pipeline system and expect to continue so during the fourth quarter of 2020. We expect volumes on our other offshore pipeline transportation assets to return to normal pre-hurricane levels in the fourth quarter of 2020, with the exception of unexpected downtime we incurred in October due to Hurricanes Delta and Zeta that impacted our operations by some 15 days.

Sodium minerals and sulfur services Segment Margin for the 2020 Quarter decreased $27.7 million, or 50% from the 2019 Quarter, primarily due to lower volumes and pricing in our Alkali Business. During the 2020 Quarter, we experienced lower ANSAC and domestic sales volumes of soda ash relative to the 2019 Quarter due to the continued demand destruction from the worldwide economic shutdowns and uncertainty from the pandemic. This was coupled with lower export pricing due to supply and demand imbalances that existed at the time of our re-contracting phase in December 2019 and January 2020, which is expected to continue, to some extent, for at least the rest of 2020. While the soda ash volumes sold during the 2020 Quarter were relatively flat compared to the second quarter of 2020, we began to see an uptick in demand both domestically and on ANSAC volumes throughout the 2020 Quarter as certain regions of the world are beginning to re-open their economies and we expect continued recovery throughout the rest of 2020 and into 2021. In our refinery services business, we experienced a slight increase in NaHS volumes during the 2020 Quarter due to higher demand from certain of our domestic pulp and paper customers. Additionally, in South America (primarily in Peru), we began to see some recovery in demand from previous customer shut-ins amidst the spread of Covid-19 and we expect these volumes to continue recovering to their normal levels throughout the rest of 2020.

Onshore facilities and transportation Segment Margin for the 2020 Quarter increased by $36.5 million, or 146.9%, from the 2019 Quarter primarily due to the 2020 Quarter including the receipt of a cash payment of approximately $41 million associated with the exercise of a letter of credit we had issued to us as beneficiary from a customer that defaulted under a twenty year term agreement. This increase was partially offset by lower volumes throughout our onshore facilities and transportation asset base, primarily in Louisiana at our Baton Rouge corridor assets and our Raceland rail facility. Due to the decline in crude oil prices and the collapse in the differential of Western Canadian Select (WCS) to the Gulf Coast, which has made crude-by-rail to the Gulf Coast uneconomic, the volumes at our Baton Rouge facilities were below our minimum take-or-pay levels and we were only able to recognize our minimum volume commitment in segment margin during the 2020 Quarter. We expect to only recognize our minimum volume commitment in segment margin through the rest of 2020 and as we enter 2021 due to the lower anticipated volumes and the prepaid transportation credits that our customer has accumulated over the last six months.

Marine transportation Segment Margin for the 2020 Quarter increased $0.9 million, or 6%, from the 2019 Quarter. During the 2020 Quarter, in our offshore barge operation, we benefited from the continual improving rates in the spot and short term markets coupled with increased utilization relative to the 2019 Quarter. This was partially offset by lower utilization and day rates in our inland business. We expect to see continued pressure on our utilization, and to an extent, the spot rates in our inland business as Midwest and Gulf Coast refineries continue to lower their utilization rates to better align with overall demand as a result of Covid-19 and the current operating environment. Additionally, the five year contract associated with our M/T American Phoenix tanker ended on September 30, 2020. We have re-contracted the tanker beginning in the fourth quarter of 2020 at a marginally lower rate and shorter term. We have continued to enter into short term contracts (less than a year) in both the inland and offshore (including the M/T American Phoenix) markets because we believe the day rates currently being offered by the market have yet to fully recover from their cyclical lows.

Other Components of Net Income

In the 2020 Quarter, we recorded Net Loss Attributable to Genesis Energy, L.P. of $29.7 million compared to Net Income Attributable to Genesis Energy, L.P. of $17.6 million in the 2019 Quarter. Net Loss Attributable to Genesis Energy, L.P. in the 2020 Quarter was negatively impacted, relative to the 2019 Quarter, by: (i) lower segment margin of $14.0 million, which is inclusive of approximately $41 million of incremental cash receipts received in the 2020 Quarter and included in the 2020 Quarter's segment margin, associated with principal repayments on our direct financing lease; and (ii) lower non-cash revenues of $11.8 million within our offshore pipeline transportation and onshore facilities and transportation segments as a result of how we recognize revenue in accordance with GAAP on certain contracts. These decreases were partially offset by (i) lower depreciation, depletion and amortization expense of $15.8 million during the 2020 Quarter due to lower depreciation expense on our rail logistics assets as they were impaired during the second quarter of 2020; and (ii) lower interest expense of $3.4 million during the 2020 Quarter.

Earnings Conference Call

We will broadcast our Earnings Conference Call on Thursday, November 5, 2020, at 8:30 a.m. Central time (9:30 a.m. Eastern time). This call can be accessed at www.genesisenergy.com. Choose the Investor Relations button. For those unable to attend the live broadcast, a replay will be available beginning approximately one hour after the event and remain available on our website for 30 days. There is no charge to access the event.

Genesis Energy, L.P. is a diversified midstream energy master limited partnership headquartered in Houston, Texas. Genesis’ operations include offshore pipeline transportation, sodium minerals and sulfur services, onshore facilities and transportation and marine transportation. Genesis’ operations are primarily located in Texas, Louisiana, Arkansas, Mississippi, Alabama, Florida, Wyoming and the Gulf of Mexico.

GENESIS ENERGY, L.P.

CONDENSED CONSOLIDATED STATEMENTS OF OPERATIONS - UNAUDITED

(in thousands, except per unit amounts)


Three Months Ended
September 30,


Nine Months Ended
September 30,


2020


2019


2020


2019

REVENUES

$

443,125


$

621,697


$

1,371,515


$

1,876,491


COSTS AND EXPENSES:


Costs of sales and operating expenses

356,957


470,389


1,037,647


1,394,117


General and administrative expenses

11,072


14,999


45,858


40,097


Depreciation, depletion and amortization

67,733


83,522


222,210


240,513


Impairment expense

3,331


280,826


OPERATING INCOME (LOSS)

4,032


52,787


(215,026

)


201,764


Equity in earnings of equity investees

14,439


11,830


41,216


39,873


Interest expense

(51,312

)


(54,673

)


(157,895

)


(165,881

)


Other income, net

7,406


7,974


13,114


306


INCOME (LOSS) BEFORE INCOME TAXES

(25,435

)


17,918


(318,591

)


76,062


Income tax expense

(145

)


(111

)


(575

)


(656

)


NET INCOME (LOSS)

(25,580

)


17,807


(319,166

)


75,406


Net loss (income) attributable to noncontrolling interests

12


22


38


(1,503

)


Net income attributable to redeemable noncontrolling interests

(4,149

)


(272

)


(12,394

)


(272

)


NET INCOME (LOSS) ATTRIBUTABLE TO GENESIS ENERGY, L.P.

$

(29,717

)


$

17,557


$

(331,522

)


$

73,631


Less: Accumulated distributions attributable to Class A Convertible Preferred Units

(18,684

)


(18,684

)


(56,052

)


(55,783

)


NET INCOME (LOSS) AVAILABLE TO COMMON UNITHOLDERS

$

(48,401

)


$

(1,127

)


$

(387,574

)


$

17,848


NET INCOME (LOSS) PER COMMON UNIT:


Basic and Diluted

$

(0.39

)


$

(0.01

)


$

(3.16

)


$

0.15


WEIGHTED AVERAGE OUTSTANDING COMMON UNITS:


Basic and Diluted

122,579


122,579


122,579


122,579


GENESIS ENERGY, L.P.

OPERATING DATA - UNAUDITED


Three Months Ended
September 30,


Nine Months Ended
September 30,


2020


2019


2020


2019

Offshore Pipeline Transportation Segment


Crude oil pipelines (barrels/day unless otherwise noted):


CHOPS

98,626


231,635


178,962


234,070


Poseidon (1)

274,008


249,209


268,862


255,811


Odyssey (1)

84,902


144,995


117,100


148,945


GOPL

1,266


9,796


3,706


10,046


Offshore crude oil pipelines total

458,802


635,635


568,630


648,872


Natural gas transportation volumes (MMbtus/d) (1)

265,465


396,408


337,039


420,595


Sodium Minerals and Sulfur Services Segment


NaHS (dry short tons sold)

28,105


26,806


80,129


97,076


Soda Ash volumes (short tons sold)

588,949


951,172


2,006,006


2,646,582


NaOH (caustic soda) volumes (dry short tons sold) (2)

20,922


18,844


57,551


60,171


Onshore Facilities and Transportation Segment


Crude oil pipelines (barrels/day):


Texas

64,635


51,492


70,444


47,265


Jay

9,731


10,292


8,276


10,644


Mississippi

5,523


6,015


5,605


5,988


Louisiana (3)

73,482


115,519


99,490


114,337


Onshore crude oil pipelines total

153,371


183,318


183,815


178,234


Free State- CO2 Pipeline (Mcf/day)

90,649


76,914


106,530


86,294


Crude oil and petroleum products sales (barrels/day)

29,284


33,244


25,772


32,593


Rail unload volumes (barrels/day) (4)

3,860


78,696


33,907


87,745


Marine Transportation Segment


Inland Fleet Utilization Percentage (5)

74.0

%


97.2

%


85.0

%


97.5

%

Offshore Fleet Utilization Percentage (5)

95.7

%


92.4

%


97.3

%


94.2

%

(1)

Volumes for our equity method investees are presented on a 100% basis. We own 64% of Poseidon and 29% of Odyssey, as well as equity interests in various other entities.

(2)

Caustic soda sales volumes include volumes sold from our Alkali and Refinery Services businesses.

(3)

Total daily volume for the three and nine months ended September 30, 2020 includes 33,874 and 35,676 barrels per day of intermediate refined products associated with our Port of Baton Rouge Terminal pipelines. Total daily volume for the three and nine months ended September 30, 2019 includes 45,657 and 54,153 barrels per day of intermediate refined products associated with our Port of Baton Rouge Terminal pipelines.

(4)

Indicates total barrels for which fees were charged for unloading at all rail facilities.

(5)

Utilization rates are based on a 365 day year, as adjusted for planned downtime and dry-docking.

GENESIS ENERGY, L.P.

CONDENSED CONSOLIDATED BALANCE SHEETS - UNAUDITED

(in thousands, except number of units)


September 30,
2020


December 31,
2019

ASSETS


Cash, cash equivalents and restricted cash

$

44,016


$

56,405


Accounts receivable - trade, net

247,819


417,002


Inventories

89,811


65,137


Investment in direct financing leases, net

69,370


9,293


Other current assets

65,576


45,237


Total current assets

516,592


593,074


Fixed assets and mineral leaseholds, net

4,467,166


4,850,300


Investment in direct financing leases, net


107,702


Equity investees

321,541


334,523


Intangible assets, net

129,178


138,927


Goodwill

301,959


301,959


Right of use assets, net

159,488


177,071


Other assets, net

57,426


94,085


Total assets

$

5,953,350


$

6,597,641


LIABILITIES AND CAPITAL


Accounts payable - trade

$

151,762


$

218,737


Accrued liabilities

181,840


196,758


Total current liabilities

333,602


415,495


Senior secured credit facility

984,800


959,300


Senior unsecured notes, net of debt issuance costs

2,373,928


2,469,937


Deferred tax liabilities

12,665


12,640


Other long-term liabilities

378,870


393,850


Total liabilities

4,083,865


4,251,222


Mezzanine capital:


Class A convertible preferred units

790,115


790,115


Redeemable noncontrolling interests

137,475


125,133


Partners' capital:


Common unitholders

951,554


1,443,320


Accumulated other comprehensive loss

(8,066

)


(8,431

)


Noncontrolling interests

(1,593

)


(3,718

)


Total partners' capital

941,895


1,431,171


Total liabilities, mezzanine capital and partners' capital

$

5,953,350


$

6,597,641


Common Units Data:


Total common units outstanding

122,579,218


122,579,218


Contacts

Genesis Energy, L.P.
Ryan Sims
SVP - Finance and Corporate Development
(713) 860-2521


Read full story here

  • Revenue of $104 million
  • Net loss of $22 million and diluted EPS of negative $0.19
  • Adjusted EBITDA of negative $10 million
  • Operating cash flow of $4 million and free cash flow of $6 million
  • Extended long-term debt maturity to 2025 and $129 million of liquidity

HOUSTON--(BUSINESS WIRE)--Forum Energy Technologies, Inc. (NYSE: FET) today announced third quarter 2020 revenue of $104 million, a decrease of $10 million from the second quarter 2020. Orders received in the quarter increased by $7 million to $92 million. Net loss for the quarter was $22 million, or $0.19 per diluted share, compared to a net loss of $5 million, or $0.05 per diluted share, for the second quarter 2020. Excluding $12 million, or $0.11 per share of special items, adjusted net loss was $0.30 per diluted share in the third quarter 2020, compared to an adjusted net loss of $0.29 per diluted share in the second quarter 2020. Adjusted EBITDA was negative $10 million in the third quarter 2020, an improvement of approximately $2 million from the second quarter 2020.


Special items in the third quarter 2020, on a pre-tax basis, included a $29 million gain on extinguishment of debt resulting from the debt exchange completed in August. This par for par exchange extended Forum's debt maturity date from 2021 to 2025. The $29 million gain reflects the accounting difference between the net carrying value of the 2021 Notes exchanged and the estimated fair value of the 2025 Notes. The gain was partially offset by impairments and restructuring charges of $11 million and $3 million of foreign exchange losses. See Tables 1-3 for a reconciliation of GAAP to non-GAAP financial information.

Cris Gaut, Chairman and Chief Executive Officer, remarked, “U.S. rig count and U.S. frac fleet count both declined sharply in the third quarter as compared with the second. However, it appears these measures of activity bottomed in the third quarter and have continued to increase into the fourth quarter. As a result, we believe the third quarter represents an inflection point in U.S. drilling and completion activity, as well as for Forum.

“Forum bookings increased 8% sequentially, driven by orders for our short-cycle completion products and our surface separation production equipment products. Orders for these products rose as our exploration and production and service company customers began to increase spending commitments. Our revenues, however, decreased due to the lower than anticipated activity levels in the quarter. Given the increases in U.S. land activity that have occurred already in the fourth quarter, we expect sequential improvement in both orders and revenue in line with activity.

“Our on-going efforts to size our operations for the current level of market activity continued to improve our earnings and our EBITDA increased sequentially despite lower revenues in the quarter. Accelerating cost reduction efforts allowed us to increase EBITDA despite lower revenue in the third quarter. We have significantly reduced fixed costs and are continuing initiatives to further decrease direct and structural costs to generate positive EBITDA, even at historically low levels of activity.”

“I am pleased with the way our employees have responded to these extremely challenging market conditions and look forward to seeing the strong results Forum will deliver as market conditions continue to improve.”

Segment Results

Drilling & Downhole segment revenue was $43 million and orders were $39 million, a decrease of 8% and 9%, respectively, from the second quarter 2020. Lower demand for drilling products in North America, resulting from the continued steep decline in drilling activity levels in the third quarter of 2020, was the primary driver of these decreases. Segment adjusted EBITDA was $(4) million, down $1 million from the second quarter, resulting primarily from the decline in revenues partially offset by cost reduction actions implemented in the second quarter. Drilling & Downhole operations focus primarily on capital equipment and consumable products for global drilling, well construction, artificial lift and subsea markets.

Completions segment revenue was $20 million, a sequential increase of $2 million, or 11%, as well completions activity began to grow in the third quarter. Orders in the third quarter were $18 million, an increase of $4 million, or 30%, from the second quarter 2020. Segment adjusted EBITDA was $(4) million, up $2 million from the second quarter due to a more favorable revenue mix and continued cost management. The Completions segment designs and manufactures products for the coiled tubing, stimulation and intervention markets.

Production segment revenue was $41 million, a decrease of $8 million, or 16% from the second quarter 2020, due to lower sales of both valves and surface production equipment. Orders in the third quarter were $35 million, a 21% increase sequentially, due to significant orders for well-site production equipment for deliveries throughout 2021 and one large international order for desalination process equipment. Segment adjusted EBITDA was $3 million, an increase of $1 million sequentially, as revenue declines were more than offset by cost reductions from restructuring actions implemented in the second quarter. The Production segment manufactures land well site production equipment, desalination process equipment, and a wide range of valves for upstream, midstream and process industry customers.

Forum Energy Technologies is a global oilfield products company, serving the drilling, downhole, subsea, completions and production sectors of the oil and natural gas industry. The Company’s products include highly engineered capital equipment as well as products that are consumed in the drilling, well construction, production and transportation of oil and natural gas. Forum is headquartered in Houston, TX with manufacturing and distribution facilities strategically located around the globe. For more information, please visit www.f-e-t.com.

Forward Looking Statements and Other Legal Disclosure

This press release contains forward-looking statements within the meaning of Section 27A of the Securities Act of 1933 and Section 21E of the Securities Exchange Act of 1934. All statements, other than statements of historical facts, included in this press release that address activities, events or developments that the Company expects, believes or anticipates will or may occur in the future are forward-looking statements. Without limiting the generality of the foregoing, forward-looking statements contained in this press release specifically include the expectations of plans, strategies, objectives and anticipated financial and operating results of the Company, including any statement about the Company's future financial position, liquidity and capital resources, operations, performance, acquisitions, returns, capital expenditure budgets, new product development activities, costs and other guidance included in this press release.

These statements are based on certain assumptions made by the Company based on management's experience and perception of historical trends, current conditions, anticipated future developments and other factors believed to be appropriate. Such statements are subject to a number of assumptions, risks and uncertainties, many of which are beyond the control of the Company, which may cause actual results to differ materially from those implied or expressed by the forward-looking statements. Among other things, these include the severity and duration of the COVID-19 pandemic and related repercussions resulting from the negative impact on demand for oil and gas, the volatility of oil and natural gas prices, oilfield development activity levels, the availability of raw materials and specialized equipment, the Company's ability to deliver backlog in a timely fashion, the availability of skilled and qualified labor, competition in the oil and natural gas industry, governmental regulation and taxation of the oil and natural gas industry, the Company's ability to implement new technologies and services, the availability and terms of capital, and uncertainties regarding environmental regulations or litigation and other legal or regulatory developments affecting the Company's business, and other important factors that could cause actual results to differ materially from those projected as described in the Company's filings with the U.S. Securities and Exchange Commission.

Any forward-looking statement speaks only as of the date on which such statement is made and the Company undertakes no obligation to correct or update any forward-looking statement, whether as a result of new information, future events or otherwise, except as required by applicable law.

Forum Energy Technologies, Inc.

Condensed consolidated statements of income (loss)

(Unaudited)


Three months ended


September 30,


June 30,

(in millions, except per share information)


2020


2019


2020

Revenue


$

103.6


$

239.3


$

113.3


Cost of sales


90.5


176.7


100.4


Gross profit


13.1


62.6


12.9


Operating expenses


Selling, general and administrative expenses


46.0


63.5


48.3


Transaction expenses


0.7


0.3


0.2


Impairments of goodwill, intangible assets, property and equipment


3.0


532.3


0.1


Loss (gain) on disposal of assets and other


0.5


(0.1

)


(0.7

)

Total operating expenses


50.2


596.0


47.9


Operating loss


(37.1

)


(533.4

)


(35.0

)

Other expense (income)


Interest expense


8.5


7.8


6.4


Gain on extinguishment of debt


(28.7

)


(36.3

)

Deferred loan costs written off


0.3


0.1


Gain realized on previously held equity investment


(1.6

)


Foreign exchange losses (gains) and other, net


3.3


(3.2

)


0.7


Total other (income) expense, net


(16.6

)


3.0


(29.1

)

Loss before income taxes


(20.5

)


(536.4

)


(5.9

)

Income tax expense (benefit)


1.1


(3.4

)


(0.4

)

Net loss (1)


$

(21.6

)


$

(533.0

)


$

(5.5

)


Weighted average shares outstanding


Basic


111.6


110.3


111.6


Diluted


111.6


110.3


111.6


Loss per share


Basic


$

(0.19

)


$

(4.83

)


$

(0.05

)

Diluted


$

(0.19

)


$

(4.83

)


$

(0.05

)


(1) Refer to Table 1 for schedule of adjusting items.

Forum Energy Technologies, Inc.

Condensed consolidated statements of income (loss)

(Unaudited)


Nine months ended


September 30,

(in millions, except per share information)


2020


2019

Revenue


$

399.5


$

756.8


Cost of sales


351.4


560.9


Gross profit


48.1


195.9


Operating expenses


Selling, general and administrative expenses


154.5


195.3


Transaction expenses


0.9


1.0


Impairments of goodwill, intangible assets, property and equipment


20.4


532.3


Contingent consideration benefit


(4.6

)

Gain on disposal of assets and other


(0.2

)


(0.1

)

Total operating expenses


175.6


723.9


Loss from equity investment


(0.3

)

Operating loss


(127.5

)


(528.3

)

Other expense (income)


Interest expense


21.6


24.2


Foreign exchange gains and other, net


(1.0

)


(3.0

)

Gain on extinguishment of debt


(72.5

)


Deferred loan costs written off


2.3


Gain realized on previously held equity investment


(1.6

)

Total other (income) expense, net


(49.6

)


19.6


Loss before income taxes


(77.9

)


(547.9

)

Income tax expense (benefit)


(13.7

)


6.7


Net income (loss) (1)


$

(64.2

)


$

(554.6

)


Weighted average shares outstanding


Basic


111.5


110.0


Diluted


111.5


110.0


Loss per share


Basic


$

(0.58

)


$

(5.04

)

Diluted


$

(0.58

)


$

(5.04

)


(1) Refer to Table 2 for schedule of adjusting items.

Forum Energy Technologies, Inc.

Condensed consolidated balance sheets

(Unaudited)


(in millions of dollars)

September 30,
2020


December 31,
2019

Assets


Current assets


Cash and cash equivalents

$

20.0


$

57.9


Accounts receivable—trade, net

79.8


154.2


Inventories, net

364.7


414.6


Other current assets

41.0


39.2


Total current assets

505.5


665.9


Property and equipment, net of accumulated depreciation

120.3


154.8


Operating lease assets

33.9


48.7


Intangible assets, net

247.3


272.3


Other long-term assets

17.0


18.3


Total assets

$

924.0


$

1,160.0


Liabilities and equity


Current liabilities


Current portion of long-term debt

$

1.3


$

0.7


Other current liabilities

135.9


196.2


Total current liabilities

137.2


196.9


Long-term debt, net of current portion

290.0


398.9


Other long-term liabilities

69.5


78.2


Total liabilities

496.7


674.0


Total equity

427.3


486.0


Total liabilities and equity

$

924.0


$

1,160.0


Forum Energy Technologies, Inc.

Condensed consolidated cash flow information

(Unaudited)


Nine Months Ended September 30,

(in millions of dollars)


2020


2019

Cash flows from operating activities


Net loss


$

(64.2

)


$

(554.6

)

Impairments of goodwill, intangible assets, property and equipment


20.4


532.3


Depreciation and amortization


39.1


48.5


Impairments of operating lease assets


14.1


2.2


Gain on extinguishment of debt


(72.5

)


Other noncash items and changes in working capital


64.8


47.3


Net cash provided by operating activities


1.7


75.7


Cash flows from investing activities


Capital expenditures for property and equipment


(2.2

)


(12.6

)

Proceeds from sale of business, property and equipment


4.2


39.8


Net cash provided by investing activities


2.0


27.2


Cash flows from financing activities


Borrowings of debt


85.0


97.0


Repayments of debt


(113.4

)


(217.3

)

Bond exchange early participation payment


(3.5

)


Repurchases of stock


(0.2

)


(1.1

)

Deferred financing costs


(9.4

)


Net cash used in financing activities


(41.5

)


(121.4

)


Effect of exchange rate changes on cash


(0.1

)


0.2


Net decrease in cash, cash equivalents and restricted cash


$

(37.9

)


$

(18.3

)

Forum Energy Technologies, Inc.

Supplemental schedule - Segment information

(Unaudited)


As Reported


As Adjusted (4)


Three months ended


Three months ended

(in millions of dollars)


September 30,
2020


September 30,
2019


June 30,
2020


September 30,
2020


September 30,
2019


June 30,
2020

Revenue


Drilling & Downhole


$

43.2


$

88.3


$

47.2


$

43.2


$

88.3


$

47.2


Completions


19.6


70.6


17.6


19.6


70.6


17.6


Production


40.8


81.0


48.6


40.8


81.0


48.6


Eliminations


(0.6

)


(0.1

)


(0.6

)


(0.1

)

Total revenue


$

103.6


$

239.3


$

113.3


$

103.6


$

239.3


$

113.3


Operating income (loss)


Drilling & Downhole (1)


$

(13.2

)


$

4.3


$

(9.4

)


$

(8.4

)


$

6.4


$

(7.8

)

Operating income margin %


(30.6

)%


4.9

%


(19.9

)%


(19.4

)%


7.2

%


(16.5

)%

Completions


(11.9

)


(0.1

)


(17.8

)


(11.4

)


2.5


(13.2

)

Operating income margin %


(60.7

)%


(0.1

)%


(101.1

)%


(58.2

)%


3.5

%


(75.0

)%

Production


(0.1

)


2.3


(1.1

)


0.6


3.5


(0.7

)

Operating income margin %


(0.2

)%


2.8

%


(2.3

)%


1.5

%


4.3

%


(1.4

)%

Corporate


(7.7

)


(7.4

)


(7.2

)


(5.0

)


(6.5

)


(5.7

)

Total segment operating income (loss)


(32.9

)


(0.9

)


(35.5

)


(24.2

)


5.9


(27.4

)

Other items not in segment operating income (2)


(4.2

)


(532.5

)


0.5


0.1


0.1


0.7


Total operating income (loss)


$

(37.1

)


$

(533.4

)


$

(35.0

)


$

(24.1

)


$

6.0


$

(26.7

)

Operating income margin %


(35.8

)%


(222.9

)%


(30.9

)%


(23.3

)%


2.5

%


(23.6

)%


EBITDA (3)


Drilling & Downhole


$

(13.0

)


$

(181.5

)


$

(5.3

)


$

(3.8

)


$

12.3


$

(3.2

)

EBITDA Margin %


(30.1

)%


(205.5

)%


(11.2

)%


(8.8

)%


13.9

%


(6.8

)%

Completions


(5.9

)


(303.5

)


(11.9

)


(4.4

)


11.6


(6.2

)

EBITDA Margin %


(30.1

)%


(429.9

)%


(67.6

)%


(22.4

)%


16.4

%


(35.2

)%

Production


(1.1

)


(19.5

)


1.3


2.7


5.9


2.1


EBITDA Margin %


(2.7

)%


(24.1

)%


2.7

%


6.6

%


7.3

%


4.3

%

Corporate


20.4


(8.3

)


28.9


(4.2

)


(4.3

)


(4.3

)

Total EBITDA


$

0.4


$

(512.8

)


$

13.0


$

(9.7

)


$

25.5


$

(11.6

)

EBITDA Margin %


0.4

%


(214.3

)%


11.5

%


(9.4

)%


10.7

%


(10.2

)%

(1) Includes earnings (loss) from equity investment for the three months ended September 30, 2019.

(2) Includes transaction expenses, gain/(loss) on disposal of assets, and impairments of goodwill, intangible assets, property and equipment.

(3) The Company believes that the presentation of EBITDA is useful to the Company's investors because EBITDA is an appropriate measure of evaluating the Company's operating performance and liquidity that reflects the resources available for strategic opportunities including, among others, investing in the business, strengthening the balance sheet, repurchasing the Company's securities and making strategic acquisitions. In addition, EBITDA is a widely used benchmark in the investment community. See the attached separate schedule for the reconciliation of GAAP to non-GAAP financial information.

(4) Refer to Table 1 for schedule of adjusting items.

Forum Energy Technologies, Inc.

Supplemental schedule - Segment information

(Unaudited)


As Reported


As Adjusted (4)


Nine months ended


Nine months ended

(in millions of dollars)


September 30,
2020


September 30,
2019


September 30,
2020


September 30,
2019

Revenue


Drilling & Downhole


$

167.0


$

256.6


$

167.0


$

256.6


Completions


88.0


246.8


88.0


246.8


Production


145.0


256.3


145.0


256.3


Eliminations


(0.5

)


(2.9

)


(0.5

)


(2.9

)

Total revenue


$

399.5


$

756.8


$

399.5


$

756.8


Operating income (loss)


Drilling & Downhole (1)


$

(26.8

)


$

3.2


$

(15.1

)


$

8.8


Operating income margin %


(16.0

)%


1.2

%


(9.0

)%


3.4

%

Completions


(47.0

)


9.6


(28.7

)


13.0


Operating income margin %


(53.4

)%


3.9

%


(32.6

)%


5.3

%

Production


(9.3

)


10.2


(2.3

)


11.8


Operating income margin %


(6.4

)%


4.0

%


(1.6

)%


4.6

%

Corporate


(23.3

)


(22.7

)


(18.4

)


(20.7

)

Total segment operating income (loss)


(106.4

)


0.3


(64.5

)


12.9


Other items not in segment operating income (loss) (2)


(21.1

)


(528.6

)


0.8


0.3


Total operating income (loss)


$

(127.5

)


$

(528.3

)


$

(63.7

)


$

13.2


Operating income margin %


(31.9

)%


(69.8

)%


(15.9

)%


1.7

%


EBITDA (3)


Drilling & Downhole


$

(19.3

)


$

(171.5

)


$

(0.5

)


$

26.7


EBITDA Margin %


(11.6

)%


(66.8

)%


(3.6

)%


10.4

%

Completions


(37.7

)


(276.6

)


(6.9

)


41.7


EBITDA Margin %


(42.8

)%


(112.1

)%


(7.8

)%


16.9

%

Production


(6.3

)


(7.8

)


5.1


18.9


EBITDA Margin %


(4.3

)%


(3.0

)%


3.5

%


7.4

%

Corporate


46.1


(19.3

)


(14.5

)


(13.5

)

Total EBITDA


$

(17.2

)


$

(475.2

)


$

(16.8

)


$

73.8


EBITDA Margin %


(4.3

)%


(62.8

)%


(4.2

)%


9.8

%

(1) Includes earnings (loss) from equity investment for the nine months ended September 30, 2019.

(2) Includes transaction expenses, gain (loss) on disposal of assets, contingent consideration benefit, and impairments of goodwill, intangible assets, property and equipment.

(3) The Company believes that the presentation of EBITDA is useful to the Company's investors because EBITDA is an appropriate measure of evaluating the Company's operating performance and liquidity that reflects the resources available for strategic opportunities including, among others, investing in the business, strengthening the balance sheet, repurchasing the Company's securities and making strategic acquisitions. In addition, EBITDA is a widely used benchmark in the investment community. See the attached separate schedule for the reconciliation of GAAP to non-GAAP financial information.

(4) Refer to Table 2 for schedule of adjusting items.

Forum Energy Technologies, Inc.

Supplemental schedule - Orders information

(Unaudited)


Three months ended

(in millions of dollars)


September 30,
2020


September 30,
2019


June 30,
2020

Orders


Drilling & Downhole


$

38.7


$

80.0


$

42.3


Completions


18.4


64.5


14.2


Production


35.2


55.2


29.1


Total orders


$

92.3


$

199.7


$

85.6


Revenue


Drilling & Downhole


$

43.2


$

88.3


$

47.2


Completions


19.6


70.6


17.6


Production


40.8


81.0


48.6


Eliminations


(0.6

)


(0.1

)

Total revenue


$

103.6


$

239.3


$

113.3


Book to bill ratio (1)


Drilling & Downhole


0.90


0.91


0.90


Completions


0.94


0.91


0.81


Production


0.86


0.68


0.60


Total book to bill ratio


0.89


0.83


0.76


(1) The book-to-bill ratio is calculated by dividing the dollar value of orders received in a given period by the revenue earned in that same period. The Company believes that this ratio is useful to investors because it provides an indication of whether the demand for our products, in the markets in which the Company operates, is strengthening or declining. A ratio of greater than one is indicative of improving market demand, while a ratio of less than one would suggest weakening demand. In addition, the Company believes the book-to-bill ratio provides more meaningful insight into future revenues for our business than other measures, such as order backlog, because the majority of the Company's products are activity based consumable items or shorter cycle capital equipment, neither of which are typically ordered by customers far in advance.

Forum Energy Technologies, Inc.

Reconciliation of GAAP to non-GAAP financial information

(Unaudited)

Table 1 - Adjusting items


Three months ended


September 30, 2020


September 30, 2019


June 30, 2020

(in millions, except per share information)

Operating loss


EBITDA (1)


Net loss


Operating income (loss)


EBITDA (1)


Net income (loss)


Operating loss


EBITDA (1)


Net loss

As reported

$

(37.1

)


$

0.4


$

(21.6

)


$

(533.4

)


$

(512.8

)


$

(533.0

)


$

(35.0

)


$

13.0


$

(5.5

)

% of revenue


(35.8

)%


0.4

%


(222.9

)%


(214.3

)%


(30.9

)%


11.5

%


Restructuring charges and other


3.3


3.3


3.3


2.7


2.7


2.7


4.1


4.1


4.1


Transaction expenses


0.7


0.7


0.7


0.3


0.3


0.3


0.2


0.2


0.2


Inventory and other working capital adjustments


1.2


1.2


1.2


2.6


2.6


2.6


4.1


4.1


4.1


Impairments of goodwill, intangible assets, property and equipment


3.0


3.0


3.0


532.3


532.3


532.3


0.1


0.1


0.1


Stock-based compensation expense


1.9


3.6


2.6


Impairments of operating lease assets


4.8


4.8


4.8


0.2


0.2


0.2


(0.2

)


(0.2

)


(0.2

)

Amortization of basis difference for equity method investment (2)


0.3


0.3


0.3


Gain Realized on Previously Held Equity Investment


(1.6

)


(1.6

)


Disposal related equity-based compensation recorded by equity investment subsidiary


1.0


1.0


1.0


Gain on extinguishment of debt


(28.7

)


(28.7

)


(36.2

)


(36.2

)

Deferred loan costs written off


0.3


0.3


0.2


0.2


Loss (gain) on foreign exchange, net (3)


3.4


3.4


(3.1

)


(3.1

)


0.5


0.5


Income tax expense of adjustments


0.3


As adjusted (1)

$

(24.1

)


$

(9.7

)


$

(33.6

)


$

6.0


$

25.5


$

2.0


$

(26.7

)


$

(11.6

)


$

(32.7

)

% of revenue


(23.3

)%


(9.4

)%


2.5

%


10.7

%


(23.6

)%


(10.2

)%


Diluted shares outstanding as reported


111.6


110.3


111.6


Diluted shares outstanding as adjusted


111.6


110.5


111.6


Diluted EPS - as reported


$

(0.19

)


$

(4.83

)


$

(0.05

)

Diluted EPS - as adjusted


$

(0.30

)


$

0.02


$

(0.29

)


Contacts

Company Contact
Lyle Williams
Executive Vice President and Chief Financial Officer
713.351.7920
This email address is being protected from spambots. You need JavaScript enabled to view it.


Read full story here

DUBLIN--(BUSINESS WIRE)--The "Oil & Gas Engineering Services Market - Growth, Trends, and Forecasts (2020 - 2025)" report has been added to ResearchAndMarkets.com's offering.


The Oil & Gas Engineering Services Market is expected to register a CAGR of approximately 7% during the forecast period (2020 - 2025).

The significant adoption of automation technologies in the Oil & Gas industry is the primary factor driving the adoption of engineering services in the industry.

Companies Mentioned

  • Stress Engineering Services Inc.
  • Toyo Engineering Corporation
  • Element Materials Technology
  • L&T Technology Services Limited
  • Arseal Technologies
  • Citec Group Oy Ab
  • WSP Global Inc.
  • Wood PLC
  • Tetra Tech, Inc.
  • Mannvit Consulting Engineers
  • QuEST Global Services Pte. Ltd.
  • M&H
  • Hatch Ltd.
  • Lloyd's Register Group Services Limited

Key Market Trends

Downstream Segment to Exhibit Significant Growth

The Downstream sector of the Oil & Gas Industry includes the operations that occur after the production phase until the point of sale. Certain downstream operations include refining, processing, transportation, and sale of petroleum products. The increasing demand for safe and reliable operations, while minimizing the total cost of operations, is expected to drive the adoption of downstream oil and gas services in the industry.

  • Downstream oil and gas services play an important role in maximizing the refining process while impacting the desirability and marketability of the finished product. The downstream supply chain involves major operations such as effective database management, marketing by-products, and effective management of distribution.
  • Certain downstream oil and gas services include asset integrity management, industrial technical inspection, petroleum testing, refining and distribution, hazardous location equipment testing, and database software solutions. Some of them also include Enterprise Asset Management (EAM) solutions, which address core Asset Information Management and Plant Asset Maintenance Management applications.
  • In April 2020, Stress Engineering Services developed a sustainability scorecard with RPS to assess the emissions, carbon footprint and environmental impact of systems, sub-systems and facilities in the upstream, downstream and midstream sectors, in addition to manufacturing plants, power plants, wastewater systems, and processing systems.

North America Expected to Dominate the Market

North America is expected to dominate the Oil and Gas Engineering Services Market, due to the increasing number of oil & gas projects in countries such as the United States and Canada. The United States is one of the largest producers of crude oil and natural gas, according to the study in 2018, the United States accounted for approximately 14.1% to 20.0% of the global production of crude oil and natural gas respectively.

  • The country is witnessing a significant number of strategic collaborations as a lucrative path to grab the opportunities provided by the oil and gas industry in the region. For instance, in June 2020, US-based engineering companies, KBR and L&T Hydrocarbon Engineering (LTHE), signed a Memorandum of Understanding (MoU) aimed to build modular process plants for refinery and petrochemical projects. Under the terms of the MoU, KBR will provide license proprietary technology and engineering services such as solid acid alkylation technology (K-SAAT), solvent de-asphalting technology (ROSE), and catalytic olefins technology (K-COT). Additionally, LTHE will serve at the EPC provider.
  • Also, Canada is one of the largest producers of oil and gas globally, as the industry plays an important role in the country's economy. As per the Canadian Association of Petroleum Producers (CAPP), the oil production in the country is expected to reach 5.4 billion bbl/d in 2030, and oil sands are expected to account for 70.7% of the total production.

Key Topics Covered:

1 INTRODUCTION

1.1 Study Assumptions & Market Definition

1.2 Scope of the Study

2 RESEARCH METHODOLOGY

3 EXECUTIVE SUMMARY

4 MARKET DYNAMICS

4.1 Market Overview

4.2 Market Drivers

4.2.1 Growing Adoption of Automation in the Oil & Gas Industry to Aid Growth of Design and Engineering Services

4.2.2 Ongoing Efforts to Enhance Cost & Operational Efficiency in the Oil & Gas Industry

4.2.3 Industry 4.0 Practices Such as Extended Reality & BIM 4D to Reduce TTM

4.3 Market Restraints

4.3.1 The Market is Susceptible to Fluctuations in the Oil & Gas Prices as Well as Other Macro-economic Changes

4.3.2 Operational and Compliance-related Challenges

4.4 Industry Stakeholder and Business Model Analysis

4.5 Industry Attractiveness - Porter's Five Forces Analysis?

4.5.1 Bargaining Power of Suppliers

4.5.2 Bargaining Power of Buyers/Consumers

4.5.3 Threat of New Entrants

4.5.4 Threat of Substitute Products

4.5.5 Intensity of Competitive Rivalry

4.6 Comparative Analysis of In-house and Outsourced Engineering Services Industry

4.7 Cost Breakdown Analysis

4.8 Comparative Analysis of the Adoption Trends Between Oil & Gas and Other Major Process Industries

4.9 Impact of COVID-19 on the Engineering Services Industry

5 MARKET SEGMENTATION

5.1 By Type

5.1.1 Downstream

5.1.2 Midstream

5.1.3 Upstream

5.2 Geography

5.2.1 North America

5.2.2 Europe

5.2.3 Asia-Pacific

5.2.4 Latin America

5.2.5 Middle East & Africa

6 COMPETITIVE LANDSCAPE

6.1 Company Profiles*

7 INVESTMENT ANALYSIS

8 MARKET OPPORTUNITIES AND FUTURE TRENDS

For more information about this report visit https://www.researchandmarkets.com/r/5xuw9u


Contacts

ResearchAndMarkets.com
Laura Wood, Senior Press Manager
This email address is being protected from spambots. You need JavaScript enabled to view it.
For E.S.T Office Hours Call 1-917-300-0470
For U.S./CAN Toll Free Call 1-800-526-8630
For GMT Office Hours Call +353-1-416-8900

Offshore Source Logo

Offshore Source keeps you updated with relevant information concerning the Offshore Energy Sector.

Any views or opinions represented on this website belong solely to the author and do not represent those of the people, institutions or organizations that Offshore Source or collaborators may or may not have been associated with in a professional or personal capacity, unless explicitly stated.

Corporate Offices

Technology Systems Corporation
8502 SW Kansas Ave
Stuart, FL 34997

info@tscpublishing.com