
SANTA CLARITA, Calif.--(BUSINESS WIRE)--California Resources Corporation (NYSE: CRC), an independent California-based oil and gas exploration and production company, today reported a net loss attributable to common stock of $29 million for the third quarter of 2020, and adjusted net loss1 of $55 million. GAAP reporting requires the accounting return from the non-controlling interest in the Ares JV upon our emergence from bankruptcy to be taken into account in determining earnings per share. Accordingly, CRC reported net income of $2.20 per diluted share for the third quarter of 2020, or adjusted net income1 of $1.68 per diluted share. Operational and financial highlights for the third quarter of 2020 were as follows:
Highlights
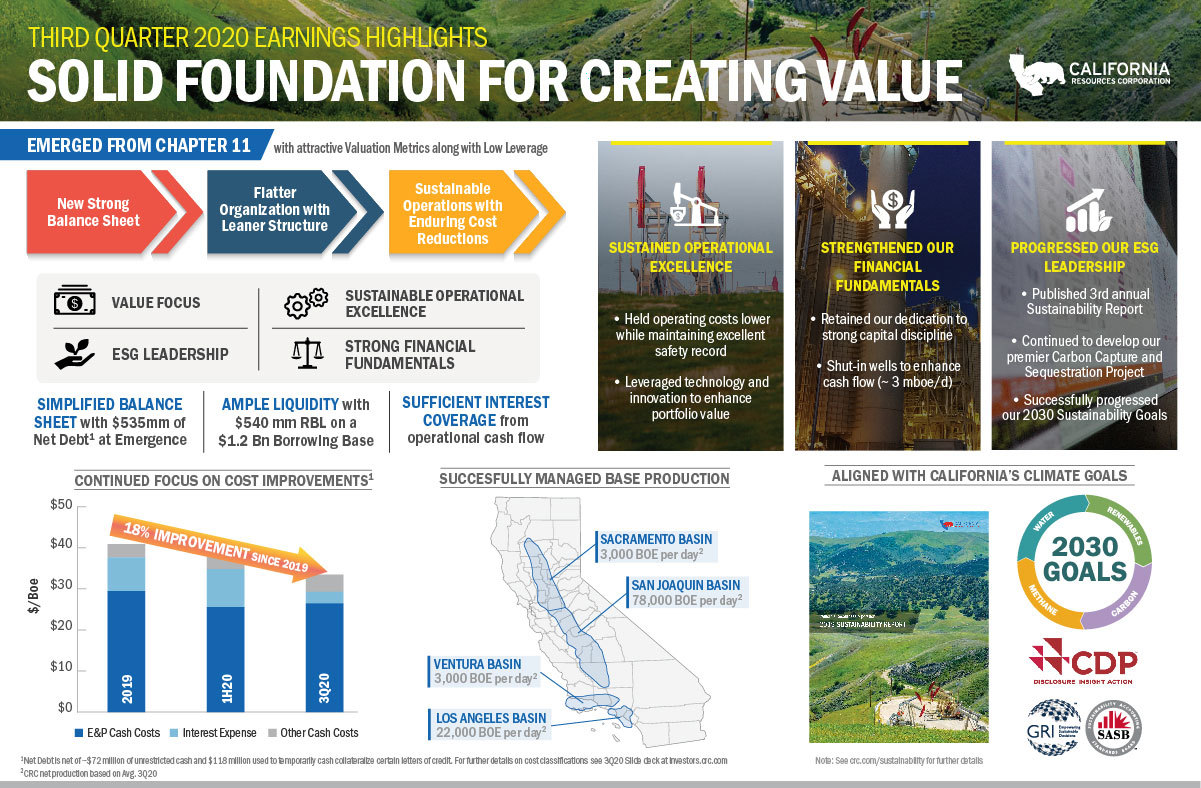
- Completed a financial restructuring and emerged from Chapter 11 bankruptcy with $535 million of net debt2 and $350 million of liquidity3
- Reported adjusted EBITDAX1 of $103 million; adjusted EBITDAX margin1 of 25%; net cash provided by operating activities of $48 million; and free cash flow1 of $44 million after internally funded capital
- Delivered average net production of 106,000 barrels of oil equivalent (BOE) per day including 64,000 barrels per day of oil
- Optimized CRC and flattened the organization for a leaner structure, reducing costs to enhance profitability in the current Brent price environment
- Published third annual Sustainability Report showcasing 2030 Sustainability Goals and 2019 ESG Performance data
Todd A. Stevens, CRC's President and Chief Executive Officer, commented, “I am proud of our team's performance as we navigated through the recent Chapter 11 restructuring while continuing to safely operate amidst the ongoing worldwide pandemic. I strongly believe that our new capital structure and organizational design provide a solid foundation to create substantial value and deliver significant shareholder returns. We look forward to further developing our vast portfolio while generating free cash flow, advancing our sustainability projects and ensuring that we can continue to provide energy to California by Californians for decades to come.”
Mr. Stevens continued, "Given the state’s energy challenges, maintaining responsible California production without interruption is more important than ever. California currently imports over 70% of the oil and 90% of the natural gas it uses daily. California needs all of its native oil and gas for personal protective equipment, hand sanitizer, jet fuel and bunker fuel for ships in our ports, in addition to gasoline, diesel and many other products essential to our quality of life."
| 1 See Attachment 3 for the non-GAAP financial measures of adjusted EBITDAX, adjusted EBITDAX margin, production costs per BOE (excluding effects of PSC-type contracts), adjusted net income (loss) and free cash flow after internally funded capital, including reconciliations to their most directly comparable GAAP measure, where applicable. |
| 2 Net debt is net of unrestricted cash of approximately $72 million and $118 million used to cash collateralize on an interim basis certain letters of credit that were outstanding under CRC’s senior debtor-in-possession credit facility at the time of our emergence. |
| 3 Liquidity includes $72 million of unrestricted cash and approximately $278 million of availability on our Revolving Credit Facility. |
Third Quarter 2020 Results
For the third quarter of 2020, CRC reported a net loss attributable to common stock (CRC net loss) of $29 million, or net income of $2.20 per diluted share after accounting for a return from the noncontrolling interest in the Ares JV, compared to a net income attributable to common stock of $94 million, or $1.89 per diluted share, for the same period of 2019. Adjusted net loss1 for the third quarter of 2020 was $55 million, or adjusted net income1 of $1.68 per diluted share, compared to adjusted net income1 of $17 million, or $0.35 per diluted share, for the same period in 2019. Third quarter 2020 adjusted net loss1 excluded unusual and infrequent items including a net gain of $66 million from reorganization items, $15 million of Chapter 11 transaction costs, $10 million of severance expenses and other net charges of $15 million. Third quarter 2019 adjusted net income1 excluded a net gain of $82 million on debt repurchases and non-cash losses on commodity derivatives of $6 million.
Adjusted EBITDAX1 for the third quarter of 2020 was $103 million and cash provided by operating activities was $48 million. Free cash flow1 was $44 million after taking into account CRC's internally funded capital of $4 million.
Total daily net production volumes decreased 17% year-over-year, from 128,000 BOE per day for the third quarter of 2019 to 106,000 BOE per day for the third quarter of 2020. The decrease from the same prior-year period over our mid-teens natural decline rate was primarily due to shut-in production driven by the collapse in commodity prices, power outages and reduced well repair work. PSC-type contracts positively impacted our oil production by nearly 1,000 barrels per day in the third quarter of 2020 compared to the same prior-year period. Oil volumes in the third quarter of 2020 averaged 64,000 barrels per day, NGL volumes averaged 14,000 barrels per day and natural gas volumes averaged 168 million cubic feet per day.
Our realized crude oil prices, including the effect of settled hedges, decreased by $26.26 per barrel from $68.41 in the third quarter of 2019 to $42.15 per barrel in the third quarter of 2020. Brent realized prices were lower in the three months ended September 30, 2020 compared to the same prior-year period due to the combination of the supply increase caused by the Saudi-Russia price war that began earlier in the year and the continuation of severe demand decline caused by COVID-19. In the third quarter of 2020, hedge settlements increased our realized crude oil prices by $0.32 per barrel compared to an increase of $5.56 per barrel in the same prior-year period. Realized NGL prices were $25.16 per barrel, up $1.61 per barrel over the prior-year period due to improvements in negotiated sales differentials along with stronger NGL values relative to crude. Realized natural gas prices were $2.22 per thousand cubic feet (Mcf) for the third quarter of 2020, $0.51 per Mcf lower than the same prior-year period increased natural gas production and higher inventories across the U.S. primarily due to shelter-in-place orders related to COVID-19, partially offset by fewer infrastructure constraints within local California markets in 2020 compared to 2019.
Production costs for the third quarter of 2020 were $141 million, compared to $221 million for the third quarter of 2019. The decrease was primarily due to efficiencies and streamlining of our operations, workforce reductions and reduced activity levels, such as well repair work, in response to the current economic environment. On a per barrel basis, for the same comparative periods, production costs were $14.52 and $18.82, respectively. Excluding the effect of PSC-type contracts, production costs per BOE1 for the third quarter of 2020 and 2019 were $13.37 and $17.44, respectively.
G&A expenses were $64 million for the third quarter of 2020, compared to $66 million for the same prior-year period. Third quarter G&A expenses decreased primarily due to ongoing cost saving efforts, workforce reductions and a decline in spending across a number of cost categories. These reductions were offset by an increase in cash costs related to changes to our compensation plans prior to our bankruptcy filing and higher payout on pre-established performance metrics on the incentive portion of these awards in the third quarter of 2020. Excluding the cost of employee incentive awards, the 2020 third quarter G&A was $44 million, down $11 million from $55 million in the third quarter of 2019.
CRC reported taxes other than on income of $42 million for the third quarter of 2020, consistent with the same prior-year period. Exploration expense was $2 million for the third quarter of 2020, $3 million less than the same prior-year period due to lower activity.
Total internally funded capital invested during the third quarter of 2020 was $4 million.
Nine-Month 2020 Results
For the first nine months of 2020, CRC reported a net loss attributable to common stock (CRC net loss) of $2,096 million, or $39.64 per diluted share after accounting for a return from the noncontrolling interest in the Ares JV in the third quarter of 2020, compared to a net income attributable to common stock of $39 million, or $0.77 per diluted share, for the same period of 2019. Adjusted net loss1 for the first nine months of 2020 was $265 million, or $2.57 per diluted share, compared to adjusted net income1 of $34 million, or $0.69 per diluted share, for the same period in 2019. The first nine months of 2020 adjusted net loss1 excluded unusual and infrequent items including $1,736 million of asset impairments, $64 million of Chapter 11 costs, a gain of $66 million on reorganization items, net, and other net losses of $97 million. The first nine months of 2019 adjusted net income1 excluded a net gain of $108 million from debt repurchases, $99 million of non-cash derivative losses, and a net $4 million charge related to other unusual and infrequent items.
Adjusted EBITDAX1 for the first nine months of 2020 was $373 million and cash provided by operating activities was $141 million. Free cash flow1 was $104 million after taking into account CRC's internally funded capital of $37 million.
Total daily net production volumes decreased 13% year-over-year, from 130,000 BOE per day for the first nine months of 2019 to 113,000 BOE per day for the first nine months of 2020. The decrease over the same prior-year period was primarily due to very limited capital investment, approximately 3,000 BOE per day of average shut-in production during the 2020 period, the Lost Hills divestiture, lower well repair work and other factors. PSC-type contracts positively impacted our oil production by over 2,800 barrels per day in the first nine months of 2020 compared to the prior-year period. Oil volumes in the first nine months of 2020 averaged 70,000 barrels per day, NGL volumes averaged 14,000 barrels per day and natural gas volumes averaged 175 million cubic feet per day.
Our realized crude oil prices, including the effect of settled hedges, decreased by $24.89 per barrel from $68.16 in the first nine months of 2019 to $43.27 per barrel in the first nine months of 2020. In the first nine months of 2020, hedge settlements increased our realized crude oil prices by $2.00 per barrel compared to an increase of $3.13 per barrel in the same prior-year period. Realized NGL prices were $25.17 per barrel, down $5.87 per barrel over the prior-year period. Realized natural gas prices were $2.05 per thousand cubic feet (Mcf) for the first nine months of 2020, $0.77 per Mcf lower than the same prior-year period.
Production costs for the first nine months of 2020 were $460 million, compared to $684 million for the first nine months of 2019. The decrease was primarily due to efficiencies and streamlining of our operations, workforce reductions and reduced work schedules, as well as lower activity levels, such as well repair work, in response to the current environment. On a per barrel basis, for the same comparative periods, production costs were $14.85 and $19.32, respectively. Excluding the effect of PSC-type contracts, production costs per BOE1 for the first nine months of 2020 and 2019 were $14.03 and $17.82, respectively.
G&A expenses were $193 million for the first nine months of 2020, compared to $228 million for the same prior-year period. The decrease was primarily attributable to cost saving efforts, workforce reductions and a decline in spending across a number of cost categories.
CRC reported taxes other than on income of $121 million for the first nine months of 2020, consistent with the same prior-year period. Exploration expense was $9 million for the first nine months of 2020, down from $25 million in the same prior-year period due to lower activity.
Total capital invested during the first nine months of 2020 was $131 million. CRC internally funded $37 million. CRC's JV partners Macquarie Infrastructure and Real Assets Inc. (MIRA) and Alpine invested an additional $1 million and $93 million, respectively, which are excluded from CRC's consolidated results.
Emergence and Balance Sheet Update
Subsequent to quarter-end, CRC emerged from Chapter 11 bankruptcy with a new balance sheet. The restructuring eliminated all pre-filing debt and the noncontrolling interests in CRC's midstream JV. As a result, CRC's new capital structure consists of a $1.2 billion reserve-based lending Revolving Credit Facility with a commitment level of $540 million, $300 million of Secured Notes and a $200 million Second Lien Term Loan. CRC has approximately $35 million drawn on the facility at emergence, net of unrestricted cash of approximately $72 million and $118 million used to cash collateralize on an interim basis certain letters of credit that were outstanding under CRC’s senior debtor-in-possession credit facility at the time of our emergence. We expect these letters of credit will be transitioned to our new Revolving Credit Facility and will no longer need to be cash collateralized. We believe that our new Revolving Credit Facility provides CRC with ample liquidity for our operations.
Upon emergence from Chapter 11 bankruptcy on October 27th, 2020, seven new directors were appointed to the Board of Directors. Our Board of Directors currently consists of eight directors as follows: (i) our President and Chief Executive Officer, Todd A. Stevens and (ii) seven non-employee directors, including Douglas E. Brooks, Tiffany (TJ) Thom Cepak, James N. Chapman, Mark A. McFarland, Julio M. Quintana, William B. Roby and Brian Steck.
Operational Update
In the third quarter of 2020, CRC operated no drilling rigs. The San Joaquin basin produced 78,000 net BOE per day. The Los Angeles basin produced 22,000 net BOE per day, the Ventura basin produced 3,000 net BOE per day and the Sacramento basin produced 3,000 net BOE per day.
2020 Capital Budget
Given the current commodity environment, CRC continues to be disciplined with its capital investment and will hold its internally funded capital program to a level that maintains the mechanical integrity of its facilities to continue to operate them in a safe and environmentally responsible manner.
Sustainability Update
CRC remains committed to transparent reporting of our environmental, social and governance (ESG) data which enhances our stakeholder engagement, strengthens our performance, and further supports our role as a dependable and dedicated energy producer in the State of California. Accordingly, we have continued to expand our sustainability disclosures, and have published our third annual Sustainability Report on our website covering our accomplishments in 2019. CRC’s 2030 Sustainability Goals and our ongoing sustainability strategy align with the climate goals of California, a signatory to the Paris Climate Accord, and support the state's sustainable development by providing safe, affordable and reliable energy that is essential for Californians. In addition, our new Board of Directors has reaffirmed the Sustainability – Health, Safety, Environment and Community Committee as a standing committee of the Board.
Hedging Update as of October 31, 2020
For the fourth quarter of 2020, CRC has protected the downside risk of approximately 39% of its volume of third quarter oil production, with approximately 74% of the hedges being in put spreads and put collars at an average Brent price of $44.84 and the remainder in swaps at an average Brent price of $44.75. For the first quarter of 2021, CRC has protected the downside risk of approximately 38% of its third quarter oil production, with approximately 75% of the hedges being in put spreads and put collars at an average Brent price of $45.00 and the remainder in swaps at an average Brent price of $44.75. For the second quarter of 2021, CRC has protected the downside risk of approximately 23% of its third quarter oil production, with approximately 60% of the hedges being in put spreads and put collars at an average Brent price of $40.00 and the remainder in swaps at an average Brent price of $44.75. For July 2021, CRC has protected the downside risk of approximately 22% of its third quarter oil production, with approximately 60% of the hedges being in put spreads and put collars at an average Brent price of $40.00 and the remainder in swaps at an average Brent price of $44.75.
Conference Call Details
To participate in the conference call scheduled for November 5th, 2020 at 5:00 P.M. Eastern Standard Time, either dial (877) 328-5505 (International calls please dial +1 (412) 317-5421) or access via webcast at www.crc.com, fifteen minutes prior to the scheduled start time to register. Participants may also pre-register for the conference call at http://dpregister.com/10140527. A digital replay of the conference call will be archived for approximately 90 days and supplemental slides for the conference call will be available online in the Investor Relations section of www.crc.com.
About California Resources Corporation
California Resources Corporation (CRC) is the largest oil and natural gas exploration and production company in California. CRC operates its world-class resource base exclusively within the State of California, applying complementary and integrated infrastructure to gather, process and market its production. Using advanced technology, CRC focuses on safely and responsibly supplying affordable energy for California by Californians.
Forward-Looking Statements
The information included herein contains forward-looking statements that involve risks and uncertainties that could materially affect our expected results of operations, liquidity, cash flows and business prospects. Such statements include those regarding our expectations as to our future:
- financial position, liquidity, cash flows and results of operations
- business prospects
- transactions and projects
- operating costs
- Value Creation Index (VCI) metrics, which are based on certain estimates including future production rates, costs and commodity prices
- operations and operational results including production, hedging and capital investment
- budgets and maintenance capital requirements
- reserves
- type curves
- expected synergies from acquisitions and joint ventures
Actual results may differ from anticipated results, sometimes materially, and reported results should not be considered an indication of future performance. While we believe assumptions or bases underlying our expectations are reasonable and make them in good faith, they almost always vary from actual results, sometimes materially. We also believe third-party statements we cite are accurate but have not independently verified them and do not warrant their accuracy or completeness. Factors (but not necessarily all the factors) that could cause results to differ include:
- our ability to execute our business plan post-emergence
- the volatility of commodity prices and the potential for sustained low oil, natural gas and NGL prices
- impact of our recent emergence from bankruptcy on our business and relationships
- debt limitations on our financial flexibility
- insufficient cash flow to fund planned investments or changes to our capital plan
- insufficient capital or liquidity, including as a result of lender restrictions, unavailability of capital markets or inability to attract potential investors
- limitations on transportation or storage capacity and the need to shut-in wells
- inability to enter into desirable transactions, including acquisitions, asset sales and joint ventures
- our ability to utilize our net operating loss carryforwards to reduce our income tax obligations
- limitations on the liquidity of our new common stock and volatility of its market price
- legislative or regulatory changes, including those related to drilling, completion, well stimulation, operation, maintenance or abandonment of wells or facilities, managing energy, water, land, greenhouse gases or other emissions, protection of health, safety and the environment, or transportation, marketing and sale of our products
- joint ventures and acquisitions and our ability to achieve expected synergies
- the recoverability of resources and unexpected geologic conditions
- incorrect estimates of reserves and related future cash flows and the inability to replace reserves
- changes in business strategy
- PSC effects on production and unit production costs
- effect of stock price on costs associated with incentive compensation
- effects of hedging transactions
- equipment, service or labor price inflation or unavailability
- availability or timing of, or conditions imposed on, permits and approvals
- lower-than-expected production, reserves or resources from development projects, joint ventures or acquisitions, or higher-than-expected decline rates
- disruptions due to accidents, mechanical failures, power outages, transportation or storage constraints, natural disasters, labor difficulties, cyber-attacks or other catastrophic events
- pandemics, epidemics, outbreaks, or other public health events, such as the coronavirus disease (COVID-19)
- factors discussed in Item 1A, Risk Factors in CRC's Annual Report on Form 10-K and third quarter 2020 Form 10-Q available at www.crc.com.
Words such as "anticipate," "believe," "continue," "could," "estimate," "expect," "goal," "intend," "likely," "may," "might," "plan," "potential," "project," "seek," "should," "target, "will" or "would" and similar words that reflect the prospective nature of events or outcomes typically identify forward-looking statements. Any forward-looking statement speaks only as of the date on which such statement is made, and we undertake no obligation to correct or update any forward-looking statement, whether as a result of new information, future events or otherwise, except as required by applicable law.
Attachment 1 |
|||||||||||||||||
SUMMARY OF RESULTS |
|
|
|
|
|
|
|
|
|
||||||||
(DEBTOR-IN-POSSESSION: Entity Operating Under Chapter 11) |
|
|
|
|
|
|
|
|
|
||||||||
|
|
Third Quarter |
|
Nine Months |
|
||||||||||||
($ and shares in millions, except per share amounts) |
|
2020 |
|
2019 |
|
2020 |
|
2019 |
|
||||||||
|
|
|
|
|
|
|
|
|
|
||||||||
Statements of Operations: |
|
|
|
|
|
|
|
|
|
||||||||
Revenues |
|
|
|
|
|
|
|
|
|
||||||||
Oil and natural gas sales |
|
$ |
312 |
|
|
$ |
541 |
|
|
$ |
987 |
|
|
$ |
1,720 |
|
|
Net derivative gain (loss) from commodity contracts |
|
— |
|
|
37 |
|
|
75 |
|
|
(31 |
) |
|
||||
Other revenue |
|
|
|
|
|
|
|
|
|
||||||||
Marketing and trading revenue |
|
50 |
|
|
62 |
|
|
109 |
|
|
230 |
|
|
||||
Electricity sales |
|
43 |
|
|
38 |
|
|
75 |
|
|
88 |
|
|
||||
Other |
|
4 |
|
|
3 |
|
|
12 |
|
|
17 |
|
|
||||
Total revenues |
|
409 |
|
|
681 |
|
|
1,258 |
|
|
2,024 |
|
|
||||
|
|
|
|
|
|
|
|
|
|
||||||||
Costs and Other |
|
|
|
|
|
|
|
|
|
||||||||
Production costs |
|
141 |
|
|
221 |
|
|
460 |
|
|
684 |
|
|
||||
General and administrative expenses |
|
64 |
|
|
66 |
|
|
193 |
|
|
228 |
|
|
||||
Depreciation, depletion and amortization |
|
89 |
|
|
118 |
|
|
296 |
|
|
357 |
|
|
||||
Asset impairments |
|
— |
|
|
— |
|
|
1,736 |
|
|
— |
|
|
||||
Taxes other than on income |
|
42 |
|
|
42 |
|
|
121 |
|
|
119 |
|
|
||||
Exploration expense |
|
2 |
|
|
5 |
|
|
9 |
|
|
25 |
|
|
||||
Other expenses, net |
|
|
|
|
|
|
|
|
|
||||||||
Marketing and trading costs |
|
35 |
|
|
45 |
|
|
67 |
|
|
170 |
|
|
||||
Electricity cost of sales |
|
17 |
|
|
18 |
|
|
47 |
|
|
51 |
|
|
||||
Transportation costs |
|
10 |
|
|
10 |
|
|
31 |
|
|
30 |
|
|
||||
Other |
|
22 |
|
|
8 |
|
|
75 |
|
|
33 |
|
|
||||
Total costs and other |
|
422 |
|
|
533 |
|
|
3,035 |
|
|
1,697 |
|
|
||||
|
|
|
|
|
|
|
|
|
|
||||||||
Operating (loss) income |
|
(13 |
) |
|
148 |
|
|
(1,777 |
) |
|
327 |
|
|
||||
|
|
|
|
|
|
|
|
|
|
||||||||
Non-Operating (Loss) Income |
|
|
|
|
|
|
|
|
|
||||||||
Reorganization items, net |
|
66 |
|
|
— |
|
|
66 |
|
|
— |
|
|
||||
Interest and debt expense, net |
|
(28 |
) |
|
(95 |
) |
|
(200 |
) |
|
(293 |
) |
|
||||
Net gain on early extinguishment of debt |
|
— |
|
|
82 |
|
|
5 |
|
|
108 |
|
|
||||
Gain on asset divestitures |
|
— |
|
|
— |
|
|
— |
|
|
— |
|
|
||||
Other non-operating expenses |
|
(32 |
) |
|
(8 |
) |
|
(93 |
) |
|
(18 |
) |
|
||||
|
|
|
|
|
|
|
|
|
|
||||||||
(Loss) Income Before Income Taxes |
|
(7 |
) |
|
127 |
|
|
(1,999 |
) |
|
124 |
|
|
||||
Income tax provision |
|
— |
|
|
— |
|
|
— |
|
|
|
|
|||||
Net (Loss) Income |
|
(7 |
) |
|
127 |
|
|
(1,999 |
) |
|
124 |
|
|
||||
Net income attributable to noncontrolling interests |
|
(22 |
) |
|
(33 |
) |
|
(97 |
) |
|
(85 |
) |
|
||||
Net (Loss) Income Attributable to Common Stock |
|
$ |
(29 |
) |
|
$ |
94 |
|
|
$ |
(2,096 |
) |
|
$ |
39 |
|
|
|
|
|
|
|
|
|
|
|
|
||||||||
Net income (loss) attributable to common stock per share - basic 1 |
|
$ |
2.20 |
|
|
$ |
1.89 |
|
|
$ |
(39.64 |
) |
|
$ |
0.78 |
|
|
Net income (loss) attributable to common stock per share - diluted 1 |
|
$ |
2.20 |
|
|
$ |
1.89 |
|
|
$ |
(39.64 |
) |
|
$ |
0.77 |
|
|
|
|
|
|
|
|
|
|
|
|
||||||||
Adjusted net (loss) income |
|
$ |
(55 |
) |
|
$ |
17 |
|
|
$ |
(265 |
) |
|
$ |
34 |
|
|
Adjusted net income (loss) per share - basic 1 |
|
$ |
1.68 |
|
|
$ |
0.35 |
|
|
$ |
(2.57 |
) |
|
$ |
0.70 |
|
|
Adjusted net income (loss) per share - diluted 1 |
|
$ |
1.68 |
|
|
$ |
0.35 |
|
|
$ |
(2.57 |
) |
|
$ |
0.69 |
|
|
|
|
|
|
|
|
|
|
|
|
||||||||
Weighted-average common shares outstanding - basic |
|
49.5 |
|
|
49.1 |
|
|
49.4 |
|
|
48.9 |
|
|
||||
Weighted-average common shares outstanding - diluted |
|
49.5 |
|
|
49.2 |
|
|
49.4 |
|
|
49.2 |
|
|
||||
|
|
|
|
|
|
|
|
|
|
||||||||
Adjusted EBITDAX |
|
$ |
103 |
|
|
$ |
278 |
|
|
$ |
373 |
|
|
$ |
834 |
|
|
Effective tax rate |
|
0 |
% |
|
0 |
% |
|
0 |
|
|
0 |
% |
|
||||
|
|
|
|
|
|
|
|
|
|
||||||||
1 Net income (loss) and adjusted net income (loss) per diluted share for the three and nine months ended September 30, 2020 include $138 million related to the deemed redemption of the noncontrolling interest in the Ares JV. |
|
||||||||||||||||
Contacts
Scott Espenshade (Investor Relations)
818-661-6010
This email address is being protected from spambots. You need JavaScript enabled to view it.
Margita Thompson (Media)
818-661-6005
This email address is being protected from spambots. You need JavaScript enabled to view it.
Read full story here
Author:This email address is being protected from spambots. You need JavaScript enabled to view it.
