Business Wire News

Small-Business Assistance Programs offers one-time grants and flexible payment options

CHICAGO--(BUSINESS WIRE)--With many restaurants, bars, retailers and other small businesses across northern Illinois struggling to stay open during the COVID-19 pandemic, ComEd today announced a new bill-assistance program to help eligible small businesses facing financial difficulties.


“Small and family-owned businesses are the backbone of our communities. When they struggle, our neighborhoods struggle.” said ComEd CEO Joe Dominguez. “By offering a new bill-assistance option targeting small and family-owned businesses, we hope to do our part to ensure that the businesses that we all love and depend upon continue to be a part of our lives.”

ComEd’s Small Business Assistance Program provides eligible small-business customers that are past due on their energy bills with a one-time grant equal to 30 percent of their total ComEd balance (up to $1,000) for a limited time. Customers whose electric service has not been disconnected can then set up their remaining balance due on a payment plan of up to six months.

Small-business customers can visit ComEd.com/SmallBizAssistance or call 1-877-4-COMED-1 (1-877-426-6331) to learn more or apply for the Small Business Assistance Program.

Earlier this week, ComEd announced its new Helping Hand program to provide more immediate aid to eligible residential customers most in need during the ongoing COVID-19 pandemic. For a limited time, this financial-assistance program provides an additional one-time grant of up to $300 to help reduce past-due balances of income-eligible customers.

Assistance through the Helping Hand program is administered directly through ComEd, which expedites the verification process so that customers can receive grants more quickly. Residential customers can apply for Helping Hand grants at ComEd.com/PaymentAssistance.

Assistance Options to Help Residential Customers

Helping Hand and the Small Business Assistance Program are the latest in a number of assistance options ComEd has developed since the pandemic to help customers, including a $18 million bill-payment assistance program for residential customers announced earlier this summer.

ComEd has continued the suspension of service disconnections for low-income customers and those who express a financial hardship through March 31, 2021. For other customers, it’s important that they continue to stay current to avoid higher past-due balances into the spring that will be harder to address.

ComEd’s bill-assistance programs also include flexible payment options, financial assistance for past-due balances and usage alerts for current bills. Any customer who is experiencing a hardship or difficulty with their electric bill should call ComEd immediately at 1-800-334-7661 (1-800-EDISON-1), Monday through Friday from 7 a.m. to 7 p.m. to learn more and enroll in a program.

ComEd also offers usage alerts and energy-management tips to help customers manage energy use to save money now and on future energy bills. For information, visit ComEd.com/OnlineTools.

ComEd is a unit of Chicago-based Exelon Corporation (NASDAQ: EXC), a Fortune 100 energy company with approximately 10 million electricity and natural gas customers – the largest number of customers in the U.S. ComEd powers the lives of more than 4 million customers across northern Illinois, or 70 percent of the state’s population. For more information visit ComEd.com and connect with the company on Facebook, Twitter, Instagram and YouTube.


Contacts

ComEd Media Relations
312-394-3500

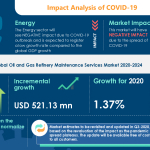
LONDON--(BUSINESS WIRE)--#GlobalOilandGasRefineryMaintenanceServicesMarket--Technavio has been monitoring the oil and gas refinery maintenance services market and it is poised to grow by USD 521.13 mn during 2020-2024, progressing at a CAGR of almost 3% during the forecast period. The report offers an up-to-date analysis regarding the current market scenario, latest trends and drivers, and the overall market environment. Download a Free Sample Report on COVID-19


Impact of COVID-19

The COVID-19 pandemic continues to transform the growth of various industries, however, the immediate impact of the outbreak is varied. While a few industries will register a drop in demand, numerous others will continue to remain unscathed and show promising growth opportunities. COVID-19 will have a low impact on the oil and gas refinery maintenance services market. The market growth in 2020 is likely to increase compared to the market growth in 2019.

Frequently Asked Questions:

  • Based on segmentation by Type, which is the leading segment in the market?
    The turnaround segment will be leading the market during the forecast period.
  • What are the major trends in the market?
    Adoption of modular mini refineries.
  • At what rate is the market projected to grow?
    The market is projected to grow at a CAGR of almost 3% during 2020-2024.
  • Who are the top players in the market?
    Aegion Corp., Aptim Corp., Chiyoda Corp., Envent Corp., Fluor Corp., John Wood Group Plc, KBR Inc., Saipem Spa, Sunergon, and Turner Industries Group are the top players in the market.
  • What are the key market drivers and challenges?
    The market is driven by the surging demand for refined fuel. However, fluctuations in crude oil prices might hamper growth.

Buy 1 Technavio report and get the second for 50% off. Buy 2 Technavio reports and get the third for free.

View market snapshot before purchasing

The market is fragmented, and the degree of fragmentation will accelerate during the forecast period. Aegion Corp., Aptim Corp., Chiyoda Corp., Envent Corp., Fluor Corp., John Wood Group Plc, KBR Inc., Saipem Spa, Sunergon, and Turner Industries Group are some of the major market participants. Although the surging demand for refined fuel will offer immense growth opportunities, fluctuations in crude oil prices are likely to pose a challenge for the market vendors. In a bid to help players strengthen their market foothold, this oil and gas refinery maintenance services market forecast report provides a detailed analysis of the leading market vendors. The report also empowers industry honchos with information on the competitive landscape and insights into the different product offerings offered by various companies.

Technavio's custom research reports offer detailed insights on the impact of COVID-19 at an industry level, a regional level, and subsequent supply chain operations. This customized report will also help clients keep up with new product launches in direct & indirect COVID-19 related markets, upcoming vaccines and pipeline analysis, and significant developments in vendor operations and government regulations.

Oil and Gas Refinery Maintenance Services Market 2020-2024: Segmentation

Oil and Gas Refinery Maintenance Services Market is segmented as below:

  • Type
    • Turnaround
    • Maintenance And Repair
  • Geography
    • APAC
    • Europe
    • North America
    • MEA
    • South America

To learn more about the global trends impacting the future of market research, download a free sample: https://www.technavio.com/talk-to-us?report=IRTNTR44762

Oil and Gas Refinery Maintenance Services Market 2020-2024: Scope

Technavio presents a detailed picture of the market by the way of study, synthesis, and summation of data from multiple sources. The oil and gas refinery maintenance services market report covers the following areas:

  • Oil and Gas Refinery Maintenance Services Market Size
  • Oil and Gas Refinery Maintenance Services Market Trends
  • Oil and Gas Refinery Maintenance Services Market Industry Analysis

This study identifies the adoption of modular mini refineries as one of the prime reasons driving the Oil and Gas Refinery Maintenance Services Market growth during the next few years.

Technavio suggests three forecast scenarios (optimistic, probable, and pessimistic) considering the impact of COVID-19. Technavio’s in-depth research has direct and indirect COVID-19 impacted market research reports.

Register for a free trial today and gain instant access to 17,000+ market research reports.

Technavio's SUBSCRIPTION platform

Oil and Gas Refinery Maintenance Services Market 2020-2024: Key Highlights

  • CAGR of the market during the forecast period 2020-2024
  • Detailed information on factors that will assist oil and gas refinery maintenance services market growth during the next five years
  • Estimation of the oil and gas refinery maintenance services market size and its contribution to the parent market
  • Predictions on upcoming trends and changes in consumer behavior
  • The growth of the oil and gas refinery maintenance services market
  • Analysis of the market’s competitive landscape and detailed information on vendors
  • Comprehensive details of factors that will challenge the growth of oil and gas refinery maintenance services market vendors

Table of Contents:

Executive Summary

Market Landscape

Market Sizing

Five Forces Analysis

Market Segmentation by Product

Customer Landscape

Geographic Landscape

Vendor Landscape

Vendor Analysis

Appendix

Explore Technavio

About Us

Technavio is a leading global technology research and advisory company. Their research and analysis focuses on emerging market trends and provides actionable insights to help businesses identify market opportunities and develop effective strategies to optimize their market positions. With over 500 specialized analysts, Technavio’s report library consists of more than 17,000 reports and counting, covering 800 technologies, spanning across 50 countries. Their client base consists of enterprises of all sizes, including more than 100 Fortune 500 companies. This growing client base relies on Technavio’s comprehensive coverage, extensive research, and actionable market insights to identify opportunities in existing and potential markets and assess their competitive positions within changing market scenarios.


Contacts

Technavio Research
Jesse Maida
Media & Marketing Executive
US: +1 844 364 1100
UK: +44 203 893 3200
Email: This email address is being protected from spambots. You need JavaScript enabled to view it.
Website: www.technavio.com/


OKLAHOMA CITY--(BUSINESS WIRE)--Enable Midstream Partners, LP (NYSE: ENBL) announced today that members of its senior management are scheduled to meet with investors at the following upcoming virtual investor conferences:


  • RBC Capital Markets Midstream and Energy Infrastructure Conference on Wednesday, Nov. 18, 2020
  • MUFG Oil & Gas Conference on Wednesday, Dec. 2, 2020
  • Wells Fargo Midstream and Utility Symposium on Wednesday, Dec. 9, 2020

The presentation materials used at these conferences will be available for download on the investor page of Enable’s website at https://investors.enablemidstream.com.

ABOUT ENABLE MIDSTREAM PARTNERS

Enable owns, operates and develops strategically located natural gas and crude oil infrastructure assets. Enable’s assets include approximately 14,000 miles of natural gas, crude oil, condensate and produced water gathering pipelines, approximately 2.6 Bcf/d of natural gas processing capacity, approximately 7,800 miles of interstate pipelines (including Southeast Supply Header, LLC of which Enable owns 50 percent), approximately 2,200 miles of intrastate pipelines and seven natural gas storage facilities comprising 84.5 billion cubic feet of storage capacity. For more information, visit https://enablemidstream.com.


Contacts

Media
Leigh Ann Williams
(405) 553-6947

Investor
Matt Beasley
(405) 558-4600

  • Pilot testwork will be completed on a 50t sample of ore collected from Piedmont’s Core Property
  • SGS Canada will complete dense medium and flotation pilot work over the coming weeks
  • Concentrate produced will be used in internal and third-party lithium hydroxide pilot programs
  • Results will be used to support definitive feasibility and detailed design engineering

NEW YORK--(BUSINESS WIRE)--$PLL #Lithium--Piedmont Lithium Limited (“Piedmont” or “Company”) is pleased to announce that it will partner with SGS Canada, Inc. (“SGS”) in Lakefield, Ontario to complete a pilot-scale spodumene concentrator testwork program using a bulk sample collected from the Piedmont Lithium Project in North Carolina.


The Company collected over 50 tonnes of mineralized pegmatite from 17 locations across the Company’s Core Property in February 2020. Samples were collected from near surface pegmatites located in areas of early, middle, and late year production.

The pilot plant design will be based on the results of prior testwork programs and will be used to support both definitive feasibility study of the Company’s planned concentrate operations as well as detailed design engineering of the full-scale operations.

The pilot program will target production of a large sample of spodumene concentrate with at least 6.0% Li2O and less than 1.0% Fe2O3 for use in future pilot-scale lithium hydroxide testwork programs that Piedmont will complete as part of Definitive Feasibility Study of the Company’s planned integrated lithium chemical plant.

Pilot Plant Setup at SGS Canada

The pilot scale testwork is viewed by the Company as a critical step in ensuring future commissioning and ramp-up success. Additionally, the bulk sample collected targeted a range of potential concentrator feed conditions, including low-grade zones and diluted feed. Testing variable conditions rather than an optimized feed will help inform engineering design and eliminate potential operational bottlenecks during the project design phase.

Keith D. Phillips, President and Chief Executive Officer, commented: “We are pleased to continue our partnership with SGS Canada on this important pilot-scale testwork program, which will underpin our upcoming definitive feasibility study as well as future detailed design engineering of our spodumene concentrator. The program will enable Piedmont to complete future lithium hydroxide testwork programs and also supply large samples of spodumene concentrate to our key customer, Tesla, for their own testing purposes.”


Contacts

Keith Phillips
President & CEO
T: +1 973 809 0505
E: This email address is being protected from spambots. You need JavaScript enabled to view it.

Tim McKenna
Investor and Government Relations
T: +1 732 331 6457
E: This email address is being protected from spambots. You need JavaScript enabled to view it.

DALLAS--(BUSINESS WIRE)--Atmos Energy Corporation (NYSE: ATO) said today that its Board of Directors declared a quarterly dividend increase on the company’s common stock to $0.625 cents per share. The Fiscal 2021 indicated annual dividend is $2.50. The Fiscal 2020 annual dividend was $2.30.

The dividend will be paid on December 14, 2020, to shareholders of record on November 30, 2020. This is the company’s 148th consecutive quarterly dividend.


Atmos Energy Corporation is the nation’s largest fully regulated, natural gas-only distributor of safe, clean, efficient and affordable energy. As part of our vision to be the safest provider of natural gas services, we are modernizing our business and our infrastructure while continuing to invest in safety, innovation, environmental sustainability and our communities. An S&P 500 company headquartered in Dallas, Atmos Energy serves more than 3 million distribution customers in over 1,400 communities across eight states and manages proprietary pipeline and storage assets, including one of the largest intrastate natural gas pipeline systems in Texas. Find us online at http://www.atmosenergy.com, Facebook, Twitter, Instagram and YouTube.


Contacts

Dan Meziere (972) 855-3729

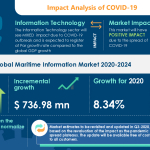
LONDON--(BUSINESS WIRE)--#GlobalMaritimeInformationMarket--The maritime information market is expected to grow by $ 736.98 mn, progressing at a CAGR of over 8% during the forecast period. Download Free Sample Report


The rising demand for operational efficiency enhancement by machine learning and data science is one of the major factors propelling market growth. However, factors such as high cost of implementation will hamper the market growth.

More details: https://www.technavio.com/report/maritime-information-market-industry-analysis

Maritime Information Market: Application Landscape

Based on the application, the MIA segment is expected to witness lucrative growth during the forecast period.

Maritime Information Market: Geographic Landscape

By geography, Europe is going to have a lucrative growth during the forecast period. About 45% of the market’s overall growth is expected to originate from Europe. Germany and Greece are the key markets for maritime information in Europe.

Buy 1 Technavio report and get the second for 50% off. Buy 2 Technavio reports and get the third for free.

View market snapshot before purchasing

Companies Covered:

  • FLIR Systems Inc.
  • Garmin Ltd.
  • Inmarsat Group Ltd.
  • Kongsberg Gruppen ASA
  • L3Harris Technologies Inc.
  • Maxar Technologies Inc.
  • ORBCOMM Inc.
  • Raytheon Co.
  • Saab AB
  • Thales Group

What our reports offer:

  • Market share assessments for the regional and country-level segments
  • Strategic recommendations for the new entrants
  • Covers market data for 2019, 2020, until 2024
  • Market trends (drivers, opportunities, threats, challenges, investment opportunities, and recommendations)
  • Strategic recommendations in key business segments based on the market estimations
  • Competitive landscaping mapping the key common trends
  • Company profiling with detailed strategies, financials, and recent developments
  • Supply chain trends mapping the latest technological advancements

Technavio suggests three forecast scenarios (optimistic, probable, and pessimistic) considering the impact of COVID-19. Technavio’s in-depth research has direct and indirect COVID-19 impacted market research reports.

Register for a free trial today and gain instant access to 17,000+ market research reports.

Technavio's SUBSCRIPTION platform

Key Topics Covered:

Executive Summary

Market Landscape

  • Market ecosystem
  • Value chain analysis

Market Sizing

  • Market definition
  • Market segment analysis
  • Market size 2019
  • Market outlook: Forecast for 2019 - 2024

Five Forces Analysis

  • Five force summary
  • Bargaining power of buyers
  • Bargaining power of suppliers
  • Threat of new entrants
  • Threat of substitutes
  • Threat of rivalry
  • Market condition

Market Segmentation by Application

  • Market segments
  • Comparison by Application
  • MIA - Market size and forecast 2019-2024
  • MIP - Market size and forecast 2019-2024
  • VT - Market size and forecast 2019-2024
  • AIS - Market size and forecast 2019-2024
  • Market opportunity by Application

Market Segmentation by End-user

  • Market segments
  • Comparison by End user
  • Commercial - Market size and forecast 2019-2024
  • Government - Market size and forecast 2019-2024
  • Market opportunity by End user

Customer landscape

Geographic Landscape

  • Geographic segmentation
  • Geographic comparison
  • Europe - Market size and forecast 2019-2024
  • North America - Market size and forecast 2019-2024
  • APAC - Market size and forecast 2019-2024
  • MEA - Market size and forecast 2019-2024
  • South America - Market size and forecast 2019-2024
  • Key leading countries
  • Market opportunity by geography
  • Market drivers
  • Market challenges
  • Market trends

Vendor Landscape

  • Vendor landscape
  • Landscape disruption

Vendor Analysis

  • Vendors covered
  • Market positioning of vendors
  • FLIR Systems Inc.
  • Garmin Ltd.
  • Inmarsat Group Ltd.
  • Kongsberg Gruppen ASA
  • L3Harris Technologies Inc.
  • Maxar Technologies Inc.
  • ORBCOMM Inc.
  • Raytheon Co.
  • Saab AB
  • Thales Group

Appendix

  • Scope of the report
  • Currency conversion rates for US$
  • Research methodology
  • List of abbreviations

About Us

Technavio is a leading global technology research and advisory company. Their research and analysis focuses on emerging market trends and provides actionable insights to help businesses identify market opportunities and develop effective strategies to optimize their market positions. With over 500 specialized analysts, Technavio’s report library consists of more than 17,000 reports and counting, covering 800 technologies, spanning across 50 countries. Their client base consists of enterprises of all sizes, including more than 100 Fortune 500 companies. This growing client base relies on Technavio’s comprehensive coverage, extensive research, and actionable market insights to identify opportunities in existing and potential markets and assess their competitive positions within changing market scenarios.


Contacts

Technavio Research
Jesse Maida
Media & Marketing Executive
US: +1 844 364 1100
UK: +44 203 893 3200
Email: This email address is being protected from spambots. You need JavaScript enabled to view it.
Website: www.technavio.com/

DALLAS--(BUSINESS WIRE)--Atmos Energy Corporation (NYSE: ATO) today reported consolidated results for its fourth fiscal quarter ended September 30, 2020.


Highlights

  • Earnings per diluted share:
    • $4.89 for the year ended September 30, 2020
    • $0.53 for the quarter ended September 30, 2020
  • Consolidated net income:
    • $601.4 million for the year ended September 30, 2020
    • $65.3 million for the quarter ended September 30, 2020
  • Adjusted net income and adjusted diluted earnings per share, which excludes a $21.0 million one-time tax benefit related to the remeasurement of net deferred tax liabilities was $580.5 million and $4.72 for the year ended September 30, 2020.
  • Capital expenditures rose 14 percent to $1,935.7 million for the year ended September 30, 2020, with approximately 88 percent of capital spending related to system safety and reliability investments.

Outlook

  • Earnings per diluted share for fiscal 2021 is expected to be in the range of $4.90 to $5.10.
  • Capital expenditures are expected to be in the range of $2.0 billion to $2.2 billion in fiscal 2021.
  • The company's Board of Directors has declared a quarterly dividend of $0.625 per common share. The indicated annual dividend for fiscal 2021 is $2.50, which represents an 8.7% increase over fiscal 2020.

“I am extremely proud of every employee for their commitment to deliver safe and reliable natural gas service paired with exceptional customer service. The preparation and dedication of our employees and leadership has served us and our customers well as we have continued to perform at the highest levels on every facet of our business during this pandemic,” said Kevin Akers, president and chief executive officer of Atmos Energy Corporation. “As we continue to execute our strategy of modernizing our natural gas distribution, transmission and storage systems to improve safety, reliability and environmental performance along with providing exceptional customer service at an affordable price, we remain well positioned to continue delivering annual earnings per share growth in the six to eight percent range,” Akers concluded.

Results for the Fiscal Year Ended September 30, 2020

Consolidated operating income increased $78.0 million to $824.1 million for the year ended September 30, 2020, compared to $746.1 million in the prior year, which primarily reflects rate outcomes in both segments and customer growth and lower operation and maintenance expense in our distribution business, partially offset by lower through system revenue and higher operation and maintenance expense in our pipeline and storage segment and increased depreciation and property tax expense.

Distribution operating income increased $57.4 million to $528.2 million for the year ended September 30, 2020, compared with $470.8 million in the prior year. The increase reflects a net $86.8 million increase in rates and customer growth of $13.7 million, partially offset by a $30.6 million increase in depreciation and property tax expenses associated with increased capital investments. Due to the timing of our fiscal year, the economic impacts from COVID-19 had a limited impact on our operating income.

Pipeline and storage operating income increased $20.6 million to $295.9 million for the year ended September 30, 2020, compared with $275.3 million in the prior year. This increase is primarily attributable to a $53.2 million increase from our GRIP filings approved in fiscal 2019 and 2020, partially offset by a $13.6 million decrease in through system revenues, a $6.8 million increase in operation and maintenance expense primarily due to well integrity costs and spending on hydro testing and in-line inspections and a $12.5 million increase in depreciation expense due to increased capital investments.

Capital expenditures increased $242.2 million to $1,935.7 million for the year ended September 30, 2020, compared with $1,693.5 million in the prior year, due to continued spending for infrastructure replacements and enhancements.

For the year ended September 30, 2020, the company generated operating cash flow of $1,038.0 million, a $69.2 million increase compared with the year ended September 30, 2019. The year-over-year increase reflects the positive cash effects of rate case outcomes achieved in fiscal 2020 and working capital changes, primarily as a result of the timing of gas cost recoveries under our purchase gas cost mechanisms.

Our equity capitalization ratio at September 30, 2020 was 60.0%, compared with 59.0% at September 30, 2019. The increase primarily reflects the absence of short-term debt balances at September 30, 2020.

Results for the Three Months Ended September 30, 2020

Consolidated operating income increased $11.1 million to $100.8 million for the three months ended September 30, 2020, from $89.7 million in the prior-year quarter. Rate case outcomes in both segments and customer growth in our distribution segment were partially offset by lower through system revenue in our pipeline and storage segment, decreased service order revenue in our distribution segment and higher depreciation expense.

Distribution operating income increased $8.2 million to $31.9 million for the three months ended September 30, 2020, compared with $23.7 million in the prior-year quarter. The increase primarily reflects a net $16.0 million increase in rates and a $3.4 million increase due to net customer growth, partially offset by a $10.5 million increase in operating expenses primarily related to increased bad debt expense and a $3.1 million decrease in service order revenues.

Pipeline and storage operating income increased $2.9 million to $68.9 million for the three months ended September 30, 2020, compared with $66.0 million in the prior-year quarter. This increase is primarily attributable to a $13.3 million increase in rates, due to the GRIP filing approved in fiscal 2020, partially offset by a $5.0 million decrease in through system revenues and a $4.2 million increase in depreciation expense due to increased capital investments.

Conference Call to be Webcast November 12, 2020

Atmos Energy will host a conference call with financial analysts to discuss the fiscal 2020 fourth quarter financial results on Thursday, November 12, 2020, at 10:00 a.m. Eastern Time. The domestic telephone number is 877-407-3088 and the international telephone number is 201-389-0927. Kevin Akers, President and Chief Executive Officer, and Chris Forsythe, Senior Vice President and Chief Financial Officer, will participate in the conference call. The conference call will be webcast live on the Atmos Energy website at www.atmosenergy.com. A playback of the call will be available on the website later that day.

Forward-Looking Statements

The matters discussed in this news release may contain “forward-looking statements” within the meaning of Section 27A of the Securities Act of 1933 and Section 21E of the Securities Exchange Act of 1934. All statements other than statements of historical fact included in this news release are forward-looking statements made in good faith by the company and are intended to qualify for the safe harbor from liability established by the Private Securities Litigation Reform Act of 1995. When used in this news release or any of the company’s other documents or oral presentations, the words “anticipate”, “believe”, “estimate”, “expect”, “forecast”, “goal”, “intend”, “objective”, “plan”, “projection”, “seek”, “strategy” or similar words are intended to identify forward-looking statements. Such forward-looking statements are subject to risks and uncertainties that could cause actual results to differ materially from those discussed in this presentation, including the risks relating to regulatory trends and decisions, the company’s ability to continue to access the credit and capital markets, and the other factors discussed in the company’s reports filed with the Securities and Exchange Commission. These risks and uncertainties include the following: federal, state and local regulatory and political trends and decisions, including the impact of rate proceedings before various state regulatory commissions; increased federal regulatory oversight and potential penalties; possible increased federal, state and local regulation of the safety of our operations; the impact of greenhouse gas emissions or other legislation or regulations intended to address climate change; possible significant costs and liabilities resulting from pipeline integrity and other similar programs and related repairs; the inherent hazards and risks involved in distributing, transporting and storing natural gas; the availability and accessibility of contracted gas supplies, interstate pipeline and/or storage services; increased competition from energy suppliers and alternative forms of energy; adverse weather conditions; the impact of climate change; the inability to continue to hire, train and retain operational, technical and managerial personnel; increased dependence on technology that may hinder the Company's business if such technologies fail; the threat of cyber-attacks or acts of cyber-terrorism that could disrupt our business operations and information technology systems or result in the loss or exposure of confidential or sensitive customer, employee or Company information; natural disasters, terrorist activities or other events and other risks and uncertainties discussed herein, all of which are difficult to predict and many of which are beyond our control; the capital-intensive nature of our business; our ability to continue to access the credit and capital markets to execute our business strategy; market risks beyond our control affecting our risk management activities, including commodity price volatility, counterparty performance or creditworthiness and interest rate risk; the concentration of our operations in Texas; the impact of adverse economic conditions on our customers; changes in the availability and price of natural gas; increased costs of providing health care benefits, along with pension and postretirement health care benefits and increased funding requirements; the outbreak of COVID-19 and its impact on business and economic conditions.

Accordingly, while we believe these forward-looking statements to be reasonable, there can be no assurance that they will approximate actual experience or that the expectations derived from them will be realized. Further, the company undertakes no obligation to update or revise any of our forward-looking statements whether as a result of new information, future events or otherwise.

Non-GAAP Financial Measures

During our fiscal third quarter we remeasured our deferred income tax balance as a result of Kansas House Bill 2585 and an update to the state deferred tax rate. As a result, we recorded a non-cash income tax benefit of $21.0 million for the year ended September 30, 2020. Due to the non-recurring nature of this benefit, we believe that net income and diluted net income per share before the non-cash income tax benefit provide a more relevant measure to analyze our financial performance than net income and diluted net income per share in order to allow investors to better analyze our core results and allow the information to be presented on a comparative basis to the prior year. Accordingly, the discussion and analysis of our financial performance herein will reference adjusted net income and adjusted diluted net income per share, non-GAAP measures, which are calculated as follows:


Year Ended September 30


2020


2019


Change


(In thousands, except per share data)

Net income

$

601,443


$

511,406


$

90,037


Non-cash income tax benefit

(20,962

)


(20,962

)

Adjusted net income

$

580,481


$

511,406


$

69,075


Diluted net income per share

$

4.89


$

4.35


$

0.54


Diluted EPS from non-cash income tax benefit

(0.17

)


(0.17

)

Adjusted diluted net income per share

$

4.72


$

4.35


$

0.37


About Atmos Energy

Atmos Energy Corporation is the nation’s largest fully regulated, natural gas-only distributor of safe, clean, efficient and affordable energy. As part of our vision to be the safest provider of natural gas services, we are modernizing our business and our infrastructure while continuing to invest in safety, innovation, environmental sustainability and our communities. An S&P 500 company headquartered in Dallas, Atmos Energy serves more than 3 million distribution customers in over 1,400 communities across eight states and manages proprietary pipeline and storage assets, including one of the largest intrastate natural gas pipeline systems in Texas. Find us online at http://www.atmosenergy.com, Facebook, Twitter, Instagram and YouTube.

This news release should be read in conjunction with the attached unaudited financial information.


Atmos Energy Corporation

Financial Highlights (Unaudited)


Statements of Income


Year Ended September 30

(000s except per share)


2020


2019

Operating revenues


Distribution segment


$

2,626,993


$

2,745,461


Pipeline and storage segment


609,339


567,024


Intersegment eliminations


(415,195

)


(410,637

)


2,821,137


2,901,848


Purchased gas cost


Distribution segment


1,071,227


1,268,591


Pipeline and storage segment


1,548


(360

)

Intersegment eliminations


(413,921

)


(409,394

)


658,854


858,837


Operation and maintenance expense


629,601


630,308


Depreciation and amortization


429,828


391,456


Taxes, other than income


278,755


275,189


Operating income


824,099


746,058


Other non-operating income


7,171


7,404


Interest charges


84,474


103,153


Income before income taxes


746,796


650,309


Income tax expense


145,353


138,903


Net income


$

601,443


$

511,406


Basic net income per share


$

4.89


$

4.36


Diluted net income per share


$

4.89


$

4.35


Cash dividends per share


$

2.30


$

2.10


Basic weighted average shares outstanding


122,788


117,200


Diluted weighted average shares outstanding


122,872


117,461


Year Ended September 30

Summary Net Income by Segment (000s)


2020


2019

Distribution


$

395,664


$

328,814


Pipeline and storage


205,779


182,592


Net income


$

601,443


$

511,406


Atmos Energy Corporation

Financial Highlights, continued (Unaudited)


Statements of Income


Three Months Ended September 30

(000s except per share)


2020


2019

Operating revenues


Distribution segment


$

430,176


$

403,793


Pipeline and storage segment


156,918


147,706


Intersegment eliminations


(112,180

)


(107,816

)


474,914


443,683


Purchased gas cost


Distribution segment


128,641


120,993


Pipeline and storage segment


1,258


184


Intersegment eliminations


(111,868

)


(107,507

)


18,031


13,670


Operation and maintenance expense


180,072


177,736


Depreciation and amortization


111,746


100,919


Taxes, other than income


64,220


61,643


Operating income


100,845


89,715


Other non-operating income (expense)


(1,962

)


9,250


Interest charges


15,494


28,763


Income before income taxes


83,389


70,202


Income tax expense


18,056


11,796


Net income


$

65,333


$

58,406


Basic net income per share


$

0.53


$

0.49


Diluted net income per share


$

0.53


$

0.49


Cash dividends per share


$

0.575


$

0.525


Basic weighted average shares outstanding


124,096


119,345


Diluted weighted average shares outstanding


124,100


119,824


Three Months Ended September 30

Summary Net Income by Segment (000s)


2020


2019

Distribution


$

19,944


$

9,838


Pipeline and storage


45,389


48,568


Net income


$

65,333


$

58,406


Atmos Energy Corporation

Financial Highlights, continued (Unaudited)

Condensed Balance Sheets


September 30,


September 30,

(000s)


2020


2019

Net property, plant and equipment


$

13,355,347


$

11,787,669


Cash and cash equivalents


20,808


24,550


Accounts receivable, net


230,595


230,571


Gas stored underground


111,950


130,138


Other current assets


107,905


72,772


Total current assets


471,258


458,031


Goodwill


731,257


730,706


Deferred charges and other assets


801,170


391,213


$

15,359,032


$

13,367,619


Shareholders' equity


$

6,791,203


$

5,750,223


Long-term debt


4,531,779


3,529,452


Total capitalization


11,322,982


9,279,675


Accounts payable and accrued liabilities


235,775


265,024


Other current liabilities


546,461


479,501


Short-term debt


464,915


Current maturities of long-term debt


165


Total current liabilities


782,401


1,209,440


Deferred income taxes


1,456,569


1,300,015


Regulatory excess deferred taxes


697,764


705,101


Deferred credits and other liabilities


1,099,316


873,388


$

15,359,032


$

13,367,619


Atmos Energy Corporation

Financial Highlights, continued (Unaudited)

Condensed Statements of Cash Flows


Year Ended September 30

(000s)


2020


2019

Cash flows from operating activities


Net income


$

601,443


$

511,406


Depreciation and amortization


429,828


391,456


Deferred income taxes


155,322


132,004


One-time income tax benefit


(20,962

)


Other


6,044


10,589


Changes in assets and liabilities


(133,676

)


(76,686

)

Net cash provided by operating activities


1,037,999


968,769


Cash flows from investing activities


Capital expenditures


(1,935,676

)


(1,693,477

)

Proceeds from the sale of discontinued operations


4,000


Debt and equity securities activities, net


491


(2,784

)

Other, net


9,667


8,601


Net cash used in investing activities


(1,925,518

)


(1,683,660

)

Cash flows from financing activities


Net decrease in short-term debt


(464,915

)


(110,865

)

Proceeds from issuance of long-term debt, net of premium/discount


999,450


1,045,221


Net proceeds from equity offering


624,302


694,103


Issuance of common stock through stock purchase and employee retirement plans


19,548


19,323


Settlement of interest rate swaps


(4,426

)


(90,141

)

Repayment of long-term debt


(575,000

)

Cash dividends paid


(282,444

)


(245,717

)

Debt issuance costs


(7,738

)


(11,254

)

Net cash provided by financing activities


883,777


725,670


Net increase (decrease) in cash and cash equivalents


(3,742

)


10,779


Cash and cash equivalents at beginning of period


24,550


13,771


Cash and cash equivalents at end of period


$

20,808


$

24,550


Three Months Ended September 30


Year Ended September 30

Statistics


2020


2019


2020


2019

Consolidated distribution throughput (MMcf as metered)


66,447


66,184


439,037


470,554


Consolidated pipeline and storage transportation volumes (MMcf)


167,725


204,810


621,371


721,998


Distribution meters in service


3,333,181


3,291,835


3,333,181


3,291,835


Distribution average cost of gas


$

3.75


$

3.68


$

3.67


$

4.02


Contacts

Analysts and Media Contact:
Dan Meziere (972) 855-3729

DUBLIN--(BUSINESS WIRE)--The "Europe Fuel Additives Market - Growth, Trends, and Forecast (2020 - 2025)" report has been added to ResearchAndMarkets.com's offering.


The Europe fuel additives market is estimated to witness a significant growth, at an estimated CAGR of around 4%, over the forecast period. Major factors driving the market studied are the enactment of stringent environmental regulations.

  • Increasing demand and penetration of battery electric vehicles (BEVs) are projected to hinder the market growth in the coming years.
  • Accelerating demand for ultra-low-sulfur diesel (ULSD) is likely to create opportunities to the market in the future.
  • Germany accounted for the largest market share and is expected to continue domination during the forecast period.

Key Market Trends

Gasoline to Dominate the Market

  • Gasoline is the major application of fuel additives in terms of market share. Gasoline engine technologies and fuels are constantly evolving and providing new challenges. The growth in the consumption of gasoline additive largely reflects the requirements of engine design and developments in refinery operations. Also, the additive cost is less than 0.3% of the average retail gasoline price.
  • The increasing popularity of new age fuel delivery systems, like gasoline direct injection (GDI) system, is likely to boost the demand for fuel additives.
  • Port injection fuel delivery systems used to be the norm. However, new gasoline direct injection or GDI technology is becoming standard equipment on many new cars, especially in high-performance vehicles. In this innovative fuel delivery system, the injector is placed inside the combustion chamber yielding improved combustion to produce better performance, improved gas mileage, and fewer emissions. Deposits in GDI systems are extremely hard to remove and require more fuel additives.
  • The market penetration of gasoline direct injection (GDI) engines is growing rapidly, which is quite instrumental in propelling the market demand for gasoline fuel additives, in significant amount.
  • Hence, owing to the above-mentioned reasons, the gasoline-related applications of fuel additives are likely to account for the highest market share, during the forecast period.

Germany to Dominate the Market

  • Germany leads Europe's automotive market with 41 assembly and engine production plants that contribute to one third of the total automobile production in Europe.
  • Germany, being one of the leading manufacturing bases for the aircraft industry, is the home to manufacturers from different segments, such as equipment manufacturers, material and component suppliers, engine producers, and whole system integrators.
  • The German aerospace industry comprises more than 2,300 firms located all around the country, with northern Germany being the area with a higher concentration of firms.
  • The country hosts a large number of production bases for aircraft interior components, MRO (maintenance, repair, and overhaul), and lightweight construction and materials, largely in Bavaria, Bremen, Baden-Wurttemberg, and Mecklenburg-Vorpommern.
  • It has been estimated that over 30 to 35 thousand new aircraft will be operational by the next 20 years, in order to meet the rising aviation demand. Thus, with the increase in production of aircraft, the consumption of fuel additives will increase during the forecast period.
  • Due to all such factors, the market for fuel additives in the country is expected to have a steady growth during the forecast period.

Key Topics Covered:

1 INTRODUCTION

2 RESEARCH METHODOLOGY

3 EXECUTIVE SUMMARY

4 MARKET DYNAMICS

4.1 Drivers

4.1.1 Enactment of Stringent Environmental Regulations

4.1.2 Other Drivers

4.2 Restraints

4.2.1 Increasing Demand and Penetration of Battery Electric Vehicles (BEVs)

4.2.2 High Costs of R&D Activities

4.3 Industry Value-Chain Analysis

4.4 Porter's Five Forces Analysis

5 MARKET SEGMENTATION

5.1 Product Type

5.2 Application

5.3 Geography

6 COMPETITIVE LANDSCAPE

6.1 Mergers & Acquisitions, Joint Ventures, Collaborations, and Agreements

6.2 Market Share Analysis

6.3 Strategies Adopted by Leading Players

6.4 Company Profiles

6.4.1 Afton Chemical

6.4.2 Baker Hughes, a GE Company LLC

6.4.3 BASF SE

6.4.4 Chevron Corporation

6.4.5 Clariant

6.4.6 Croda International Plc

6.4.7 Eni SpA

6.4.8 Evonik Industries AG

6.4.9 Exxon Mobil Corporation

6.4.10 LANXESS

6.4.11 Royal Dutch Shell plc

6.4.12 The Lubrizol Corporation

6.4.13 Total

6.4.14 VeryOne SaS (EURENCO)

7 MARKET OPPORTUNITIES AND FUTURE TRENDS

7.1 Accelerating Demand for Ultra-low-sulfur Diesel (ULSD)

For more information about this report visit https://www.researchandmarkets.com/r/kgfqzu

About ResearchAndMarkets.com

ResearchAndMarkets.com is the world's leading source for international market research reports and market data. We provide you with the latest data on international and regional markets, key industries, the top companies, new products and the latest trends.


Contacts

ResearchAndMarkets.com
Laura Wood, Senior Press Manager
This email address is being protected from spambots. You need JavaScript enabled to view it.
For E.S.T Office Hours Call 1-917-300-0470
For U.S./CAN Toll Free Call 1-800-526-8630
For GMT Office Hours Call +353-1-416-8900

HOUSTON--(BUSINESS WIRE)--Today Delfin Midstream (“Delfin”) announced that Oscar Spieler has decided to join as Executive Chairman of the Board. Mr. Spieler has had a renowned executive career in the LNG, shipping, offshore energy, and green energy industries, including as CEO at Golar LNG (NASDAQ: GLNG), Frontline (NYSE: FRO) and Sea Production, and as Chairman of Quantafuel (QFUEL-ME). Mr. Spieler brings relevant expertise, having successfully led the development and execution of the first FLNG Vessel at Golar, delivering FLNG Hilli Episeyo under budget and putting it into commercial operation.

Delfin recently announced the completion of its FEED for a Newbuild FLNG vessel. The FEED results, together with the overall project development activities, enable the Company to execute the project for a total capital cost of around 550 $/tpa(1). The Company is also using its low-cost FLNG infrastructure and technology to develop additional projects in North America.

Commenting on his appointment, Oscar Spieler said: “Delfin has developed the most cost-efficient LNG export project in the continental U.S and combined with a FID threshold of just 2.0 to 2.5 mtpa makes Delfin unique in today’s challenging market. I am excited to join the Delfin team at this pivotal moment, as we take our next steps in bringing the project to FID. With the world transitioning to low-carbon energy over the coming decades, LNG is an undeniable part of the solution. The uniqueness of the Delfin cost structure, business model, technology and asset portfolio means we are capable of providing LNG buyers with low-carbon, low-cost solutions with significantly more commercial flexibility than land-based projects.”

Dudley Poston, CEO of Delfin, added: “We are delighted to welcome Oscar to the team. He brings a wealth of knowledge and expertise across the LNG value chain. Over the last decade Oscar has played key roles in the development of some of the most important innovations in the LNG industry: FLNG, merchant LNG shipping, FSRUs and small-scale LNG. Most importantly, he has demonstrated his success in ensuring the financing, commercialization, operations, execution and viability of each venture. Oscar’s experience and leadership will be invaluable as Delfin moves from the development phase to commercial operations.”

In 2018 Mr. Spieler joined Quantafuel as Chairman of the board, which in 2020 successfully started its first plastic-to-liquids plant and completed a successful IPO and private capital raise. Mr. Spieler has vast board experience both as chairman and/or director of multiple companies within the shipping, drilling and finance sectors, including Offshore Merchant Partners, Energy Drilling Ltd, Jasper Investments, Archer, Avenir LNG, North Atlantic Drilling and Sealift.

Mr. Spieler has a Master’s Degree in Naval Architecture and Engineering from the Norwegian University of Science and Technology. In addition to spending over 15 years in John Frederiksen’s Sea Tankers group of companies, Mr. Spieler spent 15 years at DNV in Norway and four years with Norwegian Tanker Operator Bergesen.

(1) Includes all costs up to start of commercial operations (incl. FLNG Vessel, disconnectable mooring system, pipeline connections, owner’s costs, transit, installation, commissioning, contingencies), excl. finance costs, on a nameplate capacity basis

About Delfin Midstream Inc.

Delfin Midstream Inc. (“Delfin”) is a leading LNG export infrastructure development company utilizing low-cost Floating LNG technology solutions. Delfin is the parent company of the Delfin LNG LLC (“Delfin LNG”) and Avocet LNG LLC. Delfin LNG is a brownfield Deepwater Port requiring minimal additional infrastructure investment to support up to four FLNG Vessels producing up to 13 million tonnes of LNG per annum. Delfin purchased the UTOS pipeline, the largest natural gas pipeline in the Gulf of Mexico, in 2014 and submitted its Deepwater Port license application in 2015. Delfin LNG received a positive Record of Decision from MARAD and approval from the Department of Energy for long-term exports of LNG to countries that do not have a Free Trade Agreement with the United States for up to 13 MTPA. Further information is available at www.delfinmidstream.com.


Contacts

Dudley Poston, CEO, +1 713 824 1597
Wouter Pastoor, COO, +47 900 56 265
This email address is being protected from spambots. You need JavaScript enabled to view it. or www.delfinmidstream.com

Media:

Dan Gagnier
Gagnier Communications
+1 646-569-5897

Four inverter models are certified as PV Rapid Shutdown Systems with Tigo’s rapid shutdown devices


CAMPBELL, Calif.--(BUSINESS WIRE)--#rapidshutdown--Yaskawa Solectria Solar has joined the Tigo Enhanced initiative, aimed at providing customers with simple and reliable rapid shutdown solutions that meet all safety and code requirements. All Solectria inverters that are Tigo Enhanced are plug and play out of the box with Tigo’s latest generation rapid shutdown devices.

“We are excited to join the Tigo Enhanced program to generate more awareness about our solutions and make fulfilling safety and certification requirements as easy as possible for our customers,” said Mark Goodreau, General Manager of Yaskawa Solectria Solar.

Solectria’s Tigo Enhanced inverters have integrated Tigo’s RSS transmitter – which communicates with Tigo’s rapid shutdown devices – and completed UL PV Rapid Shutdown System (PVRSS) certification. The following inverters are part of the program:

  • Solectria PVI 60TL (3 phase, 60kW, 480Vac)
  • Solectria PVI 50TL (3 phase, 50kW, 480Vac)
  • Solectria PVI 25TL-208 (3 phase, 25kW, 208Vac)
  • Solectria PVI 25TL-480-R (3 phase, 25kW, 480Vac)

Customers can now look for the Tigo Enhanced logo on one of Solectria’s inverters and know that they are getting a product that seamlessly works with Tigo’s rapid shutdown devices.

“We have worked with Yaskawa Solectria Solar for a long time and are honored to have them as a partner in the Tigo Enhanced program,” said Dru Sutton, VP of Sales for North America at Tigo Energy. “Ultimately, this is about providing assurance to customers that when they choose a Solectria inverter that is Tigo Enhanced, they know they’re getting a reliable, proven, certified rapid shutdown solution.”

Yaskawa Solectria Solar and Tigo received UL PVRSS certification after testing the inverter and rapid shutdown devices for compatibility and safety. The certification fulfills a necessary safety requirement for PV Rapid Shutdown in the National Electrical Code. Rapid shutdown devices are now required with rooftop PV installations across the vast majority of the United States.

The companies are hosting a live webinar on Thursday, November 12 at 10am PT (1pm ET) to highlight their combined rapid shutdown solutions for commercial PV customers. Interested parties can register here.

The Solectria inverters and Tigo rapid shutdown devices can be purchased at leading distributors throughout the United States. For more information, contact: https://www.solectria.com/company/contact/ or This email address is being protected from spambots. You need JavaScript enabled to view it.

About Yaskawa Solectria Solar

Yaskawa Solectria Solar, a wholly-owned subsidiary of Yaskawa America, Inc., is the largest commercial inverter manufacturer in the U.S. Solectria’s products include 14kW to 750kW inverters, string combiners and web-based monitoring for all size solar systems. Solectria is backed by over 100 years of power electronics and inverter experience. All of Solectria’s three-phase central inverters are made in the USA. PV System owners, developers and EPCs rely on the high performance, reliability and bankability of Yaskawa Solectria Solar. To learn more please visit www.solectria.com.

About Tigo

Tigo is the worldwide leader in flexible module level power electronics (MLPE) with innovative solutions that significantly enhance safety, increase energy production, and decrease operating costs of photovoltaic (PV) systems. Tigo’s TS4 platform maximizes the benefit of PV systems and provides customers with the most scalable, versatile, and reliable MLPE solution available. Tigo was founded in Silicon Valley in 2007 to accelerate the adoption of solar energy worldwide. Tigo systems operate on 7 continents and produce gigawatt hours of reliable, clean, affordable and safe solar energy daily. Tigo's global team is dedicated to making the best MLPE on earth so more people can enjoy the benefits of solar. Visit us at www.tigoenergy.com.


Contacts

Media Contact for Tigo
John Lerch
408.402.0802 x430
This email address is being protected from spambots. You need JavaScript enabled to view it.

Operating Revenue Also Represents a New Record

HOUSTON--(BUSINESS WIRE)--Port Houston Executive Director Roger Guenther provided his monthly staff report to the Port Commission of the Port of Houston Authority at its Annual Budget Workshop held on Tuesday.


Guenther said that this was the “busiest month ever” for Port Houston, “jumping 15% over October 2019” by handling over 296,000 twenty-foot-equivalent (TEU) container units, putting it year-to-date at only 1% lower than 2019, a record year for Port Houston.

Guenther credited the growing cargo activity as driven by an 18% increase in “loaded” or full containers. He added, “Port Houston’s peak season has been compressed over the last couple of months, as retailers rush to ensure merchandise is on the shelves to meet holiday demands.” Guenther indicated that October operating revenue of $36.6 million, driven by the increased container volume, also represents a new record.

The Port Houston team and all partners, including the International Longshoremen Association, seafarers, Houston Pilots, and tugboat operators, were recognized for “pushing forward together exceptionally well,” ensuring jobs and economic stability for the region. Chairman Campo also expressed his appreciation to Port Police and Port Firefighters for keeping the Port of Houston and its channel waterways safe.

Guenther pointed out that along with increased cargo activity, the Port Houston team and partners continue to deliver “tremendous growth efficiently and reliably for our customers and free of congestion.” Guenther concluded his report saying, “we expect to see a strong finish through the remainder of 2020.”

Driving home the investment message to support continued growth in the coming year, the Port Commission approved the 2021 Operating and Capital Budget, including expected operating revenues of $398 million, up 5% over this year. Container volumes are projected to grow by 6%, and general cargoes are expected to show recovery next year.

The budget also includes next year’s $239 million Capital Plan to support new growth opportunities, primarily at the container terminals, with investments in the redevelopment of existing assets as well.

The Port Commission was also briefed on the Port Houston 2040 Plan. This living document is a long-range comprehensive blueprint created with input from more than 50 organizations, to help guide Port Houston’s future decision-making. More information can be found on the plan here: https://porthouston.com/2040plan/

The next Port Commission meeting is scheduled for Tuesday, Dec. 8.

About Port Houston

For more than 100 years, Port Houston has owned and operated the public wharves and terminals of the greater Port of Houston – the nation’s largest port for the foreign waterborne tonnage and an essential economic engine for the Houston region, the state of Texas, and the nation. The Port of Houston supports the creation of nearly 1.35 million jobs in Texas and 3.2 million jobs across the nation, and economic activity totaling $339 billion in Texas – 20.6 % of the Texas total gross domestic product (GDP) – and a total of $801.9 billion in U.S. economic impact. For more information, visit the website at https://porthouston.com/.


Contacts

Lisa Ashley, Director, Media Relations, Port Houston
Office: 713-670-2644; Mobile: 832-247-8179; E-mail: This email address is being protected from spambots. You need JavaScript enabled to view it.

AMSTERDAM & LOS ANGELES--(BUSINESS WIRE)--Netherlands-based International Airport operator, Royal Schiphol Group (via its subsidiary Schiphol International B.V.), and U.S. based, global alternative investment manager, Oaktree Capital Management L.P.’s Transportation Infrastructure Investing Group (“Oaktree”), announced today that they have entered into an alliance to pursue airport investment and management opportunities within the North American market, focusing on the U.S. The alliance will concentrate on building public-private partnerships, driving infrastructure investment, implementing operational and sustainability best practices, and improving the overall level of customer experience at U.S. Airports.

The alliance plans to work alongside innovative and forward-thinking airports with an interest in accessing the expertise of Schiphol’s world-class aviation franchise and Oaktree’s public-private airport experience and value-added, long-dated, stable infrastructure capital. “Our partnership with Schiphol will increase our ability to access the FAA’s Airport Investment Partnership Program (AIPP) and to invest alongside existing airport management teams as we help U.S. airports modernize their infrastructure” said Emmett McCann, Managing Director and Co-Portfolio Manager of Oaktree’s Transportation Infrastructure Investing strategy.

We are thrilled to work alongside the Oaktree team to combine our joint expertise in the U.S. market. We believe that the AIPP creates interesting opportunities to expand our presence in the U.S., including the ability to partner with existing airport operators. We believe that these types of partnerships give airport managers and local municipalities the ability to expand their depth and expertise of airport management, create new and broader access to capital, while also allowing operators to continue to hold an important role in the direction and management of their airport,” stated Kjell Kloosterziel, Director of Schiphol International. “This type of transaction is aimed at benefiting local communities and other local stakeholders, while also giving the airport sponsor the benefits of the AIPP program – creating true long-term partnerships that align with our corporate culture and strategy seeking to create long-term value for all stakeholders.”

About Royal Schiphol Group

Royal Schiphol Group is an enterprise that operates airports in the Netherlands, conducts international activities and participates in airports abroad. Operating Amsterdam Airport Schiphol, in 2019 the third airport in Europe in passenger volumes and number two for direct connectivity, is the Group's largest activity.

Royal Schiphol Group's mission is 'Connecting your world'. Schiphol Group’s domestic and international activities strengthen its role as a world-leading airport operator. Schiphol Group pursues partnership opportunities that are financially attractive and offer scope for reciprocal knowledge sharing, innovation and inspiration and offer opportunities to test new technologies and concepts. More information about Schiphol International can be found at our website: https://www.schiphol.nl/en/schiphol-group/page/schiphol-international/.

About Oaktree

Oaktree is a leader among global investment managers specializing in alternative investments, with $140 billion in assets under management as of September 30, 2020. Oaktree’s Transportation Infrastructure Investing Group seeks to make investments in North American transportation assets, businesses and infrastructure, including airports, seaports and railroads, where it can pursue value-creation strategies geared towards sustainable growth. Oaktree has over 1,000 employees and offices in 19 cities worldwide. For additional information, please visit Oaktree’s website at http://www.oaktreecapital.com/.


Contacts

Suzanne Byowitz
Sard Verbinnen and Co
Email: This email address is being protected from spambots. You need JavaScript enabled to view it.

LEAWOOD, KS--(BUSINESS WIRE)--Tortoise announced today that following a strategic review of the funds, the Board of Directors has approved a proposal to merge Tortoise Energy Independence Fund, Inc. (NDP) with and into Tortoise Pipeline & Energy Fund, Inc. (TTP). The newly combined fund will have an investment strategy to invest in those companies the team believes are in a position to benefit from the energy evolution taking place across the globe, and be renamed The Tortoise Energy Evolution Infrastructure Fund.


“We believe that merging these two funds is in the best interest of stockholders as it provides the opportunity to participate in the global energy evolution that is underway,” said Brad Adams, CEO of Tortoise’s closed-end funds. “The strategy will give the portfolio exposure to what the investment team believes are the best growth and value opportunities in renewables and midstream energy companies globally. We anticipate the fund will deliver a strong total return profile with an attractive yield and lower overall volatility, which we think is a great combination.”

The fund will invest in global stocks that operate essential renewable and power infrastructure such as solar and wind generation as well as energy infrastructure like liquefied natural gas (LNG) export facilities. These sectors are transitioning the energy sector toward solar, wind, and natural gas and away from coal, accelerating the reduction of global CO2 emissions.

“Tortoise’s long history of investing in energy infrastructure, including renewables and power as well as midstream energy infrastructure, positions us well to invest in the energy evolution,“ said Rob Thummel, Senior Portfolio Manager. The future of energy is driven by the need to meet growing global energy demand while simultaneously reducing CO2 emissions. We think the combination of renewable energy sources with power infrastructure, which includes low-carbon natural gas used domestically and exported across the globe and utilities in transition that are transforming their businesses to create a greener electric grid, is the most pragmatic way to accomplish this goal.”

On completion of the proposed merger, the adviser intends to recommend that the Board of Directors increase the quarterly distribution to $0.1925 per share, an increase of 20.3%, beginning the fiscal 2nd quarter of 2021. In addition, the adviser has agreed to lower its management fee 0.10% to 1.00% of average managed assets. The reduced management fee, and other expected cost savings, are estimated to be approximately $400,000 annually, or $0.10 per pro forma share. In addition to the estimated costs savings, the proposed merger may provide improved liquidity, long-term distribution growth potential, as well as a modest leverage profile.

“This strategic shift is aligned with our ongoing effort to narrow the discounts at which these closed-end funds are trading,” said Adams. “Our research suggests that funds with exposure to renewables and power infrastructure have been trading closer to net asset value.” In addition, the Board is committed to the repurchase programs approved for certain closed-end funds and has authorized the extension of TTP’s current repurchase program through the first quarter of 2021.

The Board of Directors and Tortoise believe that the proposed merger is in the best interests of stockholders of each fund. Details regarding the factors considered by the Board of Directors in connection with the merger proposal will be contained in proxy materials that will be sent to stockholders of each fund. For more information, an FAQ document and video are available here.

Tortoise Capital Advisors, L.L.C. is the adviser to the funds.

For additional information on these funds, please visit cef.tortoiseecofin.com.

About Tortoise

Tortoise focuses on energy and power infrastructure and the transition to cleaner energy. Tortoise’s solid track record of energy value chain investment experience and research dates back more than 20 years. As one of the earliest investors in midstream energy, Tortoise believes it is well-positioned to be at the forefront of the global energy evolution that is underway. With a steady wins approach and a long-term perspective, Tortoise strives to make a positive impact on clients and communities. For additional information, please visit www.TortoiseEcofin.com.

Important Information About the Proposed Merger and Where to Find It:

More information on the proposed merger will be contained in the proxy materials expected to be filed in the coming weeks. TTP plans to file in the near future with the Securities and Exchange Commission (SEC) a joint proxy statement/prospectus on Form N-14 8C with respect to the merger, and each fund expects to mail a definitive joint proxy statement/prospectus to each of its stockholders that will contain information about the proposed merger following a review period with the SEC. Stockholders are urged to read the definitive joint proxy statement/prospectus carefully and in its entirety when available as it will contain important information about the proposed merger. When filed with the SEC, the joint proxy statement/prospectus and other documents filed by the funds will be available for free at the SEC’s Web site, http://www.sec.gov and on the funds’ website at cef.tortoiseecofin.com. Stockholders can also obtain copies of the definitive joint proxy statement/prospectus, when available, for free by dialing (866) 362-9331.

The funds, Tortoise Capital Advisors and certain of their respective directors, officers and affiliates may be deemed under the rules of the SEC to be participants in the solicitation of proxies from stockholders in connection with the proposed merger discussed herein. Information about the directors and officers of the funds may be found in their respective annual reports and proxy statements previously filed with the SEC.

Cautionary Statement Regarding Forward-Looking Statements

This press release contains certain statements that may include “forward-looking statements” within the meaning of Section 27A of the Securities Act of 1933 and Section 21E of the Securities Exchange Act of 1934. All statements, other than statements of historical fact, included herein are "forward-looking statements." Although the funds and Tortoise Capital Advisors believe that the expectations reflected in these forward-looking statements are reasonable, they do involve assumptions, risks and uncertainties, and these expectations may prove to be incorrect. Actual results could differ materially from those anticipated in these forward-looking statements as a result of a variety of factors, including those discussed in the fund’s reports that are filed with the Securities and Exchange Commission. You should not place undue reliance on these forward-looking statements, which speak only as of the date of this press release. Other than as required by law, the funds and Tortoise Capital Advisors do not assume a duty to update this forward-looking statement.

Safe Harbor Statement

This press release shall not constitute an offer to sell or a solicitation to buy, nor shall there be any sale of these securities in any state or jurisdiction in which such offer or solicitation or sale would be unlawful prior to registration or qualification under the laws of such state or jurisdiction.


Contacts

Maggie Zastrow
(913) 981-1020
This email address is being protected from spambots. You need JavaScript enabled to view it..

Accelerating the Path to Meeting New York’s Nation-Leading Energy Storage Target

ALBANY, N.Y.--(BUSINESS WIRE)--#NewYork--Key Capture Energy (KCE) today announced that its bulk energy storage project, KCE NY 1, is the first project of its kind in the state to pass a Quality Assurance Inspection, a requirement of the New York State Energy Research and Development Authority’s (NYSERDA) Bulk Energy Storage Incentive Program.


Continuing a history of “firsts” in New York State, KCE NY 1 has demonstrated that the system is in compliance with the standards in NYSERDA’s Battery Energy Storage Guidebook as well as with all applicable laws, regulations, and rules of the authority having jurisdiction. The 20-megawatt (MW) project, currently in operation in the Capital region, is the largest lithium-ion battery installation in the northeastern United States and was the first to receive an incentive award through NYSERDA since Governor Andrew M. Cuomo announced the state’s Market Acceleration Bridge Incentive Program in April 2019.

In addition to KCE NY 1, three of KCE’s other New York State-based projects have received an award from NYSERDA to date: KCE NY 2 (200 MW), KCE NY 6 (20 MW), and KCE NY 11 (20 MW), all of which are in various stages of development. All four projects will serve New York State’s electrical system while simultaneously advancing the states’ climate change initiatives by reducing greenhouse gas emissions.

Dan Fitzgerald, Co-founder and COO of Key Capture Energy said, “New York is setting the bar for state-led climate initiatives, and we are pleased to be a part of the state’s commitment to a clean energy economy. Not only do we own and operate New York’s largest energy storage project, we are currently constructing a project for Orange & Rockland and have 700 MW of projects under development in New York, all of which further the state’s commitment to a carbon-free electric system by 2040. We look forward to continuing to work collaboratively with NYSERDA to better understand the best way to implement energy storage in New York State in a way that is the most beneficial to residents.”

About Key Capture Energy

As more large-scale renewable energy projects come online and intermittent resources are added to the energy mix, it is becoming increasingly important to keep the electrical grid stable. Headquartered in Albany, New York, Key Capture Energy is meeting this need by identifying, developing, constructing and operating energy storage solutions to foster greater deployment of renewable energy, create a more stable electric grid, and provide value to all ratepayers.

Key Capture Energy operates the largest battery storage project in New York State. Additionally, the company is the largest owner of batteries in Texas, with 50 MW in operating projects, 204 MW in construction and over 1,500 MW of battery storage projects in its development pipeline, ranging from 5 to 200 MW. In the last year, Key Capture Energy has more than tripled the size of its team to advance the company’s growing portfolio of utility-scale battery storage projects.

Learn more at keycaptureenergy.com.


Contacts

Erin Szalkowski
Innovant Public Relations
This email address is being protected from spambots. You need JavaScript enabled to view it.
713.412.6436

WALL, N.J.--(BUSINESS WIRE)--The board of directors of New Jersey Resources (NYSE: NJR) unanimously declared a quarterly dividend on its common stock of $.3325 per share. The dividend will be payable on January 4, 2021 to shareowners of record as of December 16, 2020.


NJR has paid quarterly dividends continuously since its inception in 1952, and is committed to providing value to its shareowners with a competitive return.

About New Jersey Resources:

New Jersey Resources (NYSE: NJR) is a Fortune 1000 company that, through its subsidiaries, provides safe and reliable natural gas and clean energy services, including transportation, distribution, asset management and home services. NJR is composed of five primary businesses:

  • New Jersey Natural Gas, NJR’s principal subsidiary, operates and maintains over 7,500 miles of natural gas transportation and distribution infrastructure to serve over half a million customers in New Jersey’s Monmouth, Ocean, Morris, Middlesex and Burlington counties.
  • NJR Clean Energy Ventures invests in, owns and operates solar projects with a total capacity of more than 350 megawatts, providing residential and commercial customers with low-carbon solutions.
  • NJR Energy Services manages a diversified portfolio of natural gas transportation and storage assets and provides physical natural gas services and customized energy solutions to its customers across North America.
  • NJR Midstream serves customers from local distributors and producers to electric generators and wholesale marketers through its ownership of Leaf River Energy Center and the Adelphia Gateway Pipeline Project, as well as our 50 percent equity ownership in the Steckman Ridge natural gas storage facility, and our 20 percent equity interest in the PennEast Pipeline Project.
  • NJR Home Services provides service contracts as well as heating, central air conditioning, water heaters, standby generators, solar and other indoor and outdoor comfort products to residential homes throughout New Jersey.

NJR and its more than 1,100 employees are committed to helping customers save energy and money by promoting conservation and encouraging efficiency through Conserve to Preserve® and initiatives such as The SAVEGREEN Project® and The Sunlight Advantage®. For more information about NJR: www.njresources.com.

Follow us on Twitter @NJNaturalGas.
“Like” us on facebook.com/NewJerseyNaturalGas.
Download our free NJR investor relations app for iPad, iPhone and Android.

NJR-D


Contacts

Media:
Michael Kinney
732-938-1031
This email address is being protected from spambots. You need JavaScript enabled to view it.

Investor:
Dennis Puma
732-938-1229
This email address is being protected from spambots. You need JavaScript enabled to view it.

SCOTTSDALE, Ariz.--(BUSINESS WIRE)--Arevon Energy Management (AEM) is pleased to announce that Tiago Sabino Dias will be leading the organization as President and CEO. AEM is a newly formed organization focused on innovation of power products through the integration of renewable energy, storage solutions, distributed generation, and power marketing services. AEM has an exclusive partnership with Capital Dynamics’ Clean Energy and Infrastructure (CEI) platform supporting the origination of renewable based structured energy contracts in the US.


Tiago has been instrumental in launching the AEM concept off the ground this year. He also played an integral role in the investment of over 1.5 GW of solar projects and 1,000 MWhs of battery storage projects in the US by the CEI platform.

“AEM is a key partner to CEI, supporting the origination and design of complex renewable energy products. The AEM team has already proven their capabilities, and I’m confident on the leadership of Tiago,” said Benoit Allehaut, Managing Director with Capital Dynamics.

Tiago brings more than a decade of experience in multiple renewable technologies and markets, both domestic and abroad. Most recently, he has been leading CEI’s efforts in the Midwest in collaboration with Tenaska Power.

Tiago received a Bachelor of Science in Industrial and Civil Engineering at Universidade Federal de Santa Catarina. He started his professional career as an engineer in hydropower project design. Tiago then joined ContourGlobal where he was a member of the Development and Sustainability committees and later named Vice President, Renewables. Tiago joined Capital Dynamics in 2018 as Vice President before being promoted in 2019 to Executive Vice President, Development.

AEM is thrilled to see the direction the renewable market is going and believe that this team is well positioned to lead the charge.

About Arevon Energy Management

Arevon Energy Management is an independent company with an exclusive partnership with the Capital Dynamics’ Clean Energy Infrastructure platform. Our team of experts work directly with utilities, municipalities, cooperatives, and large corporations to jointly develop clean energy strategies that exceed their economic and sustainability objectives. We are a one-stop shop for holistic solutions you can count on for the coming decades.


Contacts

Mercom Communications
Wendy Prabhu
1-512-215-4452
This email address is being protected from spambots. You need JavaScript enabled to view it.

Superior confirms 2020 Adjusted EBITDA and Total Debt to Adjusted EBITDA leverage guidance and remains focused on executing its acquisition growth strategy


TORONTO--(BUSINESS WIRE)--Superior Plus Corp. (“Superior”) (TSX:SPB) announced today the financial and operating results for the third quarter ended September 30, 2020. Unless otherwise expressed, all financial figures are expressed in Canadian dollars.

During the third quarter, we closed the preferred share investment from Brookfield and used the proceeds to reduce our debt and execute two retail propane acquisitions in our current footprint in the U.S. Northeast,” said Luc Desjardins, President and Chief Executive Officer. “Subsequent to quarter end, we made two more retail propane acquisitions in California and the Eastern U.S., further demonstrating our robust pipeline of acquisition opportunities and our ability to execute on acquisitions, even in the current environment.”

Superior delivered improved third quarter results in our U.S. and Canadian propane distribution businesses driven primarily by lower operating costs,” continued Mr. Desjardins. “Our Specialty Chemicals business results were lower due to continued weakness in the caustic soda and hydrochloric acid markets. We are maintaining our Adjusted EBITDA guidance as our businesses continue to demonstrate resiliency, and we remain focused on creating sustainable earnings growth for the future. Our residential and industrial sales volumes in Canada are relatively consistent with prior year, and we have seen a similar trend in our residential and commercial propane sales volumes in the U.S.”

I am proud of the way our employees have quickly adapted to the situation and continue to provide our customers with high-quality services and products in a safe manner,” added Mr. Desjardins.

Business and Financial Highlights

  • Superior achieved third quarter Adjusted EBITDA of $39.1 million, a $9.1 million or 19% decrease over the prior year quarter primarily due to lower EBITDA from operations in Specialty Chemicals and higher corporate costs, partially offset by higher EBITDA from operations in U.S. propane distribution (“U.S. Propane”) and Canadian propane distribution (“Canadian Propane”), and a realized gain on foreign currency hedging contracts compared to a realized loss in the prior year quarter.
  • EBITDA from Operations during the third quarter was $45.9 million, a $7.7 million or a 14% decrease from the prior year quarter primarily due to lower results from Specialty Chemicals, partially offset by higher results from U.S. Propane and Canadian Propane. Please see below for further discussion on the third quarter EBITDA from Operations by business.
  • AOCF before transaction and other costs during the third quarter was $12.5 million, a $6.7 million or 35% decrease compared to the prior year quarter primarily due to lower Adjusted EBITDA and higher cash tax expense, partially offset by lower interest expense. AOCF before transaction and other costs per share was $0.06, $0.05 lower than the prior year quarter for the same reasons and an increase in weighted average shares outstanding. Weighted average shares outstanding increased primarily due to the impact of including the preferred shares on an as-converted basis and shares issued through the Dividend Reinvestment and Optional Share Repurchase Plan.
  • Superior had net losses of $21.4 million in the third quarter, a $37.9 million increase compared to the prior year quarter primarily due to an unrealized gain on derivative financial instruments and lower selling, distribution and administrative costs (“SD&A”) in the current quarter compared to the prior year quarter, partially offset by lower gross profit.
  • Net cash flows from operating activities in the third quarter were $17.2 million, a $22.0 million decrease from the prior year quarter primarily due to reduced cashflow from changes in non-cash operating working capital compared to the prior year quarter and to a lesser extent the impact of lower net earnings net of non-cash adjustments. Changes in non-cash operating working capital are impacted by timing of sales, customer receipts and purchases of goods and services.
  • U.S. Propane EBITDA from operations for the third quarter was ($4.0) million, an increase of $3.0 million or 43% compared to the prior year quarter primarily due to lower operating expenses, the incremental contribution from the tuck-in acquisitions completed in the past 12 months and higher average unit margins, partially offset by lower sales volumes. Total sales volumes decreased 3 million litres or 2% primarily due to the impact of COVID-19 and lower commercial distillate sales volumes, partially offset by incremental volumes from acquisitions. Average sales margin for the third quarter was 36.4 cents per litre compared to 34.7 cents per litre in the prior year quarter primarily due to sales and marketing initiatives, customer mix and the impact of the weaker Canadian dollar on the translation of U.S. denominated gross profit. Operating expenses were $64.5 million, a decrease of $2.2 million or 3% compared to the prior year quarter due to cost reductions, workforce optimization initiatives and realized synergies from acquisitions, partially offset by the impact of the weaker Canadian dollar on the translation of U.S. denominated expenses.
  • Canadian Propane achieved EBITDA from operations for the third quarter of $21.6 million, an increase of $0.7 million or 3% compared to the prior year quarter primarily due to lower operating expenses, partially offset by lower average margins and lower sales volumes. Operating costs were $39.1 million, a decrease of $15.9 million or 29% primarily due to lower employee-related expenses, including the impact of the Canadian Emergency Wage Subsidy (“CEWS”), and cost-saving initiatives. In the third quarter, Canadian Propane recorded a $13.7 million benefit related to the CEWS. Average propane sales margins in the third quarter were 16.9 cents per litre compared to 18.4 cents per litre in the prior year quarter due to weaker wholesale market fundamentals compared to the prior year quarter. Total sales volumes were 341 million litres, a decrease 52 million litres or 13%, primarily due to reduced oilfield drilling activity in Western Canada and the impact of COVID-19.
  • Specialty Chemicals EBITDA from operations for the third quarter was $28.3 million, a decrease of $11.4 million or 29% compared to the prior year quarter primarily due to lower gross profit, partially offset by lower operating expenses. Gross profit decreased $14.1 million due to lower chlor-alkali sales prices and volumes and lower sodium chlorate sales volumes, partially offset by higher sodium chlorate sales prices and modestly lower electricity mill rates. Chlor-alkali sales prices and volumes were lower primarily due to weaker hydrochloric and caustic soda market fundamentals. Sodium chlorate sale volumes were lower primarily due to weaker printing paper demand and the impact of customer mill outages. Operating expenses were $27.9 million, a $3.2 million decrease primarily due to lower employee-related expenses, including the impact of the CEWS. In the third quarter, Specialty Chemicals recorded a $3.6 million benefit related to the CEWS, which positively impacted cost of goods sold and operating expenses.
  • Superior’s corporate operating and administrative costs for the third quarter were $7.1 million, an increase of $3.2 million primarily due to the higher long-term incentive plan costs related to the appreciation in Superior’s share price. In the third quarter, Superior recorded a $0.3 million benefit related to the CEWS, which impacted the corporate operating expenses.

Financial Overview


Three Months Ended


Nine Months Ended


September 30


September 30

(millions of dollars, except per share amounts)


2020


2019


2020


2019

Revenue


399.4


450.1


1,690.4


2,031.9

Gross Profit


166.3


195.0


785.3


847.0

Net earnings (loss)


(21.4)


(59.3)


(2.5)


68.0

Net earnings (loss) for the period attributable to common shareholders


(26.8)


(59.3)


(7.9)


68.0

Net earnings for the period attributable to non-controlling interest


5.4


5.4


Net earnings (loss) per share (1)

$

(0.15)


$

(0.34)


$

(0.05)


$

0.39

EBITDA from operations (2)


45.9


53.6


346.7


374.3

Adjusted EBITDA (2)


39.1


48.2


326.1


347.8

Net cash flows from operating activities


17.2


39.2


289.6


314.9

Net cash flows from operating activities per share (1)

$

0.09


$

0.22


$

1.57


$

1.80

AOCF before transaction and other costs (2)(3)


12.5


19.2


241.2


261.2

AOCF before transaction and other costs per share (1)(2)(3)

$

0.06


$

0.11


$

1.31


$

1.49

AOCF (2)


6.3


13.1


224.6


236.9

AOCF per share (1)(2)

$

0.03


$

0.07


$

1.22


$

1.35

Cash dividends declared


31.8


31.4


94.8


94.4

Cash dividends declared per share

$

0.18


$

0.18


$

0.54


$

0.54

(1)

The weighted average number of shares outstanding for the three and nine months ended September 30, 2020 was 201.8 million and 184.2 million, respectively (three and nine months ended September 30, 2019 was 174.9 million). The weighted average number of shares assumes the conversion of the preferred shares into common shares. There were no other dilutive instruments with respect to AOCF per share and AOCF before transaction and other costs per share for the three and nine months ended September 30, 2020 and 2019.

(2)

EBITDA from operations, Adjusted EBITDA and AOCF are non-GAAP measures. Refer to “Non-GAAP Financial Measures” for further details and the Third Quarter Management Discussion & Analysis (“MD&A”) for reconciliations.

(3)

Transaction and other costs for the three months ended September 30, 2020 and 2019 are related to acquisition activity and the integration of acquisitions. See “Transaction and Other Costs” for further details.

Segmented Information


Three Months Ended

Nine Months Ended


September 30

September 30


(millions of dollars)


2020


2019


2020


2019


EBITDA from operations(1)


Canadian Propane Distribution


21.6


20.9


129.4


125.2


U.S. Propane Distribution


(4.0)


(7.0)


126.5


131.2


Specialty Chemicals


28.3


39.7


90.8


117.9


45.9


53.6


346.7


374.3

(1)

See “Non-GAAP Financial Measures”.

Brookfield Investment

On July 13, 2020, Superior issued 260,000 perpetual exchangeable preferred shares (the “Preferred Shares”) in its wholly owned subsidiary Superior Plus US Holdings Inc. for gross proceeds of US$260 million (the “Brookfield Investment”) to an affiliate of Brookfield Asset Management Inc. (“Brookfield”), on a private placement basis. The Preferred Shares entitle the holders to a monthly dividend at a current rate of 7.25% per annum through to the end of Superior’s second fiscal quarter in 2027, and may be exchanged, at Brookfield’s option, into common shares of Superior at an exchange price of US $8.67 per common share (or approximately CDN $11.63 (1) per common share). On an as-exchanged basis, the Brookfield Investment currently represents approximately 15% of the pro forma fully diluted outstanding common shares.

Superior used the proceeds of the Brookfield Investment to reduce the credit facility debt.

Business Development and Acquisition Update

On August 3, 2020, Superior acquired the assets of a retail propane distribution company, operating under the tradename, Champagne’s Energy (“Champagne”), for total consideration of approximately US$27.4 million (CDN $36.7 million). The purchase price was paid primarily with cash from Superior’s credit facility. Champagne is a retail distributor delivering approximately 41.0 million litres of propane and distillates annually to residential and commercial customers in Maine.

On September 1, 2020, Superior acquired the assets of a retail propane and heating oil distribution company, operating under the tradename, Rymes Propane and Oil (“Rymes”), for total consideration of approximately US$151.6 million (CDN $198.0 million). The purchase price was paid primarily with cash from Superior’s credit facility. Rymes is a retail distributor delivering approximately 204.0 million litres of propane and distillates annually to residential and commercial customers in New Hampshire, Maine, Massachusetts and Vermont.

On October 15, 2020, Superior acquired all of the equity interests of a Southern California propane distribution company, operating under the tradename, Central Coast Propane (“Central Coast”), for total consideration of approximately US$12.9 million (CDN $16.8 million). The purchase price was paid primarily with cash from Superior’s credit facility. Central Coast is a retail distributor delivering approximately 5.0 million litres of propane to approximately 2,800 residential and commercial customers in Southern California.

On October 27, 2020, Superior acquired the assets of a retail propane distribution company, operating under the tradename, Petro Home Services (“Petro”), for total consideration of approximately US$6.1 million (CDN $8.1 million). The purchase price was paid primarily with cash from Superior’s credit facility. Petro is a retail distributor delivering approximately 11.0 million litres of propane annually to 11,000 customers in North Carolina, South Carolina, Georgia and Tennessee.

Adjusted EBITDA Guidance and Leverage Update

Superior’s outlook for 2020 remains unchanged, with expected Adjusted EBITDA in the previously disclosed guidance range of $475 million to $515 million. Average weather, as measured by degree days for the remainder of 2020 is anticipated to be consistent with the five-year average for Canada and the U.S.

Superior remains focused on managing both its debt and its leverage ratio. Superior’s Total Debt to Adjusted EBITDA leverage ratio for the trailing twelve months was 3.4x as at September 30, 2020, compared to 3.7x at June 30, 2020 and December 31, 2019. The decrease in the leverage ratio from June 30, 2020 and December 31, 2019 was primarily due to lower debt, partially offset by higher Pro Forma Adjusted EBITDA related to acquisitions made during the trailing-twelve months.

Superior’s Total Debt as at September 30, 2020, was $1,849.0 million, a decrease of $32.7 million from June 30, 2020 and $107.1 million from December 31, 2019. The decrease from June 30, 2020 was primarily due to the proceeds from the Brookfield Investment, which were used to reduce the credit facility, partially offset by the acquisition of Rymes and Champagne, which were funded primarily using the credit facility.

Superior is well within its covenants under its credit facility agreement and unsecured note indentures. Superior’s Senior debt to Credit Facility EBITDA ratio was 3.4x as at September 30, 2020, and cannot exceed 5.0x. Superior also had available liquidity of $381.0 million available under the credit facility as at September 30, 2020.

Superior expects Total Debt to Adjusted EBITDA at December 31, 2020 to be in the range of 3.0x to 3.5x, consistent with the previously disclosed guidance range and consistent with Superior’s long-term range.

MD&A and Financial Statements

Superior’s MD&A, the unaudited Condensed Interim Consolidated Financial Statements and the Notes to the Condensed Interim Consolidated Financial Statements for the three and nine months ended September 30, 2020 provide a detailed explanation of Superior’s operating results. These documents are available online at Superior’s website at www.superiorplus.com under the Investor Relations section and on SEDAR under Superior’s profile at www.sedar.com.

2020 Third Quarter Conference Call

Superior will be conducting a conference call and webcast for investors, analysts, brokers and media representatives to discuss the Third Quarter Results at 10:30 a.m. EST on Thursday, November 12, 2020. To participate in the call, dial: 1-844-389-8661. Internet users can listen to the call live, or as an archived call on Superior’s website at www.superiorplus.com under the Events section.

Non-GAAP Financial Measures

Throughout the third quarter earnings release, Superior has used the following terms that are not defined by International Financial Reporting Standards (“Non-GAAP Financial Measures”), but are used by management to evaluate the performance of Superior and its business: AOCF before and after transaction and other costs, earnings before interest, taxes, depreciation and amortization (“EBITDA”) from operations, Adjusted EBITDA, operating expenses, Total Debt to Adjusted EBITDA leverage ratio and Pro Forma Adjusted EBITDA. These measures may also be used by investors, financial institutions and credit rating agencies to assess Superior’s performance and ability to service debt. Non-GAAP financial measures do not have standardized meanings prescribed by GAAP and are therefore unlikely to be comparable to similar measures presented by other companies. Securities regulations require that Non-GAAP financial measures are clearly defined, qualified and reconciled to their most comparable GAAP financial measures. Except as otherwise indicated, these Non-GAAP financial measures are calculated and disclosed on a consistent basis from period to period. Specific items may only be relevant in certain periods. See “Non-GAAP Financial Measures” in the MD&A for a discussion of Non-GAAP financial measures and certain reconciliations to GAAP financial measures.

The intent of Non-GAAP financial measures is to provide additional useful information to investors and analysts, and the measures do not have any standardized meaning under IFRS. The measures should not, therefore, be considered in isolation or used in substitute for measures of performance prepared in accordance with IFRS. Other issuers may calculate Non-GAAP financial measures differently. Investors should be cautioned that AOCF, EBITDA from operations, Adjusted EBITDA and Credit Facility EBITDA should not be construed as alternatives to net earnings, cash flow from operating activities or other measures of financial results determined in accordance with GAAP as an indicator of Superior’s performance. Non-GAAP financial measures are identified and defined as follows:

Adjusted Operating Cash Flow and Adjusted Operating Cash Flow per Share

AOCF is equal to cash flow from operating activities as defined by IFRS, adjusted for changes in non-cash working capital, other expenses, non-cash interest expense, current income taxes and finance costs. Superior may deduct or include additional items in its calculation of AOCF; these items would generally, but not necessarily, be infrequent in nature and could distort the analysis of trends in business performance. Excluding these items does not imply they are non-recurring. AOCF and AOCF per share are presented before and after transaction and other costs.

AOCF per share before transaction and other costs is calculated by dividing AOCF before transaction and other costs by the weighted average number of shares outstanding. AOCF per share is calculated by dividing AOCF by the weighted average number of shares outstanding.

AOCF is a performance measure used by management and investors to evaluate Superior’s ongoing performance of its businesses and ability to generate cash flow. AOCF represents cash flow generated by Superior that is available for, but not necessarily limited to, changes in working capital requirements, investing activities and financing activities of Superior.

The seasonality of Superior’s individual quarterly results must be assessed in the context of annualized AOCF. Adjustments recorded by Superior as part of its calculation of AOCF include, but are not limited to, the impact of the seasonality of Superior’s businesses, principally the Energy Distribution segment, by adjusting for non-cash working capital items, thereby eliminating the impact of the timing between the recognition and collection/payment of Superior’s revenues and expenses, which can differ significantly from quarter to quarter. AOCF is reconciled to cash flow from operating activities. Please refer to the Financial Overview section of the MD&A for the reconciliation.

Adjusted EBITDA

Adjusted EBITDA represents earnings before interest, taxes, depreciation, amortization, losses (gains) on disposal of assets, finance expense, restructuring costs, transaction and other costs, and unrealized gains (losses) on derivative financial instruments. Adjusted EBITDA is used by Superior and investors to assess its consolidated results and ability to service debt. Adjusted EBITDA is reconciled to net earnings before income taxes.

Adjusted EBITDA is a significant performance measure used by management and investors to evaluate Superior’s ongoing performance of its businesses. Adjusted EBITDA is also used as one component in determining short-term incentive compensation for certain management employees.

The seasonality of Superior’s individual quarterly results must be assessed in the context of annualized Adjusted EBITDA.

EBITDA from operations

EBITDA from operations is defined as Adjusted EBITDA excluding costs that are not considered representative of Superior’s underlying core operating performance, including gains and losses on foreign currency hedging contracts, corporate costs and transaction and other costs. Management uses EBITDA from operations to set targets for Superior (including annual guidance and variable compensation targets). EBITDA from operations is reconciled to net earnings before income taxes. Please refer to the Results of Operating Segments in the MD&A for the reconciliations.

Operating Expenses

Operating expenses include wages and benefits for employees, drivers, service and administrative labour, fleet maintenance and operating costs, freight and distribution expenses excluded from cost of sales, along with the costs associated with owning and maintaining land, buildings and equipment, such as rent, repairs and maintenance, environmental, utilities, insurance and property tax costs. Operating expenses exclude gains or losses on disposal of assets, depreciation and amortization and non-recurring expenses, such as transaction, restructuring and integration costs.

Operating expenses are defined as SD&A expenses adjusted for amortization and depreciation, gains or losses on disposal of assets and transaction, restructuring and other costs.

Total Debt to Adjusted EBITDA Leverage Ratio and Pro Forma Adjusted EBITDA

Adjusted EBITDA for the Total Debt to Adjusted EBITDA Leverage Ratio is defined as Adjusted EBITDA calculated on a 12-month trailing basis giving pro forma effect to acquisitions and dispositions adjusted to the first day of the calculation period (“Pro Forma Adjusted EBITDA”). Pro Forma Adjusted EBITDA is used by Superior to calculate its Total Debt to Adjusted EBITDA Leverage Ratio.

To calculate the Total Debt to Adjusted EBITDA Leverage Ratio divide the sum of borrowings before deferred financing fees and lease liabilities by Pro Forma Adjusted EBITDA. Total Debt to Adjusted EBITDA Leverage Ratio is used by Superior and investors to assess its ability to service debt.

Forward Looking Information

Certain information included herein is forward-looking information within the meaning of applicable Canadian securities laws. Forward-looking information may include statements regarding the objectives, business strategies to achieve those objectives, expected financial results (including those in the area of risk management), economic or market conditions, and the outlook of or involving Superior, Superior LP and its businesses.


Contacts

Beth Summers Executive Vice President and Chief Financial Officer
Phone: (416) 340-6015

Rob Dorran Vice President, Investor Relations and Treasurer
Phone: (416) 340-6003
Toll Free: 1-866-490-PLUS (7587)


Read full story here

HOUSTON--(BUSINESS WIRE)--ConocoPhillips (NYSE: COP) today announced a new gas condensate discovery in production license 1009 located 22 miles northwest of the Heidrun Field and 150 miles from the coast of Norway in the Norwegian Sea. ConocoPhillips Skandinavia AS is operator of the license with 65 percent working interest. PGNiG Upstream Norway AS holds 35 percent working interest.


The discovery well, 6507/4-1 (Warka), was drilled in 1,312 feet of water to a total depth of 16,355 feet. Preliminary estimates place the size of the discovery between 50 and 190 million barrels of recoverable oil equivalent. Further appraisal will be conducted to determine potential flow rates, the reservoir’s ultimate resource recovery and plans for development.

“We have built a strong position on the Norwegian shelf since the discovery of the Ekofisk Field in 1969 and we are a very active industry operator and partner across the North Sea and the Norwegian Sea,” said Matt Fox, executive vice president and chief operating officer. “This discovery, potentially the largest on the Norwegian Continental shelf this year, bolsters our position in the Norwegian Sea and the Heidrun area. The Warka discovery and potential future opportunities represent very low cost of supply resource additions that can extend our multi-decade success on the Norwegian Continental Shelf.”

The Warka well was drilled by the Leiv Eiriksson drilling rig, which upon completion of the well will proceed to drill exploration well 6507/5-10 S (Slagugle) in production license 891, which is located 14 miles north-northeast of the Heidrun Field. ConocoPhillips Skandinavia AS is operator of production license 891 with 80 percent working interest and Pandion Energy AS holds 20 percent working interest.

--- # # # ---

About ConocoPhillips

Headquartered in Houston, Texas, ConocoPhillips had operations and activities in 15 countries, $63 billion of total assets, and approximately 9,800 employees at Sept. 30, 2020. Production excluding Libya averaged 1,108 MBOED for the nine months ended Sept. 30, 2020, and proved reserves were 5.3 BBOE as of Dec. 31, 2019. For more information, go to www.conocophillips.com.

CAUTIONARY STATEMENT FOR THE PURPOSES OF THE "SAFE HARBOR" PROVISIONS OF THE PRIVATE SECURITIES LITIGATION REFORM ACT OF 1995

This news release contains forward-looking statements as defined under the federal securities laws. Forward-looking statements relate to future events and anticipated results of operations, business strategies, and other aspects of our operations or operating results. Words and phrases such as "anticipate," "estimate," "believe," “budget,” "continue," "could," "intend," "may," "plan," "potential," "predict," “seek,” "should," "will," “would,” "expect," "objective," "projection," "forecast," "goal," "guidance," "outlook," "effort," "target" and other similar words can be used to identify forward-looking statements. However, the absence of these words does not mean that the statements are not forward-looking. Where, in any forward-looking statement, the company expresses an expectation or belief as to future results, such expectation or belief is expressed in good faith and believed to be reasonable at the time such forward-looking statement is made. However, these statements are not guarantees of future performance and involve certain risks, uncertainties and other factors beyond our control. Therefore, actual outcomes and results may differ materially from what is expressed or forecast in the forward-looking statements. Factors that could cause actual results or events to differ materially from what is presented include the impact of public health crises, such as pandemics (including coronavirus (COVID-19)) and epidemics and any related company or government policies and actions to protect the health and safety of individuals or government policies or actions to maintain the functioning of national or global economies and markets; global and regional changes in the demand, supply, prices, differentials or other market conditions affecting oil and gas and the resulting company actions in response to such changes, including changes resulting from the imposition or lifting of crude oil production quotas or other actions that might be imposed by the Organization of Petroleum Exporting Countries and other producing countries; changes in commodity prices; changes in expected levels of oil and gas reserves or production; operating hazards, drilling risks, unsuccessful exploratory activities; unexpected cost increases or technical difficulties in constructing, maintaining, or modifying company facilities; legislative and regulatory initiatives addressing global climate change or other environmental concerns; investment in and development of competing or alternative energy sources; disruptions or interruptions impacting the transportation for our oil and gas production; international monetary conditions and exchange rate fluctuations; changes in international trade relationships, including the imposition of trade restrictions or tariffs on any materials or products (such as aluminum and steel) used in the operation of our business; our ability to collect payments when due under our settlement agreement with PDVSA; our ability to collect payments from the government of Venezuela as ordered by the ICSID; our ability to liquidate the common stock issued to us by Cenovus Energy Inc. at prices we deem acceptable, or at all; our ability to complete our announced dispositions or acquisitions on the timeline currently anticipated, if at all; the possibility that regulatory approvals for our announced dispositions or acquisitions will not be received on a timely basis, if at all, or that such approvals may require modification to the terms of our announced dispositions, acquisitions or our remaining business; business disruptions during or following our announced dispositions or acquisitions, including the diversion of management time and attention; the ability to deploy net proceeds from our announced dispositions in the manner and timeframe we currently anticipate, if at all; potential liability for remedial actions under existing or future environmental regulations; potential liability resulting from pending or future litigation; the impact of competition and consolidation in the oil and gas industry; limited access to capital or significantly higher cost of capital related to illiquidity or uncertainty in the domestic or international financial markets; general domestic and international economic and political conditions; the ability to successfully receive the requisite approvals and consummate the proposed acquisition of Concho resources; the ability to successfully integrate the operations of Concho Resources with our operations and achieve the anticipated benefits from the transaction; changes in fiscal regime or tax, environmental and other laws applicable to our business; and disruptions resulting from extraordinary weather events, civil unrest, war, terrorism or a cyber attack; and other economic, business, competitive and/or regulatory factors affecting our business generally as set forth in our filings with the Securities and Exchange Commission. Unless legally required, ConocoPhillips expressly disclaims any obligation to update any forward-looking statements, whether as a result of new information, future events or otherwise.


Contacts

John C. Roper (media)
281-293-1451
This email address is being protected from spambots. You need JavaScript enabled to view it.

Investor Relations
281-293-5000
This email address is being protected from spambots. You need JavaScript enabled to view it.

LONDON--(BUSINESS WIRE)--#Globallandfillgasmarket--The global landfill gas market is poised to grow by $ 1.68 bn during 2020-2024, progressing at a CAGR of about 4% during the forecast period. Technavio suggests three forecast scenarios (optimistic, probable, and pessimistic) considering the impact of COVID-19. Download Free Sample Report on COVID-19 Recovery Analysis


The report on the landfill gas market provides a holistic update, market size and forecast, trends, growth drivers, and challenges, as well as vendor analysis.

The report offers an up-to-date analysis regarding the current global market scenario and the overall market environment. The market is driven by the growing demand for energy worldwide.

The landfill gas market analysis includes technology segment, subjects segment, price range segment, and geography landscape. This study identifies the emergence of smart landfills as one of the prime reasons driving the landfill gas market growth during the next few years.

This report presents a detailed picture of the market by the way of study, synthesis, and summation of data from multiple sources by an analysis of key parameters.

The landfill gas market covers the following areas:

Landfill Gas Market Sizing
Landfill Gas Market Forecast
Landfill Gas Market Analysis

Companies Mentioned

  • Advanced Disposal Services Inc.
  • Ameresco Inc.
  • Aria Energy
  • Biffa Group Ltd.
  • Covanta Holding Corp.
  • Energy Developments Pty. Ltd.
  • General Electric Co.
  • Infinis Energy Plc
  • VEOLIA ENVIRONNEMENT SA
  • Waste Management Inc.

Key Topics Covered:

Executive Summary

  • Market Overview

Market Landscape

  • Market ecosystem
  • Value chain analysis

Market Sizing

  • Market definition
  • Market segment analysis
  • Market size 2019
  • Market outlook: Forecast for 2019 - 2024

Five Forces Analysis

  • Five Forces Summary
  • Bargaining power of buyers
  • Bargaining power of suppliers
  • Threat of new entrants
  • Threat of substitutes
  • Threat of rivalry
  • Market condition

Market Segmentation by Technology

  • Market segments
  • Comparison by Technology placement
  • CE - Market size and forecast 2019-2024
  • Turbines - Market size and forecast 2019-2024
  • Others - Market size and forecast 2019-2024
  • Market opportunity by Technology

Customer landscape

  • Overview

Geographic Landscape

  • Geographic segmentation
  • Geographic comparison
  • North America - Market size and forecast 2019-2024
  • Europe - Market size and forecast 2019-2024
  • APAC - Market size and forecast 2019-2024
  • South America - Market size and forecast 2019-2024
  • MEA - Market size and forecast 2019-2024
  • Key leading countries
  • Market opportunity by geography

Drivers, Challenges, and Trends

  • Market drivers
  • Volume driver - Demand led growth
  • Volume driver - Supply led growth
  • Volume driver - External factors
  • Volume driver - Demand shift in adjacent markets
  • Price driver - Inflation
  • Price driver - Shift from lower to higher-priced units
  • Market challenges
  • Market trends

Vendor Landscape

  • Overview
  • Vendor landscape
  • Landscape disruption

Vendor Analysis

  • Vendors covered
  • Market positioning of vendors
  • Advanced Disposal Services Inc.
  • Ameresco Inc.
  • Aria Energy
  • Biffa Group Ltd.
  • Covanta Holding Corp.
  • Energy Developments Pty. Ltd.
  • General Electric Co.
  • Infinis Energy Plc
  • VEOLIA ENVIRONNEMENT SA
  • Waste Management Inc.

Appendix

  • Scope of the report
  • Currency conversion rates for US$
  • Research methodology
  • List of abbreviations


About Us

Technavio is a leading global technology research and advisory company. Their research and analysis focuses on emerging market trends and provides actionable insights to help businesses identify market opportunities and develop effective strategies to optimize their market positions. With over 500 specialized analysts, Technavio’s report library consists of more than 17,000 reports and counting, covering 800 technologies, spanning across 50 countries. Their client base consists of enterprises of all sizes, including more than 100 Fortune 500 companies. This growing client base relies on Technavio’s comprehensive coverage, extensive research, and actionable market insights to identify opportunities in existing and potential markets and assess their competitive positions within changing market scenarios.


Contacts

Technavio Research
Jesse Maida
Media & Marketing Executive
US: +1 844 364 1100
UK: +44 203 893 3200
Email: This email address is being protected from spambots. You need JavaScript enabled to view it.
Website: www.technavio.com/

DUBLIN--(BUSINESS WIRE)--The "Oil Refining Industry in Russia 2020" report has been added to ResearchAndMarkets.com's offering.


The downstream energy sector report, "Oil Refining Industry in Russia" is a complete source of information on Russia crude oil refining industry.

It provides refinery level information relating to existing and planned (new build) refineries such as insights and forecasts of refinery capacities, refined petroleum products production and consumption, refinery complexity factor and comparison against peer group countries in the respective region. The report also covers complete details of major players operating in the refining sector in Russia and in depth analysis of the latest industry news and deals.

Report Scope

  • Outlook of Country Oil Refining Industry and refined petroleum products beyond 2020
  • Forecasts of refined products production and consumption along with major refining companies and operators.
  • Historic and Forecasted Refining capacity and secondary units capacities beyond 2020
  • Key Opportunities and Restraints in country Refinery market
  • Benchmark with five peer group countries on Nelson Complexity Factor.
  • Market structure of Country Refining Industry, companies, capacities and market share.
  • Information on planned refineries such as planned capacity, equity structure, Operator Company, expected commissioning date and project cost.
  • Refined petroleum products production and demand beyond 2020.
  • Refinery level information such as refinery name, commissioned year, primary and secondary units installed capacities along with future capacity expansions, refinery complexity factor, ownership and operator details.
  • Company profiles of major refining companies including SWOT Analysis.
  • Latest mergers, acquisitions, contract announcements and all related industry news and deals analysis.

Key Topics Covered:

1 Table of Contents

1.1 List of Figures

1.2 List of Tables

2 Introduction to Russia Refining Markets

2.1 What is This Report About?

2.2 Market Definition

3 Refining Industry in Russia

3.1 Russia Refining Market Snapshot, 2019

3.2 Role of Russia in Global and Regional Refining Markets

3.2.1 Contribution to Europe and Global Refining Capacity, 2019

3.2.2 Russia Average Nelson Complexity Factor (NCF) vs. Europe and Global, 2019

4 Russia Refining Market- Drivers and Restraints

4.1 Russia Refining Industry: Trends and Issues

4.1.1 Russia Refining Industry: Major Trends

4.2 Major Restrains of Investing in Russia Refining Sector

5 Russia Oil Products Demand and Supply Forecast to 2025

5.1 Russia Refined Products Demand Forecast to 2025

5.1.1 Russia Gasoline Demand Forecast to 2025

5.1.2 Russia Diesel Oil Demand Forecast to 2025

5.1.3 Russia Kerosene Demand Forecast to 2025

5.1.4 Russia LPG Demand Forecast to 2025

5.2 Russia Refined Products Production Forecast to 2025

5.2.1 Russia Gasoline Production Forecast to 2025

5.2.2 Russia Diesel Oil Production Forecast to 2025

5.2.3 Russia Kerosene Production Forecast to 2025

5.2.4 Russia LPG Production Forecast to 2025

6 Russia Refinery Capacities Forecast to 2025

6.1 Location, Operator, Ownership, Startup Details of Operational Refineries in Russia

6.1.1 Refinery Location, Operator, Ownership, Startup Details

6.2 Russia Total Refining Capacity Historic and Forecast, 2012-2025

6.3 Russia Refining Capacity Historic and Forecast, 2012-2025

6.4 Russia Refinery wise Secondary Conversion Unit-1 Capacity, 2012-2025

6.5 Russia Refinery wise Secondary Conversion Unit-2 Capacity, 2012-2025

6.6 Russia Refinery wise Secondary Conversion Unit-3 Capacity, 2012-2025

7 Russia Refining Industry- Future Developments and Investment Opportunities

7.1 Capital Investment Details of All Upcoming Refineries

7.2 Location, Operator, Ownership, Start Up Details of Planned Refineries in Russia

7.2.1 Refinery Location, Operator, Ownership, Startup Details

7.3 Refinery Capacities of All Upcoming Refineries

8 Key Strategies Russia Refining Companies

8.1 Russia Company wise Refining Capacity Forecast, 2012-2025

9 Gazprom Company Profile

9.1 Gazprom Key Information

9.2 Gazprom Company Overview

9.3 Gazprom Business Description

9.4 Gazprom SWOT Analysis

9.4.1 Overview

9.4.2 Strengths

9.4.3 Weaknesses

9.4.4 Opportunities

9.4.5 Threats

9.5 Gazprom Financial Ratios - Capital Market Ratios

9.6 Gazprom Financial Ratios - Annual Ratios

9.7 Gazprom Financial Ratios - Interim Ratios

10 Russia Refining Industry Latest Tenders and Contracts

11 Russia Refining Industry Updates

12 Russia Refining Industry Deals

For more information about this report visit https://www.researchandmarkets.com/r/nqberg


Contacts

ResearchAndMarkets.com
Laura Wood, Senior Press Manager
This email address is being protected from spambots. You need JavaScript enabled to view it.
For E.S.T Office Hours Call 1-917-300-0470
For U.S./CAN Toll Free Call 1-800-526-8630
For GMT Office Hours Call +353-1-416-8900

Offshore Source Logo

Offshore Source keeps you updated with relevant information concerning the Offshore Energy Sector.

Any views or opinions represented on this website belong solely to the author and do not represent those of the people, institutions or organizations that Offshore Source or collaborators may or may not have been associated with in a professional or personal capacity, unless explicitly stated.

Corporate Offices

Technology Systems Corporation
8502 SW Kansas Ave
Stuart, FL 34997

info@tscpublishing.com