Business Wire News

COLUMBUS, Ind.--(BUSINESS WIRE)--Cummins Inc. (NYSE: CMI) today announced that it closed on the previously announced NPROXX joint venture with ETC for hydrogen storage tanks.


“NPROXX’s leading hydrogen storage products are an exciting complement to our broad and differentiated hydrogen portfolio,” said Amy Davis, Vice President and President, New Power at Cummins Inc. “Many companies aspire to shape tomorrow’s hydrogen economy, but very few have all of the elements required. We are excited to bring together Cummins’ 100 years of experience in launching new products, partnerships and customer support with NPROXX’s innovative hydrogen storage tank solutions.”

The joint venture will provide customers with hydrogen products for both on-highway and rail applications. Leveraging more than 40 years of centrifuge technology from ETC, NPROXX has been supplying carbon fiber tanks for more than two years with products in bus, truck, train and other on-highway applications.

“We admire Cummins’ scale advantage, global reach and deep understanding of their customers, and our teams are united in our shared commitment to unlock the potential of hydrogen,” said Rainer vor dem Esche, Managing Director, NPROXX. “Together, we can provide unique and reliable hydrogen storage options that will accelerate the availability of hydrogen solutions for our customers.”

NPROXX’s type 4 hydrogen pressure vessels are equipped to serve a wide range of industries, including commercial vehicles, passenger vehicles, trains and refueling infrastructure applications. The technology can also be modified for use in multiple fuel types, including natural gas.

Cummins and ETC will each own 50 percent of the new joint venture. The unconsolidated joint venture results will be included as part of Cummins’ New Power business segment, led by Davis.

Cummins is quickly emerging as the hydrogen leader for commercial and industrial industries. To date, the company has more than 500 electrolyzer installations and 2,000 fuel cell installations worldwide. Its electrolyzers are in fueling stations on five continents, including the first fueling stations in Scotland, Sweden, Norway and Southeast Asia.

Want to learn more about Cummins investments across the hydrogen supply chain? Join company leaders including Chairman and CEO Tom Lingebarger at 10:30 a.m. (EST) Nov. 16 for Cummins Hydrogen Day. Click here to register.

About Cummins Inc.

Cummins Inc., a global power leader, is a corporation of complementary business segments that design, manufacture, distribute and service a broad portfolio of power solutions. The company’s products range from diesel, natural gas, electric and hybrid powertrains and powertrain-related components including filtration, aftertreatment, turbochargers, fuel systems, controls systems, air handling systems, automated transmissions, electric power generation systems, batteries, electrified power systems, hydrogen generation and fuel cell products. Headquartered in Columbus, Indiana (U.S.), since its founding in 1919, Cummins employs approximately 61,600 people committed to powering a more prosperous world through three global corporate responsibility priorities critical to healthy communities: education, environment and equality of opportunity. Cummins serves its customers online, through a network of company-owned and independent distributor locations, and through thousands of dealer locations worldwide and earned about $2.3 billion on sales of $23.6 billion in 2019. See how Cummins is powering a world that’s always on by accessing news releases and more information at https://www.cummins.com/always-on.

About NPROXX

NPROXX is a global leader in designing, developing and manufacturing Type 4 pressure vessels for the storage of hydrogen under high pressure. Based on 40 years experience in carbon-fibre-reinforced polymer (CFRP) products and systems in various industries NPROXX provides composite tank systems and tailor made solutions for hydrogen storage applications: Transport and storage (500 bar, 1000 bar), Heavy duty vehicles, busses and ships (350 bar), Automotive (700 bar). More information can be found on our news and case studies page at https://www.nproxx.com/news-and-case-studies/

Forward-looking disclosure statement

Information provided in this release that is not purely historical are forward-looking statements within the meaning of the Private Securities Litigation Reform Act of 1995, including statements regarding our forecasts, guidance, preliminary results, expectations, hopes, beliefs and intentions on strategies regarding the future. These forward-looking statements include, without limitation, statements relating to our plans and expectations for our revenues and EBITDA. Our actual future results could differ materially from those projected in such forward-looking statements because of a number of factors, including, but not limited to: market slowdown due to the impacts from COVID-19 pandemic, other public health crises, epidemics or pandemics; impacts to manufacturing and supply chain abilities from an extended shutdown or disruption of our operations due to the COVID-19 pandemic; supply shortages and supplier financial risk, particularly from any of our single-sourced suppliers, including suppliers that may be impacted by the COVID-19 pandemic; aligning our capacity and production with our demand, including impacts of COVID-19; a major customer experiencing financial distress, particularly related to the COVID-19 pandemic; any adverse results of our internal review into our emissions certification process and compliance with emission standards; increased scrutiny from regulatory agencies, as well as unpredictability in the adoption, implementation and enforcement of emission standards around the world; disruptions in global credit and financial markets as the result of the COVID-19 pandemic; adverse impacts from government actions to stabilize credit markets and financial institutions and other industries; product recalls; the development of new technologies that reduce demand for our current products and services; policy changes in international trade; a slowdown in infrastructure development and/or depressed commodity prices; the U.K.'s decision to end its membership in the European Union (EU); labor relations or work stoppages; reliance on our executive leadership team and other key personnel; lower than expected acceptance of new or existing products or services; changes in the engine outsourcing practices of significant customers; our plan to reposition our portfolio of product offerings through exploration of strategic acquisitions and divestitures and related uncertainties of entering such transactions; exposure to potential security breaches or other disruptions to our information technology systems and data security; challenges or unexpected costs in completing cost reduction actions and restructuring initiatives; failure to realize expected results from our investment in Eaton Cummins Automated Transmission Technologies joint venture; political, economic and other risks from operations in numerous countries; competitor activity; increasing competition, including increased global competition among our customers in emerging markets; foreign currency exchange rate changes; variability in material and commodity costs; the actions of, and income from, joint ventures and other investees that we do not directly control; changes in taxation; global legal and ethical compliance costs and risks; product liability claims; increasingly stringent environmental laws and regulations; the performance of our pension plan assets and volatility of discount rates, particularly those related to the sustained slowdown of the global economy due to the COVID-19 pandemic; future bans or limitations on the use of diesel-powered products; the price and availability of energy; our sales mix of products; protection and validity of our patent and other intellectual property rights; the outcome of pending and future litigation and governmental proceedings; continued availability of financing, financial instruments and financial resources in the amounts, at the times and on the terms required to support our future business; and other risks detailed from time to time in our SEC filings, including particularly in the Risk Factors section of our 2019 Annual Report on Form 10-K and Quarterly Reports on Form 10-Q. Shareholders, potential investors and other readers are urged to consider these factors carefully in evaluating the forward-looking statements and are cautioned not to place undue reliance on such forward-looking statements. The forward-looking statements made herein are made only as of the date of this press release and we undertake no obligation to publicly update any forward-looking statements, whether as a result of new information, future events or otherwise. More detailed information about factors that may affect our performance may be found in our filings with the SEC, which are available at http://www.sec.gov or at http://www.cummins.com in the Investor Relations section of our website.


Contacts

Jon Mills – Director, External Communications
(317) 658-4540
This email address is being protected from spambots. You need JavaScript enabled to view it.

APS and Leeward contract to bring New Mexican wind power to Grand Canyon State

PHOENIX & DALLAS--(BUSINESS WIRE)--Customers of Arizona Public Service Company (APS) will soon power their homes and businesses with more clean energy. Earlier this year, APS announced a bold commitment to deliver 100% clean, carbon-free electricity to customers by 2050. By the end of 2021, APS will harness the power of Leeward Renewable Energy’s (Leeward) advanced GE wind turbine technology to help meet Arizona’s growing energy demands.


APS has entered into a power purchase agreement (PPA) with Leeward to purchase wind energy output from Leeward’s two Aragonne Wind facilities. The PPA resulted from a September 2019 Wind Request for Proposal. This PPA enables Leeward to sell 200 megawatts of wind generation to APS over a term of 20 years through the repowering of Leeward’s existing 90-megawatt Aragonne Wind project and the construction of its 145-megawatt Aragonne Mesa Wind project. Both facilities are located within Guadalupe County, New Mexico.

Leeward and APS have a longstanding partnership. APS first purchased power from the legacy 90-megawatt Aragonne Wind farm in 2006 when the project began operating commercially. Repowering of this existing project, coupled with the new wind generation, fits squarely with APS’s efforts to advance Arizona’s clean energy future by adding new renewable resources to its energy mix and bringing customers direct cost-saving benefits through energy efficiency products and smart energy home programs.

Renewable energy resources like this wind power are important to a diverse and increasingly clean energy mix for Arizona,” said Brad Albert, APS Vice President of Resource Management. “By working with supplier partners like Leeward, APS is advancing toward our target of having 45% of our generation portfolio in renewable energy by 2030 on the path to 100% clean energy by 2050. We are moving toward that future while continuing our focus on serving customers with reliable, affordable energy.”

This project will modernize Leeward’s existing wind assets and add significant generation capacity to its Guadalupe County, New Mexico, renewable energy complex. Together, both companies will use wind resources as a clean power solution for APS customers in Arizona.

Leeward is pleased to partner with APS on an innovative project that will repower one of our legacy wind assets and also enable the construction of a new wind facility, bringing economic benefits to the local community,” said Andrew Flanagan, Chief Development Officer at Leeward. “We look forward to working alongside the APS team as we continue to actively develop new wind, solar and energy storage projects across the U.S.”

About APS

APS serves nearly 1.3 million homes and businesses in 11 of Arizona’s 15 counties, and is a leader in delivering affordable, clean and reliable energy in the Southwest. The company is committed to serving customers with 100% clean power by 2050. As owner and operator of Palo Verde Generating Station, the nation’s largest producer of carbon-free electricity, and with one of the country’s most substantial renewable energy portfolios, APS’s current energy mix is 50% clean. With headquarters in Phoenix, APS is the principal subsidiary of Pinnacle West Capital Corp. (NYSE: PNW).

About Leeward

Leeward Renewable Energy is a growth-oriented renewable energy company that owns and operates a portfolio of 21 wind farms across nine states, with 20 in operation and one under construction, totaling approximately 2,000 megawatts of generating capacity. Leeward is actively developing new wind, solar, and energy storage projects in energy markets across the U.S. Leeward is a portfolio company of OMERS Infrastructure, an investment arm of OMERS, one of Canada's largest defined benefit pension plans with C$109 billion in net assets (as at December 31, 2019). For more information, visit www.leewardenergy.com.


Contacts

Media Contacts:
APS: Yessica del Rincón (480) 209-8513 or This email address is being protected from spambots. You need JavaScript enabled to view it.
Leeward: Kelly Kimberly (713) 822-7538 or This email address is being protected from spambots. You need JavaScript enabled to view it.

Websites:
aps.com/newsroom
leewardenergy.com/news/

Virtual Event Participants include Lordstown Motors, XL Fleet, Blink Charging, Canoo, QuantumScape, and Romeo Power

NEW YORK--(BUSINESS WIRE)--With California eliminating sales of gas-powered vehicles by 2035, broad-based electrification is imminent. And now, a transition to Democratic control of the federal government could accelerate green technology adoption even further. In the marketplace, there are now many ways to invest in electric vehicles and related technologies, with several major companies listing on public exchanges in the last year alone and more on the way.


To discuss this changing landscape, IPO Edge will host a virtual forum on Monday, November 16, at 2:00 p.m. EST: Acceleration of Electrification: California’s 2035 Ban and the Future of EVs, Energy Technology and Regulation.

Participants will include the California Governor’s Office of Business and Economic Development, as well as CEOs and senior executives from Blink Charging Co., QuantumScape, XL Fleet, Canoo, Lordstown Motors and Romeo Power. Speakers will discuss the most important electrification technologies heading into 2021 and beyond, the changing regulatory landscape, and emerging investment and financing opportunities.

The event, hosted in partnership with Vinson & Elkins LLP, ICR, Nasdaq, Cowen and The Palm Beach Hedge Fund Association, will consist of panel discussions, one-on-one interviews, and live Q&A sessions, totaling approximately two hours.

To register, please CLICK HERE.

Confirmed speakers include:

The program includes the following topics:

  • How California and other states are supporting emerging technologies in electrification
  • California’s 2035 ban on internal combustion engine (ICE) vehicle sales
  • Private investment opportunities
  • Consumer vs. commercial vehicles
  • Best paths to public markets: IPOs, SPACs, and direct listings
  • Implications for peripheral industries such as charging stations and batteries

About ICR

Established in 1998, ICR partners with its clients to execute strategic communications and advisory programs that achieve business goals, build awareness and credibility, and enhance long-term enterprise value. The firm’s highly-differentiated service model, which pairs capital markets veterans with senior communications professionals, brings deep sector knowledge and relationships to more than 750 clients in approximately 20 industries. ICR’s healthcare practice operates under the Westwicke brand (www.westwicke.com). Today, ICR is one of the largest and most experienced independent communications and advisory firms in North America, maintaining offices in New York, Norwalk, Boston, Baltimore, San Francisco, San Diego and Beijing. Learn more at www.icrinc.com. Follow us on Twitter at @ICRPR.

About IPO Edge

IPO Edge is dedicated to objective journalism as a means to deliver the clearest news and analysis of new and upcoming initial public offerings. In an era when misinformation is rampant, we aspire to distinguish between truth and falsehood, along with opportunity and risk. Find our content on www.ipo-edge.com along with Yahoo Finance and Bloomberg Terminals.


Contacts

IPO Edge
John Jannarone
This email address is being protected from spambots. You need JavaScript enabled to view it.

ICR
Brian Ruby
This email address is being protected from spambots. You need JavaScript enabled to view it.

VERNAL, Utah--(BUSINESS WIRE)--Superior Drilling Products, Inc. (NYSE American: SDPI) (“SDP” or the “Company”), an innovator and manufacturer of drilling tool technologies, today announced that it has entered into sale-leaseback agreements for its facilities in Vernal, Utah. The transaction is subject to customary due diligence and the Company expects it to close before year end.


Under the terms of the transaction, SDP will sell its facilities for $4.5 million and simultaneously enter into a 15-year lease. After fees, the Company is expected to net approximately $4.2 million in proceeds of which $2.5 million will be used to repay its outstanding mortgage. Lease terms are for monthly payments that are $17 thousand less than current mortgage debt service.

Chris Cashion, Chief Financial Officer, commented, “This transaction was an excellent opportunity given current market conditions for us to monetize our Vernal property. The proceeds will enable us to completely pay off our mortgage and improve liquidity with approximately $1.7 million in additional cash. The additional cash helps bolster our balance sheet providing us the flexibility to continue to expand internationally and develop additional revenue streams. The Drill-N-Ream®, our unique, patented wellbore conditioning tool, is being deployed more frequently in international markets while it also continues to gain new customers in the U.S. We believe this bodes well for our future and these opportunities are further bolstered as the oil & gas industry begins to improve.”

About Superior Drilling Products, Inc.

Superior Drilling Products, Inc. is an innovative, cutting-edge drilling tool technology company providing cost saving solutions that drive production efficiencies for the oil and natural gas drilling industry. The Company designs, manufactures, repairs and sells drilling tools. SDP drilling solutions include the patented Drill-N-Ream® well bore conditioning tool and the patented Strider oscillation system technology. In addition, SDP is a manufacturer and refurbisher of PDC (polycrystalline diamond compact) drill bits for a leading oil field service company. SDP operates a state-of-the-art drill tool fabrication facility, where it manufactures its solutions for the drilling industry, as well as customers’ custom products. The Company’s strategy for growth is to leverage its expertise in drill tool technology and innovative, precision machining in order to broaden its product offerings and solutions for the oil and gas industry.

Additional information about the Company can be found at: www.sdpi.com.

Safe Harbor Regarding Forward Looking Statements

This news release contains forward-looking statements and information that are subject to a number of risks and uncertainties, many of which are beyond our control. All statements, other than statements of historical fact included in this release, including, without limitations, the continued impact of COVID-19 on the business, the Company’s strategy, future operations, success at developing future tools, the Company’s effectiveness at executing its business strategy and plans, financial position, estimated revenue and losses, projected costs, prospects, plans and objectives of management, and ability to outperform are forward-looking statements. The use of words “could,” “believe,” “anticipate,” “intend,” “estimate,” “expect,” “may,” “continue,” “predict,” “potential,” “project”, “forecast,” “should” or “plan, and similar expressions are intended to identify forward-looking statements, although not all forward -looking statements contain such identifying words. These statements reflect the beliefs and expectations of the Company and are subject to risks and uncertainties that may cause actual results to differ materially. These risks and uncertainties include, among other factors, the duration of the COVID-19 pandemic and related impact on the oil and natural gas industry, the effectiveness of success at expansion in the Middle East, options available for market channels in North America, the deferral of the commercialization of the Strider technology, the success of the Company’s business strategy and prospects for growth; the market success of the Company’s specialized tools, effectiveness of its sales efforts, its cash flow and liquidity; financial projections and actual operating results; the amount, nature and timing of capital expenditures; the availability and terms of capital; competition and government regulations; and general economic conditions. These and other factors could adversely affect the outcome and financial effects of the Company’s plans and described herein. The Company undertakes no obligation to revise or update any forward-looking statements to reflect events or circumstances after the date hereof.


Contacts

For more information, contact investor relations:
Deborah K. Pawlowski
Kei Advisors LLC
(716) 843-3908
This email address is being protected from spambots. You need JavaScript enabled to view it.

WASHINGTON--(BUSINESS WIRE)--Oceana issued the following statement from Jacqueline Savitz, chief policy officer:


“The abundance of our oceans can be a key to helping us build back better, if we can end the expansion of offshore drilling and restore fishery abundance. Most of our coasts are still slated for offshore oil drilling in President Trump’s current proposal, but we will rely on President-elect Joe Biden to quickly and permanently protect our coasts.

Four years of deregulation and attacks have left our bedrock environmental laws bruised and battered. Laws that protect marine mammals and endangered species, and protections for critical marine habitat have been wantonly undermined by President Trump.

As President-elect Biden says, we can build back better, and the abundance and biodiversity of our oceans are essential in the journey toward a healthier world. The oceans are not just a resource we must protect, they are also a vital tool in healing our planet from the decades of damage we have caused. They are our life support system, and a source of food, that can provide 1 billion people a healthy seafood meal every day if we can manage our fisheries sustainably. Those are meals that do not require land or fresh water for grazing and feeding. Meals that contribute far less carbon dioxide than other protein sources, and meals that can help us stave off heart disease, diabetes and other diseases.

By expanding on the transparency in our seafood supply chain, President-elect Biden can give managers the tools they need to restore the abundance of our fisheries so that people may benefit from healthy seafood.

The oceans are also a major part of the solution to climate change. By absorbing about a third of the carbon dioxide we emit they have done us a great service. But that carbon dioxide is making our oceans sick. It is melting sea ice and driving sea level rise and ocean acidification. It is causing warming waters, weather hazards and shifting species ranges that will lead to ecological havoc.

By rejoining the Paris Agreement and moving away from fossil fuels toward a green energy future, including offshore wind, the Biden-Harris administration can help save the ocean, and us, from the looming climate disaster. By permanently protecting U.S. waters from new offshore oil and gas drilling, the administration can not only help slow the climate crisis, but also protect coastal communities from the threat of spills and the blight of sprawling oil infrastructure.

With these measures, we can build back the bounty of our oceans. Our planet can heal. We can make it better. We can achieve all of that if we protect our oceans.

We look forward to working with President-elect Biden, and Vice President-elect Harris, to establish a proactive, sensible, science-based approach to restoring and managing our incredibly rich marine resources and our deeply generous oceans.”

Oceana is the largest international advocacy organization dedicated solely to ocean conservation. Oceana is rebuilding abundant and biodiverse oceans by winning science-based policies in countries that control one-third of the world’s wild fish catch. With more than 225 victories that stop overfishing, habitat destruction, pollution, and the killing of threatened species like turtles and sharks, Oceana’s campaigns are delivering results. A restored ocean means that 1 billion people can enjoy a healthy seafood meal, every day, forever. Together, we can save the oceans and help feed the world. Visit www.USA.Oceana.org to learn more.


Contacts

Dustin Cranor, 954.348.1314 or This email address is being protected from spambots. You need JavaScript enabled to view it.

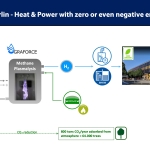
BERLIN--(BUSINESS WIRE)--The Mercure Hotel MOA Berlin is set to become the first hotel and eventlocation worldwide with a negative CO2 balance when generating heat. Thanks to the methane plasmalysis technology developed by Graforce, the MOA Berlin will not only generate its heat without any emissions. It will also be able to extract CO2 from the atmosphere – while heating. Thus, the "MOA-H2eat" solution was just awarded with the German Gas Industry Innovation Prize, because of An approach that revolutionizes the heating market and contributes to decentralized decarbonization," the jury said.


The MOA Berlin is no longer heating with natural gas but with hydrogen from biogas. The methane plasmalysis technology splits the biogas into hydrogen and solid carbon. Using electricity from renewable energies, methane plasmalysis is just as climate-friendly as electrolysis – but the costs are significantly lower.

For the zero-emission heating process, the MOA Berlin uses modified gas condensing boilers fueled by a mixture of green hydrogen and biogas. The mixing ratio is controlled by the methane plasmalyzer. The heat generation is started with 30 vol.% hydrogen and 70 vol.% biogas. In the following months, the share of hydrogen is gradually increased.

The solid carbon can be used as an industrial raw material, for paints and ceramics or, as in the case of the MOA Berlin, for producing asphalt. Thus, CO2 is permanently bound. Thus, Graforce offers the worldwide first market-ready technology for CO2 reduction and a green alternative to the controversial CCS storage.

The gas heaters used at the MOA Berlin before would have emitted up to 800 tons of CO2 per year. In order to absorb this amount from the atmosphere, the equivalent of more than 65,000 trees is needed.

"In order to counteract global warming, the generation of heat and hot water must be completely CO2-free by 2050. There are two ways to achieve this: Either we’ll heat with renewable electricity only or we decarbonize the natural gas supply with a carbon-free alternative such as hydrogen," Graforce founder and CTO Dr. Jens Hanke explains.

About

The German company Graforce has developed new plasma applications for inexpensively producing green hydrogen and other valuable industrial gases from residual materials. www.graforce.com/EN


Contacts

Graforce GmbH
Dr. Jens Hanke
Phone: +49 30 - 63 2222-110
This email address is being protected from spambots. You need JavaScript enabled to view it.

Phil Mezey appointed as Non-Executive Chairman; Brian Freed named Chief Executive Officer

SAN ANTONIO, Texas--(BUSINESS WIRE)--EPIC Midstream Holdings, LP (“EPIC” or “the Company”) today announced its executive leadership succession plan, in which the Board of Directors unanimously appointed Brian Freed to succeed Phil Mezey as Chief Executive Officer, with Mr. Mezey becoming Non-Executive Chairman. In addition to his role as CEO, Mr. Freed will join the Company’s Board of Directors.


I am very pleased with the progress we have made in accomplishing our goal of building world class midstream assets from the Permian Basin to the Gulf Coast,” said Mr. Mezey. “With this achievement, we are now empowering the next generation of leaders to successfully transition EPIC from a company focused on project development to a leader in operational excellence. In my new role, I’ll continue to drive our strategic thinking with a special focus on several key initiatives that have the potential to further enhance our capabilities as a leading midstream player. I believe Brian’s appointment to CEO will best serve our employees, customers, and shareholders in the future.”

I am excited about this next phase of the Company’s growth and am focused on making EPIC a market leader in the Permian Basin over the coming years,” said Mr. Freed. “I am honored to have worked with Phil for the past year and look forward to continuing to partner with him in his new role,” added Mr. Freed.

Mr. Freed has served as EPIC’s President since July 2019. Prior to joining EPIC, he most recently served as the Senior Vice President, Midstream and Marketing, of Apache Corporation.

Phil has positioned EPIC’s organization and its assets for continued long-term growth,” said Nate Walton, Partner in the Private Equity Group of Ares Management. “Brian has played a critical role in the commercialization of EPIC’s crude and NGL pipelines, and we look forward to this next phase under his leadership.”

About EPIC Midstream Holdings, LP

EPIC was formed in 2017 to build, own and operate midstream infrastructure in both the Permian and Eagle Basins. EPIC operates the EPIC Crude Oil Pipeline and the EPIC NGL Pipeline that span approximately 700-miles servicing the Delaware, Midland and Eagle Ford Basins. EPIC is a portfolio company of funds managed by the Private Equity Group of Ares Management Corporation (NYSE: ARES). For more information, visit www.epicmid.com.


Contacts

Media Contact:
EPIC Midstream Holdings, LP
David McArthur
Corporate Communications Director
(210) 446-1059
This email address is being protected from spambots. You need JavaScript enabled to view it.

Merger Proposal Fails to Win Sunworks Stockholder Approval

SOUTH BURLINGTON, Vt.--(BUSINESS WIRE)--The Peck Company Holdings, Inc. (NASDAQ: PECK) (“Peck”), a leading commercial solar engineering, procurement and construction (EPC) company was informed today by Sunworks, Inc. (NASDAQ: SUNW) (“Sunworks”), a provider of solar power solutions for agriculture, commercial and industrial (“ACI”), public works and residential markets, that the Merger Agreement previously announced on August 10, 2020 was terminated by Sunworks due to its inability to obtain stockholder approval.

Sunworks had established October 9, 2020 as the record date for determining stockholders eligible to vote at the Sunwork’s Special Meeting of Stockholders and as of the record date, there were 16,628,992 shares of Common Stock outstanding and entitled to vote. At the Sunwork’s Special Meeting of Stockholders only 4,362,575 votes were cast, or 26% of the total outstanding shares. This total fell short of the quorum required to vote on the proposed merger. Peck had been informed that approximately 65% of the shares voted had voted in favor of the merger but Sunworks and its proxy solicitor did not believe adjourning the Special Meeting and continued solicitation of proxies would enable it to obtain the requisite stockholder vote due to Sunwork’s widely dispersed stockholder base. Accordingly Sunworks terminated the merger but indicated its desire to continue to have strategic discussions to determine other ways for the two companies to work together.

Peck had received sufficient proxies to approve the merger but, due to Sunwork’s termination, Peck cancelled its scheduled Special Meeting of Stockholders.

Chairman and CEO of Peck, Jeffrey Peck commented, “Our stockholders were in favor of the merger with Sunworks, so we are committed to finding alternative ways that we can work efficiently together and to leverage the synergies between our two companies in the coming months.”

About The Peck Company Holdings, Inc.

Headquartered in South Burlington, VT, The Peck Company Holdings, Inc. (NASDAQ: PECK) is a 2nd-generation family business founded in 1972 and rooted in values that align people, purpose, and profitability. Ranked by Solar Power World as one of the leading commercial solar contractors in the Northeastern United States, Peck provides EPC services to solar energy customers for projects ranging in size from several kilowatts for residential properties to multi-megawatt systems for large commercial and utility scale projects. Peck has installed over 160 megawatts worth of solar systems since it started installing solar in 2012 and continues its focus on profitable growth opportunities. Please visit www.peckcompany.com for additional information.

Forward Looking Statements

This press release contains forward-looking statements within the meaning of the Private Securities Litigation Reform Act of 1995. These forward-looking statements include, but are not limited to, statements about (i) the Company’s future business relationship with Sunworks,, including synergies, (ii) Peck’s plans, objectives, expectations and intentions and other statements contained in this press release that are not historical facts; and (iii) other statements identified by words such as “expects” “anticipates,” “intends,” “plans,” “believes,” “seeks,” “estimates,” “targets,” “projects,” or words of similar meaning generally intended to identify forward-looking statements. These forward-looking statements are based upon the current beliefs and expectations of the management of Peck and are inherently subject to significant business, economic and competitive uncertainties and contingencies, many of which are beyond the control of Peck. In addition, these forward-looking statements are subject to assumptions with respect to future business strategies and decisions that are subject to change. Actual results may differ materially from the anticipated results discussed in these forward-looking statements because of possible uncertainties.

The following factors, among others, could cause actual results to differ materially from the anticipated results or other expectations expressed in the forward-looking statements: (1) the termination of the Merger Agreement (2) the amount of any costs, fees, expenses, impairments and charges related to the abandoned merger; (3) uncertainty as to the effects of the announcement of the termination of the merger on the market price of Peck’s Common Stock and/or on its financial performance; (4) uncertainty as to the long-term value of Peck’s Common Stock; (5) the ability of Peck to raise capital from third parties to grow its business; (6) operating costs, loss of customers and business disruption following the abandonment of the merger, including adverse effects on relationships with employees and customers, may be greater than expected; (7) economic, competitive, regulatory, environmental and other factors may adversely affect the businesses in which Peck is e engaged; and (8) the impact of COVID-19 and the related federal, state and local restrictions on Peck’s operations and workforce, the impact of COVID-19 and such restrictions on customers of Peck and the impact of COVID-19 on the supply chain and availability of shipping and distribution of Peck. . Additional factors that could cause actual results to differ materially from those expressed in the forward-looking statements are discussed in Peck’s reports (such as Annual Reports on Form 10-K, Quarterly Reports on Form 10-Q and Current Reports on Form 8-K) filed with the SEC and available on the SEC’s Internet site (http://www.sec.gov).


Contacts

The Peck Company Holdings Investor Contacts:
Michael d’Amato
This email address is being protected from spambots. You need JavaScript enabled to view it.
p802-264-2040

ClearThink
This email address is being protected from spambots. You need JavaScript enabled to view it.

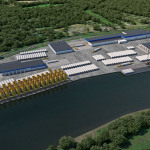
NEW YORK--(BUSINESS WIRE)--#offshorewind--Today, Equinor announced its proposal to locate America’s first offshore wind tower manufacturing facility at the Port of Albany, in upstate New York. Developed jointly with leading wind industry manufacturers Marmen and Welcon, Equinor stands ready to transform the port for manufacturing offshore wind towers and transition pieces (TPs), creating up to 350 direct jobs in the region.


The Port of Albany extension initiative is part of the bid Equinor submitted in response to the New York State Energy Research and Development Authority’s (NYSERDA) latest offshore wind energy solicitation, which seeks up to 2.5 gigawatts of offshore wind and multi-port infrastructure investment plans (PIIPs). Development of a tower manufacturing facility at the Port of Albany is contingent upon NYSERDA selecting Equinor’s bid and PIIP.

“With this latest solicitation, New York solidifies its commitment to renewable energy and its desire to make the offshore wind industry an important component of the state’s economy,” said Siri Espedal Kindem, President of Equinor Wind U.S. “Equinor is excited about the possibility of expanding its business within New York, and this plan would create the first facility for offshore wind tower and transition piece manufacturing in the U.S. Our proposal helps secure New York and the Port of Albany as a regional leader in this exciting new industry.”

The construction of an offshore wind tower/TP manufacturing facility at the Port of Albany could provide an immediate economic boost to the area as it recovers from the challenges caused by the COVID-19 pandemic, creating new employment opportunities as early as the second half of 2021. If Equinor’s plan is chosen by NYSERDA, hundreds of jobs will flow to Albany for the construction of the port’s infrastructure and for the long-term assembly. In addition, maritime operations related to industry components will sustain hundreds of other jobs for decades.

“The port is the ideal location to build these components and we are excited about the prospect of the area becoming a manufacturing hub for offshore wind,” said Katie Newcombe, Chief Economic Development Officer for the Center for Economic Growth. “With the ongoing expansion of offshore wind power on the East coast, the Port of Albany would become a natural destination for future projects to source components. The economic potential for the NY Capital Region is enormous. We commend New York State leadership for their focused work in developing this industry and will continue our active engagement with local manufacturers to participate.”

In September 2020, bp and Equinor announced that they formed a strategic partnership for offshore wind in the U.S., and that bp will be a 50% non-operating partner in the Empire Wind and Beacon Wind assets on the U.S. East Coast. The transaction is expected to close in early 2021.

About Equinor

Equinor is developing into a broad energy company, building a material position in renewable energy. Equinor now powers more than one million European homes with renewable offshore wind from four projects in the United Kingdom and Germany. Equinor commissioned the world’s first floating offshore wind farm in 2017 off the coast of Scotland. In the U.S., Equinor holds two lease areas, the Empire Wind lease area located approximately 20 miles south of Long Island, and the Beacon Wind lease area that lies 60 miles off the coast of Long Island.

About Marmen

Marmen has facilities in Canada and in the USA and is recognized as one of the largest manufacturers of onshore wind towers in North America and for providing high-precision machining, fabrication and mechanical assembly services to leading OEMs around the world.

About Welcon

Welcon, based in Denmark, is the world´s leading manufacturer of offshore wind towers and holds worldwide production rights for the Stiesdal floating and bottom fixed offshore foundations.


Contacts

Media contact:
Eskil Eriksen, Media Relations
+47 958 82 534 (mobile)

MONTAGUE, Mass. & MANSFIELD, Mass.--(BUSINESS WIRE)--In the largest municipal electric department purchase of clean, renewable power in New England history, 21 public power entities from Massachusetts, Rhode Island, and Vermont have agreed to purchase 200 million kilowatt-hours per year of hydroelectric power produced by FirstLight Power in Western Massachusetts.


The purchase agreement, structured and executed by Energy New England, will cover the year-round electric power demands of 23,000 typical homes while saving participating utilities’ ratepayers millions of dollars over the life of the contract. By relying on clean hydropower from the Cabot and Turners Falls generating facilities on the Connecticut River in Montague instead of electricity produced by natural gas or oil, the contract will deliver carbon-dioxide emissions reductions equal to taking 30,000 cars off the road by 2023.

“Never before have so many municipal light plants, municipal electric departments, and other public power utilities come together to buy emissions-free renewable power on this scale,’’ said Energy New England president and CEO John G. Tzimorangas. “We are honored to have had the chance to connect our ‘munis’ with one of Massachusetts’ premier energy suppliers, FirstLight Power, for this landmark transaction that will deliver environmental and economic benefits for years to come.”

FirstLight CEO Alicia Barton said: “Our Cabot and Turners Falls hydroelectric generating stations that will deliver this power have been key elements of Massachusetts’ energy network for more than a century and help support more than 110 great jobs in Western Massachusetts and across the state. We’re looking forward to serving municipal utilities across New England in reaching their states’ targets for reducing emissions and addressing climate change while delivering affordable, reliable electricity to thousands of our neighbors.”

The 21 public power entities participating in the contract include 18 in Massachusetts: Belmont Municipal Light Department, Braintree Electric Light Department, Concord Municipal Light Plant, Danvers Electric Division, Georgetown Municipal Light Department, Groveland Municipal Light Department, Hingham Municipal Lighting Plant, Mass Development/Devens Utilities, Merrimac Municipal Light Department, Middleboro Gas & Electric Department, Merrimac Municipal Electric Department, North Attleboro Electric Department, Norwood Municipal Light Department, Reading Municipal Light Department, Rowley Municipal Lighting Plant, Taunton Municipal Lighting Plan, Wellesley Municipal Light Plant, and Westfield Gas & Electric.

Also participating are the Block Island Utility District and Pascoag Utility District in Rhode Island and Stowe Electric Department in Vermont.

Power purchased by Massachusetts municipal electric utilities served by Energy New England already accounts for on average 29 percent fewer carbon emissions from electric generation than average Commonwealth electricity-sector carbon emissions. The new contract with FirstLight will further improve the munis’ carbon profile to an average of 34 percent below the state average.

"While the Legislature continues to work on advancing laws governing how municipal light plants will support the Commonwealth's net-zero by 2050 commitment, I am pleased to see this group of munis stepping up with a significant expansion of their procurement of renewable and carbon-free electricity, produced right here in Massachusetts," said State Representative Thomas A. Golden, Jr., Chairman of the Joint Committee on Telecommunications, Utilities, and Energy.

Coleen O’Brien, General Manager of the Reading Municipal Light Department, said, “FirstLight and Energy New England offered an excellent opportunity for RMLD to increase its portfolio of local renewable energy at competitive rates for our customers in the four towns we serve. The RMLD is pleased and honored to be a part of these successful collaboration efforts and history-making purchases by public power entities to ensure reliable, affordable energy.''

Massachusetts House Minority Leader Bradley H. Jones, Jr., said: “The Commonwealth’s municipal light departments have demonstrated that they’re more than willing to do their part voluntarily to meet the state’s emissions goals. This historic agreement represents a win-win-win-win for Massachusetts’ environment, local decision-making and home rule, investing in locally produced energy, and saving ratepayers money during these challenging economic times.”

First Light’s Cabot Generating Station is Massachusetts’ largest conventional hydropower facility, located on the Connecticut River in Montague. First put into service in 1916, the facility comprises six generating units with combined output of 62 megawatts, enough to power more than 50,000 homes. Turners Falls, just upstream of Cabot, consists of 5 generators with combined output of 6 megawatts and was commissioned in 1905.

ABOUT FIRSTLIGHT POWER

FirstLight Power (FirstLight) is a leading clean power producer and energy storage company in New England with a portfolio that includes nearly 1.4 GW of pumped-hydro storage, battery storage, hydroelectric generation, and solar generation—the largest clean energy generation portfolio in New England today.

ABOUT ENERGY NEW ENGLAND (ENE)

ENE is the largest wholesale risk management and energy trading organization serving the needs of municipal utilities in the northeast. ENE works with numerous businesses, residents and utilities to help promote the principles of conservation, efficiency, and environmental stewardship, and advances the many benefits available through integrated sustainability planning. www.ene.org


Contacts

FirstLight Power: Leonard Greene, Director of Government Affairs and Communications, 860.795.4310

Energy New England: Vincent J. Ragucci III, Chief Strategy Officer, 508.698.1240

Denterlein/strategic communications and PR: Peter J. Howe, 617.482.0042 This email address is being protected from spambots. You need JavaScript enabled to view it.

TULSA, Okla.--(BUSINESS WIRE)--Blueknight Energy Partners, L.P. ("Blueknight" or the "Partnership") (Nasdaq: BKEP and BKEPP) today announced that its Chief Executive Officer, Andrew Woodward, and Chief Financial Officer, Matthew Lewis, are scheduled to participate in the following upcoming virtual investor conferences:


  • RBC Capital Markets Midstream and Energy Infrastructure Conference on Wednesday, November 18, 2020. Blueknight will be hosting one-on-one meetings.
  • Wells Fargo Midstream and Utility Symposium on Tuesday, December 8, 2020. Blueknight will be hosting one-on-one meetings.

Presentation materials used at these conferences will be available through the “Investors” section of the Blueknight website at investor.bkep.com.

About Blueknight Energy Partners, L.P.

Blueknight owns and operates a diversified portfolio of complementary midstream energy assets consisting of:

  • 8.8 million barrels of liquid asphalt storage located at 53 terminals in 26 states;
  • 6.9 million barrels of above-ground crude oil storage capacity located primarily in Oklahoma, approximately 6.6 million barrels of which are located at the Cushing Interchange terminalling facility in Cushing, Oklahoma;
  • 604 miles of crude oil pipeline located primarily in Oklahoma; and
  • 63 crude oil transportation vehicles deployed in Oklahoma and Texas.

Blueknight provides integrated terminalling, gathering and transportation services for companies engaged in the production, distribution and marketing of liquid asphalt and crude oil. Blueknight is headquartered in Tulsa, Oklahoma. For more information, visit the Partnership's website at www.bkep.com.


Contacts

Blueknight Investor Relations
Chase Jacobson, (918) 237-4032
This email address is being protected from spambots. You need JavaScript enabled to view it.

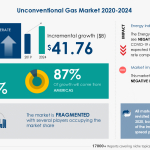
LONDON--(BUSINESS WIRE)--#UnconventionalGasMarket--The unconventional gas market is poised to grow by $ 41.76 bn during 2020-2024, progressing at a CAGR of almost 7% during the forecast period. Technavio suggests three forecast scenarios (optimistic, probable, and pessimistic) considering the impact of COVID-19. Download Free Sample Report on COVID-19 Recovery Analysis


The report on the unconventional gas market provides a holistic update, market size and forecast, trends, growth drivers, and challenges, as well as vendor analysis.

The report offers an up-to-date analysis regarding the current global market scenario and the overall market environment. The market is driven by the abundance of unconventional gas resources.

The unconventional gas market analysis includes type segment, end-user segment, and geography landscape. This study identifies the technology development in the hydraulic fracturing process as one of the prime reasons driving the unconventional gas market growth during the next few years.

This report presents a detailed picture of the market by the way of study, synthesis, and summation of data from multiple sources by an analysis of key parameters.

The unconventional gas market covers the following areas:

Unconventional Gas Market Sizing

Unconventional Gas Market Forecast

Unconventional Gas Market Analysis

Companies Mentioned

  • BP Plc
  • Chevron Corp.
  • ConocoPhillips Co.
  • Exxon Mobil Corp.
  • PetroChina Co. Ltd.
  • PJSC Gazprom
  • Royal Dutch Shell Plc
  • Santos Ltd.
  • Saudi Arabian Oil Co.
  • YPF SA.


Key Topics Covered:

PART 01: EXECUTIVE SUMMARY

PART 02: SCOPE OF THE REPORT

PART 03: MARKET LANDSCAPE

  • Market ecosystem
  • Market characteristics
  • Value chain analysis
  • Market segmentation analysis

PART 04: MARKET SIZING

  • Market definition
  • Market sizing 2019
  • Market outlook
  • Market size and forecast 2019-2024

PART 05: FIVE FORCES ANALYSIS

  • Bargaining power of buyers
  • Bargaining power of suppliers
  • Threat of new entrants
  • Threat of substitutes
  • Threat of rivalry
  • Market condition

PART 06: MARKET SEGMENTATION BY TYPE

  • Market segmentation by type
  • Comparison by type
  • Shale gas - Market size and forecast 2019-2024
  • Tight gas - Market size and forecast 2019-2024
  • Coalbed methane - Market size and forecast 2019-2024
  • Market opportunity by type

PART 07: CUSTOMER LANDSCAPE

PART 08: MARKET SEGMENTATION BY END-USER

  • Market segmentation by end-user
  • Comparison by end-user
  • Power generation - Market size and forecast 2019-2024
  • Residential and commercial - Market size and forecast 2019-2024
  • Industrial - Market size and forecast 2019-2024
  • Others - Market size and forecast 2019-2024
  • Market opportunity by end-user

PART 09: GEOGRAPHIC LANDSCAPE

  • Geographic segmentation
  • Geographic comparison
  • Americas - Market size and forecast 2019-2024
  • APAC - Market size and forecast 2019-2024
  • EMEA - Market size and forecast 2019-2024
  • Key leading countries
  • Market opportunity

PART 10: DECISION FRAMEWORK

PART 11: DRIVERS AND CHALLENGES

  • Market drivers
  • Market challenges

PART 12: MARKET TRENDS

  • Technology development in hydraulic fracturing process
  • Innovation at frac sites to reduce wastage
  • Commoditization of LNG

PART 13: VENDOR LANDSCAPE

  • Overview
  • Landscape disruption
  • Competitive scenario

PART 14: VENDOR ANALYSIS

  • Vendors covered
  • Vendor classification
  • Market positioning of vendors
  • BP Plc
  • Chevron Corp.
  • ConocoPhillips Co.
  • Exxon Mobil Corp.
  • PetroChina Co. Ltd.
  • PJSC Gazprom
  • Royal Dutch Shell Plc
  • Santos Ltd.
  • Saudi Arabian Oil Co.
  • YPF SA

PART 15: APPENDIX

  • Research methodology
  • List of abbreviations
  • Definition of market positioning of vendors

PART 16: EXPLORE TECHNAVIO

About Us

Technavio is a leading global technology research and advisory company. Their research and analysis focuses on emerging market trends and provides actionable insights to help businesses identify market opportunities and develop effective strategies to optimize their market positions. With over 500 specialized analysts, Technavio’s report library consists of more than 17,000 reports and counting, covering 800 technologies, spanning across 50 countries. Their client base consists of enterprises of all sizes, including more than 100 Fortune 500 companies. This growing client base relies on Technavio’s comprehensive coverage, extensive research, and actionable market insights to identify opportunities in existing and potential markets and assess their competitive positions within changing market scenarios.


Contacts

Technavio Research
Jesse Maida
Media & Marketing Executive
US: +1 844 364 1100
UK: +44 203 893 3200
Email: This email address is being protected from spambots. You need JavaScript enabled to view it.
Website: www.technavio.com/

Banking and financial services company collaborates with Ameresco to install renewable energy assets and accelerate the transition to a low-carbon economy

FRAMINGHAM, Mass.--(BUSINESS WIRE)--#constructionloanfacility--Ameresco, Inc., (NYSE: AMRC), a leading energy efficiency and renewable energy company, today announced it has closed a construction loan facility for up to $30 million to finance solar projects and assets.


The financing was secured through a construction loan facility from Fifth Third Bank, National Association. This non-recourse facility allows Ameresco to draw loan proceeds for solar projects in construction as a bridge to their permanent financing or sale upon commercial operation.

“This innovative facility represents a flexible source of construction capital for our solar assets,” said Doran Hole, chief financial officer of Ameresco. “Fifth Third has demonstrated its continued confidence in renewables and Ameresco’s ability to move projects forward despite challenging times.”

“This financing highlights the continued growth of the solar market, and Fifth Third’s commitment to the renewable energy industry,” said Eric Cohen, group head of Renewable Energy Finance at Fifth Third Bank, N.A. “As a financer in the industry since 2012, Fifth Third is proud to help clients across the country access capital and achieve their objectives.”

To learn more about the solar energy solutions Ameresco offers, visit www.ameresco.com/solution-solar-power/.

About Ameresco, Inc.

Founded in 2000, Ameresco, Inc. (NYSE:AMRC) is a leading independent provider of comprehensive services, energy efficiency, infrastructure upgrades, asset sustainability and renewable energy solutions for businesses and organizations throughout North America and Europe. Ameresco’s sustainability services include upgrades to a facility’s energy infrastructure and the development, construction and operation of renewable energy plants. Ameresco has successfully completed energy saving, environmentally responsible projects with Federal, state and local governments, healthcare and educational institutions, housing authorities, and commercial and industrial customers. With its corporate headquarters in Framingham, MA, Ameresco has more than 1,000 employees providing local expertise in the United States, Canada, and the United Kingdom. For more information, visit www.ameresco.com.

The announcement of the entry into a construction loan facility is not necessarily indicative of future availability of borrowings under such facility or of trends in the company’s overall access to financing. This facility was reflected in the company’s financial statements as of and for the period ended September 30, 2020.


Contacts

Ameresco: Leila Dillon, 508-661-2264, This email address is being protected from spambots. You need JavaScript enabled to view it.

DUBLIN--(BUSINESS WIRE)--The "Ethiopia Energy Requirements Forecasted to 2050" report has been added to ResearchAndMarkets.com's offering.


The outlook for this report is from 2020 to 2050 integrating all end user energy carrier generation outputs into a coherent energy mix to meet the needs of an increasingly urbanised population and growing economy.

The primary energy carriers in Ethiopia are all analysed and forecasted. The economic effects of the Covid-19 pandemic, particularly on energy production and consumption, are analysed extensively in the report.

Key Topics Covered:

  • Scope
  • Methodology
  • Key Findings
  • Introduction
  • Coronavirus Shock
  • World Economic Outlook
  • Sectoral Growth of Energy
  • 2020 Consumption of Energy
  • 2050 Consumption of Energy
  • Glossary and References

Companies Mentioned

  • Ethiopian Electric Power Corporation
  • Universal Electrification Access Program
  • Stiftung Solar Energy Foundation
  • Beshah International Solar and Information Technology
  • Green Light Planet
  • Lydetco Plc
  • Niwa Solar
  • Solartech
  • Azuri Technologies
  • Ethio Resource Group
  • Ministry of Water
  • Irrigation and Electricity
  • Ethiopia Energy Authority
  • Ethiopian Electric Power
  • Ethiopian Rural Energy Development and Promotion Centre
  • Rural Electrification Fund
  • Petroleum Operation Department
  • East African Power Pool
  • Plan International Spain
  • Schneider Electric
  • Statera Capital
  • Sustainable Agriculture Community Development Programme
  • Accenture Development Partnerships

For more information about this report visit https://www.researchandmarkets.com/r/ej0nb6

About ResearchAndMarkets.com

ResearchAndMarkets.com is the world's leading source for international market research reports and market data. We provide you with the latest data on international and regional markets, key industries, the top companies, new products and the latest trends.


Contacts

ResearchAndMarkets.com
Laura Wood, Senior Press Manager
This email address is being protected from spambots. You need JavaScript enabled to view it.
For E.S.T Office Hours Call 1-917-300-0470
For U.S./CAN Toll Free Call 1-800-526-8630
For GMT Office Hours Call +353-1-416-8900

HAMDEN, Conn.--(BUSINESS WIRE)--TransAct Technologies Incorporated (Nasdaq: TACT), a global leader in software-driven technology and printing solutions for high-growth markets, today announced Bart Shuldman, Chairman and Chief Executive Officer will participate in the virtual Southwest IDEAS Investor Conference on November 18, 2020. TransAct Technologies’ presentation will be webcasted and is scheduled to be available at 7:00 am CST on November 18th. The presentation can be accessed through the Southwest IDEAS conference portal for registered participants, in the investor relations section of the Company's website: visit www.transact-tech.com, and on the IDEAS conference website: www.IDEASconferences.com.

About IDEAS Investor Conferences

The mission of the IDEAS Conferences is to provide independent regional venues for quality companies to present their investment merits to an influential audience of investment professionals. Unlike traditional bank-sponsored events, IDEAS Investor Conferences are “Sponsored BY the Buyside FOR the Buyside” and for the benefit of regional investment communities. Conference sponsors collectively have more than $200 billion in assets under management and include: Adirondack Research and Management, Allianz Global Investors: NFJ Investment Group, Ariel Investments, Aristotle Capital Boston, Barrow Hanley Mewhinney & Strauss, BMO Global Asset Management, Constitution Research & Management, Inc., Fidelity Investments, First Wilshire Securities Management, Inc., Gamco Investors, Granahan Investment Management, Great Lakes Advisors, Greenbrier Partners Capital Management, LLC, GRT Capital Partners, LLC, Hodges Capital Management, Ironwood Investment Management, Keeley Teton Advisors, Luther King Capital Management, Marble Harbor Investment Counsel, Perritt Capital Management, Punch & Associates, Westwood Holdings Group, Inc., and William Harris Investors.

The IDEAS Investor Conferences are held annually in Boston, Chicago and Dallas and are produced by Three Part Advisors, LLC. Additional information about the events can be located at www.IDEASconferences.com.

If interested in participating or learning more about the IDEAS conferences, please contact Lacey Wesley at (817) 769 -2373 or This email address is being protected from spambots. You need JavaScript enabled to view it..

About TransAct Technologies Incorporated

TransAct Technologies Incorporated is a global leader in developing software-driven technology and printing solutions for high-growth markets including restaurant solutions, POS automation, casino and gaming, and oil and gas. The Company’s solutions are designed from the ground up based on customer requirements and are sold under the BOHA!™, AccuDate™, EPICENTRAL®, Epic®, Ithaca® and Printrex® brands. TransAct has sold over 3.3 million printers and terminals around the world and is committed to providing world-class service, spare parts and accessories to support its installed product base. Through the TransAct Services Group, the Company also provides customers with a complete range of supplies and consumable items both online at http://www.transactsupplies.com and through its direct sales team. TransAct is headquartered in Hamden, CT. For more information, please visit http://www.transact-tech.com or call (203) 859-6800.

BOHA! is a trademark of TRANSACT Technologies Incorporated. ©2020 TRANSACT Technologies Incorporated. All rights reserved.


Contacts

Investor Contact:
Steve DeMartino
President and Chief Financial Officer
TransAct Technologies Incorporated
203-859-6810

Michael Bowen
ICR, Inc.
This email address is being protected from spambots. You need JavaScript enabled to view it.
203-682-8299

Marc P. Griffin
ICR, Inc.
This email address is being protected from spambots. You need JavaScript enabled to view it.
646-277-1290

- Revenues of $132.5 million

- Net income of $34.7 million, a $91.7 million improvement

- Adjusted EBITDA of $25.6 million with adjusted EBITDA margin of 19.3%

- Diluted EPS improved to $0.69, compared to $(1.39)

- Quarterly bookings increased 106% compared to third quarter 2019, and increased 111% sequentially

- The above results include the recognition of a $26.0 million loss recovery settlement related to certain historical EPC loss contracts

AKRON, Ohio--(BUSINESS WIRE)--$BW #BabcockWilcox--Babcock & Wilcox Enterprises, Inc. ("B&W" or the "Company") (NYSE: BW) reported financial results for the third quarter ended September 30, 2020.

Management Commentary

“Our third quarter results improved significantly, driven by a loss recovery from our historical European EPC loss projects, and reflecting the ongoing execution of our turnaround strategy," said Kenneth Young, B&W's CEO. "Despite the challenges presented by COVID-19 and its impact on revenues across our segments, adjusted EBITDA was roughly break-even for the quarter before the benefit of the loss recovery, demonstrating the benefits of our cost-savings initiatives. Our rebranding initiative announced in August, coupled with our reorganization and international expansion, is accelerating our growth and drove our bookings of $177 million in the quarter, an improvement of 106% compared to the third quarter of 2019. Our pipeline of over $5 billion of identified project opportunities that we expect to bid through 2023 continues to strengthen, and the expansion of our international presence is progressing as planned."

 “While COVID-19 impacted all of our segments in the third quarter, a number of projects that were previously delayed or deferred due to the pandemic are restarting," Young added. "We continue meeting customer and market needs by providing technology solutions to help achieve a clean, sustainable energy and industrial infrastructure. This includes our broad suite of advanced renewable, environmental and thermal technologies, such as high-performance waste-to-energy systems, innovative submerged grind conveyor systems, and flexible natural gas-fired package boilers, as well as strategic partnerships to accelerate advanced energy storage solutions."

Louis Salamone, B&W's CFO, commented: "As an essential business, we continue to focus on supporting our customers and driving our growth strategy while continuing to manage our costs and cash flow through the global pandemic. While we can't fully predict the evolving impacts of COVID-19, based on the current strength of our bookings, pipeline and information from our customers, as well as current assumptions regarding the impacts of COVID-19 on our business, we continue to target between $70 million and $80 million of adjusted EBITDA in 2021."

New Segment Financial Reporting

Beginning with the third quarter of 2020, B&W is reporting its financial results under three new reportable segments aligned with the Company's strategic, market-focused organizational and rebranding initiative announced this past August to accelerate growth and provide stakeholders with improved visibility into its renewable and environmental growth platforms. Segment results for prior periods have been restated for comparative purposes.

  • B&W Renewable segment: Cost-effective technologies for efficient and environmentally sustainable power and heat generation, including waste-to-energy, biomass energy and black liquor systems for the pulp and paper industry. The segment's leading technologies support a circular economy, diverting waste from landfills to use for power generation and replacing fossil fuels, while recovering metals and reducing emissions.
  • B&W Environmental segment: A full suite of best-in-class emissions control and environmental technology solutions for utility and industrial steam generation applications around the world. The segment's broad experience includes systems for cooling, ash handling, particulate control, nitrogen oxides and sulfur dioxides removal, chemical looping for carbon control, and mercury control.
  • B&W Thermal segment: Steam generation equipment, aftermarket parts, construction, maintenance and field services for plants in the power generation, oil and gas, and industrial sectors. The segment has an extensive global base of installed equipment for utilities and general industrial applications including refining, petrochemical, food processing, metals and others.

Results of Operations

Consolidated revenues in the third quarter of 2020 were $132.5 million compared to $198.6 million in the third quarter of 2019. The Company's focus on core technologies and profitability, combined with the adverse impacts of COVID-19, were the primary drivers of the revenue decline.

GAAP operating income in the third quarter of 2020 was $14.1 million, including the impact of a non-recurring loss recovery of $26.0 million recognized in the B&W Renewable segment under an October 10, 2020 settlement agreement with an insurer in connection with five of the six historical European EPC loss contracts, compared to an operating loss of $3.2 million in the third quarter of 2019. The increase was partially offset by lower volume in each of the segments and customer delays as a result of COVID-19, as well as restructuring and settlement costs and advisory fees of $6.2 million. GAAP net income was $34.7 million, a $91.7 million improvement compared to third quarter 2019, primarily driven by the non-recurring loss recovery and favorable foreign exchange effects, partially offset by lower interest expense. Adjusted EBITDA improved to $25.6 million compared to $10.1 million in the third quarter of 2019.

All amounts referred to in this release are on a continuing operations basis, unless otherwise noted. Reconciliations of operating income, the most directly comparable GAAP measure, to adjusted EBITDA, as well as to adjusted gross profit for the Company's segments, are provided in the exhibits to this release.

Babcock & Wilcox Renewable segment revenues were $39.1 million in the third quarter of 2020 compared to $51.3 million in the third quarter of 2019 due to new anticipated revenues being deferred due to COVID-19, as well as the advanced completion of activities on the historical EPC loss projects compared to the third quarter of 2019. Adjusted EBITDA in the third quarter of 2020 was $23.6 million compared to $(0.6) million in last year's quarter, primarily due to the aforementioned non-recurring loss recovery of $26.0 million, partially offset by lower volume. The segment's adjusted gross profit was $32.1 million in the third quarter of 2020 compared to $6.6 million reported in the third quarter of 2019, primarily driven by the loss recovery, partially offset by lower volume.

Babcock & Wilcox Environmental segment revenues were $25.3 million in the third quarter of 2020 compared to $45.0 million in the third quarter of 2019. The decrease was primarily due to the completion of large construction projects in the prior year and the postponement of new projects by customers as a result of COVID-19. Adjusted EBITDA was $1.1 million compared to $1.8 million in the same period last year, driven primarily by the impact of COVID-19 and lower volume. Adjusted gross profit declined to $5.9 million in the third quarter of 2020, compared to $9.0 million in the prior-year period, primarily due to the decrease in revenue partially offset by favorable product mix. At September 30, 2020, the segment had two remaining significant loss contracts, previously reported as part of B&W SPIG's U.S. entity. The first was approximately 100% complete at the end of the third quarter of 2020 with only performance testing remaining, which is expected to be completed in the fourth quarter of 2020. The second was approximately 97% complete at the end of the third quarter of 2020 and is expected to be completed in the fourth quarter of 2020.

Babcock & Wilcox Thermal segment revenues were $70.0 million for the third quarter of 2020, compared to $108.2 million in the prior-year period. The decrease is attributable to the adverse impacts of COVID-19 resulting in customer delays and lower parts, construction, package boilers and international service orders. Adjusted EBITDA in the quarter declined to $7.3 million compared to $12.9 million in the third quarter last year, primarily due to the decrease in revenue volume. This was partially offset by the results of costs savings and restructuring initiatives. Adjusted EBITDA margin was 10.4% in the quarter as compared to 11.9% in the same period last year. Adjusted gross profit in the third quarter of 2020 was $20.6 million compared to $25.6 million in the prior-year period, consistent with the decrease in Adjusted EBITDA. Adjusted gross profit margin was 29.5% compared to 23.7% in the same period last year, primarily due to favorable product mix and the benefits of costs savings and restructuring initiatives.

Financing, Liquidity and Balance Sheet

At September 30, 2020, the Company had cash and cash equivalents of $38.9 million and borrowing availability of $23.1 million.

On October 23, 2020, the Company received $26.0 million from an insurer through a previously disclosed loss recovery settlement. As required by the Company’s U.S. Revolving Credit Facility, 50% of the net proceeds, or approximately $8 million, of the settlement received by the Company was applied as a permanent reduction of the U.S. Revolving Credit Facility.

In addition, as previously disclosed, on October 30, 2020, the Company entered into an amendment of its Credit Agreement to provide, among other matters, that with respect to any prepayment event, the commitment reduction amount shall be only an amount equal to 50% of the net cash proceeds of such prepayment event, and also established, as required by the terms of the Credit Agreement, new financial covenants of interest coverage ratios and senior leverage ratios.

The Company is continuing to pursue cost recoveries from responsible subcontractors for the B&W Renewable segment's European EPC loss contracts. The Company also continues to evaluate additional opportunities for cost savings and potential dispositions as appropriate.

Earnings Call Information

B&W plans to host a conference call and webcast on Thursday, November 12, 2020 at 8:30 a.m. ET. to discuss the Company’s third quarter 2020 results. The listen-only audio of the conference call will be broadcast live via the Internet on B&W’s Investor Relations site. The dial-in number for participants in the U.S. is (833) 227-5843; the dial-in number for participants outside the U.S. is (647) 689-4070. The conference ID for all participants is 4193759. A replay of this conference call will remain accessible in the investor relations section of the Company's website for a limited time.

COVID-19 Impact

The global COVID-19 pandemic has disrupted business operations, trade, commerce, financial and credit markets, and daily life throughout the world. The Company's business has been, and continues to be, adversely impacted by the measures taken and restrictions imposed in the locations in which it operates by local governments and others to control the spread of this virus. These measures and restrictions have varied widely and have been subject to significant changes from time to time depending on the changes in the severity of the virus in these locations. These restrictions, including travel restrictions and curtailment of other activity, negatively impact the Company's ability to conduct business. Although some of these restrictions have been lifted or scaled back, a recent resurgence of COVID-19 has resulted in the reimposition of certain restrictions and may lead to other restrictions being implemented in response to efforts to reduce the spread of the virus. These varying and changing events have caused many of the projects the Company anticipated to begin in 2020 to be delayed to later in 2020 and others to be delayed further into 2021 and 2022. Many customers and projects require B&W's employees to travel to customer and project worksites. Certain customers and significant projects are located in areas where travel restrictions have been imposed, certain customers have closed or reduced on-site activities, and timelines for completion of certain projects have, as noted above, been extended into next year and beyond. Additionally, out of concern for the Company's employees, even where restrictions permit employees to return to Company offices and worksites, the Company has advised those who are uncomfortable returning to worksites due to the pandemic that they are not required to do so for an indefinite period of time. The resulting uncertainty concerning, among other things, the spread and economic impact of the virus has also caused significant volatility and, at times, illiquidity in global equity and credit markets. As part of the Company’s recent response to the impact of the COVID-19 pandemic on its business, the Company has taken a number of cash conservation and cost reduction measures. At the time of this release, it is impossible to predict the overall impact the pandemic will have on the Company's business, liquidity, capital resources or financial results. More detail can be found in the Company's Form 10-Q for the third quarter of 2020.

Non-GAAP Financial Measures

The Company uses non-GAAP financial measures internally to evaluate its performance and in making financial and operational decisions. When viewed in conjunction with GAAP results and the accompanying reconciliation, the Company believes that its presentation of these measures provides investors with greater transparency and a greater understanding of factors affecting our financial condition and results of operations than GAAP measures alone.

This release presents adjusted gross profit for each business segment and adjusted EBITDA, which are non-GAAP financial measures. Adjusted EBITDA on a consolidated basis is defined as the sum of the adjusted EBITDA for each of the segments, further adjusted for corporate allocations and research and development costs. At a segment level, the adjusted EBITDA presented is consistent with the way the Company's chief operating decision maker reviews the results of operations and makes strategic decisions about the business and is calculated as earnings before interest, tax, depreciation and amortization adjusted for items such as gains or losses on asset sales, mark to market ("MTM") pension adjustments, restructuring and spin costs, impairments, losses on debt extinguishment, costs related to financial consulting required under the U.S. Revolving Credit Facility and other costs that may not be directly controllable by segment management and are not allocated to the segment. The Company presented consolidated Adjusted EBITDA because it believes it is useful to investors to help facilitate comparisons of the ongoing, operating performance before corporate overhead and other expenses not attributable to the operating performance of the Company's revenue generating segments. This release also presents certain targets for our adjusted EBITDA in the future; these targets are not intended as guidance regarding how the Company believes the business will perform. The Company is unable to reconcile these targets to their GAAP counterparts without unreasonable effort and expense due to the aspirational nature of these targets.

This release also presents adjusted gross profit by segment. The Company believes that adjusted gross profit by segment is useful to investors to help facilitate comparisons of the ongoing, operating performance of the segments by excluding expenses related to, among other things, activities related to the spin-off, activities related to various restructuring activities the Company has undertaken, corporate overhead (such as SG&A expenses and research and development costs) and certain non-cash expenses such as intangible amortization and goodwill impairments that are not allocated by segment.

Forward-Looking Statements

B&W Enterprises cautions that this release contains forward-looking statements, including, without limitation, statements relating to the application of the proceeds of the term loans under the Agreement, and management expectations regarding future growth and our ability to achieve sustained value for our shareholders. These forward-looking statements are based on management’s current expectations and involve a number of risks and uncertainties, including, among other things, the impact of COVID-19 on us and the capital markets and global economic climate generally; our recognition of any asset impairments as a result of any decline in the value of our assets or our efforts to dispose of any assets in the future; our ability to obtain and maintain sufficient financing to provide liquidity to meet our business objectives, surety bonds, letters of credit and similar financing; our ability to comply with the requirements of, and to service the indebtedness under, our credit agreement as amended and restated (the "A&R" Credit Agreement"); our ability to obtain waivers of required pension contributions; the highly competitive nature of our businesses and our ability to win work, including identified project opportunities in our pipeline; general economic and business conditions, including changes in interest rates and currency exchange rates; cancellations of and adjustments to backlog and the resulting impact from using backlog as an indicator of future earnings; our ability to perform contracts on time and on budget, in accordance with the schedules and terms established by the applicable contracts with customers; failure by third-party subcontractors, partners or suppliers to perform their obligations on time and as specified; our ability to successfully resolve claims by vendors for goods and services provided and claims by customers for items under warranty; our ability to realize anticipated savings and operational benefits from our restructuring plans, and other cost-savings initiatives; our ability to successfully address productivity and schedule issues in our B&W Renewable and B&W Environmental segments, including the ability to complete our B&W Renewable's European EPC projects and B&W Environmental's U.S. loss projects within the expected time frame and the estimated costs; our ability to successfully partner with third parties to win and execute contracts within our B&W Environmental and B&W Renewable segments; changes in our effective tax rate and tax positions, including any limitation on our ability to use our net operating loss carryforwards and other tax assets; our ability to maintain operational support for our information systems against service outages and data corruption, as well as protection against cyber-based network security breaches and theft of data; our ability to protect our intellectual property and renew licenses to use intellectual property of third parties; our use of the percentage-of-completion method of accounting to recognize revenue over time; our ability to successfully manage research and development projects and costs, including our efforts to successfully develop and commercialize new technologies and products; the operating risks normally incident to our lines of business, including professional liability, product liability, warranty and other claims against us; changes in, or our failure or inability to comply with, laws and government regulations; actual or anticipated changes in governmental regulation, including trade and tariff policies; difficulties we may encounter in obtaining regulatory or other necessary permits or approvals; changes in, and liabilities relating to, existing or future environmental regulatory matters; changes in actuarial assumptions and market fluctuations that affect our net pension liabilities and income; potential violations of the Foreign Corrupt Practices Act; our ability to successfully compete with current and future competitors; the loss of key personnel and the continued availability of qualified personnel; our ability to negotiate and maintain good relationships with labor unions; changes in pension and medical expenses associated with our retirement benefit programs; social, political, competitive and economic situations in foreign countries where we do business or seek new business; the possibilities of war, other armed conflicts or terrorist attacks; the willingness of customers and suppliers to continue to do business with us on reasonable terms and conditions; our ability to successfully consummate strategic alternatives for non-core assets, if we determine to pursue them; and the other factors specified and set forth under "Risk Factors" in our periodic reports filed with the Securities and Exchange Commission, including our most recent annual report on Form 10-K and our quarterly report on Form 10-Q for the quarter ended September 30, 2020. The Company cautions not to place undue reliance on these forward-looking statements, which speak only as of the date of this report, and the Company undertakes no obligation to update or revise any forward-looking statement, except to the extent required by applicable law.

About B&W Enterprises

Headquartered in Akron, Ohio, Babcock & Wilcox Enterprises is a global leader in energy and environmental technologies and services for the power and industrial markets. Follow B&W on LinkedIn and learn more at www.babcock.com.

Exhibit 1

Babcock & Wilcox Enterprises, Inc.

Condensed Consolidated Statements of Operations(1)

(In millions, except per share amounts)


Three months ended
September 30,


Nine months ended
September 30,


2020

2019


2020

2019

Revenues

$

132.5


$

198.6


$

416.5


$

678.7


Costs and expenses:


Cost of operations

75.2


158.3


292.7


563.2


Selling, general and administrative expenses

35.7


36.0


107.9


120.4


Advisory fees and settlement costs

3.8


4.5


10.1


22.9


Restructuring activities

2.4


2.6


6.7


9.6


Research and development costs

1.4


0.8


3.9


2.3


Gain on asset disposals, net


(0.3

)


(0.9

)

(0.2

)

Total costs and expenses

118.4


201.8


420.4


718.1


Operating income (loss)

14.1


(3.2

)


(3.9

)

(39.4

)

Other (expense) income:


Interest expense

(12.2

)

(29.5

)


(49.8

)

(67.4

)

Interest income

0.2


0.1


0.4


0.9


Loss on debt extinguishment


(6.2

)

(4.0

)

Loss on sale of business


(0.1

)

(3.6

)

Benefit plans, net

7.3


3.6


22.3


9.1


Foreign exchange

25.0


(26.7

)


22.7


(27.4

)

Other – net

(0.3

)

(0.3

)


(3.1

)

0.2


Total other income (expense)

20.0


(52.8

)


(13.7

)

(92.2

)

Income (loss) before income tax
(benefit) expense

34.1


(55.9

)


(17.6

)

(131.6

)

Income tax (benefit) expense

(0.5

)

1.0


(0.5

)

3.6


Income (loss) from continuing
operations

34.6


(57.0

)


(17.1

)

(135.2

)

Income from discontinued operations, net of tax


1.8


0.7


Net income (loss)

34.6


(57.0

)


(15.3

)

(134.5

)

Net loss attributable to non-controlling interest

0.2


0.4


0.1


Net income (loss) attributable to
stockholders

$

34.7


$

(57.0

)


$

(14.9

)

$

(134.4

)


Basic earnings (loss) per share - continuing
operations

$

0.70


$

(1.39

)


$

(0.35

)

$

(5.21

)

Basic earnings per share - discontinued operations


0.04


0.03


Basic earnings (loss) per share

$

0.70


$

(1.39

)


$

(0.31

)

$

(5.18

)


Diluted earnings (loss) per share - continuing
operations

$

0.69


$

(1.39

)


$

(0.35

)

$

(5.21

)

Diluted earnings per share - discontinued
operations


0.04


0.03


Diluted earnings (loss) per share

$

0.69


$

(1.39

)


$

(0.31

)

$

(5.18

)


Shares used in the computation of earnings per share:


Basic

49.5


40.9


47.6


26.0


Diluted

50.1


40.9


47.6


26.0


Contacts

Investors:
Megan Wilson
Vice President, Corporate Development & Investor Relations
Babcock & Wilcox Enterprises
704.625.4944 | This email address is being protected from spambots. You need JavaScript enabled to view it.

Media:
Ryan Cornell
Public Relations
Babcock & Wilcox Enterprises
330.860.1345 | This email address is being protected from spambots. You need JavaScript enabled to view it.


Read full story here

TULSA, Okla.--(BUSINESS WIRE)--Transcontinental Gas Pipe Line Company, LLC (“Transco”), a wholly owned subsidiary of The Williams Companies, Inc. (NYSE: WMB), announced today that it has commenced an offer to exchange any and all of its $700 million in aggregate principal amount of outstanding 3.250 percent Senior Notes due 2030 (the “Original 2030 Notes”) and $500 million in aggregate principal amount of outstanding 3.950 percent Senior Notes due 2050 (the “Original 2050 Notes” and, together with the Original 2030 Notes, the “Original Notes”) for an equal amount of the applicable series of its registered 3.250 percent Senior Notes due 2030 (the “2030 Exchange Notes”) and 3.950 percent Senior Notes due 2050 (the “2050 Exchange Notes” and, together with the 2030 Exchange Notes, the “Exchange Notes”).


The terms of the Exchange Notes are identical in all material respects to those of the applicable series of the Original Notes, except that the Exchange Notes have been registered under the Securities Act of 1933, as amended, and the transfer restrictions, restrictive legends, registration rights and additional interest provisions relating to the Original Notes do not apply to the Exchange Notes. The purpose of the Exchange Offer is to fulfill Transco’s obligations under the registration rights agreement entered into in connection with the issuance of the Original Notes. Transco will not receive any proceeds from the exchange offer.

The exchange offer will expire at 5:00 p.m. Eastern Standard Time (EST) on December 11, 2020, unless extended (such date and time, as may be extended, the “Expiration Date”). The settlement date for the exchange offer will occur promptly following the Expiration Date. The terms of the exchange offer and other information relating to Transco and the Exchange Notes are set forth in a prospectus dated November 12, 2020, a copy of which has been filed with the Securities and Exchange Commission. Transco has not authorized any person to provide information other than as set forth in the prospectus.

Copies of the prospectus and the transmittal letter governing the exchange offer can be obtained from the exchange agent, The Bank of New York Mellon Trust Company, N.A., by faxing a request to (732) 667-9408 or by writing via regular or certified mail, or overnight courier, to The Bank of New York Mellon Trust Company, N.A., Corporate Trust Operations—Reorganization Unit, 111 Sanders Creek Parkway, East Syracuse, New York 13057, Attn: Tiffany Castor.

This press release is for informational purposes only and does not constitute an offer to sell nor a solicitation of an offer to buy any security. The exchange offer is being made solely pursuant to the prospectus dated November 12, 2020, including any supplements thereto, and only to such persons and in such jurisdictions as is permitted under applicable law.

About Williams

Williams (NYSE: WMB) is committed to being the leader in providing infrastructure that safely delivers natural gas products to reliably fuel the clean energy economy. Headquartered in Tulsa, Oklahoma, Williams is an industry-leading, investment grade C-Corp with operations across the natural gas value chain including gathering, processing, interstate transportation and storage of natural gas and natural gas liquids. With major positions in top U.S. supply basins, Williams connects the best supplies with the growing demand for clean energy. Williams owns and operates more than 30,000 miles of pipelines system wide – including Transco, the nation’s largest volume and fastest growing pipeline – and handles approximately 30 percent of the natural gas in the United States that is used every day for clean-power generation, heating and industrial use.

Portions of this document may constitute “forward-looking statements” as defined by federal law. Although Transco believes any such statements are based on reasonable assumptions, there is no assurance that actual outcomes will not be materially different. Additional information about issues that could lead to material changes in performance is contained in Transco’s annual and quarterly reports filed with the Securities and Exchange Commission.


Contacts

MEDIA:
This email address is being protected from spambots. You need JavaScript enabled to view it.
(800) 945-8723

INVESTOR CONTACTS:
Danilo Juvane
(918) 573-5075

BOGOTA, Colombia--(BUSINESS WIRE)--GeoPark Limited (“GeoPark” or the “Company”) (NYSE: GPRK), a leading independent Latin American oil and gas explorer, operator and consolidator with operations and growth platforms in Colombia, Ecuador, Chile, Brazil and Argentina today announced the successful testing of the Indico 2 appraisal well in the CPO-5 block (GeoPark non-operated, 30% WI1) in Colombia.


The operator ONGC Videsh drilled and completed the Indico 2 appraisal well to a total depth of 10,925 feet. A test conducted through natural flow in the Une (LS3) sandstone formation resulted in a production rate of approximately 5,500 bopd2 of 35.2 degrees API, with a 0.1% water cut, through a choke of 40/64 inches and wellhead pressure of 330 pounds per square inch. Additional production history is required to determine stabilized flow rates of the well. Surface testing facilities are in place and the well is already in production.

The Indico 2 well was drilled to a bottom-hole location approximately 0.8 km northwest and 151 feet downdip of the Indico 1X well, with a net pay of approximately 161 feet.

Considering Brent of $40-45 per bbl and current production rates, the well is expected to have a payback period of less than three months.

The Indico light oil field was discovered in December 2018 and to date, continues showing strong reservoir performance from the Indico 1X well, that is currently producing 5,200 bopd with no water, with a cumulative production of over 3 million barrels of oil.

The drilling rig in the CPO-5 block is currently moving to the Aguila exploration prospect, located approximately 4.9 km southeast of the Indico oil field, which will be spudded in late November 2020. Aguila is a multi-target exploration prospect with the Une (LS3) formation as the main objective (an analogue of the existing and producing Mariposa and Indico fields) and also looking for hydrocarbon potential in the Guadalupe and Gacheta formations.

Further exploration, appraisal and development activities are budgeted to continue in the CPO-5 block in 2021 (mostly concentrated within the 1H2021) with the drilling of 5-6 gross wells plus the acquisition of 336 square kilometers of 3D seismic, as part of GeoPark’s fully funded and flexible work and investment program.

CPO-5 is a large block covering 0.5 million acres, and offers multi-play, low cost development, appraisal and exploration opportunities. It is located to the southwest and is adjacent to and on trend with the Llanos 34 block (GeoPark operated, 45% WI), where GeoPark has discovered more than 4003 million barrels of recoverable oil and has produced more than 100 million barrels of oil during the past eight years.

James F. Park, Chief Executive Officer of GeoPark, said: “It is great to begin drilling on this large high potential CPO-5 block and great to see the positive results starting to come in. Not only is this block rich in hydrocarbons – with four mapped oil plays in the Mirador, Guadalupe, Gacheta and Une (LS3) formations – but the associated economics and cycle times are industry-leading even under the lowest oil price scenarios. We are very pleased to be working with our partners ONGC Videsh on this block and congratulate them for successfully executing and carrying out this important operation.”

NOTICE

Additional information about GeoPark can be found in the “Investor Support” section on the website at www.geo-park.com.

Rounding amounts and percentages: Certain amounts and percentages included in this press release have been rounded for ease of presentation. Percentage figures included in this press release have not in all cases been calculated on the basis of such rounded figures, but on the basis of such amounts prior to rounding. For this reason, certain percentage amounts in this press release may vary from those obtained by performing the same calculations using the figures in the financial statements. In addition, certain other amounts that appear in this press release may not sum due to rounding.

CAUTIONARY STATEMENTS RELEVANT TO FORWARD-LOOKING INFORMATION

This press release contains statements that constitute forward-looking statements. Many of the forward looking statements contained in this press release can be identified by the use of forward-looking words such as ‘‘anticipate,’’ ‘‘believe,’’ ‘‘could,’’ ‘‘expect,’’ ‘‘should,’’ ‘‘plan,’’ ‘‘intend,’’ ‘‘will,’’ ‘‘estimate’’ and ‘‘potential,’’ among others.

Forward-looking statements that appear in a number of places in this press release include, but are not limited to, statements regarding the intent, belief or current expectations, regarding various matters, including the drilling plan, payback period and oil production. Forward-looking statements are based on management’s beliefs and assumptions, and on information currently available to the management. Such statements are subject to risks and uncertainties, and actual results may differ materially from those expressed or implied in the forward-looking statements due to various factors.

Forward-looking statements speak only as of the date they are made, and the Company does not undertake any obligation to update them in light of new information or future developments or to release publicly any revisions to these statements in order to reflect later events or circumstances, or to reflect the occurrence of unanticipated events. For a discussion of the risks facing the Company that could affect whether these forward-looking statements are realized, see filings with the U.S. Securities and Exchange Commission.

1 Through GeoPark’s 100% ownership in Petrodorado South America S.A. Sucursal Colombia (Colombia).

2 Corresponds to an average production rate through a choke of 40/64 inches for approximately 12 hours.

3 Based on proved, probable and possible PRMS reserves, DeGolyer and MacNaughton (D&M) 2019.


Contacts

INVESTORS:

Stacy Steimel
T: +562 2242 9600
This email address is being protected from spambots. You need JavaScript enabled to view it.

Miguel Bello
T: +562 2242 9600
This email address is being protected from spambots. You need JavaScript enabled to view it.

Diego Gully
T: +5411 4312 9400
This email address is being protected from spambots. You need JavaScript enabled to view it.

MEDIA:

Communications Department
This email address is being protected from spambots. You need JavaScript enabled to view it.

GeoPark can be visited online at www.geo-park.com

DALLAS--(BUSINESS WIRE)--Trinity Industries, Inc. (NYSE: TRN) (“Trinity”) announced its plans to enter into a joint venture with Norfolk Southern, GATX Corporation, Genesee & Wyoming and Watco to create a coalition that is expected to accelerate rail modal transformation through the advancement of GPS technology and other telematics across the North American railcar fleet.


The new venture, called RailPulse, is committed to develop new standards and systems infrastructure to support the industry in meeting two key objectives. The first objective is to provide real-time information for enhanced safety through the consistent, reliable provision of key data on railcars across the entire North American fleet to shippers, railcar owners, and railroads. The second objective is to reinforce rail’s competitive modal share position of freight transportation through increased real-time and sustainable visibility into status, location, and condition of rail equipment and the commodities being transported.

“While this coalition is in the early stages of development, we believe these efforts will be a key factor in improving the rail industry’s competitive position,” said Trinity CEO and President, Jean Savage. “We’ve been leveraging artificial intelligence to develop actionable analytics and infrastructure to support the addition of telematics on railcars for nearly two years, and testing the reliability of certain analytics on our own fleet of leased railcars. We believe partnering with other leading rail service providers will accelerate widespread adoption of these technologies across the North American railcar fleet and transform rail shipping in the future.”

The Commonwealth of Pennsylvania, through its Department of Transportation (PennDOT), recently received a Fiscal Year 2020 Consolidated Rail Infrastructure and Safety Improvements grant from the U.S. Department of Transportation for the project. The Commonwealth, along with the rail partners that collectively own 20% of the North American railcar fleet, will provide an additional modest investment.

A full rollout of the RailPulse platform to North American rail shippers is expected by the end of 2022.

“In working with our customers, we have heard consistent feedback that they need greater rail network visibility in order to move more of their freight volume to the railroad,” said Gregg Mitchell, Trinity’s Chief Commercial Officer. “This new platform will empower industry participants, like Trinity, to deliver real-time insights to shippers and other railcar users for better fleet, inventory, and supply chain management. Ultimately, we expect these insights will provide improved satisfaction to shippers and their customers.”

About Trinity Industries
Trinity Industries, Inc., headquartered in Dallas, Texas, owns businesses that are leading providers of rail transportation products and services in North America. Our rail-related businesses market their railcar products and services under the trade name TrinityRail®. The TrinityRail platform provides railcar leasing and management services, as well as railcar manufacturing, maintenance and modifications. Trinity also owns businesses engaged in the manufacture of products used on the nation’s roadways and in traffic control, as well as a logistics business that primarily provides support services to Trinity. Trinity reports its financial results in three principal business segments: the Railcar Leasing and Management Services Group, the Rail Products Group, and the All Other Group. For more information, visit: www.trin.net.


Contacts

Investor Contact:
Jessica L. Greiner
Vice President, Investor Relations and Communications
Trinity Industries, Inc.
(Investors) 214/631-4420

Media Contact:
Jack L. Todd
Vice President, Public Affairs
Trinity Industries, Inc.
(Media Line) 214/589-8909

Gross Profit Rises 47%; New Contracts Announced

LOUISVILLE, Ky.--(BUSINESS WIRE)--$SYPR--Sypris Solutions, Inc. (Nasdaq/GM: SYPR) today reported financial results for its third quarter ended October 4, 2020. Having completed a series of strategic initiatives over the past several years, Sypris Solutions is now well positioned to achieve long-term growth and a return to profitable operations. These steps have included reducing and realigning the Company’s cost structure while diversifying its book of business in terms of both customers and markets.


Results for the third quarter of 2020 fundamentally reflected these expectations, highlighted by a rebound in demand for Sypris Technologies from the unusually low levels of the second quarter and the positive performance of Sypris Electronics. The global economic impact of the COVID-19 pandemic lessened in several of the Company’s markets during the quarter, while the essential nature of the defense and communication programs served by Sypris Electronics continued to enable this segment to sustain operations at or above planned levels.

HIGHLIGHTS

─────────────────────

  • The Company’s third quarter revenue was even with the prior-year period, but increased 29.2% sequentially, reflecting a rebound in market conditions for Sypris Technologies and continued growth for Sypris Electronics.
  • Gross profit increased 47.1% quarter-over-quarter and 70.8% sequentially, while gross margin increased 490 basis points from the prior-year period and 370 basis points sequentially.
  • EPS increased to $0.17 per share for the quarter compared to a loss of $0.07 per share for the prior year, reflecting the 47.1% improvement in gross profit and the release of a valuation allowance on certain foreign deferred tax assets, in consideration of the sustained profitability of and positive outlook for the Company’s operations in Mexico, among other factors.
  • Sypris Electronics revenue increased 52.6% during the quarter compared to the prior-year period, supported by a strong backlog of orders, which has increased 27.2% since year-end 2019, while supporting a 62.0% increase in shipments year-to-date over the prior year.
  • During the third quarter, Sypris Electronics announced an initial contract award from the Leonardo DRS Naval Electronics business unit to manufacture and test electronic assemblies for a shipboard system with production to begin during 2020.
  • Sypris Electronics also announced contracts to manufacture a variety of electronic assemblies for mission-critical munition dispensing systems with production to begin during 2020 and continue into 2021.
  • Sypris Technologies revenue increased 62.1% sequentially, as customers reopened operations that were temporarily idled during the second quarter in response to the global pandemic.
  • Gross profit for Sypris Technologies increased 732.8% sequentially, while gross margin increased to 15.8%, up from 3.1% for the second quarter of 2020.
  • Sypris Technologies announced the award of orders for projects in Brazil and Canada. The contracts, which provide for the use of Ultra High-Pressure closures in the Libra Oil Field deep-water project in Brazil and Double-Bolt closures for use in the Trans Mountain Pipeline Expansion project in Canada, call for shipments to begin prior to year-end 2020.
  • Sypris Technologies also announced a contract for the delivery of 58” Tool-less closures weighing 5.5 tons each for use in the Alberta Xpress Gas project, which will expand transmission capacity from Manitoba to delivery locations in the Midwestern and Southern US. Shipments are to be completed prior to year-end.

─────────────────────

“Our operations performed extremely well during the third quarter and returned to profitability as demand rebounded from the adverse conditions incurred during the second quarter,” commented Jeffrey T. Gill, President and Chief Executive Officer. “In the face of the challenges brought on by the pandemic, our businesses pulled together to protect our employees, while balancing the needs of our customers, communities and business partners during these difficult times. The effort and execution by our people resulted in a strong performance for the third quarter.

“Revenue for Sypris Electronics increased 52.6% from the prior-year quarter, reflecting its strong backlog and improved electronic component availability. Sales are up 62.0% for the first nine months of 2020 compared to the prior year, while backlog has increased 27.2% since year-end. We have been designated as an essential supplier to our customers serving the defense and communications industries and as such, our team has done an excellent job making sure that we were able to provide for their increasing needs during the period.

“Demand from customers serving the automotive, commercial vehicle, sport utility, and off-highway markets recovered in the third quarter, resulting in a 62% increase in revenue sequentially. The outlook going forward has also improved significantly for these markets. Recent contract awards in our energy markets are also expected to contribute in the fourth quarter and early 2021 as we remain vigilant in our pursuit of new opportunities to support our growth objectives in the coming year.

“Gross profit for the first nine months of 2020 was $9.0 million, or 14.6% of revenue as compared to gross margin of 11.2% for the full year 2019. Given the current year-to-date margin performance includes the burden of the pandemic’s impact on the second quarter, we are pleased to be maintaining this trend line. Our margins have improved steadily since 2016 and we believe we have the opportunity to continue this into 2021.

“Sypris Technologies has also been designated as an essential supplier to our customers serving the energy and transportation sectors of our country and as a result, our team will continue to take whatever steps are necessary to ensure that the needs of our customers are reliably met without delay.”

Concluding, Mr. Gill said, “Our customer base and the markets we serve are considerably more diversified than at any point in our recent history. As an essential business, we have a responsibility to ensure that our defense, communications, energy, and transportation sectors remain vibrant. We will continue to monitor developments, act promptly to mitigate the risks and take the necessary steps required to ensure deliveries continue to be made in a timely manner.”

Third Quarter Results

The Company reported revenue of $22.2 million for the third quarter ended October 4, 2020, compared to $22.3 million for the prior-year period. Additionally, the Company reported net income of $3.5 million for the third quarter, or $0.17 per diluted share, compared to a net loss of $1.6 million, or $0.07 per share, for the prior-year period. Results for the quarter ended October 4, 2020, include an income tax benefit of $3.2 million, primarily from the release of a valuation allowance on certain foreign deferred tax assets.

The Company updated its quarterly evaluation on the realizability of deferred tax assets associated with its Mexican operating subsidiary as of October 4, 2020. The Mexico operation’s cumulative income before taxes for the trailing 3-year period ended October 4, 2020, is positive, and together with other positive evidence, supports management’s conclusion that a valuation allowance is no longer needed for the foreign deferred tax assets. The release of the valuation allowance and the impact of deferred tax expense for the nine months ended October 4, 2020, resulted in a net tax benefit of $3.2 million for the third quarter.

For the nine months ended October 4, 2020, the Company reported revenue of $61.7 million compared with $66.3 million for the first nine months of 2019. The Company reported net income for the nine-month period of $2.8 million, or $0.14 per diluted share, compared with a net loss of $3.1 million, or $0.15 per share, for the prior-year period. Results for the nine months ended October 4, 2020, include net gains of $0.8 million from the sale of idle assets and an income tax benefit of $3.2 million, primarily from the release of a valuation allowance on certain foreign deferred tax assets. Results for the nine months ended September 29, 2019, include a gain of $1.5 million in connection with a contract settlement with a customer and net gains of $0.5 million from the sale of idle assets.

Sypris Technologies

Revenue for Sypris Technologies was $12.1 million in the third quarter of 2020 compared to $15.7 million for the prior-year period, primarily reflecting reduced demand attributable to the pandemic coupled with the anticipated cyclical decline in the commercial vehicle market. Gross profit for the third quarter was $1.9 million, or 15.8% of revenue, compared to $2.5 million, or 16.1% of revenue, for the same period in 2019.

Sypris Electronics

Revenue for Sypris Electronics was $10.1 million in the third quarter of 2020 compared to $6.6 million for the prior-year period. Shipments during the third quarter reflected the impact of the growing backlog. Additionally, many of the challenges faced during the prior year with electronic component shortages and extensive lead-times have been resolved. Gross profit for the quarter was $1.5 million, or 15.0% of revenue, compared to a loss of $0.2 million, or 2.8% of revenue, for the same period in 2019.

Outlook

Commenting on the future, Mr. Gill added, “First and foremost, we remain focused on the health and safety of our employees, their families and our customers. While the future potential impact of a second wave of the pandemic remains unknown, demand has strengthened significantly from customers serving the automotive, commercial vehicle and sport utility markets. Similarly, demand from customers in the defense and communications sector remains robust. While the energy market continues to be volatile, we continue to see wins on important large projects around the world.

“As we close out this year and prepare for 2021, we remain focused on meeting the important needs of our customers who serve defense, communications, energy, transportation, and other critical infrastructure industries. With a strong backlog and recovering markets, we believe that the outlook for the coming year has the potential to be one of positive top line growth and further margin expansion for Sypris. We are increasingly optimistic about the coming year.”

Sypris Solutions is a diversified provider of truck components, oil and gas pipeline components and aerospace and defense electronics. The Company produces a wide range of manufactured products, often under multi-year, sole-source contracts. For more information about Sypris Solutions, visit its Web site at www.sypris.com.

Forward Looking Statements

This press release contains “forward-looking” statements within the meaning of the federal securities laws. Forward-looking statements include our plans and expectations of future financial and operational performance. Such statements may relate to projections of the company’s revenue, earnings, and other financial and operational measures, our liquidity, our ability to mitigate or manage disruptions posed by COVID-19, and the impact of COVID-19 and economic conditions on our future operations, among other matters. In March 2020, the President of the United States declared the COVID-19 outbreak a national emergency. COVID-19 continues to spread throughout the United States and other countries across the world, and the duration and severity of its effects are currently unknown. The COVID-19 pandemic has resulted, and is likely to continue to result, in significant economic disruption and has and will likely adversely affect our business. The Company has continued to operate at each location and sought to remain compliant with government regulations imposed due to the COVID-19 pandemic.

Each forward-looking statement herein is subject to risks and uncertainties, as detailed in our most recent Form 10-K and Form 10-Q and other SEC filings. Briefly, we currently believe that such risks also include the following: the impact of COVID-19 and economic conditions on our future operations; possible public policy response to the pandemic, including legislation or restrictions that may impact our operations or supply chain; our failure to successfully complete final contract negotiations with regard to our announced contract “orders”, “wins” or “awards”; our failure to achieve and maintain profitability on a timely basis by steadily increasing our revenues from profitable contracts with a diversified group of customers, which would cause us to continue to use existing cash resources or other assets to fund operating losses; our failure to achieve targeted gains and cash proceeds from the anticipated sale of certain equipment; the fees, costs and supply of, or access to, debt, equity capital, or other sources of liquidity; our ability to comply with the requirements of the SBA and seek forgiveness of all or a portion of the PPP Loan; the cost, quality, timeliness, efficiency and yield of our operations and capital investments, including the impact of tariffs, product recalls or related liabilities, employee training, working capital, production schedules, cycle times, scrap rates, injuries, wages, overtime costs, freight or expediting costs; dependence on, retention or recruitment of key employees and distribution of our human capital; disputes or litigation involving governmental, supplier, customer, employee, creditor, stockholder, product liability or environmental claims; our inability to develop new or improved products or new markets for our products; cost, quality and availability or lead times of raw materials such as steel, component parts (especially electronic components), natural gas or utilities; breakdowns, relocations or major repairs of machinery and equipment, especially in our Toluca Plant; our ability to maintain compliance with the NASDAQ listing standards minimum closing bid price; our reliance on a few key customers, third party vendors and sub-suppliers; inventory valuation risks including excessive or obsolescent valuations or price erosions of raw materials or component parts on hand or other potential impairments, non-recoverability or write-offs of assets or deferred costs; other potential weaknesses in internal controls over financial reporting and enterprise risk management; failure to adequately insure or to identify product liability, environmental or other insurable risks; unanticipated or uninsured disasters, public health crises, losses or business risks; unanticipated or uninsured product liability claims; volatility of our customers’ forecasts, scheduling demands and production levels which negatively impact our operational capacity and our effectiveness to integrate new customers or suppliers, and in turn cause increases in our inventory and working capital levels; the costs of compliance with our auditing, regulatory or contractual obligations; labor relations; strikes; union negotiations; pension valuation, health care or other benefit costs; our inability to patent or otherwise protect our inventions or other intellectual property from potential competitors; adverse impacts of new technologies or other competitive pressures which increase our costs or erode our margins; U.S. government spending on products and services that Sypris Electronics provides, including the timing of budgetary decisions; changes in licenses, security clearances, or other legal rights to operate, manage our work force or import and export as needed; risks of foreign operations; currency exchange rates; war, terrorism, or political uncertainty; cyber security threats and disruptions; inaccurate data about markets, customers or business conditions; or unknown risks and uncertainties. We undertake no obligation to update our forward-looking statements, except as may be required by law.

 
Sypris Solutions, Inc.
Financial Highlights
(In thousands, except per share amounts)
 
Three Months Ended
October 4, September 29,

2020

2019

(Unaudited)
Revenue

$

22,154

$

22,259


Net income (loss)

$

3,495

$

(1,557

)

Income (loss) per common share:
Basic

$

0.17

$

(0.07

)

Diluted

$

0.17

$

(0.07

)

Weighted average shares outstanding:
Basic


21,064


20,941


Diluted


21,080


20,941


Nine Months Ended
October 4, September 29,

2020

2019

(Unaudited)
Revenue

$

61,732

$

66,267


Net income (loss)

$

2,842

$

(3,090

)

Income (loss) per common share:
Basic

$

0.14

$

(0.15

)

Diluted


0.14


(0.15

)

Weighted average shares outstanding:
Basic


21,026


20,829


Diluted


21,026


20,829


Sypris Solutions, Inc.
Consolidated Statements of Operations
(in thousands, except for per share data)
 
Three Months Ended Nine Months Ended
October 4, September 29, October 4, September 29,

2020

2019

2020

2019

(Unaudited) (Unaudited)
Net revenue:
Sypris Technologies

$

12,072


$

15,654


$

33,234


$

48,673


Sypris Electronics


10,082


6,605


28,498


17,594


Total net revenue


22,154


22,259


61,732


66,267


Cost of sales:
Sypris Technologies


10,165


13,140


28,605


40,892


Sypris Electronics


8,568


6,793


24,112


18,200


Total cost of sales


18,733


19,933


52,717


59,092


Gross profit (loss):
Sypris Technologies


1,907


2,514


4,629


7,781


Sypris Electronics


1,514


(188

)


4,386


(606

)

Total gross profit


3,421


2,326


9,015


7,175


Selling, general and administrative


2,577


3,148


8,630


10,206


Severance, relocation and other costs


-


190


124


391


Operating income (loss)


844


(1,012

)


261


(3,422

)

Interest expense, net


216


227


636


676


Other expense (income), net


372


286


(114

)


(1,156

)

Income (loss) before taxes


256


(1,525

)


(261

)


(2,942

)

Income tax (benefit) expense, net


(3,239

)


32


(3,103

)


148


Net Income (loss)

$

3,495


$

(1,557

)

$

2,842


$

(3,090

)

Income (loss) per common share:
Basic

$

0.17


$

(0.07

)

$

0.14


$

(0.15

)

Diluted

$

0.17


$

(0.07

)

$

0.14


$

(0.15

)

Dividends declared per common share

$

-


$

-


$

-


$

-


Weighted average shares outstanding:
Basic


21,064


20,941


21,026


20,829


Diluted


21,080


20,941


21,026


20,829


Sypris Solutions, Inc.
Consolidated Balance Sheets
(in thousands, except for share data)
 
October 4, December 31,

2020

2019

(Unaudited) (Note)
ASSETS
Current assets:
Cash and cash equivalents

$

8,294


$

5,095


Accounts receivable, net


8,603


7,444


Inventory, net


17,844


20,784


Other current assets


4,766


4,282


Assets held for sale


1,069


2,233


Total current assets


40,576


39,838


Property, plant and equipment, net


9,727


11,675


Operating lease right-of-use assets


6,315


7,014


Other assets


4,760


1,529


Total assets

$

61,378


$

60,056


LIABILITIES AND STOCKHOLDERS' EQUITY
Current liabilities:
Accounts payable

$

8,202


$

9,346


Accrued liabilities


12,583


12,495


Operating lease liabilities, current portion


942


841


Finance lease obligations, current portion


383


684


Note payable - related party, current portion


2,500


-


Note payable - PPP loan, current portion


2,174


-


Total current liabilities


26,784


23,366


Operating lease liabilities, net of current portion


6,189


6,906


Finance lease obligations, net of current portion


2,029


2,351


Note payable - related party


3,974


6,463


Note payable - PPP Loan


1,384


-


Other liabilities


5,816


7,539


Total liabilities


46,176


46,625


Stockholders’ equity:
Preferred stock, par value $0.01 per share, 975,150 shares authorized; no shares issued


-


-


Series A preferred stock, par value $0.01 per share, 24,850 shares authorized; no shares issued


-


-


Common stock, non-voting, par value $0.01 per share, 10,000,000 shares authorized; no shares issued


-


-


Common stock, par value $0.01 per share, 30,000,000 shares authorized;
21,321,790 shares issued and 21,316,752 outstanding in 2020 and
21,324,618 shares issued and 21,298,426 outstanding in 2019


213


213


Additional paid-in capital


155,004


154,702


Accumulated deficit


(114,591

)


(117,433

)

Accumulated other comprehensive loss


(25,424

)


(24,051

)

Treasury stock, 5,038 and 26,192 in 2020 and 2019


-


-


Total stockholders’ equity


15,202


13,431


Total liabilities and stockholders’ equity

$

61,378


$

60,056


Note: The balance sheet at December 31, 2019, has been derived from the audited consolidated financial statements at that date but does not include all information and footnotes required by accounting principles generally accepted in the United States for a complete set of financial statements.
 
 
Sypris Solutions, Inc.
Consolidated Cash Flow Statements
(in thousands)
 
Nine Months Ended
October 4, September 29,

2020

2019

(Unaudited)
Cash flows from operating activities:
Net income (loss)

$

2,842


$

(3,090

)

Adjustments to reconcile net income (loss) to net cash provided by (used in) operating activities:
Depreciation and amortization


1,883


2,106


Deferred income taxes


(3,257

)


-


Stock-based compensation expense


335


389


Deferred loan costs recognized


11


11


Net (gain) loss on the sale of assets


(813

)


(467

)

Provision for excess and obsolete inventory


222


503


Non-cash lease expense


699


541


Other noncash items


72


15


Contributions to pension plans


(34

)


(348

)

Changes in operating assets and liabilities:
Accounts receivable


(1,158

)


1,198


Inventory


2,409


(2,415

)

Prepaid expenses and other assets


(983

)


207


Accounts payable


(1,036

)


(3,344

)

Accrued and other liabilities


(1,114

)


1,646


Net cash provided by (used in) operating activities


78


(3,048

)

Cash flows from investing activities:
Capital expenditures


(1,151

)


(553

)

Proceeds from sale of assets


1,969


653


Net cash provided by investing activities


818


100


Cash flows from financing activities:
Finance lease payments


(623

)


(466

)

Proceeds from Paycheck Protection Program loan


3,558


-


Indirect repurchase of shares for minimum statutory tax withholdings


(33

)


(138

)

Net cash provided by (used in) financing activities


2,902


(604

)

Effect of exchange rate changes on cash balances


(599

)


(99

)

Net increase (decrease) in cash and cash equivalents


3,199


(3,651

)

Cash and cash equivalents at beginning of period


5,095


10,704


Cash and cash equivalents at end of period

$

8,294


$

7,053


Contacts

Anthony C. Allen
Chief Financial Officer
(502) 329-2000

Offshore Source Logo

Offshore Source keeps you updated with relevant information concerning the Offshore Energy Sector.

Any views or opinions represented on this website belong solely to the author and do not represent those of the people, institutions or organizations that Offshore Source or collaborators may or may not have been associated with in a professional or personal capacity, unless explicitly stated.

Corporate Offices

Technology Systems Corporation
8502 SW Kansas Ave
Stuart, FL 34997

info@tscpublishing.com