Business Wire News

PG&E Issues Weather “All Clear” for A Majority of Areas: Remainder of “All Clear” Decisions Expected Tuesday Morning

Aerial, Vehicle and On-The-Ground Patrols Confirm at Least 13 Instances of Damage or Hazards to Electric Equipment So Far

SAN FRANCISCO--(BUSINESS WIRE)--Pacific Gas and Electric Company (PG&E) restored power Monday night by 10:00 PM to more than 156,000 of the approximately 345,000 customers impacted by the Public Safety Power Shutoff (PSPS) that started Sunday morning on Oct. 25. All remaining customers—approximately 189,000—are expected to have power back on late Tuesday evening.

PG&E crews began restoring power to customers where no damage or hazards to electrical equipment were found during inspections that began as early as Monday morning in locations where the weather “all clear” was received. In areas where equipment was damaged by the severe wind event, crews worked safely and as quickly as possible to make the repairs and restore those customers.

Today, PG&E meteorologists issued a weather “all clear” for most of the areas impacted by this PSPS event. To fully restore service, PG&E crews will need to complete their patrols of over 17,000 miles of transmission and distribution lines for damage or hazards.

The patrol and inspection efforts include nearly 1,800 on-the-ground personnel, 65 helicopters and one airplane. Preliminary data shows at least 13 instances of weather-related damage and hazards in the PSPS-affected areas. Examples include downed lines and vegetation on power lines. If PG&E had not de-energized power lines, these types of damage could have caused wildfire ignitions.

PSPS Restoration

PG&E has restored 156,000 customers today and expects all remaining customers to have power back on late Tuesday evening. Restoration may be delayed for some customers if there is significant damage to individual lines, which could be caused by wind-blown branches and other debris.

The restoration process PG&E follows includes:

  1. Patrol – PG&E crews look for potential weather-related damage to the lines, poles and towers. This is done by foot, vehicle and air.
  2. Repair – Where equipment damage is found, PG&E crews isolate the damaged area from the rest of the system so other parts of the system can be energized.
  3. Restore – Once the system is safe to energize, PG&E's Control Center can complete the process and restore power to affected areas.
  4. Notify Customers – Customers are notified that power has been restored.

For more information on the PSPS event, visit pge.com/pspsupdates.

Extreme Winds Recorded Across Service Area

Winds in de-energized areas due to PSPS were recorded as follows:

County

Max recorded sustained winds
(mph)

Max recorded wind gusts
(mph)

Sonoma

76

89

Napa

54

82

Contra Costa

55

74

Lake

57

71

Placer

42

71

Alameda

52

66

More Information on PG&E PSPS Events

PG&E’s goal is to have essentially all customers affected by the PSPS who can receive power restored within 12 daylight hours of the weather “All Clear” for each affected area.

PG&E uses a PSPS only as the last resort to protect community and customer safety against wildfires, given dry and windy weather, dry vegetation and an elevated fire risk across portions of its service area.

PG&E will submit a report detailing damage from the severe weather to the California Public Utilities Commission within 10 days of the completion of the PSPS.

For more information on the PSPS event, visit pge.com/pspsupdates.

About PG&E

Pacific Gas and Electric Company, a subsidiary of PG&E Corporation (NYSE:PCG), is one of the largest combined natural gas and electric energy companies in the United States. Based in San Francisco, with more than 23,000 employees, the company delivers some of the nation's cleanest energy to 16 million people in Northern and Central California. For more information, visit pge.com and pge.com/news.


Contacts

Media Relations
415-973-5930

Garmin brings sonar to a mobile device so anglers can find and catch more fish – with or without a boat

OLATHE, Kan.--(BUSINESS WIRE)--Garmin® International, Inc., a unit of Garmin Ltd. (NASDAQ:GRMN), the world’s leading marine electronics manufacturer1, today introduced STRIKER Cast— a castable fishfinder that delivers sonar wirelessly to a smartphone or tablet. No boat? No problem. STRIKER Cast is a versatile sonar device that anglers can take with them wherever they go. Just cast it out from where the fish are biting that day – the bank, a dock, or even from a kayak – to view fish and structure in crisp detail on the free STRIKER Cast app, compatible with both Apple® and Android devices. With STRIKER Cast, anglers can even create their own fishing maps2 for an even more detailed look at the area they’re fishing.


“Now more than ever, consumers are finding ways to spend more time outside enjoying the great outdoors, and for so many, that includes fishing,” said Dan Bartel, Garmin vice president of global consumer sales. “Whether you’re new to the sport or a seasoned angler fishing from shorelines, docks or piers, STRIKER Cast will help you identify structure and fish, right from the palm of your hand.”

Designed for use in freshwater and saltwater (and even for ice fishing), STRIKER Cast delivers excellent sonar performance in both shallow water and deep water – from less than 2 ft. to 150 ft. – and will wirelessly stream sonar and water temperature data from up to 200 feet away. It delivers easy-to-understand traditional 2-D sonar and ice fishing flasher modes, with setting adjustments for gain, range and more. Anglers can even turn on fish icons to view more realistic images of the fish targets and their depth readings directly in the app, so it’s easy to know exactly where to drop the line.

Available with built-in GPS, anglers can instantly create their own maps with 1-foot contours – and remember that great spot they found – by using Quickdraw Contours software, a free, easy-to-use tool that lets users instantly create personalized HD maps on any body of water. The data collected can be stored within the STRIKER Cast app, and anglers can upload, download or browse collected Quickdraw Contours data from other users from Garmin’s Quickdraw Community.

Easy to cast and built to last, STRIKER Cast is durable and lightweight, and should be used with a 20 lb. test weight or higher fishing line. The power-savvy STRIKER Cast automatically powers on when it’s floating in water and turns off when it’s not. Rugged by design, it boasts an internal, USB-rechargeable battery that can go for more than 10 hours between charges3, and it’s water-resistant to IPX6 and IPX7 standards4.

STRIKER Cast is available now in two versions: STRIKER Cast GPS with a suggested retail price of $179.99 and STRIKER Cast without GPS, which has a suggested retail price of $129.99. To learn more, visit garmin.com/marine.

Engineered on the inside for life on the outside, Garmin products have revolutionized life for anglers, sailors, mariners and boat enthusiasts everywhere. Committed to developing the most sophisticated marine electronics the industry has ever known, Garmin believes every day is an opportunity to innovate and a chance to beat yesterday. For the sixth consecutive year, Garmin was recently named the Manufacturer of the Year by the National Marine Electronics Association (NMEA). Other Garmin marine brands include Fusion® and Navionics®. For more information, visit Garmin's virtual pressroom at garmin.com/newsroom, contact the Media Relations department at 913-397-8200, or follow us at facebook.com/garmin, twitter.com/garminnews, instagram.com/garmin or youtube.com/garmin.

1 Based on 2019 reported sales

2 GPS-version only

3 Battery life may vary depending on usage

4 See Garmin.com/waterrating

About Garmin International, Inc. Garmin International, Inc. is a subsidiary of Garmin Ltd. (Nasdaq: GRMN). Garmin Ltd. is incorporated in Switzerland, and its principal subsidiaries are located in the United States, Taiwan and the United Kingdom. Garmin, Navionics and Fusion are registered trademarks and STRIKER and Quickdraw are trademarks of Garmin Ltd. or its subsidiaries.

All other brands, product names, company names, trademarks and service marks are the properties of their respective owners. All rights reserved.

Notice on Forward-Looking Statements:

This release includes forward-looking statements regarding Garmin Ltd. and its business. Such statements are based on management’s current expectations. The forward-looking events and circumstances discussed in this release may not occur and actual results could differ materially as a result of known and unknown risk factors and uncertainties affecting Garmin, including, but not limited to, the risk factors listed in the Annual Report on Form 10-K for the year ended December 28, 2019, filed by Garmin with the Securities and Exchange Commission (Commission file number 0-31983). A copy of such Form 10-K is available at https://www.garmin.com/en-US/company/investors/earnings/. No forward-looking statement can be guaranteed. Forward-looking statements speak only as of the date on which they are made and Garmin undertakes no obligation to publicly update or revise any forward-looking statement, whether as a result of new information, future events, or otherwise.

Category: Marine


Contacts

Carly Hysell
913-397-8200
This email address is being protected from spambots. You need JavaScript enabled to view it.

Represents Advanced Group 2 Detonator Technology

HOUSTON--(BUSINESS WIRE)--Titan Division of Hunting Energy Services, a subsidiary of Hunting PLC, the international energy services company, today introduced its new ControlFire® Recon cartridge for use in Hunting’s plug-and-play perforating systems.


This inherently safe select-fire initiation device features the latest ControlFire Recon switch pre-assembled to Hunting’s patent-pending modular detonator. With ControlFire Recon technology, the user can interrogate the downhole tool string, including detonator resistance – the first switch on the market to do so. The compact cartridge package allows for simple, wire-free arming at the wellsite, and unparalleled safety and real-time performance during perforating operations.

Compliant with API RP 67 Group 2 initiator requirements, the Recon cartridge is immune to radio frequency, electrostatic discharge and stray voltages up to 500 volts. Hunting’s ControlFire switch has a near 100% success rate, and is viewed as the industry standard in addressable switch technology.

About Hunting

Hunting PLC is an international energy services provider to the world's leading upstream oil and gas companies. Established in 1874, it is a premium-listed public company traded on the London Stock Exchange. The Company maintains a corporate office in Houston and is headquartered in London. As well as the United Kingdom, the Company has operations in Canada, China, Indonesia, Kenya, Mexico, Netherlands, Norway, Saudi Arabia, Singapore, South Africa, United Arab Emirates and the United States of America.

The company’s Hunting Energy Services Titan Division engineers and manufactures perforating systems, wireline selective firing systems, cased hole logging instruments, nuclear detectors, energetics, and associated wireline hardware and accessories.


Contacts

Business Contact:
John Feuerstein
Hunting
281-442-7382
This email address is being protected from spambots. You need JavaScript enabled to view it.

  • Third quarter revenues of $5.1 billion; GAAP1 Net Income of $501 million
  • Third quarter EBITDA of 17.1 percent; Diluted EPS of $3.36
  • The company produced record quarterly operating cash flow of $1.2 billion
  • Total liquidity increased to $6.5 billion, including cash and marketable securities of $3.3 billion

COLUMBUS, Ind.--(BUSINESS WIRE)--Cummins Inc. (NYSE: CMI) today reported results for the third quarter of 2020.


Third quarter revenues of $5.1 billion decreased 11 percent from the same quarter in 2019. Sales in North America declined by 18 percent while international revenues were flat. Currency negatively impacted revenues by 1 percent primarily due to a weaker Brazilian Real.

Earnings before interest, taxes, depreciation and amortization (EBITDA) in the third quarter were $876 million (17.1 percent of sales), compared to $958 million (16.6 percent of sales) a year ago.

“Cummins successfully translated increased sales into strong profits and produced record operating cash flow during the third quarter,” said Chairman and CEO Tom Linebarger. “I want to thank our employees all over the globe once again for their dedication to our company and to our customers. Over the last six months we have faced both the most severe decline in quarterly sales in our history as well as the largest sequential increase. We continue to work safely and effectively through an incredibly challenging period, meeting our commitments to customers who provide products critical to the functioning of the global economy.”

Net income attributable to Cummins in the third quarter was $501 million ($3.36 per diluted share) compared to $622 million ($3.97 per diluted share) in 2019. The tax rate in the third quarter was 26.5 percent and was negatively impacted by $31 million ($0.21 per diluted share) of discrete tax items.

“We continue to advance existing products and invest in new technology while returning cash to shareholders,” said Chief Financial Officer Mark Smith. “In October we announced a 3% increase to our quarterly dividend, which will make 2020 the eleventh consecutive year of increases to Cummins’ dividend.”

2020 Outlook:

The company currently expects fourth quarter revenues to be similar to third quarter levels, with higher demand in North America truck markets and continued improvement in aftermarket sales, partially offset by lower demand in China.

On October 1st, the company ended temporary salary reductions that began in April. Compensation expense is projected to increase by approximately $90 million dollars in the fourth quarter due to the end of these salary reductions.

“We are encouraged by the recovery in demand across our markets in the third quarter,” said Chairman and CEO Tom Linebarger. “We will continue to manage cautiously through the remainder of the year as visibility on future orders remains low and the impact of the virus on economies around the world remains difficult to predict.”

Third Quarter 2020 Highlights:

  • The company completed an aggregate $2 billion debt offering of 5, 10, and 30-year maturities. The company’s long-term credit ratings remain unchanged at A+ from Standard & Poor’s and A2 from Moody’s with stable outlooks
  • A collaboration with the Department of Energy’s Oak Ridge National Laboratory (ORNL) has resulted in the ability to produce enough filter media to supply more than a million face masks and respirators per day to U.S. healthcare facilities
  • Cummins was awarded over $12 million of funding for five separate Department of Energy projects related to PEM and Solid Oxide fuel cell and electrolyzer technologies
  • The company announced an increase in its quarterly dividend from $1.311 to $1.35 a share

1 Generally Accepted Accounting Principles

Third quarter 2020 detail (all comparisons to same period in 2019):

Engine Segment

  • Sales - $2.1 billion, down 13 percent
  • Segment EBITDA - $382 million, or 18.1 percent of sales, compared to $341 million or 14.1 percent of sales
  • EBITDA was positively impacted by a $30 million value added tax (VAT) recovery
  • On-highway revenues decreased 13 percent and off-highway revenues declined 9 percent
  • Sales declined by 18 percent in North America but increased 8 percent in international markets primarily due to increased demand in China

Distribution Segment

  • Sales - $1.7 billion, down 14 percent
  • Segment EBITDA - $182 million, or 10.6 percent of sales, compared to $186 million or 9.3 percent of sales
  • Revenues in North America were down 18 percent and international sales declined by 5 percent
  • Demand declined in all lines of business

Components Segment

  • Sales - $1.5 billion, down 7 percent
  • Segment EBITDA - $261 million, or 16.9 percent of sales, compared to $286 million or 17.3 percent of sales
  • Revenues in North America decreased by 24 percent and international sales increased by 26 percent due to higher demand in China and India

Power Systems Segment

  • Sales - $981 million, down 13 percent
  • Segment EBITDA - $101 million, or 10.3 percent of sales, compared to $158 million, or 14.0 percent of sales
  • Power generation revenues decreased by 7 percent while industrial revenues decreased 21 percent due to lower demand in mining and oil and gas markets

New Power Segment

  • Sales - $18 million
  • Segment EBITDA loss - $40 million
  • Costs associated with the development of fuel cells and electrolyzers as well as products to support battery electric vehicles are contributing to EBITDA losses

About Cummins Inc.

Cummins Inc., a global power leader, is a corporation of complementary business segments that design, manufacture, distribute and service a broad portfolio of power solutions. The company’s products range from diesel, natural gas, electric and hybrid powertrains and powertrain-related components including filtration, aftertreatment, turbochargers, fuel systems, controls systems, air handling systems, automated transmissions, electric power generation systems, batteries, electrified power systems, hydrogen generation and fuel cell products. Headquartered in Columbus, Indiana (U.S.), since its founding in 1919, Cummins employs approximately 61,600 people committed to powering a more prosperous world through three global corporate responsibility priorities critical to healthy communities: education, environment and equality of opportunity. Cummins serves its customers online, through a network of company-owned and independent distributor locations, and through thousands of dealer locations worldwide and earned about $2.3 billion on sales of $23.6 billion in 2019. See how Cummins is powering a world that’s always on by accessing news releases and more information at https://www.cummins.com/always-on.

Forward-looking disclosure statement

Information provided in this release that is not purely historical are forward-looking statements within the meaning of the Private Securities Litigation Reform Act of 1995, including statements regarding our forecasts, guidance, preliminary results, expectations, hopes, beliefs and intentions on strategies regarding the future. These forward-looking statements include, without limitation, statements relating to our plans and expectations for our revenues and EBITDA. Our actual future results could differ materially from those projected in such forward-looking statements because of a number of factors, including, but not limited to: market slowdown due to the impacts from COVID-19 pandemic, other public health crises, epidemics or pandemics; impacts to manufacturing and supply chain abilities from an extended shutdown or disruption of our operations due to the COVID-19 pandemic; supply shortages and supplier financial risk, particularly from any of our single-sourced suppliers, including suppliers that may be impacted by the COVID-19 pandemic; aligning our capacity and production with our demand, including impacts of COVID-19; a major customer experiencing financial distress, particularly related to the COVID-19 pandemic; any adverse results of our internal review into our emissions certification process and compliance with emission standards; increased scrutiny from regulatory agencies, as well as unpredictability in the adoption, implementation and enforcement of emission standards around the world; disruptions in global credit and financial markets as the result of the COVID-19 pandemic; adverse impacts from government actions to stabilize credit markets and financial institutions and other industries; product recalls; the development of new technologies that reduce demand for our current products and services; policy changes in international trade; a slowdown in infrastructure development and/or depressed commodity prices; the U.K.'s exit from the European Union (EU); labor relations or work stoppages; reliance on our executive leadership team and other key personnel; lower than expected acceptance of new or existing products or services; changes in the engine outsourcing practices of significant customers; our plan to reposition our portfolio of product offerings through exploration of strategic acquisitions and divestitures and related uncertainties of entering such transactions; exposure to potential security breaches or other disruptions to our information technology systems and data security; challenges or unexpected costs in completing cost reduction actions and restructuring initiatives; failure to realize expected results from our investment in Eaton Cummins Automated Transmission Technologies joint venture; political, economic and other risks from operations in numerous countries; competitor activity; increasing competition, including increased global competition among our customers in emerging markets; foreign currency exchange rate changes; variability in material and commodity costs; the actions of, and income from, joint ventures and other investees that we do not directly control; changes in taxation; global legal and ethical compliance costs and risks; product liability claims; increasingly stringent environmental laws and regulations; the performance of our pension plan assets and volatility of discount rates, particularly those related to the sustained slowdown of the global economy due to the COVID-19 pandemic; future bans or limitations on the use of diesel-powered products; the price and availability of energy; our sales mix of products; protection and validity of our patent and other intellectual property rights; the outcome of pending and future litigation and governmental proceedings; continued availability of financing, financial instruments and financial resources in the amounts, at the times and on the terms required to support our future business; and other risks detailed from time to time in our SEC filings, including particularly in the Risk Factors section of our 2019 Annual Report on Form 10-K and Quarterly Reports on Form 10-Q. Shareholders, potential investors and other readers are urged to consider these factors carefully in evaluating the forward-looking statements and are cautioned not to place undue reliance on such forward-looking statements. The forward-looking statements made herein are made only as of the date of this press release and we undertake no obligation to publicly update any forward-looking statements, whether as a result of new information, future events or otherwise. More detailed information about factors that may affect our performance may be found in our filings with the SEC, which are available at http://www.sec.gov or at http://www.cummins.com in the Investor Relations section of our website.

Presentation of Non-GAAP Financial Information

EBITDA is a non-GAAP measure used in this release and is defined and reconciled to what management believes to be the most comparable GAAP measure in a schedule attached to this release. Cummins presents this information as it believes it is useful to understanding the Company's operating performance, and because EBITDA is a measure used internally to assess the performance of the operating units.

Webcast information

Cummins management will host a teleconference to discuss these results today at 10 a.m. EST. This teleconference will be webcast and available on the Investor Relations section of the Cummins website at www.cummins.com. Participants wishing to view the visuals available with the audio are encouraged to sign-in a few minutes prior to the start of the teleconference.


CUMMINS INC. AND SUBSIDIARIES

CONDENSED CONSOLIDATED STATEMENTS OF NET INCOME

(Unaudited) (a)


Three months ended

In millions, except per share amounts


September 27,

2020


June 28,

2020


September 29,

2019

NET SALES


$

5,118


$

3,852


$

5,768


Cost of sales


3,769


2,962


4,274


GROSS MARGIN


1,349


890


1,494


OPERATING EXPENSES AND INCOME


Selling, general and administrative expenses


533


470


600


Research, development and engineering expenses


224


189


242


Equity, royalty and interest income from investees


98


115


68


Other operating expense, net


(20

)


(10

)


(21

)

OPERATING INCOME


670


336


699


Interest income


4


4


14


Interest expense


25


23


26


Other income, net


37


45


68


INCOME BEFORE INCOME TAXES


686


362


755


Income tax expense


182


93


139


CONSOLIDATED NET INCOME


504


269


616


Less: Net income (loss) attributable to noncontrolling interests


3


(7

)


(6

)

NET INCOME ATTRIBUTABLE TO CUMMINS INC.


$

501


$

276


$

622


EARNINGS PER COMMON SHARE ATTRIBUTABLE TO CUMMINS INC.


Basic


$

3.39


$

1.87


$

3.99


Diluted


$

3.36


$

1.86


$

3.97


WEIGHTED-AVERAGE COMMON SHARES OUTSTANDING


Basic


147.9


147.6


155.9


Diluted


148.9


148.0


156.6


(a) Prepared on an unaudited basis in accordance with accounting principles generally accepted in the United States of America.


CUMMINS INC. AND SUBSIDIARIES

CONDENSED CONSOLIDATED STATEMENTS OF NET INCOME

(Unaudited) (a)


Nine months ended

In millions, except per share amounts


September 27,

2020


September 29,

2019

NET SALES


$

13,981


$

17,993


Cost of sales


10,448


13,326


GROSS MARGIN


3,533


4,667


OPERATING EXPENSES AND INCOME


Selling, general and administrative expenses


1,549


1,822


Research, development and engineering expenses


651


730


Equity, royalty and interest income from investees


342


256


Other operating expense, net


(35

)


(25

)

OPERATING INCOME


1,640


2,346


Interest income


15


38


Interest expense


71


87


Other income, net


119


174


INCOME BEFORE INCOME TAXES


1,703


2,471


Income tax expense


402


501


CONSOLIDATED NET INCOME


1,301


1,970


Less: Net income attributable to noncontrolling interests


13


10


NET INCOME ATTRIBUTABLE TO CUMMINS INC.


$

1,288


$

1,960


EARNINGS PER COMMON SHARE ATTRIBUTABLE TO CUMMINS INC.


Basic


$

8.69


$

12.50


Diluted


$

8.65


$

12.45


WEIGHTED-AVERAGE COMMON SHARES OUTSTANDING


Basic


148.3


156.8


Diluted


148.9


157.4


(a) Prepared on an unaudited basis in accordance with accounting principles generally accepted in the United States of America.


CUMMINS INC. AND SUBSIDIARIES

CONDENSED CONSOLIDATED BALANCE SHEETS

(Unaudited) (a)

 
In millions, except par value


September 27,

2020


December 31,

2019

ASSETS


Current assets


Cash and cash equivalents


$

2,967


$

1,129


Marketable securities


345


341


Total cash, cash equivalents and marketable securities


3,312


1,470


Accounts and notes receivable, net


3,628


3,670


Inventories


3,470


3,486


Prepaid expenses and other current assets


652


761


Total current assets


11,062


9,387


Long-term assets


Property, plant and equipment, net


4,087


4,245


Investments and advances related to equity method investees


1,418


1,237


Goodwill


1,288


1,286


Other intangible assets, net


990


1,003


Pension assets


1,010


1,001


Other assets


1,713


1,578


Total assets


$

21,568


$

19,737


LIABILITIES


Current liabilities


Accounts payable (principally trade)


$

2,597


$

2,534


Loans payable


129


100


Commercial paper


316


660


Accrued compensation, benefits and retirement costs


433


560


Current portion of accrued product warranty


646


803


Current portion of deferred revenue


540


533


Other accrued expenses


990


1,039


Current maturities of long-term debt


58


31


Total current liabilities


5,709


6,260


Long-term liabilities


Long-term debt


3,609


1,576


Pensions and other postretirement benefits


571


591


Accrued product warranty


635


645


Deferred revenue


837


821


Other liabilities


1,566


1,379


Total liabilities


$

12,927


$

11,272


EQUITY


Cummins Inc. shareholders’ equity


Common stock, $2.50 par value, 500 shares authorized, 222.5 and 222.4 shares issued


$

2,385


$

2,346


Retained earnings


15,118


14,416


Treasury stock, at cost, 74.4 and 71.7 shares


(7,696

)


(7,225

)

Common stock held by employee benefits trust, at cost, 0.0 and 0.2 shares


(2

)

Accumulated other comprehensive loss


(2,107

)


(2,028

)

Total Cummins Inc. shareholders’ equity


7,700


7,507


Noncontrolling interests


941


958


Total equity


$

8,641


$

8,465


Total liabilities and equity


$

21,568


$

19,737


(a) Prepared on an unaudited basis in accordance with accounting principles generally accepted in the United States of America.


CUMMINS INC. AND SUBSIDIARIES

CONDENSED CONSOLIDATED STATEMENTS OF CASH FLOWS

(Unaudited) (a)


Three months ended

In millions


September 27,

2020


June 28,

2020


September 29,

2019

CASH FLOWS FROM OPERATING ACTIVITIES


Consolidated net income


$

504


$

269


$

616


Adjustments to reconcile consolidated net income to net cash provided by (used in) operating activities


Depreciation and amortization


166


165


178


Deferred income taxes


4


(31

)

Equity in income of investees, net of dividends


(12

)


(46

)


(1

)

Pension and OPEB expense


27


27


19


Pension contributions and OPEB payments


(20

)


(22

)


(38

)

Stock-based compensation expense


10


8


9


Restructuring payments


(19

)


(33

)


Gain on corporate owned life insurance


(12

)


(21

)


(9

)

Foreign currency remeasurement and transaction exposure


(5

)


(5

)


(100

)

Changes in current assets and liabilities, net of acquisitions


Accounts and notes receivable


(123

)


63


211


Inventories


174


(53

)


63


Other current assets


(22

)


16


33


Accounts payable


329


(391

)


(151

)

Accrued expenses


186


(101

)


120


Changes in other liabilities


9


171


48


Other, net


27


(69

)


156


Net cash provided by (used in) operating activities


1,223


(22

)


1,123


CASH FLOWS FROM INVESTING ACTIVITIES


Capital expenditures


(116

)


(77

)


(153

)

Investments in internal use software


(12

)


(13

)


(16

)

Investments in and advances to equity investees


(13

)


(10

)


2


Acquisitions of businesses, net of cash acquired


(222

)

Investments in marketable securities—acquisitions


(137

)


(169

)


(108

)

Investments in marketable securities—liquidations


154


159


143


Cash flows from derivatives not designated as hedges


7


(28

)


(60

)

Other, net


14


3


(4

)

Net cash used in investing activities


(103

)


(135

)


(418

)


CASH FLOWS FROM FINANCING ACTIVITIES


Proceeds from borrowings


1,977


22


Net (payments) borrowings of commercial paper


(1,711

)


410


468


Payments on borrowings and finance lease obligations


(16

)


(15

)


(30

)

Net borrowings (payments) under short-term credit agreements


2


(21

)


(4

)

Distributions to noncontrolling interests


(13

)


(20

)

Dividend payments on common stock


(194

)


(193

)


(204

)

Repurchases of common stock


(706

)

Other, net


59


23


9


Net cash provided by (used in) financing activities


104


226


(487

)

EFFECT OF EXCHANGE RATE CHANGES ON CASH AND CASH EQUIVALENTS


(8

)


(9

)


(55

)

Net increase in cash and cash equivalents


1,216


60


163


Cash and cash equivalents at beginning of period


1,751


1,691


1,397


CASH AND CASH EQUIVALENTS AT END OF PERIOD


$

2,967


$

1,751


$

1,560


(a) Prepared on an unaudited basis in accordance with accounting principles generally accepted in the United States of America.


CUMMINS INC. AND SUBSIDIARIES

CONDENSED CONSOLIDATED STATEMENTS OF CASH FLOWS

(Unaudited) (a)


Nine months ended

In millions


September 27,

2020


September 29,

2019

CASH FLOWS FROM OPERATING ACTIVITIES


Consolidated net income


$

1,301


$

1,970


Adjustments to reconcile consolidated net income to net cash provided by operating activities


Depreciation and amortization


499


493


Deferred income taxes


(7

)


(14

)

Equity in income of investees, net of dividends


(136

)


(44

)

Pension and OPEB expense


81


56


Pension contributions and OPEB payments


(102

)


(130

)

Stock-based compensation expense


22


37


Restructuring payments


(100

)


Gain on corporate owned life insurance


(50

)


(64

)

Foreign currency remeasurement and transaction exposure


(7

)


(54

)

Changes in current assets and liabilities, net of acquisitions


Accounts and notes receivable


47


(101

)

Inventories


(50

)


(62

)

Other current assets


73


48


Accounts payable


109


(3

)

Accrued expenses


(236

)


(74

)

Changes in other liabilities


208


168


Other, net


(72

)


117


Net cash provided by operating activities


1,580


2,343


CASH FLOWS FROM INVESTING ACTIVITIES


Capital expenditures


(268

)


(395

)

Investments in internal use software


(33

)


(50

)

Investments in and advances to equity investees


(30

)


(16

)

Acquisitions of businesses, net of cash acquired


(237

)

Investments in marketable securities—acquisitions


(422

)


(367

)

Investments in marketable securities—liquidations


408


296


Cash flows from derivatives not designated as hedges


(15

)


(86

)

Other, net


23


26


Net cash used in investing activities


(337

)


(829

)


CASH FLOWS FROM FINANCING ACTIVITIES


Proceeds from borrowings


1,999


10


Net (payments) borrowings of commercial paper


(344

)


122


Payments on borrowings and finance lease obligations


(41

)


(47

)

Net borrowings under short-term credit agreements


6


53


Distributions to noncontrolling interests


(26

)


(33

)

Dividend payments on common stock


(582

)


(562

)

Repurchases of common stock


(550

)


(806

)

Other, net


102


65


Net cash provided by (used in) financing activities


564


(1,198

)

EFFECT OF EXCHANGE RATE CHANGES ON CASH AND CASH EQUIVALENTS


31


(59

)

Net increase in cash and cash equivalents


1,838


257


Cash and cash equivalents at beginning of year


1,129


1,303


CASH AND CASH EQUIVALENTS AT END OF PERIOD


$

2,967


$

1,560


(a) Prepared on an unaudited basis in accordance with accounting principles generally accepted in the United States of America.


CUMMINS INC. AND SUBSIDIARIES

SEGMENT INFORMATION

(Unaudited)

 
In millions


Engine


Distribution


Components


Power

Systems


New

Power


Total

Segments


Intersegment

Eliminations (1)


Total

Three months ended September 27, 2020


External sales


$

1,617


$

1,715


$

1,201


$

567


$

18


$

5,118


$


$

5,118


Intersegment sales


495


6


340


414


1,255


(1,255

)


Total sales


2,112


1,721


1,541


981


18


6,373


(1,255

)


5,118


Research, development and engineering expenses


72


9


64


53


26


224


224


Equity, royalty and interest income (loss) from investees


74


13


13


(2

)


98


98


Interest income


1


1


1


1


4


4


EBITDA (2)


382


182


261


101


(40

)


886


(10

)


876


Depreciation and amortization (3)


51


30


47


32


5


165


165


EBITDA as a percentage of total sales


18.1

%


10.6

%


16.9

%


10.3

%


NM


13.9

%


17.1

%


Three months ended September 29, 2019


External sales


$

1,822


$

2,001


$

1,253


$

683


$

9


$

5,768


$


$

5,768


Intersegment sales


594


3


397


443


1,437


(1,437

)


Total sales


2,416


2,004


1,650


1,126


9


7,205


(1,437

)


5,768


Research, development and engineering expenses


79


7


73


58


25


242


242


Equity, royalty and interest income from investees


34


12


9


13


68


68


Interest income


5


4


2


3


14


14


EBITDA (2)


341


186


286


158


(36

)


935


23


958


Depreciation and amortization (3)


50


29


67


29


2


177


177


EBITDA as a percentage of total sales


14.1

%


9.3

%


17.3

%


14.0

%


NM


13.0

%


16.6

%


"NM" - not meaningful information

(1) Includes intersegment sales, intersegment profit in inventory eliminations and unallocated corporate expenses. There were no significant unallocated corporate expenses for the three months ended September 27, 2020 and September 29, 2019.

(2) EBITDA is defined as earnings or losses before interest expense, income taxes, depreciation and amortization and noncontrolling interests.

(3) Depreciation and amortization, as shown on a segment basis, excludes the amortization of debt discount and deferred costs included in the Condensed Consolidated Statements of Net Income as "Interest expense." A portion of depreciation expense is included in "Research, development and engineering expenses."


Contacts

Jon Mills
Director, External Communications
(317) 658-4540
This email address is being protected from spambots. You need JavaScript enabled to view it.


Read full story here

San Antonio, Texas-based Millennium PetroCapital Corporation, placed its third Austin Chalk oil well online in Gonzales County, Texas, in October of 2020.


SAN ANTONIO--(BUSINESS WIRE)--$invest #investment--Millennium PetroCapital Corporation, a recent finalist for the regional Better Business Bureau's Torch Award for Marketplace Ethics, is a privately held parent company specializing in South Texas and Texas Gulf Coast oil and gas exploration and development. Millennium has successfully continued its Chalk Talk multi-well development plan in the famously prolific Austin Chalk formation. The Company has put three Austin Chalk wells into production through its dedicated drilling and operating division, Millennium Exploration Company, LLC, from May to October 2020, with plans to drill a fourth well before year's end.

Imagination, Boldness, Tenacity & Reputation. Millennium displays its Core Values as an active participant in the Austin Chalk formation re-emergence currently unfolding in South Texas. Millennium placed into commercial production its Chalk Talk #2H well and the Chalk Talk 'A' #1H well on May 25 and June 10, respectively, with the Chalk Talk 'B' #3H going into production on October 6, 2020. These three wells are the first of eight wells that the Company currently plans to drill within its strategically positioned 7,200-acre development area, with the fourth well scheduled to follow before the end of 2020. Each of the three wells penetrated the targeted Austin Chalk zone with a 4,000-foot horizontal leg, and all three wells exhibited oil flow through the skimmer systems during the drilling process as their 30 to 50-foot gas flares lit the South Texas night.

Continued Austin Chalk Development Program - Millennium, aside from being the Operator of Record of the Chalk Talk development, controls a combined 75% interest in this ongoing project along with its private equity partners. Plans are currently unfolding to expand Millennium's Austin Chalk foothold by using their internally developed and proprietary geophysical exploration strategy. The Company will use this strategy to identify other drilling prospects while simultaneously building regional operational support infrastructure to facilitate more efficient drilling and production operations.

Energy Development from Concept to Cash Flow - The Millennium companies have specialized in developing, acquiring, drilling, and producing Texas-based oil and gas assets since July of 2006. In nearly 15 years in business, Millennium has created and managed 60 joint ventures consisting of over 80 wells with a current commercial completion average of about 72%. "Our team has an amazing passion for the art and science that goes into making these projects come to fruition. Millennium is a sophisticated corporate body whose ever-evolving departments function together to carry out these elaborate projects symphonically. Through its systems, processes, and, most importantly, its people, our company's collective ability allows management to pursue increasingly creative and ambitious ideas. Accomplishing one more Austin Chalk well in the calendar year 2020 will allow us to capitalize on the current window of lower-cost operations. In this way, we can simultaneously provide needed work for our key vendors, who have been struggling financially due to the current state of oil prices," added Richard Monroy, Millennium's CEO.

For more information about the Millennium companies, please visit http://www.millenniumpetrocapital.com/ or call Samuel Perez at 210.960.1000.


Contacts

Samuel Perez
210.960.1000

LITTLE RIVER, S.C.--(BUSINESS WIRE)--PCT LTD (OTC Pink: PCTL) today announced that it has executed a domestic supply agreement with Maverick Energy Services and Maverick Environmental Solutions of Holdenville, Oklahoma for a minimum of 1,000,000 gallons of PCT Hydrolyte® to be delivered over the next twelve months. An initial order has been fulfilled on this contract.


We would also like to update our shareholders on PCTL’s revenue guidance for the fiscal year of 2020. We continue to anticipate revenues of approximately $4 million. In addition, we expect to achieve record setting revenues during the 4th quarter of 2020.

About Maverick Energy Services and Maverick Environmental Solutions, LLC:

Both companies were developed by Mr. Doug Humphreys. Mr. Humphreys graduated in 1975 from Southwest Oklahoma University with degrees in Business Administration and Geology. Mr. Humphreys began his career in 1977 with Tide West Oil Company, formerly Flint & Associates. From 1977 – 1997, Mr. Humphreys had a personal role in the development of over 1,500 wells at various depths of up to 20,000 plus feet. Over his career, he was employed with various oil and gas companies, including Tide West Oil Company, Square D Drilling, Kerr-McGee, focused in Texas, New Mexico, Louisiana, Kansas and Oklahoma. In 2007, Mr. Humphreys started Maverick Energy Services, LLC and in 2019, Maverick Environmental Services, LLC. Mr. Humphreys currently serves on the board of The First National Bank of Holdenville, Oklahoma, serves on the foundation board of Seminole State College, is a member of OIPA and is a well-known figure within oil and gas circles.
www.OKMaverick.com

About PCT Ltd:

PCT LTD ("PCTL") focuses its business on acquiring, developing and providing sustainable, environmentally safe disinfecting, cleaning and tracking technologies. The company acquires and holds rights to innovative products and technologies, which are commercialized through its wholly-owned operating subsidiary, Paradigm Convergence Technologies Corporation (PCT Corp). Currently trading on OTC:PINK, "PCTL" is actively engaged in applying for listing its common stock to the OTC QB market. The Company established entry into its target markets with commercially viable products in the United States and now continues to gain market share in the U.S. and internationally.

ADDITIONAL NEWS AND CORPORATE UPDATES:

PCTL would like to warn its stockholders and potential investors that material corporate information regarding sales, areas of business and other corporate updates will only be made through press releases or filings with the SEC. PCTL does not utilize social media, chatrooms or other online sources to disclose material information. The public should only rely on official press releases and corporate filings for accurate and up to date information regarding PCTL.

Forward-Looking Statements:

This press release contains "forward-looking statements" as defined in Section 27A of the Securities Act of 1933, as amended, and Section 21B of the Securities Exchange Act of 1934, as amended. Any statements that express or involve discussions with respect to predictions, expectations, beliefs, plans, projections, objectives, goals, assumptions or future events or performance are not statements of historical fact and may be "forward-looking statements."

Such statements are based on expectations, estimates and projections at the time the statements are made that involve a number of risks and uncertainties, which could cause actual results or events to differ materially from those presently anticipated. Such statements involve risks and uncertainties, including but not limited to: the ability of PCTL to fulfill orders to the United Kingdom; PCTL's continued installation of equipment with distributors and/or customers; subsequent installations of PCTL's Annihilyzer Infection Control Systems and other larger-volume equipment; PCTL's ability to raise sufficient funds to satisfy its working capital requirements; the ability of PCTL to execute its business plan; any other effects resulting from the information disclosed above; risks and effects of legal and administrative proceedings and government regulation; future financial and operational results; competition; general economic conditions; and the ability to manage and continue growth. Should one or more of these risks or uncertainties materialize, or should underlying assumptions prove incorrect, actual outcomes may vary materially from those indicated. Important factors that could cause actual results to differ materially from the forward-looking statements PCTL makes in this press release include market conditions and those set forth in reports or documents it files from time to time with the SEC. PCTL undertakes no obligation to revise or update such statements to reflect current events or circumstances after the date hereof or to reflect the occurrence of unanticipated events.


Contacts

Gary Grieco, CEO and Chairman, PCT LTD
+1(843) 390-7900 Office
www.para-con.com
www.pctcorphealth.com
www.survivalyte.com

Rich Inza, Investor Relations (RMJ Consulting, LLC)
+1(843) 491-4611
This email address is being protected from spambots. You need JavaScript enabled to view it.

Dave Donlin
Cervelle Group
407-405-8142

Bulk Efficiently and Cost-Effectively Supports Aker BP’s High Performance Computing with Added Flexibility, Scalability and More

OSLO, Norway--(BUSINESS WIRE)--#AkerBP--Bulk Data Centers, one of the Nordics’ leading data center providers delivering ultra-flexible, scalable, highly connected and sustainable solutions, announces that it has been selected as the colocation provider of choice by Aker BP. Aker BP is a fully-fledged exploration and production company on the Norwegian Continental Shelf. Measured in production, Aker BP is one of the largest independent oil companies in Europe.


Looking to expand with a new High Performance Computing (HPC) cluster, Aker BP required flexible, cost-effective options that could be deployed quickly to meet immediate needs while provisioning room for later expansion.

Bulk is providing Aker BP with a dedicated, secure colocation solution within its Oslo Internet Exchange (OS-IX), supporting up to 20 kW per rack. OS-IX is Norway's best-connected data center and is powered by renewable energy. This colocation solution is complemented by dark fiber connectivity sourced by Bulk from Fortum Fiber.

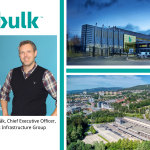
“We’re proud to support Aker BP,” states Jon Gravråk, CEO of Bulk Data Centers. “The value of Nordic digital infrastructure’s low operating costs when it comes to dense requirements such as those found in HPC — combined with our strategic location, scalability and flexibility — allowed us to deliver a tailored, meticulous solution to the company’s evolving needs. We look forward to supporting Aker BP as they continue on their path of growth.”

Bulk takes the sustainability and business value of the Nordic data center to the next level, serving as an ideal partner for power-intensive data processing needs. With green-powered data center locations that offer enhanced power resilience, scalability and flexibility, Bulk Data Centers ensures workloads run with the utmost availability, cost efficiency and responsiveness. This commitment, combined with the company’s decades of insight and expert in-house engineering and service teams, cements its capabilities as a trusted advisor to cloud service providers, enterprises, hyperscalers and more.

To learn more about Bulk Data Centers, please visit www.bulkinfrastructure.com.

About Bulk Data Centers

Bulk Data Centers (Bulk) delivers ultra-flexible, highly connected, and massively scalable data center and colocation solutions backed by personalized service excellence. As a trusted advisor offering strategically located data centers in Norway and Denmark, Bulk enables customers to reduce costs and environmental impact. Bulk leads the industry in resilience, cost efficiency, scalability and sustainability with solutions that deliver long-term growth potential with the lowest total cost of ownership. From colocation to powered land, Bulk supports business-critical solutions with unsurpassed standards, power and connectivity. To learn how Bulk Data Centers can solve your complex data and communications logistics challenges, visit bulkinfrastructure.com and follow us on LinkedIn, Twitter and Facebook.

Bulk Data Centers is a division of Bulk Infrastructure, a leading provider of sustainable digital infrastructure in the Nordics. Bulk Infrastructure is an industrial investor, developer and operator of industrial real estate, data centers and dark fiber networks.

About Aker BP

Aker BP is a full-fledged E&P company with exploration, development and production activities on the Norwegian Continental Shelf (NCS). Measured in production, Aker BP is one of the largest independent oil companies in Europe. Aker BP has a balanced portfolio and is the operator of the Valhall, Ula, Ivar Aasen, Alvheim and Skarv field hubs. Aker BP also holds a 11.5733% share of the Johan Sverdrup field. The company is headquartered at Fornebu outside Oslo and has offices in Stavanger, Trondheim, Harstad and Sandnessjøen.


Contacts

Ilissa Miller
iMiller Public Relations
email: This email address is being protected from spambots. You need JavaScript enabled to view it.
Tel: +1.914.315.6424

NEW YORK--(BUSINESS WIRE)--#insurance--Starr Marine, a division of Starr Insurance Companies, has introduced a comprehensive Terminal Management System (TMS) Assessment Program, designed to help Starr clients identify and reduce the risks unique to marine terminal operations of all sizes.


The TMS program, developed in conjunction with industry experts, is a proprietary tool created to measure terminal operations against industry best practices. Using independent marine surveyors, the Starr Marine Loss Control Services Team works with the terminal’s management to conduct a thorough on-site evaluation and review of operational, maintenance and safety procedures.

The assessment provides clients with a benchmarked score and detailed recommendations to enhance risk management initiatives and loss control plans for their operations.

“Our efforts to develop the TMS tool predates the recent spate of high-profile port losses,” said Matthew Davis, senior vice president and head of Starr Marine. “Events like these, however, are a reminder of why Starr’s loss control approach is central to how we work with clients – to prevent losses before they happen.”

About Starr Insurance Companies

Starr Insurance Companies (or Starr) is a marketing name for the operating insurance and travel assistance companies and subsidiaries of Starr International Company, Inc. and for the investment business of C. V. Starr & Co., Inc. and its subsidiaries. Starr is a leading insurance and investment organization with a presence on six continents; through its operating insurance companies, Starr provides property, casualty, and accident and health insurance products as well as a range of specialty coverages including aviation, marine, energy and excess casualty insurance. Starr’s insurance company subsidiaries domiciled in the U.S., Bermuda, China, Hong Kong, Singapore, U.K. and Malta each have an A.M. Best rating of “A” (Excellent). Starr’s Lloyd’s syndicate has a Standard & Poor’s rating of “A+” (Strong).

Visit us at www.starrcompanies.com or follow us LinkedIn and Twitter.


Contacts

Charlie Armstrong
Vice President, Marketing
This email address is being protected from spambots. You need JavaScript enabled to view it., 646.758.8308

TULSA, Okla.--(BUSINESS WIRE)--NGL Energy Partners LP (NYSE: NGL) announced today that the Board of Directors of its general partner has declared a quarterly distribution of $0.10 per unit, or $0.40 per unit on an annualized basis, for the quarter ended September 30, 2020. This cash distribution is payable on November 13, 2020 to common unitholders of record at the close of business on November 6, 2020.


“Our Board has made the strategic decision to adjust our annualized common unit distribution to $0.40 per unit,” stated Mike Krimbill, NGL’s CEO. “Numerous considerations factored into this decision. Our business segments performed in-line with our expectations during the fiscal second quarter and we expect over 5.0x common unit coverage for the period. We are working with our bank group to extend our credit facility maturity. This distribution adjustment should benefit those discussions. We were also yielding over 20% on our common units and we believe the best use of our cash at this time is to reduce indebtedness, improve leverage and reduce bank commitments in the short-term.”

Continued Krimbill, “Our business has continued to perform well despite the challenges faced by the energy industry and the Partnership. Since the end of the quarter, we have successfully completed our Poker Lake pipeline and tie-in and have seen produced water volumes average approximately 1.6 million barrels per day. We continue to see incremental activity around our Northern Delaware Basin water platform and expect volumes to trend favorably through the remainder of the fiscal year. We are entering the winter gasoline butane-blending and propane heating season in a strong position and expect our Liquids segment to perform well again this year. With respect to debt reduction, we continue to identify opportunities to monetize assets at favorable multiples and, since March 2020, we have repurchased and retired approximately $125 million of unsecured notes at a discount, resulting in a net $50 million debt reduction.”

In addition to the common unit distribution, the Board of Directors declared a cash distribution in the required amount of $15.6 million, which amount represents the Class D Distribution Amount to be paid to the holders of the Class D Preferred Units. The Class D Preferred distribution will also be made on November 13, 2020.

NGL plans to issue its fiscal second quarter ended September 30, 2020 earnings press release post-market close on Monday November 9, 2020. Members of NGL’s management team intend to host an earnings call following this release on Monday, November 9, 2020 at 4:00 pm CT to discuss its financial results. Analysts, investors, and other interested parties may access the conference call by dialing (800) 291-4083 and providing access code 8880357. An archived audio replay of the call will be available for 7 days beginning at 1:00 pm CT on November 10, 2020, which can be accessed by dialing (855) 859-2056 and providing access code 8880357.

Forward Looking Statements

This press release includes “forward-looking statements.” All statements other than statements of historical facts included or incorporated herein may constitute forward-looking statements. Actual results could vary significantly from those expressed or implied in such statements and are subject to a number of risks and uncertainties. While NGL believes such forward-looking statements are reasonable, NGL cannot assure they will prove to be correct. The forward-looking statements involve risks and uncertainties that affect operations, financial performance, and other factors as discussed in filings with the Securities and Exchange Commission. Other factors that could impact any forward-looking statements are those risks described in NGL’s annual report on Form 10-K, quarterly reports on Form 10-Q, and other public filings. You are urged to carefully review and consider the cautionary statements and other disclosures made in those filings, specifically those under the heading “Risk Factors.” NGL undertakes no obligation to publicly update or revise any forward-looking statements except as required by law.

About NGL Energy Partners LP

NGL Energy Partners LP, a Delaware limited partnership is a diversified midstream energy company that transports, stores, markets and provides other logistics services for crude oil, natural gas liquids and other products and transports, treats and disposes of produced water generated as part of the oil and natural gas production process. For further information, visit the Partnership’s website at www.nglenergypartners.com.

This release is a qualified notice under Treasury Regulation Section 1.1446-4(b). Brokers and nominees should treat 100% of NGL Energy Partner LP’s distributions to foreign investors as being attributable to income that is effectively connected with a United States trade or business. Therefore, distributions to foreign investors are subject to federal income tax withholding at the highest applicable effective tax rate.


Contacts

NGL Energy Partners LP Trey Karlovich, 918.481.1119
Executive Vice President and Chief Financial Officer This email address is being protected from spambots. You need JavaScript enabled to view it.
or
Linda Bridges, 918.481.1119
Senior Vice President – Finance and Treasurer This email address is being protected from spambots. You need JavaScript enabled to view it.

A streamlined online tool to effectively feed continuous improvement initiatives

MIAMI--(BUSINESS WIRE)--Brenock Technology, LLC (Brenock), a provider of software applications and consulting services for multiple industries including the cruise, marine and hospitality sectors, today announced its new employee engagement and idea management platform, Idea Pipeline. Idea Pipeline is a cloud-based enterprise engagement tool that allows human resources directors, organization leaders and other department heads to source and implement ideas and solutions from their employees, through a digital platform. The tool is available for use on desktop and mobile devices and empowers employees to champion innovation within their company.


The development of Idea Pipeline began as a project for a Brenock customer. Brenock enlisted the help of Ric Pratte, president of Idea Pipeline, to provide a solution that would help meet its customer’s engagement needs. After seeing the impact the platform had on employee involvement and morale, Brenock partnered with Ric to build and drive Idea Pipeline as a new division and standalone product for the company.

“Giving employees a voice is one of the most beneficial ways to proactively improve employee experience. Employees are the closest to customer issues and directly impacted by internal process challenges,” said Pratte. “Idea Pipeline shares the improvement responsibility to help make employees feel trusted and accountable. As an active continuous improvement program, the solution affects organizations’ productivity and bottom lines. It’s a cost-effective method to improve quality, increase revenue and improve customer satisfaction.”

In addition to providing a streamlined process for idea sharing, Idea Pipeline encourages users to participate and crowdsource feedback to elevate the quality of ideas. This blend as an engagement and continuous improvement platform, allows decision makers to improve representation of perspectives when solving problems and making changes within their company or department.

Idea Pipeline also offers analytics and insights to help organizations assess and implement ideas. As the suggestions are being evaluated, the platform provides real-time status updates promoting transparency and increasing collaboration among teams. Further, the tool is a web-based SaaS platform, which allows members of the organization to access and collaborate on the tool anywhere there is an internet connection, without needing to download additional apps.

“Expanding the availability of Idea Pipeline in our portfolio was an easy decision,” said Manus Walsh, president at Brenock. “We knew it could deliver broader value to marine leaders looking to strengthen their business and better engage crew members following the economic challenges of the global pandemic. We are eager to empower ports, shipping companies and vendors through a bottom-up approach to openly solve common challenges and uncover new opportunities.”

Another differentiator of Idea Pipeline is its pricing plan based on idea evaluation. Unlike other collaboration tools that determine pricing by number of users, potentially limiting some employees from putting forth ideas, Idea Pipeline utilizes “Number of Ideas Entered,” an internal metric which allows an unlimited number of people to participate and contribute. The pricing is then determined by the total number of “valid” ideas maintained in the system. This does not include inappropriate, offensive, not accepted or deleted ideas. Pricing by executed ideas and not the number of people using the system, allows companies to scale with the value they are receiving from the platform.

Idea Pipeline is Brenock’s first product announcement since the company announced its joint venture with Tideworks Technology Inc. (Tideworks), a full-service provider of comprehensive terminal operating system (TOS) solutions. The joint venture was announced in June 2020 and is aligned with Tideworks’ parent company, Carrix’ mission to increase collaboration across workforces and enterprises within the global supply chain.

About Brenock Technology

Brenock is a software development company founded in 1995 in Miami. As a trusted technology partner with a proven history of innovation, integrity and flexibility, the company develops cloud-based applications that enable leaders in the marine, hospitality, transportation, medical and financial sectors to improve productivity and secure increased ROI on their IT investments. Brenock can be contacted toll free at (800) 496-7066, or online at www.brenock.com.


Contacts

AnnMarie (Henriksson) Carson, Communiqué PR
Phone: (206) 282-4923 ext. 119
Email: This email address is being protected from spambots. You need JavaScript enabled to view it.

SAN ANTONIO--(BUSINESS WIRE)--NuStar Energy L.P. (NYSE: NS) today announced that its Board of Directors has declared a third quarter 2020 common unit distribution of $0.40 per unit. The third quarter common unit distribution will be paid on November 13, 2020 to holders of record as of November 6, 2020.


NuStar Energy L.P.’s Board of Directors also declared a third quarter 2020 Series A preferred unit distribution of $0.53125 per unit, a Series B preferred unit distribution of $0.47657 per unit and a Series C preferred unit distribution of $0.56250 per unit. The preferred unit distributions will be paid on December 15, 2020 to holders of record as of December 1, 2020.

A conference call with management is scheduled for 9:00 a.m. CT on Thursday, November 5, 2020, to discuss the financial and operational results for the third quarter of 2020. Investors interested in listening to the discussion may dial toll-free 844/889-7787, passcode 3097533. International callers may access the discussion by dialing 661/378-9931, passcode 3097533. The partnership intends to have a playback available following the discussion, which may be accessed by dialing toll-free 855/859-2056, passcode 3097533. International callers may access the playback by dialing 404/537-3406, passcode 3097533. The playback will be available until 12:00 p.m. CT on December 5, 2020.

Investors interested in listening to the live discussion or a replay via the internet may access the discussion directly at https://edge.media-server.com/mmc/p/bsztt3hp or by logging on to NuStar Energy L.P.’s website at www.nustarenergy.com.

NuStar Energy L.P., a publicly traded master limited partnership based in San Antonio, is one of the largest independent liquids terminal and pipeline operators in the nation. NuStar currently has approximately 10,000 miles of pipeline and 75 terminal and storage facilities that store and distribute crude oil, refined products and specialty liquids. The partnership’s combined system has approximately 75 million barrels of storage capacity, and NuStar has operations in the United States, Canada and Mexico. For more information, visit NuStar Energy L.P.'s website at www.nustarenergy.com.

This release serves as qualified notice to nominees under Treasury Regulation Sections 1.1446-4(b)(4) and (d). Please note that 100% of NuStar Energy L.P.’s distributions to foreign investors are attributable to income that is effectively connected with a United States trade or business. Accordingly, all of NuStar Energy L.P.’s distributions to foreign investors are subject to federal income tax withholding at the highest effective tax rate for individuals and corporations, as applicable. Nominees, and not NuStar Energy L.P., are treated as the withholding agents responsible for withholding on the distributions received by them on behalf of foreign investors.


Contacts

NuStar Energy, L.P., San Antonio
Investors, Tim Delagarza, Manager, Investor Relations
Investor Relations: 210-918-INVR (4687)
or
Media, Mary Rose Brown, Executive Vice President and Chief Administrative Officer,
Corporate Communications: 210-918-2314
website: http://www.nustarenergy.com

PLANO, Texas--(BUSINESS WIRE)--Performance Pipe, a division of Chevron Phillips Chemical Company LP, today announced it is now an exclusive distributor of Supraflow™ gas pipe tap tees manufactured by Spain-based Grupo Torre for Canada and most of the U.S. The Supraflow™ gas pipe tees offer utility operators a new solution to streamline how to tap 4- to 18-inch pressurized polyethylene (PE) gas pipe lines with outlets of 4, 6 and 8 inches.


We are proud to supply Supraflow™ gas pipe tap tees that offer an economical larger outlet tap without compromising on safety,” said Curt Shill, fittings manager at Performance Pipe. “This innovative product is in stock and available to gas pipe markets where alternative solutions are more complicated and more involved.”

Grupo Torre manufactures Supraflow™ gas pipe tap tees with Performance Pipe’s PE4710 high-density polyethylene (HDPE) molded butt fusion tee fittings. Features and benefits offered by Supraflow™ gas pipe tap tees include:

  • ASTM D2513 compliant
  • 4- to 18-inch SDR 11 gas main hot taps with 4-, 6- or 8-inch IPS branch outlets
  • No interruption to gas service during installation
  • Less excavation and restoration costs, resulting in reduced traffic and public disturbances
  • Compact and lightweight drill assembly (sold separately)
  • Significant installation time reduction
  • Universal installation procedure for all Supraflow™ gas pipe tap tees
  • Single-operator installation
  • Installation options allow for 360-degree orientation around the main pipe and the product itself

Supraflow™ gas pipe tap tees represent one the most efficient solutions currently available for gas pipe diversions and extensions,” said Daniel Guilló, commercial manager at Grupo Torre. “We designed this product to make it operationally flexible, compact, and easy and safe to install, which leads to less disruption to public life and higher cost savings for utility companies.”

Click here to access product specifications and purchase information; a video description of the product also is available here.

About Performance Pipe

Performance Pipe is a division of Chevron Phillips Chemical Company LP and is one of the largest pressure pipe manufacturers in North America, with seven manufacturing facilities located throughout the United States. Performance Pipe’s DriscoPlex™ and Driscopipe™ brands of medium density and high-density polyethylene gas pipe are regularly sold to more than 400 customers worldwide. For more information about Performance Pipe, visit www.performancepipe.com.

About Chevron Phillips Chemical

Chevron Phillips Chemical is one of the world’s top producers of olefins and polyolefins and a leading supplier of aromatics, alpha olefins, styrenics, specialty chemicals, plastic piping and polymer resins. With approximately 5,000 employees, Chevron Phillips Chemical and its affiliates own nearly $17 billion in assets, including 31 manufacturing and research facilities in six countries. Chevron Phillips Chemical is equally owned indirectly by Chevron U.S.A. Inc. and Phillips 66 Company, and is headquartered in The Woodlands, Texas. For more information about Chevron Phillips Chemical, visit www.cpchem.com. Also, follow us on Twitter: @chevronphillips.

“Chevron Phillips Chemical” or “CPChem” may refer to one or more Chevron Phillips Chemical’s subsidiaries or affiliates or to all of them taken as a whole. All of these terms are used for convenience only and are not intended as a precise description of any of the separate companies, each of which manages its own affairs.

About Grupo Torre

Grupo Torre is an industrial company based in Barcelona, Spain. The firm has been developing system components and services for work on water, gas and steam networks since 1878, with a philosophy based on constant innovation and improving safety. The team of employees that Messrs. Vivé and Casals built up in 1878 has, with the passing of time, evolved and adapted into a highly qualified and technically competent team that is able to meet the complex needs of modern-day industry, based on over a century of experience.


Contacts

News Inquiries: Nicola Facchin
Phone: 832-813-4264; email: This email address is being protected from spambots. You need JavaScript enabled to view it.

Ultra High-Definition transducers offer stunning clarity and improved performance with 20% greater range

OLATHE, Kan.--(BUSINESS WIRE)--Garmin® International, Inc., a unit of Garmin Ltd. (NASDAQ:GRMN), the world’s leading marine electronics manufacturer1, today introduced the GT56 and GT36, its latest transducers offering Ultra High-Definition (UHD) ClearVü and SideVü scanning sonar with 20% greater range and three frequencies for top performance with improved clarity.


“We’re excited to add the GT56 and GT36 to our expansive line of transducers for anglers who want to take their fishing to the next level with the clearest and highest resolution data from a Garmin scanning sonar,” said Dan Bartel, Garmin vice president of global consumer sales. “With optimized SideVü performance and multiple sonar frequencies, these new transducers easily adapt to all fishing styles and bodies of water, so anglers can cover more area than ever before.”

The new GT56 and GT36 transducers deliver the ultimate in sonar versatility. They offer UHD ClearVü and SideVü scanning sonar, so anglers can see stunningly clear images of structure and fish below and off to the sides of their boat. What’s more, Garmin’s UHD SideVü sonar now has 20% greater range at 1,000 kHz, so anglers can scan waters further and in greater detail than ever. In addition to UHD ClearVü and SideVü scanning sonars, the all-in-one GT56 transducer also offers high wide CHIRP traditional sonar with remarkably clear target separation and definition up to 800 feet below the boat.

With multiple scanning sonar frequencies, anglers can make simple adjustments for the waters they’re fishing. Both the GT56 and GT36 deliver 455 kHz, 800 kHz and 1,000 kHz for improved scanning performance at varying depths. They also support Garmin’s new high-contrast vivid scanning sonar color palettes, making it easier to distinguish fish from structure based on the user’s preferences and fishing conditions. With seven new vivid color options added, Garmin now offers a choice of 16 color palettes.

Garmin is also excited to offer new ECHOMAP UHD “sv” and ECHOMAP Ultra bundles with the GT56 transducer included. The bundles have varying suggested retail prices from $849.99 to $2,899.99. The GT56 and GT36 will also be sold individually with suggested retail prices of $449.99 and $399.99, respectively, with included transom and trolling motor mounting hardware. They are compatible with the GPSMAP® 8400xsv and 8600xsv series, the new GPSMAP 7x3, 9x3 and 12x3 “sv” chartplotters, as well as the ECHOMAP Ultra series and the ECHOMAP UHD “sv” chartplotters. All are expected to be available next month. To learn more, visit garmin.com/marine.

Engineered on the inside for life on the outside, Garmin products have revolutionized life for anglers, sailors, mariners and boat enthusiasts everywhere. Committed to developing the most sophisticated marine electronics the industry has ever known, Garmin believes every day is an opportunity to innovate and a chance to beat yesterday. For the sixth consecutive year, Garmin was recently named the Manufacturer of the Year by the National Marine Electronics Association (NMEA). Other Garmin marine brands include Fusion® and Navionics®. For more information, visit Garmin's virtual pressroom at garmin.com/newsroom, contact the Media Relations department at 913-397-8200, or follow us at facebook.com/garmin, twitter.com/garminnews, instagram.com/garmin or youtube.com/garmin.

1 Based on 2019 reported sales

About Garmin International, Inc. Garmin International, Inc. is a subsidiary of Garmin Ltd. (Nasdaq: GRMN). Garmin Ltd. is incorporated in Switzerland, and its principal subsidiaries are located in the United States, Taiwan and the United Kingdom. Garmin, GPSMAP, Navionics and Fusion are registered trademarks and ECHOMAP is a trademark of Garmin Ltd. or its subsidiaries.

All other brands, product names, company names, trademarks and service marks are the properties of their respective owners. All rights reserved.

Notice on Forward-Looking Statements:

This release includes forward-looking statements regarding Garmin Ltd. and its business. Such statements are based on management’s current expectations. The forward-looking events and circumstances discussed in this release may not occur and actual results could differ materially as a result of known and unknown risk factors and uncertainties affecting Garmin, including, but not limited to, the risk factors listed in the Annual Report on Form 10-K for the year ended December 28, 2019, filed by Garmin with the Securities and Exchange Commission (Commission file number 0-31983). A copy of such Form 10-K is available at https://www.garmin.com/en-US/company/investors/earnings/. No forward-looking statement can be guaranteed. Forward-looking statements speak only as of the date on which they are made and Garmin undertakes no obligation to publicly update or revise any forward-looking statement, whether as a result of new information, future events, or otherwise.

Category: Marine


Contacts

Carly Hysell
913-397-8200
This email address is being protected from spambots. You need JavaScript enabled to view it.

New Protein, Planet and Pet Pledges, aligned to United Nations Sustainable Development Goals (SDGs), aim to provide improved access to nutritious protein, reduce the company’s and customers’ footprint on the planet, and help support more healthy pets that in turn support people’s wellbeing.

GREENFIELD, Ind.--(BUSINESS WIRE)--Elanco Animal Health Incorporated (NYSE: ELAN) today announced its first sustainability commitments, just two years after becoming an independent company. The decade-long commitments support the SDGs, address societal challenges and underscore Elanco’s role in improving the health of animals, which also improves the health of people and the planet.


Today, the company is issuing three Healthy Purpose Pledges to drive sustainable change by 2030, including:

  • Protein Pledge: Create more resilient food systems by enabling 57 million more people to access their annual nutritious protein needs.
  • Planet Pledge: Remove 21 million tons of emissions from customers’ farms while reducing the company’s own impact on the planet.
  • Pet Pledge: Improve the world’s wellbeing by helping at least 100 million healthy pets help people.

"Business can be a unique force for good, and at Elanco, we believe we have the opportunity and responsibility to help tackle key societal challenges," said Jeff Simmons, president and CEO at Elanco. "Elanco's Healthy Purpose sustainability commitments, the first of its kind in the animal health industry, advances the world’s wellbeing while supporting and strengthening our own business. It all starts with a healthy, strong enterprise driven by the growth, innovation and margin expansion agenda we are executing against. Through these efforts, Elanco is focused on creating value for our customers, employees, shareholders and society as a whole.”

With millions in the world unable to access affordable, nutritious protein, the Elanco Protein Pledge is an active commitment to improve the efficiency and sustainability of every farmer the company works with, improve the health and welfare of 3 billion farm animals and support and enhance agricultural productivity and income of 250,000 dairy and poultry smallholder farmers.

The natural environment needs protection and Elanco can help reduce impacts and develop solutions to support customers, while minimizing the company’s own impact. Elanco’s Planet Pledge is a commitment to be customers’ lead partner on the journey toward net zero emissions on their farms, grow the product portfolio with environmental benefits and accelerate toward sustainable packaging while achieving 100% renewable sources of electricity across the company’s operations.

Ultimately, the combination of Elanco’s Protein and Planet Pledges will help the company drive a decrease in the global emissions intensity of animal protein by 2%, compared to business-as-usual 2030.

The connection between animals and humans is powerful. Pets can be a prescription on four legs to improve physical, social and emotional health. Elanco’s Pet Pledge will help 40 million more pets receive better care through the company's work with veterinarians and pet owners, innovate by delivering a constant flow of new medicines and health products for pets, and help the world understand and experience the benefits of pets on wellbeing.

“Three clear reasons will help us achieve our Healthy Purpose Pledges – the Elanco Differentiators: People, Access, and Innovation,” said Simmons. “With the industry’s most passionate, highly-engaged people, innovation created with purpose, and access to 19 species of animals in nearly 100 countries, Elanco has the ability to address our customers’ and society’s greatest needs. We look forward to partnering with, and learning from, our customers and stakeholders who share our drive to achieve these goals.”

Elanco believes in creating a culture of people with purpose, an inclusive safe harbor where employees can bring their whole self to work and have the opportunity for personal growth, defining their own purpose or “why” and creating their own personal standard operating procedure to support wellbeing.

The company is committed to tracking performance and engaging with stakeholders through ongoing dialogue, input, and regular performance disclosure. This commitment includes learning from experts and partners to ensure the approach evolves in line with best practices and the world’s needs. Watch Elanco’s Healthy Purpose Pledges and its measures come to life on Elanco.com and through Elanco’s social channels.

ABOUT ELANCO

Elanco Animal Health Incorporated (NYSE: ELAN) is a global leader in animal health dedicated to innovating and delivering products and services to prevent and treat disease in farm animals and pets, creating value for farmers, pet owners, veterinarians, stakeholders, and society as a whole. With nearly 70 years of animal health heritage, we are committed to helping our customers improve the health of animals in their care, while also making a meaningful impact on our local and global communities. At Elanco, we are driven by our vision of Food and Companionship Enriching life and our Elanco Healthy Purpose™ Sustainability/ESG framework – all to advance the health of animals, people and the planet. Learn more at www.elanco.com.

Forward Looking Statements

This press release may include certain statements concerning expectations for the future that are forward-looking statements as defined by federal securities law. Such forward-looking statements are subject to a variety of known and unknown risks, uncertainties, and other factors that are difficult to predict and many of which are beyond management’s control. These risks and assumptions are described in Elanco’s annual reports on Form 10-K and other reports that are available from the U.S. Securities and Exchange Commission. Readers are cautioned not to place undue reliance on forward-looking statements, which reflect management’s view only as of the date made. We undertake no obligation to update any forward-looking statement, except as otherwise required by law.


Contacts

Media Contact: Colleen Parr Dekker +1.317.989.7011 This email address is being protected from spambots. You need JavaScript enabled to view it.
Investor Contact: Tiffany Kanaga +1.302.897.0668 This email address is being protected from spambots. You need JavaScript enabled to view it.

Prime Impact Fund leads financing to accelerate market adoption of Leading Edge’s next-generation solar panel manufacturing approach


WILMINGTON, Mass.--(BUSINESS WIRE)--Leading Edge Equipment Technologies, the maker of revolutionary silicon wafer manufacturing equipment for solar panels, announced today the closing of $7.6 million in Series A financing led by Prime Impact Fund. Clean Energy Ventures and DSM Venturing also participated in the financing.

“Leading Edge’s technology is poised to structurally disrupt solar panel manufacturing,” said Matthew Nordan, Managing Director at Prime Impact Fund. “As solar accelerates globally, Leading Edge provides an unusual opportunity to increase panel efficiency, reduce cost, and slash greenhouse gas emissions from the panel production process. We’re excited to work with Rick, Alison, Nathan, and the rest of the team to quickly commercialize this manufacturing technology.”

Leading Edge empowers solar panel manufacturers with a new drop-in manufacturing technology that produces kerfless, single-crystal silicon wafers. This manufacturing technology reduces wafer costs by 50 percent, increases commercial solar panel power by up to seven percent, and reduces manufacturing emissions by over 50 percent.

“After critical technology demonstrations and the development of a new commercial tool, we are now ready to launch this technology into market in 2021,” said Rick Schwerdtfeger, CEO of Leading Edge who joined the team in 2020 to lead commercialization. “Having recently secured a 31,000 square foot facility and doubled the size of our team, we will use this new funding to prepare for our 2021 commercial pilots.”

Current silicon wafer production technology is a seven-step process in which large silicon ingots, created in large and energy-intensive furnaces, are wire-sawn into wafers. This approach is extremely wasteful, incurs high energy costs, and produces low-quality wafers that reduce solar panel efficiency. Leading Edge’s manufacturing equipment uses its patented Floating Silicon Method™ to produce silicon wafers through ribbons. This reduces the production process to a single step while also consuming less energy and producing almost no waste product.

“Despite intense growth in the solar industry over the last decade, many manufacturers have struggled to remain profitable, competing on market share and marginal cost reductions. We’re excited to empower manufacturers with a game-changing competitive advantage and unlock cost-effective, high-efficiency solar power,” said Alison Greenlee, Co-founder and Chief Commercial Officer of Leading Edge.

Previous investors in Leading Edge Equipment Technologies include DSM Venturing, Applied Materials, Clean Energy Ventures, Clean Energy Venture Group and David Buzby.

About Leading Edge Equipment Technologies
Leading Edge Equipment Technologies has developed a revolutionary crystal growth manufacturing technology that creates kerfless, single-crystal silicon wafers for solar panels. The company builds drop-in manufacturing equipment for solar panel manufacturers that can lower all-in module production costs, improve solar cell efficiency, and reduce manufacturing emissions. Learn more at www.leadingedgetech.io.


Contacts

Ted Dillon
This email address is being protected from spambots. You need JavaScript enabled to view it.

RNG projects to reduce environmental impact of dairy manure and improve odor and nutrient management practices

SAN FRANCISCO--(BUSINESS WIRE)--Brightmark, the global waste solutions provider, today announced that it has partnered with three New York dairy farms on the Helios Project, the latest in a series of renewable natural gas (RNG) projects the company has launched over the past two years. The project is part of the recently announced joint venture Brightmark RNG Holdings LLC, a Brightmark platform in partnership with Chevron U.S.A. Inc.


Gardeau Crest Farms located in Western New York and Lawnhurst Farms and Willet Dairy, located in New York’s Finger Lakes Region, have each signed supply agreements with Brightmark indicating their intent to provide the company with dairy manure from their herds that will serve as feedstock for the three existing anaerobic digesters on the farms. The digesters will capture, extract, and clean the methane in the manure, then convert it into RNG and inject it into a nearby gas pipeline for distribution.

When fully operational in the third quarter of 2021, the digesters will produce up to 500 MMBtu of RNG per day or 182,500 MMBtu per year between the three dairy farms. Brightmark has partnered on RNG projects with 23 dairy farms in nine states over the past two years. Once all of these projects are operational, Brightmark’s RNG projects will generate enough renewable natural gas each year to drive 1,600 18-wheeler trucks from San Francisco to New York City.

“We are excited to partner with Gardeau Crest, Lawnhurst and Willet to further expand our renewable natural gas projects in New York and deliver environmental and economic benefits to their communities,” said Bob Powell, Founder and Chief Executive Officer of Brightmark. “Brightmark aims to offset 22 million metric tons of CO2 by 2024 with our RNG projects and these partnerships are critical in helping us achieve our goal.”

Anaerobic digestion systems can prevent significant quantities of methane, a potent greenhouse gas, from being released into the atmosphere. Research shows that when all climate benefits are considered together, RNG from dairy manure can reduce greenhouse gas emissions 400% when it is used to replace traditional vehicle fuels through this net carbon-negative process. These projects will reduce the net greenhouse gas emissions from the manure processed at this facility at a rate of 55,000 metric tons of CO2e per year, which is equivalent to planting 72,000 acres of forest each year. After the methane is extracted from the processed manure, the remaining materials will be returned to the farmers for use as fertilizer on their fields that grow crops for their cows. These partnerships will allow the farms to reduce land application of manure and improve odor and nutrient management practices.

“We are proud to partner with Brightmark to further reduce our environmental impact and to ensure that we continue to be good neighbors to our local community with the odor management benefits our anaerobic digester provides,” said Don Jensen of Lawnhurst Farms. “This partnership allows us to convert our manure waste into a valuable resource, while also improving odor control and reducing our emissions – a win-win-win for our farm, our community and the environment.”

ABOUT BRIGHTMARK

Brightmark is a global waste solutions company with a mission to reimagine waste. The company takes a holistic, closed loop, circular economy approach to tackling the planet’s most pressing environmental challenges with imagination and optimism for the future. Through the deployment of disruptive, breakthrough waste-to-energy solutions focused on plastics renewal (plastic waste-to-fuel) and renewable natural gas (organic waste-to-fuel), Brightmark enables programs specifically tailored to environmental needs in order to build scalable project solutions that have a positive impact on the world and communities in which its stakeholders live and work. For more information, visit www.brightmark.com.


Contacts

Media Contact:
Cory Ziskind
ICR
This email address is being protected from spambots. You need JavaScript enabled to view it.
646-277-1232

New 7-, 9- and 12-inch chartplotters and combo units transform the way anglers, cruisers and sailors see above and below the water

OLATHE, Kan.--(BUSINESS WIRE)--Garmin® International, Inc., a unit of Garmin Ltd. (NASDAQ:GRMN), the world’s leading marine electronics manufacturer1, today introduced the GPSMAP® 7x3, GPSMAP 9x3 and GPSMAP 12x3 series—its next generation of mid-sized chartplotters and combination units that offer a sleek and streamlined design, improved display optics and a robust feature set that seamlessly integrates into a Garmin marine system – available with and without built-in sonar.


“Building on the legacy of our flagship GPSMAP series, we’re excited to expand the premium look and feature set of our most-capable chartplotters across the full product line,” said Dan Bartel, Garmin vice president of global consumer sales. “Along with strikingly increased resolution, the mid-sized GPSMAP x3 series includes models that offer almost twice the processing power of previous-generation devices2 so users will benefit from increased performance across the boat’s entire network.”

Slim, stunning appearance

Designed for a wide range of dash configurations, the GPSMAP x3 series features slimline design borders with edge-to-edge glass displays. The maximized glass design can be bail-, flush- or flat-mounted and offers a reduced footprint. For superior clarity and sunlight readability, the GPSMAP 12x3 and 9x3 models offer high-resolution in-plane switching (IPS) touchscreens that provide consistent, accurate colors that can be seen from all viewing angles, even with polarized sunglasses. Additionally, the GPSMAP 9x3 and 7x3 models offer 50% and 60% more display pixels, respectively, compared to previous models. For existing Garmin customers3 who want to upgrade to the new GPSMAP x3 series, a retrofit kit is available for easy installation.

Premium processing power

Offering nearly double the processing power of the previous generation2, the premium power found in the GPSMAP x3 series significantly benefits all onboard sensors like sonar, radar, cameras, video and digital switching, and enhances the user experience across the entire network. Fast and responsive, these systems reference 10Hz GNSS (GPS, GLONASS and Galileo) for accurate positioning and smooth speed as well as course over ground (COG) data. The increase in processing power also delivers Garmin’s fastest mapping capabilities, so there’s hardly ever a delay, even at high speeds.

Built-in sonar and unparalleled cartography coverage

The sonar combo versions (xsv series) offer built-in support for 1kW traditional CHIRP sonar so anglers can see superior target separation up to 1,000 feet below the boat. These new combos also have buit-in support for Ultra High-Definition SideVü and ClearVü scanning sonars featuring Garmin’s new high-contrast vivid color palettes, making it easier for anglers to distinguish fish from structure. The xsv models also support the full Garmin Panoptix all-seeing sonar product line, including the revolutionary Panoptix LiveScope real-time live scanning sonar. Transducers are sold separately.

Navigate with confidence and ease thanks to Garmin’s preloaded exclusive BlueChart® g3 coastal charts and LakeVü g3 inland maps with integrated Navionics® data and Auto Guidance4 technology. Garmin’s industry leading cartography1 brings unrivaled detail and convenience to users by blending the best content from both Garmin and Navionics to provide navigational aids, spot soundings, depth contours, tides and currents, plus detailed harbors and marinas. For the most detailed data, customers can also add or download BlueChart g3 Vision and LakeVü g3 Ultra for access to Garmin’s high-resolution relief shading that combines color and shadow for an entirely new level of detail to the ocean floor and lake bottom. This premium cartography now offers relief shading coverage for the entire continental U.S. coast line and more than 150 lakes, respectively.

Seamless connectivity and integration

Like all other GPSMAP units, the powerful GPSMAP x3 series is fully network capable with NMEA® 2000 and the Garmin Marine Network, making it easy to build a customized electronics suite, including sonar, radar, autopilots, instruments, cameras and more. Featuring J1939 engine connectivity for engine integration, including select Yamaha engines, they’re also compatible with OneHelm, an exclusive feature that brings together all the operations and capabilities of third-party devices like EmpirBusdigital switching on one screen. OneHelm integration simplifies control and customization of the boat’s most crucial systems to one master source–the Garmin chartplotter.

Thanks to built-in Wi-Fi®, it’s easy to take advantage of the free all-in-one Garmin ActiveCaptain® mobile app for access to the OneChartfeature, Quickdraw and ActiveCaptain Community data and much more. ActiveCaptain also provides smart notifications5 directly to the chartplotter, over-the-air software updates, off-vessel planning capabilities and so much more. Users can also connect other compatible Garmin devices like the quatix® marine smartwatches, gWind Wireless 2 transducer, GNX Wind marine instruments and wireless remote controls to the GPSMAP x3 series through the device’s integrated ANT support. Finally, sailors will appreciate the built-in SailAssist feature that provides data, displays and prerace guidance needed to gain a competitive edge.

The new GPSMAP 7x3, 9x3 and 12x3 series will be available next month with a 7-, 9- and 12-display, respectively. The sonar versions (xsv series) have suggested retail prices ranging from $1099.99 to $2899.99, while the non-sonar versions have suggested retail prices of $999.99 to $2699.99. To learn more, visit garmin.com/marine.

Engineered on the inside for life on the outside, Garmin products have revolutionized life for anglers, sailors, mariners and boat enthusiasts everywhere. Committed to developing the most sophisticated marine electronics the industry has ever known, Garmin believes every day is an opportunity to innovate and a chance to beat yesterday. For the sixth consecutive year, Garmin was recently named the Manufacturer of the Year by the National Marine Electronics Association (NMEA). Other Garmin marine brands include Fusion® and Navionics. For more information, visit Garmin's virtual pressroom at garmin.com/newsroom, contact the Media Relations department at 913-397-8200, or follow us at facebook.com/garmin, twitter.com/garminnews, instagram.com/garmin or youtube.com/garmin.

1 Based on 2019 reported sales
2 GPSMAP 9x3 and 7x3 models only
3 Retrofit kit is compatible with previous generation models. Visit garmin.com/marine to check compatibility.
4 Auto Guidance is for planning purposes only and does not replace safe navigation operations
5 When paired with your compatible smartphone

About Garmin International, Inc. Garmin International, Inc. is a subsidiary of Garmin Ltd. (Nasdaq: GRMN). Garmin Ltd. is incorporated in Switzerland, and its principal subsidiaries are located in the United States, Taiwan and the United Kingdom. Garmin, GPSMAP, BlueChart, Navionics, ActiveCaptain, quatix and Fusion are registered trademarks and Panoptix, Panoptix LiveScope, OneHelm, EmpirBus, OneChart, Quickdraw, gWind and GNX are trademarks of Garmin Ltd. or its subsidiaries.

Wi-Fi® is a registered trademark of the Wi-Fi Alliance. All other brands, product names, company names, trademarks and service marks are the properties of their respective owners. All rights reserved.

Notice on Forward-Looking Statements:

This release includes forward-looking statements regarding Garmin Ltd. and its business. Such statements are based on management’s current expectations. The forward-looking events and circumstances discussed in this release may not occur and actual results could differ materially as a result of known and unknown risk factors and uncertainties affecting Garmin, including, but not limited to, the risk factors listed in the Annual Report on Form 10-K for the year ended December 28, 2019, filed by Garmin with the Securities and Exchange Commission (Commission file number 0-31983). A copy of such Form 10-K is available at https://www.garmin.com/en-US/company/investors/earnings/. No forward-looking statement can be guaranteed. Forward-looking statements speak only as of the date on which they are made and Garmin undertakes no obligation to publicly update or revise any forward-looking statement, whether as a result of new information, future events, or otherwise.

Category: Marine


Contacts

Carly Hysell
913-397-8200
This email address is being protected from spambots. You need JavaScript enabled to view it.

HOUSTON--(BUSINESS WIRE)--Cheniere Energy Partners, L.P. (“Cheniere Partners”) (NYSE American: CQP) today declared (i) a cash distribution of $0.650 ($2.60 annualized) per common unit to unitholders of record as of November 6, 2020, and (ii) the related distribution to its general partner. These distributions are payable on November 13, 2020.

This press release serves as qualified notice to nominees as provided for under Treasury Regulation Section 1.1446-4(b)(4) and (d). Please note that 100 percent of Cheniere Partners’ distributions to foreign investors are attributable to income that is effectively connected with a United States trade or business. Accordingly, all of Cheniere Partners’ distributions to foreign investors are subject to federal income tax withholding at the highest applicable effective tax rate. Nominees are treated as withholding agents responsible for withholding distributions received by them on behalf of foreign investors.

About Cheniere Partners

Cheniere Partners is developing, constructing and operating natural gas liquefaction facilities at the Sabine Pass LNG terminal located in Cameron Parish, Louisiana, on the Sabine-Neches Waterway less than four miles from the Gulf Coast. Cheniere Partners is currently operating five natural gas liquefaction Trains and is constructing one additional Train for a total production capacity of approximately 30 mtpa of LNG at the Sabine Pass terminal. The Sabine Pass LNG terminal has operational regasification facilities that include five LNG storage tanks, two marine berths and vaporizers and an additional marine berth that is under construction. Cheniere Partners also owns the Creole Trail Pipeline, a 94-mile pipeline that interconnects the Sabine Pass LNG terminal with a number of large interstate pipelines.

For additional information, please refer to the Cheniere Partners website at www.cheniere.com and Quarterly Report on Form 10-Q for the quarter ended June 30, 2020, filed with the Securities and Exchange Commission.

Forward-Looking Statements

This press release contains certain statements that may include “forward-looking statements.” All statements, other than statements of historical or present facts or conditions, included herein are “forward-looking statements.” Included among “forward-looking statements” are, among other things, (i) statements regarding Cheniere Partners’ financial and operational guidance, business strategy, plans and objectives, including the development, construction and operation of liquefaction facilities, (ii) statements regarding expectations regarding regulatory authorizations and approvals, (iii) statements expressing beliefs and expectations regarding the development of Cheniere Partners’ LNG terminal and liquefaction business, (iv) statements regarding the business operations and prospects of third parties, (v) statements regarding potential financing arrangements, (vi) statements regarding future discussions and entry into contracts, and (vii) statements regarding the COVID-19 pandemic and its impact on our business and operating results. Although Cheniere Partners believes that the expectations reflected in these forward-looking statements are reasonable, they do involve assumptions, risks and uncertainties, and these expectations may prove to be incorrect. Cheniere Partners’ actual results could differ materially from those anticipated in these forward-looking statements as a result of a variety of factors, including those discussed in Cheniere Partners’ periodic reports that are filed with and available from the Securities and Exchange Commission. You should not place undue reliance on these forward-looking statements, which speak only as of the date of this press release. Other than as required under the securities laws, Cheniere Partners does not assume a duty to update these forward-looking statements.


Contacts

Cheniere Energy Partners, L.P.
Investors
Randy Bhatia, 713-375-5479
Megan Light, 713-375-5492
or
Media Relations
Eben Burnham-Snyder, 713-375-5764
Jenna Palfrey, 713-375-5491

Improved performance in the third quarter 2020 delivered net income of $4.6 million, Adjusted EBITDA of $136.0 million, and Distributable Cash Flow of $86.5 million, a 5% year-over-year increase

Third quarter results include positive free cash flow after capital expenditures and distributions, distribution coverage of 1.9x, leverage of 4.1x, approximately $450 million in liquidity and no near-term maturities until 2023

Bakken activities returned to pre-COVID levels including record natural gas volumes on the Arrow system driven by accelerated well-connect activity, enhanced well productivity and full resumption of normal operations

Based on year-to-date results and current activity across Crestwood’s assets, full-year Adjusted EBITDA expected to exceed midpoint of the revised 2020 guidance range of $520 million to $570 million

Enhanced approach to sustainability focused on reduced emissions with the adoption of a flaring minimization policy, increased leak detection and repair and membership to The Environmental Partnership

HOUSTON--(BUSINESS WIRE)--Crestwood Equity Partners LP (NYSE: CEQP) (“Crestwood”) today reported its financial and operating results for the three months ended September 30, 2020.


Third Quarter 2020 Highlights (1)

  • Third quarter 2020 net income of $4.6 million, compared to net income of $33.6 million in third quarter 2019
  • Third quarter 2020 Adjusted EBITDA of $136.0 million, compared to $140.9 million in the third quarter 2019
  • Third quarter 2020 distributable cash flow to common unitholders of $86.5 million; Third quarter 2020 coverage ratio was 1.9x
  • Ended September 30, 2020 with approximately $2.6 billion in total debt and a 4.1x leverage ratio; Crestwood had $780 million drawn under its $1.25 billion revolver as of September 30, 2020
  • Announced third quarter 2020 cash distribution of $0.625 per common unit, or $2.50 per common unit on an annualized basis, payable on November 13, 2020, to unitholders of record as of November 6, 2020

Management Commentary

“In the third quarter, Crestwood’s diversified portfolio once again produced solid cash flow, despite continued commodity volatility, generating Adjusted EBITDA of $136.0 million and Distributable Cash Flow of $86.5 million. Both performance metrics were above consensus estimates and drove strong financial results of 4.1x leverage and 1.9x coverage allowing us to maintain our quarterly distribution unchanged,” said Robert G. Phillips, Chairman, President and Chief Executive Officer of Crestwood’s general partner. “Our third quarter results were highlighted by record natural gas volumes on the Arrow system, improved rig activity in the Bakken and Delaware Basin, strong demand for Crestwood’s natural gas and NGL storage assets and record natural gas transportation volumes across our Stagecoach pipelines in the Marcellus dry gas region. Additionally, our Marketing, Supply & Logistics segment continued to outperform expectations due largely to the NGL assets acquired in April 2020, which increased Crestwood’s NGL market share, hub access, storage capacity, customer base and optimization opportunities across the US.”

Mr. Phillips continued, “I am also pleased to announce that Crestwood achieved a key milestone of positive free cash flow after capital expenditures and distributions in the third quarter. When paired with the recent sale of our non-core Fayetteville assets, Crestwood has generated in excess of $50 million which we are using to reduce debt through the repayment of revolver borrowings and opportunistically repurchasing our 2023 senior notes. The improving fundamentals across the portfolio gives us confidence in the ability to deliver full-year Adjusted EBITDA in excess of the mid-point of our revised 2020 guidance range. Taking a peek into 2021, based on current forward pricing, we expect our assets to continue to perform well, with limited future capital expansions due to available capacity in all the areas we operate, and continue to generate free cash flow resulting in further debt reduction.”

Third Quarter 2020 Segment Results and Outlook

Gathering and Processing (G&P) segment EBITDA totaled $108.0 million in the third quarter 2020, an increase of 9% compared to $99.2 million in the third quarter 2019, which excludes a $20 million non-cash loss on the sale of the Fayetteville assets. Highlights during the third quarter 2020 include a 107% increase in Bakken natural gas processing volumes, a 31% increase in Bakken produced water gathering volumes, and a 25% increase in Bakken natural gas gathering volumes over third quarter 2019, combined with a full quarter contribution from the new Delaware Basin produced water gathering system which commenced service in April 2020. By the end of the quarter, all producers in the Bakken, Delaware Basin and Crestwood’s legacy gas basins had resumed normal operations with no commodity-price driven shut-ins while the Powder River Basin continued to experience lower volumes due to the ongoing Chesapeake Energy (“Chesapeake”) bankruptcy process. Crestwood expects higher Powder River Basin gas volumes during the fourth quarter 2020 as a result of improving natural gas prices. There is currently one rig and one completion crew operating on the Fort Berthold Indian Reservation in the Bakken and five rigs running on acreage dedicated to Crestwood in the Delaware Basin which will contribute additional well connects in the fourth quarter and drive increased volumes into 2021.

Storage and Transportation (S&T) segment EBITDA totaled $14.7 million in the third quarter 2020 compared to $17.3 million in the third quarter 2019. Third quarter 2020 natural gas storage and transportation volumes averaged 2.2 Bcf/d, which is flat compared to the third quarter 2019. In the third quarter 2020, a shift in producer capital to Northeast Pennsylvania combined with higher than normal volatility along the Gulf Coast due to weather and global LNG demand, drove increased utilization of Crestwood’s natural gas storage and transportation assets. Crestwood has a combined 76 Bcf of natural gas storage capacity strategically located in the Northeast and Gulf Coast, providing critical supply balancing services to Northeast utilities, Marcellus producers and Gulf Coast LNG, power generation and Mexican export markets. Natural gas fundamentals look favorable for the fourth quarter and into 2021 due to a robust forward curve supported by greater producer capital discipline, paired with strong residential and commercial demand and increased utilization of domestic LNG export facilities. Going forward, Crestwood’s natural gas storage assets are ideally situated to benefit from these market dynamics. At the COLT Hub, rail loading volumes increased 4% over the second quarter 2020 as producers brought existing production back online, completion crews returned to the basin, and as shippers began to increase utilization of crude-by-rail assets in light of the ongoing uncertainty of the Dakota Access Pipeline’s near-term operations.

Marketing, Supply and Logistics (MS&L) segment EBITDA totaled $11.9 million in the third quarter 2020, compared to $26.1 million in the third quarter 2019. While both periods exclude the non-cash change in fair value of commodity inventory-related derivative contracts, the MS&L segment during the third quarter 2019 benefitted from the recognition of seasonal spreads that are typically realized in the fourth quarter. During the third quarter 2020, the recently acquired NGL assets continued to outperform internal expectations driven by the successful integration of the assets that has provided an expanded operating footprint which allows Crestwood to capture additional market share, provides increased access to the Conway and Mont Belvieu NGL hubs, and further diversifies the NGL marketing and logistics platform. Third quarter results were offset by lower revenue from keep dry agreements due to reduced downstream refinery activity. Looking into the fourth quarter, Crestwood expects the MS&L segment to benefit from strong seasonal spreads, exposure to incremental hub markets, increased downstream market opportunities and further optimization of the newly acquired NGL assets.

Expenses

Combined O&M and G&A expenses, net of non-cash unit-based compensation, in the third quarter 2020 were $42.5 million compared to $47.9 million in the third quarter 2019. Crestwood fully realized its previously announced reductions in O&M and G&A during the quarter and expects the majority of these cost reductions to be permanent.

Fourth Quarter 2020 and Preliminary 2021 Outlook

Based on year-to-date results and current activity across all three operating segments, Crestwood expects to exceed the mid-point of its revised 2020 guidance range of $520 million to $570 million and continue to generate excess free cash flow after distributions in the fourth quarter, allowing the partnership to end the year with conservative leverage and coverage ratios. The improved outlook is a result of lower-than-expected producer shut-ins across the Bakken and Delaware Basin, new well activity in the Bakken, Delaware Basin and Barnett assets, record natural gas gathering and processing volumes on the Arrow system, strong demand for storage assets in the MS&L and S&T segments, and the successful integration of the newly acquired NGL assets.

Based on preliminary customer discussions, forecasted activity levels and 2021 commodity prices, Crestwood expects its 2021 outlook to be consistent with its revised 2020 guidance range. After completion of the company’s multi-year capital investments across the G&P portfolio, growth capital expenditures in 2021 should be at or below $40 million and 2021 maintenance capital to be at or below $20 million. Due to potential volatility in the sector, Crestwood expects to provide formal 2021 guidance in February 2021 as customer forecasts may be positively or negatively impacted by commodity prices, basin returns, capital availability and macroeconomic factors.

Robert T. Halpin, Executive Vice President and Chief Financial Officer, commented, “During the third quarter 2020, Crestwood achieved a significant milestone of generating positive free cash flow after capital expenditures and both common and preferred distributions, that we utilized to opportunistically begin repurchasing bonds and paying down the revolver. Based on our preliminary outlook for 2021, we remain pleased with the resiliency and forecast of the business and we expect to meaningfully grow free cash flow that will be utilized to strengthen the balance sheet by enhancing liquidity and further deleveraging.”

Third Quarter 2020 Business Update

Bakken Update

During the third quarter 2020, the Arrow system averaged crude oil gathering volumes of 107 MBbls/d, natural gas gathering volumes of 119 MMcf/d, natural gas processing volumes of 115 MMcf/d, and water gathering volumes of 97 MBbls/d. By the end of the third quarter, all Arrow producers had resumed normal operations, which combined with 15 new three-product well connections and continued producer efficiencies, drove record natural gas gathering and processing volumes across the system, exceeding pre-COVID production levels. Additionally, as part of its on-going commitment to sustainability initiatives, Crestwood completed infrastructure projects to enhance its water gathering system which has led to increased system reliability and capacity to safely handle growing volumes that are expected to reach record levels during the fourth quarter and into 2021.

In the third quarter 2020, Crestwood invested $6 million in the Bakken primarily for optimizations and improvements for the Arrow water gathering system mentioned above. As producers reimburse Crestwood for the majority of well connect capital, the company expects the minimal remaining 2020 capital investment to be focused on optimization projects to support producer water volumes. Based on current producer forecasts, Crestwood estimates approximately 20 three-product wells to be connected to the Arrow system early in the fourth quarter driving increased volumes into early 2021. Additionally, there are estimated to be 35 to 40 three-product DUCs and 20 to 25 water only DUCs on Arrow acreage at the end of 2020 that are expected to be completed and connected to the Arrow system in 2021. Currently, WPX Energy (NYSE:WPX) has one active rig and one completion crew operating on Crestwood’s dedicated acreage and has recently publicly commented on maintaining current levels of activity through 2021. Driven by the current DUC inventory, this level of activity is expected to maintain stable year-over-year cash flow across the Arrow system in 2021 with limited additional capital investment.

Powder River Basin Update

During the third quarter 2020, the Powder River Basin system averaged gathering and processing volumes of 72 MMcf/d. Volumes in the third quarter 2020 continued to be affected by Jackalope’s anchor customer, Chesapeake, shutting-in a portion of its wells in the second quarter due to the depressed commodity price environment and its on-going bankruptcy process. Crestwood expects Chesapeake’s shut-in wells to be brought back online during the coming months, assuming the current commodity pricing outlook. As part of Chesapeake’s on-going bankruptcy process, the company listed the Powder River Basin as one of five key regions in its long-term financial projections filed in the Amended Disclosure Statement on October 8, 2020.

During the third quarter, Crestwood invested $5 million of final costs associated with the Bucking Horse II expansion. Crestwood is actively engaged with other producers in the basin in an effort to optimize Bucking Horse utilization, reduce operating costs and to provide better recoveries and improved netbacks for producers in the current commodity price environment. Additionally, based on preliminary producer conversations, Crestwood expects completion of the DUC inventory of 10 to 15 new wells to the Jackalope system in mid-2021.

Delaware Basin Update

During the third quarter 2020, Crestwood’s Delaware Basin natural gas gathering assets averaged volumes of 184 MMcf/d, a 6% increase compared to 174 MMcf/d in third quarter 2019. The increase in gathering volumes in the Delaware Basin was driven by a 44% increase in natural gas gathering volumes on the Willow Lake system, partially offset by lower Nautilus volumes as a result of frac protection as drilling and completion activity resumed and storm related shut-ins in the latter half of the quarter. Produced water gathering and disposal volumes averaged 46 MBbls/d during the third quarter and Crestwood expects volumes to continue to increase in the fourth quarter as production on the system continues to rise. Currently, there are five rigs running on Crestwood’s Delaware Permian acreage, two on the Willow Lake system by Concho Resources (NYSE: CXO) and three on the Nautilus system by Royal Dutch Shell PLC, that are expected to result in 15 to 20 well connects in the fourth quarter and increased volumes in early 2021.

Legacy Natural Gas Basin Update

Effective October 1, 2020, as part of Crestwood’s strategy to strengthen its balance sheet and enhance liquidity, Crestwood sold its Fayetteville shale gathering assets for $23 million. In the Barnett shale, Crestwood anticipates a rig operating on its Lake Arlington gathering system during fourth quarter, resulting in eight to ten new wells to be connected in early 2021 and year-over-year cash flow growth in 2021. In the SW Marcellus, Crestwood’s gathering and compression volumes are supported by Antero Resources (NYSE: AR) which recently announced a volumetric production payment that should mitigate future shut-in risk and maintain natural field decline.

Capitalization and Liquidity Update

In the third quarter 2020, Crestwood invested approximately $11 million in growth capital, generated approximately $30 million in free cash flow after distributions(2) and reduced total debt through a combination of repaying borrowings on its revolving credit facility and opportunistically repurchasing senior notes at a discount to par. Looking to the fourth quarter and into 2021, Crestwood expects improving cash flow, reduced growth and maintenance capital expenditures and proceeds from asset divestitures to generate increasing free cash flow after distributions which will be used to maximize liquidity and reduce debt further.

As of September 30, 2020, Crestwood had approximately $2.6 billion of debt outstanding, comprised of $1.793 billion of fixed-rate senior notes and $780 million outstanding under its $1.25 billion revolving credit facility, resulting in a leverage ratio of 4.1x. Crestwood currently has approximately $450 million of liquidity under its revolving credit facility. Based on year-to-date results and the current forecast for the fourth quarter, Crestwood anticipates a leverage ratio at or below 4.25x for full-year 2020 and remains committed to achieving a leverage ratio of 4.0x or less over the next 12 to 18 months. Going forward, the company expects to use availability under the revolver and free cash flow to manage its future capital needs and will continue to evaluate opportunistic non-core asset divestitures to further accelerate the strategy of preserving balance sheet strength through this down cycle.

Crestwood currently has 71.3 million preferred units outstanding (par value of $9.13 per unit) which pay a fixed-rate annual cash distribution of 9.25%, payable quarterly. The preferred units are listed on the New York Stock Exchange and trade under the ticker symbol CEQP-P.

Sustainability Program Update

Earlier this year, Crestwood published its 2019 sustainability report entitled Embracing a Culture of Sustainability. The second annual report provides enhanced transparency on the company’s environmental, social and governance (ESG) performance. This report also highlights Crestwood’s commitment to environmental stewardship and reducing its operational footprint and emissions. Crestwood is actively working toward implementing an emissions reduction program that includes the adoption of a flaring minimization policy across its gathering and processing assets and reducing methane emissions through increasing capital investments to enhance voluntary practices on leak detection and repair, as well as installing new equipment and technologies at its key assets and employing renewable supply sources for field level energy requirements. As society evolves through the energy transition, Crestwood expects that its natural gas focused assets will continue to provide necessary energy supply to meet long-term energy demand while balancing reduced carbon emissions. Further highlighting the company’s commitment to reducing emissions, Crestwood recently joined The Environmental Partnership, a group of companies within the energy industry with the intention of accelerating improvements in environmental performance within the production and transmission of fossil fuels across the country in an effort to collectively set best-in-class standards for sustainable energy operations.

Mr. Phillips commented, “Sustainability is the foundation of how we manage our business to achieve long-term success and generate unitholder value. By joining The Environmental Partnership and implementing a flaring minimization policy, we continue to position Crestwood for operational success while demonstrating our commitment to reducing emissions and minimizing our environmental footprint. We know that by working collectively as an industry, we can meet our shared goal of delivering the nation’s energy in a reliable, safe and sustainable manner and showcase the resiliency of our sector in a rapidly evolving industry.”

For more information on Crestwood’s approach to sustainability, please visit https://esg.crestwoodlp.com.

Upcoming Conference Participation

Crestwood’s management intends to participate in the following upcoming virtual investor conferences. Prior to the start of each conference, new presentation materials may be posted to the Investors section of Crestwood’s website at www.crestwoodlp.com.

  • RBC Capital Markets Midstream and Energy Infrastructure Conference, November 18 – 19, 2020
  • Capital One Securities 15th Annual Energy Conference, December 7 – 9, 2020
  • Wells Fargo Securities Midstream and Utility Symposium, December 8 – 9, 2020
  • UBS Midstream, Winter Infrastructure & Energy One-on-One Conference, January 11 – 13, 2021

Earnings Conference Call Schedule

Management will host a conference call for investors and analysts of Crestwood today at 9:00 a.m. Eastern Time (8:00 a.m. Central Time) which will be broadcast live over the internet. Investors will be able to connect to the webcast via the Investors page of Crestwood’s website at www.crestwoodlp.com. Please log in at least 10 minutes in advance to register and download any necessary software. A replay will be available shortly after the call for 90 days.

Non-GAAP Financial Measures

Adjusted EBITDA and distributable cash flow are non-GAAP financial measures. The accompanying schedules of this news release provide reconciliations of these non-GAAP financial measures to their most directly comparable financial measures calculated and presented in accordance with GAAP. Our non-GAAP financial measures should not be considered as alternatives to GAAP measures such as net income or operating income, or any other GAAP measure of liquidity or financial performance.

Forward-Looking Statements

This news release contains forward-looking statements within the meaning of the U.S. Private Securities Litigation Reform Act of 1995 and Section 21E of the Securities and Exchange Act of 1934. The words “expects,” “believes,” “anticipates,” “plans,” “will,” “shall,” “estimates,” and similar expressions identify forward-looking statements. Forward-looking statements are subject to risks and uncertainties and are based on the beliefs and assumptions of management, based on information currently available to them. Although Crestwood believes that these forward-looking statements are based on reasonable assumptions, it can give no assurance that any such forward-looking statements will materialize. Important factors that could cause actual results to differ materially from those expressed in or implied by these forward-looking statements include the risks and uncertainties described in Crestwood’s reports filed with the Securities and Exchange Commission, including its Annual Report on Form 10-K and its subsequent reports, which are available through the SEC’s EDGAR system at www.sec.gov and on our website. Readers are cautioned not to place undue reliance on forward-looking statements, which reflect management’s view only as of the date made, and Crestwood assumes no obligation to update these forward-looking statements.

About Crestwood Equity Partners LP

Houston, Texas, based Crestwood Equity Partners LP (NYSE: CEQP) is a master limited partnership that owns and operates midstream businesses in multiple shale resource plays across the United States. Crestwood is engaged in the gathering, processing, treating, compression, storage and transportation of natural gas; storage, transportation, terminalling, and marketing of NGLs; gathering, storage, terminalling and marketing of crude oil; and gathering and disposal of produced water.


Contacts

Crestwood Equity Partners LP
Investor Contacts
Josh Wannarka, 917-922-1746
This email address is being protected from spambots. You need JavaScript enabled to view it.
Senior Vice President, Investor Relations, ESG and Corporate Communications

Rhianna Disch, 713-380-3006
This email address is being protected from spambots. You need JavaScript enabled to view it.
Director, Investor Relations


Read full story here

MEDFORD, Ore. & FRAMINGHAM, Mass.--(BUSINESS WIRE)--#efficiency--Ameresco, Inc. (NYSE:AMRC), a leading energy efficiency and renewable energy company and the City of Medford, announced today that the City has entered into a $4 million contract with Ameresco. The improvements are being financed by a low-interest loan and include converting street lights and parks department lighting to light emitting diode (LED) technology.


Medford’s Transportation Manager, Karl MacNair, says completing this upgrade through an Energy Savings Performance Contract (ESPC) will allow the City to fund the project with energy savings over the term of the contract. “LED fixtures not only consume less energy, but they last four times longer than our current high-pressure sodium (HPS) lights. The lighting conversion will save taxpayers money in energy costs and contribute to reducing the City’s carbon emissions,” MacNair said.

The project will impact approximately 8,000 light fixtures across the City. All city and utility-owned street lights will be converted, as well as additional park and parking lot locations. Medford began their efforts in 2019 by converting a small portion of their lights to LED. With Ameresco’s partnership, this large-scale conversion will drastically reduce the city’s energy use for street lighting. After the conversion, residents will benefit from improved light quality and color rendering of Medford’s roadways.

“We look forward to pursuing this city-wide lighting upgrade with the City of Medford and helping to significantly reduce their energy consumption, maintenance costs, and carbon emissions.” said Lou Maltezos, executive vice president at Ameresco. “The City of Medford has taken a substantial step that represents large-scale progress by upgrading their infrastructure using an ESPC, allowing the project to be paid for with energy savings.”

The project is expected to be completed in 2021.

About City of Medford

Medford is located in southern Oregon, just 27 miles from the California border. This city has over 81,000 residents and hosts corporate headquarters for Harry and David and Lithia Motors. Located in the Rogue Valley, Medford offers access to a world class destination for those seeking adventures in wines and outdoor recreation. Stemming from their agricultural past, many farms are producing local specialty foods, beverages, and other edible products.
https://www.ci.medford.or.us/

About Ameresco, Inc.

Founded in 2000, Ameresco, Inc. (NYSE:AMRC) is a leading independent provider of comprehensive services, energy efficiency, infrastructure upgrades, asset sustainability and renewable energy solutions for businesses and organizations. Ameresco’s sustainability services include upgrades to a facility’s energy infrastructure and the development, construction and operation of renewable energy plants. Ameresco has successfully completed energy saving, environmentally responsible projects with federal, state and local governments, healthcare and educational institutions, housing authorities, and commercial and industrial customers. With its corporate headquarters in Framingham, MA, Ameresco has more than 1,000 employees providing local expertise in the United States, Canada, and the United Kingdom. For more information, visit www.ameresco.com.

The announcement of a customer’s entry into a project contract is not necessarily indicative of the timing or amount of revenue from such contract, of the company’s overall revenue for any particular period or of trends in the company’s overall total construction backlog. This project was included in our previously reported in contracted backlog as of June 30, 2020.


Contacts

Media:
Ameresco: Leila Dillon, 508.661.2264, This email address is being protected from spambots. You need JavaScript enabled to view it.
City of Medford: Kristina Johnsen, 541-774-2087, This email address is being protected from spambots. You need JavaScript enabled to view it.

Offshore Source Logo

Offshore Source keeps you updated with relevant information concerning the Offshore Energy Sector.

Any views or opinions represented on this website belong solely to the author and do not represent those of the people, institutions or organizations that Offshore Source or collaborators may or may not have been associated with in a professional or personal capacity, unless explicitly stated.

Corporate Offices

Technology Systems Corporation
8502 SW Kansas Ave
Stuart, FL 34997

info@tscpublishing.com