Business Wire News

Zayed Sustainability Prize finalist’s technology delivers a source of vital clean water to vulnerable communities

ABU DHABI, United Arab Emirates--(BUSINESS WIRE)--Thousands of people across three Cambodian villages can now live safer, healthier lives following the deployment of new water purifying technology as part of the Zayed Sustainability Prize’s UAE-driven humanitarian initiative, 20by2020.


After the most recent installation of solar powered light systems in vulnerable communities in Egypt and Jordan, the initiative has progressed with five water fountains, benefiting the 4,400 residents of the Chhnok Trou, Kampong Phrah and Ses Salab villages.

Due to the instalment of the water ultra-filtration solution, organised by the 20by2020 initiative, the village communities, along with the Chhnok Trou school and clinic, have access to clean and safe water for the first time. Not only does this gives residents an option for avoiding many of the waterborne diseases and other health issues stemming from dirty water, it will offer new opportunities for better hygiene, an essential requirement given the importance of handwashing in preventing the spread of coronavirus.

Over time it is intended that this access will improve the outlooks for residents through better hydration and the prevention of illness, which has been statistically proven to have significant, positive effects on the overall health and wellbeing of communities alongside individual growth and development.

20by2020’s support has seen yet another community benefit from life-saving technology. In Cambodia, the solution deployed has been developed by Safe Water Cube, a French company that was a Zayed Sustainability Prize finalist in 2019 under the Water Category. The technology deployment in Cambodia makes surface water drinkable (river, pond) by removing viruses and bacteria that cause diarrhoea, dysentery, cholera and hepatitis, from up to 1,000 litres of water per hour with no energy or maintenance required, and no chemicals used.

Commenting on the activation in Cambodia, H.E. Dr. Sultan Al Jaber, UAE Minister of Industry and Advanced Technology, and Director General of the Zayed Sustainability Prize, said: “This innovative water purification technology will positively impact the health and wellbeing of many people in rural Cambodia. Through the 20by2020 initiative, we are leveraging the sustainable solutions of Zayed Sustainability Prize winners and finalists to successfully impact countless lives around the world.”

H.E Al Jaber added “By streamlining efforts with the 20by2020 partners to achieve a more sustainable world, we can extend the impact of the inspiring humanitarian and international development vision of the UAE’s founding father, the late Sheikh Zayed bin Sultan Al Nahyan, while reinforcing the country’s role in humanitarian aid and progress towards sustainability.”

Delivering this positive and impactful work across the world is the main objective of 20by2020, a UAE initiative led by the Zayed Sustainability Prize in partnership with Abu Dhabi Global Market, Abu Dhabi Fund for Development, Mubadala Petroleum, Ministry of Tolerance and Coexistence and Masdar.

H.E. Mr. Lim Kean Hor, Minister of Water Resources and Meteorology and Chairman of the Tonle Sap Authority of the Royal Government of Cambodia stated: “We welcome the 20by2020 initiative whose contribution meets one of the strategic objectives of the Tonle Sap Authority to improve access to safe drinking water in the remote areas around the Tonle Sap Great Lake.”

H.E. Mr. Lim Kean Hor added, “On behalf of the Ministry of Water Resources and Meteorology, I would like to extend my thanks and appreciation to the Zayed Sustainability Prize, in addition to the 20by2020 partners for providing these innovative solutions.”

Access to safe drinking water is one of the 17 Sustainable Development Goals of the United Nations adopted by 193 countries. In Cambodia especially, the provision of clean drinking water remains a major challenge; more than 3 million people lack access to safe water and 6 million lack access to improved sanitation. Furthermore, there is growing evidence that inadequate sanitation, water, and hand washing facilities in the country are a barrier to children attending school and performing well, especially girls.

Similarly, Cambodian health care facilities are often reported as having insufficient water, sanitation, and hygiene amenities, with only 50% reported by the National Institute of Public Health as always having sufficient water for their needs. The latest 20by2020 deployment is the first step in providing a new dawn for the villages of Chhnok Trou, Kampong Phrah and Ses Salab.

As part of the initiative’s first phase, a total of six deployments have been rolled out to date, including energy, health, water, and food-related solutions in Cambodia, Egypt, Jordan, Nepal, Tanzania, and Uganda. 20by2020 also plans to deploy additional solutions before the end of the year; with the scheduling dependent on individual country-specific conditions in light of the global pandemic. Upcoming technology deployments include water and energy-related projects in Bangladesh, Madagascar, Costa Rica and Indonesia.

About Zayed Sustainability Prize

Established by the UAE leadership, in 2008, to honour the legacy of the founding father, the late Sheikh Zayed bin Sultan Al Nahyan, the Zayed Sustainability Prize is the UAE’s pioneering global award for recognising sustainability and humanitarian solutions around the world.

The Zayed Sustainability Prize acknowledges and rewards global pioneers and innovators who are committed to accelerating impactful sustainable solutions.

Over the past 12 years, the Prize has awarded 86 winners. Collectively, they have directly and indirectly, positively impacted the lives of over 335 million people around the world. The Zayed Sustainability Prize categories are: Health, Food, Energy, Water and Global High Schools.

For more information, please visit www.ZayedSustainabilityPrize.com or go to our social media platforms on, Twitter, Facebook, Instagram, YouTube.

*Source: AETOSWire


Contacts

Hill+Knowlton
Medhat Juma, Senior Consultant, +971523596128
This email address is being protected from spambots. You need JavaScript enabled to view it.

ABERDEEN, Scotland--(BUSINESS WIRE)--KNOT Offshore Partners LP (NYSE:KNOP) (“the Partnership”) plans to release its financial results for the Third Quarter of 2020 before opening of the market on Thursday, November 19, 2020.

The Partnership also plans to host a conference call on Thursday, November 19, 2020 at 11:00 AM (Eastern Time) to discuss the results for the Third Quarter of 2020. All unitholders and interested parties are invited to listen to the live conference call by choosing from the following options:

  • By dialing 1-855-209-8259 from the US, dialing 1-855-669-9657 from Canada or 1-412-542-4105 if outside North America (please ask to be joined into the KNOT Offshore Partners LP call).
  • By accessing the webcast, which will be available on the Partnership's website: www.knotoffshorepartners.com.

Our Third Quarter 2020 Earnings Presentation will also be available at www.knotoffshorepartners.com prior to the conference call start time.

The conference call will be recorded and remain available until November 26, 2020. This recording can be accessed following the live call by dialing 1-877-344-7529 from the US, or 1-412-317-0088 if outside North America, and entering the replay access code 10149600.

About KNOT Offshore Partners LP

KNOT Offshore Partners LP owns, operates and acquires shuttle tankers under long-term charters in the offshore oil production regions of the North Sea and Brazil. KNOT Offshore Partners LP is structured as a publicly traded master limited partnership. KNOT Offshore Partners LP’s common units trade on the New York Stock Exchange under the symbol “KNOP.”


Contacts

KNOT Offshore Partners LP
Gary Chapman
Chief Executive Officer and Chief Financial Officer
Email: This email address is being protected from spambots. You need JavaScript enabled to view it.
Tel: +44 1224 618 420

EDISON, N.J.--(BUSINESS WIRE)--Please replace the release dated October 23, 2020 with the following corrected version due to multiple revisions.


The updated release reads:

EOS ENERGY STORAGE ACHIEVES LEADERSHIP MILESTONE WITH KEY APPOINTMENTS TO ITS BOARD OF DIRECTORS

Eos Energy Storage LLC (“Eos”), a leading manufacturer of safe, low-cost and long-duration zinc battery storage systems, today announced key appointments to its board of directors.

Eos is pleased to announce that Audrey Zibelman, Dr. Krishna Singh, and Alex Dimitrief will join the Eos board upon the closing of the business combination with B. Riley Principal Merger Corp. II (“BMRG”). In addition, Joe Mastrangelo, Chief Executive Officer of Eos, has been invited to join the board. The board will provide insight and counsel on the continued strategic direction of Eos while also working with Eos and customers to accelerate the adoption of Eos’ zinc-based battery solutions.

Audrey Zibelman currently serves as CEO of the Australian Energy Market Operator (“AEMO”), which manages electricity and gas systems across Australia. Ms. Zibelman will bring deep experience in tackling the multifaceted challenges of clean energy adoption, having led the effort to draw up the “Integrated System Plan”, Australia’s 20-year blueprint to transition the country to renewables. Starting in 2021, Ms. Zibelman will take up a newly created leadership role at X, the moonshot factory, a subsidiary entity of Alphabet Inc. Ms. Zibelman will be leading an early stage team working to develop new technologies to enable safe, reliable and affordable clean energy.

Alex Dimitrief is an experienced C-suite leader, former general counsel and trial lawyer who has steered energy and other global businesses through a wide range of complex legal, regulatory, commercial and operational challenges. Mr. Dimitrief brings valuable and practical perspectives drawn from a unique combination of 20 years as a senior partner at a leading international law firm and over ten years as a leader at one of the largest in-house legal departments.

Dr. Krishna Singh is the founder, president and chief executive officer of Holtec International, a supplier of equipment and systems for the energy industry. With nearly 50 years of experience in the nuclear power industry and as the holder of 119 patents, Dr. Singh brings a unique perspective and knowledge that will contribute to the success of Eos. In September 2019, Eos and Holtec announced the formation of HI-POWER, LLC, a multi-gigawatt manufacturing joint venture to produce Eos’ next generation of aqueous zinc batteries. The state-of-the-art HI-POWER manufacturing facility is located in Pittsburgh, PA.

Joe Mastrangelo, Eos’ Chief Executive Officer, brings over two decades of experience as an energy industry leader, where he has led diverse teams to develop and deploy commercial scale projects around the world. Mr. Mastrangelo has broad operating experience across the energy value chain including serving as Chief Executive Officer of GE’s Power Conversion business, and over ten years of experience at GE Oil & Gas in various leadership roles in finance, quality, and commercial operations, culminating in being named a GE Corporate Officer in 2008. Mr. Mastrangelo joined Eos as a board advisor in March 2018 and assumed the role of Chief Executive Officer in August 2019.

It is a privilege to welcome these talented leaders to the board at this exciting time in Eos’ 12-year history,” said Dan Shribman, Chief Executive Officer of BMRG and Chief Investment Officer of B. Riley Financial. “We look forward to their guidance and assistance as we take Eos public and continue to generate the incredible commercial momentum the company has seen over the last several months.”

It is a great honor to have the board’s support of these accomplished leaders,” said Joe Mastrangelo. “Their experience and knowledge are exceptional and, together, I know we can push Eos to impressive new heights on our mission to accelerate clean energy adoption. I look forward to working with the board and my team to capitalize on the incredible market opportunity in front of us in the battery storage space.”

Following the closing of the business combination, the board will consist of seven members with each bringing extensive and proven executive management and technology expertise to help Eos in key areas of its business:

  • Alex Dimitrief, is an experienced director, Chief Executive Officer, C-suite leader and general counsel who has steered varied energy-related and other global businesses through a wide range of complex commercial, legal and organizational challenges. He has previously served as a director of both public and non-public companies including The We Company, Synchrony Financial (NYSE: SF) and GE Capital Bank and presently sits on the Advisory Board of Cresset Capital Management. As President and Chief Executive Officer of General Electric’s Global Growth Organization, Mr. Dimitrief was responsible for driving GE’s growth in more than 180 countries. Under Mr. Dimitrief’s watch in 2018, GE achieved $76 billion in international orders and secured billions in financing for many of GE’s emerging market customers. As GE’s General Counsel, Mr. Dimitrief served as the principal executive advisor to GE’s Board and led a global team responsible for GE’s legal matters, compliance, SEC reporting, government affairs and environmental safety programs. In previous roles at GE, Mr. Dimitrief was a leader of the transformation of GE Capital (including the IPO/split-off of Synchrony Financial) and led joint venture negotiations for GE Energy in China and Russia. In 2007, Mr. Dimitrief came to GE from after 20 years as a senior partner at Kirkland & Ellis LLP, where he “first chaired” and regularly advised Boards about securities, restructuring, intellectual property, product liability, environmental, governance and commercial disputes.
  • Joe Mastrangelo joined Eos as a board advisor in March 2018 and assumed the role of Chief Executive Officer in August, 2019. Before coming to Eos, Mr. Mastrangelo was president and chief executive officer of Gas Power Systems since September 2015. As an energy industry leader for the past two decades, Mr. Mastrangelo has extensive experience leading diverse teams to develop and deploy commercial scale projects around the world. Mr. Mastrangelo has broad operating experience across the energy value chain including serving as Chief Executive Officer of GE’s Power Conversion business, applying science and systems of power conversion to increase the efficiency of the world’s energy infrastructure. Mr. Mastrangelo spent ten years with GE Oil & Gas, in leadership roles in finance, quality, and commercial operations, culminating in being named a GE Corporate Officer in 2008. Joe began his career with GE in the company’s Financial Management Program and then joined GE’s Corporate Audit Staff.
  • Daniel Shribman, is BMRG’s Chief Executive Officer, Chief Financial Officer and Director, has served as chief investment officer of B. Riley Financial (Nasdaq: RILY) and as president of B. Riley Principal Investments, LLC since September 2019 and September 2018, respectively. Mr. Shribman helps oversee the asset base of B. Riley Financial alongside chief executive officer Bryant Riley. Shribman has served as a member of the board of directors of Alta Equipment Group Inc. (NYSE: ALTG) since February 2020, when it completed its business combination with B. Riley Principal Merger Corp., where Mr. Shribman was chief financial officer. Mr. Shribman brings experience in both public and private equity to Eos. Prior to joining B. Riley, Mr. Shribman was a Portfolio Manager at Anchorage Capital Group, L.L.C., a special situation asset manager, from 2010 to 2018.
  • Dr. Krishna Singh, is the founder of Holtec International, a diversified energy technology company with nine major operations centers in seven countries on five continents, where he has served as president and chief executive officer since 1986. Dr. Singh has been active in the nuclear power industry since 1971 and is a widely-published author in with over 70 technical papers, one textbook and numerous symposia volumes. He is a prolific inventor with and a prolific inventor (119 patents granted, many pending). In addition to Holtec International, Dr. Singh serves on numerous advisory boards in the energy industry including the Nuclear Energy Institute and the University of California Nuclear Engineering Department. Dr. Singh also serves as a member of the board of overseers at the University of Pennsylvania School of Engineering and Applied Science and a director of the Washington DC Atlantic Counsel.
  • Russell Stidolph has served as a director since 2014 and the chairman of the board of Eos since 2018. Mr. Stidolph is the founder AltEnergy, LLC a private equity firm focused on alternative energy investing, where he has served as Managing Director since 2006. Prior to forming AltEnergy, Mr. Stidolph was a Principal at J.H. Whitney & Co., LLC a middle-market private equity firm based in New Canaan, Connecticut. While at J.H. Whitney Mr. Stidolph was responsible for starting and developing the firm’s alternative energy investing practice where he was responsible for Hawkeye Renewables, LLC and Iowa Winds, LLC. Mr. Stidolph was both the Chief Financial Officer and Vice Chairman of Hawkeye Renewables, LLC before it was sold in 2006 to Thomas H. Lee Partners, LP. Prior to joining J.H. Whitney, Mr. Stidolph was a member of the corporate finance group at PaineWebber, Inc., that was responsible for high yield and leverage finance origination. Mr. Stidolph also acted as Senior Vice President and the Chief Financial Officer of Tres Amigas, LLC and he still sits on the Company’s Board of Directors, and was Chairman of the board of directors of Viridity Energy, Inc before it was sold to Ormat Technologies in 2017.
  • Marian “Mimi” Walters, is Chief Commercial Officer for Leading Edge Power Solutions, LLC. She is a former Member of the U.S. House of Representatives (the “House”) from California’s 45th District where she worked on key legislation, business and policy initiatives related to energy, technology, environmental and healthcare and served from 2015 to 2019. Ms. Walters was a member of House Leadership and served on the influential Energy and Commerce Committee. She was a member of the Communications and Technology, Digital Commerce and Consumer Protection, and Oversight and Investigations subcommittees. Prior to her election to Congress, Ms. Walters was a member of the California State Senate from 2008 to 2014, where she served on the Banking and Financial Institutions Committee and was Vice Chair of the Appropriations Committee. She previously served in the California State Assembly, and was mayor and council member for the City of Laguna Niguel. Prior to her career in public service, Ms. Walters was an investment professional at Drexel Burnham Lambert and Kidder, Peabody & Co.
  • Audrey Zibelman, is Managing Director and Chief Executive Officer of the AEMO, responsible for overseeing AEMO’s strategy, operations and administrative functions. Ms. Zibelman also serves on the CSIRO Energy Advisory Committee, the Melbourne Energy Institute’s Advisory Board, and as a Director of the Melbourne Recital Centre and the Advanced Energy Economy Institute. Ms. Zibelman has extensive experience in the public, private and not-for profit energy and electricity sectors in the United States. Prior to joining AEMO in March 2017, her roles included Chair of the New York State Public Service Commission (“NYPSC”), from August 2013 to March 2018, Executive Vice President and Chief Operating Officer of system operator PJM from January 2008 to February 2013, executive roles with Xcel Energy, from 1992 to 2004, one of the United States largest integrated gas and electricity utilities and served on a number of energy industry advisory groups and Boards. During her tenure at the NYPSC, Ms. Zibelman led the design and implementation of extensive regulatory and retail market changes to modernize and transform the state’s electricity industry under New York Governor Andrew M. Cuomo’s ‘Reforming the Energy Vision’ plan. A recognized national and international expert in energy policy, markets and Smart Grid innovation, Ms. Zibelman is a Founder and past President and CEO of Viridity Energy, Inc., which she formed after more than 25 years of electric utility industry leadership experience in both the public and private sectors. Previously, Ms. Zibelman was the Executive Vice President and Chief Executive Officer of GO15 member organization, PJM, a regional transmission organization responsible for operating the power grid and wholesale power market which serves fourteen states across the eastern United States. Ms. Zibelman also held legal and executive positions at Xcel Energy, served as General Counsel to the New Hampshire Public Utilities Commission, and was Special Assistant Attorney General in the Minnesota Attorney General’s Office. During her career, Ms. Zibelman has served on numerous industry-related and non-profit boards, including, but not limited to the Midwest and Mid-Atlantic Reliability Councils. Ms. Zibelman’s board experience also includes Advisor to Secretary of Energy for the U.S. Department of Energy and Advisory Council, New York State Energy Research and Development Authority, the New York State Planning Board and the New York State Emergency Planning Council.

As previously announced, BMRG, a publicly traded special purpose acquisition company, and Eos have entered into a definitive merger agreement for a business combination that would result in Eos becoming a publicly listed company. Upon closing of the transaction, the combined company will be renamed Eos Energy Enterprises, Inc. (“Eos Energy”) and intends to list its shares of common stock on Nasdaq under the ticker symbol “EOSE”.

About Eos Energy Storage LLC

At Eos, we are on a mission to accelerate clean energy by deploying stationary storage solutions that can help deliver the reliable and cost-competitive power that the market expects in a safe and environmentally sustainable way. Eos has been pursuing this opportunity since 2008 when it was founded. Eos has more than 10 years of experience in battery storage testing, development, deployment, and operation. The Eos Aurora® system integrates Eos’ aqueous, Znyth® technology to provide a safe, scalable, and sustainable alternative to lithium-ion. https://eosenergystorage.com

About B. Riley Principal Merger Corp. II

BMRG was formed for the purpose of effecting a merger, share exchange, asset acquisition, share purchase, reorganization or similar business combination with one or more businesses.

Additional Information about the Business Combination

In connection with the business combination, BMRG has filed a definitive proxy statement with the United States Securities and Exchange Commission (“SEC”). BMRG stockholders and other interested persons are advised to read the definitive proxy statement, in connection with BMRG’s solicitation of proxies for the meeting of stockholders to be held to approve, among other things, the proposed business combination, because the proxy statement will contain important information about BMRG, Eos and the proposed business combination. The definitive proxy statement has been mailed to BMRG stockholders as of the record date of October 22, 2020 for voting on the proposed business combination. Stockholders can obtain copies of the proxy statement, without charge, at the SEC’s website at www.sec.gov. Copies of the documents filed with the SEC by BMRG, when and if available, can be obtained free of charge by directing a written request to B. Riley Principal Merger Corp. II, 299 Park Avenue, 21st Floor, New York, New York 10171 or by telephone at (212) 457-3300.


Contacts

For Eos Energy Storage LLC

Investors
Ed Yuen
This email address is being protected from spambots. You need JavaScript enabled to view it.

Media
Balki G. Iyer
This email address is being protected from spambots. You need JavaScript enabled to view it.

HOUSTON--(BUSINESS WIRE)--SANDRIDGE MISSISSIPPIAN TRUST II (OTC: SDRMU) today announced a distribution of approximately $6.2 million, or $0.125 per unit, reflecting the net proceeds received from the sale of the Trust’s assets to SandRidge Energy, Inc. on September 10, 2020 as previously disclosed, as well as the release of approximately $1.3 million of cash reserves previously withheld by the Trustee for the payment of future known, anticipated or contingent expenses or liabilities of the Trust. The distribution is expected to occur on or before November 23, 2020 to holders of record as of the close of business on November 13, 2020 and is expected to be the final distribution to be made to the Trust unitholders. The stock transfer books for the Trust units will be closed at the close of business on November 13, 2020. If any cash reserves remain following the payment of the Trust’s estimated remaining expenses and liabilities, the Trustee may make a final distribution to unitholders of such amount. Holders of record as of the close of business on November 13, 2020 will be entitled to such distribution, if any.

The Trust will remain in existence until the filing of a certificate of cancellation with the Secretary of State of the State of Delaware following the completion of the winding up process.

The Trust owned royalty interests in oil and natural gas properties in the Mississippian formation in Alfalfa, Grant, Kay, Noble and Woods counties in northern Oklahoma and Barber, Comanche, Harper and Sumner counties in southern Kansas and was entitled to receive proceeds from the sale of production attributable to the royalty interests. As described in the Trust’s filings with the SEC, the amount of the quarterly distributions fluctuated from quarter to quarter, depending on the proceeds received by the Trust as a result of actual production volumes, oil, natural gas and NGL prices, and the amount and timing of the Trust’s administrative expenses, among other factors. All Trust unitholders share distributions on a pro rata basis.

Distributable income was calculated as follows (in thousands, except for unit and per unit amounts):

Proceeds from sale of Trust assets

$

5,250


Expenses of sale of Trust assets


(391

)

Net proceeds from sale of Trust assets


4,859


Release of previously withheld cash reserves


1,348


Distributable income

$

6,207


Distributable income available to unitholders

$

6,207


Distributable income per unit (49,725,000 units issued and outstanding)

$

0.125


Pursuant to Internal Revenue Code Section 1446, withholding tax on income effectively connected to a United States trade or business allocated to non-U.S. persons should be made at the highest marginal rate. Under Section 1441, withholding tax on fixed, determinable, annual, periodic income from United States sources allocated to non-U.S. persons should be made at 30% of gross income unless the rate is reduced by treaty. This is intended to be a qualified notice by SandRidge Mississippian Trust II to nominees and brokers as provided for under Treasury Regulation Section 1.1446-4(b), and while specific relief is not specified for Section 1441 income, this disclosure is intended to suffice. Nominees and brokers should withhold at the highest marginal rate on the distribution made to non-U.S. persons. The Tax Cuts and Jobs Act (the "TCJA") enacted in December 2017 treats a non-U.S. holder's gain on the sale of Trust units as ECI to the extent such holder would have had ECI if the Trust had sold all of its assets at fair market value on the date of the exchange. The TCJA also requires the transferee of units to withhold 10% of the amount realized on the sale of exchange of units (generally, the purchase price) unless the transferor certifies that it is not a nonresident alien individual or foreign corporation. Pending the finalization of proposed regulations under IRC Section 1446, the IRS has suspended this new withholding obligation with respect to publicly traded partnerships such as the Trust, which is classified as a partnership for federal and state income tax purposes

This press release contains statements that are “forward-looking statements” within the meaning of Section 21E of the Securities Exchange Act of 1934, as amended. All statements contained in this press release, other than statements of historical facts, are “forward-looking statements” for purposes of these provisions. These forward-looking statements include: the amount and date of any anticipated distribution to unitholders; the future distribution of cash reserves, if any, that remain following the payment of the Trust's estimated remaining expenses and liabilities; and the timing of the cancellation of the Trust. Statements made in this press release are qualified by the cautionary statements made in this press release. Neither SandRidge nor the Trustee intends, and neither assumes any obligation, to update any of the statements included in this press release. An investment in Common Units issued by SandRidge Mississippian Trust II is subject to the risks described in the Trust’s Annual Report on Form 10-K for the year ended December 31, 2019, the Trust’s Quarterly Report on Form 10-Q for the period ended June 30, 2020, and all of its other filings with the SEC. The Trust’s annual, quarterly and other filed reports are or will be available over the Internet at the SEC’s website at http://www.sec.gov.


Contacts

SandRidge Mississippian Trust II
The Bank of New York Mellon Trust Company, N.A., as Trustee
Sarah Newell
1(512) 236-6555

Strong Winds Expected to Begin Sunday Morning Through Monday Morning, With Windy Conditions Lingering in Some Regions Through Early Tuesday

SAN FRANCISCO--(BUSINESS WIRE)--Pacific Gas and Electric Company (PG&E) will de-energize certain electrical lines for safety starting this morning (Sunday, Oct. 25) as part of a Public Safety Power Shutoff (PSPS). PG&E is calling a PSPS due to a significant, offshore wind event starting Sunday that is forecast to have the driest humidity levels and the strongest winds of the wildfire season thus far, that together create high risk of catastrophic wildfires.

The PSPS event will affect approximately 361,000 customers in targeted portions of 36 counties, including: Alameda, Alpine, Amador, Butte, Calaveras, Colusa, Contra Costa, El Dorado, Fresno, Glenn, Humboldt, Kern, Lake, Madera, Marin, Mariposa, Mendocino, Napa, Nevada, Placer, Plumas, San Joaquin, San Mateo, Santa Clara, Santa Cruz, Shasta, Sierra, Siskiyou, Solano, Sonoma, Stanislaus, Tehama, Trinity, Tuolumne, Yolo and Yuba. Some customers in 17 tribal communities will also be affected.

Some customers previously notified about the potential PSPS will not have their power turned off during this event. This is due to a combination of favorable changes in the weather forecast. Approximately 105,000 customers will not be turned off for this reason. Additionally, another 84,000 will remain energized through the event due to islanding, temporary generation, and other methods.

Affected Counties and Customers

Below is a list of customers who could potentially be affected by this PSPS event.

  • Alameda County: 16,329 customers, 795 Medical Baseline customers
  • Alpine County: 575 customers, 6 Medical Baseline customers
  • Amador County: 10,398 customers, 805 Medical Baseline customers
  • Butte County: 13,066 customers, 1,160 Medical Baseline customers
  • Calaveras County: 15,694 customers, 729 Medical Baseline customers
  • Colusa County: 565 customers, 32 Medical Baseline customers
  • Contra Costa County: 17,966 customers, 883 Medical Baseline customers
  • El Dorado County: 38,462 customers, 2,681 Medical Baseline customers
  • Fresno County: 4,712 customers, 408 Medical Baseline customers
  • Glenn County: 377 customers, 18 Medical Baseline customers
  • Humboldt County: 7,143 customers, 239 Medical Baseline customers
  • Kern County: 627 customers, 32 Medical Baseline customers
  • Lake County: 21,621 customers, 1,572 Medical Baseline customers
  • Madera County: 10,792 customers, 858 Medical Baseline customers
  • Marin County: 13,809 customers, 443 Medical Baseline customers
  • Mariposa County: 703 customers, 14 Medical Baseline customers
  • Mendocino County: 648 customers, 14 Medical Baseline customers
  • Napa County: 11,026 customers, 393 Medical Baseline customers
  • Nevada County: 40,246 customers, 2,445 Medical Baseline customers
  • Placer County: 17,017 customers, 1,060 Medical Baseline customers
  • Plumas County: 3,168 customers, 167 Medical Baseline customers
  • San Joaquin County: 10 customers, 0 Medical Baseline customers
  • San Mateo County: 3,671 customers, 93 Medical Baseline customers
  • Santa Clara County: 4,182 customers, 205 Medical Baseline customers
  • Santa Cruz County: 13,872 customers, 955 Medical Baseline customers
  • Shasta County: 24,746 customers, 1,967 Medical Baseline customers
  • Sierra County: 1,101 customers, 24 Medical Baseline customers
  • Siskiyou County: 57 customers, 0 Medical Baseline customers
  • Solano County: 1,597 customers, 96 Medical Baseline customers
  • Sonoma County: 23,464 customers, 1,164 Medical Baseline customers
  • Stanislaus County: 35 customers, 0 Medical Baseline customers
  • Tehama County: 6,470 customers, 544 Medical Baseline customers
  • Trinity County: 1,376 customers, 74 Medical Baseline customers
  • Tuolumne County: 30,327 customers, 2,220 Medical Baseline customers
  • Yolo County: 165 customers, 4 Medical Baseline customers
  • Yuba County: 4,666 customers, 365 Medical Baseline customers
  • Total*: 360,687 customers, 22,465 Medical Baseline customers

*The following Tribal Community counts are included within the County level detail above.

  • Big Sandy Rancheria Tribal Community: 61 customers, 2 Medical Baseline customers
  • Cold Springs Rancheria of Mono Indians Tribal Community: 54 customers, 5 Medical Baseline customers
  • Cortina Rancheria Tribal Community: 8 customers, 1 Medical Baseline customers
  • Dry Creek Rancheria Tribal Community: 8 customers, 0 Medical Baseline customers
  • Grindstone Rancheria Tribal Community: 49 customers, 3 Medical Baseline customers
  • Hoopa Valley Tribe Tribal Community: 1062 customers, 56 Medical Baseline customers
  • Jackson Rancheria Tribal Community: 28 customers, 0 Medical Baseline customers
  • Karuk Tribe Tribal Community: 42 customers, 0 Medical Baseline customers
  • Middletown Rancheria Tribal Community: 33 customers, 0 Medical Baseline customers
  • North Fork Rancheria Tribal Community: 25 customers, 3 Medical Baseline customers
  • Pit River Tribes Tribal Community: 8 customers, 0 Medical Baseline customers
  • Robinson Rancheria Tribal Community: 96 customers, 4 Medical Baseline customers
  • Shingle Springs Rancheria Tribal Community: 49 customers, 2 Medical Baseline customers
  • Stewarts Point Rancheria (Kashaya Pomo) Tribal Community: 22 customers, 2 Medical Baseline customers
  • Tuolumne Rancheria Tribal Community: 112 customers, 6 Medical Baseline customers
  • Upper Lake Rancheria Tribal Community: 28 customers, 2 Medical Baseline customers
  • Yurok Tribe Tribal Community: 87 customers, 4 Medical Baseline customers

Timeline for Safety Shutoffs

The de-energization will begin around 10 a.m. Sunday morning, beginning with customers in the Northern Sierra region. Shutoffs will continue through Monday into late evening.

Weather is expected to subside Monday morning for the majority of customers, and by Tuesday morning for the remainder. Once it does and it is safe to do so, PG&E will patrol the de-energized lines to determine if they were damaged during the wind event and repair any damage found. PG&E will then safely restore power in stages and as quickly as possible, with the goal of restoring power to nearly all customers within 12 daylight hours after severe weather has passed.

Resource for customers

Customer notifications

Customer notifications—via text, email and automated phone call—began Friday, Oct. 23, approximately two days prior to the potential shutoff. Additional notifications one day prior to the event took place Saturday, Oct. 24. Customers enrolled in the company’s Medical Baseline program who do not verify that they have received these important safety communications will be individually visited by a PG&E employee with a knock on their door when possible with a focus on customers who rely on electricity for critical life-sustaining equipment.

Community Resource Centers

To support our customers during this PSPS, PG&E will open 106 Community Resource Centers (CRCs). For customers with power turning off Sunday morning, CRCs will be open from 8 a.m. until 10 p.m. today. All CRCs will operate from 8 a.m. to 10 p.m. throughout the event. These temporary CRCs will be open to customers when power is out at their homes and will provide ADA-accessible restrooms, hand-washing stations, medical-equipment charging, WiFi; bottled water, grab-and-go bags and non-perishable snacks.

PG&E updates its CRC locations regularly. To find CRC locations, visit pge.com/crc.

In response to the COVID-19 pandemic, all CRCs will follow important health and safety protocols including:

  • Facial coverings and maintaining a physical distance of at least six feet from those who are not part of the same household will be required at all CRCs.
  • Temperature checks will be administered before entering CRCs that are located indoors.
  • CRC staff will be trained in COVID-19 precautions and will regularly sanitize surfaces and use Plexiglass barriers at check-in.
  • All CRCs will follow county and state requirements regarding COVID-19, including limits on the number of customers permitted indoors at any time.

Besides these health protocols, customers visiting a CRC in 2020 will experience further changes, including a different look and feel. In addition to using existing indoor facilities, PG&E is planning to open CRCs at outdoor, open-air sites in some locations and use large commercial vans as CRCs in other locations. CRC locations will depend on a number of factors, including input from local and tribal leaders.

Online Resources for Customers

  • Customers can look up their address online to find out if their location is being monitored for the potential safety shutoff at www.pge.com/pspsupdates.
  • PG&E’s emergency website pge.com/pspsupdates is now available in 13 languages. Currently, the website is available in English, Spanish, Chinese, Tagalog, Russian, Vietnamese, Korean, Farsi, Arabic, Hmong, Khmer, Punjabi and Japanese. Customers will have the opportunity to choose their language of preference for viewing the information when visiting the website. In addition, PG&E’s contact center has translation services available in over 200 languages. Customers who need in-language support over the phone can contact us by calling 1-833-208-4167.
  • For additional language support services including how to set language preference, select options for obtaining translated notifications, and receive other translated resources on PSPS, customers can visit pge.com/pspslanguagehelp. This website is also available in 13 languages as listed above.
  • Customers are encouraged to update their contact information and indicate their preferred language for notifications by visiting pge.com/mywildfirealerts or by calling 1-800-743-5000. PG&E’s contact center has translation services available in over 200 languages.
  • Tenants and non-account holders can sign up to receive PSPS ZIP Code Alerts for any area where you do not have a PG&E account by visiting pge.com/pspszipcodealerts.
  • PG&E has launched a new tool at its online Safety Action Center at safetyactioncenter.pge.com to help customers prepare. By using the "Make Your Own Emergency Plan" tool and answering a few short questions, visitors to the website can compile and organize the important information needed for a personalized family emergency plan.

About PG&E

Pacific Gas and Electric Company, a subsidiary of PG&E Corporation (NYSE:PCG), is one of the largest combined natural gas and electric energy companies in the United States. Based in San Francisco, with more than 20,000 employees, the company delivers some of the nation's cleanest energy to 16 million people in Northern and Central California. For more information, visit pge.com and pge.com/news.


Contacts

Media Relations
415.973.5930

HOUSTON--(BUSINESS WIRE)--Calpine Corporation plans to release third quarter 2020 financial results on Friday, November 13, 2020.


Qualified investors and securities analysts can register for access to a new section of the Company’s website to view the financial results and other future financial information at https://www.calpine.com/About-Us/Investors/Debt-Registration.

About Calpine

Calpine Corporation is America’s largest generator of electricity from natural gas and geothermal resources with operations in competitive power markets. Our fleet of 77 power plants in operation or under construction represents over 26,000 megawatts of generation capacity. Through wholesale power operations and our retail businesses Calpine Energy Solutions and Champion Energy, we serve customers in 23 states, Canada and Mexico. Our clean, efficient, modern and flexible fleet uses advanced technologies to generate power in a low-carbon and environmentally responsible manner. We are uniquely positioned to benefit from the secular trends affecting our industry, including the abundant and affordable supply of clean natural gas, environmental regulation, aging power generation infrastructure and the increasing need for dispatchable power plants to successfully integrate intermittent renewables into the grid. Please visit www.calpine.com to learn more about how Calpine is creating power for a sustainable future.


Contacts

Media Relations:
Brett Kerr
713-830-8809
This email address is being protected from spambots. You need JavaScript enabled to view it.

Investor Relations:
Bryan Kimzey
713-830-8775
This email address is being protected from spambots. You need JavaScript enabled to view it.

Customers Who Might Be Affected by the Public Safety Power Shutoff are Continuing to Receive Notifications Today, One Day Ahead of the Potential Event

SAN FRANCISCO--(BUSINESS WIRE)--Pacific Gas and Electric Company’s (PG&E) Emergency Operations Center, Meteorology team and Wildfire Safety Operations Center are working together and tracking a significant, offshore wind event starting Sunday that is forecast to have the driest humidity levels and the strongest winds of the wildfire season thus far.

PG&E has notified customers in targeted portions of 38 counties about a potential Public Safety Power Shutoff (PSPS) expected to start as early as Sunday morning (Oct. 25). Extremely dry, windy conditions with high gusts pose an increased risk for damage to the electric system that has the potential to ignite fires in areas with critically dry vegetation.

While there is still uncertainty regarding the strength and timing of this weather wind event, high fire-risk conditions are expected to arrive Sunday morning. High winds are currently expected to subside Monday morning (Oct. 26) in most impacted areas, with windy conditions lingering in some regions through early Tuesday (Oct. 27). PG&E will then patrol the de-energized lines to assess whether they were damaged during the wind event. PG&E will safely restore power as quickly as possible, with the goal of restoring most customers within 12 daylight hours, based on current weather conditions.

The highest probability areas for this PSPS include terrain of the northern and western Sacramento Valley, Northern and Central Sierra as well as higher terrain of the Bay Area, including the Santa Cruz Mountains, Central Coast Region and portions of southern Kern.

Customer Notification and Impact

The potential PSPS event is still approximately 24 hours away. PG&E in-house meteorologists, as well as staff in its Wildfire Safety Operations Center and Emergency Operations Center, will continue to monitor conditions closely and will actively look for opportunities to reduce the scope of the impacts based on evolving weather models and PSPS mitigation efforts such as the use of sectionalizing devices and temporary generation. Additional customer notifications will be issued as we move closer to the potential event.

Customer notifications—via text, email and automated phone call—began Friday afternoon, approximately two days prior to the potential shutoff. Customers enrolled in the company’s Medical Baseline program who do not verify that they have received these important safety communications will be individually visited in person by a PG&E employee with a knock on their door when possible. A primary focus will be given to customers who rely on electricity for critical life-sustaining equipment.

Customers can look up their address online to find out if their location is being monitored for the potential safety shutoff, and find the full list of affected counties, cities and communities at www.pge.com/pspsupdates.

Community Resource Centers Reflect COVID-Safety Protocols

PG&E will open 109 Community Resource Centers (CRCs) to support our customers. Locations of these CRCs is available at PG&E’s emergency website (pge.com/pspsupdates). These temporary CRCs will be open to customers when power is out at their homes and will provide ADA-accessible restrooms and hand-washing stations; medical-equipment charging; Wi-Fi; bottled water; and non-perishable snacks.

In response to the COVID-19 pandemic, all CRCs will follow important health and safety protocols including:

  • Facial coverings and maintaining a physical distance of at least six feet from those who are not part of the same household will be required at all CRCs.
  • Temperature checks will be administered before entering CRCs that are located indoors.
  • CRC staff will be trained in COVID-19 precautions and will regularly sanitize surfaces and use Plexiglass barriers at check-in.
  • All CRCs will follow county and state requirements regarding COVID-19, including limits on the number of customers permitted indoors at any time.

Besides these health protocols, customers visiting a CRC in 2020 will experience further changes, including a different look and feel. In addition to using existing indoor facilities, PG&E is planning to open CRCs at outdoor, open-air sites in some locations and use large commercial vans as CRCs in other locations. CRC locations will depend on a number of factors, including input from local and tribal leaders. Outdoor CRCs will provide grab-and-go supply bags so most customers can be on their way quickly.

Where to Go to Learn More

  • PG&E’s emergency website (pge.com/pspsupdates) is now available in 13 languages. Currently, the website is available in English, Spanish, Chinese, Tagalog, Russian, Vietnamese, Korean, Farsi, Arabic, Hmong, Khmer, Punjabi and Japanese. Customers will have the opportunity to choose their language of preference for viewing the information when visiting the website.
  • Customers are encouraged to update their contact information and indicate their preferred language for notifications by visiting pge.com/mywildfirealerts or by calling 1-800-743-5000, where in-language support is available.
  • Tenants and non-account holders can sign up to receive PSPS ZIP Code Alerts for any area where you do not have a PG&E account by visiting pge.com/pspszipcodealerts.
  • PG&E has launched a new tool at its online Safety Action Center (safetyactioncenter.pge.com) to help customers prepare. By using the "Make Your Own Emergency Plan" tool and answering a few short questions, visitors to the website can compile and organize the important information needed for a personalized family emergency plan. This includes phone numbers, escape routes and a family meeting location if an evacuation is necessary.

How Customers Can Prepare for a PSPS

As part of PSPS preparedness efforts, PG&E is asking customers to:

  • Plan for medical needs like medications that require refrigeration or devices that need power.
  • Identify backup charging methods for phones and keep hard copies of emergency numbers.
  • Build or restock your emergency kit with flashlights, fresh batteries, first aid supplies and cash.
  • Keep in mind elderly family members, younger children and pets. Information and tips including a safety plan checklist are available at pge.com/psps.
  • Continue to monitor PG&E’s new weather forecasting web page at pge.com/weather which is a dedicated page with weather forecasting information and a daily 7-day PSPS lookahead.

About PG&E

Pacific Gas and Electric Company, a subsidiary of PG&E Corporation (NYSE:PCG), is one of the largest combined natural gas and electric energy company in the United States. Based in San Francisco, with more than 20,000 employees, the company delivers some of the nation’s cleanest energy to 16 million people in Northern and Central California. For more information, visit www.pge.com/ and http://www.pge.com/about/newsroom/.


Contacts

Media Relations
415.973.5930

TAMPA, Fla.--(BUSINESS WIRE)--Overseas Shipholding Group, Inc. (NYSE: OSG) (the “Company” or “OSG”) announced today that it plans to release third quarter results before market opens on Friday, November 6, 2020.


The Company will host a conference call to discuss its third quarter 2020 results at 9:30 a.m. Eastern Time (“ET”) on Friday, November 6, 2020.

To access the call, participants should dial (844) 850-0546 for domestic callers and (412) 317-5203 for international callers. Please dial in ten minutes prior to the start of the call.

A live webcast of the conference call will be available from the Investor Relations section of the Company’s website at http://www.osg.com/

An audio replay of the conference call will be available starting at 11:30 a.m. ET on Friday, November 6, 2020 by dialing (877) 344-7529 for domestic callers and (412) 317-0088 for international callers and entering Access Code 10149303.

About Overseas Shipholding Group, Inc

Overseas Shipholding Group, Inc. (NYSE: OSG) is a publicly traded company providing energy transportation services for crude oil and petroleum products in the U.S. Flag markets. OSG is a major operator of tankers and ATBs in the Jones Act industry. OSG’s 21 vessel U.S. Flag fleet consists of three crude oil tankers doing business in Alaska, one conventional ATB, two lightering ATBs, three shuttle tankers, ten MR tankers, and two non-Jones Act MR tankers that participate in the U.S. Maritime Security Program. OSG also currently owns and operates two Marshall Islands flagged MR tankers which trade internationally. In addition to the currently operating fleet, OSG has on order one Jones Act compliant barge which is scheduled for delivery in 2020.

OSG is committed to setting high standards of excellence for its quality, safety and environmental programs. OSG is recognized as one of the world’s most customer-focused marine transportation companies and is headquartered in Tampa, FL. More information is available at www.osg.com.


Contacts

Investor Relations & Media Contact:
Susan Allan, Overseas Shipholding Group, Inc.
(813) 209-0620
This email address is being protected from spambots. You need JavaScript enabled to view it.

LONDON--(BUSINESS WIRE)--#CrudeOilFlowImproversMarket--The global crude oil flow improvers market size is poised to grow by USD 259.80 million during 2020-2024, progressing at a CAGR of over 3% throughout the forecast period, according to the latest report by Technavio. The report offers an up-to-date analysis regarding the current market scenario, latest trends and drivers, and the overall market environment. The report also provides the market impact and new opportunities created due to the COVID-19 pandemic. Download a Free Sample of REPORT with COVID-19 Crisis and Recovery Analysis.


The shift of exploration from shallow to deep-water is one of the main factors that will drive the growth of the crude oil market during the forecast period. Another reason that will force these offshore productions to migrate to deep-water is the rapid exhaustion of shallow offshore resources. This growing oil exploration in deep-water is expected to drive the demand for crude oil flow improvers during the forecast period.

Register for a free trial today and gain instant access to 17,000+ market research reports.
Technavio's SUBSCRIPTION platform

Report Highlights:

  • The major crude oil flow improvers market growth share came from the paraffin inhibitors segment in 2019. Paraffin inhibitors are mainly polymers with high molecular weight. They interact with paraffin in the oil to prevent the formation of wax crystals.
  • MEA was the largest crude oil flow market in 2019, and the region will offer several growth opportunities to market vendors during the forecast period. This is attributed to factors such as the rising number of oil and gas exploration projects.
  • The global crude oil flow improvers market is fragmented. Baker Hughes Co., BASF SE, Clariant International Ltd., Croda International Plc, Dorf Ketal Chemicals (I) Pvt. Ltd., Dow Inc., Evonik Industries AG, Infineum International Ltd., Schlumberger Ltd., and The Lubrizol Corp. some of the major market participants. To help clients improve their market position, this crude oil flow improvers market forecast report provides a detailed analysis of the market leaders.
  • As the business impact of COVID-19 spreads, the global crude oil flow improvers market 2020-2024 is expected to have neutral impact. As the pandemic spreads in some regions and plateaus in other regions, we continue to revaluate the impact on businesses and update our report forecasts.

Buy 1 Technavio report and get the second for 50% off. Buy 2 Technavio reports and get the third for free.

View market snapshot before purchasing

Growing preference for bio-based crude oil flow improvers will be a Key Market Trend

Bio-based crude oil is one of the key technological advancements in this industry. Not only are they more environmentally friendly, but they are also more effective than their counterparts. The strict policies in the US, Mexico, Germany, Russia, and Saudi Arabia are increasing the demand for bio-based crude oil flow improvers. Moreover, stringent policies on the chemicals used in crude oil flow improvers are going to drive the demand for bio-based products.

Technavio’s sample reports are free of charge and contain multiple sections of the report, such as the market size and forecast, drivers, challenges, trends, and more. Request a free sample report

Crude Oil Flow Improvers Market 2020-2024: Key Highlights

  • CAGR of the market during the forecast period 2020-2024
  • Detailed information on factors that will assist crude oil flow improvers market growth during the next five years
  • Estimation of the crude oil flow improvers market size and its contribution to the parent market
  • Predictions on upcoming trends and changes in consumer behavior
  • The growth of the crude oil flow improvers market
  • Analysis of the market’s competitive landscape and detailed information on vendors
  • Comprehensive details of factors that will challenge the growth of crude oil flow improvers market vendors

Buy 1 Technavio report and get the second for 50% off. Buy 2 Technavio reports and get the third for free.

View market snapshot before purchasing

Executive Summary

Market Landscape

  • Market ecosystem
  • Value chain analysis

Market Sizing

  • Market definition
  • Market segment analysis
  • Market size 2019
  • Market outlook: Forecast for 2019 - 2024

Five Forces Analysis

  • Five force summary
  • Bargaining power of buyers
  • Bargaining power of suppliers
  • Threat of new entrants
  • Threat of substitutes
  • Threat of rivalry
  • Market condition

Market Segmentation by Product

  • Market segments
  • Comparison by Product
  • Paraffin inhibitors - Market size and forecast 2019-2024
  • Asphaltene inhibitors - Market size and forecast 2019-2024
  • Scale inhibitors - Market size and forecast 2019-2024
  • Drag reducing agents - Market size and forecast 2019-2024
  • Hydrate inhibitors - Market size and forecast 2019-2024
  • Market opportunity by Product

Market Segmentation by Application

  • Market segments
  • Comparison by Application
  • Extraction - Market size and forecast 2019-2024
  • Refining - Market size and forecast 2019-2024
  • Transportation - Market size and forecast 2019-2024
  • Market opportunity by Application

Customer landscape

  • Customer landscape

Geographic Landscape

  • Geographic segmentation
  • Geographic comparison
  • MEA - Market size and forecast 2019-2024
  • North America - Market size and forecast 2019-2024
  • Europe - Market size and forecast 2019-2024
  • APAC - Market size and forecast 2019-2024
  • South America - Market size and forecast 2019-2024
  • Key leading countries
  • Market opportunity by geography
  • Market drivers
  • Market challenges
  • Market trends

Vendor Landscape

  • Vendor landscape
  • Landscape disruption

Vendor Analysis

  • Vendors covered
  • Market positioning of vendors
  • Baker Hughes Co.
  • BASF SE
  • Clariant International Ltd.
  • Croda International Plc
  • Dorf Ketal Chemicals (I) Pvt. Ltd.
  • Dow Inc.
  • Evonik Industries AG
  • Infineum International Ltd.
  • Schlumberger Ltd.
  • The Lubrizol Corp.

Appendix

  • Scope of the report
  • Currency conversion rates for US$
  • Research methodology
  • List of abbreviations

About Us

Technavio is a leading global technology research and advisory company. Their research and analysis focuses on emerging market trends and provides actionable insights to help businesses identify market opportunities and develop effective strategies to optimize their market positions. With over 500 specialized analysts, Technavio’s report library consists of more than 17,000 reports and counting, covering 800 technologies, spanning across 50 countries. Their client base consists of enterprises of all sizes, including more than 100 Fortune 500 companies. This growing client base relies on Technavio’s comprehensive coverage, extensive research, and actionable market insights to identify opportunities in existing and potential markets and assess their competitive positions within changing market scenarios.


Contacts

Technavio Research
Jesse Maida
Media & Marketing Executive
US: +1 844 364 1100
UK: +44 203 893 3200
Email: This email address is being protected from spambots. You need JavaScript enabled to view it.
Website: www.technavio.com/

Virtual Session

HOUSTON--(BUSINESS WIRE)--Pursuant to Texas Governor Abbott’s action of March 16, 2020 to allow virtual and telephonic open meetings to maintain government transparency the Port Commission of the Port of Houston Authority will conduct its regular monthly meeting virtually on Tuesday, Oct. 27. The virtual meeting will start at 9:15 a.m. via Webex webinar.


The Executive Office Building is closed to the general public; however, the public can participate in the meetings virtually via Webex, which can be accessed as provided on the following pages. Sign up for public comment is available up to an hour prior to the meeting by contacting Erik Eriksson at This email address is being protected from spambots. You need JavaScript enabled to view it. or Liana Christian at This email address is being protected from spambots. You need JavaScript enabled to view it..

Immediately following the Port Commission meeting, the Audit Committee will begin once the Port Commission meeting has adjourned. The Compensation Committee meeting will follow the Audit Committee meeting.

Meeting agendas are available at http://porthouston.com/leadership/public-meetings/.

About Port Houston

For more than 100 years, Port Houston has owned and operated the public wharves and terminals of the greater Port of Houston – the nation’s largest port for the foreign waterborne tonnage and an essential economic engine for the Houston region, the state of Texas and the U.S. nation. The Port of Houston supports the creation of nearly 1.35 million jobs in Texas and 3.2 million jobs nationwide, and economic activity totaling $339 billion in Texas – 20.6 percent of Texas’ total gross domestic product (GDP) – and total of $801.9 billion in economic impact across the nation. For more information, visit the website at https://porthouston.com/

The Executive Office Building is closed to the general public at this time.

The safety and security of the Port of Houston Authority’s visitors and employees is our first priority. Guests entering the Port Authority Executive Building must show a valid government-issued photo ID, and may be required to pass through security screening, including the use of a hand-held metal detector and other measures as deemed necessary. To learn more about port security visit: http://porthouston.com/portweb/port-security/.

Please note the following to help the meeting run smoothly:

  • The meeting will begin at 9:15 a.m.
  • Please dial in via phone for the audio portion, and use your attendee number to merge your phone and computer presence.
  • All participants will be muted upon entry. Please stay muted unless speaking.
  • Please turn off your video to help the call run more smoothly.

The Audit Committee will begin once the Port Commission meeting has adjourned. The Compensation Committee meeting will follow the Audit Committee meeting.

When it's time, join your Webex meeting here.

Meeting number (access code): 146 241 6757
Meeting password: YMbEPxCm627

Join meeting

Tap to join from a mobile device (attendees only)
+1-720-650-7664,,1462416757## United States Toll (Denver)
+1-469-210-7159,,1462416757## United States Toll (Dallas)

Join by phone
+1-720-650-7664 United States Toll (Denver)
+1-469-210-7159 United States Toll (Dallas)

Global call-in numbers

Join from a video system or application
Dial This email address is being protected from spambots. You need JavaScript enabled to view it.
You can also dial 173.243.2.68 and enter your meeting number.

Join using Microsoft Lync or Microsoft Skype for Business
Dial 1462416757.This email address is being protected from spambots. You need JavaScript enabled to view it.

If you are a host, click here to view host information.

Need help? Go to http://help.webex.com


Contacts

Lisa Ashley, Director, Media Relations
Office: 713-670-2644; Mobile: 832-247-8179
E-mail: This email address is being protected from spambots. You need JavaScript enabled to view it.

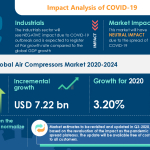
LONDON--(BUSINESS WIRE)--#AirCompressorsMarket--The new air compressors market research from Technavio indicates Neutral & Inferior growth in the short term as the business impact of COVID-19 spreads.


"One of the primary growth drivers for this market is the Shift to Energy-efficient Compressors,” says a senior analyst for Industrials at Technavio. The shift to more energy-efficient compressors will be one of the significant factors that will drive market growth. Climate change and global warming have increased the need to focus on energy efficiency and reduction in emissions in the oil and gas industry. The regional governments in Europe and North America have taken initiatives to ensure that the various equipment used in industries, such as compressors, motors, and pumps, comply with the respective regional regulations. Lower electricity consumption is another crucial reason for the adoption of new air compressors in the end-user industries. To raise the overall energy efficiency, the industrial end-users need to adopt compressors fitted with efficient and reliable controls. This has also compelled the oil and gas industry to lower its power consumption by substituting its old air compressors with new energy-efficient air compressors. As the markets recover Technavio expects the air compressors market size to grow by USD 7.22 billion during the period 2020-2024.

Get detailed insights on COVID-19 pandemic Crisis and Recovery analysis of air compressors market. Download free report sample

Air Compressors Segment Highlights for 2020

  • The air compressors market is expected to post a year-over-year growth rate of 3.20%.
  • Stationary air compressors dominated the market in 2019.
  • Stationary air compressors have higher capacities and store a greater volume of compressed air than their portable counterparts and, hence, they usually serve as a better source of power.
  • Stationary air compressors are used at sites that require uninterrupted supply and more cubic meters of compressed air.
  • The primary industries using stationary air compressors include manufacturing and oil and gas, as these industries need high power output to operate their equipment, machinery, and other accessories.

Regional Analysis

  • 51% of the growth will originate from the APAC region.
  • Increasing investments in the oil and gas industry in China, India, and a few other countries of Southeast Asia will significantly drive air compressors market growth in this region over the forecast period.
  • China and Japan are the key markets for air compressors in APAC.
  • Market growth in this region will be faster than the growth of the market in Europe and North America.

Click here to learn about report detailed analysis and insights on how you can leverage them to grow your business.

Notes:

  • The air compressors market size is expected to accelerate at a CAGR of almost 4% during the forecast period.
  • The air compressors market is segmented by product (stationary air compressor and portable air compressor) and geography (APAC, Europe, MEA, North America, and South America).
  • The market is fragmented due to the presence of many established vendors holding significant market share.
  • The research report offers information on several market vendors, including Atlas Copco AB, Deere & Co., Doosan Infracore Co. Ltd., General Electric Co., Hitachi Ltd., Ingersoll Rand Inc., KAESER KOMPRESSOREN SE, Kobe Steel Ltd., Mitsubishi Heavy Industries Ltd., and Siemens AG.

Register for a free trial today to access 17,000+ market research reports using Technavio's SUBSCRIPTION platform

About Us

Technavio is a leading global technology research and advisory company. Their research and analysis focus on emerging market trends and provides actionable insights to help businesses identify market opportunities and develop effective strategies to optimize their market positions. With over 500 specialized analysts, Technavio’s report library consists of more than 17,000 reports and counting, covering 800 technologies, spanning across 50 countries. Their client base consists of enterprises of all sizes, including more than 100 Fortune 500 companies. This growing client base relies on Technavio’s comprehensive coverage, extensive research, and actionable market insights to identify opportunities in existing and potential markets and assess their competitive positions within changing market scenarios.

Coverage

Regions Covered

Worldwide

Topics Covered

COVID-19, Stationary Air Compressor, Portable Air Compressor


Contacts

Technavio Research
Jesse Maida
Media & Marketing Executive
US: +1 844 364 1100
UK: +44 203 893 3200
Email: This email address is being protected from spambots. You need JavaScript enabled to view it.
Website: www.technavio.com/

LONDON--(BUSINESS WIRE)--#GlobalSolarPanelRecyclingMarket--The global solar panel recycling market size is poised to grow by USD 238.30 million during 2020-2024, progressing at a CAGR of over 28% throughout the forecast period, according to the latest report by Technavio. The report offers an up-to-date analysis regarding the current market scenario, latest trends and drivers, and the overall market environment. The report also provides the market impact and new opportunities created due to the COVID-19 pandemic. Download a Free Sample of REPORT with COVID-19 Crisis and Recovery Analysis.


The solar panel recycling market is driven by the growth in solar PV panel installation. The increase in solar PV installations can be attributed to factors such as the tax credits provided by the government, clean energy initiatives such as the Paris agreement of 2015, and declining costs of solar PV panels. As per the IEA, in 2017, solar PV panel prices decreased by 70% since 2010 for large-scale utility systems

Register for a free trial today and gain instant access to 17,000+ market research reports.

Technavio's SUBSCRIPTION platform

Report Highlights:

  • The major solar panel recycling market growth came from the crystalline segment in 2019, and is expected to register the highest growth during the forecast period.
  • APAC was the largest solar panel recycling market in 2019, and the region will offer several growth opportunities to market vendors during the forecast period. This is attributed to the economic and environmental benefits of solar power.
  • The global solar panel recycling market is fragmented. Canadian Solar Inc., Dynamic Lifecycle Innovations, EIKI SHOJI Co. Ltd., ENVARIS GmbH, First Solar Inc., Reiling GmbH & Co. KG, REMA System, Rinovasol Global Services BV, Targray Technology International Inc., and VEOLIA ENVIRONNEMENT SA. are some of the major market participants. To help clients improve their market position, this solar panel recycling market forecast report provides a detailed analysis of the market leaders.
  • As the business impact of COVID-19 spreads, the global solar panel recycling market 2020-2024 is expected to have negative growth. As the pandemic spreads in some regions and plateaus in other regions, we reevaluate the impact on businesses and update our report forecasts.

Buy 1 Technavio report and get the second for 50% off. Buy 2 Technavio reports and get the third for free.

View market snapshot before purchasing

Growth in Solar Panel Recycling R&D Activities will be a Key Market Trend

As the recycling processes are not yet fully developed, the raw materials recovered from solar PV panel recycling often lack the quality required to achieve maximum potential value. In order to enable value creation from end-of-life panels, considerable R&D and technological and operational skills are crucial. This will allow the development of effective solutions to address the projected increase in the solar PV panel waste and enable improved and efficient recovery of raw materials and components.

Technavio’s sample reports are free of charge and contain multiple sections of the report, such as the market size and forecast, drivers, challenges, trends, and more. Request a free sample report

Solar Panel Recycling Market 2020-2024: Key Highlights

  • CAGR of the market during the forecast period 2020-2024
  • Detailed information on factors that will assist solar panel recycling market growth during the next five years
  • Estimation of the solar panel recycling market size and its contribution to the parent market
  • Predictions on upcoming trends and changes in consumer behavior
  • The growth of the solar panel recycling market
  • Analysis of the market’s competitive landscape and detailed information on vendors
  • Comprehensive details of factors that will challenge the growth of solar panel recycling market vendors

Buy 1 Technavio report and get the second for 50% off. Buy 2 Technavio reports and get the third for free.

View market snapshot before purchasing

Executive Summary

Market Landscape

  • Market ecosystem
  • Value chain analysis

Market Sizing

  • Market definition
  • Market segment analysis
  • Market size 2019
  • Market outlook: Forecast for 2019 - 2024

Five Forces Analysis

  • Five force summary
  • Bargaining power of buyers
  • Bargaining power of suppliers
  • Threat of new entrants
  • Threat of substitutes
  • Threat of rivalry
  • Market condition

Market Segmentation by Product

  • Market segments
  • Comparison by Product
  • Crystalline - Market size and forecast 2019-2024
  • Thin-film - Market size and forecast 2019-2024
  • Market opportunity by Product

Customer landscape

Geographic Landscape

  • Geographic segmentation
  • Geographic comparison
  • Europe - Market size and forecast 2019-2024
  • APAC - Market size and forecast 2019-2024
  • North America - Market size and forecast 2019-2024
  • MEA - Market size and forecast 2019-2024
  • South America - Market size and forecast 2019-2024
  • Key leading countries
  • Market opportunity by geography
  • Market drivers
  • Market challenges
  • Market trends

Vendor Landscape

  • Vendor landscape
  • Landscape disruption

Vendor Analysis

  • Vendors covered
  • Market positioning of vendors
  • Canadian Solar Inc.
  • Dynamic Lifecycle Innovations
  • EIKI SHOJI Co. Ltd.
  • ENVARIS GmbH
  • First Solar Inc.
  • Reiling GmbH & Co. KG
  • REMA System
  • Rinovasol Global Services BV
  • Targray Technology International Inc.
  • VEOLIA ENVIRONNEMENT SA

Appendix

  • Scope of the report
  • Currency conversion rates for US$
  • Research methodology
  • List of abbreviations

About Us

Technavio is a leading global technology research and advisory company. Their research and analysis focuses on emerging market trends and provides actionable insights to help businesses identify market opportunities and develop effective strategies to optimize their market positions. With over 500 specialized analysts, Technavio’s report library consists of more than 17,000 reports and counting, covering 800 technologies, spanning across 50 countries. Their client base consists of enterprises of all sizes, including more than 100 Fortune 500 companies. This growing client base relies on Technavio’s comprehensive coverage, extensive research, and actionable market insights to identify opportunities in existing and potential markets and assess their competitive positions within changing market scenarios.


Contacts

Technavio Research
Jesse Maida
Media & Marketing Executive
US: +1 844 364 1100
UK: +44 203 893 3200
Email: This email address is being protected from spambots. You need JavaScript enabled to view it.
Website: www.technavio.com/

MISSISSAUGA, Ontario--(BUSINESS WIRE)--QM Environmental ("QM" or the "Company"), a leading Canadian environmental and industrial services company, was announced as the gold winner for Best Safety Industry Provider on October 22, in the 10th annual Canada's Safest Employers Awards 2020, presented by Canadian Occupational Safety (COS) magazine.

Canada’s Safest Employers Awards celebrate companies across the nation for their exceptional safety culture and wellness practices. Finalists were selected following an open call for nominations to COS magazine's nationwide readership of 14,000 safety professionals.

In this 10th edition of the awards, the winners attended the gala virtually, where they were recognized and had the opportunity to give brief speeches.

"Done Safely, Without Compromise is not only our health and safety motto but forms the foundation of our rich culture at the company," said Harry Kim, President, QM Environmental. "I am extremely honoured to be accepting this award on behalf of QM Environmental. We are proud of what the recognition represents in terms of our health and safety record."

QM Environmental’s unique approach to health and safety has made the integration of risk mitigation protocols possible at all company levels. QM's program is based on a systematic, coordinated and ongoing approach to hazard identification, including Risk Assessments, Staff education and loss prevention strategies.

“Our objective is to proactively raise the bar for safety performance and to continue to be a leader in the industry,” said Melissa Clarke, Head of Health & Safety, QM Environmental.

The companies participating in the best safety Industry Provider category for which QM Environmental is the Gold winner are: CBCL Limited, CSA Group, Enger Safety, Field Safe Solutions, IS2 Workforce Solutions Inc, Safety First Consulting Professional Corp, SaveStation Inc., Technical Standards and Safety Authority, Workhub Software Corp.

At QM, we believe that Health and Safety should be a priority for every Canadian company due to its positive impact on workers. We want to recognize all of the participants for their great effort, collaboration and ongoing commitment to safety.

Interested parties can read more about the event and the winners at https://safestemployers.com/winners/2020-winners#d

About QM Environmental

QM Environmental is a leading environmental and industrial services company with offices and qualified teams strategically located across Canada to provide end-to-end capabilities to the industries and customers it serves. QM Environmental is a customer-driven organization, backed by over 35 years of experience solving the country’s most complex environmental challenges through its strong culture of excellence in health and safety, integrity, and quality. QM’s services include: Environmental Remediation, Demolition and Decommissioning, Hazardous Materials Abatement, Emergency Response and Management, Training, Waste Management and Facilities, and Water Treatment.

Learn more at: www.QMenv.com

About Canadian Occupational Safety:

For almost 60 years, Canadian Occupational Safety has been the premier publication on Canada's occupational health and safety. In each issue, readers get a compelling mix of practical, informative, high-quality articles to help them in their work as health and safety professionals. Canadian Occupational Safety covers a wide range of topics ranging from office to heavy industry and general safety management to specific workplace hazards. The print publication is distributed to 14,000 occupational health and safety professionals across Canada.


Contacts

Media Inquiries
Alan De Luna
This email address is being protected from spambots. You need JavaScript enabled to view it., T. 416.525.4045

TOKYO--(BUSINESS WIRE)--Mitsubishi Chemical Holdings Corporation (“MCHC”) (TOKYO: 4188) announced that, at the meeting of its Board of Directors held today, it resolved change of representative corporate executive officers as outlined below.


1. Change in Representative Corporate Executive Officers

(Appointed)

Name:

Jean-Marc Gilson


Title:

Representative Corporate Executive Officer


President and Chief Executive Officer


(Retiring)

Name:

Hitoshi Ochi


Title:

Representative Corporate Executive Officer


President and Chief Executive Officer

2. Biographical Sketch of New Representative Corporate Executive Officer

Refer to the appendix

3. Scheduled Date of Appointment

April 1, 2021

4. Reason for the Change

MCHC converted to a company with a nominating committee, etc. in June 2015. Since then, the Nominating Committee has carried out preparations to properly conduct nominations, taking into account the period covered by the medium-term management plan and other factors. Representative Corporate Executive Officer, President and CEO, Hitoshi Ochi, has recently expressed his intent to retire at the end of the current fiscal year that coincides with the conclusion of the current medium-term management plan, where the fortification of its business infrastructure has been achieved to a meaningful degree. Therefore, the Nominating Committee explored and selected specific candidates of his successor.

The Nominating Committee set the following criteria for the next Representative Corporate Executive Officer, President and CEO. The individual had to be able to execute the following initiatives reflecting our Group Philosophy, KAITEKI.

(1)

Able to build a strategic vision and branding strategy, foreseeing the post-COVID 19 world, that integrates the healthcare business, including biochemicals and life science, with the high-value added chemicals business based on the high-performance products

(2)

Capable of improving corporate value particularly from the perspective of shareholders and investors

(3)

Able to decisively implement portfolio transformation through strong leadership

The Nominating Committee searched globally for suitable candidates, both inside and outside the company. It conducted multifaceted evaluations, including interviews with candidates and gathered references from related parties on the past performance of potential candidates. The Nominating Committee ultimately nominated Jean-Marc Gilson based on which MCHC, at the meeting of Board of Directors today, adopted the resolution to select him as the next Representative Corporate Executive Officer, President and CEO.

Jean-Marc Gilson has demonstrated leadership in the positions of president or chief executive in charge of business operations at various US and European chemical companies. This includes Executive Vice President, Specialty Chemicals Business at Dow Corning. Then he served as CEO at Avantor Performance Materials, which was selected by New Mountain Capital, a private equity fund, as their first investment in the chemicals sector. After this, at the request of New Mountain Capital, he served as COO at NuSil Technology. At present, he serves as CEO of Roquette, headquartered in France.

Jean-Marc Gilson possesses a global outlook in the fields of specialty chemicals and life science. In his previous experiences he worked at, Gilson built a proven track record for decisively executing portfolio transformation. In addition, he fully understands how correctly establishing strategies and clearly disseminating these strategies to all stakeholders contributes to the improvement of corporate value.

Given his performance, competencies and enthusiasm to lead the company, we determined that Jean-Marc Gilson is the optimal choice to lead MCHC realizing our vision of sustainable growth by accelerating our portfolio transformation and globally undertaking initiatives to solve social issues based on the Group Philosophy, KAITEKI.

Appendix

Biographical Sketch

Name:

Jean-Marc Gilson

Date of Birth:

December 16, 1963

Place of Birth:

Belgium


Professional Experience

1989

Joined Dow Corning

2005

Corporate Vice President & General Manager of Specialty Chemicals Business, President Asian Area, Dow Corning

Shareholder Representative Director, Dow Corning Toray

2009

Executive Vice President & General Manager of Specialty Chemicals Business,

Dow Corning

2011

Chief Executive Officer, Avantor Performance Materials

2012

Vice-Chairman & Chief Operating Officer, NuSil Technology

2014

Chief Executive Officer, Roquette

2021

To be appointed Representative Corporate Executive Officer,

President and Chief Executive Officer,

Mitsubishi Chemical Holdings Corporation

Number of shares held: N/A


Contacts

Mitsubishi Chemical Holdings Corporation
Osamu Shimizu
General Manager, Public Relations and Investor Relations Office
Tel: [+81] (0)3-6748-7120

DENVER--(BUSINESS WIRE)--Whiting Petroleum Corporation (NYSE:WLL) will release its third quarter 2020 financial and operating results on Thursday, November 5, 2020 after the market close. A conference call with investors, analysts and other interested parties is scheduled for 11:00 a.m. ET (10:00 a.m. CT, 9:00 a.m. MT) on Friday, November 6, 2020 to discuss Whiting's third quarter 2020 financial and operating results. Participants are encouraged to pre-register for the conference call by clicking on the following link: https://dpregister.com/sreg/10149456/dc153f7610. Callers who pre-register will be given a unique telephone number and PIN to gain immediate access on the day of the call. Those without internet access or unable to pre-register may join the live call by dialing: (877) 328-5506 (U.S.), (866) 450-4696 (Canada) or (412) 317-5422 (International) to be connected to the call.


A telephonic replay will be available beginning one to two hours after the call on Friday, November 6, 2020 and continuing through Friday, November 13, 2020. You may access this replay at (877) 344-7529 (U.S.), (855) 669-9658 (Canada) or (412) 317-0088 (International) and enter the replay access code 10149456.

About Whiting Petroleum Corporation

Whiting Petroleum Corporation, a Delaware corporation, is an independent oil and gas company that explores for, develops, acquires and produces crude oil, natural gas and natural gas liquids primarily in the Rocky Mountain region of the United States. The Company’s largest projects are in the Bakken and Three Forks plays in North Dakota and Niobrara play in northeast Colorado. The Company trades publicly under the symbol WLL on the New York Stock Exchange. For further information, please visit http://www.whiting.com.


Contacts

Company Contact: Brandon Day
Title: Investor Relations Manager
Phone: 303 390 4969
Email: This email address is being protected from spambots. You need JavaScript enabled to view it.

DUBLIN--(BUSINESS WIRE)--The "Global Aviation Fuel Market - Forecasts from 2020 to 2025" report has been added to ResearchAndMarkets.com's offering.


Global aviation fuel market was valued at US$178.560 billion in 2019 and is expected to grow at a CAGR of 6.00% over the forecast period to reach a total market size of US$253.261 billion in 2025.

Aviation fuel is a type of kerosene-based fuel which is used to operate an aircraft. Aviation fuels reduce the risk of icing or explosion due to high temperature and is primarily used by military aircrafts as well as commercial airlines in order to maximize fuel efficiency while lowering down the operational cost.

Growing global travel and tourism industry

Booming travel and tourism industry is one of the major drivers of global aviation fuel market. According to the United Nations World Tourism Organization (UNWTO), international tourist arrivals grew 5 per cent in 2018, reaching the figure to 1.4 billion which was reached two years ahead of the UNWTO forecast. This high growth in the number of international tourists is significantly driven by a relatively strong global economy with expanding middle class population base in emerging economies, new business models, technological advances, and affordable travel costs and visa facilitation. In conjunction to this, export earnings generated by tourism also increased to US$1.7 trillion in 2018, thus making the sector a true global force for economic growth and development by way of creating more and more employment. With growing number of air travel passengers worldwide, the demand for commercial aircrafts is also rising among different airlines.

Severe impact of COVID-19 on global aviation industry

The recent pandemic outbreak caused by COVID-19 has negatively impacted almost each and every industry including automotive and construction. However, the global travel and tourism industry has been hit the hardest by this pandemic. The novel coronavirus disease, which broke out in Wuhan, China, in the beginning of 2020, and then continued to spread like a wild fire throughout the globe, pushed governments to impose nationwide lockdowns and close national borders in order to contain the spread of the pandemic. The duration of the pandemic is still uncertain, and since inability of governments to contain the spread can increase the burden of this disease significantly, air travel remains restricted. A steep decline in the number of commercial flights across the globe has been driving down the demand for aviation fuel.

Although some airline carriers continue to operate while ensuring compliance to strict guidelines from governments, it is not enough to recoup the slump. Reluctance of people towards air travel, on account of high degree of fear of contracting the disease, is also limiting the number of flights per month. This trend is expected to continue till the time the world has at least one reliable vaccine or cure for the virus.

Companies Mentioned

  • Shell
  • Neste
  • Total
  • BP
  • Chevron Corporation
  • Exxon Mobil Corporation
  • Gazprom Neft PJSC
  • Mabanaft GmbH & Co. KG
  • VARO
  • Global Partners LP
  • Lukoil

Key Topics Covered:

1. Introduction

1.1. Market Definition

1.2. Market Segmentation

2. Research Methodology

2.1. Research Data

2.2. Assumptions

3. Executive Summary

3.1. Research Highlights

4. Market Dynamics

4.1. Market Drivers

4.2. Market Restraints

4.3. Market Opportunities

4.4. Porters Five Forces Analysis

4.5. Industry Value Chain Analysis

4.6. Market Attractiveness

5. Global Aviation Fuel Market Analysis, By Fuel Type

5.1. Introduction

5.2. Jet Fuel

5.3. Biofuel

6. Global Aviation Fuel Market Analysis, By Aircraft Type

6.1. Introduction

6.2. Fixed Wing

6.3. Rotorcraft

7. Global Aviation Fuel Market Analysis, By End User

7.1. Introduction

7.2. Military

7.3. Commercial

7.4. Private

7.5. Sports and Recreational

8. Global Aviation Fuel Market Analysis, By Geography

8.1. Introduction

8.2. North America

8.3. South America

8.4. Europe

8.5. Middle East and Africa

8.6. Asia Pacific

9. Competitive Environment and Analysis

9.1. Major Players and Strategy Analysis

9.2. Emerging Players and Market Lucrativeness

9.3. Mergers, Acquisitions, Agreements, and Collaborations

9.4. Vendor Competitiveness Matrix

10. Company Profiles

For more information about this report visit https://www.researchandmarkets.com/r/xownqd


Contacts

ResearchAndMarkets.com
Laura Wood, Senior Press Manager
This email address is being protected from spambots. You need JavaScript enabled to view it.
For E.S.T Office Hours Call 1-917-300-0470
For U.S./CAN Toll Free Call 1-800-526-8630
For GMT Office Hours Call +353-1-416-8900

NEW YORK--(BUSINESS WIRE)--$PLL #Lithium--Piedmont Lithium Limited (“Piedmont” or the “Company”) (Nasdaq:PLL; ASX:PLL) today announced the closing of its previously announced underwritten public offering of 2.3 million American Depositary Shares (“ADSs”), which includes the full exercise of the underwriters’ option to purchase 300,000 additional ADSs, with each ADS representing 100 of its ordinary shares (“Public Offering”). The aggregate gross proceeds of the Public Offering, before underwriting discounts and commissions, totaled $57.5 million.


Evercore ISI, Canaccord Genuity and ThinkEquity, a division of Fordham Financial Management, Inc., acted as joint book-runners for the Public Offering. Loop Capital Markets and Roth Capital Partners acted as co-managers for the Public Offering.

Proceeds from the offering will be used to continue development of the Company’s Piedmont Lithium Project, including a definitive feasibility study, testwork, permitting, further exploration drilling and ongoing land consolidation, and for general corporate purposes.

The Public Offering was made pursuant to an effective shelf registration statement that has been filed with the U.S. Securities and Exchange Commission (the “SEC”). A final prospectus supplement related to the offering of the ADSs has been filed with the SEC and is available on the SEC’s website at http://www.sec.gov and on the ASX website. Copies of the final prospectus supplement and the accompanying prospectus relating to the Public Offering may be obtained from Evercore Group L.L.C., Attention: Equity Capital Markets, 55 East 52nd Street, 35th Floor, New York, NY 10055, by telephone at (888) 474-0200 or by e-mail at This email address is being protected from spambots. You need JavaScript enabled to view it.; Canaccord Genuity LLC, 99 High Street, Suite 1200, Boston, Massachusetts 02110, Attn: Syndicate Department, by telephone at (671) 371-3900 or email at This email address is being protected from spambots. You need JavaScript enabled to view it.; and ThinkEquity, a division of Fordham Financial Management, Inc., Prospectus Department, 17 State Street, 22nd Floor, New York, New York 10004, telephone at (877) 436-3673 or e-mail at This email address is being protected from spambots. You need JavaScript enabled to view it..

This press release is not an offer or sale of the securities in the United States or in any other jurisdiction where such offer or sale is prohibited, and such securities may not be offered or sold in the United States absent registration or an exemption from registration under the Securities Act of 1933, as amended.

Forward-Looking Statements

This press release contains “forward-looking statements” as defined by the Private Securities Litigation Reform Act of 1995 that involve risks and uncertainties. In some cases, you can identify forward-looking statements by terms such as “may,” “might,” “will,” “objective,” “intend,” “should,” “could,” “can,” “would,” “expect,” “believe,” “design,” “estimate,” “predict,” “potential,” “plan” or the negative of these terms and similar expressions intended to identify forward-looking statements. Piedmont cautions readers that forward-looking statements are based on management’s expectations and assumptions as of the date of this news release and are subject to certain risks and uncertainties that could cause actual results to differ materially, including, but not limited to, the anticipated use of the net proceeds of the offering; the fact that the Company’s management will have broad discretion in the use of the proceeds from the sale of the ADSs; the Company’s operations being further disrupted by, or the Company’s financial results being adversely affected by, the novel coronavirus pandemic; the Company’s limited operating history in the lithium industry; the Company’s status as an exploration stage company; the Company’s ability to identify lithium mineralization and achieve commercial lithium mining; mining, exploration and mine construction, if warranted, on the Company’s properties; the Company’s ability to achieve and maintain profitability and to develop positive cash flow from the Company’s mining activities; the Company’s ability to enter into and deliver product under supply agreements; investment risk and operational costs associated with the Company’s exploration activities; the Company’s ability to enter into and deliver product under supply agreements; the Company’s ability to access capital and the financial markets; recruiting, training and maintaining employees; possible defects in title of the Company’s properties; potential conflicts of interest of the Company’s directors and officers; compliance with government regulations; the Company’s ability to acquire necessary mining licenses, permits or access rights; environmental liabilities and reclamation costs; volatility in lithium prices or demand for lithium; the Company’s ADS price and trading volume volatility; risks relating to the development of an active trading market for the ADSs; ADS holders not having certain shareholder rights; ADS holders not receiving certain distributions; and the Company’s status as a foreign private issuer and emerging growth company. Forward-looking statements reflect its analysis only on their stated date, and Piedmont undertakes no obligation to update or revise these statements except as may be required by law.

About Piedmont

Piedmont holds a 100% interest in the Piedmont Lithium Project located within the Carolina Tin-Spodumene Belt (“TSB”) and along trend to the Hallman Beam and Kings Mountain mines, historically providing most of the western world’s lithium between the 1950s and the 1980s. The TSB has been described as one of the largest lithium provinces in the world and is located approximately 25 miles west of Charlotte, North Carolina. It is a premier location for development of an integrated lithium business based on its favorable geology and easy access to infrastructure, power, R&D centers for lithium and battery storage, major high-tech population centers and downstream lithium processing facilities.


Contacts

Keith Phillips
President & CEO
T: +1 973 809 0505
E: This email address is being protected from spambots. You need JavaScript enabled to view it.

Tim McKenna
Investor and Government Relations
T: +1 732 331 6457
E: This email address is being protected from spambots. You need JavaScript enabled to view it.

HAMILTON, Bermuda--(BUSINESS WIRE)--October 23, 2020 – Triton International Limited (NYSE: TRTN) ("Triton")


Highlights:

  • Net income attributable to common shareholders for the three months ended September 30, 2020 was $45.9 million or $0.67 per diluted share, which includes a $24.3 million write off of unamortized debt and other costs related to the prepayment of ABS notes and other facilities and $8.6 million non-cash tax expense related to an intra-entity transfer of assets.
  • Adjusted net income was $78.1 million or $1.14 per diluted share, an increase of 32.6% from the second quarter of 2020.
  • Trade volumes and container demand jumped in the third quarter. Utilization increased 2.6% during the quarter to reach 97.4% as of September 30, 2020. Utilization was 97.6% as of October 16, 2020.
  • Triton issued $2.3 billion of ABS notes during the third quarter at an average interest rate of 2.2%. Most of the proceeds were used to prepay $1.8 billion of higher cost notes, which is expected to reduce interest expense by more than $25 million over the next year.
  • Triton's Board of Directors announced a nearly 10% increase in its quarterly common share dividend to $0.57 per share payable on December 23, 2020 to shareholders of record as of December 10, 2020.

Financial Results

The following table summarizes Triton’s selected key financial information for the three and nine months ended September 30, 2020 and 2019, and the three months ended June 30, 2020.


(in millions, except per share data)


Three Months Ended,


Nine Months Ended,


September 30, 2020


June 30, 2020


September 30, 2019


September 30, 2020


September 30, 2019

Total leasing revenues

$327.8


$321.4


$336.7


$970.6


$1,016.1


GAAP


Net income attributable to common shareholders(1)

$45.9


$60.1


$85.9


$173.2


$261.9


Net income per share - Diluted

$0.67


$0.86


$1.17


$2.48


$3.47


Non-GAAP (2)


Adjusted net income

$78.1


$60.0


$85.0


$205.2


$264.1


Adjusted net income per share - Diluted

$1.14


$0.86


$1.16


$2.93


$3.50


Return on equity (3)

15.8

%


12.2

%


16.1

%


13.6

%


16.5

%


  1. Net income attributable to common shareholders for the three and nine months ended September 30, 2020 includes a $24.3 million write off of unamortized debt and other costs related to the prepayment of ABS notes and other facilities and $8.6 million of non-cash tax expense related to an intra-entity transfer of assets. These two items are excluded in arriving at Adjusted net income.
  2. Refer to the "Use of Non-GAAP Financial Measures" and "Non-GAAP Reconciliations of Adjusted Net Income" set forth below.
  3. Refer to the “Calculation of Return on Equity” set forth below.

Operating Performance

"Triton took advantage of a strong upward inflection in container demand during the third quarter to drive a significant increase in our performance," commented Brian Sondey, Chief Executive Officer of Triton. "We generated $1.14 of Adjusted earnings per share in the third quarter of 2020, an increase of 32.6% from the second quarter, and we realized an annualized Return on equity of 15.8%."

"Global containerized trade volumes rebounded sharply in the third quarter as lockdowns in Europe and the United States eased, and container export volumes from key ports in China currently exceed pre-pandemic levels. The pace and magnitude of the trade recovery have generally exceeded our customers’ expectations, and virtually all of the major shipping lines have needed to add significant container capacity. We leveraged our market leading container supply capability to provide rapid and sizable container solutions for our customers, and we generated a record number of container bookings in the third quarter. Our team demonstrated remarkable agility in quickly responding to this surge in activity, and we are very proud to be playing an important role helping our customers keep the global supply chain functioning at this critical time. Our utilization increased 2.6% during the quarter to reach 97.4% as of September 30, 2020, and we have committed over 500,000 TEU of new containers onto attractive long-term leases. The strong demand has also led to increased container prices. As of October 16, 2020, container factories are quoting roughly $2,500 for a 20' dry container. We are also benefiting from increased sale prices for used container disposals and higher disposal gains."

"While we are very pleased with the improvement in market conditions and our performance in the third quarter, it is important to note that Triton's performance remained solid throughout 2019 and the first half of 2020 despite macro headwinds from the U.S./China trade dispute and COVID-19 lockdowns. Our annualized Return on equity averaged 14.0% for the four quarters ended June 30, 2020, and our utilization averaged 95.8%. The resilience of our business through difficult conditions reflects the strength of our long-term lease portfolio, the rapid adjustment of container supply and demand due to the short order cycle for containers, and the many advantages Triton enjoys as the scale, cost and capability leader in our industry. In addition, our customers' financial performance held up much better than expected in the first half of the year through the start of the COVID-19 pandemic and lockdowns, and our customers generally expect strong profitability in the second half of the year due to the sharp rebound in trade volumes that has led to a significant increase in freight rates."

"We have purchased approximately $800 million of new and sale-leaseback containers for delivery in 2020, which is below our target level. We accelerated container purchases during the third quarter, but our ability to quickly order large numbers of containers was constrained by tight container manufacturing capacity. We have also ordered approximately $350 million of containers for delivery in the first few months of 2021."

"We continue to strengthen our balance sheet. We issued $2.3 billion of ABS notes during the third quarter with an average fixed interest rate of 2.2%, and used most of the proceeds to prepay $1.8 billion of existing ABS notes with an average fixed interest rate of 3.8%. We closed the prepayment of the existing ABS notes on September 21, 2020, and we expect over $25 million of interest expense savings over the next year. In addition, our leverage remains near an all-time low and our liquidity position is excellent. The combination of our strong balance sheet and stable cash flows provides great protection for Triton and gives us many levers to drive shareholder value through a full range of market conditions."

Outlook

Mr. Sondey continued, "Container demand remains exceptionally strong as we start the fourth quarter. Our customers expect trade volumes to remain solid despite the end of the traditional summer peak season for dry containers. Customers are projecting meaningful container shortages into at least early next year, and they continue to rely heavily on leasing. We will benefit from a full quarter of revenue on the large number of containers picked up in the third quarter, and new containers produced in the fourth quarter should be picked up quickly. We will also benefit from a full period of reduced interest expense from our ABS refinancing. Overall, we expect our Adjusted earnings per share to increase in the range of 25% from the third to the fourth quarter of 2020."

"Looking forward to next year, the ongoing COVID-19 pandemic continues to create a high level of macro uncertainty for the global economy and trade. However, the vast majority of the containers leased-out over the last few months have been placed on multi-year leases, and the very low inventory of new and used containers available in the market should further support our utilization. In addition, the interest expense reduction from our ABS refinancing will benefit us into 2021 and beyond. As a result, we expect to achieve strong profitability and an attractive Return on equity in 2021."

Dividends

Triton’s Board of Directors has approved and declared a $0.57 per share quarterly cash dividend on its issued and outstanding common shares, payable on December 23, 2020 to shareholders of record at the close of business on December 10, 2020.

Mr. Sondey concluded, "The increase in our dividend reflects our confidence in the continued strength of our profitability and robust cash flows generated by our business, and our ongoing commitment to returning value to shareholders."

The Company's Board of Directors also approved and declared a cash dividend payable on December 15, 2020 to holders of record at the close of business on December 8, 2020 on its issued and outstanding preferred shares as follows:

Preferred Share Series


Dividend Rate


Dividend Per Share

Series A Preferred Shares (NYSE:TRTNPRA)


8.500%


$0.5312500

Series B Preferred Shares (NYSE:TRTNPRB)


8.000%


$0.5000000

Series C Preferred Shares (NYSE:TRTNPRC)


7.375%


$0.4609375

Series D Preferred Shares (NYSE:TRTNPRD)


6.875%


$0.4296875

Share Repurchase Update

Triton repurchased 0.4 million common shares in the third quarter of 2020, and has repurchased over 12.5 million common shares since the inception of the program in August 2018.

Investors’ Webcast

Triton will hold a Webcast at 8:30 a.m. (New York time) on Friday, October 23, 2020 to discuss its third quarter results. To listen by phone, please dial 1-877-418-5277 (domestic) or 1-412-717-9592 (international) approximately 15 minutes prior to the start time and reference the Triton International Limited conference call. To access the live Webcast please visit Triton's website at http://www.trtn.com. An archive of the Webcast will be available one hour after the live call.

About Triton International Limited

Triton International Limited is the world’s largest lessor of intermodal freight containers. With a container fleet of 6.1 million twenty-foot equivalent units ("TEU"), Triton’s global operations include acquisition, leasing, re-leasing and subsequent sale of multiple types of intermodal containers and chassis.

Utilization and Fleet Information

Effective December 31, 2019, we revised our cost equivalent units ("CEU") factor to be more in line with the cost of new containers over the last several years. These new CEU factors are generally consistent with those published by the International Institute for Container Lessors ("IICL"). We use the CEU factors to measure the size and performance of our container fleet.

The following table sets forth the equipment fleet utilization for the periods indicated:


Quarter Ended


September 30, 2020


June 30, 2020


March 31, 2020


December 31, 2019


September 30, 2019

Average Utilization (1)

96.1

%


95.0

%


95.4

%


95.8

%


96.7

%

Ending Utilization (1)

97.4

%


94.8

%


95.3

%


95.4

%


96.4

%

  1. Utilization is computed by dividing total units on lease (in CEU) by the total units in fleet (in CEU), excluding new units not yet leased and off-hire units designated for sale.

The following table summarizes the equipment fleet as of September 30, 2020, December 31, 2019 and September 30, 2019:


Equipment Fleet in Units


Equipment Fleet in TEU


September 30, 2020


December 31, 2019


September 30, 2019


September 30, 2020


December 31, 2019


September 30, 2019

Dry

3,220,631


3,267,624


3,287,025


5,306,071


5,369,377


5,393,705


Refrigerated

226,627


225,520


226,114


437,886


435,148


436,129


Special

93,639


94,453


94,678


170,471


171,437


171,579


Tank

11,153


12,485


12,539


11,153


12,485


12,539


Chassis

24,916


24,515


24,704


45,380


45,154


45,498


Equipment leasing fleet

3,576,966


3,624,597


3,645,060


5,970,961


6,033,601


6,059,450


Equipment trading fleet

72,444


17,906


17,054


111,369


27,121


25,764


Total

3,649,410


3,642,503


3,662,114


6,082,330


6,060,722


6,085,214


Equipment in CEU(1)


September 30, 2020


December 31, 2019


September 30, 2019

Operating leases

6,492,628


6,434,434


6,455,594


Finance leases

308,513


423,638


431,043


Equipment trading fleet

109,469


37,232


36,998


Total

6,910,610


6,895,304


6,923,635


  1. In the equipment fleet tables above, we have included total fleet count information based on CEU. CEU is a ratio used to convert the actual number of containers in our fleet to a figure based on the relative purchase prices of our various equipment types to that of a 20-foot dry container. For example, the CEU ratio for a 40-foot high cube dry container is 1.70, and a 40-foot high cube refrigerated container is 7.50. These factors may differ slightly from CEU ratios used by others in the industry.

Important Cautionary Information Regarding Forward-Looking Statements

Certain statements in this release, other than purely historical information, are "forward-looking statements" within the meaning of the Private Securities Litigation Reform Act of 1995, Section 27A of the Securities Act of 1933, as amended, and Section 21E of the Securities Exchange Act of 1934, as amended. Statements that include the words "expect," "intend," "plan," "believe," "project," "anticipate," "will," "may," "would" and similar statements of a future or forward-looking nature may be used to identify forward-looking statements. All forward-looking statements address matters that involve risks and uncertainties, many of which are beyond Triton's control. Accordingly, there are or will be important factors that could cause actual results to differ materially from those indicated in such statements and, therefore, you should not place undue reliance on any such statements.

These factors include, without limitation, economic, business, competitive, market and regulatory conditions and the following: the impact of COVID-19 on our business and financial results; decreases in the demand for leased containers; decreases in market leasing rates for containers; difficulties in re-leasing containers after their initial fixed-term leases; our customers' decisions to buy rather than lease containers; our dependence on a limited number of customers for a substantial portion of our revenues; customer defaults; decreases in the selling prices of used containers; extensive competition in the container leasing industry; difficulties stemming from the international nature of our business; decreases in the demand for international trade; disruption to our operations resulting from the political and economic policies of the United States and other countries, particularly China, including but not limited to the impact of trade wars and tariffs; disruption to our operations from failures of, or attacks on, our information technology systems; disruption to our operations as a result of natural disasters; our compliance or failure to comply with laws and regulations related to economic and trade sanctions, security, anti-terrorism, environmental protection and corruption; our ability to obtain sufficient capital to support our growth; restrictions imposed by the terms of our debt agreements; changes in tax laws in, Bermuda, the United States and other countries and other risks and uncertainties, including those risk factors set forth in the section entitled "Risk Factors" in our Form 10-K filed with the Securities and Exchange Commission ("SEC"), on February 14, 2020, in any Form 10-Q filed or to be filed by Triton, and in other documents we file with the SEC from time to time.

The foregoing list of important factors should not be construed as exhaustive and should be read in conjunction with the other cautionary statements that are included herein and elsewhere. Any forward-looking statements made herein are qualified in their entirety by these cautionary statements, and there can be no assurance that the actual results or developments anticipated by us will be realized or, even if substantially realized, that they will have the expected consequences to, or effects on Triton or its business or operations. Except to the extent required by applicable law, we undertake no obligation to update publicly or revise any forward-looking statement, whether as a result of new information, future developments or otherwise.

-Financial Tables Follow-

TRITON INTERNATIONAL LIMITED
Consolidated Balance Sheets
(In thousands, except share data)
(Unaudited)


September 30, 2020


December 31, 2019

ASSETS:


Leasing equipment, net of accumulated depreciation of $3,247,980 and $2,933,886

$

8,323,667


$

8,392,547


Net investment in finance leases

296,763


413,342


Equipment held for sale

104,923


114,504


Revenue earning assets

8,725,353


8,920,393


Cash and cash equivalents

173,257


62,295


Restricted cash

163,486


106,677


Accounts receivable, net of allowances of $2,155 and $1,276

214,978


210,697


Goodwill

236,665


236,665


Lease intangibles, net of accumulated amortization of $259,565 and $242,301

38,892


56,156


Other assets

72,044


38,902


Fair value of derivative instruments


10,848


Total assets

$

9,624,675


$

9,642,633


LIABILITIES AND SHAREHOLDERS' EQUITY:


Equipment purchases payable

$

96,798


$

24,685


Fair value of derivative instruments

154,603


36,087


Accounts payable and other accrued expenses

105,631


116,782


Net deferred income tax liability

319,320


301,317


Debt, net of unamortized costs of $41,741 and $39,781

6,429,434


6,631,525


Total liabilities

7,105,786


7,110,396


Shareholders' equity:


Preferred shares, $0.01 par value, at liquidation preference

555,000


405,000


Common shares, $0.01 par value, 270,000,000 shares authorized, 81,151,723 and 80,979,833 shares issued, respectively

812


810


Undesignated shares, $0.01 par value, 7,800,000 and 13,800,000 shares authorized, respectively, no shares issued and outstanding


Treasury shares, at cost, 12,544,597 and 8,771,345 shares, respectively

(385,696)


(278,510)


Additional paid-in capital

903,346


902,725


Accumulated earnings

1,597,928


1,533,845


Accumulated other comprehensive income (loss)

(152,501)


(31,633)


Total shareholders' equity

2,518,889


2,532,237


Total liabilities and shareholders' equity

$

9,624,675


$

9,642,633


TRITON INTERNATIONAL LIMITED
Consolidated Statements of Operations
(In thousands, except per share amounts)
(Unaudited)


Three Months Ended
September 30,


Nine months ended
September 30,


September 30, 2020


September 30, 2019


September 30, 2020


September 30, 2019

Leasing revenues:


Operating leases

$

320,352


$

326,800


$

946,579


$

985,592


Finance leases

7,405


9,868


24,043


30,501


Total leasing revenues

327,757


336,668


970,622


1,016,093


Equipment trading revenues

26,094


25,796


58,377


66,833


Equipment trading expenses

(22,225)


(21,646)


(50,555)


(54,600)


Trading margin

3,869


4,150


7,822


12,233


Net gain on sale of leasing equipment

10,737


6,196


19,351


22,184


Operating expenses:


Depreciation and amortization

136,248


133,367


402,235


403,324


Direct operating expenses

25,992


20,457


78,859


55,356


Administrative expenses

21,395


18,496


61,092


56,671


Provision (reversal) for doubtful accounts

(45)


126


4,608


505


Total operating expenses

183,590


172,446


546,794


515,856


Operating income (loss)

158,773


174,568


451,001


534,654


Other expenses:


Interest and debt expense

62,776


77,401


198,652


243,181


Realized (gain) loss on derivative instruments, net


(539)


(224)


(1,912)


Unrealized (gain) loss on derivative instruments, net


504


286


2,757


Debt termination expense

24,345


1,870


24,376


2,428


Other (income) expense, net

(631)


(116)


(4,241)


(2,047)


Total other expenses

86,490


79,120


218,849


244,407


Income (loss) before income taxes

72,283


95,448


232,152


290,247


Income tax expense (benefit)

15,825


4,845


28,070


20,737


Net income (loss)

$

56,458


$

90,603


$

204,082


$

269,510


Less: income (loss) attributable to noncontrolling interest


592


Less: dividend on preferred shares

10,512


4,708


30,850


7,038


Net income (loss) attributable to common shareholders

$

45,946


$

85,895


$

173,232


$

261,880


Net income per common share—Basic

$

0.67


$

1.18


$

2.49


$

3.49


Net income per common share—Diluted

$

0.67


$

1.17


$

2.48


$

3.47


Cash dividends paid per common share

$

0.52


$

0.52


$

1.56


$

1.56


Weighted average number of common shares outstanding—Basic

68,223


72,689


69,693


74,984


Dilutive restricted shares

359


560


289


573


Weighted average number of common shares outstanding—Diluted

68,582


73,249


69,982


75,557


TRITON INTERNATIONAL LIMITED
Consolidated Statements of Cash Flows
(In thousands)
(Unaudited)


Nine Months Ended September 30,


September 30, 2020


September 30, 2019

Cash flows from operating activities:


Net income (loss)

$

204,082


$

269,510


Adjustments to reconcile net income (loss) to net cash provided by operating activities:


Depreciation and amortization

402,235


403,324


Amortization of deferred debt cost and other debt related amortization

10,789


9,718


Lease related amortization

18,358


32,317


Share-based compensation expense

7,919


7,238


Net (gain) loss on sale of leasing equipment

(19,351)


(22,184)


Unrealized (gain) loss on derivative instruments

286


2,757


Debt termination expense

24,376


2,428


Deferred income taxes

28,441


18,885


Changes in operating assets and liabilities:


Accounts receivable

(7,325)


22,006


Accounts payable and other accrued expenses

(8,832)


(7,202)


Net equipment sold (purchased) for resale activity

5,185


(1,798)


Cash collections on finance lease receivables, net of income earned

60,913


53,706


Other assets

(44,735)


(11,198)


Net cash provided by (used in) operating activities

682,341


779,507


Cash flows from investing activities:


Purchases of leasing equipment and investments in finance leases

(354,425)


(160,518)


Proceeds from sale of equipment, net of selling costs

182,819


163,033


Other

(183)


(245)


Net cash provided by (used in) investing activities

(171,789)


2,270


Cash flows from financing activities:


Issuance of preferred shares, net of underwriting discount

145,275


221,790


Purchases of treasury shares

(107,186)


(209,592)


Redemption of common shares for withholding taxes

(2,156)


(5,666)


Debt issuance costs

(22,588)


(8,709)


Borrowings under debt facilities

3,297,445


1,417,200


Payments under debt facilities and finance lease obligations

(3,514,140)


(1,970,334)


Dividends paid on preferred shares

(30,420)


(6,253)


Dividends paid on common shares

(108,421)


(116,519)


Distributions to noncontrolling interests


(2,078)


Purchase of noncontrolling interests


(103,039)


Other

(590)


Net cash provided by (used in) financing activities

(342,781)


(783,200)


Net increase (decrease) in cash, cash equivalents and restricted cash

$

167,771


$

(1,423)


Cash, cash equivalents and restricted cash, beginning of period........................................................................................................................................................................

168,972


159,539


Cash, cash equivalents and restricted cash, end of period

$

336,743


$

158,116


Supplemental disclosures:


Interest paid

$

181,576


$

224,033


Income taxes paid (refunded)

$

440


$

2,504


Right-of-use asset for leased property

$

196


$

7,206


Supplemental non-cash investing activities:


Equipment purchases payable

$

96,798


$

34,922


Contacts

Andrew Greenberg
Senior Vice President
Business Development & Investor Relations
(914) 697-2900


Read full story here

HOUSTON--(BUSINESS WIRE)--SANDRIDGE MISSISSIPPIAN TRUST I (OTC: SDTTU) today announced that there will be no distribution paid for the three-month period ended September 30, 2020 (which primarily relates to production attributable to the Trust’s interests from June 1, 2020 to August 31, 2020) as costs, charges and expenses attributable to the properties in which the Trust holds royalty interests (the “Underlying Properties”), plus funds added to the Trust’s cash reserve, equaled the revenue received from the sale of oil, natural gas and other hydrocarbons produced from such properties, as reported by SandRidge Energy, Inc. (“SandRidge”).

During the three-month production period ended August 31, 2020, average oil, natural gas and natural gas liquids (“NGL”) prices increased compared to the three-month period ended May 31, 2020. Combined sales volumes slightly decreased compared to the previous period. As no additional development wells will be drilled, the Trust’s production is expected to decline each quarter during the remainder of its life.

As described in the Trust’s annual and quarterly reports filed with the Securities and Exchange Commission (the “SEC”), the trust agreement governing the Trust requires the Trust to dissolve and commence winding up of its business and affairs if cash available for distribution for any four consecutive quarters, on a cumulative basis, is less than $1.0 million. As cash available for distribution for the four consecutive quarters ended September 30, 2020, on a cumulative basis, will total approximately $815,000, the Trust will be required to dissolve and commence winding up beginning as of the close of business on November 13, 2020 (the “dissolution trigger date”). Accordingly, the Trustee will be required to sell all of the Trust’s assets, either by private sale or public auction, and distribute the net proceeds of the sale to the Trust unitholders after payment, or reasonable provision for payment, of all Trust liabilities, which is expected to include the establishment of cash reserves in such amounts as the Trustee in its discretion deems appropriate for the purpose of making reasonable provision for all claims and obligations of the Trust, including any contingent, conditional or unmatured claims and obligations, in accordance with the Delaware Statutory Trust Act. The sale process will involve costs that will reduce the amounts of any distributions to unitholders during the winding up period. As required by the trust agreement, within 30 days after the dissolution trigger date the Trustee plans to engage a third-party advisor to assist with the marketing and sale of the Trust’s assets. As provided in the trust agreement, SandRidge has a right of first refusal with respect to any sale of assets to a third party. The Trustee expects to complete the sale of the Trust’s assets and distribute the net proceeds of the sale to the Trust unitholders by the third quarter of 2021, and the Trust units are expected to be canceled shortly thereafter. Pending the sale or sales of the royalty interests, the Trust anticipates that it will continue to receive income from the royalty interests and will continue to make quarterly distributions to unitholders to the extent there is available cash after payment of Trust expenses and additions to cash reserves. The Trust will remain in existence until the filing of a certificate of cancellation with the Secretary of State of the State of Delaware following the completion of the winding up process.

The Trust owns royalty interests in oil and natural gas properties in the Mississippian formation in Alfalfa, Garfield, Grant and Woods counties in Oklahoma and is entitled to receive proceeds from the sale of production attributable to the royalty interests. As described in the Trust’s filings with the Securities and Exchange Commission (the “SEC”), the amount of the quarterly distributions is expected to fluctuate from quarter to quarter, depending on the proceeds received by the Trust as a result of actual production volumes, oil, natural gas and NGL prices, and the amount and timing of the Trust’s administrative expenses, among other factors. All Trust unitholders share distributions on a pro rata basis.

Volumes, average prices and distributable income available to unitholders for the period were (dollars in thousands, except average prices and per unit amount):

Sales Volumes


Oil (MBbl)

5

NGL (MBbl)

18

Natural Gas (MMcf)

199

Combined (MBoe)

56

Average Price


Oil (per Bbl)

$

38.32


NGL (per Bbl)

$

10.19


Natural Gas (per Mcf)

$

1.19


Natural Gas (per Mcf) including impact of post-production expenses

$

0.47


Revenues

$

619


Expenses

564

Distributable income

55


Additional cash reserve

$

55


Distributable income available to unitholders

$


Distributable income per unit (28,000,000 units issued and outstanding)

$


Pursuant to Internal Revenue Code Section 1446, withholding tax on income effectively connected to a United States trade or business allocated to non-U.S. persons ("ECI") should be made at the highest marginal rate. Under Section 1441, withholding tax on fixed, determinable, annual, periodic income from United States sources allocated to non-U.S. persons should be made at 30% of gross income unless the rate is reduced by treaty. This is intended to be a qualified notice by SandRidge Mississippian Trust I to nominees and brokers as provided for under Treasury Regulation Section 1.1446-4(b), and while specific relief is not specified for Section 1441 income, this disclosure is intended to suffice. Nominees and brokers should withhold at the highest marginal rate on the distribution made to non-U.S. persons. The Tax Cuts and Jobs Act (the "TCJA") enacted in December 2017 treats a non-U.S. holder's gain on the sale of Trust units as ECI to the extent such holder would have had ECI if the Trust had sold all of its assets at fair market value on the date of the exchange. The TCJA also requires the transferee of units to withhold 10% of the amount realized on the sale of exchange of units (generally, the purchase price) unless the transferor certifies that it is not a nonresident alien individual or foreign corporation. Pending the finalization of proposed regulations under IRC Section 1446, the IRS has suspended this new withholding obligation with respect to publicly traded partnerships such as the Trust, which is classified as a partnership for federal and state income tax purposes.

This press release contains statements that are “forward-looking statements” within the meaning of Section 21E of the Securities Exchange Act of 1934, as amended. All statements contained in this press release, other than statements of historical facts, are “forward-looking statements” for purposes of these provisions. These forward-looking statements include the amount and date of any anticipated distribution to unitholders, and the timing of the potential early termination of the Trust. The anticipated distribution is based, in part, on the amount of cash received or expected to be received by the Trust from SandRidge with respect to the relevant period. Any differences in actual cash receipts by the Trust could affect this distributable amount. The amount of such cash received or expected to be received by the Trust (and its ability to pay distributions) has been and will be significantly and negatively impacted by prevailing low commodity prices, which have declined sharply since the beginning of 2020 in response to the economic effects of the COVID-19 pandemic and the announcement in March 2020 of planned production increases by Saudi Arabia and could remain low for an extended period of time or decline further. Continued low oil, NGL and natural gas prices will reduce revenues to the Trust, which will reduce the amount of cash available for distribution to unitholders and in certain periods could result in no distributions to unitholders. Other important factors that could cause actual results to differ materially include expenses of the Trust and reserves for anticipated future expenses, and the effect, impact, potential duration or other implications of the COVID-19 pandemic. Statements made in this press release are qualified by the cautionary statements made in this press release. Neither SandRidge nor the Trustee intends, and neither assumes any obligation, to update any of the statements included in this press release. An investment in Common Units issued by SandRidge Mississippian Trust I is subject to the risks described in the Trust’s Annual Report on Form 10-K for the year ended December 31, 2019, the Trust’s Quarterly Report on Form 10-Q for the period ended June 30, 2020, and all of its other filings with the SEC. The Trust’s annual, quarterly and other filed reports are or will be available over the Internet at the SEC’s website at http://www.sec.gov.


Contacts

SandRidge Mississippian Trust I
The Bank of New York Mellon Trust Company, N.A., as Trustee
Sarah Newell
1(512) 236-6555

MANSFIELD, Ohio--(BUSINESS WIRE)--#EARNINGS--The Gorman-Rupp Company (NYSE: GRC) reports financial results for the third quarter and nine months ended September 30, 2020.

Third Quarter 2020 Highlights

  • Third quarter earnings per share were $0.28 compared to $0.37 per share for the third quarter of 2019

- Third quarter of 2020 included a non-cash pension settlement charge of $0.03 per share

- Third quarter earnings per share improved over second quarter of 2020 due to increased sales and cost containment efforts

  • Net sales decreased 10.4% or $10.3 million compared to the third quarter of 2019 and increased 3.7% compared to the second quarter of 2020
  • Scott A. King promoted to President and Chief Operating Officer effective January 1, 2021

Net sales for the third quarter of 2020 were $89.0 million compared to net sales of $99.3 million for the third quarter of 2019, a decrease of 10.4% or $10.3 million. Domestic sales decreased 8.9% or $6.2 million and international sales decreased 13.8% or $4.1 million compared to the same period in 2019. Sales have decreased across all of our markets primarily as a result of the COVID-19 pandemic, along with a slowdown in the oil & gas industry. This, together with the overall economic downturn that has resulted from the pandemic, slowed demand in the third quarter compared to the prior year. However, net sales increased by 3.7% compared to the second quarter of 2020. Our facilities and supply chain have remained operational through the pandemic.

Sales in our water markets decreased 5.2% or $3.5 million in the third quarter of 2020 compared to the third quarter of 2019. Sales in the construction market decreased $1.5 million driven primarily by softness in oil and gas drilling activity. Sales decreased $1.3 million in the repair market, $0.5 million in the municipal market, $0.1 million in fire protection, and $0.1 million in agriculture primarily as a result of the COVID-19 pandemic.

Sales in our non-water markets decreased 21.6% or $6.8 million in the third quarter of 2020 compared to the third quarter of 2019 primarily as a result of the COVID-19 pandemic, along with reduced demand from midstream oil and gas customers and softness in oil and gas drilling activity. Sales in the industrial market decreased $2.5 million, sales in the OEM market decreased $2.3 million and sales in the petroleum market decreased $2.0 million.

International sales were $25.7 million in the third quarter of 2020 compared to $29.8 million in the same period last year and represented 29% and 30% of total sales for each respective period. The decrease in international sales was across most of the markets the Company serves, most notably in non-water and municipal markets.

Gross profit was $23.0 million for the third quarter of 2020, resulting in gross margin of 25.8%, compared to gross profit of $25.8 million and gross margin of 26.0% for the same period in 2019. Gross margin decreased 20 basis points due to a 120 basis point favorable LIFO impact in the prior year third quarter which did not recur in the current year. Gross profit margin compared to the prior year was negatively impacted from the loss of leverage on fixed labor and overhead from lower sales volume compared to 2019 which was partially offset by favorable product mix.

Selling, general and administrative (“SG&A”) expenses were $13.2 million and 14.9% of net sales for the third quarter of 2020 compared to $14.1 million and 14.3% of net sales for the same period in 2019. SG&A expenses decreased 6.5% or $0.9 million due to reduced payroll related and travel expenses combined with overall expense management. SG&A expenses as a percentage of sales increased 60 basis points primarily as a result of loss of leverage from lower sales volume.

Operating income was $9.7 million for the third quarter of 2020, resulting in an operating margin of 10.9%, compared to operating income of $11.6 million and operating margin of 11.7% for the same period in 2019. Operating margin decreased 80 basis points primarily as a result of loss of leverage from lower sales volume.

Other income (expense), net was $0.7 million of expense for the third quarter of 2020 compared to income of $0.3 million for the same period in 2019. The increase to expense was due primarily to a non-cash pension settlement charge of $1.0 million which occurred in the third quarter of 2020.

Net income was $7.3 million for the third quarter of 2020 compared to $9.8 million in the third quarter of 2019, and earnings per share were $0.28 and $0.37 for the respective periods. Earnings per share for the third quarter of 2020 included a non-cash pension settlement charge of $0.03 per share. Earnings per share improved over the second quarter of 2020 due to increased sales and cost containment efforts.

Net sales for the first nine months of 2020 were $266.5 million compared to net sales of $304.5 million for the first nine months of 2019, a decrease of 12.5% or $38.0 million. Domestic sales decreased 11.2% or $23.7 million and international sales decreased 15.5% or $14.3 million compared to the same period in 2019. Sales have decreased across most of our markets primarily as a result of the COVID-19 pandemic, along with a slowdown in the oil and gas industry.

Sales in our water markets decreased 10.3% or $21.7 million in the first nine months of 2020 compared to the first nine months of 2019. Sales in the agriculture market increased $0.1 million. This increase was offset by sales decreases in the construction market of $12.1 million driven primarily by softness in oil and gas drilling activity, decreases in the repair market of $4.5 million due primarily to the COVID-19 pandemic, and decreases in the municipal market of $3.5 million driven primarily by timing of shipments related to weather and the COVID-19 pandemic. Also, sales in the fire protection market decreased $1.7 million driven primarily by lower international shipments as a result of the COVID-19 pandemic.

Sales in our non-water markets decreased 17.5% or $16.3 million in the first nine months of 2020 compared to the first nine months of 2019 primarily as a result of the COVID-19 pandemic, along with reduced demand from midstream oil and gas customers and softness in oil and gas drilling activity. Sales in the OEM market decreased $7.1 million, sales in the petroleum market decreased $5.8 million and sales in the industrial market decreased $3.4 million.

International sales were $78.2 million in the first nine months of 2020 compared to $92.5 million in the same period last year and represented 29% and 30% of total sales, respectively. The decrease in international sales was across most of the markets the Company serves.

Gross profit was $68.3 million for the first nine months of 2020, resulting in gross margin of 25.6%, compared to gross profit of $77.3 million and gross margin of 25.4% for the same period in 2019. Gross margin improved 20 basis points due principally to lower material costs of 180 basis points as a result of the stabilization of material costs and favorable product mix. Partially offsetting these improvements was loss of leverage on fixed labor and overhead from lower sales volume compared to the first nine months of 2019.

SG&A expenses were $41.0 million and 15.4% of net sales for the first nine months of 2020 compared to $43.5 million and 14.3% of net sales for the same period in 2019. SG&A expenses decreased 5.9% or $2.5 million due to reduced payroll related and travel expenses combined with overall expense management. SG&A expenses as a percentage of sales increased 110 basis points primarily as a result of loss of leverage from lower sales volume.

Operating income was $27.3 million for the first nine months of 2020, resulting in an operating margin of 10.3%, compared to operating income of $33.8 million and operating margin of 11.1% for the same period in 2019. Operating margin decreased 80 basis points primarily as a result of loss of leverage from lower sales volume partially offset by lower material costs.

Other income (expense), net was $4.4 million of expense for the first nine months of 2020 compared to income of $0.8 million in 2019. The increase to expense was due primarily to non-cash pension settlement charges of $4.4 million.

Net income was $18.4 million for the first nine months of 2020 compared to $27.5 million in 2019, and earnings per share were $0.70 and $1.05 for the respective periods. Earnings per share for the first nine months of 2020 included non-cash pension settlement charges of $0.13 per share.

The Company’s backlog of orders was $102.0 million at September 30, 2020 compared to $101.4 million at September 30, 2019 and $105.0 million at December 31, 2019. Incoming orders decreased 10.1% for the first nine months of 2020 compared to the same period in 2019. Incoming orders were down across most markets the Company serves driven primarily by the COVID-19 pandemic and a slowdown in the oil and gas industry.

Capital expenditures for the first nine months of 2020 were $6.3 million and consisted primarily of machinery and equipment and building improvements. Capital expenditures for the full-year 2020 are presently planned to be in the range of $8-$10 million.

As part of the Company’s on-going succession planning, effective January 1, 2021 the role of President will transition from Jeffrey S. Gorman, who will continue to serve as the Company’s Chairman and Chief Executive Officer, to Scott A. King, who is currently the Company’s Vice President and Chief Operating Officer. In addition to operational and financial oversight of all of Gorman-Rupp’s divisions and subsidiaries, Mr. King will join Mr. Gorman in leading the Company’s strategic planning and acquisition efforts. Mr. King has been with the Company since 2004 and has held various operational leadership roles during this time.

Jeffrey S. Gorman, Chairman, President and CEO commented, “I am very pleased to announce that the Board of Directors has approved the transition of my role as President to Scott A. King effective January 1, 2021. During his 15 years with the Company, Scott has developed a deep understanding of the pump industry, as well as the culture that has contributed to Gorman-Rupp’s success over the years.”

“The Board and I are also recognizing the contributions of two other Executive Officers effective January 1, 2021. James C. Kerr, currently the Company’s Vice President and Chief Financial Officer, will be promoted to Executive Vice President and Chief Financial Officer, and Brigette A. Burnell, currently the Company’s Vice President, General Counsel and Corporate Secretary, will be promoted to Senior Vice President, General Counsel and Corporate Secretary.”

Regarding the current quarter, Mr. Gorman stated, “While sales and incoming orders continue to be negatively impacted by the global challenges of COVID-19, both our sales and earnings showed improvement over the second quarter. Although the ongoing impact of COVID-19 on our economy continues to remain uncertain, we remain focused on being prepared for the eventual recovery when it does occur, including maintaining strong inventory levels and focusing on our long-term strategic initiatives across the numerous end markets we serve.”

“I would also like to extend my personal gratitude to all the employees of Gorman-Rupp worldwide. COVID-19 has brought a unique set of challenges that could not have been addressed without their cooperation and dedication to our customers, shareholders and fellow employees.”

About The Gorman-Rupp Company
Founded in 1933, The Gorman-Rupp Company is a leading designer, manufacturer and international marketer of pumps and pump systems for use in diverse water, wastewater, construction, dewatering, industrial, petroleum, original equipment, agriculture, fire protection, heating, ventilating and air conditioning (HVAC), military and other liquid-handling applications.

Forward-Looking Statements
In connection with the “safe harbor” provisions of the Private Securities Litigation Reform Act of 1995, The Gorman-Rupp Company provides the following cautionary statement: This news release contains various forward-looking statements based on assumptions concerning The Gorman-Rupp Company’s operations, future results and prospects. These forward-looking statements are based on current expectations about important economic, political, and technological factors, among others, and are subject to risks and uncertainties, which could cause the actual results or events to differ materially from those set forth in or implied by the forward-looking statements and related assumptions. Such factors include, but are not limited to: (1) continuation of the current and projected future business environment, including the duration and scope of the COVID-19 pandemic, the impact of the pandemic and actions taken in response to the pandemic; (2) highly competitive markets; (3) availability and costs of raw materials; (4) loss of key personnel; (5) cyber security threats; (6) intellectual property security; (7) acquisition performance and integration; (8) compliance with, and costs related to, a variety of import and export laws and regulations; (9) environmental compliance costs and liabilities; (10) exposure to fluctuations in foreign currency exchange rates; (11) conditions in foreign countries in which The Gorman-Rupp Company conducts business; (12) changes in our tax rates and exposure to additional income tax liabilities; (13) impairment in the value of intangible assets, including goodwill; (14) defined benefit pension plan settlement expense; (15) family ownership of common equity; and (16) risks described from time to time in our reports filed with the Securities and Exchange Commission. Except to the extent required by law, we do not undertake and specifically decline any obligation to review or update any forward-looking statements or to publicly announce the results of any revisions to any of such statements to reflect future events or developments or otherwise.

For additional information, contact James C. Kerr, Chief Financial Officer, Telephone (419) 755-1548.

 
The Gorman-Rupp Company
Condensed Consolidated Statements of Income (Unaudited)
(thousands of dollars, except per share data)
 
Three Months Ended September 30, Nine Months Ended September 30,

2020


2019

2020


2019


Net sales

$88,982


$99,298

$266,467


$304,487

Cost of products sold

66,011


73,506

198,199


227,190

 
Gross profit

22,971


25,792

68,268


77,297

 
Selling, general and
administrative expenses

13,228


14,154

40,951


43,505

 
Operating income

9,743


11,638

27,317


33,792

 
Other income (expense), net

(744

)

269

(4,361

)

792

 
Income before income taxes

8,999


11,907

22,956


34,584

Income taxes

1,738


2,132

4,575


7,107

 
Net income

$7,261


$9,775

$18,381


$27,477

 
Earnings per share

$0.28


$0.37

$0.70


$1.05


The Gorman-Rupp Company
Condensed Consolidated Balance Sheets (Unaudited)
(thousands of dollars, except share data)
 
September 30, December 31,

2020

2019

Assets
Cash and cash equivalents

$93,665

$80,555

Accounts receivable, net

59,890

65,433

Inventories, net

82,504

75,997

Prepaid and other

5,388

5,680

 
Total current assets

241,447

227,665

 
Property, plant and equipment, net

109,401

111,779

 
Other assets

8,497

8,320

 
Prepaid pension assets

337

-

 
Goodwill and other intangible assets, net

33,740

34,996


Total assets

$393,422

$382,760

 
Liabilities and shareholders' equity
Accounts payable

$14,060

$16,030

Accrued liabilities and expenses

31,948

29,465

 
Total current liabilities

46,008

45,495

 
Pension benefits

-

1,040

 
Postretirement benefits

24,556

24,453

 
Other long-term liabilities

3,227

3,894

 
Total liabilities

73,791

74,882

 
Shareholders' equity

319,631

307,878

 
Total liabilities and shareholders' equity

$393,422

$382,760

 
Shares outstanding

26,101,992

26,067,502


Contacts

Brigette A. Burnell
Corporate Secretary
The Gorman-Rupp Company
Telephone (419) 755-1246
NYSE: GRC

Offshore Source Logo

Offshore Source keeps you updated with relevant information concerning the Offshore Energy Sector.

Any views or opinions represented on this website belong solely to the author and do not represent those of the people, institutions or organizations that Offshore Source or collaborators may or may not have been associated with in a professional or personal capacity, unless explicitly stated.

Corporate Offices

Technology Systems Corporation
8502 SW Kansas Ave
Stuart, FL 34997

info@tscpublishing.com