Business Wire News

Composite Decking Leader Recognized as Highest Ranking Building Materials Manufacturer

WINCHESTER, Va.--(BUSINESS WIRE)--Trex® Company (NYSE: TREX), the world’s #1 brand of wood-alternative decking and railing and leader in high-performance, low-maintenance outdoor living products, was named to FORTUNE Magazine’s 2020 list of the 100 fastest-growing companies worldwide. Trex captured spot #57 and was the highest-ranked building materials manufacturer on this year’s list.


“We are honored to be recognized by FORTUNE as one of the fastest-growing public companies in 2020 and inspired to continue enhancing the lives of people by engineering what’s next in outdoor living,” said Bryan Fairbanks, president and CEO of Trex Company. “Since Trex's inception, we’ve developed and nurtured long-standing relationships with the top specialty material distributors, pro channel dealers and DIY retailers, making Trex the most widely available and purchased brand throughout North America and increasingly around the world. We continue to focus on ensuring these channel partners grow alongside Trex as we invest in our brand and deliver market-leading products that meet the needs of homeowners seeking to improve their outdoor living spaces.”

Trex was founded in the mid-1990s on the premise that ingenuity can help extract value from what was once seen as waste. Today, the entire high-performance Trex decking portfolio is made from a minimum of 95% recycled material that repurposes more than 800 million pounds of recycled plastic and reclaimed wood fiber annually. In fact, Trex is one of the largest recyclers of discarded plastic shopping bags and polyethylene film in North America. Furthermore, the company uses some of the most earth-friendly manufacturing processes in the world, reclaiming factory waste and eliminating the use of harmful chemicals.

“This accolade is especially meaningful to us because it demonstrates that a company can build a successful business model based on recycled materials and ingenious design,” noted Fairbanks. “As proud as I am about our outstanding growth, I am even more excited about our strategic initiative to accelerate the conversion from wood decking to sustainable Trex composite decking – raising the bar for product performance and aesthetics – as well as environmental responsibility.”

FORTUNE measures and ranks the top-performing companies over three years based on revenues, profits and stock returns. Because the methodology evaluates companies over a three-year period, the bulk of the performance results that drove this year’s rankings were accumulated before COVID-19 began affecting the global economy. Trex, however, has continued to grow despite and throughout the pandemic recently reporting a 19% YOY increase in consolidated net sales for Q3 2020.

For more information on the FORTUNE 2020 Fastest-Growing Companies list methodology, visit https://fortune.com/100-fastest-growing-companies/.

For more information about high-performance, low-maintenance Trex products, visit trex.com.

About Trex Company, Inc.

Trex Company, Inc. [NYSE: TREX] is the world’s largest manufacturer of high performance wood-alternative decking and railing, with more than 25 years of product experience. Stocked in more than 6,700 retail locations worldwide, Trex outdoor living products offer a wide range of style options with fewer ongoing maintenance requirements than wood, as well as a truly environmentally responsible choice. For more information, visit trex.com. You also can follow Trex on Twitter (@Trex_Company), Instagram (@trexcompany), Pinterest (trexcompany) or Houzz (trexcompany-inc), “like” Trex on Facebook (@TrexCompany) or view product and demonstration videos on the brand’s YouTube channel (TheTrexCo).


Contacts

Ben Arens or Sara Tatay
L.C. Williams & Associates
800/837-7123 or 312/565-3900
This email address is being protected from spambots. You need JavaScript enabled to view it. or This email address is being protected from spambots. You need JavaScript enabled to view it.

TORONTO--(BUSINESS WIRE)--Superior Plus Corp. (TSX:SPB):


November 2020 Cash Dividend - $0.06 per share
Superior Plus Corp. (“Superior”) today announced its cash dividend for the month of November 2020 of $0.06 per share payable on December 15, 2020. The record date is November 30, 2020 and the ex-dividend date will be November 27, 2020. Superior’s annualized cash dividend rate is currently $0.72 per share. This dividend is an eligible dividend for Canadian income tax purposes.

Upcoming Release of 2020 Third Quarter Results and Conference Call
Superior expects to release its 2020 third quarter results on Wednesday, November 11, 2020 after market close. A conference call and webcast to discuss the 2020 third quarter results is scheduled for 10:30 AM EST on Thursday, November 12, 2020. To participate in the call, dial: 1-844-389-8661. Internet users can listen to the call live, or as an archived call, on Superior's website at: www.superiorplus.com under the Events section.

About the Corporation
Superior consists of two primary operating businesses: Energy Distribution includes the distribution of propane and distillates, and Specialty Chemicals includes the production and distribution of specialty chemicals products.

For further information about Superior, please visit our website at: www.superiorplus.com or contact: Beth Summers, Executive Vice President and Chief Financial Officer, Tel: (416) 340-6015, or Rob Dorran, Vice President, Investor Relations and Treasurer, Tel: (416) 340-6003, E-mail: This email address is being protected from spambots. You need JavaScript enabled to view it., Toll Free: 1-866-490-PLUS (7587).

Forward Looking Information
This news release contains certain forward-looking information and statements that are based on Superior’s current expectations, estimates, projections and assumptions in light of its experience and its perception of historical trends. In this news release, such forward-looking information and statements can be identified by terminology such as “will”, "expects", "annualized", and similar expressions.

In particular, this news release contains forward-looking statements and information relating to: future dividends which may be declared on Superior’s common shares, the dividend payment, the tax treatment thereof, and the receipt of cash dividends. These forward-looking statements are being made by Superior based on certain assumptions that Superior has made in respect thereof as at the date of this news release, regarding, among other things: the success of Superior’s operations; prevailing commodity prices, margins, volumes and exchange rates; that Superior’s future results of operations will be consistent with past performance and management expectations in relation thereto; the continued availability of capital at attractive prices to fund future capital requirements; future operating costs; that any required commercial agreements can be reached; that all required regulatory and environmental approvals can be obtained on the necessary terms in a timely manner. These forward-looking statements are not guarantees of future performance and are subject to a number of known and unknown risks and uncertainties, including, but not limited to: the regulatory environment and decisions; non-performance of agreements in accordance with their terms; the impact of competitive entities and pricing; reliance on key industry partners and agreements; actions by governmental or regulatory authorities including changes in tax laws and treatment, or increased environmental regulation; adverse general economic and market conditions in Canada, North America and elsewhere; fluctuations in operating results; labour and material shortages; and certain other risks detailed from time to time in Superior’s public disclosure documents including, among other things, those detailed under the heading "Risk Factors" in Superior’s management's discussion and analysis and annual information form for the year ended December 31, 2019, which can be found at www.sedar.com.

Accordingly, readers are cautioned that events or circumstances could cause results to differ materially from those predicted, forecasted or projected. Such forward-looking statements are expressly qualified by the above statements. Superior does not undertake any obligation to publicly update or revise any forward looking statements or information contained herein, except as required by applicable laws.


Contacts

Beth Summers, Executive Vice President and Chief Financial Officer
Tel: (416) 340-6015
or
Rob Dorran, Vice President, Investor Relations and Treasurer
Tel: (416) 340-6003
E-mail: This email address is being protected from spambots. You need JavaScript enabled to view it.
Toll Free: 1-866-490-PLUS (7587)

EAST AURORA, N.Y.--(BUSINESS WIRE)--The Board of Directors of Moog Inc. (NYSE: MOG.A and MOG.B) has declared a quarterly dividend of $.25 per share on the Company’s issued and outstanding shares of Class A common stock and Class B common stock. The dividend will be paid on December 7, 2020 to all shareholders of record as of the close of business on November 20, 2020.

The dividend represents a use of cash of approximately $8 million. Future declarations of quarterly dividends are subject to the determination and discretion of Moog’s Board of Directors.

Moog Inc. is a worldwide designer, manufacturer, and integrator of precision control components and systems. Moog’s high-performance systems control military and commercial aircraft, satellites and space vehicles, launch vehicles, missiles, automated industrial machinery, marine and medical equipment. Additional information about the company can be found at www.moog.com.

Cautionary Statement

Information included or incorporated by reference in this report that does not consist of historical facts, including statements accompanied by or containing words such as “may,” “will,” “should,” “believes,” “expects,” “expected,” “intends,” “plans,” “projects,” “approximate,” “estimates,” “predicts,” “potential,” “outlook,” “forecast,” “anticipates,” “presume” and “assume,” are forward-looking statements. Such forward-looking statements are made pursuant to the safe harbor provisions of the Private Securities Litigation Reform Act of 1995. These forward-looking statements reflect the Company’s current views with respect to certain current and future events and financial performance and are not guarantees of future performance. This includes but is not limited to, the Company’s expectation and ability to pay a quarterly cash dividend on its common stock in the future, subject to the determination by the board of directors, and based on an evaluation of company earnings, financial condition and requirements, business conditions, capital allocation determinations and other factors, risks and uncertainties. The impact or occurrence of these could cause actual results to differ materially from the expected results described in the forward-looking statements. These important factors, risks and uncertainties include:

COVID-19 Pandemic Risks

  • We face various risks related to health pandemics such as the global COVID-19 pandemic, which may have material adverse consequences on our operations, financial position, cash flows, and those of our customers and suppliers.

Strategic Risks

  • We operate in highly competitive markets with competitors who may have greater resources than we possess;
  • Our new products and technology research and development efforts are substantial and may not be successful which could reduce our sales and earnings;
  • Our inability to adequately enforce and protect our intellectual property or defend against assertions of infringement could prevent or restrict our ability to compete; and
  • Our sales and earnings may be affected if we cannot identify, acquire or integrate strategic acquisitions, or as we conduct divestitures.

Market Condition Risks

  • The markets we serve are cyclical and sensitive to domestic and foreign economic conditions and events, which may cause our operating results to fluctuate;
  • We depend heavily on government contracts that may not be fully funded or may be terminated, and the failure to receive funding or the termination of one or more of these contracts could reduce our sales and increase our costs;
  • The loss of The Boeing Company as a customer or a significant reduction in sales to The Boeing Company could adversely impact our operating results; and
  • We may not realize the full amounts reflected in our backlog as revenue, which could adversely affect our future revenue and growth prospects. 

Operational Risks

  • Our business operations may be adversely affected by information systems interruptions, intrusions or new software implementations;
  • We may not be able to prevent, or timely detect, issues with our products and our manufacturing processes which may adversely affect our operations and our earnings;
  • If our subcontractors or suppliers fail to perform their contractual obligations, our prime contract performance and our ability to obtain future business could be materially and adversely impacted; and
  • The failure or misuse of our products may damage our reputation, necessitate a product recall or result in claims against us that exceed our insurance coverage, thereby requiring us to pay significant damages.

Financial Risks

  • We make estimates in accounting for over-time contracts, and changes in these estimates may have significant impacts on our earnings;
  • We enter into fixed-price contracts, which could subject us to losses if we have cost overruns;
  • Our indebtedness and restrictive covenants under our credit facilities could limit our operational and financial flexibility;
  • The phase out of LIBOR may negatively impact our debt agreements and financial position, results of operations and liquidity;
  • Significant changes in discount rates, rates of return on pension assets, mortality tables and other factors could adversely affect our earnings and equity and increase our pension funding requirements;
  • A write-off of all or part of our goodwill or other intangible assets could adversely affect our operating results and net worth; and
  • Unforeseen exposure to additional income tax liabilities may affect our operating results.

Legal and Compliance Risks

  • Contracting on government programs is subject to significant regulation, including rules related to bidding, billing and accounting standards, and any false claims or non-compliance could subject us to fines, penalties or possible debarment;
  • Our operations in foreign countries expose us to political and currency risks and adverse changes in local legal and regulatory environments;
  • Government regulations could limit our ability to sell our products outside the United States and otherwise adversely affect our business;
  • We are involved in various legal proceedings, the outcome of which may be unfavorable to us; and
  • Our operations are subject to environmental laws, and complying with those laws may cause us to incur significant costs.

General Risks

  • The United Kingdom's decision to exit the European Union may result in short-term and long-term adverse impacts on our results of operations;
  • Escalating tariffs, restrictions on imports or other trade barriers between the United States and various countries may impact our results of operations;
  • Future terror attacks, war, natural disasters or other catastrophic events beyond our control could negatively impact our business; and
  • Our performance could suffer if we cannot maintain our culture as well as attract, retain and engage our employees.

These factors are not exhaustive. New factors, risks and uncertainties may emerge from time to time that may affect the forward-looking statements made herein. Given these factors, risks and uncertainties, investors should not place undue reliance on forward-looking statements as predictive of future results. We disclaim any obligation to update the forward-looking statements made in this report.


Contacts

Ann Marie Luhr
716-687-4225

A Cold Front from the Gulf of Alaska is Forecasted to Arrive on Thursday, Bringing the First Chilly Temperatures, Rainfall and Snow to Portions of Northern California by Friday

SAN FRANCISCO--(BUSINESS WIRE)--Fall’s first real cold front is forecast this week for Northern California and it’s expected to cause temperatures to drop by 15 to 20 degrees and perhaps bring showers and snow to some locations by Friday, so Pacific Gas and Electric Company (PG&E) is urging customers to be cautious when heating their homes.

Electric heating devices, such as space heaters, are a fire hazard when not properly used or monitored. Fuel-burning appliances, such as gas furnaces, stoves and water heaters, can increase the risk of carbon monoxide when they are not working properly. High levels of carbon monoxide, a toxic gas, can be generated by appliances that are defective or improperly installed or maintained. It’s also a good time of year to change the batteries in your smoke alarms and carbon monoxide detectors.

According to PG&E meteorologists, a weather system will move into the region out of the Pacific Northwest Thursday night into Friday, and it will bring precipitation and significantly cooler temperatures with it.

The National Weather Service forecasts that the high temperature in Chico will drop from 81 degrees on Thursday to 58 degrees on Friday. Predicted low temps on Friday will be 44 degrees in San Jose, 43 in Sacramento, 45 in Fresno and 39 in Santa Rosa. In the Lake Tahoe area, by Sunday, the high will be near 35 degrees with a low around 13 degrees.

PG&E urges customers to focus on safely heating their homes as temperatures drop and offers the following tips:

  • Place space heaters on level, hard, nonflammable surfaces, not on rugs or carpets.
  • Don’t put objects on space heaters or use them to dry clothes or shoes.
  • Keep all flammable materials at least three feet away from heating sources and supervise children and pets when a space heater or fireplace is being used.
  • Turn off space heaters when leaving the room or going to sleep.
  • Never use cooking devices such as ovens or stoves to heat your home, and never use products inside the home that generate dangerous levels of carbon monoxide, such as generators, barbecues, propane heaters and charcoal.
  • Install carbon monoxide detectors to warn you if concentration levels are high. As of 2011, all California single-family homes are required to have carbon monoxide detectors. Make sure they are installed near sleeping areas and replace the batteries at least twice a year.
  • When using the fireplace to stay warm, make sure the flue is open so that the byproducts of combustion can vent safely through the chimney.

If customers suspect there is a problem with a natural gas appliance inside their home, they should call PG&E at 1-800-743-5000. A gas service representative will be dispatched to do a thorough inspection at no cost to the customer. If you detect carbon monoxide in your home, you should get out immediately and call 911.

About PG&E

Pacific Gas and Electric Company, a subsidiary of PG&E Corporation (NYSE:PCG), is one of the largest combined natural gas and electric energy companies in the United States. Based in San Francisco, with more than 23,000 employees, the company delivers some of the nation's cleanest energy to 16 million people in Northern and Central California. For more information, visit pge.com and pge.com/news.


Contacts

MEDIA RELATIONS:
415-973-5930

Reconfirms 2020 Guidance and Provides 2021 Guidance

Increases Run Rate Production and Financial Guidance

HOUSTON--(BUSINESS WIRE)--Cheniere Energy, Inc. (NYSE American: LNG):


Summary of Third Quarter 2020 Results (in millions, except LNG data)


Three Months Ended September 30,


Nine Months Ended September 30,


2020


2019


% Change


2020


2019


% Change

Revenues

$

1,460


$

2,170


(33

)%


$

6,571


$

6,723


(2

)%

Net income (loss)1

$

(463

)


$

(318

)


(46

)%


$

109


$

(291

)


nm

Consolidated Adjusted EBITDA2

$

477


$

694


(31

)%


$

2,909


$

1,959


48

%

LNG exported:


Number of cargoes

55


108


(49

)%


261


299


(13

)%

Volumes (TBtu)

193


383


(50

)%


920


1,054


(13

)%

LNG volumes loaded (TBtu)

187


384


(51

)%


920


1,057


(13

)%


Summary Guidance (in billions, except LNG and per share data)


2020 Full Year Guidance


2020

Consolidated Adjusted EBITDA2

$

3.8

-

$

4.1

Distributable Cash Flow2

$

1.0

-

$

1.3


2021 Full Year Guidance


2021

Consolidated Adjusted EBITDA2

$

3.9

-

$

4.2

Distributable Cash Flow2

$

1.2

-

$

1.5


Run Rate Guidance


Previous Run Rate


Revised Run Rate3

Consolidated Adjusted EBITDA2

$

5.2


-

$

5.6


$

5.3


-

$

5.7


Distributable Cash Flow2

$

2.5


-

$

2.9


$

2.6


-

$

3.0


Distributable Cash Flow per Share2,4

$

8.40


-

$

9.60


$

10.25


-

$

11.75


Production Capacity per Train5 (mtpa)

4.7


-

5.0


4.9


-

5.1


Recent Highlights

Operational

  • As of October 31, 2020, more than 1,250 cumulative LNG cargoes totaling over 85 million tonnes of LNG have been produced, loaded and exported from our liquefaction projects.
  • In August and September 2020, we coordinated across our liquefaction facilities and with our counterparties to fulfill all of our commercial obligations despite the operational impacts of Hurricane Laura, which included a temporary suspension of operations at the SPL Project (defined below).
  • In October 2020, as part of the commissioning process, feed gas was introduced to Train 3 of the CCL Project (defined below).

Financial

  • For the nine months ended September 30, 2020, we reported net income1 of $109 million, Consolidated Adjusted EBITDA2 of approximately $2.9 billion, and Distributable Cash Flow2 of over $1.0 billion.
  • During the three months ended September 30, 2020, in line with our previously announced capital allocation priorities, we prepaid $100 million of outstanding borrowings under the three-year Cheniere Term Loan Facility with available cash. During the nine months ended September 30, 2020, we repurchased an aggregate of 2.9 million shares of our common stock for $155 million under our share repurchase program.
  • In July 2020, the Cheniere Term Loan Facility was increased from $2.62 billion to $2.695 billion, and we used borrowings under the facility to (1) redeem all of the remaining outstanding principal amount of the 11.0% Convertible Senior Secured Notes due 2025 issued by Cheniere CCH Holdco II, LLC (the “CCH Holdco II Notes”), subsequent to the $300 million redemption in March 2020, with cash at a price of $1,080 per $1,000 principal amount of notes, (2) repurchase $844 million in aggregate principal amount of outstanding 4.875% Convertible Senior Notes due 2021 issued by Cheniere (the “2021 Convertible Notes”) at individually negotiated prices from a small number of investors, and (3) pay related fees and expenses of the Cheniere Term Loan Facility. The remaining borrowing capacity under the Cheniere Term Loan Facility, approximately $372 million, is expected to be used to repay and/or repurchase a portion of the remaining outstanding principal amount of the 2021 Convertible Notes and for the payment of related fees and expenses.
  • In August 2020, Cheniere Corpus Christi Holdings, LLC (“CCH”) issued an aggregate principal amount of $769 million of 3.52% Senior Secured Notes due 2039. The net proceeds of these notes were used to repay a portion of the outstanding borrowings under the CCH Credit Facility, pay costs associated with certain interest rate derivative instruments that were settled, and pay certain fees, costs and expenses incurred in connection with the transactions contemplated thereby.
  • In August 2020, Moody’s Investors Service upgraded its rating of CCH’s senior debt from Ba1 (Positive Outlook) to Baa3.
  • In September 2020, we issued an aggregate principal amount of $2.0 billion of 4.625% Senior Secured Notes due 2028 (the “2028 Senior Secured Notes”) and used net proceeds to prepay approximately $2.0 billion of the outstanding borrowings under the Cheniere Term Loan Facility.

Cheniere Energy, Inc. (“Cheniere”) (NYSE American: LNG) reported net loss1 of $463 million, or $1.84 per share—basic and diluted for the three months ended September 30, 2020, compared to a net loss of $318 million, or $1.25 per share—basic and diluted, for the comparable 2019 period. Net loss increased during the three months ended September 30, 2020 primarily due to decreased total margins6, increased loss on modification or extinguishment of debt primarily related to the redemption of the remaining CCH Holdco II Notes and a portion of the 2021 Convertible Notes, and increased loss on our equity method investments, partially offset by increased losses attributable to non-controlling interest, decreased interest expense, and increased income tax benefit. Total margins decreased during the three months ended September 30, 2020 primarily due to the accelerated recognition of revenues in prior periods related to elections by our long-term SPA customers to not take delivery of LNG cargoes that were scheduled to be delivered during the current period, partially offset by an increase in margins per MMBtu of LNG delivered to customers and recognized in income.

Cheniere reported net income of $109 million, or $0.43 per share—basic and diluted for the nine months ended September 30, 2020, compared to a net loss of $291 million, or $1.13 per share—basic and diluted, for the comparable 2019 period. Net income increased during the nine months ended September 30, 2020 primarily due to increased total margins, partially offset by increased operating costs and expenses primarily due to additional Trains in operation and costs incurred in response to the COVID-19 pandemic, increased loss on modification of extinguishment of debt as detailed above, increased interest expense, increased income tax expense, and increased loss on our equity method investments. Total margins increased during the nine months ended September 30, 2020 primarily due to increased LNG revenues including both cargoes delivered to customers and cargoes for which customers notified us that they would not take delivery, primarily as a result of additional Trains in operation and slightly increased margins per MMBtu of LNG delivered to customers and recognized in income, and increased net gains from changes in fair value of commodity derivatives.

Margins per MMBtu of LNG delivered to customers and recognized in income increased during the three and nine months ended September 30, 2020 primarily due to an increase in the proportion of volumes sold pursuant to higher-margin long-term contracts, partially offset by a decrease in market pricing for short-term cargoes sold.

Consolidated Adjusted EBITDA was $477 million for the three months ended September 30, 2020, compared to $694 million for the comparable 2019 period. The decrease in Consolidated Adjusted EBITDA during the three months ended September 30, 2020 was primarily due to the accelerated recognition of revenues in prior periods related to elections by our long-term SPA customers to not take delivery of LNG cargoes that were scheduled to be delivered during the current period.

Consolidated Adjusted EBITDA was $2.91 billion for the nine months ended September 30, 2020, compared to $1.96 billion for the comparable 2019 period. The increase in Consolidated Adjusted EBITDA during the nine months ended September 30, 2020 was primarily due to increased LNG revenues including both cargoes delivered to customers and cargoes for which customers notified us that they would not take delivery, primarily due to additional Trains in operation and slightly increased margins per MMBtu of LNG delivered to customers and recognized in income, partially offset by increased operating costs and expenses primarily due to additional Trains in operation.

During the three and nine months ended September 30, 2020, we recognized $171 million and $932 million, respectively, in revenues associated with LNG cargoes for which customers have notified us that they will not take delivery, of which $47 million would have otherwise been recognized subsequent to September 30, 2020, if the cargoes were lifted pursuant to the delivery schedules with the customers. LNG revenues during the three months ended September 30, 2020 excluded $458 million that would have otherwise been recognized during the quarter if the cargoes were lifted pursuant to the delivery schedules with the customers, as these revenues were recognized during the three months ended June 30, 2020. Excluding the impact of cargo cancellations related to periods subsequent to September 30, 2020 and those received in prior periods for the current periods, our total revenues would have been $1.87 billion and $6.52 billion for the three and nine months ended September 30, 2020, respectively.

During the three and nine months ended September 30, 2020, 55 and 261 LNG cargoes, respectively, were exported from our liquefaction projects, none of which were commissioning cargoes. Six cargoes exported from our liquefaction projects and sold on a delivered basis were in transit as of September 30, 2020.

“We are once again delivering strong results in the face of challenges, including two major hurricanes which recently impacted the Sabine Pass area, further cementing our reputation for resilience and operational excellence,” said Jack Fusco, Cheniere’s President and Chief Executive Officer. "The stability in our operations, along with a strengthening of LNG market conditions, supports our ability to reconfirm our full year 2020 financial guidance and provide robust financial guidance for full year 2021.”

“As we look ahead to 2021, we expect the global LNG market to continue rebalancing and look forward to the completion of Train 3 at Corpus Christi ahead of schedule and within budget. Today we are also raising our run rate Consolidated Adjusted EBITDA and Distributable Cash Flow guidance. The increases in these guidance ranges are driven by increased expected run-rate LNG production, as we have continued to execute on optimization and debottlenecking opportunities to maximize production from our existing infrastructure.”

LNG Volume Summary

The following table summarizes the volumes of operational and commissioning LNG that were loaded from our liquefaction projects and for which the financial impact was recognized on our Consolidated Financial Statements during the three and nine months ended September 30, 2020:


Three Months Ended


Nine Months Ended


September 30, 2020


September 30, 2020

(in TBtu)

Operational


Commissioning


Operational


Commissioning

Volumes loaded during the current period

187


920


Volumes loaded during the prior period but recognized during the current period

2


33


Less: volumes loaded during the current period and in transit at the end of the period

(21

)


(21

)


Total volumes recognized in the current period

168


932


In addition, during the three and nine months ended September 30, 2020, we recognized the financial impact of 31 TBtu and 79 TBtu of LNG, respectively, on our Consolidated Financial Statements related to LNG cargoes sourced from third parties.

Cargo Cancellation Revenue Summary

The following table summarizes the timing impacts of revenue recognition related to cargoes for which customers elected to not take delivery on our revenues for the three and nine months ended September 30, 2020 (in millions):


Three Months Ended


Nine Months Ended


September 30, 2020


September 30, 2020

Total revenues

$

1,460


$

6,571


Impact of cargo cancellations recognized in the prior period for deliveries scheduled in the current period

458


Impact of cargo cancellations recognized in the current period for deliveries scheduled in subsequent periods

(47

)


(47

)


Total revenues excluding the timing impact of cargo cancellations

$

1,871


$

6,524


Liquefaction Projects Update


CCL Project


SPL Project


Train 3


Train 6

Project Status

Commissioning


Under Construction

Project Completion Percentage (1)

96.7% (2)


70.9% (3)

Expected Substantial Completion

1Q 2021


2H 2022

Note: Projects update excludes Trains in operation

(1) Project completion percentages as of September 30, 2020

(2) Engineering 100.0% complete, procurement 100.0% complete, and construction 91.1% complete

(3) Engineering 97.8% complete, procurement 98.2% complete, and construction 34.6% complete

Additional Discussion and Analysis of Financial Condition and Results

Details Regarding Third Quarter and Year-to-Date September 30, 2020 Results

Our financial results are reported on a consolidated basis. Our ownership interest in Cheniere Energy Partners, L.P. (“Cheniere Partners”) (NYSE American: CQP) as of September 30, 2020 consisted of 100% ownership of the general partner and a 48.6% limited partner interest.

Income from operations decreased $235 million during the three months ended September 30, 2020, as compared to the comparable 2019 period, primarily due to the decrease in total margins as detailed above. Income from operations increased $1.0 billion during the nine months ended September 30, 2020, as compared to the comparable 2019 period, primarily due to the increase in total margins as detailed above, partially offset by costs incurred in response to the COVID-19 pandemic and increased operating costs and expenses primarily due to additional Trains in operation.

Selling, general and administrative expense included share-based compensation expenses of $16 million and $54 million for the three and nine months ended September 30, 2020, respectively, compared to $22 million and $65 million for the comparable 2019 periods.

Capital Resources

As of September 30, 2020, we had cash and cash equivalents of $2.1 billion on a consolidated basis, of which $1.3 billion was held by Cheniere Partners. In addition, we had current restricted cash of $522 million designated for the following purposes: $157 million for the SPL Project, $145 million for the CCL Project and $220 million for other restricted purposes.

Liquefaction Projects

SPL Project

Through Cheniere Partners, we operate five natural gas liquefaction Trains and are constructing one additional Train for a total production capacity of approximately 30 million tonnes per annum (“mtpa”) of LNG at the Sabine Pass LNG terminal (the “SPL Project”).

CCL Project

We operate two Trains and are commissioning one additional Train for a total production capacity of approximately 15 mtpa of LNG near Corpus Christi, Texas (the “CCL Project”).

Corpus Christi Stage 3

We are developing an expansion adjacent to the CCL Project for up to seven midscale Trains with an expected total production capacity of approximately 10 mtpa of LNG (“Corpus Christi Stage 3”). We expect to commence construction of the Corpus Christi Stage 3 project upon, among other things, entering into an engineering, procurement, and construction contract and additional commercial agreements, and obtaining adequate financing.

Investor Conference Call and Webcast

We will host a conference call to discuss our financial and operating results for the third quarter 2020 on Friday, November 6, 2020, at 11 a.m. Eastern time / 10 a.m. Central time. A listen-only webcast of the call and an accompanying slide presentation may be accessed through our website at www.cheniere.com. Following the call, an archived recording will be made available on our website.

___________________________

1

Net income (loss) as used herein refers to Net income (loss) attributable to common stockholders on our Consolidated Statements of Operations.

2

Non-GAAP financial measure. See “Reconciliation of Non-GAAP Measures” for further details.

3

Run rate assumes full operations of nine Trains.

4

Previous run rate Distributable Cash Flow per Share assumed ~300 million shares outstanding, revised run rate Distributable Cash Flow per Share assumes ~255 million shares.

5

Run rate average annual production capacity which includes expected impacts of planned maintenance, production reliability, potential overdesign, and debottlenecking opportunities.

6

Total margins as used herein refers to total revenues less cost of sales.


About Cheniere

Cheniere Energy, Inc. is the leading producer and exporter of liquefied natural gas (LNG) in the United States, reliably providing a clean, secure, and affordable solution to the growing global need for natural gas. Cheniere is a full-service LNG provider, with capabilities that include gas procurement and transportation, liquefaction, vessel chartering, and LNG delivery. Cheniere has one of the largest liquefaction platforms in the world, consisting of the Sabine Pass and Corpus Christi liquefaction facilities on the U.S. Gulf Coast, with expected total production capacity of approximately 45 million tonnes per annum of LNG operating or under construction. Cheniere is also pursuing liquefaction expansion opportunities and other projects along the LNG value chain. Cheniere is headquartered in Houston, Texas, and has additional offices in London, Singapore, Beijing, Tokyo, and Washington, D.C.

For additional information, please refer to the Cheniere website at www.cheniere.com and Quarterly Report on Form 10-Q for the quarter ended September 30, 2020, filed with the Securities and Exchange Commission.

Forward-Looking Statements

This press release contains certain statements that may include “forward-looking statements” within the meanings of Section 27A of the Securities Act of 1933 and Section 21E of the Securities Exchange Act of 1934. All statements, other than statements of historical or present facts or conditions, included herein are “forward-looking statements.” Included among “forward-looking statements” are, among other things, (i) statements regarding Cheniere’s financial and operational guidance, business strategy, plans and objectives, including the development, construction and operation of liquefaction facilities, (ii) statements regarding expectations regarding regulatory authorizations and approvals, (iii) statements expressing beliefs and expectations regarding the development of Cheniere’s LNG terminal and pipeline businesses, including liquefaction facilities, (iv) statements regarding the business operations and prospects of third parties, (v) statements regarding potential financing arrangements, (vi) statements regarding future discussions and entry into contracts, (vii) statements relating to the amount and timing of share repurchases, and (viii) statements regarding the COVID-19 pandemic and its impact on our business and operating results. Although Cheniere believes that the expectations reflected in these forward-looking statements are reasonable, they do involve assumptions, risks and uncertainties, and these expectations may prove to be incorrect. Cheniere’s actual results could differ materially from those anticipated in these forward-looking statements as a result of a variety of factors, including those discussed in Cheniere’s periodic reports that are filed with and available from the Securities and Exchange Commission. You should not place undue reliance on these forward-looking statements, which speak only as of the date of this press release. Other than as required under the securities laws, Cheniere does not assume a duty to update these forward-looking statements.

Cheniere Energy, Inc.

Consolidated Statements of Operations

(in millions, except per share data)(1)

(unaudited)


Three Months Ended


Nine Months Ended


September 30,


September 30,


2020


2019


2020


2019

Revenues


LNG revenues

$

1,373


$

2,059


$

6,236


$

6,375


Regasification revenues

67


66


202


199


Other revenues

20


45


133


149


Total revenues

1,460


2,170


6,571


6,723


Operating costs and expenses


Cost of sales (excluding items shown separately below)

768


1,267


2,295


3,758


Operating and maintenance expense

317


308


988


824


Development expense


2


5


6


Selling, general and administrative expense

70


72


224


222


Depreciation and amortization expense

233


213


699


561


Impairment expense and loss on disposal of assets


1


5


7


Total operating costs and expenses

1,388


1,863


4,216


5,378


Income from operations

72


307


2,355


1,345


Other expense


Interest expense, net of capitalized interest

(355

)


(395

)


(1,174

)


(1,014

)


Loss on modification or extinguishment of debt

(171

)


(27

)


(215

)


(27

)


Interest rate derivative loss, net


(78

)


(233

)


(187

)


Other expense, net

(129

)


(70

)


(115

)


(38

)


Total other expense

(655

)


(570

)


(1,737

)


(1,266

)


Income (loss) before income taxes and non-controlling interest

(583

)


(263

)


618


79


Income tax benefit (provision)

75


3


(119

)


Net income (loss)

(508

)


(260

)


499


79


Less: net income (loss) attributable to non-controlling interest

(45

)


58


390


370


Net income (loss) attributable to common stockholders

$

(463

)


$

(318

)


$

109


$

(291

)


Net income (loss) per share attributable to common stockholders—basic and diluted (2)

$

(1.84

)


$

(1.25

)


$

0.43


$

(1.13

)


Weighted average number of common shares outstanding—basic

252.2


256.0


252.5


256.8


Weighted average number of common shares outstanding—diluted

252.2


256.0


253.2


256.8


___________________

(1)

Please refer to the Cheniere Energy, Inc. Quarterly Report on Form 10-Q for the quarter ended September 30, 2020, filed with the Securities and Exchange Commission.

(2)

Earnings per share in the table may not recalculate exactly due to rounding because it is calculated based on whole numbers, not the rounded numbers presented.


Cheniere Energy, Inc.

Consolidated Balance Sheets

(in millions, except share data)(1)(2)


September 30,


December 31,


2020


2019

ASSETS

(unaudited)


Current assets


Cash and cash equivalents

$

2,091


$

2,474


Restricted cash

522


520


Accounts and other receivables, net

390


491


Inventory

280


312


Derivative assets

195


323


Other current assets

154


92


Total current assets

3,632


4,212


Property, plant and equipment, net

30,201


29,673


Operating lease assets, net

630


439


Non-current derivative assets

592


174


Goodwill

77


77


Deferred tax assets

414


529


Other non-current assets, net

385


388


Total assets

$

35,931


$

35,492


LIABILITIES AND STOCKHOLDERS’ EQUITY


Current liabilities


Accounts payable

$

41


$

66


Accrued liabilities

1,006


1,281


Current debt

338


Deferred revenue

179


161


Current operating lease liabilities

160


236


Derivative liabilities

164


117


Other current liabilities

29


13


Total current liabilities

1,917


1,874


Long-term debt, net

30,949


30,774


Non-current operating lease liabilities

473


189


Non-current finance lease liabilities

58


58


Non-current derivative liabilities

173


151


Other non-current liabilities

14


11


Commitments and contingencies


Stockholders’ equity


Preferred stock, $0.0001 par value, 5.0 million shares authorized, none issued


Common stock, $0.003 par value, 480.0 million shares authorized


Issued: 273.0 million shares at September 30, 2020 and 270.7 million shares at December 31, 2019


Outstanding: 252.2 million shares at September 30, 2020 and 253.6 million shares at December 31, 2019

1


1


Treasury stock: 20.8 million shares and 17.1 million shares at September 30, 2020 and December 31, 2019, respectively, at cost

(872

)


(674

)


Additional paid-in-capital

4,246


4,167


Accumulated deficit

(3,399

)


(3,508

)


Total stockholders' deficit

(24

)


(14

)


Non-controlling interest

2,371


2,449


Total equity

2,347


2,435


Total liabilities and stockholders’ equity

$

35,931


$

35,492


Contacts

Cheniere Energy, Inc.

Investors
Randy Bhatia, 713-375-5479
Megan Light, 713-375-5492
or
Media Relations
Eben Burnham-Snyder, 713-375-5764
Jenna Palfrey, 713-375-5491


Read full story here

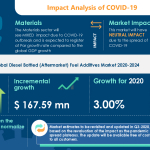
LONDON--(BUSINESS WIRE)--#DieselBottledAftermarketFuelAdditivesMarket--Technavio has been monitoring the diesel bottled (aftermarket) fuel additives market and it is poised to grow by USD 167.59 mn during 2020-2024, progressing at a CAGR of 5% during the forecast period. The report offers an up-to-date analysis regarding the current market scenario, latest trends and drivers, and the overall market environment.


Technavio’s in-depth research has all your needs covered as our research reports include all foreseeable market scenarios, including pre- & post-COVID-19 analysis. Download Latest Free Sample Report on COVID-19 Analysis

The market is fragmented, and the degree of fragmentation will accelerate during the forecast period. Afton Group, BASF SE, Callington Haven Pty. Ltd., Chevron Corp., Cummins Inc., Evonik Industries AG, LIQUI MOLY GmbH, Lucas Oil Products Inc., The Lubrizol Corp., and Total SA are some of the major market participants. To make the most of the opportunities, market vendors should focus more on the growth prospects in the fast-growing segments, while maintaining their positions in the slow-growing segments.

Buy 1 Technavio report and get the second for 50% off. Buy 2 Technavio reports and get the third for free.

View market snapshot before purchasing

Rising vehicle population and high consumption of diesel bottled fuel additives have been instrumental in driving the growth of the market. However, growing popularity of battery-powered electric vehicles might hamper the market growth.

Technavio's custom research reports offer detailed insights on the impact of COVID-19 at an industry level, a regional level, and subsequent supply chain operations. This customized report will also help clients keep up with new product launches in direct & indirect COVID-19 related markets, upcoming vaccines and pipeline analysis, and significant developments in vendor operations and government regulations. Download a Free Sample Report on COVID-19 Impacts

Diesel Bottled (Aftermarket) Fuel Additives Market 2020-2024: Segmentation

Diesel Bottled (Aftermarket) Fuel Additives Market is segmented as below:

  • End-user
    • Automotive
    • Oil And Gas
    • Others
  • Type
    • Cetane Improvers
    • Cold Flow Improvers
    • Corrosion Inhibitors
    • Anti-icing
    • Others
  • Geography
    • North America
    • Europe
    • APAC
    • South America
    • MEA

Diesel Bottled (Aftermarket) Fuel Additives Market 2020-2024: Scope

Technavio presents a detailed picture of the market by the way of study, synthesis, and summation of data from multiple sources. The diesel bottled (aftermarket) fuel additives market report covers the following areas:

  • Diesel Bottled (Aftermarket) Fuel Additives Market Size
  • Diesel Bottled (Aftermarket) Fuel Additives Market Trends
  • Diesel Bottled (Aftermarket) Fuel Additives Market Industry Analysis

Technavio suggests three forecast scenarios (optimistic, probable, and pessimistic) considering the impact of COVID-19. Technavio’s in-depth research has direct and indirect COVID-19 impacted market research reports.

Register for a free trial today and gain instant access to 17,000+ market research reports.

Technavio's SUBSCRIPTION platform

Diesel Bottled (Aftermarket) Fuel Additives Market 2020-2024: Key Highlights

  • CAGR of the market during the forecast period 2020-2024
  • Detailed information on factors that will assist diesel bottled (aftermarket) fuel additives market growth during the next five years
  • Estimation of the diesel bottled (aftermarket) fuel additives market size and its contribution to the parent market
  • Predictions on upcoming trends and changes in consumer behavior
  • The growth of the diesel bottled (aftermarket) fuel additives market
  • Analysis of the market’s competitive landscape and detailed information on vendors
  • Comprehensive details of factors that will challenge the growth of diesel bottled (aftermarket) fuel additives market, vendors

Table of Contents:

Executive Summary

  • Market Overview

Market Landscape

  • Market ecosystem
  • Market characteristics
  • Value chain analysis

Market Sizing

  • Market definition
  • Market segment analysis
  • Market size 2019
  • Market outlook: Forecast for 2019 - 2024

Five Forces Analysis

  • Five Forces Summary
  • Bargaining power of buyers
  • Bargaining power of suppliers
  • Threat of new entrants
  • Threat of substitutes
  • Threat of rivalry
  • Market condition

Market Segmentation by End-user

  • Market segments
  • Comparison by End-user
  • Automotive - Market size and forecast 2019-2024
  • Oil and gas - Market size and forecast 2019-2024
  • Others - Market size and forecast 2019-2024
  • Market opportunity by End-user

Market Segmentation by Type

  • Market segments
  • Comparison by Type
  • Cetane improvers - Market size and forecast 2019-2024
  • Cold flow improvers - Market size and forecast 2019-2024
  • Corrosion inhibitors - Market size and forecast 2019-2024
  • Anti-icing - Market size and forecast 2019-2024
  • Combustion improvers - Market size and forecast 2019-2024
  • Deposit controllers - Market size and forecast 2019-2024
  • Antioxidants - Market size and forecast 2019-2024
  • Others - Market size and forecast 2019-2024
  • Market opportunity by Type

Customer landscape

  • Overview

Geographic Landscape

  • Geographic segmentation
  • Geographic comparison
  • North America - Market size and forecast 2019-2024
  • Europe - Market size and forecast 2019-2024
  • APAC - Market size and forecast 2019-2024
  • South America - Market size and forecast 2019-2024
  • MEA - Market size and forecast 2019-2024
  • Key leading countries
  • Market opportunity by geography
  • Volume driver-Demand led growth
  • Market challenges
  • Market trends

Vendor Landscape

  • Vendor landscape
  • Landscape disruption

Vendor Analysis

  • Vendors covered
  • Market positioning of vendors
  • Afton Group
  • BASF SE
  • Callington Haven Pty. Ltd.
  • Chevron Corp.
  • Cummins Inc.
  • Evonik Industries AG
  • LIQUI MOLY GmbH
  • Lucas Oil Products Inc.
  • The Lubrizol Corp.
  • Total SA

Appendix

  • Scope of the report
  • Currency conversion rates for US$
  • Research methodology
  • List of abbreviations

About Us

Technavio is a leading global technology research and advisory company. Their research and analysis focus on emerging market trends and provides actionable insights to help businesses identify market opportunities and develop effective strategies to optimize their market positions. With over 500 specialized analysts, Technavio’s report library consists of more than 17,000 reports and counting, covering 800 technologies, spanning across 50 countries. Their client base consists of enterprises of all sizes, including more than 100 Fortune 500 companies. This growing client base relies on Technavio’s comprehensive coverage, extensive research, and actionable market insights to identify opportunities in existing and potential markets and assess their competitive positions within changing market scenarios.


Contacts

Technavio Research
Jesse Maida
Media & Marketing Executive
US: +1 844 364 1100
UK: +44 203 893 3200
Email: This email address is being protected from spambots. You need JavaScript enabled to view it.
Website: www.technavio.com/

NEW YORK--(BUSINESS WIRE)--Hess Corporation (NYSE: HES) announced today that it has completed the previously announced sale of its 28% working interest in the Shenzi Field in the deepwater Gulf of Mexico to BHP, the field’s operator, for a total consideration of $505 million, subject to customary adjustments, with an effective date of July 1, 2020.


This transaction brings value forward in the current low price environment and further strengthens our cash and liquidity position,” CEO John Hess said. “Proceeds will be used to fund our world class investment opportunity in Guyana.”

Hess Corporation is a leading global independent energy company engaged in the exploration and production of crude oil and natural gas. More information on Hess Corporation is available at www.hess.com.

Cautionary Statements

This news release contains “forward-looking statements” within the meaning of Section 27A of the Securities Act of 1933, as amended, and Section 21E of the Securities Exchange Act of 1934, as amended. Words such as “anticipate,” “estimate,” “expect,” “forecast,” “guidance,” “could,” “may,” “should,” “would,” “believe,” “intend,” “project,” “plan,” “predict,” “will,” “target” and similar expressions identify forward-looking statements, which are not historical in nature. These forward-looking statements may include, without limitation, the use of proceeds from our asset sale and our future financial and operational results. Forward-looking statements are subject to certain known and unknown risks and uncertainties that could cause actual results to differ materially from our historical experience and our current projections or expectations of future results expressed or implied by these forward-looking statements. The following important factors could cause actual results to differ materially from those in our forward-looking statements: fluctuations in market prices of crude oil, natural gas liquids and natural gas; demand for our products, including due to the global COVID-19 pandemic or due to the impact of competing or alternative energy products and political conditions and events; the ability of our contractual counterparties to satisfy their obligations to us; contract and other laws, regulations and governmental actions applicable to our business; and other factors described in the Risk Factor section in our Annual Report on Form 10-K and Quarterly Reports on Form 10-Q and any additional risks described in our other filings with the Securities and Exchange Commission. As and when made, we believe that our forward-looking statements are reasonable. However, given these risks and uncertainties, caution should be taken not to place undue reliance on any such forward-looking statements since such statements speak only as of the date when made and there can be no assurance that such forward-looking statements will occur and actual results may differ materially from those contained in any forward-looking statement we make. Except as required by law, we undertake no obligation to publicly update or revise any forward-looking statements, whether because of new information, future events or otherwise.


Contacts

Investor Contact:
Jay Wilson
(212) 536-8940
This email address is being protected from spambots. You need JavaScript enabled to view it.

Media Contact:
Lorrie Hecker
(212) 536-8250
This email address is being protected from spambots. You need JavaScript enabled to view it.

DENVER--(BUSINESS WIRE)--Whiting Petroleum Corporation (NYSE: WLL) (“Whiting” or the “Company”) today announced third quarter 2020 results.


Third Quarter 2020 Highlights

  • Revenue was $184 million for the quarter ending September 30, 2020
  • Net income was $278 million, or $7.30 per diluted share for the quarter ending September 30, 2020
  • Adjusted EBITDAX was $100 million for the quarter ending September 30, 2020 (see further discussion regarding the presentation of adjusted EBITDAX in "About Non-GAAP Financial Measures" below)
  • Emerged from bankruptcy with a strong balance sheet and liquidity position

On September 1, 2020 (the “Emergence Date”) the Company emerged from voluntary bankruptcy under Chapter 11 of the Bankruptcy Code. Beginning on the Emergence Date, the Company applied fresh start accounting, which resulted in a new basis of accounting, and became a new entity for financial reporting purposes. As a result of the application of fresh start accounting and the effects of the implementation of the Company’s chapter 11 plan of reorganization, the consolidated financial statements after September 1, 2020 are not comparable with the consolidated financial statements on or prior to that date. References to “Successor” refer to the Whiting entity after emergence from bankruptcy on the Emergence Date. References to “Predecessor” refer to the Whiting entity prior to emergence from bankruptcy. References to “Successor Period” refer to the period from September 1, 2020 through September 30, 2020. References to “Current Predecessor Quarter” and “Current Predecessor YTD Period” refer to the periods from July 1, 2020 through August 31, 2020 and January 1, 2020 through August 31, 2020, respectively. References to “Prior Predecessor Quarter” and “Prior Predecessor YTD Period” refer to the three and nine months ended September 30, 2019, respectively.

Although GAAP requires that we report on results for the Successor Period and the Current Predecessor Quarter and Current Predecessor YTD Period separately, our operating results are discussed below for the three and nine months ended September 30, 2020 by combining the results of the applicable Predecessor and Successor periods in order to provide the most meaningful comparison of our current results to prior periods. Accordingly, references to “Combined Current Quarter” and “Combined Current YTD Period” refer to the three and nine months ended September 30, 2020, respectively.

Revenue for the Combined Current Quarter decreased $192 million to $184 million when comparing to the quarter ending September 30, 2019. A decrease in total production accounted for approximately $111 million of the change in revenue and decreases in commodity prices realized accounted for approximately $81 million of the change in revenue between periods.

Net income for the Combined Current Quarter was $278 million, or $7.30 per share, as compared to a net loss of $19 million, or $0.21 per share, in the quarter ended September 30, 2019. Adjusted net loss for the Combined Current Quarter was $13 million or $0.34 per share.

Adjusted EBITDAX for the Combined Current Quarter was $100 million compared to $236 million for the quarter ended September 30, 2019.


Non-GAAP


Predecessor


Combined Three
Months Ended
September 30, 2020


Three Months
Ended
September 30, 2019

Selected operating statistics:


Production


Oil (MBbl)


5,209


7,441


NGLs (MBbl)


1,641


1,830


Natural gas (MMcf)


10,737


12,536


Total production (MBOE)


8,639


11,361


Average prices


Oil (per Bbl):


Price received


$

34.05


$

49.71


Effect of crude oil hedging (1)


0.01


1.41


Realized price (3)


$

34.06


$

51.12


Weighted average NYMEX price (per Bbl) (4)


$

40.92


$

56.43


NGLs (per Bbl):


Realized price


$

6.48


$

3.07


Natural gas (per Mcf):


Price received


$

(0.41

)


$

0.03


Effect of natural gas hedging (2)


0.03


-


Realized price


$

(0.38

)


$

0.03


Weighted average NYMEX price (per MMBtu) (4)


$

1.90


$

2.29


Selected operating metrics


Sales price, net of hedging ($ per BOE)


$

21.29


$

34.01


Lease operating ($ per BOE)


5.92


7.51


Transportation, gathering, compression and other ($ per BOE)


0.72


0.98


Depreciation, depletion and amortization ($ per BOE)


10.57


18.58


General and administrative ($ per BOE)


3.11


2.63


Production and ad valorem taxes (% of sales revenue)


9

%


9

%

_________________________________

(1)

Whiting received $0.04 million and $10 million in pre-tax cash settlements on crude oil hedges during the three months ended September 30, 2020 and 2019, respectively. A summary of Whiting’s outstanding hedges is included in “Commodity Price Hedging” later in this release.

(2)

Whiting received $0.3 million in pre-tax cash settlements on natural gas hedges during the three months ended September 30, 2020. A summary of Whiting’s outstanding hedges is included in “Commodity Price Hedging” later in this release.

(3)

Whiting’s realized prices were reduced by $2.38 per Bbl during the three months ended September 30, 2019 due deficiency payments under a contract in our Redtail field. This contract ended in April 2020.

(4)

Average NYMEX prices weighted for monthly production volumes.

Liquidity

Since emergence, the Company paid down approximately $25 million on its revolver. As of September 30, 2020, the Company had $400 million outstanding on its revolver and $14 million in cash resulting in total liquidity of $364 million. Whiting expects to fund its operations fully within operating cash flow through at least 2021.

Commodity Price Hedging

Whiting uses commodity hedges in order to reduce the effects of commodity price volatility and to adhere to the requirements of its credit facility. As of October 30, 2020, the Company has approximately 1.9 million Bbls of oil hedged at a weighted-average floor price of approximately $39 per Bbl in 2020, approximately 8.8 million Bbls of oil hedged at a weighted-average floor price of approximately $39 per Bbl in 2021 and approximately 3.5 million Bbls of oil hedged at a weighted-average floor price of approximately $38 per Bbl in 2022. Additionally, the Company has approximately 2.2 billion British thermal units (“Bbtu”) of natural gas hedged at a weighted-average floor price of $2.36 per million British thermal units (“MMbtu”) in 2020, approximately 23.5 Bbtu of natural gas hedged at a weighted-average floor price of $2.65 per MMbtu in 2021 and approximately 12.1 Bbtu of natural gas hedged at a weighted-average floor price of $2.38 per MMbtu in 2022. These floor prices are the weighted-average of swaps and the floors of collared transactions.

G & A

G&A expenses decreased to $27 million in the Combined Current Quarter, which includes $15 million of specific costs related to restructuring. This compares to $28 million in the second quarter 2020 and $30 million in the third quarter 2019, which included $11 million and $8 million of non-recurring items, respectively.

Operations

During the second quarter, the Company filed for bankruptcy, at which time all operations were suspended, except for workover operations. This suspension of operations clearly resulted in a steep decline in production over the past two quarters. During the third quarter of 2020, total production averaged 93.9 thousand barrels of oil equivalent per day (“MBOE/d”), of which 60% was crude oil, a decrease of 5% from the second quarter of 2020. Production for the same period of 2019 was 123 MBOE/d.

During the third quarter the Company turned seven wells to production in the Williston Basin. In the fourth quarter of 2020, Whiting expects to turn five additional wells to production as well as commence completion operations on another five wells at year end that will impact 2021 production. The Company expects capital expenditures of $27 million during the fourth quarter, bringing full year capital expenditures to the midpoint of guidance. Due to the timing of wells put on production during the third and fourth quarters, combined with completion work being done near the end of the year, we anticipate fourth quarter production will decline from the third quarter.

LOE declined to $51 million in the Combined Current Quarter from $53 million in the second quarter of 2020. This 4% decrease is primarily due to the company’s focus on saltwater disposal optimization, lower non-op spending and improved rental agreements. This also marked a 40% decrease from the same period in 2019. Whiting continues to focus on costs to improve margins during the current price environment.

Whiting has consistently outperformed the NDIC requirement for gas capture since the regulatory requirement began. In September, Whiting captured 96% of its gas and continues to explore new technologies to reduce overall emissions.

Outlook for Full-Year 2020

The following table provides guidance for the full-year 2020 based on current forecasts.


Full-Year Guidance


2020

Production (MBOE/d)


98 - 99

Percent Oil


60%

Capital Expenditures (MM)


$ 213 - $ 218

Lease operating expense (MM)


$ 238 - $ 242

Management Comment

Lynn A. Peterson, President and CEO of WLL commented, "The past quarter saw the Company complete its restructuring work and emerge from bankruptcy in September. The Whiting team remained extremely focused during the process and I commend all of our staff for their efforts.”

Peterson added, “We are in a challenging and volatile commodity price environment and we will continue to prioritize cash flow generation. As we look ahead at consensus commodity prices in 2021, our goals will be 1) to maintain production levels near our 2020 exit rate, and 2) operate within internally generated cash flow, which in combination should produce an attractive free cash flow yield. We anticipate holding 2021 spending levels in the same range as our 2020 capital expenditures to achieve these goals. We believe this strategy will create value for the Company's stakeholders while always operating in a safe environment."

Conference Call

WLL will host a conference call on Friday, November 6, 2020 at 11:00 a.m. Eastern time (9:00 a.m. Mountain time) to discuss the results. The call will be conducted by President and CEO Lynn A. Peterson, CFO James Henderson, COO Charles J. Rimer and IR Manager Brandon Day. A Q&A session will immediately follow the discussion of the results for the quarter.

To participate in this call please dial:
Domestic Dial-in Number: (877) 328-5506
International Dial-in Number: (412) 317-5422
Webcast URL: https://dpregister.com/sreg/10149456/dc153f7610

Replay Information:
Conference ID #: 10149456
Replay Dial-In (Toll Free US & Canada): (877) 344-7529 (U.S.), (855) 669-9658 (Canada)
Replay Dial-In (International): (412) 317-0088
Expiration Date: Friday, November 13, 2020

Selected Operating and Financial Statistics


Successor


Predecessor


Non-GAAP


Predecessor


Month Ended
September
30, 2020


Eight Months
Ended August
31, 2020


Combined
Nine Months
Ended
September 30,
2020


Nine Months
Ended
September 30,
2019

Selected operating statistics:


Production


Oil (MBbl)


1,746


15,273


17,020


22,435


NGLs (MBbl)


559


4,522


5,081


5,709


Natural gas (MMcf)


3,631


29,667


33,299


38,167


Total production (MBOE)


2,910


24,740


27,650


34,506


Average prices


Oil (per Bbl):


Price received


$

34.58


$

28.86


$

29.45


$

50.51


Effect of crude oil hedging (1)


0.28


3.00


2.72


0.66


Realized price (3)


$

34.86


$

31.86


$

32.17


$

51.17


Weighted average NYMEX price (per Bbl) (4)


$

39.63


$

38.23


$

38.37


$

56.99


NGLs (per Bbl):


Realized price


$

3.19


$

4.45


$

4.31


$

6.09


Natural gas (per Mcf):


Price received


$

(0.30

)


$

(0.06

)


$

(0.09

)


$

0.62


Effect of natural gas hedging (2)


0.15


(0.01

)


0.01


-


Realized price


$

(0.15

)


$

(0.07

)


$

(0.08

)


$

0.62


Weighted average NYMEX price (per MMBtu) (4)


$

2.24


$

1.76


$

1.81


$

2.62


Selected operating metrics


Sales price, net of hedging ($ per BOE)


$

21.34


$

20.39


$

20.49


$

34.96


Lease operating ($ per BOE)


6.37


6.40


6.39


7.43


Transportation, gathering, compression and other ($ per BOE)


0.68


0.90


0.88


0.93


Depreciation, depletion and amortization ($ per BOE)


6.91


13.69


12.98


17.74


General and administrative ($ per BOE)


3.55


3.71


3.69


2.82


Production and ad valorem taxes (% of sales revenue)


10

%


9

%


9

%


9

%

_________________________________

(1)

Whiting received $46 million and $15 million in pre-tax cash settlements on crude oil hedges during the nine months ended September 30, 2020 and 2019, respectively. A summary of Whiting’s outstanding hedges is included in “Commodity Price Hedging” earlier in this release.

(2)

Whiting received $0.3 million in pre-tax cash settlements on natural gas hedges during the nine months ended September 30, 2020. A summary of Whiting’s outstanding hedges is included in “Commodity Price Hedging” earlier in this release.

(3)

Whiting’s realized prices were reduced by $1.42 and $2.05 per Bbl during the nine months ended September 30, 2020 and 2019, respectively, due to the Redtail deficiency payments. This contract ended in April 2020.

(4)

Average NYMEX prices weighted for monthly production volumes.


Successor


Predecessor


Non-GAAP


Predecessor


Month
Ended
September
30, 2020


Two Months
Ended August
31, 2020


Combined
Three Months
Ended
September 30,
2020


Three Months
Ended
September 30,
2019

Selected financial data:


(In thousands, except per share data)


Total operating revenues


$

61,084


$

122,558


$

183,642


$

375,891


Total operating expenses


30,877


188,471


219,348


351,253


Total other (income) expense, net


2,122


(247,992

)


(245,870

)


43,705


Net income (loss)


40,270


237,425


277,695


(19,067

)

Per basic share (1)


1.06


2.60


7.30


(0.21

)

Per diluted share (1)


1.06


2.60


7.30


(0.21

)

Adjusted net income (loss) (2)


8,250


(21,130

)


(12,880

)


(35,148

)

Per basic share (1)


0.22


(0.23

)


(0.34

)


(0.38

)

Per diluted share (1)


0.22


(0.23

)


(0.34

)


(0.38

)

Adjusted EBITDAX (2)


34,689


64,838


99,527


235,663


_________________________________

(1)

For the combined three months ended September 30, 2020, the Company used the Successor’s basic and diluted weighted average share count to calculate per share amounts.

(2)

Reconciliations of net income (loss) to adjusted net income (loss) and adjusted EBITDAX are included later in this news release.


Successor


Predecessor


Non-GAAP


Predecessor


Month
Ended
September
30, 2020


Eight Months
Ended August
31, 2020


Combined
Nine Months
Ended
September 30,
2020


Nine Months
Ended
September 30,
2019

Selected financial data:


(In thousands, except per share data)


Total operating revenues


$

61,084


$

459,004


$

520,088


$

1,191,644


Total operating expenses


30,877


4,651,298


4,682,175


1,147,122


Total other (income) expense, net


2,122


(170,459

)


(168,337

)


139,574


Net income (loss)


40,270


(3,965,461

)


(3,925,191

)


(93,679

)

Per basic share (1)


1.06


(43.37

)


(103.16

)


(1.03

)

Per diluted share (1)


1.06


(43.37

)


(103.16

)


(1.03

)

Adjusted net income (loss) (2)


8,250


(209,656

)


(201,406

)


(57,821

)

Per basic share (1)


0.22


(2.29

)


(5.29

)


(0.63

)

Per diluted share (1)


0.22


(2.29

)


(5.29

)


(0.63

)

Adjusted EBITDAX (2)


34,689


227,580


262,269


738,176


_________________________________

(1)

For the combined nine months ended September 30, 2020, the Company used the Successor’s basic and diluted weighted average share count to calculate per share amounts.

(2)

Reconciliations of net income (loss) to adjusted net income (loss) and adjusted EBITDAX are included later in this news release.

Third Quarter and First Nine Month 2020 Costs and Margins

A summary of cash revenues and cash costs on a per BOE basis is as follows:


Successor


Predecessor


Non-GAAP


Predecessor


Month Ended
September
30, 2020


Two Months
Ended
August 31,
2020


Combined
Three Months Ended

September 30,
2020


Three Months
Ended
September 30,
2019

Sales price, net of hedging


$

20.99


$

21.39


$

21.26


$

34.01

Gain (loss) on hedging activities


0.35


(0.13

)


0.03


-

Lease operating expense


6.37


5.70


5.92


7.51

Transportation, gathering, compression and other


0.68


0.74


0.72


0.98

Production and ad valorem tax


2.03


1.81


1.88


3.10

Cash general & administrative


3.55


2.74


3.02


2.94

Exploration


1.45


0.47


0.80


0.73

Cash interest expense


0.60


1.33


1.09


3.56

Cash income tax expense


0.80


-


0.27


-

Cash reorganization items


-


5.32


3.53


-


$

5.86


$

3.15


$

4.06


$

15.19


Successor


Predecessor


Non-GAAP


Predecessor


Month Ended
September
30, 2020


Eight Months
Ended
August 31,
2020


Combined
Nine Months
Ended September 30,
2020


Nine Months
Ended
September 30,
2019

Sales price, net of hedging


$

20.99


$

18.55


$

18.81


$

34.96

Gain (loss) on hedging activities


0.35


1.84


1.68


-

Lease operating expense


6.37


6.40


6.39


7.43

Transportation, gathering, compression and other


0.68


0.90


0.88


0.93

Production and ad valorem tax


2.03


1.67


1.70


2.98

Cash general & administrative


3.55


3.56


3.56


2.68

Exploration


1.45


0.93


0.98


0.82

Cash interest expense


0.60


2.41


2.22


3.52

Cash income tax expense


0.80


0.11


0.18


-

Cash reorganization items


-


2.31


2.07


-


$

5.86


$

2.10


$

2.51


$

16.60

Selected Financial Data

For further information and discussion on the selected financial data below, please refer to Whiting Petroleum Corporation’s Quarterly Report on Form 10‑Q for the quarter ended September 30, 2020 to be filed with the Securities and Exchange Commission.

WHITING PETROLEUM CORPORATION

CONDENSED CONSOLIDATED BALANCE SHEETS (unaudited)

(in thousands)


Successor


Predecessor


September 30,


December 31,


2020


2019


ASSETS


Current assets:


Cash and cash equivalents


$

13,702


$

8,652


Restricted cash


13,233


-


Accounts receivable trade, net


128,577


308,249


Prepaid expenses and other


22,056


14,082


Total current assets


177,568


330,983


Property and equipment:


Oil and gas properties, successful efforts method


1,829,472


12,812,007


Other property and equipment


72,856


178,689


Total property and equipment


1,902,328


12,990,696


Less accumulated depreciation, depletion and amortization


(19,447

)


(5,735,239

)

Total property and equipment, net


1,882,881


7,255,457


Other long-term assets


38,007


50,281


TOTAL ASSETS


$

2,098,456


$

7,636,721


WHITING PETROLEUM CORPORATION

CONDENSED CONSOLIDATED BALANCE SHEETS (unaudited)

(in thousands)


Successor


Predecessor


September 30,


December 31,


2020


2019


LIABILITIES AND EQUITY


Current liabilities:


Accounts payable trade


$

44,171


$

80,100


Revenues and royalties payable


146,767


202,010


Accrued capital expenditures


14,809


64,263


Accrued liabilities and other


63,987


85,007


Accrued lease operating expenses


23,757


38,262


Accrued interest


1,432


53,928


Taxes payable


16,985


26,844


Total current liabilities


311,908


550,414


Long-term debt


400,328


2,799,885


Asset retirement obligations


119,262


131,208


Operating lease obligations


17,749


31,722


Deferred income taxes


-


73,593


Other long-term liabilities


19,723


24,928


Total liabilities


868,970


3,611,750


Commitments and contingencies


Equity:


Predecessor common stock, $0.001 par value, 225,000,000 shares authorized; 91,743,571 issued and 91,326,469 outstanding as of December 31, 2019


-


92


Successor common stock, $0.001 par value, 500,000,000 shares authorized; 38,051,210 issued and outstanding as of September 30, 2020


38


-


Additional paid-in capital


1,189,178


6,409,991


Accumulated earnings (deficit)


40,270


(2,385,112

)

Total equity


1,229,486


4,024,971


TOTAL LIABILITIES AND EQUITY


$

2,098,456


$

7,636,721


WHITING PETROLEUM CORPORATION

CONDENSED CONSOLIDATED STATEMENTS OF OPERATIONS (unaudited)

(in thousands, except per share data)


Successor


Predecessor


Non-GAAP


Predecessor


Month
Ended
September 30,
2020


Two Months
Ended
August 31,
2020


Combined
Three Months
Ended
September 30,
2020


Three Months
Ended
September 30,
2019

OPERATING REVENUES


Oil, NGL and natural gas sales


$

61,084


$

122,558


$

183,642


$

375,891


OPERATING EXPENSES


Lease operating expenses


18,526


32,646


51,172


85,320


Transportation, gathering, compression and other


1,980


4,259


6,239


11,176


Production and ad valorem taxes


5,908


10,362


16,270


35,220


Depreciation, depletion and amortization


20,110


71,240


91,350


211,025


Exploration and impairment


4,207


10,217


14,424


10,890


General and administrative


10,345


16,513


26,858


29,890


Derivative (gain) loss, net


(30,594

)


43,125


12,531


(30,597

)

Loss on sale of properties


395


1,280


1,675


595


Amortization of deferred gain on sale


-


(1,171

)


(1,171

)


(2,266

)

Total operating expenses


30,877


188,471


219,348


351,253


INCOME FROM OPERATIONS


30,207


(65,913

)


(35,706

)


24,638


OTHER INCOME (EXPENSE)


Interest expense


(2,128

)


(11,379

)


(13,507

)


(48,447

)

Gain (loss) on extinguishment of debt


-


-


-


4,598


Interest income and other


6


139


145


144


Reorganization items


-


259,232


259,232


-


Total other income (expense)


(2,122

)


247,992


245,870


(43,705

)

INCOME (LOSS) BEFORE INCOME TAXES


28,085


182,079


210,164


(19,067

)

INCOME TAX EXPENSE (BENEFIT)


Current


2,316


-


2,316


-


Deferred


(14,501

)


(55,346

)


(69,847

)


-


Total income tax benefit


(12,185

)


(55,346

)


(67,531

)


-


NET INCOME (LOSS)


$

40,270


$

237,425


$

277,695


$

(19,067

)

INCOME (LOSS) PER COMMON SHARE


Basic


$

1.06


$

2.60


$

7.30


$

(0.21

)

Diluted


$

1.06


$

2.60


$

7.30


$

(0.21

)

WEIGHTED AVERAGE SHARES OUTSTANDING


Basic


38,051


91,464


38,051


91,299


Diluted


38,051


91,464


38,051


91,299


WHITING PETROLEUM CORPORATION

CONDENSED CONSOLIDATED STATEMENTS OF OPERATIONS (unaudited)

(in thousands, except per share data)


Successor


Predecessor


Non-GAAP


Predecessor


Month
Ended
September 30,
2020


Eight Months
Ended
August 31,
2020


Combined
Nine Months
Ended
September 30,
2020


Nine Months
Ended
September 30,
2019

OPERATING REVENUES


Oil, NGL and natural gas sales


$

61,084


$

459,004


$

520,088


$

1,191,644


OPERATING EXPENSES


Lease operating expenses


18,526


158,228


176,754


256,384


Transportation, gathering, compression and other


1,980


22,266


24,246


32,145


Production and ad valorem taxes


5,908


41,204


47,112


102,796


Depreciation, depletion and amortization


20,110


338,757


358,867


612,166


Exploration and impairment


4,207


4,184,830


4,189,037


44,045


General and administrative


10,345


91,816


102,161


97,437


Derivative (gain) loss, net


(30,594

)


(181,614

)


(212,208

)


7,431


Loss on sale of properties


395


927


1,322


1,681


Amortization of deferred gain on sale


-


(5,116

)


(5,116

)


(6,963

)

Total operating expenses


30,877


4,651,298


4,682,175


1,147,122


INCOME FROM OPERATIONS


30,207


(4,192,294

)


(4,162,087

)


44,522


OTHER INCOME (EXPENSE)


Interest expense


(2,128

)


(73,054

)


(75,182

)


(145,274

)

Gain (loss) on extinguishment of debt


-


25,883


25,883


4,598


Interest income and other


6


211


217


1,102


Reorganization items


-


217,419


217,419


-


Total other income (expense)


(2,122

)


170,459


168,337


(139,574

)

INCOME (LOSS) BEFORE INCOME TAXES


28,085


(4,021,835

)


(3,993,750

)


(95,052

)

INCOME TAX EXPENSE (BENEFIT)


Current


2,316


2,718


5,034


-


Deferred


(14,501

)


(59,092

)


(73,593

)


(1,373

)

Total income tax benefit


(12,185

)


(56,374

)


(68,559

)


(1,373

)

NET INCOME (LOSS)


$

40,270


$

(3,965,461

)


$

(3,925,191

)


$

(93,679

)

INCOME (LOSS) PER COMMON SHARE


Basic


$

1.06


$

(43.37

)


$

(103.16

)


$

(1.03

)

Diluted


$

1.06


$

(43.37

)


$

(103.16

)


$

(1.03

)

WEIGHTED AVERAGE SHARES OUTSTANDING


Basic


38,051


91,423


38,051


91,274


Diluted


38,051


91,423


38,051


91,274


Contacts

Company Contact: Brandon Day
Title: Investor Relations Manager
Phone: 303‑837‑1661
Email: This email address is being protected from spambots. You need JavaScript enabled to view it.


Read full story here

LONDON--(BUSINESS WIRE)--#GasEngineMarket--Technavio has been monitoring the global gas engine market size, operating under the consumer discretionary industry. The latest report on gas engine market, 2020-2024 estimates it to register an incremental growth of by USD 1.85 billion, almost at a CAGR of 7% during the forecast period. The report offers an up-to-date analysis regarding the current market scenario, latest trends and drivers, and the overall market environment.


Technavio’s in-depth research has all your needs covered as our research reports include all foreseeable market scenarios, including pre- & post-COVID-19 analysis. Download Latest Free Sample Report on COVID-19 Analysis

The market is fragmented, and the degree of fragmentation will accelerate during the forecast period. Competitors have to focus on differentiating their product offerings with unique value propositions to strengthen their foothold in the market. Market vendors also have to leverage on the existing growth prospects in the fast-growing segments, while maintaining their positions in the slow-growing segments. Caterpillar Inc., Cummins Inc., Doosan Infracore Co. Ltd., Hyundai Heavy Industries Co. Ltd., INNIO Jenbacher GmbH & Co. OG, Kawasaki Heavy Industries Ltd., MAN SE, Mitsubishi Heavy Industries Ltd., Rolls-Royce Plc, and Siemens AG are among some of the major market participants.

Buy 1 Technavio report and get the second for 50% off. Buy 2 Technavio reports and get the third for free.

View market snapshot before purchasing

Expanding gas generator market has been instrumental in driving the growth of the market. However, the irregularities in natural gas reserves and supplies might hamper the market growth.

Technavio's custom research reports offer detailed insights on the impact of COVID-19 at an industry level, a regional level, and subsequent supply chain operations. This customized report will also help clients keep up with new product launches in direct & indirect COVID-19 related markets, upcoming vaccines and pipeline analysis, and significant developments in vendor operations and government regulations. Download a Free Sample Report on COVID-19 Impacts

Gas Engine Market 2020-2024: Segmentation

Gas Engine Market is segmented as below:

Based on geographic segmentation, over 44% of the market growth originated from Europe during the forecast period. In addition, the power segment led the growth under the end-user segments. This report provides an accurate prediction of the contribution of all the segments to the growth of the market size.

  • End-user
    • Power
    • Industrial
    • Residential
    • Commercial
  • Material
    • Titanium Dental Implants
    • Zirconium Dental Implants
  • Geographic Landscape
    • Europe
    • North America
    • APAC
    • South America

Gas Engine Market 2020-2024: Scope

Technavio presents a detailed picture of the market by the way of study, synthesis, and summation of data from multiple sources. The gas engine market report covers the following areas:

  • Gas Engine Market Size
  • Gas Engine Market Trends
  • Gas Engine Market Industry Analysis

This study identifies the development of nano coating as one of the prime reasons driving the Gas Engine Market growth during the next few years.

Technavio suggests three forecast scenarios (optimistic, probable, and pessimistic) considering the impact of COVID-19. Technavio’s in-depth research has direct and indirect COVID-19 impacted market research reports.

Register for a free trial today and gain instant access to 17,000+ market research reports.

Technavio's SUBSCRIPTION platform

Gas Engine Market 2020-2024: Key Highlights

  • CAGR of the market during the forecast period 2020-2024
  • Detailed information on factors that will assist gas engine market growth during the next five years
  • Estimation of the gas engine market size and its contribution to the parent market
  • Predictions on upcoming trends and changes in consumer behavior
  • The growth of the gas engine market
  • Analysis of the market’s competitive landscape and detailed information on vendors
  • Comprehensive details of factors that will challenge the growth of gas engine market, vendors

Table of Contents:

Executive Summary

Market Landscape

  • Market ecosystem
  • Value chain analysis

Market Sizing

  • Market definition
  • Market segment analysis
  • Market size 2019
  • Market outlook: Forecast for 2019 - 2024

Five Forces Analysis

  • Five Forces Summary
  • Bargaining power of buyers
  • Bargaining power of suppliers
  • Threat of new entrants
  • Threat of substitutes
  • Threat of rivalry
  • Market condition

Market Segmentation by End-user

  • Market segments
  • Comparison by End user
  • Power - Market size and forecast 2019-2024
  • Industrial - Market size and forecast 2019-2024
  • Residential - Market size and forecast 2019-2024
  • Commercial - Market size and forecast 2019-2024
  • Market opportunity by End user

Customer landscape

  • Customer landscape

Geographic Landscape

  • Geographic segmentation
  • Geographic comparison
  • Europe - Market size and forecast 2019-2024
  • North America - Market size and forecast 2019-2024
  • APAC - Market size and forecast 2019-2024
  • South America - Market size and forecast 2019-2024
  • MEA - Market size and forecast 2019-2024
  • Key leading countries
  • Market opportunity by geography
  • Volume driver - Demand led growth
  • Volume driver - External factors
  • Market challenges
  • Market trends

Vendor Landscape

  • Vendor landscape
  • Landscape disruption

Vendor Analysis

  • Vendors covered
  • Market positioning of vendors
  • Caterpillar Inc.
  • Cummins Inc.
  • Doosan Infracore Co. Ltd.
  • Hyundai Heavy Industries Co. Ltd.
  • INNIO Jenbacher GmbH & Co. OG
  • Kawasaki Heavy Industries Ltd.
  • MAN SE
  • Mitsubishi Heavy Industries Ltd.
  • Rolls-Royce Plc
  • Siemens AG

Appendix

  • Scope of the report
  • Currency conversion rates for US$
  • Research methodology
  • List of abbreviations

About Us

Technavio is a leading global technology research and advisory company. Their research and analysis focus on emerging market trends and provides actionable insights to help businesses identify market opportunities and develop effective strategies to optimize their market positions. With over 500 specialized analysts, Technavio’s report library consists of more than 17,000 reports and counting, covering 800 technologies, spanning across 50 countries. Their client base consists of enterprises of all sizes, including more than 100 Fortune 500 companies. This growing client base relies on Technavio’s comprehensive coverage, extensive research, and actionable market insights to identify opportunities in existing and potential markets and assess their competitive positions within changing market scenarios.


Contacts

Technavio Research
Jesse Maida
Media & Marketing Executive
US: +1 844 364 1100
UK: +44 203 893 3200
Email: This email address is being protected from spambots. You need JavaScript enabled to view it.
Website: www.technavio.com/

HOUSTON--(BUSINESS WIRE)--Magnolia Oil & Gas Corporation (“Magnolia,” “we,” “our,” or the “Company”) (NYSE: MGY) today announced its financial and operational results for the third quarter of 2020.


Third Quarter 2020 Highlights:

  • Magnolia reported third quarter 2020 net income attributable to Class A Common Stock of $9.1 million, or $0.05 per share. Third quarter 2020 total net income was $13.7 million and adjusted net income was $15.6 million, or $0.06 per share.
  • Third quarter 2020 production averaged 54.3 thousand barrels of oil equivalent per day (“Mboe/d”). As expected, Magnolia did not complete any operated wells during the third quarter. Quarterly volumes were negatively impacted by 2 Mboe/d due to the delays of non-operated wells in Karnes until the fourth quarter and some unplanned downtime at a Karnes processing facility.
  • Adjusted EBITDAX during the third quarter of 2020 was $76.4 million. Drilling and completion costs (“D&C”) for the quarter were $27.4 million or just 36% of adjusted EBITDAX, and better than our earlier guidance. We continue to target D&C spending during 2020 of approximately 60 percent of adjusted EBITDAX, and inline with our strategy and business plan.
  • We began completing wells in Giddings at the end of the third quarter with several wells coming online during October. Progress continues in reducing our well costs in Giddings, with current total well costs averaging $6.5 million (including costs for drilling, completion, and facilities), representing a 45 percent improvement in total costs per lateral foot compared to 2019 levels.
  • We purchased 1.2 million shares of Class A Common Stock for $7 million during the third quarter as part of our active share repurchase program. Year-to-date, we have repurchased 2.2 million shares and currently have 6.8 million shares remaining under our current authorization.(1)
  • Magnolia ended the quarter with approximately $148.5 million of cash on its balance sheet and remains undrawn on its recently reaffirmed $450.0 million revolving credit facility. The Company has no debt maturities until 2026 and has no plans to increase its debt levels.

(1)

Includes 0.1 million shares of Class A Common Stock repurchased for $0.5 million in September with settlement dates in October.

Magnolia is in a strong position with an attractive, high-margin asset base and a business model that generates consistent free cash flow with low levels of debt,” said Magnolia Chairman, President, and CEO, Steve Chazen. “We generated $46 million of free cash flow after capital outlays during the quarter, ending the period with $149 million of cash and after allocating $10 million toward buying back our stock and for a small bolt-on acquisition. This general framework of organic investment in our business and small bolt-on acquisitions that generate moderate growth, while returning excess cash to shareholders, is expected to continue into next year.

As we had previously indicated, the third quarter marked a trough period for the Company’s production as we had not completed any wells since February. Production volumes are expected to rebound in the fourth quarter by 7 to 10 percent, particularly in Giddings, where we started bringing on new well completions last month. While still early, we remain very optimistic on Giddings as the results of the initial batch of wells brought on last month are better than the average of the 14 wells we drilled in this area and laid out last quarter. Our initial core area of development in Giddings continues to outperform our expectations providing us with longer term confidence in this opportunity.”

Operational Update

Third quarter total company production averaged 54.3 Mboe/d, with oil production representing half of our total volumes. Production from Karnes and Giddings and other averaged 33.9 Mboe/d and 20.4 Mboe/d, respectively, during the third quarter 2020. As per our scheduled plan, Magnolia did not complete or turn on any operated wells during the third quarter. The delay of several non-operated wells in Karnes, previously expected to come online in the third quarter, negatively impacted our production during the period, and these wells have since come online in the fourth quarter.

Magnolia is currently operating one rig in Giddings that continues to drill multi-well pads in our initial core developmental area. We ended the third quarter with 8 drilled but uncompleted wells in Giddings which are expected to be brought online during the fourth quarter. The first 3-well pad was brought online in mid-October and early results indicate that the performance of these wells exceeds the average of the wells that we have drilled thus far within the initial 70,000-acre core area. We are not planning any operated activity in Karnes during the fourth quarter.

Our total cost per well at Giddings continues to improve with recent well costs averaging $6.5 million. Drilling times are continuing to set new company records providing further confidence that well costs should experience additional declines. Drilling costs per lateral foot have declined nearly 55 percent and completion costs per lateral foot have decreased 50 percent compared to 2019 levels. These operational efficiencies have resulted in a 45 percent improvement in the total costs per lateral foot (including costs for drilling and completion, and facilities). Magnolia anticipates well costs in Giddings to decline toward $6 million per well in our development area driven by continued efficiencies.

Guidance

Our total capital spending for drilling, completions, and facilities is expected to be approximately 55 percent of our adjusted EBITDAX in the fourth quarter. Fourth quarter production is expected to increase 7 to 10 percent sequentially. The increase in our overall volumes is expected to be driven by several multi-well pads in Giddings to be turned in line throughout the current quarter in addition to several non-operated wells in Karnes. Overall, we continue to run one operated rig in Giddings where our development drilling program is expected to continue through the fourth quarter.

Oil price differentials are anticipated to be a roughly $3 per barrel discount to Magellan East Houston (“MEH”) during the fourth quarter, which is in line with historical levels. During the third quarter, Magnolia hedged 50,000 million British thermal units (“MMbtu”) per day of natural gas production (just under half our total natural gas production) using costless collars with a weighted average floor price of $2.31 per MMbtu and a weighted average ceiling price of $3.00 per MMbtu, from September 2020 through August of 2021.

Looking into 2021, we plan to invest approximately 60 percent of our adjusted EBITDAX on drilling and completing wells consistent with the capital discipline that has supported our business model since our inception. At current product prices, Magnolia plans to operate one rig focused on pad drilling in the Giddings initial core area. Based on current drill times in Giddings, we estimate a one rig drilling program is on pace to drill approximately 20 wells per year.

Quarterly Report on Form 10-Q

Magnolia's financial statements and related footnotes will be available in its Quarterly Report on Form 10-Q for the three and nine months ended September 30, 2020, which is expected to be filed with the U.S. Securities and Exchange Commission (“SEC”) on November 6, 2020.

Conference Call and Webcast

Magnolia will host an investor conference call on Friday, November 6, 2020 at 10:00 a.m. Central (11:00 a.m. Eastern) to discuss these operating and financial results. Interested parties may join the webcast by visiting Magnolia's website at www.magnoliaoilgas.com/investors/events-and-presentations and clicking on the webcast link or by dialing 1-844-701-1059. A replay of the webcast will be posted on Magnolia's website following completion of the call.

About Magnolia Oil & Gas Corporation

Magnolia (MGY) is a publicly traded oil and gas exploration and production company with operations primarily in South Texas in the core of the Eagle Ford Shale and Austin Chalk formations. Magnolia focuses on generating value for shareholders through steady production growth, strong pre-tax margins, and free cash flow. For more information, visit www.magnoliaoilgas.com.

Cautionary Note Regarding Forward-Looking Statements

The information in this press release includes forward-looking statements within the meaning of Section 27A of the Securities Act of 1933, as amended, and Section 21E of the Securities Exchange Act of 1934, as amended. All statements, other than statements of present or historical fact included in this press release, regarding Magnolia’s strategy, future operations, financial position, estimated revenues, and losses, projected costs, prospects, plans and objectives of management are forward looking statements. When used in this press release, the words could, should, will, may, believe, anticipate, intend, estimate, expect, project, the negative of such terms and other similar expressions are intended to identify forward-looking statements, although not all forward-looking statements contain such identifying words. These forward-looking statements are based on management’s current expectations and assumptions about future events and are based on currently available information as to the outcome and timing of future events. Except as otherwise required by applicable law, Magnolia disclaims any duty to update any forward-looking statements, all of which are expressly qualified by the statements in this section, to reflect events or circumstances after the date of this press release. Magnolia cautions you that these forward-looking statements are subject to all of the risks and uncertainties, most of which are difficult to predict and many of which are beyond the control of Magnolia, incident to the development, production, gathering and sale of oil, natural gas and natural gas liquids. In addition, Magnolia cautions you that the forward looking statements contained in this press release are subject to the following factors: (i) the length, scope and severity of the ongoing coronavirus disease 2019 (“COVID-19”) pandemic, including the effects of related public health concerns and the impact of continued actions taken by governmental authorities and other third parties in response to the pandemic and its impact on commodity prices, supply and demand considerations, and storage capacity; (ii) the outcome of any legal proceedings that may be instituted against Magnolia; (iii) Magnolia’s ability to realize the anticipated benefits of its acquisitions, which may be affected by, among other things, competition and the ability of Magnolia to grow and manage growth profitably; (iv) changes in applicable laws or regulations; and (v) the possibility that Magnolia may be adversely affected by other economic, business, and/or competitive factors. Should one or more of the risks or uncertainties described in this press release occur, or should underlying assumptions prove incorrect, actual results and plans could differ materially from those expressed in any forward-looking statements. Additional information concerning these and other factors that may impact the operations and projections discussed herein can be found in Magnolia’s filings with the SEC, including its Annual Report on Form 10-K for the fiscal year ended December 31, 2019. Magnolia’s SEC filings are available publicly on the SEC’s website at www.sec.gov.

Magnolia Oil & Gas Corporation

Operating Highlights


For the Three Months Ended


For the Nine Months Ended


September 30, 2020


September 30, 2019


September 30, 2020


September 30, 2019

Production:


Oil (MBbls)


2,485


3,520


8,965


9,615


Natural gas (MMcf)


9,444


10,763


29,261


30,583


Natural gas liquids (MBbls)


937


1,245


3,213


3,389


Total (Mboe)


4,996


6,559


17,055


18,101


Average daily production:


Oil (Bbls/d)


27,016


38,261


32,718


35,220


Natural gas (Mcf/d)


102,653


116,989


106,790


112,026


Natural gas liquids (Bbls/d)


10,181


13,533


11,725


12,414


Total (boe/d)


54,306


71,292


62,241


66,305


Revenues (in thousands):


Oil revenues


$

95,677


$

207,840


$

311,153


$

584,009


Natural gas revenues


14,895


21,243


44,238


71,208


Natural gas liquids revenues


10,495


15,716


29,880


51,215


Total Revenues


$

121,067


$

244,799


$

385,271


$

706,432


Average sales price:


Oil (per Bbl)


$

38.50


$

59.05


$

34.71


$

60.74


Natural gas (per Mcf)


1.58


1.97


1.51


2.33


Natural gas liquids (per Bbl)


11.20


12.62


9.30


15.11


Total (per boe)


$

24.23


$

37.32


$

22.59


$

39.03


NYMEX WTI ($/Bbl)


$

40.94


$

56.45


$

38.30


$

57.06


NYMEX Henry Hub ($/Mcf)


$

1.97


$

2.23


$

1.88


$

2.67


Realization to benchmark:


Oil (per Bbl)


94

%


105

%


91

%


106

%

Natural Gas (per Mcf)


80

%


88

%


80

%


87

%


Operating expenses (in thousands):


Lease operating expenses


$

18,802


$

24,344


$

61,275


$

70,752


Gathering, transportation and processing


5,771


9,270


20,579


26,016


Taxes other than income


7,331


13,333


22,874


40,825


Depreciation, depletion and amortization


44,731


143,894


238,273


385,942


Operating costs per boe:


Lease operating expenses


$

3.76


$

3.71


$

3.59


$

3.91


Gathering, transportation and processing


1.16


1.41


1.21


1.44


Taxes other than income


1.47


2.03


1.34


2.26


Depreciation, depletion and amortization


8.95


21.94


13.97


21.32


Magnolia Oil & Gas Corporation

Consolidated Statements of Operations

(In thousands, except per share data)


For the Three Months Ended


For the Nine Months Ended


September 30, 2020


September 30, 2019


September 30, 2020


September 30, 2019

REVENUES


Oil revenues


$

95,677


$

207,840


$

311,153


$

584,009


Natural gas revenues


14,895


21,243


44,238


71,208


Natural gas liquids revenues


10,495


15,716


29,880


51,215


Total revenues


121,067


244,799


385,271


706,432


OPERATING EXPENSES


Lease operating expenses


18,802


24,344


61,275


70,752


Gathering, transportation and processing


5,771


9,270


20,579


26,016


Taxes other than income


7,331


13,333


22,874


40,825


Exploration expense


701


3,924


563,589


10,017


Impairment of oil and natural gas properties


1,381,258


Asset retirement obligation accretion


1,501


1,394


4,403


4,095


Depreciation, depletion and amortization


44,731


143,894


238,273


385,942


Amortization of intangible assets


3,626


3,626


10,879


10,879


General & administrative expenses


16,663


17,345


50,472


52,651


Transaction related costs


438


Total operating costs and expenses


99,126


217,130


2,353,602


601,615


OPERATING INCOME (LOSS)


21,941


27,669


(1,968,331

)


104,817


OTHER INCOME (EXPENSE)


Income from equity method investee


1,007


92


2,059


608


Interest expense, net


(7,333

)


(6,896

)


(21,345

)


(21,611

)

Loss on derivatives, net


(2,208

)


(2,208

)


Other expense, net


(51

)


21


(510

)


8


Total other income (expense)


(8,585

)


(6,783

)


(22,004

)


(20,995

)


INCOME (LOSS) BEFORE INCOME TAXES


13,356


20,886


(1,990,335

)


83,822


Income tax expense (benefit)


(339

)


3,529


(79,340

)


12,449


NET INCOME (LOSS)


13,695


17,357


(1,910,995

)


71,373


LESS: Net income (loss) attributable to noncontrolling interest


4,548


6,810


(674,860

)


29,294


NET INCOME ATTRIBUTABLE TO MAGNOLIA


9,147


10,547


(1,236,135

)


42,079


LESS: Non-cash deemed dividend related to warrant exchange


2,763


2,763


NET INCOME (LOSS) ATTRIBUTABLE TO CLASS A COMMON STOCK


$

9,147


$

7,784


$

(1,236,135

)


$

39,316


NET INCOME (LOSS) PER COMMON SHARE


Basic


$

0.05


$

0.05


$

(7.41

)


$

0.25


Diluted


$

0.05


$

0.05


$

(7.41

)


$

0.24


WEIGHTED AVERAGE NUMBER OF COMMON SHARES OUTSTANDING


Basic


166,467


166,872


166,728


160,051


Diluted


170,676


167,108


166,728


161,488


WEIGHTED AVERAGE NUMBER OF CLASS B SHARES OUTSTANDING(1)


85,790


91,790


85,790


92,292


(1)

Shares of Class B Common Stock, and corresponding Magnolia LLC Units, are anti-dilutive in the calculation of weighted average number of common shares outstanding.

Magnolia Oil & Gas Corporation

Summary Cash Flow Data

(In thousands)


For the Three Months Ended


For the Nine Months Ended


September 30, 2020


September 30, 2019


September 30, 2020


September 30, 2019

CASH FLOWS FROM OPERATING ACTIVITIES

NET INCOME (LOSS)


$

13,695


$

17,357


$

(1,910,995

)


$

71,373


Adjustments to reconcile net income (loss) to net cash provided by operating activities:


Depreciation, depletion and amortization


44,731


143,894


238,273


385,942


Amortization of intangible assets


3,626


3,626


10,879


10,879


Exploration expense, non-cash


53


561,629


536


Impairment of oil and natural gas properties


1,381,258


Asset retirement obligation accretion


1,501


1,394


4,403


4,095


Amortization of deferred financing costs


913


892


2,710


2,644


Loss on derivatives, net


2,208


2,208


Deferred tax expense (benefit)


3,414


(77,834

)


11,765


Stock based compensation


2,927


2,829


8,871


8,376


Other


(1,007

)


(88

)


(2,059

)


(512

)

Net change in operating assets and liabilities


(3,438

)


5,849


11,656


(6,487

)

Net cash provided by operating activities


65,156


179,220


230,999


488,611


CASH FLOWS FROM INVESTING ACTIVITIES


Acquisition of EnerVest properties


4,250


Acquisitions, other


(3,920

)


(1,318

)


(73,702

)


(93,221

)

Additions to oil and natural gas properties


(27,674

)


(88,403

)


(157,325

)


(351,467

)

Changes in working capital associated with additions to oil and natural gas properties


5,409


(9,147

)


(18,972

)


(13,392

)

Other investing


(496

)


1


(842

)


(247

)

Net cash used in investing activities


(26,681

)


(98,867

)


(250,841

)


(454,077

)


CASH FLOW FROM FINANCING ACTIVITIES


Contributions from noncontrolling interest owners


7,301


Distributions to noncontrolling interest owners


(104

)


(490

)


(594

)


(716

)

Class A Common Stock repurchases


(6,479

)


(9,722

)


(12,962

)


(9,722

)

Other financing activities


(209

)


(2,361

)


(702

)


(2,666

)

Net cash used in financing activities


(6,792

)


(12,573

)


(14,258

)


(5,803

)


NET CHANGE IN CASH AND CASH EQUIVALENTS


31,683


67,780


(34,100

)


28,731


Cash and cash equivalents – Beginning of period


116,850


96,709


182,633


135,758


Cash and cash equivalents – End of period


$

148,533


$

164,489


$

148,533


$

164,489


Magnolia Oil & Gas Corporation

Summary Balance Sheet Data

(In thousands)


September 30, 2020


December 31, 2019

Cash and cash equivalents


$

148,533


$

182,633


Other current assets


66,329


110,585


Property, plant and equipment, net


1,169,949


3,116,757


Other assets


49,468


56,431


Total assets


$

1,434,279


$

3,466,406


Current liabilities


$

124,462


$

175,208


Long-term debt, net


390,787


389,835


Other long-term liabilities


106,849


172,834


Common stock


26


26


Additional paid in capital


1,709,043


1,703,362


Treasury stock


(23,240

)


(10,277

)

Retained earnings (accumulated deficit)


(1,153,195

)


82,940


Noncontrolling interest


279,547


952,478


Total liabilities and equity


$

1,434,279


$

3,466,406


Magnolia Oil & Gas Corporation

Non-GAAP Financial Measures

Reconciliation of net income to adjusted EBITDAX

In this press release, we refer to adjusted EBITDAX, a supplemental non-GAAP financial measure that is used by management and external users of our consolidated financial statements, such as industry analysts, investors, lenders, and rating agencies. We define adjusted EBITDAX as net income before interest expense, income taxes, depreciation, depletion and amortization, amortization of intangible assets, exploration costs, accretion of asset retirement obligation, non-cash stock based compensation expense, and loss on derivatives, net. Adjusted EBITDAX is not a measure of net income in accordance with GAAP.

Our management believes that adjusted EBITDAX is useful because it allows them to more effectively evaluate our operating performance and compare the results of our operations from period to period and against our peers without regard to our financing methods or capital structure. We also believe that securities analysts, investors, and other interested parties may use adjusted EBITDAX in the evaluation of our Company. We exclude the items listed above from net income in arriving at adjusted EBITDAX because these amounts can vary substantially from company to company within our industry depending upon accounting methods and book values of assets, capital structures and the method by which the assets were acquired. Adjusted EBITDAX should not be considered as an alternative to, or more meaningful than, net income as determined in accordance with GAAP or as an indicator of our operating performance or liquidity. Certain items excluded from adjusted EBITDAX are significant components in understanding and assessing a company’s financial performance, such as a company’s cost of capital and tax structure, as well as the historic costs of depreciable assets, none of which are components of adjusted EBITDAX. Our presentation of adjusted EBITDAX should not be construed as an inference that our results will be unaffected by unusual or non-recurring items. Our computations of adjusted EBITDAX may not be comparable to other similarly titled measures of other companies.

The following table presents a reconciliation of net income to adjusted EBITDAX, our most directly comparable financial measure, calculated and presented in accordance with GAAP:


For the Three Months Ended

(In thousands)


September 30, 2020


September 30, 2019

NET INCOME


$

13,695


$

17,357

Exploration expense


701


3,924

Asset retirement obligation accretion


1,501


1,394

Depreciation, depletion and amortization


44,731


143,894

Amortization of intangible assets


3,626


3,626

Interest expense, net


7,333


6,896

Income tax expense (benefit)


(339

)


3,529

EBITDAX


71,248


180,620

Non-cash stock based compensation expense


2,927


2,829

Loss on derivatives, net(1)


2,208


Adjusted EBITDAX


$

76,383


$

183,449

(1)

There were no cash settlements or realized gains or losses on the Company’s derivative instruments during the three months ended September 30, 2020 and 2019.

Magnolia Oil & Gas Corporation

Non-GAAP Financial Measures

Reconciliation of net income attributable to Class A Common Stock to adjusted earnings

Our presentation of adjusted earnings and adjusted earnings per share are non-GAAP measures because they exclude the effect of certain items included in net income attributable to Class A Common Stock. Management uses adjusted earnings and adjusted earnings per share to evaluate our operating and financial performance because it eliminates the impact of certain items that management does not consider to be representative of the Company’s on-going business operations.


Contacts

Contacts for Magnolia Oil & Gas Corporation
Investors
Brian Corales
(713) 842-9036
This email address is being protected from spambots. You need JavaScript enabled to view it.

Media
Art Pike
(713) 842-9057
This email address is being protected from spambots. You need JavaScript enabled to view it.


Read full story here

NEW YORK--(BUSINESS WIRE)--#exploration--Hess Corporation (NYSE: HES) announced today that John Hess, Chief Executive Officer, will speak at the Bank of America Securities 2020 Global Energy Conference on November 10, 2020 at 10:00 a.m. Eastern Time.


A live audio webcast and a replay of the presentation will be accessible via Hess Corporation’s website

Hess Corporation is a leading global independent energy company engaged in the exploration and production of crude oil and natural gas. More information on Hess Corporation is available at https://www.hess.com/.

Cautionary Statements

This presentation will contain projections and other forward-looking statements within the meaning of Section 27A of the Securities Act of 1933 and Section 21E of the Securities Exchange Act of 1934. These projections and statements reflect the company’s current views with respect to future events and financial performance. No assurances can be given, however, that these events will occur or that these projections will be achieved, and actual results could differ materially from those projected as a result of certain risk factors. A discussion of these risk factors is included in the company’s periodic reports filed with the Securities and Exchange Commission.


Contacts

Investor contact:
Jay Wilson
(212) 536-8940
This email address is being protected from spambots. You need JavaScript enabled to view it.

Media contact:
Lorrie Hecker
(212) 536-8250
This email address is being protected from spambots. You need JavaScript enabled to view it.

NEWPORT BEACH, Calif.--(BUSINESS WIRE)--Clean Energy Fuels Corp. (NASDAQ: CLNE) (“Clean Energy” or the “Company”) today announced its operating results for the third quarter of 2020.

Andrew J. Littlefair, Clean Energy’s President and Chief Executive Officer, stated, “Renewable natural gas continues to be a shining star in our business. It strongly contributed to our operating results in the third quarter while benefitting our customers’ carbon reduction goals. Investment in RNG facilities is robust and Clean Energy plays a critical role in getting this renewable fuel into fuel tanks.”

The Company delivered 97.7 million gallons in the third quarter of 2020, a 5% decrease from 102.7 million in the third quarter of 2019. This decrease was principally from the continuing effects of COVID-19, primarily impacting the airports (fleet services), public transit and government fleet customer markets.

The Company’s revenue for the third quarter of 2020 was $70.9 million, a decrease of 4.8% compared to $74.4 million for the third quarter of 2019. Revenue for the third quarter of 2020 included $5.0 million from U.S. federal excise tax credits for alternative fuels ("AFTC"), which applied to vehicle fuel sales made from July 1, 2020 through September 30, 2020, and an unrealized loss of $0.1 million on commodity swap and customer fueling contracts relating to the Company’s Zero Now truck financing program. Revenue for the third quarter of 2019 included an unrealized gain of $1.1 million on commodity swap and customer fueling contracts relating to the Company’s Zero Now program. Excluding the AFTC revenue in the third quarter of 2020 and the unrealized loss and gain on commodity swap and customer fueling contracts in the third quarter of both 2020 and 2019, respectively, revenue for the third quarter of 2020 decreased by 9.9% to $66.0 million compared to $73.3 million for the third quarter of 2019. This decrease was principally due to lower effective fuel prices resulting from lower natural gas prices and the fuel price mix, which is based on the variation of fuel types and locations where we deliver fuel, and lower volumes. The decrease in revenue from lower effective fuel prices and volumes was partially offset by higher station construction sales which were $8.8 million for the third quarter of 2020 compared to $6.4 million for the third quarter of 2019.

The Company’s revenue for the nine months ended September 30, 2020 was $216.8 million, a decrease of 3.4% compared to $224.5 million for the nine months ended September 30, 2019. Revenue for the nine months ended September 30, 2020 included $14.8 million from AFTC revenue, which applied to vehicle fuel sales made from January 1, 2020 through September 30, 2020, and an unrealized gain of $4.0 million on commodity swap and customer fueling contracts relating to the Company’s Zero Now truck financing program. Revenue for the nine months ended September 30, 2019 included an unrealized loss of $3.3 million on commodity swap and customer fueling contracts relating to the Company’s Zero Now program. Excluding the AFTC revenue in the nine months ended September 30, 2020 and the unrealized gain and loss on commodity swap and customer fueling contracts in both the 2020 and 2019 periods, respectively, revenue for the nine months ended September 30, 2020 decreased by 13.1% to $197.9 million compared to $227.7 million for the nine months ended September 30, 2019. This decrease was principally due to lower effective fuel prices resulting from lower natural gas prices and the fuel price mix, which is based on the variation of fuel types and locations where we deliver fuel, and lower volumes. The decrease in revenue from lower effective fuel prices and volumes was partially offset by higher station construction sales, which were $19.6 million for the nine months ended September 30, 2020 compared to $15.5 million for the nine months ended September 30, 2019.

On a GAAP (as defined below) basis, net loss attributable to Clean Energy for the third quarter of 2020 was $(2.3) million, or $(0.01) per share, compared to $(4.3) million, or $(0.02) per share, for the third quarter of 2019. The third quarter of 2020 was positively affected by AFTC revenue and negatively affected by the unrealized loss on commodity swap and customer fueling contracts, while the comparable 2019 period was positively affected by the unrealized gain on commodity swap and customer fueling contracts.

On a GAAP basis, net loss attributable to Clean Energy for the nine months ended September 30, 2020 was $(7.3) million, or $(0.04) per share, compared to $(20.7) million, or $(0.10) per share, for the nine months ended September 30, 2019. The nine months ended September 30, 2020 was positively affected by AFTC revenue and the unrealized gain on commodity swap and customer fueling contracts, while the comparable 2019 period was negatively affected by the unrealized loss on commodity swap and customer fueling contracts.

Non-GAAP loss per share and Adjusted EBITDA (each as defined below) for the third quarter of 2020 was $(0.01) and $11.0 million, respectively. Non-GAAP loss per share and Adjusted EBITDA for the third quarter of 2019 was $(0.02) and $8.5 million, respectively.

Non-GAAP loss per share and Adjusted EBITDA for the nine months ended September 30, 2020 was $(0.04) and $31.5 million, respectively. Non-GAAP loss per share and Adjusted EBITDA for the nine months ended September 30, 2019 was $(0.06) and $28.6 million, respectively.

Non-GAAP loss per share and Adjusted EBITDA are described below and reconciled to GAAP net loss per share attributable to Clean Energy and GAAP net loss attributable to Clean Energy, respectively.

Non-GAAP Financial Measures

To supplement the Company’s unaudited condensed consolidated financial statements presented in accordance with accounting principles generally accepted in the United States of America (“GAAP”), the Company uses non-GAAP financial measures that it calls non-GAAP income (loss) per share (“non-GAAP income (loss) per share”) and adjusted EBITDA (“Adjusted EBITDA”). Management presents non-GAAP income (loss) per share and Adjusted EBITDA because it believes these measures provide meaningful supplemental information about the Company’s performance, for the following reasons: (1) these measures allow for greater transparency with respect to key metrics used by management to assess the Company’s operating performance and make financial and operational decisions; (2) these measures exclude the effect of items that management believes are not directly attributable to the Company’s core operating performance and may obscure trends in the business; and (3) these measures are used by institutional investors and the analyst community to help analyze the Company’s business. In future quarters, the Company may make adjustments for other expenditures, charges or gains to present non-GAAP financial measures that the Company’s management believes are indicative of the Company’s core operating performance.

Non-GAAP financial measures are limited as an analytical tool and should not be considered in isolation from, or as a substitute for, the Company’s GAAP results. The Company expects to continue reporting non-GAAP financial measures, adjusting for the items described below (and/or other items that may arise in the future as the Company’s management deems appropriate), and the Company expects to continue to incur expenses, charges or gains similar to the non-GAAP adjustments described below. Accordingly, unless expressly stated otherwise, the exclusion of these and other similar items in the presentation of non-GAAP financial measures should not be construed as an inference that these costs are unusual, infrequent or non-recurring. Non-GAAP income (loss) per share and Adjusted EBITDA are not recognized terms under GAAP and do not purport to be an alternative to GAAP income (loss), GAAP income (loss) per share or any other GAAP measure as an indicator of operating performance. Moreover, because not all companies use identical measures and calculations, the Company’s presentation of non-GAAP income (loss) per share and Adjusted EBITDA may not be comparable to other similarly titled measures used by other companies.

Non-GAAP Income (Loss) Per Share

Non-GAAP income (loss) per share, which the Company presents as a non-GAAP measure of its performance, is defined as net income (loss) attributable to Clean Energy Fuels Corp., plus stock-based compensation expense, plus (minus) loss (income) from equity method investments, and plus (minus) any loss (gain) from changes in the fair value of derivative instruments, the total of which is divided by the Company’s weighted-average common shares outstanding on a diluted basis. The Company’s management believes excluding non-cash expenses related to stock-based compensation provides useful information to investors regarding the Company’s performance because of the varying available valuation methodologies, the volatility of the expense (which depends on market forces outside of management’s control), the subjectivity of the assumptions and the variety of award types that a company can use, which may obscure trends in a company’s core operating performance. Similarly, the Company believes excluding the non-cash results from equity method investments is useful to investors because these charges are not part of or representative of the core operations of the Company. In addition, the Company’s management believes excluding the non-cash loss (gain) from changes in the fair value of derivative instruments is useful to investors because the valuation of the derivative instruments is based on a number of subjective assumptions, the amount of the loss or gain is derived from market forces outside of management’s control, and the exclusion of these amounts enables investors to compare the Company’s performance with other companies that do not use, or use different forms of, derivative instruments.

The table below shows GAAP and non-GAAP loss attributable to Clean Energy per share and also reconciles GAAP net loss attributable to Clean Energy to an adjusted net loss figure used in the calculation of non-GAAP loss per share:


Three Months Ended


Nine Months Ended


September 30,


September 30,

(in thousands, except share and per share data)


2019


2020


2019


2020

Net loss attributable to Clean Energy Fuels Corp.


$

(4,334

)


$

(2,271

)


$

(20,663

)


$

(7,303

)

Stock-based compensation


892


708


3,056


2,522


Income (loss) from equity method investments


(377

)


11


123


368


Loss (gain) from change in fair value of derivative instruments


(1,139

)


150


4,854


(4,055

)

Adjusted (non-GAAP) net loss


$

(4,958

)


$

(1,402

)


$

(12,630

)


$

(8,468

)

Diluted weighted-average common shares outstanding


204,712,888


198,785,394


204,522,984


201,472,851


GAAP loss attributable to Clean Energy Fuels Corp. per share


$

(0.02

)


$

(0.01

)


$

(0.10

)


$

(0.04

)

Non-GAAP loss attributable to Clean Energy Fuels Corp. per share


$

(0.02

)


$

(0.01

)


$

(0.06

)


$

(0.04

)

Adjusted EBITDA

Adjusted EBITDA, which the Company presents as a non-GAAP measure of its performance, is defined as net income (loss) attributable to Clean Energy, plus (minus) income tax expense (benefit), plus interest expense, minus interest income, plus depreciation and amortization expense, plus stock-based compensation expense, plus (minus) loss (income) from equity method investments, and plus (minus) any loss (gain) from changes in the fair value of derivative instruments. The Company’s management believes Adjusted EBITDA provides useful information to investors regarding the Company’s performance for the same reasons discussed above with respect to non-GAAP income (loss) per share. In addition, management internally uses Adjusted EBITDA to determine elements of executive and employee compensation.

The table below shows Adjusted EBITDA and also reconciles this figure to GAAP net loss attributable to Clean Energy:


Three Months Ended


Nine Months Ended


September 30,


September 30,

(in thousands, except share and per share data)


2019


2020


2019


2020

Net loss attributable to Clean Energy Fuels Corp.


$

(4,334

)


$

(2,271

)


$

(20,663

)


$

(7,303

)

Income tax expense


68


79


194


235


Interest expense


1,704


1,009


5,437


5,060


Interest income


(560

)


(427

)


(1,707

)


(1,081

)

Depreciation and amortization


12,247


11,744


37,331


35,718


Stock-based compensation


892


708


3,056


2,522


Income (loss) from equity method investments


(377

)


11


123


368


Loss (gain) from change in fair value of derivative instruments


(1,139

)


150


4,854


(4,055

)

Adjusted EBITDA


$

8,501


$

11,003


$

28,625


$

31,464


Definition of “Gallons Delivered”

The Company defines “gallons delivered” as its gallons sold as compressed natural gas (“CNG”) and liquefied natural gas (“LNG”), along with its gallons associated with providing operations and maintenance services, in each case delivered to its customers in the applicable period, plus the Company’s proportionate share of gallons delivered by joint ventures in the applicable period. RNG sold as vehicle fuel, is sold under the brand name Redeem™ and is included in the CNG or LNG amounts as applicable based on the form in which it was sold.


Three Months Ended


Nine Months Ended


September 30,


September 30,

Gasoline gallon equivalents delivered (in millions)


2019


2020


2019


2020

RedeemTM


37.4


40.1


111.1


112.1

The table below shows gallons delivered for the three and nine months ended September 30, 2019 and 2020:


Three Months Ended


Nine Months Ended


September 30,


September 30,

Gallons Delivered (in millions)


2019


2020


2019


2020

CNG


86.1


82.1


248.5


239.8

LNG


16.6


15.6


49.0


46.7

Total


102.7


97.7


297.5


286.5

Sources of Revenue

The following table shows the Company's sources of revenue for the three and nine months ended September 30, 2019 and 2020:


Three Months Ended


Nine Months Ended


September 30,


September 30,

Revenue (in millions)


2019


2020


2019


2020

Volume-related (1)


$

67.9


$

57.1


$

208.7


$

182.4

Station construction sales


6.4


8.8


15.5


19.6

AFTC (2)


5.0


14.8

Other


0.1


0.3


Total revenue


$

74.4


$

70.9


$

224.5


$

216.8

____________________

(1)

For the three and nine months ended September 30, 2020, volume-related revenue includes an unrealized gain (loss) from the change in fair value of commodity swap and customer fueling contracts of $(0.1) million and $4.0 million, respectively. For the three and nine months ended September 30, 2019, volume-related revenue includes an unrealized gain (loss) from the change in fair value of commodity swap and customer contracts of $1.1 million and $(3.3) million, respectively.

(2)

In 2019, we recognized AFTC revenue for the vehicle fuel we sold in 2018 and 2019 in the three months ended December 31, 2019.

2020 Outlook

Our latest 2020 outlook given on August 6, 2020 contemplated a prolonged effect and more flattened recovery curve from the COVID-19 pandemic. We continue to hold that view and thus continue to hold a view of achieving a GAAP net loss of approximately $11.0 million for 2020, assuming no unrealized gains or losses on the Company’s commodity swap contracts. Changes in diesel and natural gas market conditions resulting in unrealized gains or losses on the Company’s commodity swap contracts could significantly impact the Company’s estimated GAAP net income for 2020. Accordingly, Adjusted EBITDA for 2020 is still expected to be approximately $45.0 million. These expectations also exclude the impact of any acquisitions, divestitures, transactions or other extraordinary events including a deterioration in, slower or lack of any recovery from the COVID-19 pandemic. Additionally, the expectations regarding 2020 Adjusted EBITDA assume the calculation of this non-GAAP financial measure in the same manner as described above and without adjustments for any other items that may arise during 2020 and that management deems appropriate to exclude. These expectations are forward-looking statements and are qualified by the statement under “Safe Harbor Statement” below.


(in thousands)


2020 Outlook

GAAP Net income (loss) attributable to Clean Energy Fuels Corp.


$

(11,000

)

Income tax expense (benefit)


Interest expense


5,500


Interest income


(2,000

)

Depreciation and amortization


48,500


Stock-based compensation


4,000


Loss (income) from equity method investments


Loss (gain) from change in fair value of derivative instruments


Adjusted EBITDA


$

45,000


Today’s Conference Call

The Company will host an investor conference call today at 4:30 p.m. Eastern time (1:30 p.m. Pacific). Investors interested in participating in the live call can dial 1.800.736.4594 from the U.S. and international callers can dial 1.212.231.2919. A telephone replay will be available approximately two hours after the call concludes through Saturday, December 5, 2020, by dialing 1.844.512.2921 from the U.S., or 1.412.317.6671 from international locations, and entering Replay Pin Number 21971570. There also will be a simultaneous, live webcast available on the Investor Relations section of the Company’s web site at www.cleanenergyfuels.com, which will be available for replay for 30 days.

About Clean Energy Fuels Corp.

Clean Energy Fuels Corp. is North America’s leading provider of the cleanest fuel for the transportation market. Through its sales of Redeem™ renewable natural gas (RNG), which is derived from biogenic methane produced by the breakdown of organic waste, Clean Energy helps thousands of vehicles, from airport shuttles to city buses to waste and heavy-duty trucks, to reduce their amount of climate-harming greenhouse gas by at least 70% and up to 300% depending on the RNG feedstock. Clean Energy can deliver Redeem through compressed natural gas (CNG) and liquefied natural gas (LNG) to its network of approximately 550 fueling stations across the U.S. and Canada. Clean Energy builds and operates CNG and LNG fueling stations for the transportation market, owns natural gas liquefaction facilities in California and Texas, and transports bulk CNG and LNG to non-transportation customers around the U.S. For more information, visit www.CleanEnergyFuels.com.

Safe Harbor Statement

This press release contains forward-looking statements within the meaning of Section 27A of the Securities Act of 1933, as amended, and Section 21E of the Securities Exchange Act of 1934, as amended, including statements about, among other things, the Company’s outlook for fiscal 2020, the expected impact of the COVID-19 pandemic on the Company’s business and the demand for renewable vehicle fuels, including fleets transitioning to lower carbon solutions in transportation.

Forward-looking statements are statements other than historical facts and relate to future events or circumstances or the Company’s future performance, and they are based on the Company’s current assumptions, expectations and beliefs concerning future developments and their potential effect on the Company and its business. As a result, actual results, performance or achievements and the timing of events could differ materially from those anticipated in or implied by these forward-looking statements as a result of many factors including, among others: the COVID-19 pandemic and the measures taken to prevent its spread and the related impact on our operations, liquidity and financial condition; the Company’s history of net losses and the possibility the Company incurs additional net losses in the future; the willingness of fleets and other consumers to adopt natural gas as a vehicle fuel, and the rate and level of any such adoption; future supply, demand, use and prices of crude oil, gasoline, diesel, natural gas, and other vehicle fuels, including overall levels of and volatility in these factors; natural gas vehicle and engine cost, fuel usage, availability, quality, safety, convenience, design, performance and residual value, as well as operator perception with respect to these factors, in general and in the Company’s key customer markets, including heavy-duty trucking; the Company’s ability to execute its Zero Now truck financing program, a key strategic initiative related to the market for natural gas heavy-duty trucks, and the effect of this initiative on the Company’s business, prospects, performance and liquidity; the Company’s ability to capture a substantial share of the market for alternative vehicle fuels and vehicle fuels generally and otherwise compete successfully in these markets, including in the event of improvements in or perceived advantages of non-natural gas vehicle fuels or engines powered by these fuels or other competitive developments; the availability of environmental, tax and other government regulations, programs and incentives that promote natural gas, such as AFTC, or other alternatives as a vehicle fuel, including long-standing support for gasoline- and diesel-powered vehicles and growing support for electric and hydrogen-powered vehicles that could result in programs or incentives that favor these or other vehicles or vehicle fuels over natural gas; future availability of capital, which may include equity or debt financing, in the amounts and at the times needed to fund any growth in the Company’s business and the repayment of its debt obligations (whether at or before their due dates) or other expenditures, as well as the terms and other effects of any such capital-raising transaction; the effect of, or potential for changes to greenhouse gas emissions requirements or other environmental regulations applicable to vehicles powered by gasoline, diesel, natural gas or other vehicle fuels and crude oil and natural gas fueling, drilling, production, transportation or use; the Company’s ability to manage and grow its RNG business, including its ability to continue to receive revenue from sales of tradable credits the Company generates by selling conventional and renewable natural gas as vehicle fuel and the effect of any increase in competition for RNG supply; the Company’s ability to manage and grow its business of transporting and selling CNG for non-vehicle purposes via virtual natural gas pipelines and interconnects; the Company’s ability to accurately predict natural gas vehicle fuel demand in the geographic and customer markets in which it operates and effectively calibrate its strategies, timing and levels of investments to be consistent with this demand; the Company’s ability to recognize the anticipated benefits of its CNG and LNG fueling station network; construction, permitting and other factors that could cause delays or other problems at station construction projects; the Company’s ability to manage the safety and environmental risks inherent in its operations; the Company’s compliance with all applicable government regulations; the Company’s ability to execute and realize the intended benefits of any acquisitions, divestitures, investments or other strategic relationships or transactions; and general political, regulatory, economic and market conditions.

The forward-looking statements made in this press release speak only as of the date of this press release and the Company undertakes no obligation to update publicly such forward-looking statements to reflect subsequent events or circumstances, except as otherwise required by law.


Contacts

Investor Contact:
This email address is being protected from spambots. You need JavaScript enabled to view it.

News Media Contact:
Raleigh Gerber
Manager of Corporate Communications
949.437.1397


Read full story here

MGE's 50-megawatt share of project advances company's net-zero carbon goal


MADISON, Wis.--(BUSINESS WIRE)--Wisconsin's first large-scale solar project is complete and powering Madison-area households and businesses. Madison Gas and Electric (MGE) is a co-owner of the 150-megawatt (MW) Two Creeks Solar facility with Wisconsin Public Service (WPS). MGE owns 50 MW; WPS owns 100 MW.

"We are excited that Two Creeks Solar is now generating cost-effective, carbon-free energy for all our customers," said Jeff Keebler, MGE Chairman, President and CEO. "Growing our use of renewable resources is a key strategy for achieving our goal of net-zero carbon electricity by the year 2050. The completion of Two Creeks Solar is an important step in our ongoing transition toward deep decarbonization."

Two Creeks Solar features 500,000 solar panels across 800 acres in Manitowoc County. It can power more than 33,000 homes.

NextEra Energy Resources LLC developed and built Two Creeks Solar in partnership with MGE and WPS. Construction began in August 2019. Many of the facility’s components, including its half-million panels, were installed this spring and summer. Two Creeks is located in the Town of Two Creeks and City of Two Rivers.

Badger Hollow Solar Farm

MGE also will own 100 MW of the 300-MW Badger Hollow Solar Farm in Iowa County, Wisconsin, about 12 miles west of Dodgeville. Construction continues on the 150-MW Phase I of the project. It is expected online in spring 2021.

MGE targeting net-zero carbon by 2050

Consistent with the latest climate science, MGE is targeting net-zero carbon electricity by 2050. The company continues to work toward carbon reductions of at least 40% by 2030, as announced in 2015 and consistent with the landmark Paris Agreement on climate change. If MGE can go further faster in reducing carbon emissions, it will. To reach its carbon-reduction goals, MGE is growing its use of renewable energy, engaging customers around energy efficiency and facilitating the electrification of transportation, all of which are key strategies identified by the United States for achieving deep decarbonization. Visit mge2050.com to learn more.

About MGE

MGE generates and distributes electricity to 155,000 customers in Dane County, Wis., and purchases and distributes natural gas to 163,000 customers in seven south-central and western Wisconsin counties. MGE's parent company is MGE Energy, Inc. The company's roots in the Madison area date back more than 150 years.


Contacts

Steve Schultz
Corporate Communications Manager
608-252-7219 | This email address is being protected from spambots. You need JavaScript enabled to view it.

HOUSTON--(BUSINESS WIRE)--$HESM--Hess Midstream LP (NYSE: HESM) (“Hess Midstream”) announced today that Jonathan Stein, Chief Financial Officer, and Jennifer Gordon, Vice President, Investor Relations, will meet with investors on November 18, 2020 at the NYSE Industrials Access Day, and on November 19, 2020 at the Scotiabank Energy Infrastructure Conference.


A presentation will be posted in the “Investors” section of the Hess Midstream website at www.hessmidstream.com.

About Hess Midstream

Hess Midstream is a fee-based, growth-oriented, midstream company that owns, operates, develops and acquires a diverse set of midstream assets to provide services to Hess and third-party customers. Hess Midstream owns oil, gas and produced water handling assets that are primarily located in the Bakken and Three Forks Shale plays in the Williston Basin area of North Dakota. More information is available at www.hessmidstream.com.

Forward Looking Statements

This press release may include forward-looking statements within the meaning of the federal securities laws. Generally, the words “anticipate,” “estimate,” “expect,” “forecast,” “guidance,” “could,” “may,” “should,” “believe,” “intend,” “project,” “plan,” “predict,” “will” and similar expressions identify forward-looking statements, which generally are not historical in nature. Forward-looking statements are subject to certain risks and uncertainties that could cause actual results to differ materially from historical results and current projections or expectations. When considering these forward-looking statements, you should keep in mind the risk factors and other cautionary statements in the filings made by Hess Midstream with the U.S. Securities and Exchange Commission, which are available to the public. Hess Midstream undertakes no obligation to, and does not intend to, update these forward-looking statements to reflect events or circumstances occurring after this press release. You are cautioned not to place undue reliance on these forward-looking statements, which speak only as of the date of this press release.


Contacts

Investor Contact:
Jennifer Gordon
(212) 536-8244

Media Contact:
Robert Young
(713) 496-6076

DUBLIN--(BUSINESS WIRE)--The "Solar PV Dominating Investment Opportunities in Renewable Sector Across the Middle East, 2020-2025" report has been added to ResearchAndMarkets.com's offering.


Renewable energy presents a $341.1 billion opportunity for companies wishing to ride on the growth in this decade.

Sustainable development is the theme gaining unparalleled levels of attention and importance across the globe. The Middle East hosts top oil exporters in the world along with some of the top carbon emitters. The onus to reduce greenhouse gases (GHG) has fallen on the region and, therefore, the countries in the region have ambitious targets to promote renewables and thereby, reduce the carbon footprint.

Key drivers of market growth are climate change commitments, abundance of resources, falling costs of renewables, and progressive policies being implemented by countries in the region to promote clean energy and reduce carbon footprint.

This study explores the avenues for investments available for renewables companies in this region that arise as a result of this serious effort towards promoting renewables in the region and also as a result of localisation efforts by these countries as they move towards building well-diversified and non-oil dependent economies.

The scope of the study is limited to solar (PV and CSP) and wind (onshore) technologies and geographic coverage is the Middle East, covering the Gulf Cooperation Council (GCC) countries and also Iran, Iraq, Jordan, and Lebanon.

Opportunities are abound with capacity additions of more than 57.0 GW in the pipeline. This study explores critical success factors and growth opportunities available for companies with the right strategy, along with technology trends and growth themes.

While the Kingdom of Saudi Arabia (KSA) is the leader in terms of planned capacity addition, other key markets include Qatar and the UAE. In terms of technologies, solar PV is expected to gain maximum traction during the next 5 years compared to other technologies. The study touches upon the current capacity of local equipment manufacturers, the key participants in the market and possible future capabilities of manufacturers.

This is a market that requires strategic partnerships and critical local market knowledge for success. Besides, due to limitations in resources other than oil, a robust procurement strategy is key to sustain profits.

Key Issues Addressed

  • What is the installed capacity of renewable energy in the region and what is the expected investment in each renewable energy technology type?
  • What are the trends affecting the renewable energy industry?
  • How is the competitive landscape, and what are the critical success factors?
  • What are the growth opportunities available for new entrants and existing participants?
  • What are the opportunities available in each country in the region?

Key Topics Covered:

1. Strategic Imperatives

  • Why Is It Increasingly Difficult to Grow?
  • The Strategic Imperative
  • Middle Eastern Renewable Energy and the Strategic Imperative-Top 3 Strategic Imperatives Affecting Growth
  • Growth Opportunities Fuel the Growth Pipeline Engine

2. Growth Opportunity Analysis, Middle Eastern Renewable Energy-Executive Summary

  • Key Findings
  • Top Power Industry Trends in the Middle East
  • Renewable Energy Installed Capacity and Trends
  • Renewable Energy Capacity Targets
  • RE Installed Capacity Breakdown
  • Top Trends

3. Investment Opportunity and Outlook

  • Localisation Drive in the Region
  • CEO's Perspective

4. Research Scope and Segmentation

  • Research Scope
  • Key Questions this Study will Answer

5. Drivers and Restraints-ME Renewable Energy

  • Growth Drivers
  • Growth Drivers Explained
  • Growth Restraints
  • Growth Restraints Explained

6. Middle Eastern Power Industry Outlook

  • Overall Power Generation Capacity
  • Growth in Power Demand at a CAGR of 4.1%
  • Role of Renewables
  • Middle Eastern Renewable Energy Sector Overview

7. Forecast Assumptions, Middle Eastern Renewable Sector

  • Overall Power Generation Capacity
  • Regional Attractiveness

8. Renewable Energy Outlook and Investment Opportunities-KSA

  • KSA RE Sector Snapshot
  • KSA-Key Government Policies and Initiatives
  • Key Competitors
  • Renewable Energy Installed Capacity and Trends
  • Opportunity Size
  • Projects
  • Opportunities in Local Manufacturing-Wind and Solar
  • Opportunities in Local Manufacturing-Solar PV Value Chain
  • Opportunities in Local Manufacturing-Solar CSP Value Chain
  • Opportunities in Local Manufacturing-Wind Value Chain

9. Renewable Energy Outlook and Investment Opportunities-UAE

  • UAE RE Sector Snapshot
  • UAE-Key Government Policies and Initiatives
  • Key Competitors
  • Renewable Energy Installed Capacity and Trends
  • Opportunity Size
  • Projects
  • Opportunities in Local Manufacturing-Solar PV Value Chain
  • Opportunities in Local Manufacturing-Solar CSP Value Chain
  • Opportunities in Local Manufacturing-Wind Value Chain

10. Renewable Energy Outlook and Investment Opportunities-Qatar

  • Qatar RE Sector Snapshot
  • Qatar-Key Government Policies and Initiatives
  • Key Competitors
  • Renewable Energy Installed Capacity and Trends
  • Opportunity Size
  • Opportunities in Local Manufacturing-Solar PV Value Chain

11. Renewable Energy Outlook and Investment Opportunities-Kuwait

  • Kuwait RE Sector Snapshot
  • Kuwait-Key Government Policies and Initiatives
  • Key Competitors
  • Renewable Energy Installed Capacity and Trends
  • Opportunity Size
  • Projects
  • Opportunities in Local Manufacturing-Solar PV Value Chain

12. Renewable Energy Outlook and Investment Opportunities-Bahrain

  • Bahrain RE Sector Snapshot
  • Bahrain-Key Government Policies and Initiatives
  • Key Competitors
  • Renewable Energy Installed Capacity and Trends
  • Opportunity Size
  • Opportunities in Local Manufacturing-Solar PV Value Chain

13. Renewable Energy Outlook and Investment Opportunities-Oman

  • Oman RE Sector Snapshot
  • Oman-Key Government Policies and Initiatives
  • Key Competitors
  • Renewable Energy Installed Capacity and Trends
  • Opportunity Size
  • Projects
  • Opportunities in Local Manufacturing-Solar PV Value Chain

14. Renewable Energy Outlook and Investment Opportunities-Rest of the Middle East

  • Rest of ME RE Sector Snapshot
  • Rest of ME-Key Government Policies and Initiatives
  • Key Competitors
  • Renewable Energy Installed Capacity and Trends
  • Opportunity Size
  • Opportunities in Local Manufacturing-Solar PV Value Chain (Lebanon)

15. Growth Opportunity Universe, Middle Eastern Renewable Energy Sector

  • Growth Theme 1-RE for Desalination
  • Growth Theme 2-RE in Mobility
  • Growth Theme 3-RE in District Cooling
  • Growth Opportunity 1-Anti-soiling and Efficiency Improvement Solutions for Addressing Efficiency Losses, 2020
  • Growth Opportunity 2-Storage Solutions to Address Intermittency and Output Stabilisation
  • Critical Success Factors

16. The Last Word

For more information about this report visit https://www.researchandmarkets.com/r/2lx1ny


Contacts

ResearchAndMarkets.com
Laura Wood, Senior Press Manager
This email address is being protected from spambots. You need JavaScript enabled to view it.

For E.S.T Office Hours Call 1-917-300-0470
For U.S./CAN Toll Free Call 1-800-526-8630
For GMT Office Hours Call +353-1-416-8900

Q3 2020 Highlights

  • 176 million gallons of fuel sold
  • 137 million gallons of fuel produced
  • Revenues of $576 million
  • Net income from continuing operations available to common stockholders of $26 million, or $0.60 per diluted share ($102 million, or $2.38 per diluted share, for the nine months ended September 30, 2020)
  • Adjusted EBITDA of $58 million ($157 million for the nine months ended September 30, 2020)
  • Carbon reduction from fuels produced by REG in the quarter of over one million metric tons
  • Announced planned expansion of renewable diesel plant in Geismar, Louisiana to 340 million gallons per year
  • Built on board and executive talent with Walter Berger joining the REG Board of Directors, Trisha Conley joining as Vice President, People Development and Bob Kenyon joining as Vice President, Sales & Marketing

AMES, Iowa--(BUSINESS WIRE)--Renewable Energy Group, Inc. (“REG” or the “Company”) (NASDAQ: REGI) today announced its financial results for the third quarter ended September 30, 2020.


Revenues for the third quarter were $576 million on 176 million gallons of fuel sold. Net income from continuing operations available to common stockholders was $26 million in the third quarter of 2020, compared to a net loss of $14 million in the third quarter of 2019. The net loss in the third quarter of 2019 does not include the Biodiesel Mixture Excise Tax Credit ("BTC") allocation, which was retroactively reinstated in December 2019. Adjusted EBITDA in the third quarter was $58 million, compared to $88 million in the third quarter of 2019, including the allocation of the BTC.

"We delivered a relatively strong third quarter and are on track for a strong full year. We are especially pleased with these results considering the price volatility and overall energy demand slowdown due to COVID-19," said Cynthia (CJ) Warner, President and Chief Executive Officer. "Demand for our low carbon fuels was resilient, which we believe further demonstrates that the renewable fuel industry is at an inflection point driven by customer demand."

Warner continued, "REG is positioned to lead and capitalize on this unique opportunity with strong ongoing production, and our focused downstream strategy to deliver value to our customers while expanding our margins. We are building upon this momentum with the planned Geismar expansion."

Third Quarter 2020 Highlights - GAAP

All figures refer to the quarter ended September 30, 2020, unless otherwise noted. All comparisons are to the quarter ended September 30, 2019, unless otherwise noted.

The table below summarizes REG’s financial results for the third quarter of 2020.

REG Q3 2020 Results

(dollars and gallons in thousands, except per gallon data)


Q3 2020


Q3 2019


Y/Y Change


Market Data


NYMEX ULSD average price per gallon

$

1.20


$

1.89


(36.5

)

%

D4 RIN average price per credit

$

0.67


$

0.46


45.7


%

CBOT Soybean oil average price per gallon

$

2.36


$

2.14


10.3


%

HOBO + 1.5xRIN average price per gallon (1)

$

0.85


$

1.44


(41.0

)

%


Gallons sold

176,219


187,531


(6.0

)

%


GAAP


Total revenues

$

576,052


$

584,372


(1.4

)

%

Operating income (loss)

$

27,335


$

(11,831

)


$

39,166


Net income (loss) from continuing operations available to common stockholders

$

26,339


$

(13,753

)


$

40,092


(1)

HOBO = HO NYMEX + 1 - ((CBOT SBO $/lb)/100 x 7.5)


HOBO + RINs = HOBO + 1.5 x D4 RIN as quoted by the Oil Price Information Service.

REG sold 176 million gallons of fuel, a decrease of 6% mostly attributable to the Company's continued focus on improvement in product mix. Lower margin petroleum diesel volumes and third party biodiesel volumes decreased by 12 million gallons and 5 million gallons, respectively. The Company’s sale of self-produced biodiesel increased by 6 million gallons. The Company’s sale of self-produced renewable diesel decreased by 2 million gallons due to timing of a vessel shipment.

REG produced an aggregate of 137 million gallons of biodiesel and renewable diesel during the quarter, essentially flat versus the corresponding quarter in the prior year. Production at the Company's Geismar, Louisiana renewable diesel plant increased 3% and European biodiesel production increased 4%. North American biodiesel production decreased 1% due primarily to the absence of production from the Company's New Boston, Texas plant, which was closed in July 2019.

Revenues of $576 million were essentially flat, negatively impacted by lower selling prices due primarily to significantly lower ULSD prices, which declined 37%. The price impact was mostly offset by an $83 million increase, due to the BTC being in effect in 2020, higher revenue in Europe mostly attributable to higher volumes there, and a 46% increase in average D4 RIN prices.

Gross profit was $78 million, or 13% of revenues, compared to gross profit of $24 million, or 4% of revenues. Gross profit as a percentage of revenue increased due primarily to the increase in European revenue, an increase in gross profit for separated RINs driven by higher average D4 RIN prices, a $4 million increase in risk management gains, and the BTC being in effect in 2020. The increases were partially offset by lower selling prices in North America and increased feedstock costs. Weighted average feedstock production costs increased $0.04 per gallon. While feedstock availability improved during the quarter compared to the second quarter of this year, relative prices were significantly different from the third quarter of 2019. In response, REG changed the feedstock mix to limit overall cost impacts, resulting in soybean oil usage increasing 26%, animal fat increasing 20%, distillers corn oil decreasing by 14%, and canola oil usage decreasing 26% year over year.

Operating income was $27 million compared to an operating loss of $12 million for the third quarter of 2019, driven by the same factors as those described above for gross profit. Note that the increase in operating income was reduced somewhat by an impairment charge and an increase in selling, general and administrative costs due to higher employee related compensation.

GAAP net income from continuing operations available to common stockholders was $26 million, or $0.60 per share on a fully diluted basis, compared to net loss of $14 million, or $0.35 per share on a fully diluted basis, in the third quarter of 2019. The differential drivers are the same as those described above for operating income.

At September 30, 2020, REG had cash and cash equivalents, restricted cash, and marketable securities of $285 million, an increase of $232 million from December 31, 2019. In addition, REG had $102 million in long-term marketable securities at the end of the quarter compared to none at December 31, 2019. These increases are mainly due to receipt of the 2018 and 2019 retroactive gross BTC claims and cash generated by operations, offset by funds used to fully pay down the Company's asset-backed line of credit, to make tax sharing payments owed in regards to our 2018 and 2019 BTC, to repurchase a portion of the 2036 convertible senior notes, and for capital expenditures.

At September 30, 2020, accounts receivable were $188 million, a decrease of $671 million from December 31, 2019. The decrease in accounts receivable was due primarily to receipt of the retroactive 2018 and 2019 BTC claims. At September 30, 2020, accounts payable were $135 million, a decrease of $234 million from December 31, 2019. The decrease in accounts payable is due primarily to tax sharing payments to customers related to the 2018 and 2019 BTC.

Third Quarter 2020 Highlights - Non-GAAP

All figures refer to the quarter ended September 30, 2020, unless otherwise noted. All comparisons are to the quarter ended September 30, 2019, unless otherwise noted. Adjusted amounts reflect the allocation of the BTC benefits for the period in which the gallons were sold (shown in the table above).

The table below summarizes REG’s financial results for the third quarter of 2020, as adjusted in order to reflect the allocation of the BTC benefits for the period in which associated gallons were sold.

REG Q3 2020 Results

(dollars and gallons in thousands)


Q3 2020


Q3 2019


Y/Y Change


Market Data


HOBO + 1.5xRIN average price per gallon

$

0.85


$

1.44


(41.0)

%


BTC Allocated to Period Earned - Non-GAAP (1)


Total revenues

$

576,052


$

661,621


(12.9)

%

Operating income (loss)

$

27,335


$

65,337


(58.2)

%

Net income from continuing operations available to common stockholders

$

26,339


$

62,136


(57.6)

%

Adjusted EBITDA

$

58,381


$

87,790


(33.5)

%

(1)

BTC benefits are allocated to the respective periods when associated gallons were sold for 2019.

Operating income as adjusted was $27 million, a decrease of $38 million resulting mainly from the decrease in margins, but also the increase in impairment charges, and higher selling, general and administrative expenses, partially offset by the increase in risk management gains, the increase in gross profit for separated RINs, and an increase in BTC benefit of $6 million.

Net income available to common stockholders as adjusted was $26 million compared to a net income of $62 million in 2019. Adjusted EBITDA was $58 million compared to $88 million in Q3 2019, all as a result of the same factors as those described above for operating income.

Reconciliation of Non - GAAP Measures

The Company uses earnings before interest, taxes, depreciation and amortization, adjusted for certain additional items identified in the table below, or Adjusted EBITDA, as a supplemental performance measure. Adjusted EBITDA is presented in order to assist investors in analyzing performance across reporting periods on a consistent basis by excluding items that are not believed to be indicative of core operating performance. Adjusted EBITDA is used by the Company to evaluate, assess and benchmark financial performance on a consistent and a comparable basis and as a factor in determining incentive compensation for Company executives.

The following table sets forth Adjusted EBITDA for the periods presented, as well as a reconciliation to net income (loss) from continuing operations determined in accordance with GAAP:


Three months
ended
September 30,
2020


Three months
ended
September 30,
2019


Nine months
ended
September 30,
2020


Nine months
ended
September 30,
2019

(In thousands)


Net income (loss) from continuing operations

$

26,831


$

(13,753

)


$

104,532


$

(112,775

)

Adjustments:


Income tax (benefit) expense

1,046


(629

)


4,007


(1,149

)

Interest expense

1,070


2,866


4,732


10,822


Depreciation

9,388


9,107


27,425


27,349


Amortization of intangible assets

591


397


1,262


1,241


EBITDA

38,926


(2,012

)


141,958


(74,512

)

Gain on sale of assets


(187

)


Change in fair value of contingent consideration


(136

)


566


(Gain) loss on debt extinguishment

(18

)


(1,809

)


2


Gain on lease termination


(4,459

)


Other income, net

(1,594

)


(179

)


(3,505

)


(1,724

)

Impairment of assets

19,256


11,145


19,256


11,613


Stock compensation

1,811


1,804


5,789


4,981


Biodiesel tax credit 2019(1)


77,168


212,045


Adjusted EBITDA

$

58,381


$

87,790


$

157,043


$

152,971


(1) On December 20, 2019, the Biodiesel Mixture Excise Tax Credit ("BTC") was retroactively reinstated for the 2018 and 2019 calendar years. The retroactive credit for 2018 and 2019 resulted in a net benefit to us that was recognized in our GAAP financial statements for the quarter ending December 31, 2019. The portion of the credit related to 2019 was allocated to each of the four quarters based upon the portion of the BTC benefit that related to that quarter.

Adjusted EBITDA is a supplemental performance measure that is not required by, or presented in accordance with, generally accepted accounting principles, or GAAP. Adjusted EBITDA should not be considered as an alternative to net income or any other performance measure derived in accordance with GAAP, or as an alternative to cash flows from operating activities or a measure of liquidity or profitability. Adjusted EBITDA has limitations as an analytical tool, and should not be considered in isolation, or as a substitute for any of the results as reported under GAAP. Some of these limitations are:

  • Adjusted EBITDA does not reflect cash expenditures or the impact of certain cash charges that the Company considers not to be an indication of ongoing operations;
  • Adjusted EBITDA does not reflect changes in, or cash requirements for, working capital requirements;
  • Adjusted EBITDA does not reflect the interest expense, or the cash requirements necessary to service interest or principal payments, on indebtedness;
  • Although depreciation and amortization are non-cash charges, the assets being depreciated and amortized will often have to be replaced in the future, and Adjusted EBITDA does not reflect cash requirements for such replacements;
  • Stock-based compensation expense is an important element of the Company’s long term incentive compensation program, although the Company has excluded it as an expense when evaluating our operating performance; and
  • Other companies, including other companies in the same industry, may calculate these measures differently, limiting their usefulness as a comparative measure.

About Renewable Energy Group

Renewable Energy Group, Inc. (Nasdaq: REGI) is leading the energy industry's transition to sustainability by transforming renewable resources into high-quality, cleaner fuels. REG is an international producer of cleaner fuels and North America’s largest producer of biodiesel. REG solutions are alternatives for petroleum diesel and produce significantly lower carbon emissions. REG utilizes an integrated procurement, distribution and logistics network to operate 12 biorefineries in the U.S. and Europe. In 2019, REG produced 495 million gallons of cleaner fuel delivering over 4.2 million metric tons of carbon reduction. REG is meeting the growing global demand for lower-carbon fuels and leading the way to a more sustainable future.

Note Regarding Forward-Looking Statements

This press release contains certain forward-looking statements within the meaning of the Private Securities Litigation Reform Act of 1995, as amended, including statements regarding our expectations for a strong full year, our business plans and strategy, customer demand, industry trends and the planned Geismar expansion. These forward-looking statements are based on current expectations, estimates, assumptions and projections that are subject to change, and actual results may differ materially from the forward-looking statements. Factors that could cause actual results to differ materially include, but are not limited to, the Company’s inability to obtain the capital needed to complete the expansion project, cost overruns and construction delays, the inability to obtain governmental permits and third party easements required or necessary to initiate or complete the expansion project, the potential impact of COVID-19 on our business and operations; the Company's financial performance, including revenues, cost of revenues and operating expenses; changes in governmental programs and policies requiring or encouraging the use of biofuels, including RFS2 in the United States, renewable fuel policies in Canada and Europe, and state level programs such as California's Low Carbon Fuel Standard; availability of federal and state governmental tax incentives and incentives for biomass-based diesel production; changes in the spread between biomass-based diesel prices and feedstock costs; the availability, future price, and volatility of feedstocks; the availability, future price and volatility of petroleum and products derived from petroleum; risks associated with fire, explosions, leaks and other natural disasters at our facilities; any disruption of operations at our Geismar renewable diesel refinery (which would have a disproportionately adverse effect on our profitability); the unexpected closure of any of our facilities; the effect of excess capacity in the biomass-based diesel industry and announced large plant expansions and potential co-processing of renewable diesel by petroleum refiners; unanticipated changes in the biomass-based diesel market from which we generate almost all of our revenues; seasonal fluctuations in our operating results; potential failure to comply with government regulations; competition in the markets in which we operate; our dependence on sales to a single customer; technological advances or new methods of biomass-based diesel production or the development of energy alternatives to biomass-based diesel; our ability to successfully implement our acquisition strategy; the Company's ability to retain and recruit key personnel; the Company's indebtedness and its compliance, or failure to comply, with restrictive and financial covenants in its various debt agreements; risk management transaction, and other risks and uncertainties described in REG's annual report on Form 10-K for the year ended December 31, 2019 and subsequently filed Form 10-Q and other periodic filings with the Securities and Exchange Commission. All forward-looking statements are made as of the date of this press release and REG does not undertake to update any forward-looking statements based on new developments or changes in our expectations.

RENEWABLE ENERGY GROUP, INC. AND SUBSIDIARIES

CONDENSED CONSOLIDATED STATEMENTS OF OPERATIONS (unaudited)

FOR THE THREE AND NINE MONTHS ENDED SEPTEMBER 30, 2020 AND 2019

(in thousands, except share and per share amounts)


Three months ended


Nine months ended


September 30, 2020


September 30, 2019


September 30, 2020


September 30, 2019

REVENUES:


Biomass-based diesel sales

$

492,769


$

583,676


$

1,350,496


$

1,620,960


Biomass-based diesel government incentives

83,178


512


245,471


1,510


575,947


584,188


1,595,967


1,622,470


Other revenue

105


184


718


754


576,052


584,372


1,596,685


1,623,224


COSTS OF GOODS SOLD:


Biomass-based diesel

498,362


560,288


1,386,996


1,638,701


Other costs of goods sold

40


8


151


11


498,402


560,296


1,387,147


1,638,712


GROSS PROFIT (LOSS)

77,650


24,076


209,538


(15,488

)

SELLING, GENERAL AND ADMINISTRATIVE EXPENSES

31,059


24,762


86,971


77,157


GAIN ON DISPOSAL OF PROPERTY, PLANT AND EQUIPMENT


(187

)


IMPAIRMENT OF PROPERTY, PLANT AND EQUIPMENT

19,256


11,145


19,256


11,613


INCOME (LOSS) FROM OPERATIONS

27,335


(11,831

)


103,498


(104,258

)

OTHER INCOME (EXPENSE), NET

542


(2,551

)


5,041


(9,666

)

INCOME (LOSS) FROM CONTINUING OPERATIONS BEFORE INCOME TAXES

27,877


(14,382

)


108,539


(113,924

)

INCOME TAX BENEFIT (EXPENSE)

(1,046

)


629


(4,007

)


1,149


NET INCOME (LOSS) FROM CONTINUING OPERATIONS

26,831


(13,753

)


104,532


(112,775

)

NET LOSS ON DISCONTINUED OPERATIONS


(2,193

)


(8,672

)

NET INCOME (LOSS)

$

26,831


$

(15,946

)


$

104,532


$

(121,447

)


NET INCOME (LOSS) FROM CONTINUING OPERATIONS AVAILABLE TO COMMON STOCKHOLDERS

$

26,339


$

(13,753

)


$

102,461


$

(112,775

)

NET LOSS FROM DISCONTINUED OPERATIONS AVAILABLE TO COMMON STOCKHOLDERS

$


$

(2,193

)


$


$

(8,672

)

Basic net income (loss) per share available to common stockholders:


Continuing operations

$

0.67


$

(0.35

)


$

2.62


$

(2.96

)

Discontinued operations

$


$

(0.06

)


$


$

(0.23

)

Net income (loss) per share

$

0.67


$

(0.41

)


$

2.62


$

(3.19

)

Diluted net income (loss) per share available to common stockholders


Continuing operations

$

0.60


$

(0.35

)


$

2.38


$

(2.96

)

Discontinued operations

$


$

(0.06

)


$


$

(0.23

)

Net income (loss) per share

$

0.60


$

(0.41

)


$

2.38


$

(3.19

)

Weighted-average shares used to compute basic net income (loss) per share available to common stockholders:


Basic

39,306,263


38,959,606


39,154,788


38,060,782


Weighted-average shares used to compute diluted net income (loss) per share available to the common stockholders:


Diluted

43,624,340


38,959,606


43,107,989


38,060,782


RENEWABLE ENERGY GROUP, INC. AND SUBSIDIARIES

CONDENSED CONSOLIDATED BALANCE SHEETS (unaudited)

AS OF SEPTEMBER 30, 2020 AND DECEMBER 31, 2019

(in thousands, except share and per share amounts)


September 30, 2020


December 31, 2019

ASSETS


CURRENT ASSETS:


Cash and cash equivalents

$

97,187


$

50,436


Marketable securities

184,916


Accounts receivable, net

187,860


858,922


Inventories

145,998


161,429


Prepaid expenses and other assets

59,811


35,473


Restricted cash

3,000


3,000


Total current assets

678,772


1,109,260


Long-term marketable securities

101,584


Property, plant and equipment, net

592,317


584,577


Right of use assets

29,057


36,899


Goodwill

16,080


16,080


Intangible assets, net

11,018


12,018


Other assets

31,580


26,515


TOTAL ASSETS

$

1,460,408


$

1,785,349


LIABILITIES AND EQUITY


CURRENT LIABILITIES:


Lines of credit

$


$

76,990


Current maturities of long-term debt

49,906


77,131


Current maturities of operating lease obligations

14,457


15,690


Accounts payable

135,039


369,213


Accrued expenses and other liabilities

23,107


40,776


Deferred revenue

9,654


8,620


Total current liabilities

232,163


588,420


Deferred income taxes

6,977


6,975


Long-term debt (net of debt issuance costs of $1,767 and $2,783, respectively)

15,881


26,130


Long-term operating lease obligations

15,701


30,413


Other liabilities

5,448


1,505


Total liabilities

276,170


653,443


COMMITMENTS AND CONTINGENCIES


TOTAL EQUITY

1,184,238


1,131,906


TOTAL LIABILITIES AND EQUITY

$

1,460,408


$

1,785,349


Contacts

Company:
Renewable Energy Group, Inc.
Todd Robinson
Treasurer
+1 (515) 239-8048
This email address is being protected from spambots. You need JavaScript enabled to view it.

NORTH HUNTINGDON, Pa.--(BUSINESS WIRE)--The ExOne Company (Nasdaq: XONE), the global leader in industrial sand and metal 3D printers using binder jetting technology, today announced it is one of 16 companies participating in a consortium led by DNV GL, the world’s leading risk management and quality assurance society for the oil & gas and maritime industries.


The consortium was founded in 2018 with the goal of developing an industry-accepted guideline for quality assurance of additively manufacturing parts.

Today, the consortium includes the entire value chain of operators, contractors and fabricators: Equinor, Saudi Aramco, Siemens, Kongsberg Maritime, Voestalpine, Guaranteed, IMI CCI, Kongsberg Ferrotech, Addilan, BMT Aerospace, FIT AG, Howco Group, ImphyTek Powders, Intertek, XDM3D and ExOne.

In February, the consortium released a new standard, “Additive manufacturing of metallic parts” (DNVGL-ST-B203) for the oil & gas sector, which is focused on wire-arc additive manufacturing (WAAM) and laser-based powder bed fusion (PBF-LM). Now, the group is expanding its effort to incorporate more AM technologies, such as binder jetting technology (BJT).

“As manufacturers around the world move to new additive manufacturing technologies, it’s important that they have standards to ensure the quality of their AM parts and products,” said John Hartner, ExOne CEO. “Binder jetting technology already delivers many benefits to the oil & gas and maritime industries, and we’re eager to expand that reach with new quality standards. Our binder jetting technology can help manufacturers 3D print large or small parts in high volumes that bring them broad benefits.”

About ExOne

ExOne is the pioneer and global leader in binder jet 3D printing technology. Since 1995, we’ve been on a mission to deliver powerful 3D printers that solve the toughest problems and enable world-changing innovations. Our 3D printing systems quickly transform powder materials — including metals, ceramics, composites and sand — into precision parts, metalcasting molds and cores, and innovative tooling solutions. Industrial customers use our technology to save time and money, reduce waste, improve their manufacturing flexibility, and deliver designs and products that were once impossible. As home to the world’s leading team of binder jetting experts, ExOne also provides specialized 3D printing services, including on-demand production of mission-critical parts, as well as engineering and design consulting. Learn more about ExOne at www.exone.com or on Twitter at @ExOneCo. We invite you to join with us to #MakeMetalGreen™.


Contacts

Media:
Sarah Webster
Chief Marketing Officer
724-516-2336
This email address is being protected from spambots. You need JavaScript enabled to view it.


  • Delivered Reported EPS of $0.39 and Adjusted EPS of $0.50 on solid backlog execution
  • Tracking ahead of plan on $100 million cost reduction program
  • Further traction on Flowserve 2.0 transformation efforts while limiting pandemic disruptions
  • Substantial progress on new product development program, including 9 new and upgraded products
  • Strengthened liquidity with $500 million notes offering, credit facility amendment and solid operating cash flow, which together bring current liquidity to $1.7 billion

DALLAS--(BUSINESS WIRE)--Flowserve Corporation (NYSE: FLS), a leading provider of flow control products and services for the global infrastructure markets, today announced its financial results for the third quarter ended September 30, 2020.


Third Quarter 2020 Highlights (all comparisons to the 2019 third quarter, unless otherwise noted)[1]

  • Reported Earnings Per Share (EPS) of $0.39 and Adjusted EPS[2] of $0.50
    • Reported EPS includes after-tax adjusted items of approximately $14.3 million, including realignment, transformation and below-the-line foreign exchange impacts
  • Total bookings were $806.1 million, down 21.2%, or 21.6% on a constant currency basis
    • Original equipment bookings were $381.0 million, or 47% of total bookings, down 28.3%, or 29.0% on a constant currency basis
    • Aftermarket bookings were $425.1 million, or 53% of total bookings, down 13.5%, or 13.6% on a constant currency basis
  • Sales were $924.3 million, down 7.2%, or 7.7% on a constant currency basis
    • Original equipment sales were $479.4 million, down 5.6%, or 6.3% on a constant currency basis
    • Aftermarket sales were $444.9 million, down 8.8% reported and on a constant currency basis
  • Reported gross and operating margins were 30.9% and 9.4%, respectively
    • Adjusted gross and operating margins[3] were 31.5% and 10.9%, respectively
  • Backlog at September 30, 2020 was $2.0 billion, down 4.2% sequentially

“We delivered a solid operating quarter as we continued to refine and improve our processes to more effectively manage the pandemic-related challenges,” said Scott Rowe, Flowserve’s president and chief executive officer. “Our front-line workers and operating leaders are continuously improving their ability to limit COVID disruptions in our facilities, demonstrating their commitment to each other and our customers to safely deliver critical support, products and services.”

“Despite the challenges with COVID, we continue to execute the Flowserve 2.0 agenda and advance our long-term strategic plan,” added Rowe. “The transformation has enabled us to achieve our $100 million annualized cost savings target, as well as manage our margins and decrementals better than previous cycles. Additionally, we launched five new and four upgraded products during the quarter targeting attractive process applications. We believe these actions will continue to position Flowserve for long-term success as our end-markets begin to recover in 2021.”

Outlook

Rowe concluded, “Looking forward, we are increasingly optimistic that our markets have stabilized, and we can expect a return to growth in 2021 as the world recovers from the COVID pandemic. I am confident that with continued Flowserve 2.0 transformation progress we will be well positioned to capture growth opportunities when investment returns, driving long-term value for our customers, associates and shareholders.”

As announced on April 6, 2020, Flowserve withdrew its full year 2020 guidance in light of the significant market uncertainty as a result of the COVID-19 pandemic, and its related affects. In terms of fourth quarter outlook, Flowserve’s results are traditionally seasonal during the year – with the highest performance for quarterly revenues, adjusted earnings and cash flow typically occurring in the fourth quarter of the year. We expect the 2020 fourth quarter to largely follow that trend.

Revision to Prior Periods

The company also announced today that in conjunction with its close process for the 2020 third quarter, the company identified and corrected immaterial accounting errors related to the recognition of a liability for unasserted asbestos claims, as well as certain other immaterial adjustments. As part of its review of this accounting treatment, the company retained a third-party actuarial consultant to review information pertaining to our potential asbestos liability. Based on the results of this analysis, the company recognized an ‘incurred but not reported’ (“IBNR”) liability during the year ended December 31, 2014 through the second quarter of 2020. The company does not have an increased view of risk related to asbestos litigation or a change in expectations for future cash flows.

The cumulative effect of these corrections resulted in an increase in liabilities including an IBNR for unasserted asbestos claims of approximately $66 million, as well as an increase to total assets of approximately $23 million and a decrease to retained earnings of approximately $43 million as of June 30, 2020. The expected impacts of the revisions described above and reflected in the supplemental schedules attached as Exhibit 99.2 to the Form 8-K filed today in connection with this earnings release are preliminary and unaudited and are subject to change before filing the September 30, 2020 Form 10-Q.

While the revisions are not material to any prior annual or quarterly period, to enhance transparency, the company plans to provide revised comparative periods in future filings, including in its September 30, 2020 Form 10-Q, which the company expects to file within the prescribed timeline for such report, including any available extension.

Third Quarter 2020 Results Conference Call
Flowserve will host its conference call with the financial community on Friday, November 6th at 11:00 AM Eastern. Scott Rowe, president and chief executive officer, as well as other members of the management team will be presenting. The call can be accessed by shareholders and other interested parties at www.flowserve.com under the “Investor Relations” section.

[1] Prior period comparisons are impacted by the accounting revision related to incurred but not reported accruals for expected future asbestos litigation as well as certain other non-material adjustments further detailed in “Revisions to Prior Periods” section.
[2] See Reconciliation of Non-GAAP Measures table for detailed reconciliation of reported results to adjusted measures.
[3] Adjusted gross and operating margins are calculated by dividing adjusted gross profit and adjusted operating income, respectively, by revenues. Adjusted gross profit and adjusted operating income are derived by excluding the adjusted items. See reconciliation of Non-GAAP Measures table for detailed reconciliation.

About Flowserve
Flowserve Corp. is one of the world’s leading providers of fluid motion and control products and services. Operating in more than 50 countries, the company produces engineered and industrial pumps, seals and valves as well as a range of related flow management services. More information about Flowserve can be obtained by visiting the company’s Web site at www.flowserve.com.

Safe Harbor Statement: This news release includes forward-looking statements within the meaning of Section 27A of the Securities Act of 1933 and Section 21E of the Securities Exchange Act of 1934, which are made pursuant to the safe harbor provisions of the Private Securities Litigation Reform Act of 1995, as amended. Words or phrases such as, "may," "should," "expects," "could," "intends," "plans," "anticipates," "estimates," "believes," "forecasts," "predicts" or other similar expressions are intended to identify forward-looking statements, which include, without limitation, earnings forecasts, statements relating to our business strategy and statements of expectations, beliefs, future plans and strategies and anticipated developments concerning our industry, business, operations and financial performance and condition.

The forward-looking statements included in this news release are based on our current expectations, projections, estimates and assumptions. These statements are only predictions, not guarantees. Such forward-looking statements are subject to numerous risks and uncertainties that are difficult to predict. These risks and uncertainties may cause actual results to differ materially from what is forecast in such forward-looking statements, and include, without limitation, the following: the impact of the global outbreak of COVID-19 on our business and operations; a portion of our bookings may not lead to completed sales, and our ability to convert bookings into revenues at acceptable profit margins; changes in global economic conditions and the potential for unexpected cancellations or delays of customer orders in our reported backlog; our dependence on our customers’ ability to make required capital investment and maintenance expenditures; if we are not able to successfully execute and realize the expected financial benefits from our strategic transformation and realignment initiatives, our business could be adversely affected; risks associated with cost overruns on fixed-fee projects and in taking customer orders for large complex custom engineered products; the substantial dependence of our sales on the success of the oil and gas, chemical, power generation and water management industries; the adverse impact of volatile raw materials prices on our products and operating margins; economic, political and other risks associated with our international operations, including military actions, trade embargoes, epidemics or pandemics or changes to tariffs or trade agreements that could affect customer markets, particularly North African, Russian and Middle Eastern markets and global oil and gas producers, and non-compliance with U.S. export/re-export control, foreign corrupt practice laws, economic sanctions and import laws and regulations; increased aging and slower collection of receivables, particularly in Latin America and other emerging markets; our exposure to fluctuations in foreign currency exchange rates, including in hyperinflationary countries such as Venezuela and Argentina; our furnishing of products and services to nuclear power plant facilities and other critical processes; potential adverse consequences resulting from litigation to which we are a party, such as litigation involving asbestos-containing material claims; expectations regarding acquisitions and the integration of acquired businesses; our relative geographical profitability and its impact on our utilization of deferred tax assets, including foreign tax credits; the potential adverse impact of an impairment in the carrying value of goodwill or other intangible assets; our dependence upon third-party suppliers whose failure to perform timely could adversely affect our business operations; the highly competitive nature of the markets in which we operate; environmental compliance costs and liabilities; potential work stoppages and other labor matters; access to public and private sources of debt financing; our inability to protect our intellectual property in the U.S., as well as in foreign countries; obligations under our defined benefit pension plans; our internal control over financial reporting may not prevent or detect misstatements because of its inherent limitations, including the possibility of human error, the circumvention or overriding of controls, or fraud; the recording of increased deferred tax asset valuation allowances in the future or the impact of tax law changes on such deferred tax assets could affect our operating results; our information technology infrastructure could be subject to service interruptions, data corruption, cyber-based attacks or network security breaches, which could disrupt our business operations and result in the loss of critical and confidential information; ineffective internal controls could impact the accuracy and timely reporting of our business and financial results; and other factors described from time to time in our filings with the Securities and Exchange Commission.

All forward-looking statements included in this news release are based on information available to us on the date hereof, and we assume no obligation to update any forward-looking statement.

The Company reports its financial results in accordance with U.S. generally accepted accounting principles (GAAP). However, management believes that non-GAAP financial measures which exclude certain non-recurring items present additional useful comparisons between current results and results in prior operating periods, providing investors with a clearer view of the underlying trends of the business. Management also uses these non-GAAP financial measures in making financial, operating, planning and compensation decisions and in evaluating the Company's performance. Throughout our materials we refer to non-GAAP measures as “Adjusted.” Non-GAAP financial measures, which may be inconsistent with similarly captioned measures presented by other companies, should be viewed in addition to, and not as a substitute for, the Company’s reported results prepared in accordance with GAAP.


PRELIMINARY CONDENSED CONSOLIDATED STATEMENTS OF INCOME
(Unaudited)

Three Months Ended September 30,

(Amounts in thousands, except per share data)

2020


2019 - As Revised

 
Sales

$

924,301


$

995,709


Cost of sales


(639,092

)


(662,856

)

Gross profit


285,209


332,853


Selling, general and administrative expense


(200,729

)


(230,362

)

Net earnings from affiliates


2,842


2,087


Operating income


87,322


104,578


Interest expense


(14,710

)


(13,981

)

Interest income


673


2,253


Other income (expense), net


(963

)


(8,477

)

Earnings before income taxes


72,322


84,373


Provision for income taxes


(18,672

)


(22,410

)

Net earnings, including noncontrolling interests


53,650


61,963


Less: Net earnings attributable to noncontrolling interests


(2,647

)


(2,121

)

Net earnings attributable to Flowserve Corporation

$

51,003


$

59,842


Net earnings per share attributable to Flowserve Corporation common shareholders:
Basic

$

0.39


$

0.46


Diluted


0.39


0.45


RECONCILIATION OF NON-GAAP MEASURES
(Unaudited)
 

Three Months Ended September 30, 2020

(Amounts in thousands, except per share data)

As Reported (a)


Realignment (1)


Other Items


As Adjusted

 
Sales

$

924,301


$

-


$

-


$

924,301


Gross profit


285,209


(5,659

)


-


290,868


Gross margin


30.9

%


-


-


31.5

%

 
Selling, general and administrative expense


(200,729

)


(1,773

)


(5,856

)

(3)


(193,100

)

 
Operating income


87,322


(7,432

)


(5,856

)


100,610


Operating income as a percentage of sales


9.4

%


-


-


10.9

%

 
Interest and other expense, net


(15,000

)


-


(2,329

)

(4)


(12,671

)

 
Earnings before income taxes


72,322


(7,432

)


(8,185

)


87,939


Provision for income taxes


(18,672

)


(1,552

)

(2)


2,867


(5)


(19,987

)

Tax Rate


25.8

%


-20.9

%


35.0

%


22.7

%

 
Net earnings attributable to Flowserve Corporation

$

51,003


$

(8,984

)

$

(5,318

)

$

65,305


Net earnings per share attributable to Flowserve Corporation common shareholders:
Basic

$

0.39


$

(0.07

)

$

(0.04

)

$

0.50


Diluted


0.39


(0.07

)


(0.04

)


0.50


Basic number of shares used for calculation


130,313


130,313


130,313


130,313


Diluted number of shares used for calculation


130,900


130,900


130,900


130,900


(a) Reported in conformity with U.S. GAAP  
 
Notes:
(1) Represents realignment expense incurred as a result of realignment programs.
(2) Includes tax impact of items above.
(3) Represents Flowserve 2.0 transformation efforts and $1.1 million related to discrete asset write-downs.
(4) Represents below-the-line foreign exchange impacts.
(5) Includes tax impact of items above and $0.4 million benefit related to tax reform.
 
 
RECONCILIATION OF NON-GAAP MEASURES
(Unaudited)
 

Three Months Ended September 30, 2019

(Amounts in thousands, except per share data)

As Revised (a)


Realignment (1)


Other Items


As Adjusted

 
Sales

$

995,709


$

-


$

-


$

995,709


Gross profit


332,853


(3,420

)


-


336,273


Gross margin


33.4

%


-


-


33.8

%

 
Selling, general and administrative expense


(230,362

)


(1,374

)


(5,058

)

(3)


(223,930

)

 
Operating income


104,578


(4,794

)


(5,058

)


114,430


Operating income as a percentage of sales


10.5

%


-


-


11.5

%

 
Interest and other expense, net


(20,205

)


-


(7,802

)

(4)


(12,403

)

 
Earnings before income taxes


84,373


(4,794

)


(12,860

)


102,027


Provision for income taxes


(22,410

)


978


(2)


3,140


(5)


(26,528

)

Tax Rate


26.6

%


20.4

%


24.4

%


26.0

%

 
Net earnings attributable to Flowserve Corporation

$

59,842


$

(3,816

)

$

(9,720

)

$

73,378


Net earnings per share attributable to Flowserve Corporation common shareholders:
Basic

$

0.46


$

(0.03

)

$

(0.07

)

$

0.56


Diluted


0.45


(0.03

)


(0.07

)


0.56


Basic number of shares used for calculation


131,145


131,145


131,145


131,145


Diluted number of shares used for calculation


131,846


131,846


131,846


131,846


Notes:
(1) Represents realignment expense incurred as a result of realignment programs
(2) Includes tax impact of items above
(3) Represents Flowserve 2.0 transformation efforts
(4) Represents below-the-line foreign exchange impacts
(5) Includes tax impact of items above
 
 
PRELIMINARY SEGMENT INFORMATION
(Unaudited)
 
FLOWSERVE PUMP DIVISION

Three Months Ended September 30,

(Amounts in millions, except percentages)

2020


2019 - As Revised

Bookings

$

574.1


$

742.1


Sales


670.2


682.7


Gross profit


210.0


230.4


Gross profit margin


31.3

%


33.7

%

SG&A


126.2


147.1


Segment operating income


86.7


85.5


Segment operating income as a percentage of sales


12.9

%


12.5

%

 
FLOW CONTROL DIVISION

Three Months Ended September 30,

(Amounts in millions, except percentages)

2020


2019 - As Revised

Bookings

$

237.6


$

282.7


Sales


255.2


314.0


Gross profit


78.1


101.8


Gross profit margin


30.6

%


32.4

%

SG&A


47.3


52.5


Segment operating income


30.8


49.2


Segment operating income as a percentage of sales


12.0

%


15.7

%


PRELIMINARY CONDENSED CONSOLIDATED STATEMENTS OF INCOME
(Unaudited)

Nine Months Ended September 30,

(Amounts in thousands, except per share data)

2020 - As Revised


2019 - As Revised

 
Sales

$

2,742,826


$

2,871,517


Cost of sales


(1,921,451

)


(1,931,756

)

Gross profit


821,375


939,761


Selling, general and administrative expense


(675,523

)


(665,625

)

Net earnings from affiliates


9,125


8,057


Operating income


154,977


282,193


Interest expense


(40,608

)


(42,025

)

Interest income


3,571


6,494


Other income (expense), net


7,558


(15,153

)

Earnings before income taxes


125,498


231,509


Provision for income taxes


(59,175

)


(58,607

)

Net earnings, including noncontrolling interests


66,323


172,902


Less: Net earnings attributable to noncontrolling interests


(6,890

)


(6,659

)

Net earnings attributable to Flowserve Corporation

$

59,433


$

166,243


Net earnings per share attributable to Flowserve Corporation common shareholders:
Basic

$

0.46


$

1.27


Diluted


0.45


1.26


RECONCILIATION OF NON-GAAP MEASURES
(Unaudited)
 

Nine Months Ended September 30, 2020

(Amounts in thousands, except per share data)

As Reported (a)


Realignment (1)


Other Items


As Adjusted

 
Sales

$

2,742,826


$

-


$

-


$

2,742,826


Gross profit


821,375


(40,635

)


-


862,010


Gross margin


29.9

%


-


-


31.4

%

 
Selling, general and administrative expense


(675,523

)


(31,681

)


(27,557

)

(3)


(616,285

)

 
Operating income


154,977


(72,316

)


(27,557

)


254,850


Operating income as a percentage of sales


5.7

%


-


-


9.3

%

 
Interest and other expense, net


(29,479

)


-


9,252


(4)


(38,731

)

 
Earnings before income taxes


125,498


(72,316

)


(18,305

)


216,119


Provision for income taxes


(59,175

)


10,146


(2)


(17,664

)

(5)


(51,657

)

Tax Rate


47.2

%


14.0

%


-96.5

%


23.9

%

 
Net earnings attributable to Flowserve Corporation

$

59,433


$

(62,170

)

$

(35,969

)

$

157,572


Net earnings per share attributable to Flowserve Corporation common shareholders:
Basic

$

0.46


$

(0.48

)

$

(0.28

)

$

1.21


Diluted


0.45


(0.47

)


(0.27

)


1.20


Basic number of shares used for calculation


130,413


130,413


130,413


130,413


Diluted number of shares used for calculation


131,068


131,068


131,068


131,068


(a) Reported in conformity with U.S. GAAP


Notes:
(1) Represents realignment expense incurred as a result of realignment programs.
(2) Includes tax impact of items above.
(3) Includes $16.0 million related to Flowserve 2.0 transformation efforts and $11.5 million related to discrete asset write-downs.
(4) Represents below-the-line foreign exchange impacts.
(5) Includes tax impact of items above, $25.4 million related to Italian tax valuation allowance and $2.4 million benefit related to tax reform.
 
 
RECONCILIATION OF NON-GAAP MEASURES
(Unaudited)
 

Nine Months Ended September 30, 2019

(Amounts in thousands, except per share data)

As Revised


Realignment (1)


Other Items


As Adjusted

 
Sales

$

2,871,517


$

-


$

-


$

2,871,517


Gross profit


939,761


(12,783

)


-


952,543


Gross margin


32.7

%


-


-


33.2

%

 
Selling, general and administrative expense


(665,625

)


13,619


(21,044

)

(3)


(658,200

)

 
Operating income


282,193


836


(21,044

)


302,400


Operating income as a percentage of sales


9.8

%


-


-


10.5

%

 
Interest and other expense, net


(50,684

)


-


(13,788

)

(4)


(36,896

)

 
Earnings before income taxes


231,509


836


(34,832

)


265,504


Provision for income taxes


(58,607

)


1,939


(2)


8,603


(5)


(69,149

)

Tax Rate


25.3

%


-231.9

%


24.7

%


26.0

%

 
Net earnings attributable to Flowserve Corporation

$

166,243


$

2,775


$

(26,229

)

$

189,696


Net earnings per share attributable to Flowserve Corporation common shareholders:
Basic

$

1.27


$

0.02


$

(0.20

)

$

1.45


Diluted


1.26


0.02


(0.20

)


1.44


Basic number of shares used for calculation


131,092


131,092


131,092


131,092


Diluted number of shares used for calculation


131,697


131,697


131,697


131,697


Notes:
(1) Represents realignment (expense) income incurred as a result of realignment programs. Income in selling, general and administrative due to gains from the sales of non-strategic manufacturing facilities that are included in our Realignment Programs.
(2) Includes tax impact of items above
(3) Represents Flowserve 2.0 transformation efforts
(4) Represents below-the-line foreign exchange impacts
(5) Includes tax impact of items above
 
 
PRELIMINARY SEGMENT INFORMATION
(Unaudited)
 
FLOWSERVE PUMP DIVISION

Nine Months Ended September 30,

(Amounts in millions, except percentages)

2020


2019 - As Revised

Bookings

$

1,792.3


$

2,253.5


Sales


1,979.9


1,966.8


Gross profit


603.7


653.8


Gross profit margin


30.5

%


33.2

%

SG&A


426.1


419.7


Segment operating income


186.7


242.1


Segment operating income as a percentage of sales


9.4

%


12.3

%


FLOW CONTROL DIVISION

Nine Months Ended September 30,

(Amounts in millions, except percentages)

2020


2019 - As Revised

Bookings

$

807.8


$

942.8


Sales


766.9


908.7


Gross profit


229.1


293.7


Gross profit margin


29.9

%


32.3

%

SG&A


154.9


159.1


Segment operating income


74.2


134.7


Segment operating income as a percentage of sales


9.7

%


14.8

%


PRELIMINARY CONDENSED CONSOLIDATED BALANCE SHEETS
(Unaudited)
 
(Amounts in thousands, except par value) September 30,
2020
December 31,
2019 - As
Revised
 
ASSETS
Current assets:
Cash and cash equivalents

$

921,178


$

670,980


Accounts receivable, net of allowance for expected credit losses of $76,061 and
$53,412, respectively


750,897


795,538


Contract assets, net of allowance for expected credit losses of $3,043 at September 30, 2020


310,130


272,914


Inventories, net


714,489


660,837


Prepaid expenses and other


109,451


106,478


Total current assets


2,806,145


2,506,747


Property, plant and equipment, net of accumulated depreciation of $1,068,613 and
$1,013,207, respectively


551,011


563,564


Operating lease right-of-use assets, net


166,850


186,218


Goodwill


1,204,609


1,193,010


Deferred taxes


32,206


54,879


Other intangible assets, net


171,246


180,805


Other assets, net of allowance for expected credit losses of $97,946 and $101,439, respectively


241,509


253,054


Total assets

$

5,173,576


$

4,938,277


LIABILITIES AND EQUITY
Current liabilities:
Accounts payable

$

428,870


$

447,582


Accrued liabilities


423,117


401,385


Contract liabilities


198,380


221,095


Debt due within one year


8,581


11,272


Operating lease liabilities


34,634


36,108


Total current liabilities


1,093,582


1,117,442


Long-term debt due after one year


1,701,082


1,365,977


Operating lease liabilities


133,348


151,523


Retirement obligations and other liabilities


541,721


530,994


Shareholders’ equity:
Common shares, $1.25 par value


220,991


220,991


Shares authorized – 305,000
Shares issued – 176,793
Capital in excess of par value


499,561


501,045


Retained earnings


3,625,291


3,652,244


Treasury shares, at cost – 46,775 and 46,262 shares, respectively


(2,059,666

)


(2,051,583

)

Deferred compensation obligation


6,100


8,334


Accumulated other comprehensive loss


(618,856

)


(584,292

)

Total Flowserve Corporation shareholders' equity


1,673,421


1,746,739


Noncontrolling interests


30,422


25,602


Total equity


1,703,843


1,772,341


Total liabilities and equity

$

5,173,576


$

4,938,277


Contacts

Investor Contacts:
Jay Roueche, Vice President, Investor Relations & Treasurer, (972) 443-6560
Mike Mullin, Director, Investor Relations, (972) 443-6636

Media Contact:
Lars Rosene, Vice President, Corporate Communications & Public Affairs, (972) 443-6644


Read full story here
LONDON--(BUSINESS WIRE)--#GlobalWellTestingServicesMarket--Technavio has been monitoring the well testing services market and it is poised to grow by USD 1.53 billion during 2020-2024, progressing at a CAGR of almost 4% during the forecast period. The report offers an up-to-date analysis regarding the current market scenario, latest trends and drivers, and the overall market environment. Download a Free Sample Report on COVID-19


Impact of COVID-19

The COVID-19 pandemic continues to transform the growth of various industries, however, the immediate impact of the outbreak is varied. While a few industries will register a drop in demand, numerous others will continue to remain unscathed and show promising growth opportunities. COVID-19 will have a low impact on the well testing services market. The market growth in 2020 is likely to increase compared to market growth in 2019.

Frequently Asked Questions:

  • Based on segmentation by Application, which is the leading segment in the market?
    Onshore.
  • What are the major trends in the market?
    Growing adoption of IoT by oil and gas industry.
  • At what rate is the market projected to grow?
    The market is projected to grow at a CAGR of almost 4% during 2020-2024.
  • Who are the top players in the market?
    Baker Hughes Co., Halliburton Co., MB Petroleum Services LLC, Minerals Technologies Inc., Oil States International Inc., Schlumberger Ltd., SGS SA, TechnipFMC Plc, TETRA Technologies Inc., and Weatherford International Plc are the top players in the market.
  • What are the key market drivers and challenges?
    The market is driven by the increase in rig count. However, volatile crude oil prices might hamper growth.

Buy 1 Technavio report and get the second for 50% off. Buy 2 Technavio reports and get the third for free.

View market snapshot before purchasing

The market is fragmented, and the degree of fragmentation will accelerate during the forecast period. Baker Hughes Co., Halliburton Co., MB Petroleum Services LLC, Minerals Technologies Inc., Oil States International Inc., Schlumberger Ltd., SGS SA, TechnipFMC Plc, TETRA Technologies Inc., and Weatherford International Plc are some of the major market participants. Although the increase in rig count will offer immense growth opportunities, volatile crude oil prices are likely to pose a challenge for the market vendors. In a bid to help players strengthen their market foothold, this well testing services market forecast report provides a detailed analysis of the leading market vendors. The report also empowers industry honchos with information on the competitive landscape and insights into the different product offerings offered by various companies.

Technavio's custom research reports offer detailed insights on the impact of COVID-19 at an industry level, a regional level, and subsequent supply chain operations. This customized report will also help clients keep up with new product launches in direct & indirect COVID-19 related markets, upcoming vaccines and pipeline analysis, and significant developments in vendor operations and government regulations.

Well Testing Services Market 2020-2024: Segmentation

Well Testing Services Market is segmented as below:

  • Application
    • Onshore
    • Offshore
  • Geography
    • North America
    • APAC
    • Europe
    • MEA
    • South America

To learn more about the global trends impacting the future of market research, download a free sample: https://www.technavio.com/talk-to-us?report=IRTNTR43970

Well Testing Services Market 2020-2024: Scope

Technavio presents a detailed picture of the market by the way of study, synthesis, and summation of data from multiple sources. The well testing services market report covers the following areas:

  • Well Testing Services Market Size
  • Well Testing Services Market Trends
  • Well Testing Services Market Industry Analysis

This study identifies the growing adoption of IoT by oil and gas industry as one of the prime reasons driving the Well Testing Services Market growth during the next few years.

Technavio suggests three forecast scenarios (optimistic, probable, and pessimistic) considering the impact of COVID-19. Technavio’s in-depth research has direct and indirect COVID-19 impacted market research reports.

Register for a free trial today and gain instant access to 17,000+ market research reports.

Technavio's SUBSCRIPTION platform

Well Testing Services Market 2020-2024: Key Highlights

  • CAGR of the market during the forecast period 2020-2024
  • Detailed information on factors that will assist well testing services market growth during the next five years
  • Estimation of the well testing services market size and its contribution to the parent market
  • Predictions on upcoming trends and changes in consumer behavior
  • The growth of the well testing services market
  • Analysis of the market’s competitive landscape and detailed information on vendors
  • Comprehensive details of factors that will challenge the growth of well testing services market vendors

Table of Contents:

Executive Summary

Market Landscape

  • Market ecosystem
  • Value chain analysis

Market Sizing

  • Market definition
  • Market segment analysis
  • Market size 2019
  • Market outlook: Forecast for 2019 – 2024

Five Forces Analysis

  • Five forces summary
  • Bargaining power of buyers
  • Bargaining power of suppliers
  • Threat of new entrants
  • Threat of substitutes
  • Threat of rivalry
  • Market condition

Market Segmentation by Application

  • Market segments
  • Comparison by Application
  • Onshore - Market size and forecast 2019-2024
  • Offshore - Market size and forecast 2019-2024
  • Market opportunity by Application

Customer landscape

  • Customer landscape

Geographic Landscape

  • Geographic segmentation
  • Geographic comparison
  • North America - Market size and forecast 2019-2024
  • APAC - Market size and forecast 2019-2024
  • Europe - Market size and forecast 2019-2024
  • MEA - Market size and forecast 2019-2024
  • South America - Market size and forecast 2019-2024
  • Key leading countries
  • Market opportunity by geography
  • Market drivers
  • Market challenges
  • Market trends

Vendor Landscape

  • Vendor landscape
  • Landscape disruption
  • Competitive scenario

Vendor Analysis

  • Vendors covered
  • Market positioning of vendors
  • Baker Hughes Co.
  • Halliburton Co.
  • MB Petroleum Services LLC
  • Minerals Technologies Inc.
  • Oil States International Inc.
  • Schlumberger Ltd.
  • SGS SA
  • TechnipFMC Plc
  • TETRA Technologies Inc.
  • Weatherford International Plc

Appendix

  • Scope of the report
  • Currency conversion rates for US$
  • Research methodology
  • List of abbreviations

About Us

Technavio is a leading global technology research and advisory company. Their research and analysis focuses on emerging market trends and provides actionable insights to help businesses identify market opportunities and develop effective strategies to optimize their market positions. With over 500 specialized analysts, Technavio’s report library consists of more than 17,000 reports and counting, covering 800 technologies, spanning across 50 countries. Their client base consists of enterprises of all sizes, including more than 100 Fortune 500 companies. This growing client base relies on Technavio’s comprehensive coverage, extensive research, and actionable market insights to identify opportunities in existing and potential markets and assess their competitive positions within changing market scenarios.


Contacts

Technavio Research
Jesse Maida
Media & Marketing Executive
US: +1 844 364 1100
UK: +44 203 893 3200
Email: This email address is being protected from spambots. You need JavaScript enabled to view it.
Website: www.technavio.com/

ANNAPOLIS, Md.--(BUSINESS WIRE)--$HASI #earnings--Hannon Armstrong Sustainable Infrastructure Capital, Inc. ("Hannon Armstrong," "we," "our" or the "Company") (NYSE: HASI), a leading investor in climate change solutions, today reported results for the third quarter of 2020.


Recent Highlights

  • Delivered $0.78 GAAP EPS on a fully diluted basis through the first three quarters in 2020, compared with $0.54 in the same period in 2019
  • Delivered $1.19 Core EPS (pre-CECL provision) and $1.12 Core EPS on a fully diluted basis year-to-date in 2020, compared to $1.01 Core EPS in the same period in 2019
  • Lowered weighted-average cost of debt and extended weighted-average maturity through issuance of $375 million of unsecured green bonds with 10-year maturity and a 3.75% coupon and $144 million of convertible green bonds with a 3-year maturity and a 0% coupon
  • Reported $24.6 million of GAAP Net Investment Income and $67.2 million of Core Net Investment Income through the first three quarters of 2020
  • Closed $716 million of transactions in the quarter, compared to $287 million in the same period in 2019
  • Closed $1.1 billion of transactions through the first three quarters of 2020, compared to $810 million in the same period in 2019
  • Declared quarterly dividend of $0.34 per share payable in January 2021
  • Joined the Partnership for Carbon Accounting Financials
  • Estimated that 1.2 million metric tons of annual carbon emissions will be avoided annually by our transactions closed this quarter, equating to a CarbonCount® score of 1.67 metric tons per $1,000 invested

"Since the global pandemic and resulting economic recession erupted in March, we have raised and committed to invest over $1 billion of capital in climate change solutions - all while our existing portfolio continues to perform and generate historically strong earnings," said Jeffrey W. Eckel, Hannon Armstrong Chairman and Chief Executive Officer.

"In addition, we have continued our leadership on ESG. With our recently announced membership in the Partnership for Carbon Accounting Financials, we have joined with over 70 financial institutions to help drive the development of a global and transparent standard on financed emissions that will finally enable investors to measure the efficiency with which their capital is reducing carbon emissions and mitigating climate change."

A summary of our results is shown in the tables below:


For the three months ended
September 30, 2020


For the three months ended
September 30, 2019


$ in thousands


Per Share
(Diluted)


$ in thousands


Per Share
(Diluted)

GAAP Net Income

$

21,175


$

0.28


$

9,102


$

0.13


Core Earnings (1)

25,288


0.33


25,284


0.38


(1)

Includes a provision for loss on receivables of $2 million related to the new credit loss standard, which we may refer to in this press release as CECL or Topic 326. On a pre-CECL provision basis comparable to last year, the per share core earnings are $0.36 for the three months ended September 30, 2020. A reconciliation of our GAAP net income to core earnings is included in this press release.


For the nine months ended
September 30, 2020


For the nine months ended
September 30, 2019


$ in thousands


Per Share (Diluted)


$ in thousands


Per Share (Diluted)

GAAP Net Income

$

57,491


$

0.78


$

35,487


$

0.54


Core Earnings (1)

82,546


1.12


65,990


1.01


(1)

Includes a provision for loss on receivables of $6 million for the adoption of CECL. On a pre-CECL provision basis comparable to last year, the per share core earnings are $1.19 for the nine months ended September 30, 2020. A reconciliation of our GAAP net income to core earnings is included in this press release.

Financial Results

"In the third quarter, we capitalized on favorable market conditions and our leading ESG position to raise over $500 million in ten-year unsecured and three-year convertible green bonds at the lowest coupons in our company's history," said Hannon Armstrong Chief Financial Officer Jeffrey A. Lipson.

"With over $880 million in available cash on our balance sheet, we remain well-positioned to fund our forward flow investment commitments in addition to other anticipated growth opportunities."

Comparison of the three months ended September 30, 2020 to the same period in 2019

Total revenue increased by approximately $10 million, or 25%. Gain on sale and fee income increased by approximately $6 million and interest and rental income increased by approximately $4 million. These increases were primarily driven by a larger portfolio of higher yielding assets as well as a change in the mix of assets being securitized.

Interest expense increased approximately $10 million, or 58%, primarily as a result of a higher outstanding balance, including $775 million in unsecured debt raised in the second and third quarters. We recorded an approximate $2 million provision for loss on receivables, in accordance with the new CECL standard, as opposed to realized losses on the portfolio. In the same period last year, we recorded an $8 million provision on two commercial receivables that were previously placed on non-accrual. Other expenses (compensation and benefits and general and administrative expenses) increased by $2 million primarily due to an increase in our employee headcount and incentive compensation.

For the quarter, we recognized $17 million in income using the hypothetical liquidation at book value method (HLBV) for our equity method investments, compared to $6 million of HLBV income in the same period last year as a result of tax attribute allocations which had the impact of increasing our allocation of earnings.

Income tax expense increased by $2 million primarily as a result of an increase in income from our portfolio and the recognition of tax benefits in the prior year that did not recur.

GAAP net income for the three months was $21 million, an increase of $12 million, or 133% compared to the same period in the prior year. Core earnings for the three months was $25 million, equal to core earnings from the same period in prior year.

A reconciliation of our GAAP net income to core earnings is included in this press release.

Leverage

The calculation of our fixed-rate debt and leverage ratios as of September 30, 2020 and 2019 are shown in the chart below:


September 30,
2020


% of Total


September 30,
2019


% of Total


($ in millions)


($ in millions)


Floating-rate borrowings (1)

$

23


1

%


$

38


3

%

Fixed-rate debt (2)

2,168


99

%


1,318


97

%

Total

$

2,191


100

%


$

1,356


100

%

Leverage (3)

2.0 to 1


1.5 to 1


(1)

Floating-rate borrowings include borrowings under our floating-rate credit facilities.

(2)

Fixed-rate debt also includes the present notional value of non-recourse debt that is hedged using interest rate swaps. Debt excludes securitizations that are not consolidated on our balance sheet.

(3)

Leverage, as measured by our debt-to-equity ratio. This calculation excludes securitizations that are not consolidated on our balance sheet (where the collateral is generally financing receivables with U.S. government obligors).

Portfolio

Our Portfolio totaled approximately $2.2 billion as of September 30, 2020, which included approximately $1.3 billion of behind-the-meter assets and approximately $0.9 billion of grid-connected assets. The following is an analysis of the performance our Portfolio as of September 30, 2020:


Portfolio Performance


1 (1)


2 (2)


3 (3)


Total


(dollars in millions)


Government


Commercial


Government


Commercial


Government


Commercial


Total receivables

251


862


10


8


1,131


Less: Allowance for loss on receivables


(19

)


(4

)


(8

)


(31

)


Net receivables (4)

251


843


6


1,100


Investments

36


16


52


Real estate


360


360


Equity method (5)

investments


695


24


719


Total

$

287


$

1,914


$


$

30


$


$


$

2,231


Percent of Portfolio

13

%


86


%


%


1


%


%


%


100


%

Average remaining balance (6)

$

7


$

12


$


$

11


$


$

4


$

11


(1)

This category includes our assets where based on our credit criteria and performance to date, we believe that our risk of not receiving our invested capital remains low.

(2)

This category includes our assets where based on our credit criteria and performance to date, we believe there is a moderate level of risk to not receiving some or all of our invested capital.

(3)

This category includes our assets where based on our credit criteria and performance to date, we believe there is substantial doubt regarding our ability to recover some or all of our invested capital. Included in this category are two commercial receivables with a combined total carrying value of approximately $8 million as of September 30, 2020 which we consider impaired and have held on non-accrual status since 2017. We recorded an allowance for the entire asset amounts as described in our Annual Report on Form 10-K filed with the SEC on February 25, 2020. We expect to continue to pursue our legal claims with regards to these assets.

(4)

Total reconciles to the total of the government receivables and commercial receivables lines of the consolidated balance sheets.

(5)

Some of the individual projects included in portfolios that make up our equity method investments have government off takers. As they are part of large portfolios, they are not classified separately.

(6)

Average remaining balance is calculated gross of allowance for loss on receivables and excludes approximately 145 transactions each with outstanding balances that are less than $1 million and that in the aggregate total $58 million.

Guidance

The Company expects that annual core earnings per share in 2020 (pre-CECL provision) will exceed the previously communicated guidance midpoint of $1.43, reflecting 2018 to 2020 annual Core EPS growth above the midpoint of the 2% to 6% from the 2017 baseline. This guidance reflects the Company’s estimates of (i) yield on its existing Portfolio; (ii) yield on incremental Portfolio investments, inclusive of the Company’s existing pipeline; (iii) the volume and profitability of securitization transactions; (iv) amount, timing, and costs of debt and equity capital to fund new investments; (v) changes in costs and expenses reflective of the Company’s forecasted operations, (vi) the ongoing impact of the current outbreak of COVID-19 and (vii) the general interest rate and market environment. All guidance is based on current expectations of the future impact of COVID-19 and the economic conditions, the regulatory environment, the dynamics of the markets in which we operate and the judgment of the Company’s management team. The Company has not provided GAAP guidance as discussed in the Forward-Looking Statements section of this press release.

Dividend

The Company is announcing today that its Board of Directors approved a quarterly cash dividend of $0.34 per share of common stock. This dividend will be paid on January 8, 2021, to stockholders of record as of December 28, 2020.

Conference Call and Webcast Information

Hannon Armstrong will host an investor conference call today, Thursday, November 5, 2020, at 5:00 p.m. eastern time. The conference call can be accessed live over the phone by dialing 1-866-652-5200 or for international callers, 1-412-317-6060. Please ask to be connected to the Hannon Armstrong call. A replay will be available two hours after the call and can be accessed by dialing 1-877-344-7529, or for international callers, 1-412-317-0088. The passcode for the replay is 10149196. The replay will be available until November 12, 2020.

Interested investors and other parties may also listen to a simultaneous webcast of the conference call by logging onto the Investor Relations section of the Company's website at www.hannonarmstrong.com. The online replay will be available for a limited time beginning immediately following the call.

About Hannon Armstrong

Hannon Armstrong (NYSE: HASI) is the first U.S. public company solely dedicated to investments in climate change solutions, providing capital to leading companies in energy efficiency, renewable energy, and other sustainable infrastructure markets. With more than $6 billion in managed assets as of September 30, 2020, Hannon Armstrong's core purpose is to make climate-positive investments with superior risk-adjusted returns. For more information, please visit www.hannonarmstrong.com. Follow Hannon Armstrong on LinkedIn and Twitter @HannonArmstrong.

Forward-Looking Statements:

Some of the information contained in this press release is forward-looking statements within the meaning of Section 27A of the Securities Act of 1933, as amended, and Section 21E of the Securities Exchange Act of 1934, as amended that are subject to risks and uncertainties. For these statements, we claim the protections of the safe harbor for forward-looking statements contained in such Sections. These forward-looking statements include information about possible or assumed future results of our business, financial condition, liquidity, results of operations, plans and objectives. When we use the words "believe," "expect," "anticipate," "estimate," "plan," "continue," "intend," "should," "may" or similar expressions, we intend to identify forward-looking statements.

Forward-looking statements are subject to significant risks and uncertainties. Investors are cautioned against placing undue reliance on such statements. Actual results may differ materially from those set forth in the forward-looking statements. Factors that could cause actual results to differ materially from those described in the forward-looking statements include those discussed under the caption “Risk Factors” included in our most recent Annual Report on Form 10-K as well as in other periodic reports that we file with the U.S. Securities and Exchange Commission (the "SEC").

Other important factors that we think could cause our actual results to differ materially from expected results are summarized below, including the ongoing impact of the current outbreak of the novel coronavirus (COVID-19), on the U.S., regional and global economies, the U.S. sustainable infrastructure market and the broader financial markets. The current outbreak of COVID-19 has also impacted, and is likely to continue to impact, directly or indirectly, many of the other important factors below and the risks described in the Form 10-K and in our subsequent filings under the Securities Exchange Act of 1934, as amended. Other factors besides those listed could also adversely affect us. In addition, we cannot assess the impact of each factor on our business or the extent to which any factor, or combination of factors, may cause actual results to differ materially from those contained in any forward-looking statements. In particular, it is difficult to fully assess the impact of COVID-19 at this time due to, among other factors, uncertainty regarding the severity and duration of the outbreak domestically and internationally, uncertainty regarding the effectiveness of federal, state and local governments’ efforts to contain the spread of COVID-19 and respond to its direct and indirect impact on the U.S. economy and economic activity.

Statements regarding the following subjects, among others, may be forward-looking:

  • negative impacts from continued spread of COVID-19, including on the U.S. or global economy or on our business, financial position or results of operations;
  • our expected returns and performance of our investments;
  • the state of government legislation, regulation and policies that support or enhance the economic feasibility of projects that reduce carbon emissions or increase resilience to climate change, which we refer to as climate change solutions, including energy efficiency and renewable energy projects and the general market demands for such projects;
  • market trends in our industry, energy markets, commodity prices, interest rates, the debt and lending markets or the general economy;
  • our business and investment strategy;
  • availability of opportunities to invest in climate change solutions including energy efficiency and renewable energy projects and our ability to complete potential new opportunities in our pipeline;
  • our relationships with originators, investors, market intermediaries and professional advisers;
  • competition from other providers of capital;
  • our or any other company’s projected operating results;
  • actions and initiatives of the federal, state and local governments and changes to federal, state and local government policies, regulations, tax laws and rates and the execution and impact of these actions, initiatives and policies;
  • the state of the U.S. economy generally or in specific geographic regions, states or municipalities and economic trends;
  • our ability to obtain and maintain financing arrangements on favorable terms, including securitizations;
  • general volatility of the securities markets in which we participate;
  • the credit quality of our assets;
  • changes in the value of our assets, our portfolio of assets and our investment and underwriting process;
  • the impact of weather conditions, natural disasters, accidents or equipment failures or other events that disrupt the operation of our investments or negatively impact the value of our assets;
  • rates of default or decreased recovery rates on our assets;
  • interest rate and maturity mismatches between our assets and any borrowings used to fund such assets;
  • changes in interest rates and the market value of our assets and target assets;
  • changes in commodity prices, including continued low natural gas prices;
  • effects of hedging instruments on our assets or liabilities;
  • the degree to which our hedging strategies may or may not protect us from risks, such as interest rate volatility;
  • impact of and changes in accounting guidance;
  • our ability to maintain our qualification as a real estate investment trust for U.S. federal income tax purposes;
  • our ability to maintain our exemption from registration under the Investment Company Act of 1940, as amended;
  • availability of and our ability to attract and retain qualified personnel;
  • estimates relating to our ability to generate sufficient cash in the future to operate our business and to make distributions to our stockholders; and
  • our understanding of our competition.

The risks included here are not exhaustive. Forward-looking statements are based on beliefs, assumptions and expectations as of the date of this press release. Any forward- looking statement speaks only as of the date on which it is made. New risks and uncertainties arise over time, and it is not possible for us to predict those events or how they may affect us. Except as required by law, we are not obligated to, and do not intend to, update or revise any forward-looking statements after the date of this earnings release, whether as a result of new information, future events or otherwise.

The Company has not provided GAAP guidance as forecasting a comparable GAAP financial measure, such as net income, would require that the Company apply the HLBV method to these investments. In order to forecast under the HLBV method, the Company would be required to make various assumptions related to expected changes in the net asset value of the various entities and how such changes would be allocated under HLBV. GAAP HLBV earnings over a period of time are very sensitive to these assumptions especially in regard to when a partnership transaction flips and thus the liquidation scenarios change materially. The Company believes that these assumptions would require unreasonable efforts to complete and if completed, the wide variation in projected GAAP earnings based upon a range of scenarios would not be meaningful to investors. Accordingly, the Company has not included a GAAP reconciliation table related to any core earnings guidance.

Estimated carbon savings are calculated using the estimated kilowatt hours, gallons of fuel oil, million British thermal units of natural gas and gallons of water saved as appropriate, for each project. The energy savings are converted into an estimate of metric tons of CO2 equivalent emissions based upon the project’s location and the corresponding emissions factor data from the U.S. Government and International Energy Agency. Portfolios of projects are represented on an aggregate basis.

HANNON ARMSTRONG SUSTAINABLE INFRASTRUCTURE CAPITAL, INC.

CONDENSED CONSOLIDATED STATEMENTS OF OPERATIONS

(DOLLARS IN THOUSANDS, EXCEPT PER SHARE DATA)


For the Three Months
Ended September 30,


For the Nine Months
Ended September 30,


2020


2019


2020


2019

Revenue


Interest income

$

23,508


$

19,322


$

71,046


$

54,270


Rental income

6,469


6,469


19,408


19,415


Gain on sale of receivables and investments

13,628


7,713


34,449


16,718


Fee income

4,984


5,338


13,115


12,850


Total revenue

48,589


38,842


138,018


103,253


Expenses


Interest expense

26,085


16,561


65,884


46,861


Provision for loss on receivables

2,458


8,027


5,629


8,027


Compensation and benefits

9,012


7,193


27,223


21,281


General and administrative

3,918


3,737


11,181


10,818


Total expenses

41,473


35,518


109,917


86,987


Income before equity method investments

7,116


3,324


28,101


16,266


Income (loss) from equity method investments

16,506


5,984


32,505


18,114


Income (loss) before income taxes

23,622


9,308


60,606


34,380


Income tax (expense) benefit

(2,345

)


(132

)


(2,860

)


1,298


Net income (loss)

$

21,277


$

9,176


$

57,746


$

35,678


Net income (loss) attributable to non-controlling interest holders

102


74


255


191


Net income (loss) attributable to controlling stockholders

$

21,175


$

9,102


$

57,491


$

35,487


Basic earnings (loss) per common share

$

0.28


$

0.14


$

0.80


$

0.55


Diluted earnings (loss) per common share

$

0.28


$

0.13


$

0.78


$

0.54


Weighted average common shares outstanding—basic

74,012,788


64,922,325


71,376,004


63,492,884


Weighted average common shares outstanding—diluted

76,131,252


65,630,711


72,644,626


64,147,835


HANNON ARMSTRONG SUSTAINABLE INFRASTRUCTURE CAPITAL, INC.

CONDENSED CONSOLIDATED BALANCE SHEETS

(DOLLARS IN THOUSANDS, EXCEPT PER SHARE DATA)


September 30,
2020


December 31,
2019

Assets


Cash and cash equivalents

$

881,487


$

6,208


Equity method investments

718,793


498,631


Government receivables

250,914


263,175


Commercial receivables, net of allowance of $31 million and $8 million, respectively

848,520


896,432


Real estate

359,948


362,265


Investments

51,638


74,530


Securitization assets

146,549


123,979


Other assets

86,649


162,054


Total Assets

$

3,344,498


$

2,387,274


Liabilities and Stockholders’ Equity


Liabilities:


Accounts payable, accrued expenses and other

$

56,843


$

54,351


Credit facilities

22,565


31,199


Non-recourse debt (secured by assets of $724 million and $921 million, respectively)

599,958


700,225


Senior unsecured notes

1,278,844


512,153


Convertible notes

288,551


149,434


Total Liabilities

2,246,761


1,447,362


Stockholders’ Equity:


Preferred stock, par value $0.01 per share, 50,000,000 shares authorized, no shares issued and outstanding


Common stock, par value $0.01 per share, 450,000,000 shares authorized, 74,252,973 and 66,338,120 shares issued and outstanding, respectively

743


663


Additional paid in capital

1,282,744


1,102,303


Accumulated deficit

(202,914

)


(169,786

)


Accumulated other comprehensive income (loss)

11,474


3,300


Non-controlling interest

5,690


3,432


Total Stockholders’ Equity

1,097,737


939,912


Total Liabilities and Stockholders’ Equity

$

3,344,498


$

2,387,274


Contacts

Investor Relations Contact:

Chad Reed
This email address is being protected from spambots. You need JavaScript enabled to view it.
410-571-6189

Media Contact:

Gil Jenkins
This email address is being protected from spambots. You need JavaScript enabled to view it.
443-321-5753


Read full story here
Offshore Source Logo

Offshore Source keeps you updated with relevant information concerning the Offshore Energy Sector.

Any views or opinions represented on this website belong solely to the author and do not represent those of the people, institutions or organizations that Offshore Source or collaborators may or may not have been associated with in a professional or personal capacity, unless explicitly stated.

Corporate Offices

Technology Systems Corporation
8502 SW Kansas Ave
Stuart, FL 34997

info@tscpublishing.com