

Exploration started with a bang in 2019 with a frontier discovery by a Total led joint venture at Brulpadda in South Africa, which follows the hugely successful play opening Liza discovery in Guyana in 2015 by an Exxon led JV.
 Both discoveries included partners who had paid a premium via a farm-in to participate in the well. These high-profile successes for the farm-out model should catalyze a recovery in the global farm-out market.
Outside North America, the number of conventional exploration farm-outs completed declined by ~45% from 106 in 2014 to a low of 57 in 2016. The market has since been recovering with 61 deals in 2017, and 71 in 2018 but the market remains well below the norm prior to the oil price crash.
Signs of recovery in the conventional exploration farm-out market
As activity levels fell, companies have also paid less to farm-in. Companies are paying on average half the cost to access an offshore drilling opportunity in 2018 compared to 2014. This reflects both lower levels of promote, the proportion above their equity interest that companies are willing to pay to access a drilling opportunity, and lower well costs. Promotes paid in the offshore market fell from an average of 2 in 2014 to a low of 1.5 in 2016/17 before recovering to 1.8 in 2018 suggesting that the offshore market is beginning to recover.
Onshore, promotes are generally higher, due to lower well costs. The 5-year average was 3:1, however, deal activity remains subdued with only ~20 deals per year since 2015. The last commercial frontier onshore discovery subject to farm-in was Ngamia-1, drilled by Tullow in 2012.
Since the start of 2014, 191 companies have been active in the exploration farm-in market. During the 5-year period, the most active farm-in company was Total who completed 15 deals, whilst the most active farm-out company has been Tullow who completed 19. Looking at 2018 in more detail, Figure 2 shows deal flow by net equity earned. Activity during 2018 was dominated by juniors and independent companies. The juniors are net sellers and an important source of drilling opportunities for the sector. Independents and majors were net buyers and trading across the peer groups.
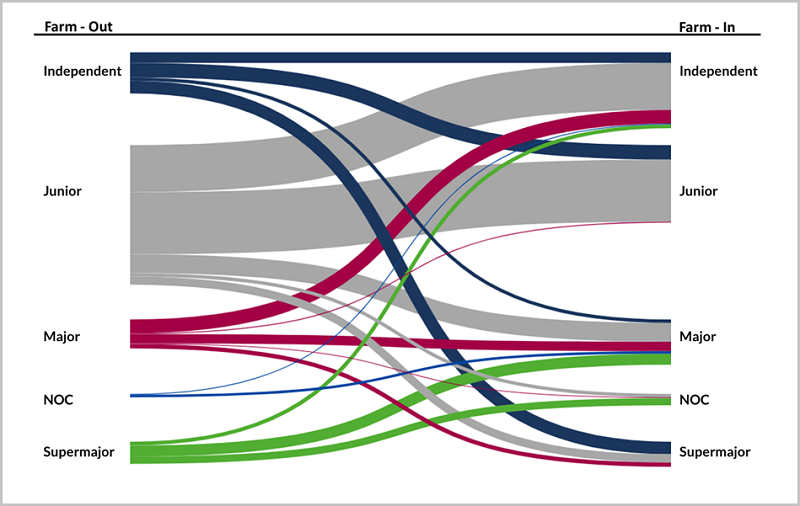 Figure 2 Sankey diagram showing the net exploration farm-out by deal flow during 2018. Colors indicate where a company peer group has farmed out to. Companies have been divided into 5 peer groups based on market capitalization.
Source: Westwood Farm-Outs
Higher oil prices, cheaper deal terms, and recent large farm-in discoveries are all positives for the farm-out market. It remains to be seen how strong this recovery will be and to what extent the cost of farming-in may start to rebound. With a mean duration of ~500 days between an opportunity coming to market and a deal being completed, and then a further ~300 days before an exploration well is drilled, the quality of today’s farm-in opportunity set will not become fully apparent for at least another two years.
Vikesh Mistry, Senior Analyst, Westwood Global Energy Group
