Business Wire News

RICHARDSON, Texas--(BUSINESS WIRE)--EPCOR USA Inc. (EPCOR USA) today announces the expansion of its partnership with VertexOne, a leading provider of meter-to-cash solutions for utilities across North America. EPCOR USA enters into this new contract to collaborate with VertexOne on a portfolio of solutions over the coming decades. This collaboration supports EPCOR USA‘s continued evolution and modernization to meet changing customer expectations and utility needs.


Under this new contract, EPCOR USA will embark upon a modernization strategy that includes the following VertexOne solutions: VertexOne CIS Essentials™, VertexOne vxField™, VertexOne MeterSmart™, VertexOne WaterSmart™, VertexOne GasSmart™ and enhanced electronic bill presentment and payments. “VertexOne is thrilled to continue this partnership with EPCOR USA as we work alongside their team to upgrade and refine their systems,” said VertexOne President and CEO Andrew Jornod. “This project builds upon our seven-year partnership and extends it past 2030 so we can continue to support EPCOR in meeting their long-term goals.”

EPCOR will be upgrading its current systems to the latest and most modern offerings available with VertexOne to drive success in a variety of areas:

  • Customer Service: EPCOR USA’s 226,000 regulated water, wastewater and natural gas customers will enjoy modern customer self-serve functionality that improves the customers’ experience and is adaptable to changing customer needs
  • Business Processes: EPCOR USA will enhance business processes by adopting industry-leading best practices and technology to deliver integrated customer service in an efficient and effective manner.
  • Digital Transformation: Utility staff and end-customers will have access to the best digital solutions for customer engagement, billing, payments, and data analytics.
  • Optimized Field Work: With VertexOne Field™, dispatchers and field technicians will be better aligned, old paper-based systems will be automated and scheduling of work assignments will be optimized.

“EPCOR is excited to continue our work with the VertexOne team and launch expanded solutions for our customers. We pride ourselves on staying ahead of the game with the latest and greatest technology solutions to provide the best experience for our staff and customers and have been very impressed with VertexOne’s ability to offer just that,” says Sarah Skaggs, Director of Customer Care. “For the past seven years, VertexOne has gone above and beyond to provide excellent service and support. Their team truly serves as an extension of our internal team and continue to demonstrate aligned objectives and dedication to our success.”

"This project will allow for the evolution and transformation of our business practices and will serve as a model for best-practices for utilities across the country. It will result in a flexible and user-centric set of systems that improves internal and external services through more efficient processes,” continues Skaggs.

As part of the program, EPCOR USA will also serve as a premier development partner for VertexOne GasSmart™, a customer engagement and data analytics platform designed to surface actionable insights and valuable recommendations for gas customers. “We look forward to bringing these best-in-class technologies to EPCOR USA and help them achieve impressive results and elevate both utility staff and end-customer experiences,” shares Jornod.

About EPCOR USA

Headquartered in Phoenix, Arizona, EPCOR USA’s wholly owned subsidiaries build, own and operate water and wastewater and natural gas facilities and infrastructure in the southwestern United States. EPCOR USA provides water, wastewater, wholesale water and natural gas services to approximately 670,000 people across 39 communities and 15 counties in Arizona, New Mexico and Texas. Visit www.epcor.com for more.

About VertexOne

VertexOne is the recognized leader in SaaS platforms for critical business processes of utilities across North America. Through a wide range of innovative services and solutions—including the VertexOne Complete™ SaaS Solution for Utilities comprised of the Customer Information System (CIS), Mobile Workforce Management (MWM), Meter Data Management (MDM), Digital Customer Engagement and Customer Self Service, and now the addition of WaterSmart solutions and services—VertexOne helps utilities more efficiently deliver a compelling customer experience; reducing the cost to serve customers, increasing operational efficiency, improving customer satisfaction, and driving utility operations forward. VertexOne takes on the heavy lifting of keeping current with the rapid pace of technology changes through our VertexOne Complete™ SaaS offering, so utilities don't have to—leaving our customers more time to focus on core utility business while leaving the technology to us. For more information, visit https://www.vertexone.net.


Contacts

Ali Barsamian
This email address is being protected from spambots. You need JavaScript enabled to view it.
925-451-1767

First-of-its-Kind Report Calls for Policies That Reduce Production and Use of Single-Use Plastic

WASHINGTON--(BUSINESS WIRE)--In a report released today, Oceana reveals for the first time the available data on marine mammals and sea turtles swallowing or becoming entangled in plastic in U.S. waters. After surveying dozens of government agencies, organizations and institutions that collect data on the impact of plastic on marine animals, Oceana found evidence of nearly 1,800 animals from 40 different species swallowing or becoming entangled in plastic since 2009. Of those, a staggering 88% were species listed as endangered or threatened with extinction under the Endangered Species Act. Perhaps even more concerning, Oceana says the animals reflected in this report are far fewer than the true number of sea turtles and marine mammals that consume or become entangled in plastic in U.S. waters.


“Before now, the evidence that many U.S. marine mammals and sea turtles were being harmed by plastic was not compiled in one place. While there may never be a complete account of the fate of all marine animals impacted by plastic, this report paints a grim picture. The world is hooked on plastic because the industry continues to find increasingly more ways to force this persistent pollutant into our everyday routines — and it's choking, strangling and drowning marine life,” said Dr. Kimberly Warner, report author and senior scientist at Oceana. “This report shows a wide range of single-use plastic jeopardizing marine animals, and it's not just the items that first come to mind, like bags, balloons and bottle caps. These animals are consuming or being entangled in everything from zip ties and dental flossers to those mesh onion bags you see at the grocery store. We can only expect these cases to increase as the industry continues to push single-use plastic into consumers’ hands.”

Oceana’s report found that plastics affected animals at all life stages, from recently hatched sea turtles to seal mothers with nursing pups. Plastic consumption was the most prevalent problem in the animal cases reviewed, comprising 90% of the total, though entanglement also affected a significant number of marine mammals and sea turtles in heartbreaking, and sometimes gruesome, ways.

A few of the report highlights include:

  • Most of the species that consumed or became entangled in plastic are endangered or threatened, including Hawaiian monk seals, manatees, Steller sea lions and all six species of U.S. sea turtle.
  • In the cases where plastic ingestion was the likely cause of or contributor to death, seven involved just one piece of plastic.
  • Bags, balloons, recreational fishing line, plastic sheeting and food wrappers were the most common types of identifiable plastics consumed by these animals.
  • Plastic packing straps, bags, balloons with strings, and sheeting were the most common items entangling the animals.
  • Some sea turtle groups consumed plastic up to three times more often than average for their species.
  • Some marine mammals, such as the northern fur seal, consumed plastic up to 50 times more often than average for eared seals.
  • Additional items involving entanglement or ingestion included bottle caps, water bottles, straws, plastic chairs, plastic forks, toothbrushes, children’s toys, buckets, bubble wrap, sponges, swim goggles, plastic holiday grass, sandwich bags and polystyrene cups.

The report features case studies from around the U.S., including:

  • In Florida, a Kemp’s ridley sea turtle was found entangled in a plastic bag that had become filled with sand. The plastic bag had wrapped around the animal’s neck, and scientists believe the animal drowned due to the weight of the bag or suffocated from the entanglement.
  • A Florida manatee likely died from the plastic bag, straw, string, pantyhose and fishing line filling its stomach and colon.
  • In Virginia, a female sei whale swallowed a DVD case, which lacerated her stomach and led to gastric ulcers, harming her ability to find food.
  • In New Jersey, a plastic bag was the only item found in the stomach of a dead pygmy sperm whale.
  • In California, a northern elephant seal nursing a dependent pup was found with a packing strap around her neck.
  • In South Carolina, a sea turtle center found almost 60 pieces of plastic that a loggerhead sea turtle defecated during its rehabilitation.

“This report is merely a snapshot of what’s happening to the animals inhabiting plastic-polluted waters around the United States — imagine how great the numbers would be if they included the animals not observed or documented by humans,” said Christy Leavitt, report author and plastics campaign director at Oceana. “Plastic production is expected to quadruple in the coming decades, and if nothing changes, the amount of plastic flowing into the ocean is projected to triple by 2040. The only way to turn off the tap and protect our oceans is for companies to stop producing unnecessary single-use plastic — and that will require national, state and local governments to pass policies ensuring they do.”

Marine animals swallow plastic when they mistake it for food, or inadvertently swallow it while feeding or swimming. Once swallowed, it can obstruct their digestion or lacerate their intestines, and all of this can interfere with their ability to feed and obtain nourishment. These problems can lead to starvation and death. When animals become entangled in plastics, they can drown, choke to death or suffer physical trauma, such as amputation and infection. Entanglement can also lead to malnutrition when it prevents their ability to feed properly.

Scientists now estimate that 15 million metric tons of plastic floods into the ocean every year. That equates to about two garbage trucks’ worth of plastic entering the ocean every minute. The U.S. plays a significant role in this global problem, generating more plastic waste than any other country, according to a 2020 study. Plastic has been found in every corner of the world and has turned up in our drinking water, beer, salt, honey and more. With plastic production growing at a rapid rate, increasing amounts of plastic can be expected to flood our blue planet with devastating consequences.

For Oceana’s report, fact sheet and other materials, please visit USA.Oceana.org/ChokingOnPlastic.

To learn more about Oceana’s campaign to stop plastic pollution, please visit usa.oceana.org/plastics.

Oceana is the largest international advocacy organization dedicated solely to ocean conservation. Oceana is rebuilding abundant and biodiverse oceans by winning science-based policies in countries that control one-third of the world’s wild fish catch. With more than 225 victories that stop overfishing, habitat destruction, pollution, and the killing of threatened species like turtles and sharks, Oceana’s campaigns are delivering results. A restored ocean means that 1 billion people can enjoy a healthy seafood meal, every day, forever. Together, we can save the oceans and help feed the world. Visit USA.Oceana.org to learn more.


Contacts

Melissa Valliant, 410.829.0726, This email address is being protected from spambots. You need JavaScript enabled to view it.
Dustin Cranor, 954.348.1314, This email address is being protected from spambots. You need JavaScript enabled to view it.

Trading of New Common Stock to Commence on NYSE American under Ticker “FTSI” on November 20, 2020

FORT WORTH, Texas--(BUSINESS WIRE)--FTS International, Inc. (NYSE American: FTSI) (“FTSI” or the “Company”) today announced that it has successfully completed its fully consensual financial restructuring and has emerged from Chapter 11.


Michael Doss, Chief Executive Officer, commented, “Today is an important day for FTSI. We have quickly and efficiently completed our financial restructuring and emerge with sufficient cash and revolving credit capacity to deploy stacked fleets, invest in new technology, rebuild working capital and create long-term value for our stakeholders.”

“FTSI is a leader in the pressure pumping space and with the entire organization focused on enhancing the value proposition to our customers, we will continue to set records in operational performance and attract new customer relationships. Our team and our pressure pumping fleet are well-positioned to quickly take advantage of increased customer demand as the world returns to a more normalized environment. I would like to express my gratitude to all of our employees for their dedication during this process, and thank our customers, vendors, and service providers for their continued cooperation and support.”

“The new owners, which include Amundi Pioneer Asset Management, Glendon Capital Management, Wexford Capital, and the Wilks Brothers, have deep industry experience, and understand the value of FTSI and the proposition to our customers and the industry,” continued Mr. Doss. “We expect them to be active partners, who are strongly committed to supporting our company. The proactive transaction agreed to by our equity and debt holders enhances value for all stakeholders and solidifies the company’s prospects for the future—I am proud that FTSI now has one of the cleanest balance sheets of any public, pure-play pressure pumping company.”

As previously announced, the U.S. Bankruptcy Court for the Southern District of Texas, Houston Division confirmed FTSI’s prepackaged plan of reorganization (the “Confirmed Plan”) on November 4, 2020. Pursuant to the Confirmed Plan, FTSI deleveraged its balance sheet by equitizing all prepetition funded debt, resulting in holders of FTSI’s legacy senior notes and term loan collectively holding over 90% of FTSI’s new common stock. Holders of FTSI’s legacy equity interests received approximately 9.4% of FTSI’s new common stock under the Confirmed Plan.

Upon emergence, FTSI expects to have approximately $90 million cash on hand and has entered into a new $40 million asset-based revolving credit facility with Wells Fargo Bank, N.A., as administrative agent and lender, to support working capital needs.

Issuance of Equity and Listing on the NYSE American

In connection with emergence from Chapter 11, all of the Company’s existing equity interests will be cancelled and will cease to exist, effective before the market opens on November 20, 2020. At emergence, approximately 13,687,620 shares of new Class A common stock are outstanding, with 49 million shares authorized at emergence. Shares of the Company’s new Class A common stock will commence trading on the NYSE American under the ticker symbol “FTSI” on November 20, 2020. Additionally, at emergence, approximately 312,306 shares of the Company’s new Class B common stock are outstanding, with 1 million shares of Class B common stock authorized at emergence. Shares of the Company’s new Class B common stock are identical to the shares of the Company’s new Class A common stock, except that such shares will not be listed on any stock exchange.

In addition, 1,555,521 Tranche 1 Warrants exercisable for one share of Class A common stock per Tranche 1 Warrant were issued at emergence at an initial exercise price of $33.04, expiring on November 19, 2023 and 3,888,849 Tranche 2 Warrants exercisable for one share of Class A common stock per Tranche 2 Warrant were issued at emergence at an initial exercise price of $37.14, expiring on November 19, 2023.

Details of the restructuring, the securities issued pursuant to the Confirmed Plan and the debt and other agreements entered into as part of the Plan will be provided in a Form 8-K which can be viewed on the Company’s website or the Securities and Exchange Commission’s (“SEC”) website at www.sec.gov.

Adoption of Rights Agreement

FTSI’s Board of Directors has also approved the adoption of a stockholder rights agreement (the “Rights Agreement”) and declared a dividend distribution of one right (“Right”) for each outstanding share of common stock (both Class A common stock and Class B common stock) outstanding as of the record date. The record date for such dividend distribution is November 30, 2020. The Rights expire, without any further action being required to be taken by FTSI’s Board of Directors, on November 18, 2021.

The adoption of the Rights Agreement is intended to enable all FTSI stockholders to realize the full potential value of their investment in the company and to protect the interests of the Company and its stockholders by reducing the likelihood that any person or group gains control of FTSI through acquisitions from other stockholders, open market accumulation or other tactics (especially in current volatile markets) without paying an appropriate control premium. In addition, the Rights Agreement provides the FTSI Board of Directors with time to make informed decisions that are in the best long-term interests of FTSI and its stockholders and does not deter the FTSI Board of Directors from considering any offer that is fair and otherwise in the best interest of FTSI stockholders. Under the Rights Agreement, the rights generally would become exercisable only if a person or group acquires beneficial ownership of 20% or more of FTSI common stock in a transaction not approved by the FTSI Board of Directors.

Further details of the Rights Agreement will be contained in a Current Report on Form 8-K and in a Registration Statement on Form 8-A that FTSI will be filing with the SEC. These filings will be available on the SEC’s web site at www.sec.gov.

Kirkland & Ellis LLP and Winston & Strawn LLP acted as legal advisors, Lazard Frères & Co, acted as financial advisor, and Alvarez & Marsal North America, LLC acted as restructuring advisor to the Company. Davis Polk & Wardwell LLP acted as legal advisor, and Ducera Partners, LLC and Silver Foundry, LP acted as financial advisor for the ad hoc group of secured noteholders. Stroock & Stroock & Lavan LLP acted as legal counsel to the ad hoc group of term loan lenders.

Court filings and other documents related to the restructuring are available on a separate website administered by the Company’s claims agent, Epiq, at https://dm.epiq11.com/FTSI. For inquiries regarding the Company’s emergence, please call the hotline established by Epiq at (888) 490-0882 (toll-free in the United States and Canada) or (503) 597-5602 (outside the United States).

About FTS International, Inc.

Headquartered in Fort Worth, Texas, FTSI is an independent hydraulic fracturing service company and one of the only vertically integrated service providers of its kind in North America.

To learn more, visit www.FTSI.com

Forward-Looking Statements

This news release contains statements that we believe to be “forward-looking statements” within the meaning of Section 27A of the Securities Act of 1933 and Section 21E of the Securities Exchange Act of 1934. All statements other than historical facts, including, without limitation, statements regarding our future financial position, business strategy, projected revenues, earnings, costs, capital expenditures and debt levels, and plans and objectives of management for future operations, are forward-looking statements. When used in this news release, words such as we “expect,” “intend,” “plan,” “estimate,” “anticipate,” “believe” or “should” or the negative thereof or variations thereon or similar terminology are generally intended to identify forward-looking statements. Such forward-looking statements are subject to risks and uncertainties that could cause actual results to differ materially from those expressed in, or implied by, such statements.

These risks and uncertainties include, but are not limited to: the effects of the Chapter 11 petitions (the “Chapter 11 Cases”) the effects of the Chapter 11 Cases on the Company’s liquidity or results of operations or business prospects; the effects of the Chapter 11 Cases on the Company’s business and the interests of various constituents; further declines in domestic spending by the onshore oil and natural gas industry; continued volatility in oil and natural gas prices; the effect of a loss of, financial distress of, or decline in activity levels of, one or more significant customers; actions of the Organization of the Petroleum Exporting Countries, or OPEC, its members and other state-controlled oil companies relating to oil price and production controls; the Company’s inability to employ a sufficient number of key employees, technical personnel and other skilled or qualified workers; the price and availability of alternative fuels and energy sources; the discovery rates of new oil and natural gas reserves; the availability of water resources, suitable proppant and chemicals in sufficient quantities and pricing for use in hydraulic fracturing fluids; uncertainty in capital and commodities markets and the ability of oil and natural gas producers to raise equity capital and debt financing; potential securities litigation and other litigation and legal proceedings, including arbitration proceedings; the Company’s ability to participate in consolidation opportunities within its industry; the ability to successfully manage the economic and operational challenges associated with a disease outbreak, including epidemics, pandemics, or similar widespread public health concerns, including the COVID-19 pandemic; the ultimate geographic spread, duration and severity of the COVID-19 outbreak, and the effectiveness of actions taken, or actions that may be taken, by governmental authorities to contain such outbreak or treat its impact ; the ultimate duration and impact of geopolitical events that adversely affect the price of oil, including the Saudi-Russia price war earlier this year; and a deterioration in general economic conditions or a weakening of the broader energy industry. We assume no obligation, and disclaim any duty, to update the forward-looking statements in this news release.


Contacts

Lance Turner
Chief Financial Officer
817-862-2000

RIO DE JANEIRO--(BUSINESS WIRE)--#PetroRio--Petro Rio S.A. (the “Company” or “PetroRio”) (B3: PRIO3), following best corporate governance practices, informs its shareholders and the market in general the signing of an agreement with BP Energy do Brasil Ltda. for the acquisition of interests of 35.7% in the BM-C-30 Block (“Wahoo” or “Wahoo Field”) and 60% in the BM-C-32 Block (“Itaipu” or “Itaipu Field”), thus, subject to the necessary approvals, becoming the operator of both pre-salt fields.

Wahoo, with production potential of over 140 million barrels (100% of Wahoo), had oil discoveries in 2008 and carried out formation tests in 2010, and fits precisely in the Company’s value generation strategy. The Wahoo development will allow the Company to create another production cluster, which will share all infrastructure with Frade Field (including the FPSO), enabling the capture of synergies, resulting in significant and sustainable lifting cost reduction, while maintaining high levels of safety and efficiency.

Click here to access the document.


Contacts

Jose Gustavo Costa
This email address is being protected from spambots. You need JavaScript enabled to view it.

Can Provide New or Repowered Locomotives From 44 ft. to 68 ft Frame Length and Up to 2,200 Diesel Gallon Equivalents (DGE) of RNG for 7 to 10 Days from a Mobile Refueler or from Stationary Fueling

BEAUFORT, S.C.--(BUSINESS WIRE)--OptiFuel Systems (“OptiFuel”), a solution provider of zero emission rail, marine and generator products, is now taking orders for a new line of affordable 1,200 hp to 2,400 hp, 100% natural gas freight locomotives. All of the locomotives use OptiFuel’s proprietary, EPA rail certified engine (KOFSG11.9400), which feature 0.00 g-bhp/hr NOx and PM criteria emissions. Powered by 100% RNG/Biomethane, the locomotives can have energy-weighted carbon intensity (CI) value ratings that are 200 to 300% lower than even a 100% battery-electric locomotive powered by renewable energy such as solar or wind. OptiFuel certified rail engine is based on the Cummins ISX12N. Since 2016, the ISX12N onroad engine has been utilized in more than 12,000 Class 8 long-haul trucks. With OptiFuel’s multi-engine configuration and instant stop and start capability, the fleet owner can expect to reduce fuel consumption by 20% to 40%, compared to a standard single engine locomotive configuration.


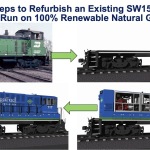
OptiFuel is capable of refurbishing most of the standard switcher and road switcher families (SW, MP, GP, SD, U, B, C, etc.) and lengths from 44 ft to 68 ft with modular components. Multiple modular KOFSG11.9400 engine pods can be incorporated into the overall design of the locomotive to provide for 1,200, 1,600, 2,000, or 2,400 hp. Each engine pod can be replaced within 3 hours with a forklift or crane. Customers have a choice of two different modular electronic controls manufacturers – TMV or Medha – containing the locomotive controls and high-power traction system electronics. Depending on frame size, horsepower, size of onboard fuel storage system, and other options, the estimated cost for a completely refurbished locomotive is $1.7 to $2.4 million and a new locomotive is from $2 to $2.7 million. OptiFuel is also able to provide kits and assembly support, allowing the customer to provide preferred content in the final assembly of the locomotives. OptiFuel also has the ability to work with customers to arrange for leasing options, including dovetailing leases with grant funds, where permissible.

OptiFuel is providing a standard 5 year / 10,000 hours warranty for all engine pods, CNG onboard storage system, and locomotive controls. Total semi-annual and annual maintenance hours for each engine pod is 8 to 10 hours. Just as in onroad use, periods between locomotive engine overhaul are 18,750 to 25,000 hours with overhaul cost of around $20,000 per engine. All parts and supplies for the KOFSG11.9400, as well as the overhaul, can be purchased at any certified Cummins dealer or from OptiFuel. All CNG storage cylinders have a 20 years lifecycle, that may be extended to 30 years.

OptiFuel is providing a variety of mobile or fixed refueling options depending on the operating conditions of a customer’s fleet. Customers can rent or purchase mobile refueling equipment, or OptiFuel can manage the refueling for the customer. For those customers who refuel multiple locomotives from a single refueling site, OptiFuel will provide its proven locomotive CNG fueling station solution (Video Link: https://optifuelsystems.com/media) and expect the CNG to cost between $0.90 to $1.35 per DGE in most deployments. This is well below the 10-year average cost of $2.45 that the Class 1 railroads have paid for diesel. Customers can purchase the refueling station or OptiFuel will cover the cost of the station and manage the refueling for the customer for a fixed DGE cost.

In addition to switcher production, OptiFuel has a U.S. Department of Energy (DOE) grant to demonstrate a zero emission, 4,400 hp line-haul locomotive powered with renewable natural gas (RNG). This program will allow pre-production testing at AAR’s Transportation Technology Center, Inc. (TTCI) and will demonstrate in-service with a regional railroad to validate that OptiFuel’s low-risk, affordable technology can also be applied in the higher horsepower freight and passenger locomotive markets.

“We believe there is a need for locomotives that deliver value and cleaner, more economical solutions simultaneously to railroads, railroad customers, and urban and Environmental Justice communities,” said Scott Myers, President of OptiFuel. “Beyond Tier 5, EPA certified technology is available today. We think that in the next two years there will be a 50-state Low Carbon Fuel Standard (LCFS) program that includes rail and an extension of the existing federal Alternative Fuel Credit program to include rail. These programs, just as in trucking and aviation, will provide RNG to the railroads at a near zero cost and providing them the financial incentive to decarbonize their fleets over the next 15 years.”

About OptiFuel Systems:

OptiFuel is providing zero emissions products (NOx, PM, CO2) for decarbonizing rail, marine, and microgrid power applications with innovative, cost-efficient, and sustainable solutions utilizing advance gaseous fuels and Cummins hybrid power products. In 2021, OptiFuel will be introducing additional zero emissions solutions in the rail, marine and generator markets to replace diesel, powered with negative-carbon RNG.

More information can be learned at https://optifuelsystems.com/


Contacts

Scott D. Myers, OptiFuel Systems LLC - (339) 222-7575, This email address is being protected from spambots. You need JavaScript enabled to view it.

DUBLIN--(BUSINESS WIRE)--The "Floating Solar Panels Market Research Report: By Type (Stationary, Solar Tracking), Location (Onshore, Offshore), Technology (Photovoltaic, Concentrated Solar Power)- Global Industry Analysis and Demand Forecast to 2026" report has been added to ResearchAndMarkets.com's offering.


The major reasons the world is now adopting floating solar panels are that they do away with the need to acquire large tracts of land and the government policies and initiatives that support their usage. Owing to these factors, the floating solar panels market, which generated revenue of $685.2 million in 2019, is predicted to advance to $2,301.8 million by 2026. Such photovoltaic (PV) panels are fixed on top of a buoyant structure, which floats on water.

On the basis of type, the industry is bifurcated into solar-tracking and stationary panels, of which the stationary bifurcation held the larger share in 2019. This is because these variants are not affected much by water currents, and they are also cheaper than solar-tracking panels. Moreover, if a panel is damaged, it is easier and more cost-effective to restructure a stationary variant. This is the reason the stationary bifurcation will keep generating the higher revenue during the forecast period (2020-2026).

The major growth driver for the floating solar panels market advance is that the technology doesn't entail the acquisition of land. Large-scale conventional PV plants require huge areas of land to generate commercially viable electricity. The land can be otherwise used for agricultural and urban development purposes, which has been restraining the growth of the global solar energy market. Thus, to keep the land free for other potential applications, the floating PV technology is being promoted around the world.

The floating solar panels market is also advancing on account of the increasing investments in renewable energy. Huge amounts of greenhouse gases (GHG) are released into the atmosphere during the combustion of gas, crude oil, and coal at power plants for generating electricity. This has been the biggest cause of air pollution, global warming, climate change, and ozone depletion. To curb environmental degradation, sustainability initiatives aimed at utilizing cleaner sources for creating electricity are being taken. This is leading to the increasing investments in renewable technologies, including floating PV plants.

Asia-Pacific (APAC) is the largest floating solar panels market presently, and it is expected to continue being so till 2026. Due to the strong government support for renewable energy, APAC is already the largest producer of solar power in the world. In addition, the strict emission-control regulations, huge demand for land for various purposes, and rising requirement for cheap electricity are driving the installation of PV panels in regional waterbodies. In most of the APAC countries, there is extremely less land to spare, on account of the booming population and expanding cities here.

Companies Mentioned

  • Ciel Et Terre International
  • JA Solar Technology Co. Ltd.
  • JinkoSolar Holding Co. Ltd.
  • Kyocera Corporation
  • Ocean Sun AS
  • Quant Solar
  • Sharp Corporation
  • Sungrow Power Supply Co. Ltd.
  • Swimsol GmbH
  • Tata Power Solar System Ltd.
  • Topper Floating Solar PV Mounting Manufacturer Co. Ltd.

Key Topics Covered:

Chapter 1. Research Scope

Chapter 2. Research Methodology

Chapter 3. Executive Summary

3.1 Global Market Summary

3.2 U.S. Market Summary

3.3 Europe Market Summary

3.4 APAC Market Summary

3.5 ROW Market Summary

Chapter 4. Market Indicators

Chapter 5. Industry Outlook

5.1 Voice of Industry Experts/KOLs

5.2 Market Dynamics

5.2.1 Trends

5.2.2 Drivers

5.2.3 Restraints/challenges

5.2.4 Impact analysis of drivers/restraints

5.3 Value Chain Analysis

5.4 Porter's Five Forces Analysis

5.4.1 Bargaining power of buyers

5.4.2 Bargaining power of suppliers

5.4.3 Intensity of rivalry

5.4.4 Threat of new entrants

5.4.5 Threat of substitutes

Chapter 6. Global Market

6.1 Overview

6.2 Market Volume, by Type (2014-2026)

6.3 Market Revenue, by Type (2014-2026)

6.4 Market Volume, by Location (2014-2026)

6.5 Market Revenue, by Location (2014-2026)

6.6 Market Volume, by Technology (2014-2026)

6.7 Market Revenue, by Technology (2014-2026)

6.8 Market Volume, by Region (2014-2026)

6.9 Market Revenue, by Region (2014-2026)

Chapter 7. U.S. Market

Chapter 8. Europe Market

Chapter 9. APAC Market

Chapter 10. RoW Market

Chapter 11. Competitive Landscape

11.1 List of Market Players and Their Offerings

11.2 Competitive Benchmarking of Key Players

11.3 Recent Strategic Developments

11.3.1 Client wins

11.3.2 Product launches

11.3.3 Partnerships

Chapter 12. Company Profiles

Chapter 13. Appendix

13.1 Abbreviations

13.2 Sources and References

13.3 About the Analyst

13.4 Related Reports

Chapter 14. About the Publisher

For more information about this report visit https://www.researchandmarkets.com/r/1rc2ga


Contacts

ResearchAndMarkets.com
Laura Wood, Senior Press Manager
This email address is being protected from spambots. You need JavaScript enabled to view it.
For E.S.T Office Hours Call 1-917-300-0470
For U.S./CAN Toll Free Call 1-800-526-8630
For GMT Office Hours Call +353-1-416-8900

DALLAS--(BUSINESS WIRE)--Pioneer Natural Resources Company (NYSE:PXD) (“Pioneer” or “the Company”) announced today that its Board of Directors declared a quarterly cash dividend of $0.55 per share on Pioneer’s outstanding common stock. The dividend is payable January 14, 2021, to stockholders of record at the close of business on December 31, 2020.

Pioneer is a large independent oil and gas exploration and production company, headquartered in Dallas, Texas, with operations in the United States. For more information, visit Pioneer’s website at www.pxd.com.


Contacts

Pioneer Natural Resources Contacts:
Investors
Neal Shah – 972-969-3900
Tom Fitter – 972-969-1821
Michael McNamara – 972-969-3592
Greg Wright – 972-969-1770

Media and Public Affairs
Tadd Owens – 972-969-5760

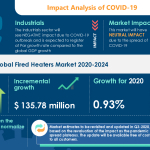
LONDON--(BUSINESS WIRE)--#FiredHeatersMarket--The fired heaters market research report from Technavio indicates neutral growth in the short term as the business impact of COVID-19 spreads.


Get detailed insights on the COVID-19 pandemic Crisis and Recovery analysis of the fired heaters market. Download free report sample

"One of the primary growth drivers for this market is the rise in global oil and gas refinery capacity”, says a senior analyst for Industrials at Technavio.

The rise in oil and gas demand has led to a significant increase in global refinery capacity. Many oil and gas E&P companies are focusing on the addition of new refineries or expanding existing refinery complexes. This is expected to create huge growth opportunities for market players during the forecast period. As the markets recover Technavio expects the fired heaters market size to grow by USD 135.78 million during the period 2020-2024.

Fired Heaters Market Segment Highlights for 2020

  • The fired heaters market is expected to post a year-over-year growth rate of 0.93%.
  • In 2019, the global fired heaters market saw maximum demand for fired heaters from end-users in the oil and gas industry.
  • The growth of the market in the oil and gas segment will be significant during the forecast period.

Regional Analysis

  • 48% of the growth will originate from the APAC region.
  • The growth of the market is driven by capacity expansions in the food and beverage, oil and gas, and chemical industries.
  • China and Japan are the key markets for fired heaters in APAC.

Click here to learn about report detailed analysis and insights on how you can leverage them to grow your business.

Notes:

  • The fired heaters market size is expected to accelerate at a CAGR of about 3% during the forecast period.
  • The fired heaters market is segmented End-user (Oil and gas, Chemicals, and Others).
  • The market is fragmented due to the presence of many/few established vendors holding significant market share.
  • The research report offers information on several market vendors, including Boustead Singapore Ltd., Esteem Projects Pvt. Ltd., Exotherm Corp., Linde AG, Scelerin Heaters LLC, Sigma Thermal Inc., Stelter and Brinck Ltd., Thermax Ltd., UnitBirwelco Ltd., and Wabtec Corp.

Register for a free trial today to access 17,000+ market research reports using Technavio's SUBSCRIPTION platform

About Us

Technavio is a leading global technology research and advisory company. Their research and analysis focuses on emerging market trends and provides actionable insights to help businesses identify market opportunities and develop effective strategies to optimize their market positions. With over 500 specialized analysts, Technavio’s report library consists of more than 17,000 reports and counting, covering 800 technologies, spanning across 50 countries. Their client base consists of enterprises of all sizes, including more than 100 Fortune 500 companies. This growing client base relies on Technavio’s comprehensive coverage, extensive research, and actionable market insights to identify opportunities in existing and potential markets and assess their competitive positions within changing market scenarios.


Contacts

Technavio Research
Jesse Maida
Media & Marketing Executive
US: +1 844 364 1100
UK: +44 203 893 3200
Email: This email address is being protected from spambots. You need JavaScript enabled to view it.
Website: www.technavio.com/

HOUSTON--(BUSINESS WIRE)--Geospace Technologies (NASDAQ: GEOS) today announced a net loss of $19.2 million, or $(1.42) per diluted share, on revenue of $87.8 million for its fiscal year ended September 30, 2020. This compares with a net loss of $146,000, or ($0.01) per diluted share, on revenue of $95.8 million for the comparable year-ago period.


For the fourth quarter ended September 30, 2020, the company reported revenue of $21.5 million and a net loss of $3.9 million, or ($0.29) per diluted share. For the comparable period last year, the company recorded revenue of $28.9 million and net income of $8.7 million, or $0.63 per diluted share.

The company noted that both the 2019 fiscal year and the fourth quarter periods benefited from a $7.0 million gain on the sale of non-essential real estate. Also noted, fiscal year 2020 operating income includes a $0.7 million non-cash charge for goodwill impairment in the company’s oil and gas segment, and a $1.1 million non-cash charge for changes in contingent consideration whereas fiscal year 2019 benefited from a $2.1 million reversal.

Walter R. (“Rick”) Wheeler, President and CEO of Geospace Technologies (the “Company”) said, “The spread of the novel coronavirus that began in late 2019 and early 2020, continues to negatively impact economies around the world. In response to this pandemic, we have continued to maintain our steadfast commitment to the health and safety measures implemented earlier this year. These measures are designed to protect our employees, as well as ensure that we can continue to serve our valued customers in the fashion to which they are accustomed.

Wheeler continued, “Despite the negative impact that COVID-19 has had on each of our business segments, we are pleased to report that our fiscal year 2020 total revenue of $87.8 million remained within 8% of last year’s total, and that we generated over $18 million in cash from operations over the course of the year. Notably, this reported revenue figure does not include any amounts from the sale of a GCL land recording system, valued at $12.5 million, to one of our customers in the second quarter. The purchase included $10 million of financing through a promissory note, and by the end of September 2020, almost $5.0 million had been received toward this system, including interest charges. Principal payment amounts toward this sale are included on our balance sheet as part of non-current deferred revenue, which we intend to recognize at a later date when collection of the note is deemed likely.”

Wheeler further noted, “As was the case throughout the fiscal year, our fourth quarter results continued to be fueled by demand for our OBX ocean-bottom recording systems. Moreover, rental contracts for our OBX marine systems pushed revenue from our wireless exploration products above last year’s mark. This helped to partially offset the reduced demand for our other oil and gas segment products, as well as the lower demand we experienced for products in our adjacent market businesses. The reduced demand was largely brought about by the negative impacts of COVID-19. Efforts to combat this disease have driven down the world’s demand for oil and gas, which has led to the largest supply and demand imbalance we’ve experienced. With a majority of seismic exploration activities currently suspended, demand for our oil and gas products remains limited. In addition, our adjacent markets graphic imaging products have seen similar setbacks. These products are used in the printing processes, merchandizing, and promotions of sports, entertainment, schools, tourism, and other social gathering events. Due to COVID-19, many of these activities have been curtailed, thus lowering demand for these products. In recognition of this lower products and rental demand and in keeping with our conservative management approach, we took steps to address our operating costs with a reduction in force in the third quarter of fiscal year 2020. Although a return to normalcy from these circumstances seems almost certain, the timing and extent of such recovery is unclear.”

Oil and Gas Markets Segment

Combined revenue from the Company’s Oil and Gas Markets segment totaled $14.2 million for the three months ended September 30, 2020. For the full fiscal year, revenue from this segment totaled $61.7 million. This compares with $20.8 million and $65.0 million for the equivalent three- and twelve-month periods a year ago, reflecting respective decreases of 32% and 5%. The decrease for the three-month period stems from lower demand for the Company’s wireless and reservoir seismic products and services, and for the full year period, reduced demand for its traditional and reservoir seismic products. Given the reduction in demand for oil and gas as a consequence of COVID-19, the Company’s Oil and Gas Markets segment will remain challenged as a result of minimal seismic exploration activity.

Revenue contributions to this segment from the Company’s traditional exploration products totaled $1.1 million and $6.7 million respectively for the three-month and full year periods ended September 30, 2020. These reflect an increase of 83% and a decrease of 30% compared to the same periods a year ago. The increase for the three-month period arises from comparing to last year’s historic low figure, while the decrease for the full year period is attributed to a persistent low overall demand for these products brought about by stark reductions in seismic exploration activities for oil and gas.

Segment contributions from the Company’s wireless seismic products totaled $13.0 million and $54.1 million respectively for the three- and twelve-month periods ended September 30, 2020. This equates to a 35% decrease and a 2% increase compared to the corresponding respective year ago periods. The fourth quarter decrease from last year is due to lower sales and rentals of the Company’s wireless products over the narrow three-month period. The full year comparative increase is a result of greater rental revenue during the year from the Company’s OBX marine nodal recording systems, partially offset by lower sales and rentals of its wireless land products. Demand for the Company’s OBX systems is driven by the desire of many oil and gas companies to find new resources near producing fields and to leverage existing offshore assets for their recovery to achieve lower cost. The Company’s rental of OBX systems is not immune from the reduced global demand for oil and gas, as such the Company expects reduced revenue from the rental of OBX systems in fiscal year 2021. Not recognized in the Company’s fiscal year 2020 revenue is the sale of a 30,000 channel GCL wireless land recording system, valued at $12.5 million. Payments received toward the system purchase are included in non-current deferred revenue on the Company’s balance sheet and are intended to be recognized as revenue at a future date when payment of a promissory note on the sale is likely.

The Company’s reservoir seismic products contributed $0.1 million and $0.9 million in total revenue for the three-month and full year periods ended September 30, 2020. This compares with $0.3 million and $2.7 million for the equivalent periods one year earlier, reflecting respective decreases of 56% and 65%. Reductions in engineering services and lower demand for the sale, rental, and repair of the Company’s borehole tools are responsible for the decreases in both periods. Management believes that contracts for the manufacture and deployment of permanent reservoir monitoring (PRM) systems offer the greatest opportunity for meaningful revenue from this product category. The Company has the largest installed base of PRM systems in the world, and offers configurations utilizing high-resolution electromagnetic motion sensors or OptoSeis® fiber optic sensor technology. In the fourth quarter of fiscal year 2020, the Company received a request from a major oil and gas producer to propose on the manufacture and installation of a large-scale seabed PRM system. In the event of a provided response, the potential customer is expected to award a contract in the second or third quarter of fiscal year 2021. If the Company were awarded the contract, revenue from the contract would not likely be recognized until the latter part of fiscal year 2021 and beyond. The Company is also continuing its ongoing discussions with other major oil and gas producers for possible PRM systems.

Adjacent Markets Segment

Combined revenue from the Company’s Adjacent Markets segment totaled $7.1 million and $25.4 million for the three- and twelve-month periods ended September 30, 2020. This compares with $8.0 million and $30.1 million for the equivalent year ago periods, representing decreases of 11% and 16% respectively. Lower sales of the Company’s sensors, cables, and connectors used in non-oil and gas industrial markets, and lower demand for its contract manufacturing services contributed to the decreases in both periods. In addition, reduced sales of the Company’s graphic imaging products further contributed to the comparative decrease over the full year period. In all cases, negative impacts of the COVID-19 pandemic are believed to be the primary cause of lower demand for the Company’s various adjacent markets products. As the effects of COVID-19 are abated, demand for the Company’s adjacent markets products will likely improve, but the extent and timing of possible recovery cannot be determined.

Emerging Markets Segment

The Company’s Emerging Markets segment generated revenue of $177,000 and $734,000 for the three-month and full year periods ended September 30, 2020. This compares with $14,000 and $159,000 for the similar three- and twelve-month periods of the previous year. For both periods, increased revenue is attributed to (i) the sale of border and perimeter security products to a commercial customer and (ii) initial site preparation and engineering related to a U.S. Customs and Border Protection, U.S. Border Patrol contract. Revenue from this $10 million contract, secured in April 2020, is expected to be recognized in the Company’s 2021 fiscal year. The contract is evidence of the Company’s successful execution of strategic diversification. Through its Quantum acquisition and analytics integration, the Company has leveraged its core engineering and manufacturing competencies to create novel products incorporating seismic acoustic technology and advanced analytics. These products provide unique technology solutions to government and commercial customers in the security, industrial, oil and gas, and other markets.

Balance Sheet and Liquidity

For the fiscal year ended September 30, 2020, the Company generated $18.1 million in cash and cash equivalents from operating activities. The Company used $4.1 million of cash for investment activities that included (i) $5.5 million invested in its rental equipment primarily to expand its OBX rental fleet, and (ii) $2.9 million for additions to property, plant, and equipment. These uses were partially offset by (i) $4.1 million of proceeds for the sale of rental equipment, and (ii) $0.2 million of proceeds from the sale of equipment. As of September 30, 2020, the Company had $32.7 million in cash and cash equivalents, and maintained an additional borrowing availability of $17.7 million under its bank credit agreement with no borrowings outstanding. Thus, as of September 30, 2020, the Company’s total liquidity stood at $50.4 million. The Company additionally owns unencumbered property and real estate in both domestic and international locations.

Wheeler concluded, “COVID-19 continues to exert a tight grip on the economies of countries around the world, and until there is a successful vaccine and infection rates consistently decline, there is no way to predict what a recovery will look like. Although the impact of the pandemic on some of our business segments was initially delayed, the negative effects have largely caught up. Seismic exploration activity will remain at a minimum as long as oil and gas supplies outstrip demand, and the lower energy demands brought about in reaction to COVID-19 reinforce this condition. As the businesses of some of our customers suffer from the pandemic’s effects, some of our adjacent market products will see reduced demand. However, much of our current efforts are focused on longer term strategic goals and projects of major customers looking further into the future. This includes oil and gas companies eager to find new reserves near existing assets using our OBX systems, as well as those intending to maximize recoveries of existing fields using our PRM systems. Transcending the pandemic is the critical mission of the U.S. Customs and Border Protection, U.S. Border Patrol, as we fulfill our contract to provide the Department of Homeland Security with a technology solution to protect our borders and society at large. We believe our strong balance sheet with no debt and ample liquidity gives us the fundamental strength to weather this pandemic and emerge on good footing. As such, we believe we are well positioned to leverage our comprehensive engineering and significant manufacturing operation in pursuit of new specialized industrial manufacturing customers and in support of national and homeland security missions. By maintaining our own manufacturing operation, we’ve de-risked our supply chain and enabled rapid time to market for new products, all of which make us highly attractive for partnership and fulfillment of commercial and government contracts. In other matters, I’d like to highlight the recent additions to our Board of Directors of Margaret “Sid” Ashworth, former Vice President of Government Relations for Northrop Grumman, and Kenneth Asbury, former President and CEO of CACI International. The experience each of them bring from such remarkable careers and accomplishments will bring fresh and diverse perspectives to our board and future strategies, creating new value for our shareholders.”

Stock Repurchase Program

The Company also announced that its Board of Directors has authorized a stock repurchase program under which the Company may purchase up to $5 million of its outstanding common stock. Under the repurchase program, the Company may purchase shares of common stock on a discretionary basis from time to time through open market transactions. The timing and number of shares repurchased will depend on a variety of factors, including stock price, trading volume, and general business and market conditions. The repurchase program has no time limit, does not obligate the Company to acquire a specified number of shares and may be modified, suspended or discontinued at any time at the Company’s discretion. The repurchase plan will be funded using existing cash or future cash flow.

Conference Call Information

Geospace Technologies will host a conference call to review its fiscal year 2020 full year financial results on November 20, 2020 at 10:00 a.m. Eastern Time (9 a.m. Central). Participants can access the call at (866) 518-6930 (US) or (203) 518-9797 (International). Please reference the conference ID: GEOSQ420 prior to the start of the conference call. A replay will be available for approximately 60 days and may be accessed through the Investor tab of our website at www.geospace.com.

About Geospace Technologies

Geospace principally designs and manufactures seismic instruments and equipment. We market our seismic products to the oil and gas industry to locate, characterize and monitor hydrocarbon-producing reservoirs. We also market our seismic products to other industries for vibration monitoring, border and perimeter security and various geotechnical applications. We design and manufacture other products of a non-seismic nature, including water meter products, imaging equipment and offshore cables.

Forward Looking Statements

This press release contains “forward-looking statements” within the meaning of Section 27A of the Securities Act of 1933, as amended, and Section 21E of the Securities Exchange Act of 1934, as amended. These forward-looking statements can be identified by terminology such as “may”, “will”, “should”, “intend”, “expect”, “plan”, “budget”, “forecast”, “anticipate”, “believe”, “estimate”, “predict”, “potential”, “continue”, “evaluating” or similar words. Statements that contain these words should be read carefully because they discuss our future expectations, contain projections of our future results of operations or of our financial position or state other forward-looking information. Examples of forward-looking statements include, among others, statements that we make regarding our expected operating results, the results and success of our transactions with Quantum and the OptoSeis® technology, the adoption and sale of our products in various geographic regions, potential tenders for PRM systems, future demand for OBX systems, the completion of new orders for our channels of our GCL system, the fulfillment of customer payment obligations, the impact of the coronavirus (COVID-19) pandemic, the Company’s ability to manage changes and the continued health or availability of management personnel, volatility and development, market position, financial results and the provision of accounting reserves. These forward-looking statements reflect our best judgment about future events and trends based on the information currently available to us. However, there will likely be events in the future that we are not able to predict or control. The factors listed under the caption “Risk Factors” and elsewhere in our most recent Annual Report on Form 10-K which is on file with the Securities and Exchange Commission, as well as other cautionary language in such Annual Report, any subsequent Quarterly Report on the Form 10-Q, or in our other periodic reports, provide examples of risks, uncertainties and events that may cause our actual results to differ materially from the expectations we describe in our forward-looking statements. Such examples include, but are not limited to, the failure of the Quantum or OptoSeis® technology transactions to yield positive operating results, decreases in commodity price levels, which could reduce demand for our products, the failure of our products to achieve market acceptance, despite substantial investment by us, our sensitivity to short term backlog, delayed or cancelled customer orders, product obsolescence resulting from poor industry conditions or new technologies, bad debt write-offs associated with customer accounts, lack of further orders for our OBX systems, failure of our Quantum products to be adopted by the border and security perimeter market, and infringement or failure to protect intellectual property. The occurrence of the events described in these risk factors and elsewhere in our most recent Annual Report on Form 10-K or in our other periodic reports could have a material adverse effect on our business, results of operations and financial position, and actual events and results of operations may vary materially from our current expectations. We assume no obligation to revise or update any forward-looking statement, whether written or oral, that we may make from time to time, whether as a result of new information, future developments or otherwise.

Geospace Technologies Corporation and Subsidiaries

Consolidated Statements of Operations

(In thousands, except share and per share amounts)

(unaudited)


Three Months Ended


Year Ended


September 30, 2020


September 30, 2019


September 30, 2020


September 30, 2019

Revenue:


Products


$

8,561


$

11,390


$

34,136


$

45,847


Rental equipment


12,959


17,549


53,699


49,962


Total revenue


21,520


28,938


87,835


95,809


Cost of revenue:


Products


11,685


13,092


39,970


46,059


Rental equipment


4,869


5,450


24,433


18,322


Total cost of revenue


16,554


18,541


64,403


64,381


Gross profit


4,966


10,397


23,432


31,428


Operating expenses:


Selling, general and administrative


5,301


6,133


23,068


23,626


Research and development


4,034


4,180


16,569


15,495


Goodwill impairment

671


671


Change in estimated fair value of contingent consideration


(534

)


(2,115

)


1,100


(2,115

)

Bad debt expense (recovery)


(343

)


(163

)


63


436


Total operating expenses


9,129


8,035


41,471


37,442


Gain on disposal of property


7,047


7,047


Income (loss) from operations


(4,163

)


9,409


(18,039

)


1,033


Other income (expense):


Interest expense


(7

)


(14

)


(38

)


(99

)

Interest income


178


410


1,102


1,308


Foreign exchange gains, net


208


56


491


241


Other, net


(31

)


(29

)


(109

)


(212

)

Total other income, net


348


423


1,446


1,238


Income (loss) before income taxes


(3,815

)


9,832


(16,593

)


2,271


Income tax expense


49


1,160


2,649


2,417


Net income (loss)


$

(3,864

)


$

8,672


$

(19,242

)


$

(146

)


Income (loss) per common share:


Basic


$

(0.29

)


$

0.64


$

(1.42

)


$

(0.01

)

Diluted


$

(0.29

)


$

0.63


$

(1.42

)


$

(0.01

)


Weighted average common shares outstanding:


Basic


13,548,644


13,408,912


13,525,179


13,388,626


Diluted


13,548,644


13,569,951


13,525,179


13,388,626


Geospace Technologies Corporation and Subsidiaries

Consolidated Balance Sheets

(In thousands, except share amounts)

(unaudited)


AS OF SEPTEMBER 30,


2020


2019

ASSETS


Current assets:


Cash and cash equivalents


$

32,686


$

18,925


Trade accounts and financing receivables, net of allowance of $496 and $951


13,778


27,426


Inventories, net


16,933


23,855


Property held for sale


587


Prepaid expenses and other current assets


953


1,008


Total current assets


64,937


71,214


Non-current financing receivables


184


Non-current inventories, net


16,930


21,524


Rental equipment, net


54,317


62,062


Property, plant and equipment, net


29,874


31,474


Goodwill


4,337


5,008


Other intangible assets, net


8,331


10,063


Deferred cost of revenue and other assets


8,119


479


Total assets


$

186,845


$

202,008


LIABILITIES AND STOCKHOLDERS’ EQUITY


Current liabilities:


Accounts payable trade


$

1,593


$

4,051


Deferred revenue and other liabilities


8,753


9,119


Total current liabilities


10,346


13,170


Contingent consideration


10,962


9,940


Non-current deferred revenue and other liabilities


4,567


51


Total liabilities


25,875


23,161


Commitments and contingencies


Stockholders’ equity:


Preferred stock, 1,000,000 shares authorized, no shares issued and outstanding


Common stock, $.01 par value, 20,000,000 shares authorized, 13,670,639 and 13,630,666 shares issued and outstanding


137


136


Additional paid-in capital


90,965


88,660


Retained earnings


86,566


105,808


Accumulated other comprehensive loss


(16,698

)


(15,757

)

Total stockholders’ equity


160,970


178,847


Total liabilities and stockholders’ equity


$

186,845


$

202,008


Geospace Technologies Corporation and Subsidiaries

Consolidated Statements of Cash Flows

(In thousands)

(unaudited)


YEAR ENDED SEPTEMBER 30,


2020


2019

Cash flows from operating activities:


Net loss


$

(19,242

)


$

(146

)

Adjustments to reconcile net loss to net cash provided by operating activities:


Deferred income tax expense


181


16


Rental equipment depreciation


17,945


13,713


Property, plant and equipment depreciation


4,016


3,965


Amortization of other intangible assets


1,732


1,661


Goodwill impairment expense


671


Amortization of premiums on short-term investments


(9

)

Stock-based compensation expense


2,305


2,329


Bad debt expense


63


436


Inventory obsolescence expense


4,726


4,614


Change in estimate of collectability of rental revenue


7,993


Change in estimated fair value of contingent consideration


1,100


(2,115

)

Gross profit from sale of used rental equipment


(743

)


(652

)

Gain on disposal of property


(7,047

)

Gain on disposal of equipment


(116

)


(100

)

Realized loss on short-term investments


66


Effects of changes in operating assets and liabilities:


Trade accounts and other receivables


2,482


(9,159

)

Inventories


5


(1,865

)

Deferred cost of revenue and other assets


(7,786

)


343


Accounts payable trade


(2,453

)


(44

)

Deferred revenue and other liabilities


5,243


(377

)

Net cash provided by operating activities


18,122


5,629


Cash flows from investing activities:


Purchase of property, plant and equipment


(2,916

)


(1,936

)

Investment in rental equipment


(5,487

)


(34,070

)

Proceeds from the sale of property


8,265


Proceeds from the sale of equipment


204


142


Proceeds from the sale of used rental equipment


4,149


4,856


Proceeds from the sale of short-term investments


25,606


Business acquisition, net of acquired cash


(1,819

)

Payments for damages related to insurance claim


(650

)

Proceeds from insurance claim


1,166


Net cash (used in) provided by investing activities


(4,050

)


1,560


Cash flows from financing activities:


Payments on contingent consideration


(78

)


Proceeds from exercise of stock options and other


215


Net cash provided by (used in) financing activities


(78

)


215


Effect of exchange rate changes on cash


(233

)


(413

)

Increase in cash and cash equivalents


13,761


6,991


Cash and cash equivalents, beginning of fiscal year


18,925


11,934


Cash and cash equivalents, end of fiscal year


$

32,686


$ 18,925


Contacts

Rick Wheeler
President and CEO
TEL: 713.986.4444
FAX: 713.986.4445


Read full story here

DUBLIN--(BUSINESS WIRE)--The "Gas Station Equipment - Global Market Trajectory & Analytics" report has been added to ResearchAndMarkets.com's offering.


The publisher brings years of research experience to the 6th edition of this report. The 137-page report presents concise insights into how the pandemic has impacted production and the buy side for 2020 and 2021. A short-term phased recovery by key geography is also addressed.

Global Gas Station Equipment Market to Reach $6.8 Billion by 2027

Amid the COVID-19 crisis, the global market for Gas Station Equipment estimated at US$5.3 Billion in the year 2020, is projected to reach a revised size of US$6.8 Billion by 2027, growing at a CAGR of 3.5% over the period 2020-2027.

The U.S. Market is Estimated at $1.4 Billion, While China is Forecast to Grow at 6.4% CAGR

The Gas Station Equipment market in the U.S. is estimated at US$1.4 Billion in the year 2020. China, the world's second largest economy, is forecast to reach a projected market size of US$1.4 Billion by the year 2027 trailing a CAGR of 6.4% over the analysis period 2020 to 2027.

Among the other noteworthy geographic markets are Japan and Canada, each forecast to grow at 1.1% and 2.7% respectively over the 2020-2027 period. Within Europe, Germany is forecast to grow at approximately 1.8% CAGR.

Competitors identified in this market include, among others:

  • Beijing Sanki Petroleum Technology Co., Ltd.
  • Bennett Pump Company
  • Chengdu Huaqi Houpu Holding Co., Ltd.
  • Dem. G. Spyrides S. A.
  • Dover Corporation
  • Gilbarco Veeder-Root
  • Scheidt & Bachmann GmbH
  • Wayne Fueling Systems LLC
  • Zhejiang Datian machine Co., Ltd.

Key Topics Covered:

I. INTRODUCTION, METHODOLOGY & REPORT SCOPE

II. EXECUTIVE SUMMARY

1. MARKET OVERVIEW

  • Global Competitor Market Shares
  • Gas Station Equipment Competitor Market Share Scenario Worldwide (in %): 2019 & 2025
  • Impact of COVID-19 and a Looming Global Recession

2. FOCUS ON SELECT PLAYERS

3. MARKET TRENDS & DRIVERS

4. GLOBAL MARKET PERSPECTIVE

III. MARKET ANALYSIS

IV. COMPETITION

  • Total Companies Profiled: 41

For more information about this report visit https://www.researchandmarkets.com/r/lwmnsc


Contacts

ResearchAndMarkets.com
Laura Wood, Senior Press Manager
This email address is being protected from spambots. You need JavaScript enabled to view it.
For E.S.T Office Hours Call 1-917-300-0470
For U.S./CAN Toll Free Call 1-800-526-8630
For GMT Office Hours Call +353-1-416-8900

  • The Company ended the quarter with $577 million in cash and short-term investments and no amounts drawn on its $750 million revolving credit facility culminating in over $1.3 billion in liquidity
  • H&P expects its first quarter of fiscal 2021 North America Solutions rig count to exit at approximately 90 rigs up over 30% during the quarter
  • Reported a fiscal fourth quarter net loss of $(0.55) per diluted share; including select items(1) of $0.19 per diluted share
  • Quarterly North America Solutions operating gross margins(2) decreased $63 million to $39 million sequentially, as revenues decreased by $105 million to $149 million and expenses decreased by $43 million to $110 million
  • H&P's leadership position in automated directional drilling technology continues as AutoSlide® commercial deployments accelerated despite a significantly declining rig market with some notable operators implementing this technology on 100% of their wells in multiple basins
  • On September 9, 2020, Directors of the Company declared a quarterly cash dividend of $0.25 per share payable on December 1, 2020 to stockholders of record at the close of business on November 13, 2020

TULSA, Okla.--(BUSINESS WIRE)--Helmerich & Payne, Inc. (NYSE: HP) reported a net loss of $59 million, or $(0.55) per diluted share, from operating revenues of $208 million for the quarter ended September 30, 2020, compared to a net loss of $46 million, or $(0.43) per diluted share, on revenues of $317 million for the quarter ended June 30, 2020. The net losses per diluted share for the fourth and third quarters of fiscal year 2020 include $0.19 and $(0.09) of after-tax gains and losses, respectively, comprised of select items(1). For the fourth quarter of fiscal year 2020, select items(1) were comprised of:


  • $0.20 of after-tax gains pertaining to the sale of industrial real estate property
  • $(0.01) of after-tax losses pertaining to a non-cash fair market adjustment to our equity investment and restructuring charges

Net cash provided by operating activities was $93 million for the fourth quarter of fiscal year 2020 compared to $214 million for the third quarter of fiscal year 2020.

For fiscal year 2020, the Company reported a net loss of $494 million, or $(4.60) per diluted share, from operating revenues of $1.8 billion. The net loss per diluted share includes $(3.74) of after-tax losses comprised of select items(1), the most significant of which are non-cash losses of $563 million related to impairments of goodwill, less capable rigs, predominantly consisting of U.S. non-super-spec rigs, and excess related drilling equipment, and inventory and $16 million related to restructuring charges. Net cash provided by operating activities was $539 million in fiscal year 2020 compared to $856 million in fiscal year 2019.

President and CEO John Lindsay commented, “In terms of activity, this past fourth fiscal quarter was one of the most challenging in the Company's history. Our strong financial position together with our long-term vision for the future of the business enabled us to focus on introducing new commercial models and expanding our drilling and digital technology solutions to customers. These efforts are making good progress in this difficult environment and will serve as the foundation from which the Company will build as the market begins to recover.

"Our embedded customer centric approach is one that focuses on providing customized solutions, employing a combination of people, rigs and automation technology to provide more value and lower risk. This approach is distinctive in the industry, resonating well across our customer base, and is a driver for the recent increased activity levels with further improvements on the horizon. We expect our contracted rigs to increase by one-third during the first fiscal quarter of 2021, exiting at approximately 90 rigs, almost doubling the number of rigs turning to the right compared to our fourth fiscal quarter trough rig count.

"Concurrent with the expected increase in near-term activity, we are also experiencing increased customer utilization of our performance-based contracts and rig automation software, AutoSlide, and we expect adoption to increase and become more prevalent in the industry. H&P's 'touch of a button' autonomous drilling approach optimizes every major facet of the operation, from real-time automated geosteering, to rotary and sliding execution, to wellbore quality and placement. The uniqueness of our automated solutions is backed by a patented economic-driven approach where the software not only makes optimal cost/benefit decisions, but also directs the rig to execute those decisions without the need of an on-site directional driller, which improves reliability, enhances value and reduces risk for our customers.

"While we are encouraged by these developments, we are also cognizant that there remains a substantial amount of uncertainty in the market and that it may take several quarters to realize what the 'new normal' activity environment will look like given the uncertain timeline and lasting impacts of the COVID-19 pandemic."

Senior Vice President and CFO Mark Smith also commented, "The Company's financial strength continues to be a bright spot in this very challenging environment. Our strong capital stewardship continues looking out into fiscal 2021 as well with our anticipated capex spend to range between $85 and $105 million.

"Additionally during the fourth fiscal quarter, we completed the sale of the Company's industrial real estate assets. The decision to divest these legacy, non-core assets was considered as we entered 2020, but the close of the sale was delayed by several months due to the COVID-19 pandemic. The proceeds from the sale serve to further bolster our cash position, which together with short-term investments was $577 million at our fiscal year-end, resulting in cash in excess of debt of $90 million."

John Lindsay concluded, “Looking back at an unprecedented and demanding 2020 fiscal year, we remain steadfast in our commitment to reshape our business and the industry during this challenging time. Our teams are doing great work to accelerate long-term strategic priorities, including driving efficiency across the company and evolving our digital technology and data platforms to deliver value-added solutions and services to our customers and partners."

Operating Segment Results for the Fourth Quarter of Fiscal Year 2020

North America Solutions:

This segment had an operating loss of $78 million compared to an operating loss of $25 million during the previous quarter. The increase in the operating loss was driven by the continued decline in rig activity due to significantly lower crude oil prices resulting from a global supply and demand imbalance caused by the pandemic.

Operating gross margins(2) declined by $62.5 million to $39.3 million as both revenues and expenses declined sequentially. Revenues during the current quarter benefited from $11.7 million in early contract termination revenue compared to $50.2 million in the prior quarter. Expenses during the quarter were adversely impacted by higher than expected self-insurance expenses. Our technology solutions were in-line with expectations and had a positive, albeit small, contribution to the total North America Solutions operating gross margins(2).

International Solutions:

This segment had an operating loss of $3.5 million compared to an operating loss of $9.5 million during the previous quarter. Despite a decline in revenue days, operating gross margins(2) improved $4.0 million to a negative $1.2 million due to certain revenue reimbursements received during the quarter. This segment continues to carry a higher level of expenses relative to activity levels resulting from compliance with local jurisdictional requirements surrounding COVID-19. The Company continues to explore opportunities to mitigate these expenses, while maintaining strict adherence to local regulations. Current quarter results included a $2.6 million foreign currency loss related to our South American operations compared to an approximate $3.2 million foreign currency loss in the third quarter of fiscal year 2020.

Offshore Gulf of Mexico:

This segment had operating income of $1.5 million compared to operating income of $3.0 million during the previous quarter. Operating gross margins(2) declined by $3.9 million to $4.6 million due to unfavorable adjustments to self-insurance expenses related to a prior period claim. Segment operating income from management contracts on customer-owned platform rigs contributed approximately $1.1 million of the total, compared to approximately $1.7 million during the prior quarter.

Operational Outlook for the First Quarter of Fiscal Year 2021

North America Solutions:

  • We expect North America Solutions operating gross margins(2) to be between $40-$50 million, inclusive of approximately $1 million of contract early termination compensation
  • We expect to exit the quarter at between 88-93 contracted rigs, inclusive of approximately 0-2 contracted rigs generating revenue that could remain idle

International Solutions:

  • We expect International Solutions operating gross margins(2) to be between $(5)-$(7) million, exclusive of any foreign exchange gains or loses

Offshore Gulf of Mexico:

  • We expect Offshore Gulf of Mexico rig operating gross margins(2) to be between $5-$7 million
  • Management contracts are also expected to generate approximately $1-2 million in operating income

Other Estimates for Fiscal Year 2021

  • Gross capital expenditures are expected to be approximately $85 to $105 million; roughly one-third expected for maintenance, roughly one-third expected for skidding to walking conversions and roughly one-third for corporate and information technology. Asset sales include reimbursements for lost and damaged tubulars and sales of other used drilling equipment that offset a portion of the gross capital expenditures and are expected to total approximately $20 million in fiscal year 2021.
  • Depreciation is expected to be approximately $430 million
  • Research and development expenses for fiscal year 2021 are expected to be roughly $30 million
  • General and administrative expenses for fiscal year 2021 are expected to be approximately $160 million

COVID-19 Update

The COVID-19 pandemic continues to have a significant impact around the world and on our Company. After falling dramatically, crude oil prices and industry activity appear to have stabilized, albeit at much lower levels. The environment in which we operate is still uncertain; however, upon the onset of COVID-19's rapid spread across the United States in early March 2020, we responded quickly and took several actions to maintain the health and safety of H&P employees, customers and stakeholders and to preserve our financial strength. We discussed these actions in our press releases dated April 30, 2020 and July 28, 2020 and in our quarterly reports on Form 10-Q for the quarters ended March 31, 2020 and June 30, 2020 and will provide updates in our annual report on Form 10-K for the fiscal year ended September 30, 2020 when filed.

Select Items Included in Net Income per Diluted Share

Fourth quarter of fiscal year 2020 net loss of $(0.55) per diluted share included $0.19 in after-tax gains comprised of the following:

  • $0.20 of after-tax gains pertaining to the sale of industrial real estate property
  • $(0.00) of after-tax losses related to restructuring charges
  • $(0.01) of non-cash after-tax losses related to fair market value adjustments to equity investments

Third quarter of fiscal year 2020 net loss of $(0.43) per diluted share included $(0.09) in after-tax losses comprised of the following:

  • $0.02 of non-cash after-tax gains related to fair market value adjustments to equity investments
  • $(0.11) of after-tax losses related to restructuring charges

Fiscal year 2020 net loss of $(4.60) per diluted share included $(3.74) in after-tax losses comprised of the following:

  • $0.03 of after-tax gains related to the change in fair value of a contingent liability
  • $0.10 of after-tax gains related to the sale of a subsidiary
  • $0.13 of after-tax benefits from the reversal of accrued compensation
  • $0.20 of after-tax gains pertaining to the sale of industrial real estate property
  • $(0.06) of non-cash after-tax losses related to fair market value adjustments to equity investments
  • $(0.11) of after-tax losses related to restructuring charges
  • $(4.03) of non-cash after-tax losses related to the impairment of goodwill, less capable rigs, predominantly consisting of U.S. non-super-spec rigs, and excess related equipment and inventory

Conference Call

A conference call will be held on Friday, November 20, 2020 at 11:00 a.m. (ET) with John Lindsay, President and CEO, Mark Smith, Senior Vice President and CFO, and Dave Wilson, Director of Investor Relations to discuss the Company’s fourth quarter fiscal year 2020 results. Dial-in information for the conference call is (866) 342-8591 for domestic callers or (203) 518-9713 for international callers. The call access code is ‘Helmerich’. You may also listen to the conference call that will be broadcast live over the Internet by logging on to the Company’s website at http://www.hpinc.com and accessing the corresponding link through the Investor Relations section by clicking on “INVESTORS” and then clicking on “Event Calendar” to find the event and the link to the webcast.

About Helmerich & Payne, Inc.

Founded in 1920, Helmerich & Payne, Inc. (H&P) (NYSE: HP) is committed to delivering industry leading levels of drilling productivity and reliability. H&P operates with the highest level of integrity, safety and innovation to deliver superior results for its customers and returns for shareholders. Through its subsidiaries, the Company designs, fabricates and operates high-performance drilling rigs in conventional and unconventional plays around the world. H&P also develops and implements advanced automation, directional drilling and survey management technologies. At September 30, 2020, H&P's fleet included 262 land rigs in the United States, 32 international land rigs and eight offshore platform rigs. For more information, see H&P online at www.hpinc.com.

Forward-Looking Statements

This release includes “forward-looking statements” within the meaning of the Securities Act of 1933 and the Securities Exchange Act of 1934, and such statements are based on current expectations and assumptions that are subject to risks and uncertainties. All statements other than statements of historical facts included in this release, including, without limitation, statements regarding the registrant’s future financial position, operations outlook, business strategy, dividends, budgets, projected costs and plans and objectives of management for future operations, and the impact or duration of the COVID-19 pandemic and any subsequent recovery, are forward-looking statements. For information regarding risks and uncertainties associated with the Company’s business, please refer to the “Risk Factors” and “Management’s Discussion and Analysis of Financial Condition and Results of Operations” sections of the Company’s SEC filings, including but not limited to its annual report on Form 10-K and quarterly reports on Form 10-Q. As a result of these factors, Helmerich & Payne, Inc.’s actual results may differ materially from those indicated or implied by such forward-looking statements. We undertake no duty to update or revise our forward-looking statements based on changes in internal estimates, expectations or otherwise, except as required by law.

We use our Investor Relations website as a channel of distribution for material company information. Such information is routinely posted and accessible on our Investor Relations website at www.hpinc.com.


Note Regarding Trademarks. Helmerich & Payne, Inc. owns or has rights to the use of trademarks, service marks and trade names that it uses in conjunction with the operation of its business. Some of the trademarks that appear in this release or otherwise used by H&P include FlexRig and AutoSlide, which may be registered or trademarked in the United States and other jurisdictions.

(1) See the corresponding section of this release for details regarding the select items. The Company believes identifying and excluding select items is useful in assessing and understanding current operational performance, especially in making comparisons over time involving previous and subsequent periods and/or forecasting future periods results. Select items are excluded as they are deemed to be outside of the Company's core business operations.

(2) Operating gross margin is defined as operating revenues less direct operating expenses.


HELMERICH & PAYNE, INC.

(Unaudited)

(in thousands, except per share data)


Three Months Ended


Year Ended


September 30,


June 30,


September 30,


September 30,

CONSOLIDATED STATEMENTS OF OPERATIONS

2020


2020


2019


2020


2019

Operating revenues


Drilling services

$

205,621


$

314,405


$

645,759


$

1,761,714


$

2,785,557


Other

2,646


2,959


3,291


12,213


12,933


208,267


317,364


649,050


1,773,927


2,798,490


Operating costs and expenses


Drilling services operating expenses, excluding depreciation and amortization

162,518


205,198


430,778


1,184,788


1,803,204


Other operating expenses

1,491


1,549


1,072


5,777


5,382


Depreciation and amortization

109,587


110,161


134,887


481,885


562,803


Research and development

4,915


3,638


6,121


21,645


27,467


Selling, general and administrative

32,619


43,108


49,812


167,513


194,416


Asset impairment charge


563,234


224,327


Restructuring charges

552


15,495


16,047


Gain on sale of assets

(27,985

)


(4,201

)


(12,641

)


(46,775

)


(39,691

)


283,697


374,948


610,029


2,394,114


2,777,908


Operating income (loss) from continuing operations

(75,430

)


(57,584

)


39,021


(620,187

)


20,582


Other income (expense)


Interest and dividend income

753


771


2,607


7,304


9,468


Interest expense

(6,154

)


(6,125

)


(8,043

)


(24,474

)


(25,188

)

Gain (loss) on investment securities

(1,395

)


2,267


(4,260

)


(8,720

)


(54,488

)

Gain on sale of subsidiary


14,963


Other

(1,673

)


(2,914

)


(546

)


(5,384

)


(1,596

)


(8,469

)


(6,001

)


(10,242

)


(16,311

)


(71,804

)

Income (loss) from continuing operations before income taxes

(83,899

)


(63,585

)


28,779


(636,498

)


(51,222

)

Income tax benefit

(23,253

)


(17,578

)


(13,110

)


(140,106

)


(18,712

)

Income (loss) from continuing operations

(60,646

)


(46,007

)


41,889


(496,392

)


(32,510

)

Income from discontinued operations before income taxes

7,905


9,151


10,050


30,580


32,848


Income tax provision

6,222


8,743


10,763


28,685


33,994


Income (loss) from discontinued operations

1,683


408


(713

)


1,895


(1,146

)

Net income (loss)

$

(58,963

)


$

(45,599

)


$

41,176


$

(494,497

)


$

(33,656

)


Basic earnings (loss) per common share:


Income (loss) from continuing operations

$

(0.57

)


$

(0.43

)


$

0.38


$

(4.62

)


$

(0.33

)

Income (loss) from discontinued operations

0.02


(0.01

)


0.02


(0.01

)

Net income (loss)

$

(0.55

)


$

(0.43

)


$

0.37


$

(4.60

)


$

(0.34

)


Diluted earnings (loss) per common share:


Income (loss) from continuing operations

$

(0.57

)


$

(0.43

)


$

0.38


$

(4.62

)


$

(0.33

)

Income (loss) from discontinued operations

0.02


(0.01

)


0.02


(0.01

)

Net income (loss)

$

(0.55

)


$

(0.43

)


$

0.37


$

(4.60

)


$

(0.34

)


Weighted average shares outstanding (in thousands):


Basic

107,484


107,439


108,896


108,009


109,216


Diluted

107,484


107,439


108,950


108,009


109,216


HELMERICH & PAYNE, INC.

(Unaudited)

(in thousands)


September 30,


September 30,

CONSOLIDATED BALANCE SHEETS

2020


2019

Assets


Cash and cash equivalents

$

487,884


$

347,943


Short-term investments

89,335


52,960


Other current assets

386,108


714,183


Total current assets

963,327


1,115,086


Investments

31,585


31,991


Property, plant and equipment, net

3,646,341


4,502,084


Other noncurrent assets

188,368


190,354


Total Assets

$

4,829,621


$

5,839,515


Liabilities and Shareholders' Equity


Current liabilities

$

219,136


$

410,238


Long-term debt, net

480,727


479,356


Other noncurrent liabilities

797,855


922,357


Noncurrent liabilities - discontinued operations

13,389


15,341


Total shareholders’ equity

3,318,514


4,012,223


Total Liabilities and Shareholders' Equity

$

4,829,621


$

5,839,515


HELMERICH & PAYNE, INC.

(Unaudited)

(in thousands)


Year Ended September 30,

CONDENSED CONSOLIDATED STATEMENTS OF CASH FLOWS

2020


2019

OPERATING ACTIVITIES:


Net loss

$

(494,497

)


$

(33,656

)

Adjustment for (income) loss from discontinued operations

(1,895

)


1,146


Loss from continuing operations

(496,392

)


(32,510

)

Adjustments to reconcile net loss to net cash provided by operating activities:


Depreciation and amortization

481,885


562,803


Asset impairment charge

563,234


224,327


Restructuring charges


Amortization of debt discount and debt issuance costs

1,817


1,732


Provision for bad debt

2,203


2,321


Stock-based compensation

36,329


34,292


Loss on investment securities

8,720


54,488


Gain on sale of assets

(46,775

)


(39,691

)

Gain on sale of subsidiary

(14,963

)


Deferred income tax benefit

(157,555

)


(44,554

)

Other

(200

)


(3,295

)

Changes in assets and liabilities

160,625


95,900


Net cash provided by operating activities from continuing operations

538,928


855,813


Net cash used in operating activities from discontinued operations

(47

)


(62

)

Net cash provided by operating activities

538,881


855,751


INVESTING ACTIVITIES:


Capital expenditures

(140,795

)


(458,402

)

Purchase of short-term investments

(134,641

)


(97,652

)

Payment for acquisition of business, net of cash acquired


(16,163

)

Proceeds from sale of short-term investments

94,646


86,765


Proceeds from sale of subsidiary

15,056


Proceeds from sale of marketable securities


11,999


Proceeds from asset sales

78,399


50,817


Other

(550

)


Net cash used in investing activities

(87,885

)


(422,636

)


FINANCING ACTIVITIES:


Dividends paid

(260,335

)


(313,421

)

Debt issuance costs paid


(3,912

)

Proceeds from stock option exercises

4,100


3,053


Payments for employee taxes on net settlement of equity awards

(3,784

)


(6,418

)

Payment of contingent consideration from acquisition of business

(8,250

)


Payments for early extinguishment of long term debt


(12,852

)

Share repurchase

(28,505

)


(42,779

)

Other

(446

)


Net cash used in financing activities

(297,220

)


(376,329

)

Net increase in cash and cash equivalents and restricted cash

153,776


56,786


Cash and cash equivalents and restricted cash, beginning of period

382,971


326,185


Cash and cash equivalents and restricted cash, end of period

$

536,747


$

382,971


Three Months Ended


Year Ended

SEGMENT REPORTING

(in thousands, except operating statistics)

September 30,


June 30,


September 30,


September 30,

2020


2020


2019 (1)


2020


2019 (1)

NORTH AMERICA SOLUTIONS


Operating revenues

$

149,304


$

254,434


$

558,938


$

1,474,380


$

2,426,191


Direct operating expenses

110,048


152,663


355,830


942,277


1,532,576


Research and development

4,828


3,459


5,918


20,699


25,164


Selling, general and administrative expense

10,916


13,533


15,818


53,714


66,179


Depreciation

101,941


102,699


120,988


438,039


504,466


Asset impairment charge


406,548


216,908


Restructuring charges

(232

)


7,237


7,005


Segment operating income (loss)

$

(78,197

)


$

(25,157

)


$

60,384


$

(393,902

)


$

80,898


Revenue days

5,945


8,101


18,765


49,003


81,805


Average rig revenue per day

$

23,951


$

27,975


$

26,218


$

26,589


$

26,167


Average rig expense per day

17,348


15,412


15,394


15,730


15,243


Average rig margin per day

$

6,603


$

12,563


$

10,824


$

10,859


$

10,924


Rig utilization

25

%


32

%


68

%


47

%


67

%


INTERNATIONAL SOLUTIONS


Operating revenues

$

23,996


$

22,477


$

48,353


$

144,185


$

211,731


Direct operating expenses

25,157


27,595


43,119


124,791


157,856


Selling, general and administrative expense

733


1,129


1,399


4,565


5,624


Depreciation

897


996


8,042


17,531


35,466


Asset impairment charge


156,686


7,419


Restructuring charges

683


2,297


2,980


Segment operating income (loss)

$

(3,474

)


$

(9,540

)


$

(4,207

)


$

(162,368

)


$

5,366


Revenue days

452


988


1,598


4,605


6,426


Average rig revenue per day

$

45,986


$

19,642


$

28,199


$

29,116


$

31,269


Average rig expense per day

42,816


21,589


22,722


23,066


21,626


Average rig margin per day

$

3,170


$

(1,947

)


$

5,477


$

6,050


$

9,643


Rig utilization

15

%


34

%


56

%


40

%


55

%


OFFSHORE GULF OF MEXICO


Operating revenues

$

32,321


$

37,494


$

38,468


$

143,149


$

147,635


Direct operating expenses

27,711


28,967


32,148


119,371


114,306


Selling, general and administrative expense

72


1,248


1,004


3,365


3,725


Depreciation

3,090


3,004


2,499


11,681


10,010


Restructuring charges

(8

)


1,262


1,254


Segment operating income

$

1,456


$

3,013


$

2,817


$

7,478


$

19,594


Revenue days

460


455


552


1,922


2,163


Average rig revenue per day

$

45,254


$

49,654


$

43,072


$

45,145


$

37,478


Average rig expense per day

37,591


34,702


35,612


37,410


28,663


Average rig margin per day

$

7,663


$

14,952


$

7,460


$

7,735


$

8,815


Rig utilization

63

%


63

%


75

%


66

%


74

%


Contacts

Dave Wilson, Director of Investor Relations
This email address is being protected from spambots. You need JavaScript enabled to view it.
(918) 5885190


Read full story here

Bruce Bain to Create, Lead and Grow Network of Business Partners to Further Scale the Company, Provide Smart Contracts to Industry

HOUSTON--(BUSINESS WIRE)--#blockchain--Data Gumbo today announced that it has hired Bruce Bain as Vice President of Channels and Alliances. In this role, Bain will build and lead a network of business partners that will aid in commercially scaling GumboNet™, the company’s massively interconnected industrial blockchain network. Bain has more than 23 years experience leading global partner programs and managing top-performing channel partners at BMC, Oracle, NetIQ and SAP.


“Bruce has a proven and extensive track record of building sales velocity and customer success through technology partnership and channel programs. We are thrilled that he will build and manage our new ecosystem to further propel customer adoption,” said Andrew Bruce, CEO of Data Gumbo. “The experience that Bruce brings to the table around enterprise technology solution delivery, SaaS customer lifecycle success, channel leadership and sales growth will be critical to expanding adoption of GumboNet, as it’s now well recognized that solid and valuable alliance and partnership programs directly correlate to technology sales.”

Bain has been in the Houston technology industry and channel partner ecosystem for more than 25 years, including a focus on serving oil & gas and manufacturing-related industries. During his time at Oracle he repeatedly created successful Go-To-Market strategies to amplify and extend enterprise software solutions through partners (VAR, ISVs, MSPs and SIs). As well, at SAP he successfully managed partners’ evolutions from perpetual license sales to SaaS solutions.

“Data Gumbo is committed to providing partners with the best opportunities for engagement, and enabling their success by building incentives and marketing programs to support their connections,” said Bain. “The opportunity for channel partners to join in Data Gumbo’s journey is vast, as the need for our trusted transactional network is exploding across heavy-asset industries and global supply chains. I look forward to building a world-class, modern partner program with focus on influencers, implementation and retention as GumboNet adoption swells in 2021 and beyond.”

Bain holds a Master of Science in Computing and Information Science from Trinity University. He is also trained and has served as an Examiner for the Malcolm Baldrige National Quality Award program, and is a Predictive Index certified partner.

About Data Gumbo

Data Gumbo provides transactional certainty for tomorrow’s industrial leaders through GumboNet™, a massively interconnected industrial blockchain network. With integrated real-time capabilities that power, automate and execute smart contracts, our network reduces contract leakage, frees up working capital, enables real-time cash and financial management and delivers provenance with unprecedented speed, accuracy, visibility and transparency. Headquartered in Houston, Texas, Data Gumbo has a subsidiary office in Stavanger, Norway. To date, the company has received equity funding with Saudi Aramco Energy Ventures, the venture subsidiary of Saudi Aramco, and Equinor Technology Ventures, the venture subsidiary of Equinor, Norway’s leading energy operator. For more information, visit www.datagumbo.com or follow on LinkedIn, @DataGumbo and Facebook.


Contacts

Gina Manassero
Data Gumbo
This email address is being protected from spambots. You need JavaScript enabled to view it.

KANSAS CITY, Mo.--(BUSINESS WIRE)--Kansas City Southern (KCS) (NYSE: KSU) President and Chief Executive Officer Patrick J. Ottensmeyer, and Executive Vice President Precision Scheduled Railroading Sameh Fahmy, will address the Credit Suisse 8th Annual Virtual Industrials Conference at 9:30 a.m. eastern time on Thursday, December 3, 2020. Interested investors not attending the conference may listen to the presentation via a simultaneous webcast on KCS’ website at http://investors.kcsouthern.com. A link to the replay will be available following the event.


Headquartered in Kansas City, Mo., Kansas City Southern (KCS) (NYSE: KSU) is a transportation holding company that has railroad investments in the U.S., Mexico and Panama. Its primary U.S. holding is The Kansas City Southern Railway Company, serving the central and south central U.S. Its international holdings include Kansas City Southern de Mexico, S.A. de C.V., serving northeastern and central Mexico and the port cities of Lázaro Cárdenas, Tampico and Veracruz, and a 50 percent interest in Panama Canal Railway Company, providing ocean-to-ocean freight and passenger service along the Panama Canal. KCS’ North American rail holdings and strategic alliances with other North American rail partners are primary components of a unique railway system, linking the commercial and industrial centers of the U.S., Mexico and Canada. More information about KCS can be found at www.kcsouthern.com.


Contacts

KCS: Ashley Thorne, 816-983-1530, This email address is being protected from spambots. You need JavaScript enabled to view it.

Upgraded fleet of smart trailers and new predictive trailer routing capability provide shippers with unmatched visibility and tendering flexibility. Carriers can now book multi-stop loops as a single shipment, and earn up to $19,000 more annually per truck while reducing empty miles.

SEATTLE--(BUSINESS WIRE)--Convoy, the nation’s most efficient digital freight network, today announced enhancements to its drop-and-hook service, Convoy Go, that provide customers with more flexible, reliable capacity, superior service levels, and real-time load visibility. As the only digital freight company to offer a nationwide drop-and-hook service, Convoy extends its leadership today through predictive trailer routing, automated reloads with batched routes, and improved telematics in its smart trailers.


The challenge with drop-and-hook service has been the complexity of matching, tracking, and routing decoupled trailers and tractors. Most carriers and brokers address this problem manually, which often results in stale data and inaccurate forecasting that in turn limits their service to dense lanes with predictable shipments. These traditional drop-and-hook services are often unable to quickly scale to meet unexpected demand surges, forcing shippers to rely on the spot market and live loads, which drive up transportation costs and introduce logistical complications.

Convoy’s technology and innovative practices address these pain points and deliver even more flexible, reliable, and efficient drop-and-hook capacity for shippers, with a nearly 100% equipment availability rate, trailers delivered 24 hours before load times, 48% lower dwell times versus live shipments, deep visibility into every load, and reduced carbon emissions. These innovations include:

Predictive Trailer Routing: This enhancement proactively routes empty trailers to customers’ facilities, while simultaneously rebalancing Convoy Go’s trailer pool. To accomplish this, Convoy uses a machine learning model, predicting several weeks in advance how many trailers customers will need across hundreds of facilities nationwide. Convoy combines these forecasts daily with historical shipment data, GPS-based trailer locations, shipment assignments, inspection reports, and driver locations, feeding it all into an optimization model that analyzes billions of trailer route permutations, ultimately picking the most efficient solution.

Automated Reloads with Batched Routes: Since Convoy launched automated reloads, which combine headhauls with backhauls, shippers have benefitted from better service due to lower carrier falloff rates, and carriers have earned more through better asset utilization, all while preventing nearly three million pounds of CO2 emissions from entering the atmosphere. Now, automated reloads support batched routes for drop-and-hook, which combine three or more runs into a single multi-stop job, providing even greater efficiency for carriers and service quality for shippers. In addition, automated reloads can now combine multiple drop-and-hook and live loads into a single trip, further reducing empty miles and improving asset utilization.

Smarter Trailers, Powered by the Internet of Things: Every Convoy Go trailer is now equipped with advanced telematics, which, combined with Convoy data, provide unmatched visibility into each load. Combinations of ultrasonic, optical laser, and radar sensors deliver real-time information to Convoy’s cloud-based data lake. A machine learning model then analyzes this data to ensure shipments are progressing as planned, automatically flagging issues that require Convoy to course-correct. As a result, Convoy and its customers know if trailers are loaded and ready for pickup, if they’re being hauled by the correct driver, if the shipment needs more time, if the trailer is available for another shipment, if a trailer needs preventative maintenance, and how many new trailers are headed inbound to each facility for loading. This automated workflow enables Convoy Go’s nationwide fleet of thousands of trailers to be remotely monitored and managed by a handful of specialists, who can make any necessary adjustments even minutes before preloading.

“Supply chain teams prefer drop-and-hook for its speed and simplicity, but traditional programs are rigid and don't respond well to market volatility,” said Ziad Ismail, chief product officer at Convoy. “With recent enhancements to Convoy Go, we're addressing the biggest challenges of drop-and-hook freight, providing flexibility to scale up during demand surges and a level of trailer visibility never before possible. This has driven unprecedented customer demand for our drop-and-hook service and contributed to strong business growth over the last year.”

Convoy Go was the first drop-and-hook service to offer loads to tens of thousands of owner-operators and small carriers in 2017, improving capacity, and then expanding nationally in 2019, providing scale. Convoy Go has thousands of digitally-enhanced trailers in its fleet and is the company's fastest-growing offering, with more than 80 shippers and shipment volume increasing 245% year over year.

Convoy Go is available today to shippers who move at least 250 full truckloads per year in the US. Learn more by visiting convoy.com/drop-and-hook.

About Convoy

Convoy is the nation’s most efficient digital freight network. We move thousands of truckloads around the country each day through our optimized, connected network of carriers, saving money for shippers, increasing earnings for drivers, and eliminating carbon waste for our planet. We use technology and data to solve problems of waste and inefficiency in the $800B trucking industry, which generates over 72 million metric tons of wasted CO2 emissions from empty trucks. Fortune 500 shippers like Anheuser-Busch, P&G, Niagara, and Unilever trust Convoy to lower costs, increase logistics efficiency, and achieve environmental sustainability targets. Convoy.com


Contacts

Media Contact:
Sam Hallock
(425) 241 - 8954
This email address is being protected from spambots. You need JavaScript enabled to view it.

Chevron Technology Ventures builds state-of-the-art digital makerspace to partner and test emerging technologies

HOUSTON--(BUSINESS WIRE)--The Founders District, an experiential mixed-use community in West Houston, welcomes Chevron to the building that houses The Cannon, a flexible workspace and innovation hub. Chevron is creating a digital makerspace where they will partner with start-up companies and community organizations in Houston’s innovation ecosystem to test emerging technologies that add efficiencies to their business and operations. Chevron will join Corva, Texas Citizens Bank, and Baker Tilly in the western portion of the Cannon building, directly off Brittmoore Road.

Chevron has been a key sponsor of The Cannon since 2018, occupying a branded office space within the innovation hub. The company recently executed a new lease agreement for a significantly larger footprint at The Cannon.

“Chevron’s support for The Founders District and The Cannon expands our commitment to Houston’s growing innovation ecosystem,” said Barbara Burger, Chevron vice president, Innovation and president of Chevron Technology Ventures. “We look forward to utilizing this new space to collaborate with other Chevron organizations, such as our Wells group, as we work to deliver more reliable, affordable, ever-cleaner energy.”

“We are thrilled to partner with Chevron Technology Ventures in developing this exciting makerspace at The Founders District,” said Mark Toon, Chief Executive Officer of Puma Development, the company developing The Founders District and founder of Work America Capital, a venture capital firm dedicated to investing in Houston-based businesses. “CTV is the paradigm for meaningful innovation in Houston. By investing in emerging technologies in energy, they are paving the way for innovation to remain at the heart of Houston’s most prominent industry.”

One of Chevron’s first onsite collaborations is planned with their Wells group, the drilling and completions arm of the company.

“In addition to providing hands-on experience for our engineers with edge communications and technology, the space will allow us to demonstrate and test digital workflows and other technologies before taking them out to the field,” said Kim McHugh, vice president, Chevron Wells. “We can work out kinks, collaborate with partners, and improve solutions iteratively while eliminating the costs and safety risk associated with deploying to our remote operations.”

About the Founders District

The Founders District is a revolutionary mixed-use campus in west Houston. Anchored by The Cannon, one of the largest and most innovative flexible workspaces in the world, the Founders District is a beacon of innovation, technology, and the elevated consumer experience. The walkable, 32+ acre campus will comprise experiential retail, dynamic entertainment, unique food & beverage, top-notch fitness, multifamily residential, commercial office, and more. To stay up to date on all developments at The Founders District, please visit our website at https://www.foundersdistrict.com/.

About The Cannon

The Cannon is a flexible workspace and digital ecosystem that builds and operates curated entrepreneurial and creative communities across a growing number of locations as well as a digital platform to serve and connect entrepreneurs globally. Currently, there are more than 300 companies in The Cannon community working at The Cannon – Main Campus, a brand new 120K square foot. converted warehouse located at the center of the 32-acre Founders District on the west side of Houston, just north of Interstate 10 and Beltway 8, at The Cannon – Post Oak and The Cannon – Downtown, which opened in December 2019 at the Amegy Bank Tower in Downtown Houston. The Cannon’s flagship Main Campus location, one of the largest coworking and office spaces in the world, plans to headquarter a community of more than 800 of Houston’s most accomplished entrepreneurs, startups, and small businesses, surrounded by service providers and resources geared to help their businesses grow. For more information visit https://thecannon.com.

About Chevron Technology Ventures

Chevron Technology Ventures (CTV) pursues externally developed technologies and new business solutions that have the potential to enhance the way Chevron produces and delivers affordable, reliable, and ever-cleaner energy. CTV leverages innovative companies and technologies to strengthen Chevron’s core operations and identifies new opportunities to shape the future of energy. For more information, visit www.chevron.com/technology/technology-ventures.


Contacts

The Founders District: Mark Toon, This email address is being protected from spambots. You need JavaScript enabled to view it.
The Cannon: John Lambert,
This email address is being protected from spambots. You need JavaScript enabled to view it.
Chevron: Mary Murrin, This email address is being protected from spambots. You need JavaScript enabled to view it.

Patented technology enables industry-transforming, dynamic battery synchronization and control for optimal battery operation and longevity

COSTA MESA, Calif.--(BUSINESS WIRE)--#AI--Veritone, Inc. (Nasdaq: VERI), the creator of the world’s first operating system for artificial intelligence, aiWARE™, today announced that it has received three new patents for its battery control technology, bringing the total number of issued patents covering its Veritone Energy Solutions to 13, with another 16 patent applications pending.


The new patented technologies enable dynamic, real-time synchronization and control of batteries to ensure optimal power distribution and battery life, helping to enable a reliable, cost-efficient green energy grid. The technologies empower utilities, independent service providers and battery providers with ground-breaking ways to address the very real Distributed Energy Resource (DER) integration challenges of suboptimal battery operation, overheating and failures that introduce safety concerns and cost companies millions in equipment damage each year.

“As the world transitions to renewable energy, whether it be wind, solar, or hydroelectric, the unpredictable nature of these green energy sources and the resulting energy supply and demand imbalances must be resolved if we are to achieve our green energy goals,” said Chad Steelberg, CEO of Veritone. “While deploying batteries to provide energy storage and smoothing seems like an obvious and simple solution, the technical hurdles to accomplish it at scale in the real-world are challenging. AI-based battery control and synchronization is necessary, now more than ever. Veritone has developed proprietary machine learning algorithms, now protected by several U.S. patents, to meet this pressing need.”

These battery control patents complement Veritone’s patented AI-based energy solutions for predictive real-time control, management and adaptation of smart grids. By applying advanced models, rules and learning to weather forecast, energy demand, pricing, and device data, Veritone Energy Solutions help utilities automatically predict optimal energy supply mix and pricing to meet grid demand, in real-time.

The following new battery control patents have been issued to Veritone:

  • The first patent (U.S. Patent No. 10,601,316) is generally related to techniques for automated, real-time and dynamic control of battery power (charging or discharging) based on its current charge state, to optimize battery operation and increase battery longevity. The patent also includes the ability to synchronize power across multiple batteries across a farm or microgrid to ensure ideal power across the systems.
  • The second patent (U.S. Patent No. 10,666,076) is generally related to techniques for dynamic control of batteries by continuously updating control models based on the battery's current state and behavior, thereby optimizing battery operation and increasing battery longevity. The current state is measured by sensing variations in battery output as a result of input excitation signals sent to the battery.
  • The third patent (U.S. Patent No. 10,816,949) is generally related to techniques for battery control system impedance actuators that optimally control the battery based on its current charge state and thermal state, reducing power dissipation and increasing battery life. The patent also includes the ability to use a mean field game representation to synchronize battery power delivery across multiple control systems present in a battery farm or microgrid.

“Other battery control solutions rely on day-ahead forecasting and steady state battery operation, which are not realistic in today’s distributed, unpredictable clean energy grids,” said Dr. Wolf Kohn, Chief Data Scientist at Veritone. “Our battery control technology, represented in the three new patents we have been granted, is unique in that it is based on real-time AI that predicts energy supply and demand minutes ahead, instead of days, and is based on the dynamic conditions of the battery and the operating environment at any given time.”

“Veritone’s dynamic battery control and synchronization technology helps independent service providers and battery providers optimize battery operation, reduce power dissipation and prolong battery life,” said Adje Mensah whose firm A.F. Mensah, Inc. develops and operates solar and battery storage projects. “With its innovative intelligent battery management technology, Veritone’s ability to leverage massive amounts of historical and real-time data to balance energy supply and demand is unique in the market, and truly transformative when it comes to solar forecasting and optimal dispatch for battery farms and microgrids.”

Veritone Energy’s Solutions include: Forecaster, which accurately detects and predicts energy supply, demand and price; Optimizer, which makes AI-based energy supply determinations; Controller, for predictive device control and active synchronization, combining energy sources to optimally satisfy demand; and Arbitrage, for buying, selling and dispatching energy. Veritone aiWARE, the leading cognitive operating system, provides deployment, integration, data services and weather services to these solution components. Veritone Energy’s highly customizable solutions can be applied to solve a wide range of challenges facing the industry, including solar smoothing, demand response, micro-grid synchronization, intelligent device control, voltage optimization, regulatory compliance, dispatch optimization and high-speed energy arbitrage. Its highly-differentiated solutions are covered by 13 patents issued in the United States and other countries, with an additional 16 applications pending.

For more information on Veritone Energy patented technology, including the scientific research behind it, please click here. To learn more about Veritone Energy solutions, please visit: https://www.veritone.com/solutions/energy/.

About Veritone

Veritone (NASDAQ: VERI) is a leading provider of artificial intelligence (AI) technology and solutions. The company’s proprietary operating system, aiWARE™, powers a diverse set of AI applications and intelligent process automation solutions that are transforming both commercial and government organizations. aiWARE orchestrates an expanding ecosystem of machine learning models to transform audio, video, and other data sources into actionable intelligence. The company’s AI developer tools enable its customers and partners to easily develop and deploy custom applications that leverage the power of AI to dramatically improve operational efficiency and unlock untapped opportunities. Veritone is headquartered in Costa Mesa, California, and has offices in Denver, London, New York and San Diego. To learn more, visit Veritone.com.

Safe Harbor Statement

This news release contains forward-looking statements, including without limitation statements regarding the Company’s patents, the features and performance of its aiWARE Energy solutions and their expected benefits to customers. Without limiting the generality of the foregoing, words such as “may,” “will,” “expect,” “believe,” “anticipate,” “intend,” “could,” “estimate” or “continue” or the negative or other variations thereof or comparable terminology are intended to identify forward-looking statements. In addition, any statements that refer to expectations, projections or other characterizations of future events or circumstances are forward-looking statements. Assumptions relating to the foregoing involve judgments and risks with respect to various matters which are difficult or impossible to predict accurately and many of which are beyond the control of Veritone. Certain of such judgments and risks are discussed in Veritone’s SEC filings. Although Veritone believes that the assumptions underlying the forward-looking statements are reasonable, any of the assumptions could prove inaccurate and, therefore, there can be no assurance that the results contemplated in forward-looking statements will be realized. In light of the significant uncertainties inherent in the forward-looking information included herein, the inclusion of such information should not be regarded as a representation by Veritone or any other person that their objectives or plans will be achieved. Veritone undertakes no obligation to revise the forward-looking statements contained herein to reflect events or circumstances after the date hereof or to reflect the occurrence of unanticipated events.


Contacts

Allison Zullo
Walker Sands, for Veritone
This email address is being protected from spambots. You need JavaScript enabled to view it.
330-554-5965

HOUSTON--(BUSINESS WIRE)--P97 Networks, a leader in cloud-based mobile commerce, will enable mobile payments for fuel from within the Google Pay mobile app. Google Pay, a safe, helpful way to pay and manage money, is now available both on Android and iOS. Using the P97 Networks’ mobile payment gateway, drivers using the Google Pay app will be able to locate and fill up gas at Shell gas stations.

“We are excited to collaborate with Google Pay,” Donald Frieden, founder and CEO of P97 said. “We are confident that these new capabilities will improve fueling experiences at the pump. and serve as a stepping stone to future innovations for pay-at-pump experiences.”

About P97 Networks, Inc.
P97 Networks provides secure cloud-based mobile commerce and digital marketing solutions for the convenience retail and fuels marketing industries under the brand name PetroZone. P97’s commerce solutions enhance the ability of convenience store operators, marketers, and oil companies to attract and retain customers by providing technology that securely connects millions of individual mobile phones and connected cars with identity and geolocation-based software technology to create unique connected-consumer experiences.

@p97networks
www.p97.com


Contacts

P97 Media Contact
Aaron Mireles
(281) 954-1706
This email address is being protected from spambots. You need JavaScript enabled to view it.

HOUSTON--(BUSINESS WIRE)--Halliburton Company (NYSE: HAL) today announced its commitment to set science-based targets to reduce greenhouse gas (GHG) emissions. The Company submitted its commitment letter to the Science Based Targets initiative (SBTi), a collaboration between CDP, the United Nations Global Compact, World Resources Institute, and the World Wide Fund for Nature. With this commitment, Halliburton will submit targets in 2021 with pending SBTi validation by 2022. Halliburton joins over 1000 global companies who have committed to set emissions reduction targets grounded in climate science through the SBTi.


“Our SBTi commitment reinforces our sustainability goals while helping our customers provide the world with affordable and reliable energy,” said Halliburton Chairman, President & CEO Jeff Miller. “Our industry plays an important role in reducing greenhouse gas emissions and provides us a great opportunity to do what we do best: innovate, collaborate, and execute to drive efficiencies and affect change.”

Science-based targets are emissions reduction targets in line with what the latest climate science outlines is necessary to meet the goals of the Paris Accord, which seeks to limit global warming to well below 2oC above pre-industrial levels.

ABOUT HALLIBURTON

Founded in 1919, Halliburton is one of the world's largest providers of products and services to the energy industry. With more than 40,000 employees, representing 140 nationalities in more than 80 countries, the company helps its customers maximize value throughout the lifecycle of the reservoir – from locating hydrocarbons and managing geological data, to drilling and formation evaluation, well construction and completion, and optimizing production throughout the life of the asset. Visit the Company’s website at www.halliburton.com. Connect with Halliburton on Facebook, Twitter, LinkedIn, Instagram and YouTube.


Contacts

For Investors:
Abu Zeya
Investor Relations
This email address is being protected from spambots. You need JavaScript enabled to view it.
281-871-2688

For News Media:
Emily Mir
External Affairs
This email address is being protected from spambots. You need JavaScript enabled to view it.
281-871-2601

FORT WORTH, Texas--(BUSINESS WIRE)--Lonestar Resources US Inc. (NASDAQ: LONE) (including its subsidiaries, “Lonestar,” “we,” “us,” “our” or the “Company”) today reported financial and operating results for the three months ended September 30, 2020.


HIGHLIGHTS

  • Lonestar reported an 8% increase in net oil and gas production to 14,419 BOE/d during the three months ended September 30, 2020 (“3Q20”), compared to 13,339 BOE/d for the three months ended June 30, 2020 (“2Q20”). Production was comprised of 73% crude oil and NGL’s on an equivalent basis.
  • Lonestar reported a net loss attributable to its common stockholders of $38.5 million during 3Q20 compared to a net loss of $42.9 million during 2Q20. Excluding, on a tax-adjusted basis, certain items that the Company does not view as either recurring or indicative of its ongoing financial performance, Lonestar’s adjusted net income for 3Q20 was $23.0 million. Most notable among these items include: a $48.4 million change in unrealized (non-cash) hedging loss on financial derivatives (‘mark-to-market’) and $12.4 million of non-recurring G&A expense related to restructuring expenses. Please see Non-GAAP Financial Measures at the end of this release for the definition of Adjusted Net Income (Loss), a reconciliation of net income (loss) before taxes to Adjusted Net Income (Loss), and the reasons for its use.
  • Lonestar reported Adjusted EBITDAX for 3Q20 of $32.5 million. On a sequential basis, Adjusted EBITDAX remained flat due to stringent cost management and substantial hedging. Please see Non-GAAP Financial Measures at the end of this release for the definition of Adjusted EBITDAX, a reconciliation of net (loss) income attributable to common stockholders to Adjusted EBITDAX, and the reasons for its use.

OPERATIONAL UPDATE

  • Production- Lonestar reported an 8% increase in net oil and gas production to 14,419 BOE/d during the three months ended September 30, 2020. 3Q20 production volumes consisted of 7,190 barrels of oil per day (50%), 3,325 barrels of NGLs per day (23%), and 23,424 Mcf of natural gas per day (27%). This increase was attributable to Q2 shut-ins and the Hawkeye 14H-16H coming online.
  • Wellhead Pricing- Lonestar’s wellhead crude oil price realization was $37.08/Bbl, which reflects a discount of $3.86/Bbl vs. WTI. Lonestar’s realized NGL price was $10.47/Bbl, or 26% of WTI. Lonestar’s realized wellhead natural gas price was $2.03 per Mcf, reflecting a $0.03 premium to Henry Hub.
  • Revenues- Wellhead revenues improved by $14.9 million to $32.1 million, or 86%, compared to the three months ended June 30, 2020 (“2Q20”), primarily driven by a 80% increase in oil price realizations and a 59% increase in NGL price realizations, partially offset by a 29% decrease in natural gas price realizations.
  • Expenses- In response to the downturn in oil and gas prices in 2020, Lonestar has made an organization-wide effort to reduce operating costs, focused on a combination of streamlining internal processes and seeking cost reductions from its vendors and service providers. Those organizational expense reductions are beginning to be reflected in the Company’s financial results. In the third quarter of 2020, total cash expenses, which include the cash portions of lease operating, gathering, processing, transportation, production taxes, general & administrative and interest expenses were $35.0 million for 3Q20, which reflects a 58% increase compared to $22.1 million in 2Q20. On a per-unit basis total cash expenses for 3Q20 and 2Q20 were $26.42 and $17.60, respectively. Excluding the incremental professional fees of $12.4 million incurred related to our restructuring, total cash expenses were $22.6 million for 3Q20, representing a 2% increase from the previous quarter. On a per-unit basis, 3Q20 total cash expenses per BOE were reduced by 4%, from $17.60 / BOE in 2Q20 to $17.07 / BOE in 3Q20.
    • Lease Operating Expenses (“LOE”), excluding rig standby costs of $0.2 million, were $4.8 million for 3Q20, which was 18% higher than LOE of $4.0 million in 2Q20. On a unit-of-production basis, LOE per BOE increased 8% quarter over quarter to $3.59 per BOE in 3Q20. Increased LOE was driven entirely by the fact that Lonestar produced at 100% of capacity in 3Q20 after shutting in a substantial portion of its production in 2Q20.
    • Gathering, Processing & Transportation Expenses (“GP&T”) for 3Q20 were $1.9 million, which was 116% higher than the GP&T of $0.9 million in the three months ended 2Q20. On a unit-of-production basis, GP&T increased 98% quarter over quarter from $0.72 per BOE in 2Q20 to $1.43 per BOE in 3Q20.
    • Production and ad valorem taxes for 3Q20 were $2.0 million, which was 17% higher than production taxes of $1.7 million in 2Q20. On a unit-of-production basis, production and ad valorem taxes increased 6% quarter over quarter from $1.42 per BOE in 2Q20 to $1.50 per BOE in 3Q20. Increased production and ad valorem taxes were a function of higher wellhead revenues.
    • General & Administrative Expenses (“G&A”) in 3Q20 were $15.8 million vs. $5.9 million in 2Q20. The significant increase was primarily due to incremental professional fees incurred related to our restructuring, totaling $12.4 million for the quarter. Excluding stock-based compensation, on a unit-of-production basis, G&A per BOE increased 177% quarter over quarter from $4.87 per BOE in 2Q20 to $11.92 per BOE in 3Q20. Excluding professional fees of $12.4 million related to restructuring, G&A per BOE decreased 40% quarter over quarter from $4.87 per BOE in 2Q20 to $2.57 per BOE in 3Q20.
    • Interest expense was $11.4 million for 3Q20 vs. $10.5 million for 2Q20. Excluding amortization of debt issuance cost, premiums, and discounts, Interest expense increased 9% quarter over quarter from $9.9 million in 2Q20 to $10.8 million in 3Q20. On a unit-of-production basis, interest expense per BOE decreased 0.5% from $8.16 per BOE in 2Q20 to $8.12 per BOE in 3Q20.

EAGLE FORD SHALE TREND - WESTERN REGION

In our Western Region, production for 3Q20 averaged approximately 7,961 BOE per day, a 2% increase from 2Q20 production. Production consisted of 2,756 barrels of oil per day (35%), 2,367 barrels of NGL’s per day (30%) and 17,027 Mcf of natural gas per day (36%). The Western Region accounted for 55% of the Company’s production during the quarter. No new wells were completed during 3Q20. However, production increased in 3Q20 after the Company returned all of its wells to full production after shutting in certain wells during 2Q20 in reaction to historically low prices.

EAGLE FORD SHALE TREND - CENTRAL REGION

In our Central Region, 3Q20 production averaged approximately 6,242 BOE/d, a 18% increase compared to 2Q20 rates. Production consisted of 4,339 barrels of oil per day (70%), 893 barrels of NGL’s per day (14%), and 6,060 Mcf of natural gas per day (16%). The increase in production was largely driven by the shut-in of crude oil production volumes all of our wells in Gonzales, Karnes, Fayette and Lavaca Counties. The Central Region accounted for 43% of the Company’s production during the quarter.

In June, Lonestar began flowback operations on the Hawkeye #14H, Hawkeye #15H, and Hawkeye #16H. These recorded maximum rates over a 30-day period (“Max-30 rates”) of 1,461 BOE/d, 86% of which was crude oil. Now, through their first 120 days of production, these wells have produced an average of 111,000 barrels of crude oil.

  • Hawkeye #14H – With a 10,979’ perforated interval, the #14H recorded Max-30 rates of 1,186 Bbls/d oil, 87 Bbls/d of NGLs, and 625 Mcf/d, or 1,377 BOE/d on a three-stream basis and was achieved on a 30/64” choke. The #14H well has been onstream for more than 4 months now, and 120-day rates have averaged 868 Bbls/d oil, 49 Bbls/d of NGLs, and 353 Mcf/d, or 976 BOE/d on a three-stream basis.
  • Hawkeye #15H – With a 10,608’ perforated interval, the #14H recorded Max-30 rates 1,372 Bbls/d oil, 101 Bbls/d of NGLs, and 729 Mcf/d, or 1,595 BOE/d on a three-stream basis and was achieved on a 30/64” choke. The #15H has been onstream for more than 4 months now, and 120-day rates of 970 Bbls/d oil, 55 Bbls/d of NGLs, and 394 Mcf/d, or 1,090 BOE/d on a three-stream basis and was achieved on a 30/64” choke.
  • Hawkeye #16H – With a 9,885’ perforated interval, the #16H recorded Max-30 rates 1,217 Bbls/d oil, 88 Bbls/d of NGLs, and 635 Mcf/d, or 1,411 BOE/d on a three-stream basis and was achieved on a 30/64” choke. The #16H has been onstream for more than 4 months now, and 120-day rates of 958 Bbls/d oil, 53 Bbls/d of NGLs, and 381 Mcf/d, or 1,074 BOE/d on a three-stream basis and was achieved on a 30/64” choke.

The Company holds a 50% working interest (“WI”) / 38% net revenue interest (“NRI”) in these wells.

In July, the Company completed drilling operations on the Hawkeye #33H, Hawkeye #34H, and Hawkeye #35. These wells were drilled to total measured depths of 20,500, 20,358 feet, and 20,467, respectively, and are expected to have perforated intervals averaging approximately 10,800 feet. These wells are currently held in inventory as Drilled Uncompleted (DUC’s). Lonestar expects to hold a 50% WI / 37.5% NRI in these wells.

EAGLE FORD SHALE TREND - EASTERN REGION

In our Eastern Region, 3Q20 production averaged approximately 216 BOE/d, a 4% decrease over 2Q20 rates. Production consisted of 95 barrels of oil per day (44%), 65 barrels of NGL’s per day (30%), and 337 Mcf of natural gas per day (26%). The Eastern Region accounted for 2% of the Company’s production during the quarter.

ABOUT LONESTAR RESOURCES US INC.

Lonestar is an independent oil and natural gas company, focused on the development, production, and acquisition of unconventional oil, NGLs, and natural gas properties in the Eagle Ford Shale in Texas, where we have accumulated approximately 70,876 gross (51,484 net) acres in what we believe to be the formation’s crude oil and condensate windows, as of September 30, 2020. For more information, please visit www.lonestarresources.com.

Cautionary & Forward-Looking Statements

Lonestar Resources US Inc. cautions that this press release contains forward-looking statements, including, but not limited to; Lonestar’s execution of its growth strategies; growth in Lonestar’s leasehold, reserves and asset value; and Lonestar’s ability to create shareholder value. These statements involve substantial known and unknown risks, uncertainties and other important factors that may cause our actual results, levels of activity, performance or achievements to be materially different from the information expressed or implied by these forward-looking statements. These risks and uncertainties include, but are not limited to, the following: volatility of oil, natural gas and NGL prices, and potential write-down of the carrying values of crude oil and natural gas properties; inability to successfully replace proved producing reserves; substantial capital expenditures required for exploration, development and exploitation projects; potential liabilities resulting from operating hazards, natural disasters or other interruptions; risks related using the latest available horizontal drilling and completion techniques; uncertainties tied to lengthy period of development of identified drilling locations; unexpected delays and cost overrun related to the development of estimated proved undeveloped reserves; concentration risk related to properties, which are located primarily in the Eagle Ford Shale of South Texas; loss of lease on undeveloped leasehold acreage that may result from lack of development or commercialization; inaccuracies in assumptions made in estimating proved reserves; our limited control over activities in properties Lonestar does not operate; potential inconsistency between the present value of future net revenues from our proved reserves and the current market value of our estimated oil and natural gas reserves; risks related to derivative activities; losses resulting from title deficiencies; risks related to health, safety and environmental laws and regulations; additional regulation of hydraulic fracturing; reduced demand for crude oil, natural gas and NGLs resulting from conservation measures and technological advances; inability to acquire adequate supplies of water for our drilling operations or to dispose of or recycle the used water economically and in an environmentally safe manner; climate change laws and regulations restricting emissions of “greenhouse gases” that may increase operating costs and reduce demand for the crude oil and natural gas; fluctuations in the differential between benchmark prices of crude oil and natural gas and the reference or regional index price used to price actual crude oil and natural gas sales; and the other important factors discussed under the caption “Risk Factors” in our Annual Report on Form 10-K filed with the Securities and Exchange Commission, or the SEC, on April 13, 2020, as well as other documents that we may file from time to time with the SEC. We may not actually achieve the plans, intentions or expectations disclosed in our forward-looking statements, and you should not place undue reliance on our forward-looking statements. Actual results or events could differ materially from the plans, intentions and expectations disclosed in the forward-looking statements we make. The forward-looking statements in this press release represent our views as of the date of this press release. We anticipate that subsequent events and developments will cause our views to change. However, while we may elect to update these forward-looking statements at some point in the future, we have no current intention of doing so except to the extent required by applicable law. You should, therefore, not rely on these forward-looking statements as representing our views as of any date subsequent to the date of this press release.


Lonestar Resources US Inc. (Debtor-In-Possession)

Unaudited Condensed Consolidated Balance Sheets

(In thousands, except par value and share)


September 30,
2020


December 31,
2019

Assets

Current assets


Cash and cash equivalents

$

36,611


$

3,137


Accounts receivable


Oil, natural gas liquid and natural gas sales

14,304


15,991


Joint interest owners and others, net

1,594


1,310


Derivative financial instruments


5,095


Prepaid expenses and other

9,936


2,208


Total current assets

62,445


27,741


Property and equipment


Oil and gas properties, using the successful efforts method of accounting


Proved properties

1,099,521


1,050,168


Unproved properties

77,367


76,462


Other property and equipment

21,914


21,401


Less accumulated depreciation, depletion, amortization and impairment

(723,351

)


(464,671

)


Property and equipment, net

475,451


683,360


Accounts receivable – related party

6,023


5,816


Derivative financial instruments


1,754


Other non-current assets

2,052


2,108


Total assets

$

545,971


$

720,779


Liabilities and Stockholders' (Deficit) Equity

Current liabilities


Accounts payable

$

10


$

33,355


Accounts payable – related party


189


Oil, natural gas liquid and natural gas sales payable


14,811


Accrued liabilities

429


26,905


Derivative financial instruments


8,564


Current maturities of long-term debt

285,000


247,000


Total current liabilities

285,439


330,824


Long-term liabilities


Long-term debt

8,781


255,068


Asset retirement obligations

7,583


7,055


Deferred tax liabilities, net


931


Warrant liability


129


Warrant liability – related party


235


Derivative financial instruments


1,898


Other non-current liabilities


3,752


Total long-term liabilities

16,364


269,068


Liabilities subject to compromise

309,193


Total liabilities

610,996


599,892


Commitments and contingencies


Stockholders' (deficit) equity


Class A voting common stock, $0.001 par value, 100,000,000 shares authorized, 25,375,314 and 24,945,594 shares issued and outstanding, respectively

142,655


142,655


Series A-1 convertible participating preferred stock, $0.001 par value, 104,893 and 100,328 shares issued and outstanding, respectively


Additional paid-in capital

176,012


175,738


Accumulated deficit

(383,692

)


(197,506

)


Total stockholders' (deficit) equity

(65,025

)


120,887


Total liabilities and stockholders' (deficit) equity

$

545,971


$

720,779


See accompanying Notes to Unaudited Condensed Consolidated Financial Statements


Lonestar Resources US Inc. (Debtor-In-Possession)

Unaudited Condensed Consolidated Statements of Operations

(In thousands, except per share data)


Three Months Ended September 30,


Nine Months Ended September 30,


2020


2019


2020


2019

Revenues


Oil sales

$

24,524


$

42,187


$

66,510


$

120,496


Natural gas liquid sales

3,202


3,439


7,565


10,381


Natural gas sales

4,383


7,519


12,285


15,224


Total revenues

32,109


53,145


86,360


146,101


Expenses


Lease operating

4,763


8,948


16,430


23,472


Gas gathering, processing and transportation

1,891


1,107


4,916


3,223


Production and ad valorem taxes

1,994


3,017


6,084


8,126


Depreciation, depletion and amortization

18,256


24,635


59,184


64,120


Loss on sale and disposal of oil and gas properties


483


1,254


33,530


Impairment of oil and gas properties


199,908


General and administrative

15,808


4,124


24,664


12,345


Other expense (income)

121


(2

)


(15

)


(4

)

Total expenses

42,833


42,312


312,425


144,812


(Loss) income from operations

(10,724

)


10,833


(226,065

)


1,289


Other (expense) income


Interest expense

(11,399

)


(11,295

)


(33,521

)


(32,730

)

Change in fair value of warrants


(100

)


363


594


(Loss) gain on derivative financial instruments

(9,656

)


21,546


70,373


(5,177

)

Reorganization items, net

(3,072

)


(3,072

)


Total other (expense) income

(24,127

)


10,151


34,143


(37,313

)

(Loss) income before income taxes

(34,851

)


20,984


(191,922

)


(36,024

)

Income tax benefit (expense)

49


(4,767

)


5,736


6,966


Net (loss) income

(34,802

)


16,217


(186,186

)


(29,058

)

Preferred stock dividends


(2,159

)


(4,566

)


(6,336

)

Undeclared cumulative preferred stock dividends

(3,671

)


(3,671

)


Net (loss) income attributable to common stockholders

$

(38,473

)


$

14,058


$

(194,423

)


$

(35,394

)


Net (loss) income per common share


Basic

$

(1.52

)


$

0.34


$

(7.70

)


$

(1.42

)

Diluted

$

(1.52

)


$

0.33


$

(7.70

)


$

(1.42

)


Weighted average common shares outstanding


Basic

25,361,361


24,933,853


25,238,972


24,852,994


Diluted

25,361,361


25,331,810


25,238,972


24,852,994


See accompanying Notes to Unaudited Condensed Consolidated Financial Statements.


Lonestar Resources US Inc.

Unaudited Condensed Consolidated Statements of Cash Flows

(In thousands)


Nine Months Ended September 30,


2020


2019

Cash flows from operating activities


Net loss

$

(186,186

)


$

(29,058

)

Adjustments to reconcile net loss to net cash provided by operating activities:


Depreciation, depletion and amortization

59,184


64,120


Stock-based compensation

(2,001

)


1,294


Deferred taxes

(931

)


(6,983

)

(Gain) loss on derivative financial instruments

(70,373

)


5,177


Settlements of derivative financial instruments

66,761


(3,858

)

Non-cash reorganization items

3,072


Impairment of oil and natural gas properties

199,908


Loss (gain) on disposal of property and equipment

83


(17

)

Loss on sale of oil and gas properties

1,254


33,530


Non-cash interest expense

2,002


1,822


Change in fair value of warrants

(363

)


(594

)

Changes in operating assets and liabilities:


Accounts receivable

(5,413

)


(8,330

)

Prepaid expenses and other assets

(2,004

)


(1,102

)

Accounts payable and accrued expenses

17,738


(3,128

)

Net cash provided by operating activities

82,731


52,873


Cash flows from investing activities


Acquisition of oil and gas properties

(2,186

)


(5,239

)

Development of oil and gas properties

(97,973

)


(119,273

)

Proceeds from sale of oil and gas properties

11,913


11,470


Purchases of other property and equipment

(1,014

)


(3,527

)

Net cash used in investing activities

(89,260

)


(116,569

)


Cash flows from financing activities


Proceeds from borrowings

48,157


114,000


Payments on borrowings

(8,154

)


(52,218

)

Net cash provided by financing activities

40,003


61,782


Net increase (decrease) in cash and cash equivalents

33,474


(1,914

)

Cash and cash equivalents, beginning of the period

3,137


5,355


Cash and cash equivalents, end of the period

$

36,611


$

3,441


Supplemental information:


Cash paid for interest

$

23,831


$

28,125


Non-cash investing and financing activities:


Undeclared cumulative dividends on preferred stock

$

3,671


$


Change in asset retirement obligation

272


(292

)

Change in liabilities for capital expenditures

(37,269

)


9,098


See accompanying Notes to Unaudited Condensed Consolidated Financial Statements.

NON-GAAP FINANCIAL MEASURES (Unaudited)
Reconciliation of Non-GAAP Financial Measures

Adjusted EBITDAX

Adjusted EBITDAX is not a measure of net income as determined by GAAP. Adjusted EBITDAX is a supplemental non-GAAP financial measure that is used by management and external users of the Company’s consolidated financial statements, such as industry analysts, investors, lenders and rating agencies. The Company defines Adjusted EBITDAX as net (loss) income attributable to common stockholders before depreciation, depletion, amortization and accretion, exploration costs, non-recurring costs, loss (gain) on sales of oil and natural gas properties, impairment of oil and gas properties, stock-based compensation, interest expense, income tax (benefit) expense, rig standby expense, other income (expense), unrealized (gain) loss on derivative financial instruments and unrealized (gain) loss on warrants.

Management believes Adjusted EBITDAX provides useful information to investors because it assists investors in the evaluation of the Company’s operating performance and comparison of the results of the Company’s operations from period to period without regard to its financing methods or capital structure. The Company excludes the items listed above from net (loss) income attributable to common stockholders in arriving at Adjusted EBITDAX to eliminate the impact of certain non-cash items or because these amounts can vary substantially from company to company within its industry depending upon accounting methods and book values of assets, capital structures and the method by which the assets were acquired. Adjusted EBITDAX should not be considered as an alternative to, or more meaningful than, net (loss) income attributable to common stockholders as determined in accordance with GAAP. Certain items excluded from Adjusted EBITDAX are significant components in understanding and assessing a company’s financial performance, such as a company’s cost of capital and tax structure, as well as the historic costs of depreciable assets, none of which are components of Adjusted EBITDAX. The Company’s computations of Adjusted EBITDAX may not be comparable to other similarly titled measures of other companies.

The following table presents a reconciliation of Adjusted EBITDAX to the GAAP financial measure of net (loss) income attributable to common stockholders for each of the periods indicated.


Three Months Ended September 30,


Nine Months Ended September 30,

($ in thousands)


2020


2019


2020


2019

Net (loss) income attributable to common stockholders


$

(38,473

)


$

14,058


$

(194,423

)


$

(35,394

)

Income tax (benefit) expense


(49

)


4,767


5,736


(6,966

)

Interest expense(1)


15,070


13,454


41,758


39,066


Exploration expense


190


Depreciation, depletion and amortization


18,256


24,635


59,184


64,120


EBITDAX


(5,196

)


56,914


(87,745

)


61,016


Rig standby expense


183


135


617


552


Non-recurring costs(2)


12,400


14,280


Stock-based compensation


942


(1,729

)


1,970


Loss on sale of oil and gas properties


483


1,254


33,530


Impairment of oil and gas properties


199,908


Reorganization Items


3,072


3,072


Unrealized loss (gain) on derivative financial instruments


48,354


(22,098

)


(2,439

)


(349

)

Realized gain on derivative financial instruments(3)


(26,474

)


(26,474

)


Unrealized loss (gain) on warrants


100


(363

)


(593

)

Other expense (income)


117


576


(48

)


1,435


Adjusted EBITDAX


$

32,456


$

37,052


$

100,333


$

97,561


(1) Interest expense also includes paid and undeclared dividends on Series A Preferred Stock

(2) Non-recurring professional fees

(3) Represents realized gains for hedges terminated in September 2020 that originally would have settled subsequent to period end.


Contacts

Chase Booth, 817-921-1889


Read full story here

  • New project represents innovative, sustainable production to meet growing demand for insect protein in animal feed, a market that has potential to reach 1 million tons in 2027
  • Construction of high-capacity facility to support hundreds of jobs in Decatur area, targeted to begin in 2021, pending permits and approvals

CHICAGO & PARIS--(BUSINESS WIRE)--ADM (NYSE:ADM), one of the world’s leading human and animal nutrition providers, and InnovaFeed, the world leader in producing premium insect ingredients for animal feed, today announced plans to collaborate on the construction and operation of the world’s largest insect protein production site, in Decatur, Illinois. The facility will be owned and operated by InnovaFeed and will co-locate with ADM’s Decatur corn processing complex, with ADM supplying feedstocks, waste heat and more. Together, these investments will bolster economic growth and job creation in Decatur and central Illinois while continuing to strengthen the state’s position as a center of innovative, sustainable agriculture.


“We are very pleased to launch this ambitious project, working alongside ADM and Illinois state partners as InnovaFeed expands to provide sustainable solutions to meet the fast growing demand for insect feed in the US and worldwide,” said Clement Ray, CEO and co-founder of InnovaFeed. “Around the world, InnovaFeed is contributing to the emergence of sustainable food systems by developing a pioneering and sustainable industry. Our new operations in Illinois, a global leader and destination for agriculture, will allow us to take the next steps to innovate and grow our business.”

“At a time when the demand for animal feed protein is steadily increasing, insect farming stands out as a true solution for the future,” said Chris Cuddy, ADM senior vice president and president of the company’s Carbohydrate Solutions business. “We’re excited to work with InnovaFeed on this ambitious project, which further expands our participation in the growing market for animal food and feed that comes from responsible, sustainable sources. It’s a great demonstration of how ADM is expanding its value chain by offering opportunities for collaboration to leading, innovative startups. It’s yet another example of how we’re constantly identifying new ways to create value from corn, oilseeds and more. And of course, we’re extremely proud that we can help bring this new, job-creating project to Decatur, the home of our North American headquarters.”

Insect feed has become an increasingly popular protein ingredient for the agriculture and aquaculture industries, as demand for animal feed has now reached an all-time high and consumers look for food that is sustainably and responsibly grown. InnovaFeed already operates two insect production facilities in France, including what is today the world’s largest. The Decatur facility represents InnovaFeed’s first international project.

“InnovaFeed’s decision to bring their first ever international facility and state-of-the-art agriculture technology to Illinois is a vote of confidence for our state, and a win for our farming communities,” said Governor JB Pritzker. “Illinois has always been a global leader in agriculture and technology, and we offer the resources to support this major international expansion – with an educated workforce, proximity to global businesses like ADM, and access to shipping and logistics. The investments InnovaFeed is making in Decatur will not only support our thriving agriculture industry – a cornerstone of our economy – but will unlock new well-paying jobs for our communities.”

Construction of the new high-capacity facility is expected to create more than 280 direct and 400 indirect jobs in the Decatur region by the second phase. The Illinois Department of Commerce and Economic Opportunity (DCEO) and the Illinois workNet Center will partner with InnovaFeed to develop recruiting strategies as well as on-the-job training programs. DCEO also partnered with InnovaFeed through an EDGE agreement to support this large-scale capital investment. Locally, InnovaFeed will benefit from the Decatur-Macon County Enterprise Zone and customized incentive opportunities from the City of Decatur and Economic Development Corporation of Decatur-Macon County.

Construction is targeted to begin in 2021, pending necessary permitting and approvals. Construction and production will come in two phases. When both are complete, the plant would have a target annual production capacity of 60,000 metric tons of animal feed protein derived from Hermetia Illucens, a type of fly with exceptional nutritional qualities; the plant will also have the capability to produce 20,000 metric tons every year of oils for poultry and swine rations, and 400,000 metric tons of fertilizer.

“Illinois remains open for business, and companies continue to choose Illinois for growth based on our industry strengths, talent, education and access to infrastructure,” said Illinois Department of Commerce & Economic Opportunity Director Erin Guthrie. “With agriculture a leading industry and employer for communities across our state, these investments by InnovaFeed to bring their one-of-a-kind technology will support our farmers and those who rely upon farms. We look forward to partnering with the company on ensuring our local residents have access to jobs and economic opportunity created by this exciting new project in Decatur.”

"The city of Decatur is pleased to partner with InnovaFeed to bring this unique and innovative facility to our community,” said Decatur Mayor Julie Moore Wolfe. “Not only will this project fuel both direct and indirect job creation, but it affirms that our best prospects for creating new jobs are in the agri-business sector, in partnership with our existing businesses, in a city that is an ideal place for groundbreaking advanced manufacturing. ADM, the State of Illinois, the Economic Development Corporation of Decatur-Macon County, and the City of Decatur worked together to bring this plant to Decatur. Our concierge approach results in joint incentive opportunities to support InnovaFeed’s infrastructure and operational needs."

The plant will be built using an innovative model of industrial collaboration that InnovaFeed has already demonstrated in other facilities enabling the French Biotech company to produce the insect protein with the lowest carbon footprint on the market. The plant will be co-located with ADM’s Decatur corn complex, with complementary infrastructure that will allow ADM to directly provide corn by-products to supply InnovaFeed’s innovative insect rearing process, as well as waste heat and steam. This collaborative operational model will enable the InnovaFeed facility to reduce CO2 emissions by 80 percent versus standalone production.

About ADM

At ADM, we unlock the power of nature to provide access to nutrition worldwide. With industry-advancing innovations, a complete portfolio of ingredients and solutions to meet any taste, and a commitment to sustainability, we give customers an edge in solving the nutritional challenges of today and tomorrow. We’re a global leader in human and animal nutrition and the world’s premier agricultural origination and processing company. Our breadth, depth, insights, facilities and logistical expertise give us unparalleled capabilities to meet needs for food, beverages, health and wellness, and more. From the seed of the idea to the outcome of the solution, we enrich the quality of life the world over. Learn more at www.adm.com.

About InnovaFeed

InnovaFeed is a biotech company that produces a new source of protein from insect rearing (Hermetia Illucens) for animal and plant nutrition. InnovaFeed’s mission is to participate in the rise of sustainable food systems by addressing the increasing demand for natural, healthy and competitive raw materials. Combining the largest production capacity on the market and state of the art research in biotechnology, InnovaFeed has developed an innovative technology and process enabling the production of high-quality insect ingredients at industrial scale and at a competitive price.

www.innovafeed.com

Source: Corporate Release


Contacts

Press contacts:
For InnovaFeed: Marianne Rageot, +337 78 21 51 09, This email address is being protected from spambots. You need JavaScript enabled to view it.
For ADM: Jackie Anderson, 312-634-8484, This email address is being protected from spambots. You need JavaScript enabled to view it.
For State of Illinois: Lauren Huffman, 217-622-0435, This email address is being protected from spambots. You need JavaScript enabled to view it.
For Economic Development Corporation of Decatur-Macon County: Nicole Bateman, 217-369-1509, This email address is being protected from spambots. You need JavaScript enabled to view it.

Offshore Source Logo

Offshore Source keeps you updated with relevant information concerning the Offshore Energy Sector.

Any views or opinions represented on this website belong solely to the author and do not represent those of the people, institutions or organizations that Offshore Source or collaborators may or may not have been associated with in a professional or personal capacity, unless explicitly stated.

Corporate Offices

Technology Systems Corporation
8502 SW Kansas Ave
Stuart, FL 34997

info@tscpublishing.com