Business Wire News

Emerges from Chapter 11 and Appoints New Board of Directors

TULSA, Okla.--(BUSINESS WIRE)--Unit Corporation (Company) today announced that it has emerged from Chapter 11 bankruptcy protection. This marks the successful completion of the Company's financial restructuring process along with implementing the Company's Plan of Reorganization (Plan), which was confirmed by the U.S. Bankruptcy Court for the Southern District of Texas, Houston Division on August 6, 2020.


"Our successful financial restructuring positions us to handle current challenges in the oil and gas industry and realize the potential of our Company," said David T. Merrill, President and Chief Executive Officer. "We look forward to continuing to enhance our financial strength and using our strengths, teamwork, and focus to improve our performance as a Company. On behalf of the Company and newly appointed Board of Directors, I would like to express our gratitude to our employees for their continued hard work and dedication during this process."

New Capital Structure

Under the Plan, the Company will complete a debt-for-equity exchange with the holders of the Company's previous 6.625% senior subordinated notes (Subordinated Notes) and will exchange its prior common stock (old common stock) for warrants to purchase its new common stock. As part of the Plan, the Company converted its existing credit facility agented by BOKF, NA into a $140 million reserve-based lending revolving loan and $40 million term loan, which remains agented by Tulsa headquartered BOKF, NA and committed by all lenders under the previous facility (the lenders). Additionally, the Company will have significantly reduced its unsecured debt liabilities, further bolstering its balance sheet.

Credit Facility

Under the terms of the Plan, the Company and certain subsidiaries (Borrowers) entered into an amended and restated credit agreement with the lenders and BOKF, NA, as administrative agent (Exit Credit Agreement) providing for a $140 million senior secured revolving credit facility (RBL Facility) and a $40 million senior secured term loan facility (Term Loan Facility). The maturity date of borrowings under the Exit Credit Agreement is March 1, 2024. As of September 3, 2020, the Borrowers had (i) $40 million in principal amount of Term Loans outstanding under the Term Loan Facility, (ii) approximately $92 million in principal amount of revolving loans outstanding under the RBL Facility and (iii) approximately $6.7 million of outstanding letters of credit.

New Common Stock

The Company will issue a total of 12 million shares of new common stock, par value $0.01 per share. Of the total outstanding shares, 95% will be issued to holders of the Subordinated Notes and holders of certain allowed general unsecured claims, and 5% has been issued to the lenders under the Exit Credit Agreement.

Warrants

Under the Plan, warrants to purchase up to an aggregate of approximately 1.8 million shares of the Company’s new common stock will be issued to holders of old common stock. The exercise price of the warrants will be determined and the warrants will become exercisable once all general unsecured claims are resolved. The Company will calculate the initial exercise price per share for the warrants, which will be set at an amount that implies a recovery by holders of the Subordinated Notes of the $650 million principal amount of the Subordinated Notes plus interest thereon to the May 15, 2021 maturity date of the Subordinated Notes.

New Board of Directors

A new Board of Directors was appointed upon the Company's emergence, providing valuable expertise and experience to the Company as it moves forward post-restructuring. The new Board of Directors consists of seven members, including Robert Anderson, Alan Carr, Phil Frohlich, Steven Hildebrand, David Merrill, Philip Smith, and Andrei Verona.

Trading on an OTC Market

The Company is seeking to facilitate trading of the new common stock on one of the OTC markets. Such market will be determined by the Board of Directors. The Company expects to complete this process during the 2020 fourth quarter and will publicly disclose the results once completed.

The Company expects the debt for equity exchange and the common stock for warrant exchange under the Plan to be completed during the 2020 fourth quarter. More information about these Chapter 11 cases can be accessed via PACER at https://www.pacer.gov and https://cases.primeclerk.com/UnitCorporation or by calling (877) 720-6581 (Toll-Free) or (646) 979-4412 (Local).

Vinson & Elkins L.L.P. served as legal advisor, Evercore Group L.L.C. served as investment banker, and Opportune LLP served as restructuring advisor to the Company.

Weil, Gotshal & Manges LLP served as legal advisor and Greenhill & Co., LLC served as financial advisor to an ad hoc group of holders of Subordinated Notes.

About the Company

Unit Corporation is a Tulsa-based energy company engaged through its subsidiaries in oil and gas exploration, production, contract drilling and natural gas gathering and processing. For more information about Unit Corporation, visit its website at http://www.unitcorp.com.

Forward-Looking Statements

This news release contains “forward-looking statements” within the meaning of the safe harbor provisions of Section 27A of the Securities Act of 1933, as amended, and Section 21E of the Securities Exchange Act of 1934, as amended. Forward-looking statements are not statements of historical facts and often contain words such as “may,” “will,” “expect,” “believe,” “anticipate,” “plan,” “estimate,” “seek,” “could,” “should,” “intend,” “potential,” or words of similar meaning. Forward-looking statements are based on management’s current expectations, beliefs, assumptions and estimates regarding the Company, industry, economic conditions, government regulations and energy policies and other factors. Forward- looking statements may include, for example, statements regarding the Company’s ability to continue to operate successfully following emergence and completing the debt for equity and common stock for warrant exchanges. These statements are subject to significant risks, uncertainties, and assumptions difficult to predict and could cause actual results to differ materially and adversely from those expressed or implied in the forward-looking statements, including risks and uncertainties regarding management's expectations of plans, strategies, objectives, growth and anticipated financial and operational performance; financial prospects; anticipated sources and uses of capital and other matters. Forward-looking statements are also subject to the risk factors and cautionary language described occasionally in the reports and registration statements the Company files with the Securities and Exchange Commission, including those in the Company’s most recent Annual Report on Form 10-K and any updates thereto in the Company’s Quarterly Reports on Form 10-Q and Current Reports on Form 8-K. Additional factors, events, or uncertainties that may emerge occasionally, or those that the Company deems immaterial, could cause the Company’s actual results to differ, and it is impossible for the Company to predict them all. The Company makes forward-looking statements based on currently available information, and the Company assumes no obligation to, and expressly disclaim any obligation to, update or revise publicly any forward-looking statements made in this news release, whether because of new information, future events or otherwise, except as required by law.


Contacts

Michael D. Earl
Vice President, Investor Relations
(918) 493-7700

- Three new independent directors join Board of Directors

- Chief Executive Officer Kenneth Young and Chief Strategy Officer Henry Bartoli also join Board

- New directors are part of a well-planned transition and strategic shift to accelerate growth in light of improved operational stability

- Five directors have retired, and the new Board is comprised of six members with four serving independently

- Kenneth Young succeeds Matthew Avril as Chairman of the Board and current director Alan Howe named Lead Independent Director

-Company to host conference call today to discuss the Board changes and provide an operational update

AKRON, Ohio--(BUSINESS WIRE)--$BW #BabcockWilcox--Babcock & Wilcox Enterprises, Inc. ("B&W" or the "Company") (NYSE: BW) today announced the appointment of three new independent members to its Board of Directors, reflecting a well-planned transition and strategic shift to accelerate growth within B&W in light of improved operational stability. The new independent members are Philip Moeller, Rebecca Stahl and Joseph Tato. CEO Kenneth Young and Chief Strategy Officer Henry Bartoli have also joined the Board, with Young appointed as Chairman of the Board.


In connection with this transition, Matthew Avril (former Chairman), Cynthia Dubin, Brian Kahn, Bryant Riley and Kenneth Siegel have retired from the Board. As a result of the transition, the new Board is comprised of six members, with four serving as independent directors, including current Director Alan Howe becoming Lead Independent Director. In order to provide continuity, the retiring Board members will be available to provide support to the new Board through the end of the year.

“Our announcement today marks a moment of significant transition for B&W, highlighting the Company’s recent refinancing and improved operational stability,” said former Chairman Matthew Avril. “I would like to express my appreciation to the retiring directors for their tireless efforts and guidance to the Company over the last few years, overseeing the resolution of a wide range of complex financial and operational issues. The new Board has industry depth and expertise to help guide B&W through its next phase.”

Kenneth Young, B&W’s Chief Executive Officer and Chairman, stated: “B&W is on an exciting path forward as we work to execute on our growth strategy, including expanding our global sales team, pursuing strategic investments in new technologies, and capitalizing on a robust global pipeline within our new Renewable, Environmental and Thermal segments. The new directors have strong and successful backgrounds across each of these segments and are well experienced in global growth initiatives. We greatly appreciate the efforts of the previous Board and their support during the past several years as we focused on reducing losses on our EPC projects and refinancing our debt, as well as their willingness to be available to support the Board transition. Our recent organizational re-alignment and re-branding efforts reflect our mission to provide solutions to our customers around the world while providing proven, industry-leading technologies. With our financial position now strengthened, reconstituting the Board is a logical next step as we focus on our long-term growth opportunities.”

Bryant Riley, former B&W board member as well as Chairman and Co-Chief Executive Officer of B. Riley Financial Inc., added: “B&W’s recent turnaround success has solidified our confidence in the Company’s operational stability and growth trajectory. We have the utmost confidence in the skillset of the Company’s management and new directors as B&W enters the next phase of its corporate evolution.”

Brian Kahn, departing B&W board member added “Kenny and his team have done a tremendous job moving the Company past the costly legacy fixed-price EPC projects, restructuring B&W as a whole, and extending the Company’s financing out two years. The incoming board members bring skillsets, relationships, and overall experience that are well-suited to accelerate the advancement of B&W in renewable energy, environmental, and thermal technologies, which we believe will collectively drive shareholder value over the next several years.”

New Members of the Board of Directors

Henry E. Bartoli is the Chief Strategy Officer of Babcock & Wilcox. Bartoli is a seasoned executive with more than 35 years of experience in the global power industry, and more recently served as President and Chief Executive Officer of Hitachi Power Systems America, LTD from 2004 to 2014. From 2002 to 2004, Bartoli was Executive Vice President of The Shaw Group, after serving in a number of senior leadership roles at Foster Wheeler Ltd. from 1992 to 2002, including Group Executive and Corporate Senior Vice President, Energy Equipment Group, and Group Executive and Corporate Vice President and Group Executive, Foster Wheeler Power Systems Group. From 1971 to 1992, he served in a number of positions of increasing importance at Burns and Roe Enterprises, Inc. Bartoli also serves as a member of the Board of Directors of Fermilab, United States’ premier particle physics laboratory owned by the U.S. Department of Energy.

Bartoli earned a B.A. in mechanical engineering from Rutgers University, and a M.S. in mechanical engineering from New Jersey Institute of Technology.

Philip Moeller serves as Executive Vice President, Business Operations Group and Regulatory Affairs at the Edison Electric Institute (EEI), which is an association that represents all of the nation’s investor-owned electric companies. Within the role, Moeller oversees issues impacting the future structure of the electric power industry, new rules in evolving competitive markets, and strategic areas of energy supply, environmental and regulatory issues, among others. Prior to joining EEI in 2016, Moeller served as a Commissioner on the Federal Energy Regulatory Commission (FERC) from 2006 – 2015. Earlier in his career, Moeller headed the Washington, D.C., office of Alliant Energy Corporation, served as a Senior Legislative Assistant for Energy Policy to U.S. Senator Slade Gorton (R-WA), and as the Staff Coordinator of the Washington State Senate Energy and Telecommunications Committee in Olympia, Washington.

Moeller received his B.A. in Political Science from Stanford University.

Rebecca Stahl currently serves as the Chief Financial Officer of The Association for Manufacturing Technology (AMT), an organization that represents and promotes U.S.-based manufacturing technology and its members and holds 25 years of experience in finance and accounting. Prior to AMT, Rebecca held the Chief Financial Officer position at Lightbridge Communications Corporation (LCC) from 2008 - 2015, a multinational wireless engineering company, and was awarded the Private Company Chief Financial Officer of the Year Award from Northern Virginia Technology Council in 2015. Earlier in her career, Stahl also held roles at BT Infonet, the Walt Disney Company and Arthur Anderson.

Stahl received her B.S. in Accounting from The Pennsylvania State University and an MBA from the Anderson School of Management at University of California Los Angeles. She is also a certified public accountant.

Joseph Tato is a partner at Covington & Burling, LLP, one of the world’s leading regulatory practices. Tato regularly represents project sponsors, equity investors, financial institutions, and governments in the development and financing of power, oil and gas, LNG, renewables, water, mining, and other infrastructure projects in the U.S., Africa, Latin America, and Europe. Prior to that, Tato held positions as Partner, Chair of Projects and Infrastructure, and Co-Chair of Energy Sector at DLA Piper, LLP and worked at LeBoeuf, Lamb, Greene & MacRae, LLP (Dewey & LeBoeuf), holding positions of Partner, Chair of Global Project Finance and Chair of Africa Practice.

Tato earned his B.A. from Columbia College, M.A. from Columbia University and J.D. from New York University School of Law.

Kenneth Young has served as Chief Executive Officer of Babcock & Wilcox (B&W) since November 2018 and Chairman since September 2020, has more than 30 years of operational, executive and director experience, primarily within the energy, communications and finance industries, on a global basis. He currently serves as President of B. Riley Financial, Inc., and Chief Executive Officer for B. Riley Principal Investments, a wholly owned subsidiary of B. Riley Financial.

Before joining B. Riley, he held executive leadership positions with Lightbridge Communications Corporation (LCC), which was the largest independent telecom construction and services company in the world and a recognized leader in providing network services. Initially serving as President and Chief Operating Officer of the Americas for LCC, he was named President and CEO in 2008, serving in that position until he led the company’s sale in 2015. Under his leadership, LCC’s revenues grew more than 200 percent and the company expanded its geographical presence into more than 50 countries. Prior to joining LCC, Young was Chief Marketing and Operations Officer with Liberty Media’s TruePosition and held various senior executive positions with multiple corporations, including Cingular Wireless, SBC Wireless, Southwestern Bell Telephone and AT&T as part of his 16-year tenure within the now-combined AT&T Corporation.

Young holds a Bachelor of Science in Computer Science from Graceland University and a Master of Business Administration from the University of Southern Illinois.Young has previously served on seven public company boards and is currently a member of the Board of Directors for Sonim Technologies NASDAQ: (SONM) and B. Riley Principal Merger Corp. II NYSE: (BMRG).

Conference Call Information

B&W plans to host a conference call today, Thursday, September 3, 2020 at 10 a.m. E.T. to discuss the Company’s Board changes and provide an operational update. The listen-only audio of the conference call will be broadcast live via the Internet on B&W’s Investor Relations site. The dial-in number for participants in the U.S. is (833) 227-5843; the dial-in number for participants outside the U.S. is (647) 689-4070. The conference ID for all participants is 8117968. A replay of this conference call will remain accessible in the investor relations section of the Company's website for a limited time.

Forward-Looking Statements

B&W cautions that this release contains forward-looking statements, including, without limitation, statements relating to expectations regarding future growth, expansion and profitability, as well as statements about B&W’s future pipeline of new projects and business within its new Renewable, Environmental and Thermal operating segments and their impact on future shareholder value. These forward-looking statements are based on management’s current expectations and involve a number of risks and uncertainties, including, among other things, the impact of COVID-19 on us, the capital markets and the global economic climate generally; our recognition of any asset impairments as a result of any decline in the value of our assets or our efforts to dispose of any assets in the future; our ability to obtain and maintain sufficient financing to provide liquidity to meet our business objectives, surety bonds, letters of credit and similar financing; our ability to comply with the requirements of, and to service the indebtedness under, our credit agreement as amended and restated; our ability to obtain waivers of required pension contributions; the highly competitive nature of our businesses and our ability to win work, including identified project opportunities in our pipeline; general economic and business conditions, including changes in interest rates and currency exchange rates; cancellations of and adjustments to backlog and the resulting impact from using backlog as an indicator of future earnings; our ability to perform contracts on time and on budget, in accordance with the schedules and terms established by applicable contracts with customers; failure by third-party subcontractors, partners or suppliers to perform their obligations on time and as specified; our ability to successfully resolve claims by vendors for goods and services provided and claims by customers for items under warranty; our ability to realize anticipated operational and strategic benefits from our new board members and new market-focused initiatives; our ability to successfully address productivity and schedule issues in fulfilling our customer agreements, including the ability to complete our EPC projects and other loss projects within the expected time frame and the estimated costs; our ability to successfully partner with third parties to win and execute new contracts; changes in our effective tax rate and tax positions, including any limitation on our ability to use our net operating loss carryforwards and other tax assets; our ability to maintain operational support for our information systems against service outages and data corruption, as well as protection against cyber-based network security breaches and theft of data; our ability to protect our intellectual property and renew licenses to use intellectual property of third parties; our use of the percentage-of-completion method of accounting to recognize revenue over time; our ability to successfully manage research and development projects and costs, including our efforts to successfully develop and commercialize new technologies and products; the operating risks normally incident to our lines of business, including professional liability, product liability, warranty and other claims against us; changes in, or our failure or inability to comply with, laws and government regulations; actual or anticipated changes in governmental regulation, including trade and tariff policies; difficulties we may encounter in obtaining regulatory or other necessary permits or approvals; changes in, and liabilities relating to, existing or future environmental regulatory matters; changes in actuarial assumptions and market fluctuations that affect our net pension liabilities and income; potential violations of the Foreign Corrupt Practices Act; our ability to successfully compete with current and future competitors; the loss of key personnel and the continued availability of qualified personnel; our ability to negotiate and maintain good relationships with labor unions; changes in pension and medical expenses associated with our retirement benefit programs; social, political, competitive and economic situations in foreign countries where we do business or seek new business; the possibilities of war, other armed conflicts or terrorist attacks; the willingness of customers and suppliers to continue to do business with us on reasonable terms and conditions; our ability to successfully consummate strategic alternatives for non-core assets, if we determine to pursue them; the impact of the upcoming U.S. Presidential and Congressional elections; and the other factors specified and set forth under "Risk Factors" in our periodic reports filed with the Securities and Exchange Commission, including our most recent annual report on Form 10-K and our quarterly report on Form 10-Q for the quarter ended June 30, 2020. The Company cautions not to place undue reliance on these forward-looking statements, which speak only as of the date of this report, and the Company undertakes no obligation to update or revise any forward-looking statement, except to the extent required by applicable law.

About B&W Enterprises

Headquartered in Akron, Ohio, Babcock & Wilcox Enterprises is a global leader in energy and environmental technologies and services for the power and industrial markets. Follow us on Twitter @BabcockWilcox and learn more at www.babcock.com.


Contacts

Investor Contact:
Megan Wilson
Vice President, Corporate Development & Investor Relations
Babcock & Wilcox Enterprises
704.625.4944 | This email address is being protected from spambots. You need JavaScript enabled to view it.

Media Contact:
Ryan Cornell
Public Relations
Babcock & Wilcox Enterprises
330.860.1345 | This email address is being protected from spambots. You need JavaScript enabled to view it.

LONDON--(BUSINESS WIRE)--#AircraftFuelSystemsMarket--Technavio has been monitoring the global aircraft fuel systems market and it is poised to grow by USD 752.31 million during 2020-2024, progressing at a CAGR of over 3% during the forecast period. The report offers an up-to-date analysis regarding the current market scenario, latest trends and drivers, and the overall market environment.


Although the COVID-19 pandemic continues to transform the growth of various industries, the immediate impact of the outbreak is varied. While a few industries will register a drop in demand, numerous others will continue to remain unscathed and show promising growth opportunities. Technavio’s in-depth research has all your needs covered as our research reports include all foreseeable market scenarios, including pre- & post-COVID-19 analysis. We offer $1000 worth of FREE customization

The market is fragmented, and the degree of fragmentation will accelerate during the forecast period. ALOFT AeroArchitects, BAE Systems Plc, Crane Co., Eaton Corporation Plc, Honeywell International Inc., Parker Hannifin Corp., Raytheon Technologies Corp., Safran SA, Senior Plc, and Woodward Inc. are some of the major market participants. To make the most of the opportunities, market vendors should focus more on the growth prospects in the fast-growing segments, while maintaining their positions in the slow-growing segments.

Buy 1 Technavio report and get the second for 50% off. Buy 2 Technavio reports and get the third for free.

View market snapshot before purchasing

The increase in aircraft design innovations has been instrumental in driving the growth of the market. However, the increase in environmental regulations might hamper market growth.

Technavio's custom research reports offer detailed insights on the impact of COVID-19 at an industry level, a regional level, and subsequent supply chain operations. This customized report will also help clients keep up with new product launches in direct & indirect COVID-19 related markets, upcoming vaccines and pipeline analysis, and significant developments in vendor operations and government regulations. Download a Free Sample Report on COVID-19 Impacts

Aircraft Fuel Systems Market 2020-2024: Segmentation

Aircraft Fuel Systems Market is segmented as below:

  • Technology
    • Fuel Injection Systems
    • Pump Feed Systems
    • Gravity Feed Systems
  • Geographic Landscape
    • North America
    • Europe
    • APAC
    • South America
    • MEA

Aircraft Fuel Systems Market 2020-2024: Scope

Technavio presents a detailed picture of the market by the way of study, synthesis, and summation of data from multiple sources. The aircraft fuel systems market report covers the following areas:

  • Aircraft Fuel Systems Market Size
  • Aircraft Fuel Systems Market Trends
  • Aircraft Fuel Systems Market Industry Analysis

This study identifies the growing popularity of additive manufacturing as one of the prime reasons driving the Aircraft Fuel Systems Market growth during the next few years.

Technavio suggests three forecast scenarios (optimistic, probable, and pessimistic) considering the impact of COVID-19. Technavio’s in-depth research has direct and indirect COVID-19 impacted market research reports.

Register for a free trial today and gain instant access to 17,000+ market research reports.

Technavio's SUBSCRIPTION platform

Aircraft Fuel Systems Market 2020-2024: Key Highlights

  • CAGR of the market during the forecast period 2020-2024
  • Detailed information on factors that will assist aircraft fuel systems market growth during the next five years
  • Estimation of the aircraft fuel systems market size and its contribution to the parent market
  • Predictions on upcoming trends and changes in consumer behavior
  • The growth of the aircraft fuel systems market
  • Analysis of the market’s competitive landscape and detailed information on vendors
  • Comprehensive details of factors that will challenge the growth of aircraft fuel systems market, vendors

Table of Contents:

Executive Summary

Market Landscape

  • Market ecosystem
  • Value chain analysis

Market Sizing

  • Market definition
  • Market segment analysis
  • Market size 2019
  • Market outlook: Forecast for 2019-2024

Five Forces Analysis

  • Five forces summary
  • Bargaining power of buyers
  • Bargaining power of suppliers
  • Threat of new entrants
  • Threat of substitutes
  • Threat of rivalry
  • Market condition

Market Segmentation by Technology

  • Market segments
  • Comparison by Technology
  • Fuel injection systems - Market size and forecast 2019-2024
  • Pump feed systems - Market size and forecast 2019-2024
  • Gravity feed systems - Market size and forecast 2019-2024
  • Market opportunity by Technology

Customer landscape

Geographic Landscape

  • Geographic segmentation
  • Geographic comparison
  • North America - Market size and forecast 2019-2024
  • Europe - Market size and forecast 2019-2024
  • APAC - Market size and forecast 2019-2024
  • South America - Market size and forecast 2019-2024
  • MEA - Market size and forecast 2019-2024
  • Key leading countries
  • Market opportunity by geography
  • Volume drivers – Demand led growth
  • Market challenges
  • Market trends

Vendor Landscape

  • Overview
  • Vendor landscape
  • Landscape disruption

Vendor Analysis

  • Vendors covered
  • Market positioning of vendors
  • ALOFT AeroArchitects
  • BAE Systems Plc
  • Crane Co.
  • Eaton Corporation Plc
  • Honeywell International Inc.
  • Parker Hannifin Corp.
  • Raytheon Technologies Corp.
  • Safran SA
  • Senior Plc
  • Woodward Inc.

Appendix

  • Scope of the report
  • Currency conversion rates for US$
  • Research methodology
  • List of abbreviations

About Us

Technavio is a leading global technology research and advisory company. Their research and analysis focus on emerging market trends and provides actionable insights to help businesses identify market opportunities and develop effective strategies to optimize their market positions. With over 500 specialized analysts, Technavio’s report library consists of more than 17,000 reports and counting, covering 800 technologies, spanning across 50 countries. Their client base consists of enterprises of all sizes, including more than 100 Fortune 500 companies. This growing client base relies on Technavio’s comprehensive coverage, extensive research, and actionable market insights to identify opportunities in existing and potential markets and assess their competitive positions within changing market scenarios.


Contacts

Technavio Research
Jesse Maida
Media & Marketing Executive
US: +1 844 364 1100
UK: +44 203 893 3200
Email: This email address is being protected from spambots. You need JavaScript enabled to view it.
Website: www.technavio.com/

RICHMOND, Va.--(BUSINESS WIRE)--Synalloy Corporation (Nasdaq: SYNL), today announced its results for the second quarter of 2020. On June 30, 2020, management and the Board of Directors committed to and approved a plan to pursue a sale and exit of its Palmer Tanks of Texas, Inc. business and is actively marketing the sale of the assets.


During the second quarter of 2020, the Company realized operating losses of $1.9 million and non-cash, pre-tax charges totaling $6.1 million for asset impairments related to the Palmer of Texas Tanks, Inc. business. "The volatility of this business unit accelerated in recent years, reflecting the chaotic oil market. The COVID-19 pandemic created a demand shock that further exacerbated an oversupply of oil worldwide. WTI prices have fallen to levels where drilling in the Permian Basin no longer covers the cost of capital. Prospects for improvement in the short and intermediate terms are not promising," said Craig C. Bram, President and CEO. "While marginally profitable on an Adjusted EBITDA basis during the past several years, committing additional capital and management attention to this business going forward, no longer makes economic sense," added Bram.

Net sales for the second quarter of 2020 totaled $66.1 million. This represents a decrease of $12.6 million or 16.0% when compared to net sales for the second quarter of 2019. Net sales for the first six months of 2020 were $140.8 million, a decrease of $22.7 million or 13.9% from net sales for the first six months of 2019. The decline in sales at the Palmer business accounted for a large percentage of the year over year decline for the entire Company. Excluding the Palmer operation, sales in the second quarter and first six months of 2020 were down 5.0% from the previous year periods.

For the second quarter of 2020, the Company recorded a net loss of $7.0 million, or $0.77 diluted loss per share, compared to a net loss of $0.3 million, or $0.03 diluted loss per share for the second quarter of 2019. The second quarter of 2020 was negatively impacted by the previously mentioned operating losses of $1.9 million and $6.1 million in non-cash, pre-tax asset impairment charges at Palmer, inventory price change losses which, on a pre-tax basis, totaled $3.5 million, compared to a $1.8 million loss in the second quarter of 2019, $2.7 million in costs associated with the Company's proxy contest and election of directors at the 2020 Annual Meeting of Shareholders, as well as changes in operating performance described in more detail below in the Segment discussions.

For the first six months of 2020, net loss was $8.1 million, or $0.90 diluted loss per share. This compares to a net loss of $1.2 million, or $0.13 diluted loss per share for the first six months of 2019. The first six months of 2020 was negatively impacted by operating losses at Palmer totaling $2.7 million and $6.1 million in non-cash, pre-tax asset impairment charges, inventory price change losses, which on a pre-tax basis totaled $3.9 million, compared to a $5.2 million loss for the first six months of 2019, as well as $2.9 million in costs associated with the Company's proxy contest and election of directors at the 2020 Annual Meeting of Shareholders.

The Company also reports its performance utilizing two non-GAAP financial measures: Adjusted Net (Loss) Income and Adjusted EBITDA. The Company's performance, as calculated under the two measures, is as follows:

  • Adjusted Net Loss for the second quarter of 2020 was $1.1 million, or $0.11 adjusted diluted loss per share compared to an Adjusted Net Loss of $0.3 million, or $0.04 adjusted diluted loss per share for the second quarter of 2019. For the first six months of 2020, Adjusted Net Loss was $1.8 million, or $0.19 adjusted diluted loss per share, compared to Adjusted Net Income of $0.3 million, or $0.04 adjusted diluted earnings per share for the first six months of 2019.
  • Adjusted EBITDA decreased $1.5 million for the second quarter of 2020 to $1.9 million (2.9% of sales), from $3.4 million (4.3% of sales) for the second quarter of 2019. For the first six months of 2020, Adjusted EBITDA was $4.6 million (3.3% of sales), compared to $8.2 million (5.0% of sales) for the first six months of 2019.

Both the Adjusted Net Income and Adjusted EBITDA metrics include an add-back of the $2.7 million and $2.9 million in costs associated with the Company's proxy contest as noted above and an add-back of the $6.1 million in non-cash asset impairment charges for the Palmer operation. These costs were added back due to the nature of the charges as one-time charges unrelated to the ongoing operations of the Company.

The Company's results are periodically impacted by factors that are not included as adjustments to our non-GAAP measures, but which represent items that help explain differences in period to period results. As mentioned above, the second quarter of 2020 was negatively impacted by inventory price change losses which, on a pre-tax basis, totaled $3.5 million, compared to a $1.8 million loss in the second quarter of 2019, representing a decrease of $1.7 million in pre-tax income compared to the second quarter 2019.

Additionally, during the second quarter, other significant items occurred with a pre-tax impact of $2.1 million, and included the following:

  • Mark-to-market valuation gains on investments in equity securities totaling $1.1 million;
  • Settlement of the insurance claim associated with the heavy wall press outage resulted in proceeds and related gain of $1.0 million.

"The cost cutting initiatives implemented at the start of this year continued to build momentum in the second quarter. On a sequential basis, Adjusted EBITDA for the operating units, other than Palmer, totaled $3.5 million in the second quarter of this year as compared with $3.1 million in the first quarter of this year. This following a sales decline of $6.2 million in the second quarter as compared with the first quarter and inventory price change losses that totaled $3.5 million in the second quarter as compared with $0.4 million in inventory price change losses in the first quarter of the year," said Mr. Bram.

Metals Segment

The Metals Segment's net sales for the second quarter of 2020 totaled $52.0 million, a decrease of $12.5 million or 19.4% from the second quarter of 2019. Excluding the Palmer business, sales declined 6.0% from the same quarter last year. Pounds shipped in the second quarter of this year were down 8.7% from the same quarter last year, with average selling prices falling by 9.9%. Excluding the Palmer business, pounds shipped were down 1.1% and average selling prices were down 4.0% from the same quarter last year. Looking at sequential quarterly performance, pounds shipped in the second quarter were down 10.9% as compared with the first quarter of this year, while average selling price declined by 3.3% quarter over quarter. Excluding the Palmer business, pounds shipped were down 9.2%, while the average selling price declined by 1.8%.

Pounds of heavy wall seamless carbon pipe and tube were down 4.0% from last year’s second quarter, primarily in the oil and gas sector. Average selling prices were down 12.0%. On a sequential quarterly basis, pounds shipped for this product category were down 19.0% in the second quarter of this year as compared with the first quarter of this year, while average selling prices declined by 4.7%.

Pounds shipped of commodity welded pipe and tube in the second quarter of this year were up 0.6% over the second quarter of last year, while average selling prices declined by 1.9% despite a richer mix of alloys and projects. On a sequential quarterly basis, pounds shipped in the second quarter were down 8.1% from the first quarter of this year and average selling prices declined 1.9%. Shipments of polished ornamental pipe and tube in the second quarter of this year were down 16.5% from the same period last year, with average selling prices up by 2.5%. Sequentially, shipments in the second quarter of this year were down 2.4% from the first quarter of this year, while average selling prices declined by 2.1%, primarily related to declines in the automotive and consumer discretionary markets offset by increases in COVID-19 related medical equipment.

The backlog for our subsidiary, Bristol Metals, LLC, as of June 30, 2020, was $26.6 million, a decrease of 15.5% when compared to the same period in 2019. Total pounds in the backlog were down by 29.3%. Pricing for the stainless steel product line was up approximately 27%, primarily due to increased special alloy orders. Galvanized products had pricing 5% lower than prior year levels due to the decline in galvanized raw materials and the pass-through mechanisms in these contracts.

The Metals Segment's reported operating losses of $9.2 million for the second quarter of 2020 compared to operating income of $1.2 million for the second quarter of 2019.

Current quarter operating results were affected by nickel prices and resulting surcharges for 304 and 316 alloys. The second quarter of 2020 proved to be a much more unfavorable environment than the second quarter of 2019, with net metal pricing losses of $3.5 million, compared to last year's $1.8 million in metal pricing losses. Second quarter 2020 surcharges on 304 alloy were approximately 11% lower than second quarter 2019 levels and 2020 surcharges on 316 alloy were 17% lower than the second quarter of 2019. More importantly, second quarter 2020 surcharges on 304 and 316 alloys were lower by 19% and 21%, respectively, when compared with the surcharges in place just five months earlier.

Specialty Chemicals Segment

Net sales for the Specialty Chemicals Segment in the second quarter of 2020 totaled $14.1 million, representing a $0.2 million or 1.1% decrease from the second quarter of 2019. Pounds shipped in the second quarter of this year were up 1.4% over the same period last year, while average selling prices were down 2.6%. On a sequential quarterly basis, pounds shipped in the second quarter of this year were up 10.6% over the first quarter of this year, with average selling prices declining by 9.1%.

Companies in the specialty chemical space are facing a significant downturn in demand for specialty chemicals. Weak industrial and manufacturing activities due to the COVID-19 lock-down restrictions and disruptions in supply chains have affected demand in North America. The relative strength of sales during the second quarter, in the face of the COVID-19 pandemic's impact on the Household, Industrial & Institutional and Sanitation supply chain, is a result of the Segment's increased production of hand sanitizer and cleaning aids to help supply critical sanitation products.

Operating income for the Specialty Chemicals Segment for the second quarter of 2020 was $2.0 million, an increase of $1.1 million from the same quarter of 2019. The increase in operating income is directly related to significant profit improvement efforts that yielded pricing and margin improvements of $0.2 million, lower manufacturing costs of $0.6 million and lower selling, general, and administrative costs of $0.3 million.

Other Items

Unallocated corporate expenses for the second quarter of 2020 decreased $0.4 million or 18.4% to $1.6 million (2.4% of sales) compared to $1.9 million (2.5% of sales) for the same period in the prior year. The second quarter decrease resulted primarily from lower professional fees, incentive bonuses, and travel expenses in the period.

Interest expense was $0.5 million and $1.0 million for the second quarter of 2020 and 2019, respectively. The decrease was related to lower average debt outstanding in the second quarter of 2020 compared to the second quarter of 2019.

The effective tax rate was 23.6% and 14.4% for the three months ended June 30, 2020 and June 30, 2019, respectively, resulting in a tax benefit of $2.1 million and $0.1 million, respectively. The June 30, 2020 effective tax rate was higher than the statutory rate of 21.0% due to the discrete treatment of costs attributable to our proxy contest, year to date tax benefits on our stock compensation plan, and estimated tax benefits associated with the Coronavirus Aid, Relief and Economic Security Act (“CARES Act”) which was signed into law on March 27, 2020. The CARES Act includes various income and payroll tax provisions, notably enabling us to carry back net operating losses and recover taxes paid in prior years.

The effective tax rate was 30.4% and 23.6% for the six-month periods ended June 30, 2020 and 2019, respectively, resulting in a tax benefit of $3.5 million and $0.5 million, respectively. The effective tax rate for the first six months of 2020 was higher than the statutory rate of 21.0% due to the discrete treatment of costs attributable to our proxy contest, and tax benefits on our stock compensation plan and estimated tax benefits associated with the Coronavirus Aid, Relief and Economic Security Act (“CARES Act”) which was signed into law on March 27, 2020. The CARES Act includes various income and payroll tax provisions, notably enabling us to carry back net operating losses and recover taxes paid in prior years.

The Company's cash balance increased $0.8 million to $1.4 million as of June 30, 2020 compared to $0.6 million at December 31, 2019. Fluctuations affecting cash flows during the six months ended June 30, 2020 were comprised of the following:

a)

Net inventories decreased $2.9 million at June 30, 2020 when compared to December 31, 2019, mainly due to the write-down of inventory related to the Palmer business in the second quarter. Inventory turns increased from 1.62 turns at December 31, 2019, calculated on a three-month average basis, to 1.75 turns at June 30, 2020;


b)

Accounts payable increased $3.7 million as of June 30, 2020 as compared to December 31, 2019, primarily due to higher metal purchases in the second quarter compared to the fourth quarter. Accounts payable days outstanding were approximately 32 days at June 30, 2020 compared to 36 days at December 31, 2019;


c)

Net accounts receivable increased $1.2 million at June 30, 2020 as compared to December 31, 2019, due primarily to improved business activity within the Specialty Chemicals Segment in the second quarter compared to the fourth quarter of 2019. Days sales outstanding, calculated using a six-month average basis, was 46 days outstanding at June 30, 2020 and 50 days at December 31, 2019, respectively;


d)

Capital expenditures for the first six months of 2020 were $2.0 million; and


e)

The Company paid $2.3 million during the first six months of 2020 related to the earn-out liabilities from the 2019 American Stainless, 2018 MUSA-Galvanized and 2017 MUSA-Stainless acquisitions.

The Company had $78.6 million of total borrowings outstanding with its lender as of June 30, 2020. The total is up $3.0 million from the balance at December 31, 2019. As of June 30, 2020, the Company had $7.2 million of remaining available capacity under its line of credit.

Pursuant to the Credit Agreement, the Company is subject to certain covenants including maintaining a minimum fixed charge coverage ratio of not less than 1.25, maintaining a minimum tangible net worth of not less than $60.0 million, and a limitation on the Company’s maximum amount of capital expenditures per year, which is in line with currently projected needs.

The Company notified its bank of a technical default of the fixed charge coverage ratio in its Credit Agreement at the quarter ended June 30, 2020. To address the technical default, the Company entered into two amendments to its Credit Agreement with its bank subsequent to the end of the quarter. On July 31, 2020, the Company entered into the Third Amendment to the Third Amended and Restated Loan Agreement (the "Third Amendment") with its bank. The Third Amendment amended the definition of the fixed charge coverage ratio to include the proxy contest costs in the numerator of the ratio calculation. The amendment is effective for the quarter ended June 30, 2020 and the directly following three quarters after June 30, 2020. Additionally, on August 13, 2020, the Company entered into the Fourth Amendment to the Third Amended and Restated Loan Agreement (the "Fourth Amendment") with its bank. The Fourth Amendment amended the definition of the fixed charge coverage ratio to include the lesser of the actual non-cash asset impairment charge related to Palmer, or $6.0 million in the numerator of the ratio calculation. The amendment is effective for the quarter ended June 30, 2020 and the directly following three quarters after June 30, 2020.

At June 30, 2020, the Company had a minimum fixed charge coverage ratio of 1.39 and a minimum tangible net worth of $67.4 million.

Outlook

The manufacturing sector will continue to face challenges over the next several quarters. As a result of the uncertainty related to the COVID-19 pandemic, we have suspended all Fiscal 2020 guidance and are not providing guidance at this time. With a restart of the economy pending, we cannot predict the impact on our various businesses. We remain diligent and thoughtful in managing profitability and liquidity while navigating these unprecedented times and continuing to execute our strategy.

Synalloy Corporation (Nasdaq: SYNL) is a growth oriented company that engages in a number of diverse business activities including the production of stainless steel and galvanized pipe and tube, the master distribution of seamless carbon pipe and tube, and the production of specialty chemicals. For more information about Synalloy Corporation, please visit our website at www.synalloy.com.

Forward-Looking Statements

This earnings release includes and incorporates by reference "forward-looking statements" within the meaning of the federal securities laws. All statements that are not historical facts are "forward-looking statements." The words "estimate," "project," "intend," "expect," "believe," "should," "anticipate," "hope," "optimistic," "plan," "outlook," "should," "could," "may" and similar expressions identify forward-looking statements. The forward-looking statements are subject to certain risks and uncertainties, including without limitation those identified below, which could cause actual results to differ materially from historical results or those anticipated. Readers are cautioned not to place undue reliance on these forward-looking statements. The following factors could cause actual results to differ materially from historical results or those anticipated: adverse economic conditions; the impact of competitive products and pricing; product demand and acceptance risks; raw material and other increased costs; raw materials availability; employee relations; ability to maintain workforce by hiring trained employees; labor efficiencies; customer delays or difficulties in the production of products; new fracking regulations; a prolonged decrease in nickel and oil prices; unforeseen delays in completing the integrations of acquisitions; risks associated with mergers, acquisitions, dispositions and other expansion activities; financial stability of our customers; environmental issues; negative or unexpected results from tax law changes; unavailability of debt financing on acceptable terms and exposure to increased market interest rate risk; inability to comply with covenants and ratios required by our debt financing arrangements; ability to weather an economic downturn; loss of consumer or investor confidence, risks relating to the impact and spread of COVID-19 and other risks detailed from time-to-time in the Company's Securities and Exchange Commission filings. The Company assumes no obligation to update the information included in this release.

Non-GAAP Financial Information

Financial statement information included in this earnings release includes non-GAAP (Generally Accepted Accounting Principles) measures and should be read along with the accompanying tables which provide a reconciliation of non-GAAP measures to GAAP measures.

Adjusted Net (Loss) Income and Adjusted Diluted (Loss) Earnings per Share are non-GAAP measures and exclude discontinued operations, goodwill impairment, asset impairment, stock option / grant costs, non-cash lease costs, acquisition costs, proxy contest costs, shelf registration costs, earn-out adjustments, gain on excess death benefit, realized and unrealized (gains) and losses on investments in equity securities, casualty insurance gain, all (gains) losses associated with a Sale-Leaseback, and retention costs from net income. They also utilize a constant effective tax rate to reflect tax neutral results.

Adjusted EBITDA is a non-GAAP measure and excludes discontinued operations, goodwill impairment, asset impairment, interest expense (including change in fair value of interest rate swap), income taxes, depreciation, amortization, stock option / grant costs, non-cash lease cost, acquisition costs, proxy contest costs, shelf registration costs, earn-out adjustments, gain on excess death benefit, realized and unrealized (gains) and losses on investments in equity securities, casualty insurance gain, all (gains) losses associated with a Sale-Leaseback and retention costs from net income.

Management believes that these non-GAAP measures provide additional useful information to allow readers to compare the financial results between periods. Non-GAAP measures should not be considered as an alternative to any measure of performance or financial condition as promulgated under GAAP, and investors should consider the Company's performance and financial condition as reported under GAAP and all other relevant information when assessing the performance or financial condition of the Company. Non-GAAP measures have limitations as analytical tools, and investors should not consider them in isolation or as a substitute for analysis of the Company's results or financial condition as reported under GAAP.

Synalloy Corporation Comparative Analysis

Condensed Consolidated Statement of Operations


(Amounts in thousands, except per share data)

Three Months Ended
June 30,


Six Months Ended
June 30,

(unaudited)

2020


2019


2020


2019

Net sales


Metals Segment

$

52,018


$

64,503


$

112,681


$

135,607


Specialty Chemicals Segment

14,118


14,275


28,152


27,975


$

66,136


$

78,778


$

140,833


$

163,582


Operating (loss) income


Metals Segment

$

(9,155

)


$

1,193


$

(8,221

)


$

2,675


Specialty Chemicals Segment

1,980


926


2,447


1,540


Unallocated expense (income)


Corporate

1,586


1,944


3,607


4,251


Acquisition costs and other

6


20


135


348


Proxy contest costs

2,734


2,909


Earn-out adjustments

(827

)


(418

)


(823

)


(401

)

Operating (loss) income

(10,674

)


573


(11,602

)


17


Interest expense

532


1,010


1,251


2,034


Change in fair value of interest rate swap

(4

)


77


81


124


Other (income) expense, net

(2,129

)


(110

)


(1,303

)


(404

)

Net loss before income taxes

(9,073

)


(404

)


(11,631

)


(1,737

)

Income tax (benefit)

(2,116

)


(142

)


(3,496

)


(548

)


Net loss

$

(6,957

)


$

(262

)


$

(8,135

)


$

(1,189

)


Net loss per common share


Basic

$

(0.77

)


$

(0.03

)


$

(0.90

)


$

(0.13

)

Diluted

$

(0.77

)


$

(0.03

)


$

(0.90

)


$

(0.13

)


Average shares outstanding


Basic

9,058


8,974


9,066


8,951


Diluted

9,058


8,974


9,066


8,951


Other data:


Adjusted EBITDA (1)

1,947


3,408


4,587


8,175


(1) The term Adjusted EBITDA is a non-GAAP financial measure that the Company believes is useful to investors in evaluating its results to determine the value of a company. An item is included in the measure if its periodic value is inconsistent and sufficiently material that not identifying the item would render period comparability less meaningful to the reader or if including the item provides a clearer representation of normalized periodic earnings. The Company includes in Adjusted EBITDA two categories of items: 1) Base EBITDA components, including: earnings before discontinued operations, interest (including change in fair value of interest rate swap), income taxes, depreciation and amortization, and 2) Material transaction costs including: goodwill impairment, asset impairment, acquisition costs, proxy contest costs, shelf registration costs, earn-out adjustments, gain on excess death benefit, realized and unrealized (gains) and losses on investments in equity securities, casualty insurance gains, all (gains) losses associated with Sale-leaseback, stock option/grant costs, non-cash lease cost, and retention costs from net income. For a reconciliation of this non-GAAP measure to the most comparable GAAP equivalent, refer to the Reconciliation of Net Income to Adjusted EBITDA as shown on next page.


Contacts

Sally Cunningham at (804) 822-3267


Read full story here

AMES, Iowa--(BUSINESS WIRE)--Renewable Energy Group, Inc. (NASDAQ: REGI) announced today that it has added Walter Berger to the company’s Board of Directors.


Mr. Berger brings a broad cross-section of experience with commercial, product, operating, strategic, M&A, and financial responsibilities and outcomes. Notably, he has strong domain expertise in technology commercialization, including energy, Cloud, software, and communications.

“We are very pleased to be adding Walter to the REG Board. His professional background and expertise bring additional diverse and synergistic perspectives to REG,” said Jeffrey Stroburg, Chairman of the Board. “Despite the current challenging operating environment under COVID-19, REG continues to accelerate our participation in the energy transition. Walter will be an asset to our team as we drive for ongoing growth and long-term success.”

Mr. Berger currently serves as President, Chief Operating Officer, and Director of KYMETA Corporation, a satellite technology and communications company headquartered in Redmond, Washington.

Before joining KYMETA, Mr. Berger served as Chief Operating Officer and Chief Financial Officer of Nuvectra Corporation, a medical device company. Before that, Mr. Berger served as Chief Financial Officer of AppDynamics Inc., an application performance management and IT operations analytics company. Mr. Berger has also served on for-profit and non-profit boards, including Sirius Computer Solutions, a national integrator of technology-based business solutions, until late 2017. Mr. Berger holds a B.A. in business administration from the University of Massachusetts, Amherst.

Berger will serve as a Class I Director and will serve on the Audit and Risk Management committees of the Board. His term will expire at the 2021 annual meeting of the company’s stockholders.

About Renewable Energy Group

Renewable Energy Group, Inc. (NASDAQ: REGI) is leading the energy industry's transition to sustainability by transforming renewable resources into high-quality, cleaner fuels. REG is North America’s largest producer of biodiesel and an industry leading producer of renewable diesel. REG solutions are alternatives for petroleum diesel and produce significantly lower carbon emissions. REG utilizes a global integrated procurement, distribution and logistics network to operate 13 biorefineries in the U.S. and Europe. In 2019, REG produced 495 million gallons of cleaner fuel delivering over 4.2 million metric tons of carbon reduction. REG is meeting the growing global demand for lower-carbon fuels and leading the way to a more sustainable future.

Note Regarding Forward-Looking Statements

This press release contains forward-looking statements within the meaning of the Private Securities Litigation Reform Act of 1995. These forward-looking statements are based on current expectations and assumptions, are subject to change, and actual results may differ materially. Factors that could cause actual results to differ materially are described in REG's annual report on Form 10-K for the year ended December 31, 2019, quarterly report on Form 10-Q for the quarter ended June 30, 2020 and from time to time in the Company's other periodic filings with the Securities and Exchange Commission. All forward-looking statements are made as of the date of this press release and REG does not undertake to update any forward-looking statements based on new developments or changes in our expectations


Contacts

Katie Stanley
Renewable Energy Group
This email address is being protected from spambots. You need JavaScript enabled to view it.
(515) 239-8184

Aspen GDOT™ software delivers production optimization across the plant, driving efficiency and improved execution

BEDFORD, Mass.--(BUSINESS WIRE)--Aspen Technology, Inc. (NASDAQ: AZPN), a global leader in asset optimization software, today announced that Heide Refinery, one of the most complex refineries in Europe, has licensed Aspen Generic Dynamic Optimization Technology (GDOT) software to achieve production levels more closely aligned to plan.


The solution will be deployed to help improve refinery margins with real-time, closed-loop, dynamic optimization increasing the flexibility of operations. GDOT will maximize against operational constraints across the refinery and help to reduce finished product quality giveaway, improving business results.

Juergen Wollschlaeger, CEO at Heide Refinery said: “AspenTech’s GDOT will improve agility in our response to changes in market conditions, such as those we are experiencing right now. It will optimize our production by continuously adjusting targets in the individual controllers within the Advanced Process Control layer so that they align with the economic objectives from planning and scheduling. Ultimately GDOT will optimize profits by minimizing finished product quality giveaway and maximizing production of the most valuable products.”

Matt Holland, vice president of sales for EURA, Aspen Technology added: “The global energy industry is facing a number of unforeseen challenges today. Operational flexibility for refineries is more crucial than ever in this environment. Our GDOT technology will give Heide Refinery the increased agility and flexibility in its operations that this unpredictable landscape demands.”

Supporting Resources

About Raffinerie Heide

Raffinerie Heide GmbH is part of the Klesch Group and is one of the largest employers in Dithmarschen, Schleswig-Holstein, with around 560 employees and 40 trainees. The company has an annual processing capacity of 4.5 million tonnes of crude oil, equal to the oil demands of the entire state of Schleswig-Holstein. The refinery with a medium-sized ethos, which was founded in 2010, produces traditional petroleum products such as petrol, diesel and aviation fuel. It also produces light heating oil and base materials for the chemicals industry. Raffinerie Heide, which is one of the most complex refineries in Europe, is among the best in the continent in terms of utilisation and availability thanks to its strict standards of care in relation to maintenance.

About Aspen Technology

Aspen Technology (AspenTech) is a global leader in asset optimization software. Its solutions address complex, industrial environments where it is critical to optimize the asset design, operation and maintenance lifecycle. AspenTech uniquely combines decades of process modelling expertise with artificial intelligence. Its purpose-built software platform automates knowledge work and builds sustainable competitive advantage by delivering high returns over the entire asset lifecycle. As a result, companies in capital-intensive industries can maximize uptime and push the limits of performance, running their assets safer, greener, longer and faster. Visit AspenTech.com to find out more. 

© 2020 Aspen Technology, Inc. AspenTech, aspenONE®, the Aspen leaf logo, Aspen, Aspen GDOT™ are trademarks of Aspen Technology, Inc. All rights reserved. 


Contacts

Aspen Technology, Inc.
Kate Jones
+44 (118) 922 6510
This email address is being protected from spambots. You need JavaScript enabled to view it.

Raffinerie Heide GmbH
Susanne Garsoffky
+49 (481) 693 2091
This email address is being protected from spambots. You need JavaScript enabled to view it.

ST. PAUL, Minn.--(BUSINESS WIRE)--A Ramsey County District Court judge today found that the Minnesota Pollution Control Agency (MPCA) did not engage in any procedural irregularities in connection with the processing of the National Pollutant Discharge Elimination System (NPDES) permit for the NorthMet copper-nickel-precious metals project, according to Poly Met Mining, Inc., a wholly owned subsidiary of PolyMet Mining Corp. (together “PolyMet” or the “company”) TSX: POM; NYSE American: PLM.


In his decision, Judge John H. Guthmann rejected the allegations that MPCA engaged in a systematic effort to keep evidence out of the administrative record. Those allegations had been made by the relators Fond du Lac Band of Lake Superior Chippewa, WaterLegacy, Minnesota Center for Environmental Advocacy, Center for Biological Diversity and Friends of the Boundary Waters Wilderness. Judge Guthmann made his findings after presiding over a seven-day hearing in St. Paul in January and extensive briefing from the parties.

Judge Guthmann found no evidence that the MPCA attempted to suppress EPA comments. Indeed, the court observed that the process for PolyMet’s permit involved “significantly more interaction between the EPA and the MPCA than with the usual NPDES permit.” The court determined that “[a]t no time did the MPCA try to discourage or prevent the EPA from submitting written comments on either the pre-proposed permit or the final permit.” The court found that MPCA’s effort to reach an agreement with EPA to delay making written comments on a draft NorthMet NPDES permit until sometime after the public notice period did not constitute a procedural irregularity. The court concluded that the MPCA exceeded the requirements of the Memorandum of Agreement between EPA and MPCA.

The district court’s conclusion that no procedural irregularities occurred in the processing of PolyMet’s permit will be incorporated into the broader challenge to that permit currently pending before the court of appeals. In that case, environmental groups and the Fond du Lac Band have challenged the MPCA’s decision to issue the permit and its denial of a contested-case hearing. The court of appeals will decide the schedule for briefing and oral argument.

“We are pleased with the district court’s ruling and look forward to defending the challenge to the water permit currently pending in the court of appeals,” said Jon Cherry, chairman, president and CEO. “We remain confident the water quality permit meets all applicable standards and will ultimately be upheld by the courts.”

The district court decision comes on the heels of the Minnesota Supreme Court this spring granting the company’s and regulators’ petitions to review court of appeals’ rulings on its Permit to Mine, dam safety and air quality permits. The Minnesota Supreme Court recently scheduled oral argument in the Permit to Mine appeal for October 13, 2020.

About PolyMet

PolyMet is a mine development company that owns 100% of the NorthMet Project, the first large-scale project to be permitted within the Duluth Complex in northeastern Minnesota, one of the world’s major, undeveloped mining regions. NorthMet has significant proven and probable reserves of copper, nickel and palladium – metals vital to global carbon reduction efforts – in addition to marketable reserves of cobalt, platinum and gold. When operational, NorthMet will become one of the leading producers of nickel, palladium and cobalt in the U.S., providing a much needed, responsibly mined source of these critical and essential metals.

Located in the Mesabi Iron Range, the project will provide economic diversity while leveraging the region’s established supplier network and skilled workforce, and generate a level of activity that will have a significant effect in the local economy. For more information: www.polymetmining.com.

PolyMet Disclosures

This news release contains certain forward-looking statements concerning anticipated developments in PolyMet’s operations in the future. Forward-looking statements are frequently, but not always, identified by words such as “expects,” “anticipates,” “believes,” “intends,” “estimates,” “potential,” “possible,” “projects,” “plans,” and similar expressions, or statements that events, conditions or results “will,” “may,” “could,” or “should” occur or be achieved or their negatives or other comparable words. These forward-looking statements may include statements regarding the ability to receive environmental and operating permits, job creation, and the effect on the local economy, or other statements that are not a statement of fact. Forward-looking statements address future events and conditions and therefore involve inherent known and unknown risks and uncertainties. Actual results may differ materially from those in the forward-looking statements due to risks facing PolyMet or due to actual facts differing from the assumptions underlying its predictions.

PolyMet’s forward-looking statements are based on the beliefs, expectations and opinions of management on the date the statements are made, and PolyMet does not assume any obligation to update forward-looking statements if circumstances or management’s beliefs, expectations and opinions should change.

Specific reference is made to risk factors and other considerations underlying forward-looking statements discussed in PolyMet’s most recent Annual Report on Form 40-F for the fiscal year ended December 31, 2019, and in our other filings with Canadian securities authorities and the U.S. Securities and Exchange Commission.

The Annual Report on Form 40-F also contains the company’s mineral resource and other data as required under National Instrument 43-101.

The TSX has not reviewed and does not accept responsibility for the adequacy or accuracy of this release.


Contacts

Media
Bruce Richardson, Corporate Communications
Tel: +1 (651) 389-4111
This email address is being protected from spambots. You need JavaScript enabled to view it.

Investor Relations
Tony Gikas, Investor Relations
Tel: +1 (651) 389-4110
This email address is being protected from spambots. You need JavaScript enabled to view it.

Trend expected to continue into 2020 for the sixth consecutive year

TORONTO--(BUSINESS WIRE)--The Ontario Society of Professional Engineers (OSPE), the voice of Ontario’s engineering community, has released updated data on curtailed (wasted) energy, following its 2019 Retail Electricity Price Reform Report, revealing that Ontario wasted a total of 6.5 terawatt-hours (TWh) of clean electricity in 2019 – an amount sufficient to power 720,000 average-sized homes1 for one year.

These findings represent a 12 per cent increase in wasted electricity from 2018. This trend has remained consistent with data dating back to 2015 and is anticipated to continue this year, with the prolonged impacts of COVID-19 expected to significantly increase the amount of wasted clean electricity in 2020. The initial report, released by OSPE in April 2019, follows a detailed analysis of year-end data issued by the Independent Electricity System Operator (IESO) and Ontario Power Generation (OPG).

The Gap Between Production and Demand

The data indicates that Ontario’s electricity pricing system is not structured to account for the low demand it has been experiencing.

“Over the last six years, Ontario has curtailed 38.5 TWh of clean electricity,” said Sandro Perruzza, CEO of OSPE. “This system is too expensive and simply not sustainable, which is why we are calling upon the provincial government and Ontario Energy Board to explore reformed retail pricing plans for consumers to subscribe to on a voluntary basis.”

“The province also continues to export even larger amounts of surplus clean electricity to neighbouring jurisdictions at a lower price than the total cost of production,” said Paul Acchione, P.Eng., energy expert and former President and Chair of OSPE.

In addition to curtailment, surplus hydroelectric, wind, solar and nuclear generated electricity was also exported to adjoining power grids from 2014 to 2019 at prices much lower than the cost of production. This occurs because Ontario produces more clean electricity than Ontario consumers currently use, so the province is forced to sell off the surplus at the low wholesale market rate. Total exports in 2019 were 19.8 TWh, compared to 18.6 TWh in 2018. OSPE estimates that about half of those exports were surplus clean electricity, enough to power about 1.2 million homes for one year.

The Impact of COVID-19

Ontario’s current electricity system is built to support businesses operating between the hours of 9:00 a.m. and 5:00 p.m. and a large percentage of homes left idle for a minimum of eight hours a day. Electricity consumption patterns have drastically changed over the last six months, primarily as a result of shifts in the business climate and workplace. These changes have led to an inevitable increase in wasted electricity.

“The restrictions COVID-19 has imposed on economic activity are already having an impact on Ontario’s electricity consumption,” said Perruzza. “OPG reported that in the first quarter of 2020, hydroelectric curtailment increased by 130 per cent. This will continue for the duration of the pandemic, ultimately resulting in a significant increase in the amount of curtailment in 2020.” Despite high Ontario system demand peaks such as those on some hours of the day in July 2020, there remains many, many hours during the year with surplus generation that is either curtailed or exported at low prices which is a wasted economic and environmental opportunity.

Proposed Solutions

OSPE has become recognized as a trusted advisor by the Ontario government and is regularly looked to by politicians to provide input on policy, planning and budget decisions. Rather than continuing to waste viable clean electricity, OSPE recommends the province leverage its excess electricity to:

  • Displace fossil fuel consumption for consumer’s heating needs
  • Charge Ontario’s growing fleet of electric vehicles
  • Create clean hydrogen for Ontario’s industrial sector and hydrogen powered vehicles

Emily Thorn Corthay, OSPE’s Energy Task Force Chair, emphasizes that, “OSPE’s proposed retail electricity pricing would incent people to fill the troughs in electricity demand through low pricing with no additional system costs which would overall lower total energy costs for those consumers who choose to opt in.”

“Professional Engineers are key to discovering, leading and implementing data-driven, practical solutions to support the integration of green technologies for a long-term, sustainable and resilient future,” said Réjeanne Aimey, President and Chair of OSPE. “Re-allocating surplus electricity by way of price reform is the next step in Ontario’s advancement, and engineers are equipped with the innovation and scientific skills to accomplish this.”

For more information, please refer to the full 2019 Retail Electricity Price Reform report.

About the Ontario Society of Professional Engineers (OSPE)

OSPE is the advocacy body and voice of the Ontario engineering profession, representing more than 85,000 Professional Engineers and 293,600 engineering students and graduates in Ontario. OSPE’s Energy Task Force has provided strategic engineering input to Ontario’s Ministry of Energy, Northern Development and Mines and the previous Ministry of Energy for more than ten years, with many of OSPE’s recommendations saving consumers hundreds of millions of dollars per year.

As a member-driven professional association, OSPE welcomes the entire engineering community to contribute knowledge, skills and leadership to help create a better future for the profession and society. For more information about OSPE, please visit www.ospe.on.ca.

_________________
1 https://www.oeb.ca/oeb/_Documents/Documents/Report_Defining_Typical_Elec_Customer_20160414.pdf


Contacts

Baijul Shukla
Ontario Society of Professional Engineers
This email address is being protected from spambots. You need JavaScript enabled to view it.

Media:
Jen Farr
Kaiser Lachance Communications
416-910-5221
This email address is being protected from spambots. You need JavaScript enabled to view it.

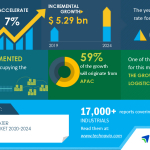
LONDON--(BUSINESS WIRE)--#BallastWaterManagementMarket--The global ballast water management market size is expected to grow by USD 5.29 billion as per Technavio. This marks a significant market growth compared to the 2019 growth estimates due to the impact of the COVID-19 pandemic in the first half of 2020. Moreover, healthy growth is expected to continue throughout the forecast period, and the market is expected to grow at a CAGR of 7%. Request Free Sample Report on COVID-19 Impacts


Read the 120-page report with TOC on "Ballast Water Management Market Analysis Report by Technology (Physical disinfection, Chemical method, and Mechanical method) and Geography (APAC, Europe, North America, MEA, and South America), and the Segment Forecasts, 2020-2024".

https://www.technavio.com/report/ballast-water-management-market-industry-analysis

The market is driven by the growing marine logistics business. In addition, the development of containerized ballast water management systems is anticipated to boost the growth of the ballast water management market.

Maritime transport is crucial in cross-border transport networks and the backbone of globalization that enable international trade and support supply chains. Maritime transport fosters industrial development by supporting manufacturing growth, bringing together consumers, intermediate and capital goods industries, and promoting regional economic and trade integration. In 2018, the global seaborne trade grew at the highest rate in several years. A volume of 11,005 million tons was loaded, and 11,002 million tons were unloaded globally. Moreover, growth in the availability of shipping data and application of big data analytics in the shipping industry has been providing greater visibility into the market as well as pricing trends, thereby allowing the shippers to choose optimal routes, fuel consumption patterns, gauge the weather conditions, and avoid piracy risks. Thus, the marine logistics business is growing, which has been resulting in the growth in ballast water use, thereby boosting the demand for ballast water management.

Buy 1 Technavio report and get the second for 50% off. Buy 2 Technavio reports and get the third for free.

View market snapshot before purchasing

Major Five Ballast Water Management Companies:

Alfa Laval AB

Alfa Laval AB has its business operations under various segments, such as energy, food and water, marine, greenhouse, and operations and other. The company offers PureBallast 3.1.

Evoqua Water Technologies LLC

Evoqua Water Technologies LLC operates its business through two segments, such as integrated solutions and services, and applied product technologies. The company offers SeaCURE Ballast Water Management System

Headway Technology Group (Qingdao) Co. Ltd.

Headway Technology Group (Qingdao) Co. Ltd. offers exhaust gas cleaning system, CR system, communication & navigation product, and other products. The company's key offerings in the ballast water management market includes OceanGuard BWMS.

Mitsubishi Heavy Industries Ltd.

Mitsubishi Heavy Industries Ltd. has its business operations under various segments, such as power systems; industry and infrastructure; and aircraft, defense, and space. The company offers ballast water treatment systems installation on oceangoing ships.

PANASIA Co. Ltd.

PANASIA Co. Ltd. offers Sulfur oxide reduction device, BWTS, Nitrogen oxide reduction device, retrofit service, marine satellite control system, ship water level control and measurement equipment. The company offers modular ballast water management system.

Register for a free trial today and gain instant access to 17,000+ market research reports.

Technavio's SUBSCRIPTION platform

Ballast Water Management Technology Outlook (Revenue, USD bn, 2019-2024)

  • Physical disinfection - size and forecast 2019-2024
  • Chemical method - size and forecast 2019-2024
  • Mechanical method - size and forecast 2019-2024

Ballast Water Management Regional Outlook (Revenue, USD bn, 2019-2024)

  • APAC - size and forecast 2019-2024
  • Europe - size and forecast 2019-2024
  • North America - size and forecast 2019-2024
  • MEA - size and forecast 2019-2024
  • South America - size and forecast 2019-2024

Technavio’s sample reports are free of charge and contain multiple sections of the report, such as the market size and forecast, drivers, challenges, trends, and more. Request a free sample report

About Technavio

Technavio is a leading global technology research and advisory company. Their research and analysis focus on emerging market trends and provides actionable insights to help businesses identify market opportunities and develop effective strategies to optimize their market positions.

With over 500 specialized analysts, Technavio’s report library consists of more than 17,000 reports and counting, covering 800 technologies, spanning across 50 countries. Their client base consists of enterprises of all sizes, including more than 100 Fortune 500 companies. This growing client base relies on Technavio’s comprehensive coverage, extensive research, and actionable market insights to identify opportunities in existing and potential markets and assess their competitive positions within changing market scenarios.


Contacts

Technavio Research
Jesse Maida
Media & Marketing Executive
US: +1 844 364 1100
UK: +44 203 893 3200
Email: This email address is being protected from spambots. You need JavaScript enabled to view it.
Website: www.technavio.com/

Stakeholders should focus on projects that support medical and infrastructure needs and segments that benefit from social distancing and remote employee trends


BOULDER, Colo.--(BUSINESS WIRE)--#COVID19--A new report from Guidehouse Insights examines which microgrid segments may benefit from COVID-19 and which will likely suffer, providing recommendations for future strategies.

Besides a shock to business as usual that rippled through the global economy, one of COVID-19’s most visible impacts on the energy industry was a steep drop in demand (and corresponding price) for oil. This created questions around how the pandemic is affecting electricity markets and, more specifically, emerging digitization platforms such as microgrids. Click to tweet: According to a new report from @WeAreGHInsights, there are short- and long-term ramifications, but discernable evidence points toward overall double-digit growth in microgrids despite a severe global recession.

“This growth will be characterized by uneven impacts on different market segments and the desirability of different distributed energy resources (DER) options,” says Peter Asmus, research director with Guidehouse Insights. “Furthermore, although near-term impacts include project delays in 2020 likely extending into 2021, the longer-term picture for microgrids will likely benefit from COVID-19.”

According to the report, to position for success, stakeholders in the microgrid ecosystem should look for projects that support vital medical and other fundamental infrastructure needs and focus on market segments that benefit from shelter at home, social distancing, and remote employee trends. The report also recommends choosing cleaner DER assets for microgrid projects and seeking out adjacent market opportunities with DER assets such as virtual power plants (VPPs).

The report, COVID-19: Which Microgrid Segments Benefit - Which Suffer?, analyzes which microgrid segments may benefit from COVID-19 and which segments will likely suffer. It discusses why these market trends should shape how vendors, utilities, and prosumers view near- and long-term microgrid opportunities. Guidehouse Insights then provides detailed and actionable recommendations for the microgrid industry ecosystem to adjust future strategies accordingly. An executive summary of the report is available for free download on the Guidehouse Insights website.

About Guidehouse Insights

Guidehouse Insights, the dedicated market intelligence arm of Guidehouse, provides research, data, and benchmarking services for today’s rapidly changing and highly regulated industries. Our insights are built on in-depth analysis of global clean technology markets. The team’s research methodology combines supply-side industry analysis, end-user primary research, and demand assessment, paired with a deep examination of technology trends, to provide a comprehensive view of emerging resilient infrastructure systems. Additional information about Guidehouse Insights can be found at www.guidehouseinsights.com.

About Guidehouse

Guidehouse is a leading global provider of consulting services to the public and commercial markets with broad capabilities in management, technology, and risk consulting. We help clients address their toughest challenges with a focus on markets and clients facing transformational change, technology-driven innovation and significant regulatory pressure. Across a range of advisory, consulting, outsourcing, and technology/analytics services, we help clients create scalable, innovative solutions that prepare them for future growth and success. Headquartered in Washington DC, the company has more than 7,000 professionals in more than 50 locations. Guidehouse is led by seasoned professionals with proven and diverse expertise in traditional and emerging technologies, markets and agenda-setting issues driving national and global economies. For more information, please visit: www.guidehouse.com.

* The information contained in this press release concerning the report, COVID-19: Which Microgrid Segments Benefit - Which Suffer?, is a summary and reflects the current expectations of Guidehouse Insights based on market data and trend analysis. Market predictions and expectations are inherently uncertain and actual results may differ materially from those contained in this press release or the report. Please refer to the full report for a complete understanding of the assumptions underlying the report’s conclusions and the methodologies used to create the report. Neither Guidehouse Insights nor Guidehouse undertakes any obligation to update any of the information contained in this press release or the report.


Contacts

Lindsay Funicello-Paul
+1.781.270.8456
This email address is being protected from spambots. You need JavaScript enabled to view it.

WILTON, England--(BUSINESS WIRE)--INVISTA’s technology and licensing group, INVISTA Performance Technologies (IPT), and SASA Polyester Sanayi A.Ş. (SASA) reached an agreement on Aug. 25 for the license of IPT’s P8 process technology for SASA’s PTA project in Adana, Turkey.


With an annual PTA production capacity of 1.5 million tonnes, this would be the largest single-stream design capacity licensed by INVISTA. Built on the demonstrated performance of IPT’s P8 technology platform, the variable cost, capital productivity and environmental performance of this PTA plant is expected to set new benchmarks within the industry.

Ibrahim Erdemoğlu, SASA’s chairman, said, “SASA will continue to invest in polyester to position itself as the leading polyester producer after China and India. This agreement will enable self-sufficiency in PTA, terminating all PTA imports into Turkey. This is also the first step of SASA’s investment in petrochemicals with more investment in polyester, PTA and MEG to follow in Adana's Yumurtalik district.”

Mike Pickens, IPT president, said, “Our companies have a long history of cooperation dating back to 1974, when SASA licensed IPT’s polyester technology. We are honoured that our industry-leading P8 PTA technology has been selected by SASA. The signing of this license agreement has great significance in terms of long-term collaboration between SASA and IPT.”

IPT’s industry-leading PTA technology, including its latest version of P8 technology, is available as a license package from IPT. For more information, please visit the IPT website at www.ipt.invista.com.

About INVISTA:

From the fibers in your carpet to the plastic in your automobiles, INVISTA’s commitment to continuous improvement has led its employees to develop some of the most durable, versatile polymers and fibers in the world. A subsidiary of Koch Industries since 2004, INVISTA brings to market the proprietary ingredients for nylon 6,6 and recognized brands including STAINMASTER®, CORDURA® and ANTRON®. INVISTA also offers specialty chemical intermediates and process technologies. See the bigger picture at INVISTA.com.

About SASA:

SASA is a leading producer in the world for polyester staple fibers, filament yarns, polyester-based and specialty polymers and intermediates (DMT). Combining and blending a leadership responsibility in industry with a powerful technical inheritance and a high production capacity, SASA successfully manages the whole process from design to production and distribution. SASA began its activities in the polyester sector in 1966.


Contacts

Kim Conlee
This email address is being protected from spambots. You need JavaScript enabled to view it.

LONDON--(BUSINESS WIRE)--#GlobalSubmarinePowerCableMarket--Technavio has been monitoring the submarine power cable market and it is poised to grow by $ 1.08 bn during 2020-2024, progressing at a CAGR of over 4% during the forecast period. The report offers an up-to-date analysis regarding the current market scenario, latest trends and drivers, and the overall market environment.


Although the COVID-19 pandemic continues to transform the growth of various industries, the immediate impact of the outbreak is varied. While a few industries will register a drop in demand, numerous others will continue to remain unscathed and show promising growth opportunities. Technavio’s in-depth research has all your needs covered as our research reports include all foreseeable market scenarios, including pre- & post-COVID-19 analysis. Download a Free Sample Report on COVID-19 Impacts

The market is fragmented, and the degree of fragmentation will accelerate during the forecast period. ABB Ltd., Anixter International Inc., Belden Inc., Fujikura Ltd., Furukawa Electric Co. Ltd., Leoni AG, Nexans SA, NKT AS, Prysmian Spa, and Sumitomo Electric Industries Ltd. are some of the major market participants. To make the most of the opportunities, market vendors should focus more on the growth prospects in the fast-growing segments, while maintaining their positions in the slow-growing segments.

Buy 1 Technavio report and get the second for 50% off. Buy 2 Technavio reports and get the third for free.

View market snapshot before purchasing

Growing offshore renewable energy installations has been instrumental in driving the growth of the market. However, challenges faced in laying and maintaining cables might hamper market growth.

Technavio's custom research reports offer detailed insights on the impact of COVID-19 at an industry level, a regional level, and subsequent supply chain operations. This customized report will also help clients keep up with new product launches in direct & indirect COVID-19 related markets, upcoming vaccines and pipeline analysis, and significant developments in vendor operations and government regulations.

Submarine Power Cable Market 2020-2024: Segmentation

Submarine Power Cable Market is segmented as below:

  • End-user
    • Offshore Wind
    • Island Connection And Inter-country
    • Offshore Oil
    • Others
  • Geography
    • Europe
    • APAC
    • North America
    • MEA
    • South America

To learn more about the global trends impacting the future of market research, download a free sample: https://www.technavio.com/talk-to-us?report=IRTNTR43750

Submarine Power Cable Market 2020-2024: Scope

Technavio presents a detailed picture of the market by the way of study, synthesis, and summation of data from multiple sources. The submarine power cable market report covers the following areas:

  • Submarine Power Cable Market Size
  • Submarine Power Cable Market Trends
  • Submarine Power Cable Market Industry Analysis

This study identifies an increase in sales of HVDC power cables as one of the prime reasons driving the submarine power cable market growth during the next few years.

Technavio suggests three forecast scenarios (optimistic, probable, and pessimistic) considering the impact of COVID-19. Technavio’s in-depth research has direct and indirect COVID-19 impacted market research reports.

Register for a free trial today and gain instant access to 17,000+ market research reports.

Technavio's SUBSCRIPTION platform

Submarine Power Cable Market 2020-2024: Key Highlights

  • CAGR of the market during the forecast period 2020-2024
  • Detailed information on factors that will assist submarine power cable market growth during the next five years
  • Estimation of the submarine power cable market size and its contribution to the parent market
  • Predictions on upcoming trends and changes in consumer behavior
  • The growth of the submarine power cable market
  • Analysis of the market’s competitive landscape and detailed information on vendors
  • Comprehensive details of factors that will challenge the growth of submarine power cable market, vendors

Table of Contents:

Executive Summary

Market Landscape

  • Market ecosystem
  • Market characteristics
  • Value chain analysis

Market Sizing

  • Market definition
  • Market segment analysis
  • Market size 2019
  • Market outlook
  • Market size and forecast for 2019 - 2024

Five Forces Analysis

  • Five forces summary
  • Bargaining power of buyers
  • Bargaining power of suppliers
  • Threat of new entrants
  • Threat of substitutes
  • Threat of rivalry
  • Market condition

Market Segmentation by End-user

  • Market segments
  • Comparison by End-user
  • Offshore wind - Market size and forecast 2019-2024
  • Island connection and inter-country - Market size and forecast 2019-2024
  • Offshore oil - Market size and forecast 2019-2024
  • Others - Market size and forecast 2019-2024
  • Market opportunity by End-user

Customer landscape

Geographic Landscape

  • Geographic segmentation
  • Geographic comparison
  • Europe - Market size and forecast 2019-2024
  • APAC - Market size and forecast 2019-2024
  • North America - Market size and forecast 2019-2024
  • MEA - Market size and forecast 2019-2024
  • South America - Market size and forecast 2019-2024
  • Key leading countries
  • Market opportunity by geography
  • Market drivers
  • Market challenges
  • Market trends

Vendor Landscape

  • Overview
  • Vendor landscape
  • Landscape disruption

Vendor Analysis

  • Vendors covered
  • Market positioning of vendors
  • ABB Ltd.
  • Anixter International Inc.
  • Belden Inc.
  • Fujikura Ltd.
  • Furukawa Electric Co. Ltd.
  • Leoni AG
  • Nexans SA
  • NKT AS
  • Prysmian Spa
  • Sumitomo Electric Industries Ltd.

Appendix

  • Scope of the report
  • Currency conversion rates for US$
  • Research methodology
  • List of abbreviations

About Us

Technavio is a leading global technology research and advisory company. Their research and analysis focuses on emerging market trends and provides actionable insights to help businesses identify market opportunities and develop effective strategies to optimize their market positions. With over 500 specialized analysts, Technavio’s report library consists of more than 17,000 reports and counting, covering 800 technologies, spanning across 50 countries. Their client base consists of enterprises of all sizes, including more than 100 Fortune 500 companies. This growing client base relies on Technavio’s comprehensive coverage, extensive research, and actionable market insights to identify opportunities in existing and potential markets and assess their competitive positions within changing market scenarios.


Contacts

Technavio Research
Jesse Maida
Media & Marketing Executive
US: +1 844 364 1100
UK: +44 203 893 3200
Email: This email address is being protected from spambots. You need JavaScript enabled to view it.
Website: www.technavio.com/


Represents Advanced Group 3 Detonator Technology

HOUSTON--(BUSINESS WIRE)--Titan Division of Hunting Energy Services, a subsidiary of Hunting PLC, the international energy services company, today announced the addition of the Exploding Foil Initiator (EFI) to their ControlFire® cartridge product line.


Hunting’s ControlFire EFI cartridge is an inherently safe, addressable, plug-and-play detonator. The EFI, a Group 3 detonator as defined by API RP 67, has the highest possible safety designation in the industry.

The EFI cartridge is the safest detonator ever introduced into the oilfield industry: no primary explosive is used, intrinsically radio frequency safe, electrostatic safe and protected by ControlFire technology from stray voltage.

About Hunting

Hunting PLC is an international energy services provider to the world's leading upstream oil and gas companies. Established in 1874, it is a premium-listed public company traded on the London Stock Exchange. The Company maintains a corporate office in Houston and is headquartered in London. As well as the United Kingdom, the Company has operations in Canada, China, Indonesia, Kenya, Mexico, Netherlands, Norway, Saudi Arabia, Singapore, South Africa, United Arab Emirates and the United States of America.

The company’s Hunting Energy Services Titan Division engineers and manufactures perforating systems, wireline selective firing systems, cased hole logging instruments, nuclear detectors, energetics, and associated wireline hardware and accessories.


Contacts

Business Contact: John Feuerstein, Hunting, 281-442-7382, This email address is being protected from spambots. You need JavaScript enabled to view it.

DUBLIN--(BUSINESS WIRE)--The "Leadership Quadrant and Strategic Positioning of Oil and Gas Field Equipment and Service Suppliers" report has been added to ResearchAndMarkets.com's offering.


The oil and gas field equipment and service manufacture landscape is diverse and continually evolving. Major players in oil and gas field equipment and service market have diversified product portfolios, strong geographical reach, and have made several strategic initiatives. The dynamics of the oil and gas field equipment and service market extends beyond routine macro-economic elements of supply and demand. It is the relationship between buyer's needs and seller's capabilities as well as the macroeconomic forces at work that affect the market. It is how well and how efficiently the sellers meet the needs of the buyers that determine long-term success.

Over the years, the level of demand for oil and gas field equipment and services has increased due to new technology advancement for oil recovery factors and increasing deep water drilling activities considering the huge reserve of shale gas in the US and China. Oil and gas field equipment and services includes variety of markets, such as exploration, oil and gas drilling, well completion and production, equipment and infrastructure, and drilling related services and is forecast to grow at a CAGR of 6%. The major growth drivers for this market are the growing demand of oil and gas, stronger pricing for pressure pumping services, and rising development of unconventional resources.

Firms that produce oil and gas field equipment and service are approaching market opportunities with starkly different strategies. The analyst, a leading global management consulting and market research firm, has analyzed the global oil and gas field equipment and service suppliers and has come up with a comprehensive research report, Leadership Quadrant and Strategic Positioning of Oil and Gas Field Equipment and Service Suppliers. Using its proprietary research methodology, the analyst has developed a comparative analysis tool, the Leadership Quadrant,' which identifies leaders, contenders, visionaries, and specialists in the oil and gas field equipment and service market and rates each oil and gas field equipment and service producer.

This report also offers a full competitive analysis from target markets to product mapping, from selling strategies to production capabilities. In this research study, six companies such as Schlumberger, Halliburton, Baker Hughes, Saipem, National Oilwell Varco, and Weatherford were analyzed and profiled because they are the top revenue producers for oil and gas field equipment and service. The six profiled manufacturers are grouped in the quadrant. The leadership quadrant analyzes the relative strength among these players. The leadership quadrant addresses the need in the market for manufacturer evaluation based on objective data and metrics.

A total of 60 figures/charts and 6 tables are provided in this 140-pages report to help in your business decisions.

This report answers the following key questions:

  • What are the market shares of suppliers in various market type segments such as in exploration, oil and gas drilling, well completion and production, equipment and infrastructure, and drilling related services market?
  • Who are the market leaders in various regions and what are their market shares?
  • Which companies are more aligned with market opportunities and which companies have ability to gain market share?
  • What are the key differentiators for major suppliers?
  • Which company has the widest product range and how the product mapping looks among various players?
  • Which companies will gain market share?

Key Topics Covered:

1. Leadership Analysis

1.1: Market Description

1.2: Scoring Criteria

1.3: Leadership Quadrant Analysis

1.3.1: Leaders (Top Right)

1.3.2: Contenders (Bottom Right)

1.3.3: Visionaries (Top Left)

1.3.4: Specialists (Lower Left)

2. Competitive Benchmarking

2.1: Product Portfolio Analysis

2.2: Financial Strength

2.3: Market Share Analysis

2.3.1: Market Share in Various Segments

2.3.2: Market Share in Various Regions

3. Schlumberger Profile

3.1: Company Overview

3.1.1: Schlumberger Company Description and Business Segments

3.1.2: Schlumberger Company Statistics

3.2: Oil and Gas Field Equipment and Service Business Overview

3.2.1: Oil and Gas Field Equipment and Service Business Segment

3.2.2: Global Oil and Gas Field Equipment and Service Operations

3.2.3: Key Differentiators and Strengths

3.3: Products and Product Positioning

3.3.1: Product Line Overview

3.3.2: Oil and Gas Field Equipment and Service Product Mapping

3.3.3: Product Positioning in Market Segments

3.4: Markets and Market Positioning

3.4.1: Market Position in Global Oil and Gas Field Equipment and Service Business

3.5: Revenue Breakdown by Market Segments

3.6: Revenue Breakdown by Regions

3.7: Production

3.7.1: Global Manufacturing Operations

3.8: Innovation and Market Leadership

3.9: Marketing, Sales, and Organizational Capabilities

3.9.1: Marketing and Sales

3.9.2: Management Commitment and Track Record

3.10: Financial Strength

4. Halliburton Profile

5. Baker Hughes Profile

6. Saipem Profile

7. National Oilwell Varco Profile

8. Weatherford Profile

For more information about this report visit https://www.researchandmarkets.com/r/chjocc


Contacts

ResearchAndMarkets.com
Laura Wood, Senior Press Manager
This email address is being protected from spambots. You need JavaScript enabled to view it.
For E.S.T Office Hours Call 1-917-300-0470
For U.S./CAN Toll Free Call 1-800-526-8630
For GMT Office Hours Call +353-1-416-8900

LONDON--(BUSINESS WIRE)--#GlobalStraddleCarrierMarket--Technavio has been monitoring the straddle carrier market and it is poised to grow by 2273 units during 2020-2024, progressing at a CAGR of over 4% during the forecast period. The report offers an up-to-date analysis regarding the current market scenario, latest trends and drivers, and the overall market environment.


Although the COVID-19 pandemic continues to transform the growth of various industries, the immediate impact of the outbreak is varied. While a few industries will register a drop in demand, numerous others will continue to remain unscathed and show promising growth opportunities. Technavio’s in-depth research has all your needs covered as our research reports include all foreseeable market scenarios, including pre- & post-COVID-19 analysis. Download a Free Sample Report on COVID-19 Impacts

The market is concentrated, and the degree of concentration will accelerate during the forecast period. ASCOM Spa, Cargotec Corp., Cimolai Technology Spa, Combilift Material Handling Solutions, CVS Ferrari Spa, Faymonville Group, Konecranes Plc, Kress Corp., Liebherr-International AG, and Morello Giovanni Srl are some of the major market participants. To make the most of the opportunities, market vendors should focus more on the growth prospects in the fast-growing segments, while maintaining their positions in the slow-growing segments.

Buy 1 Technavio report and get the second for 50% off. Buy 2 Technavio reports and get the third for free.

View market snapshot before purchasing

Growing preference for marine transport has been instrumental in driving the growth of the market.

Technavio's custom research reports offer detailed insights on the impact of COVID-19 at an industry level, a regional level, and subsequent supply chain operations. This customized report will also help clients keep up with new product launches in direct & indirect COVID-19 related markets, upcoming vaccines and pipeline analysis, and significant developments in vendor operations and government regulations.

Straddle Carrier Market 2020-2024: Segmentation

Straddle Carrier Market is segmented as below:

  • Application
    • Sea Ports
    • Others
  • Geography
    • APAC
    • Europe
    • North America
    • MEA
    • South America

To learn more about the global trends impacting the future of market research, download a free sample: https://www.technavio.com/talk-to-us?report=IRTNTR43286

Straddle Carrier Market 2020-2024: Scope

Technavio presents a detailed picture of the market by the way of study, synthesis, and summation of data from multiple sources. The straddle carrier market report covers the following areas:

  • Straddle Carrier Market Size
  • Straddle Carrier Market Trends
  • Straddle Carrier Market Industry Analysis

This study identifies economies of scale achieved by the container industry as one of the prime reasons driving the straddle carrier market growth during the next few years.

Technavio suggests three forecast scenarios (optimistic, probable, and pessimistic) considering the impact of COVID-19. Technavio’s in-depth research has direct and indirect COVID-19 impacted market research reports.
Register for a free trial today and gain instant access to 17,000+ market research reports.

Technavio's SUBSCRIPTION platform

Straddle Carrier Market 2020-2024: Key Highlights

  • CAGR of the market during the forecast period 2020-2024
  • Detailed information on factors that will assist straddle carrier market growth during the next five years
  • Estimation of the straddle carrier market size and its contribution to the parent market
  • Predictions on upcoming trends and changes in consumer behavior
  • The growth of the straddle carrier market
  • Analysis of the market’s competitive landscape and detailed information on vendors
  • Comprehensive details of factors that will challenge the growth of straddle carrier market, vendors

Table of Contents:

Executive Summary

Market Landscape

  • Market ecosystem
  • Value chain analysis

Market Sizing

  • Market definition
  • Market segment analysis
  • Market size 2019
  • Market outlook: Forecast for 2019 - 2024

Five Forces Analysis

  • Five Force Summary
  • Bargaining power of buyers
  • Bargaining power of suppliers
  • Threat of new entrants
  • Threat of substitutes
  • Threat of rivalry
  • Market condition

Market Segmentation by Application

  • Market segments
  • Comparison by Application
  • Sea Ports - Market size and forecast 2019-2024
  • Others - Market size and forecast 2019-2024
  • Market opportunity by Application

Customer landscape

Geographic Landscape

  • Geographic segmentation
  • Geographic comparison
  • APAC - Market size and forecast 2019-2024
  • Europe - Market size and forecast 2019-2024
  • North America - Market size and forecast 2019-2024
  • MEA - Market size and forecast 2019-2024
  • South America - Market size and forecast 2019-2024
  • Key leading countries
  • Market opportunity by geography
  • Market drivers
  • Market challenges
  • Market trends

Vendor Landscape

  • Vendor landscape
  • Landscape disruption

Vendor Analysis

  • Vendors covered
  • Market positioning of vendors
  • ASCOM Spa
  • Cargotec Corp.
  • Cimolai Technology Spa
  • Combilift Material Handling Solutions
  • CVS ferrari Spa
  • Faymonville Group
  • Konecranes Plc
  • Kress Corp.
  • Liebherr-International AG
  • Morello Giovanni Srl

Appendix

  • Scope of the report
  • Currency conversion rates for US$
  • Research methodology
  • List of abbreviations

About Us

Technavio is a leading global technology research and advisory company. Their research and analysis focuses on emerging market trends and provides actionable insights to help businesses identify market opportunities and develop effective strategies to optimize their market positions. With over 500 specialized analysts, Technavio’s report library consists of more than 17,000 reports and counting, covering 800 technologies, spanning across 50 countries. Their client base consists of enterprises of all sizes, including more than 100 Fortune 500 companies. This growing client base relies on Technavio’s comprehensive coverage, extensive research, and actionable market insights to identify opportunities in existing and potential markets and assess their competitive positions within changing market scenarios.


Contacts

Technavio Research
Jesse Maida
Media & Marketing Executive
US: +1 844 364 1100
UK: +44 203 893 3200
Email: This email address is being protected from spambots. You need JavaScript enabled to view it.
Website: www.technavio.com/

Partnership with Duke and Ameresco addresses key Army priority of providing continuous power to support training mission

FRAMINGHAM, Mass. & FORT BRAGG, N.C.--(BUSINESS WIRE)--#efficiency--Ameresco, Inc., (NYSE: AMRC), a leading energy efficiency and renewable energy company, today announced that the U.S. Army has awarded to Duke Energy and Ameresco’s Federal Solutions Group a utility energy service contract (UESC) to implement power generation and facility efficiency improvements at Fort Bragg.


In partnership with Duke Energy, Ameresco will deploy a 1.1 megawatt (MW) floating solar photovoltaic (PV) system on the Big Muddy Lake at Camp Mackall, a remote Special Forces training site at the base. A 2 MW battery energy storage system will provide seamless transition to on-site generation during utility provider outages. This system will supplement power from the local grid and provide backup power during electric service outages. Under the $36 million design-build contract, Duke secures third-party financing to fund construction, and the U.S. Army pays down the financing annually with the utility savings that the project generates over the term of the contract.

Ameresco will also implement improvements to the boiler system, HVAC systems and lighting systems, as well as water conservation systems. In year one of the performance period, the contract will result in utility cost savings for the Army of over $2 million, a reduction in site energy use of 7% and a site water use reduction of 20%. In addition to reducing facility energy consumption, the modernization of these building systems is designed to reduce the number and frequency of equipment failures, freeing Fort Bragg personnel to focus on mission-critical activities. Construction is slated to begin in November 2020.

“With one-tenth of the Army housed at Fort Bragg, including Special Operations, Airborne and Global Response Force forces, it is imperative to provide energy security and improvements to the installation’s utility infrastructure,” said Nicole Bulgarino, Ameresco Executive Vice President & General Manager of Federal Solutions. “We’re eager to get to work installing these energy saving and resiliency measures across Fort Bragg and to support the readiness of the U.S. Army by maintaining a continuous power supply at this critical installation.”

About Fort Bragg

Fort Bragg has the largest population of any military installation in the world with more than 50,000 active duty personnel. Among the many important functions, the Post is the home of the headquarters for both the US Army Forces Command (FORSCOM) and United States Army Special Operations Command (USASOC). The Post is also home of the Joint Special Operations Command (JSOC), the Army's XVIII Airborne Corps and the headquarters of U.S. Army Reserve Command. Womack Army Medical Center is a 1.1 million square foot, 138 bed hospital located on the Post serving more than 160,000 eligible beneficiaries, the largest beneficiary population in the Army. Two airfields are located within the confines of the Post: Pope Field and Simmons Army Airfield. Pope Field is the airlift point for the Special Forces and Brigade Combat Teams (BCT) that make up the GRF located on the Post.

About Ameresco, Inc.

Founded in 2000, Ameresco, Inc. (NYSE:AMRC) is a leading independent provider of comprehensive services, energy efficiency, infrastructure upgrades, asset sustainability and renewable energy solutions for businesses and organizations throughout North America and Europe. Ameresco’s sustainability services include upgrades to a facility’s energy infrastructure and the development, construction and operation of renewable energy plants. Ameresco has successfully completed energy saving, environmentally responsible projects with Federal, state and local governments, healthcare and educational institutions, housing authorities, and commercial and industrial customers. With its corporate headquarters in Framingham, MA, Ameresco has more than 1,000 employees providing local expertise in the United States, Canada, and the United Kingdom. For more information, visit www.ameresco.com.

The announcement of a customer’s entry into a project contract is not necessarily indicative of the timing or amount of revenue from such contract, of the company’s overall revenue for any particular period or of trends in the company’s overall total project backlog. This project was included in our previously reported awarded backlog as of June 30, 2020.


Contacts

Ameresco: Leila Dillon, 508-661-2264, This email address is being protected from spambots. You need JavaScript enabled to view it.

LONDON--(BUSINESS WIRE)--#GlobalMarineElectronicsMarket--Technavio has been monitoring the marine electronics market and it is poised to grow by $ 927.70 mn during 2020-2024, progressing at a CAGR of 3% during the forecast period. The report offers an up-to-date analysis regarding the current market scenario, latest trends and drivers, and the overall market environment.


Although the COVID-19 pandemic continues to transform the growth of various industries, the immediate impact of the outbreak is varied. While a few industries will register a drop in demand, numerous others will continue to remain unscathed and show promising growth opportunities. Technavio’s in-depth research has all your needs covered as our research reports include all foreseeable market scenarios, including pre- & post-COVID-19 analysis. Download a Free Sample Report on COVID-19 Impacts

The market is fragmented, and the degree of fragmentation will accelerate during the forecast period. FLIR Systems Inc., Furuno Electric Co. Ltd., Garmin Ltd., Kongsberg Gruppen ASA, Navico, Northrop Grumman Corp., Raytheon Co., Thales Group, thyssenkrupp AG, and Ultra Electronics Holdings Plc are some of the major market participants. To make the most of the opportunities, market vendors should focus more on the growth prospects in the fast-growing segments, while maintaining their positions in the slow-growing segments.

Buy 1 Technavio report and get the second for 50% off. Buy 2 Technavio reports and get the third for free.

View market snapshot before purchasing

The rise in seaborne trade has been instrumental in driving the growth of the market. However, delay in defense budget sanctioning might hamper market growth.

Technavio's custom research reports offer detailed insights on the impact of COVID-19 at an industry level, a regional level, and subsequent supply chain operations. This customized report will also help clients keep up with new product launches in direct & indirect COVID-19 related markets, upcoming vaccines and pipeline analysis, and significant developments in vendor operations and government regulations.

Marine Electronics Market 2020-2024: Segmentation

Marine Electronics Market is segmented as below:

  • Product
    • Sonar Systems
    • Radars
    • GPS Tracking Devices
  • Geography
    • North America
    • APAC
    • Europe
    • MEA
    • South America

To learn more about the global trends impacting the future of market research, download a free sample: https://www.technavio.com/talk-to-us?report=IRTNTR43782

Marine Electronics Market 2020-2024: Scope

Technavio presents a detailed picture of the market by the way of study, synthesis, and summation of data from multiple sources. The marine electronics market report covers the following areas:

  • Marine Electronics Market Size
  • Marine Electronics Market Trends
  • Marine Electronics Market Industry Analysis

This study identifies developments in SAS technology as one of the prime reasons driving the marine electronics market growth during the next few years.

Technavio suggests three forecast scenarios (optimistic, probable, and pessimistic) considering the impact of COVID-19. Technavio’s in-depth research has direct and indirect COVID-19 impacted market research reports.

Register for a free trial today and gain instant access to 17,000+ market research reports.

Technavio's SUBSCRIPTION platform

Marine Electronics Market 2020-2024: Key Highlights

  • CAGR of the market during the forecast period 2020-2024
  • Detailed information on factors that will assist marine electronics market growth during the next five years
  • Estimation of the marine electronics market size and its contribution to the parent market
  • Predictions on upcoming trends and changes in consumer behavior
  • The growth of the marine electronics market
  • Analysis of the market’s competitive landscape and detailed information on vendors
  • Comprehensive details of factors that will challenge the growth of marine electronics market, vendors

Table of Contents:

Executive Summary

Market Landscape

  • Market ecosystem
  • Value chain analysis

Market Sizing

  • Market definition
  • Market segment analysis
  • Market size 2019
  • Market outlook: Forecast for 2019-2024

Five Forces Analysis

  • Five forces summary
  • Bargaining power of buyers
  • Bargaining power of suppliers
  • Threat of new entrants
  • Threat of substitutes
  • Threat of rivalry
  • Market condition

Market Segmentation by Product

  • Market segments
  • Comparison by Product
  • Sonar systems - Market size and forecast 2019-2024
  • Radars - Market size and forecast 2019-2024
  • GPS tracking devices - Market size and forecast 2019-2024
  • Market opportunity by Product

Customer landscape

Geographic Landscape

  • Geographic segmentation
  • Geographic comparison
  • North America - Market size and forecast 2019-2024
  • APAC - Market size and forecast 2019-2024
  • Europe - Market size and forecast 2019-2024
  • MEA - Market size and forecast 2019-2024
  • South America - Market size and forecast 2019-2024
  • Key leading countries
  • Market opportunity by geography
  • Volume drivers – Demand led growth
  • Market challenges
  • Market trends

Vendor Landscape

  • Overview
  • Vendor landscape
  • Landscape disruption

Vendor Analysis

  • Vendors covered
  • Market positioning of vendors
  • FLIR Systems Inc.
  • Furuno Electric Co. Ltd.
  • Garmin Ltd.
  • Kongsberg Gruppen ASA
  • Navico
  • Northrop Grumman Corp.
  • Raytheon Co.
  • Thales Group
  • thyssenkrupp AG
  • Ultra Electronics Holdings Plc

Appendix

  • Scope of the report
  • Currency conversion rates for US$
  • Research methodology
  • List of abbreviations

About Us

Technavio is a leading global technology research and advisory company. Their research and analysis focuses on emerging market trends and provides actionable insights to help businesses identify market opportunities and develop effective strategies to optimize their market positions. With over 500 specialized analysts, Technavio’s report library consists of more than 17,000 reports and counting, covering 800 technologies, spanning across 50 countries. Their client base consists of enterprises of all sizes, including more than 100 Fortune 500 companies. This growing client base relies on Technavio’s comprehensive coverage, extensive research, and actionable market insights to identify opportunities in existing and potential markets and assess their competitive positions within changing market scenarios.


Contacts

Technavio Research
Jesse Maida
Media & Marketing Executive
US: +1 844 364 1100
UK: +44 203 893 3200
Email: This email address is being protected from spambots. You need JavaScript enabled to view it.
Website: www.technavio.com/

16.5 megawatt Wildflower Solar project will support the Sacramento Municipal Utility District’s community solar program as well as a pollinator habitat to boost local biodiversity

SACRAMENTO, Calif.--(BUSINESS WIRE)--#cleanenergy--Lightsource bp, a global leader in solar development, has successfully closed on a $20 million financing package and mobilized construction on its Wildflower Solar project located in Rio Linda, about 10 miles north of Sacramento, California. All of the electricity generated by the 16.5MWdc/13MWac project, enough to power about 2,600 homes, will be purchased by the Sacramento Municipal Utility District (SMUD) through a long-term power contract. SMUD, one of the largest community-owned, not-for-profit, electric service providers in the US, has been recognized worldwide for its innovative leadership in sustainability.

SMUD will use the power purchased from Wildflower to support its Neighborhood SolarShares program that can provide solar to new housing developments through an off-site utility scale solar project. The community solar program gives developers the ability to deliver the environmental benefits of solar power without having to install it on every rooftop.

“This program provides options to builders and a net benefit to potential homebuyers, all while providing clean power to our community. The state of California and the Sacramento region are facing an affordable housing crisis and our low-cost solar option provides a valuable tool to lower the construction costs of new homes while supporting carbon reduction goals.” - Arlen Orchard, SMUD CEO and General Manager

“The affordability of solar, combined with its generation of emissions free electricity has made it an ideal source to add to our country’s energy mix. Adding on benefits such as community solar programs that help contribute to affordable housing, along with implementing long-term land management plans that enhance local biodiversity, are all ways that we can work together to multiply solar’s contribution to our nation’s economy and environment.” - Kevin Smith, CEO of the Americas for Lightsource bp

Financing provided by leading institutions

Lightsource bp secured tax equity financing for the project from Guardian Life Insurance Company of America, via its partnership with the Rockwood Group. National Westminster Bank PLC (NatWest), a major retail and commercial bank and leading project financing lender in Europe and long-standing partner of Lightsource bp, is the senior project finance debt lender. The balance of the equity requirements will be invested by Lightsource BP. Lightsource bp engaged CohnReznick as the financial advisor on the transaction.

Local jobs

Project construction is underway, with commercial operation expected by the end of 2020. Construction Innovations, one of the largest locally based U.S. manufacturers of specialized electrical systems, has partnered with local contractors to build the project. The project will employ more than 75 on-site construction team members from the local community during peak construction, in addition to supporting full time manufacturing jobs within Construction Innovations’ Sacramento facility. Founded in Sacramento in 2011, Construction Innovations has provided the electrical systems needed to power over 6% of all solar capacity nationwide.

Pollinator friendly solar – fostering biodiversity and boosting crop yields

Lightsource bp creates customized long-term land and environmental management plans for solar farms that aim to maintain, as well as develop, plant and wildlife habitats to provide a net gain for local biodiversity. The plan for Wildflower Solar will be to create a pollinator friendly solar farm, designed in collaboration with ecology experts to restore and conserve pollinator habitat.

Here in California as well as around the world, habitat loss and climate change have caused pollinator populations to decline. Over 85% of the world’s flowering plants, including more than two-thirds of the world’s crop species, are dependent on pollinators, so declining populations have detrimental effects on food systems worldwide. Researchers at the Department of Energy’s Argonne National Laboratory have found that stable pollinator populations facilitated by pollinator-friendly solar farms allowed nearby agricultural land to be pollinated and, ultimately, boosted crop yields.

About Lightsource bp

Lightsource bp is a global leader in the development and management of solar energy projects. They are a 50:50 joint venture with bp plc, working together to help drive the world’s transition to low carbon energy through competitively priced and sustainable electricity. With solar set to increase tenfold in the next 20 years, Lightsource bp is well-positioned to capitalize on this growth and enact real change on the global energy landscape through responsible solar projects.

The team is comprised of 500 industry specialists, active across 13 countries – providing a full-service to their customers from initial site selection and permitting through to long-term management of projects. Lightsource bp in the US is headquartered in San Francisco with development offices in Denver, Philadelphia, Atlanta and Houston. Since the company announced its strategic expansion into North America in late 2017, the team has developed a pipeline of more than 7 gigawatts of large-scale solar projects at various stages of development across the United States with over one gigawatt of contracted assets. For more information visit lightsourcebp.com, follow us on Twitter @lightsourceBP and Instagram @lightsourcebp or view our LinkedIn page. For media inquiries, please contact Mary Grikas at This email address is being protected from spambots. You need JavaScript enabled to view it..

About SMUD

As the nation’s sixth-largest community-owned electric service provider, SMUD has been providing low-cost, reliable electricity for almost 75 years to Sacramento County (and small adjoining portions of Placer and Yolo Counties). SMUD is a recognized industry leader and award winner for its innovative energy efficiency programs, renewable power technologies, and for its sustainable solutions for a healthier environment. SMUD’s power mix is about 50 percent non-carbon emitting. For more information, visit smud.org.


Contacts

Mary Grikas
This email address is being protected from spambots. You need JavaScript enabled to view it.


LONDON--(BUSINESS WIRE)--#GlobalOffshoreWindCableMarket--Technavio has been monitoring the offshore wind cable market and it is poised to grow by $ 655.89 mn during 2020-2024, progressing at a CAGR of over 7% during the forecast period. The report offers an up-to-date analysis regarding the current market scenario, latest trends and drivers, and the overall market environment.


Technavio suggests three forecast scenarios (optimistic, probable, and pessimistic) considering the impact of COVID-19. Please Request Latest Free Sample Report on COVID-19 Impact

The market is fragmented, and the degree of fragmentation will accelerate during the forecast period. ABB Ltd., Brugg Kabel AG, Hellenic Cables SA, Jiangsu Zhongtian Technology Co. Ltd., Leoni AG, Nexans SA, NKT AS, Parker Hannifin Corp., Prysmian Spa, and Sumitomo Electric Industries Ltd. are some of the major market participants. To make the most of the opportunities, market vendors should focus more on the growth prospects in the fast-growing segments, while maintaining their positions in the slow-growing segments.

Growing offshore renewable energy installations has been instrumental in driving the growth of the market. However, higher investments needed in offshore projects might hamper market growth.

Offshore Wind Cable Market 2020-2024 : Segmentation

Offshore Wind Cable Market is segmented as below:

  • Product
    • Export Cable
    • Inter-array Cable
  • Geography
    • Europe
    • APAC
    • North America
    • MEA
    • South America

To learn more about the global trends impacting the future of market research, download a free sample: https://www.technavio.com/talk-to-us?report=IRTNTR43314

Offshore Wind Cable Market 2020-2024 : Scope

Technavio presents a detailed picture of the market by the way of study, synthesis, and summation of data from multiple sources. Our offshore wind cable market report covers the following areas:

  • Offshore Wind Cable Market size
  • Offshore Wind Cable Market trends
  • Offshore Wind Cable Market industry analysis

This study identifies the innovations in the wind industry as one of the prime reasons driving the offshore wind cable market growth during the next few years.

Offshore Wind Cable Market 2020-2024 : Vendor Analysis

We provide a detailed analysis of around 25 vendors operating in the offshore wind cable market, including some of the vendors such as ABB Ltd., Brugg Kabel AG, Hellenic Cables SA, Jiangsu Zhongtian Technology Co. Ltd., Leoni AG, Nexans SA, NKT AS, Parker Hannifin Corp., Prysmian Spa, and Sumitomo Electric Industries Ltd. Backed with competitive intelligence and benchmarking, our research reports on the Offshore Wind Cable Market are designed to provide entry support, customer profile and M&As as well as go-to-market strategy support.

Register for a free trial today and gain instant access to 17,000+ market research reports.

Technavio's SUBSCRIPTION platform

Offshore Wind Cable Market 2020-2024 : Key Highlights

  • CAGR of the market during the forecast period 2020-2024
  • Detailed information on factors that will assist offshore wind cable market growth during the next five years
  • Estimation of the offshore wind cable market size and its contribution to the parent market
  • Predictions on upcoming trends and changes in consumer behavior
  • The growth of the offshore wind cable market
  • Analysis of the market’s competitive landscape and detailed information on vendors
  • Comprehensive details of factors that will challenge the growth of offshore wind cable market vendors

Table Of Contents :

Executive Summary

Market Landscape

Market Sizing

Five Forces Analysis

Market Segmentation by Product

Customer Landscape

Geographic Landscape

Vendor Landscape

Vendor Analysis

Appendix

Explore Technavio

About Us

Technavio is a leading global technology research and advisory company. Their research and analysis focuses on emerging market trends and provides actionable insights to help businesses identify market opportunities and develop effective strategies to optimize their market positions. With over 500 specialized analysts, Technavio’s report library consists of more than 17,000 reports and counting, covering 800 technologies, spanning across 50 countries. Their client base consists of enterprises of all sizes, including more than 100 Fortune 500 companies. This growing client base relies on Technavio’s comprehensive coverage, extensive research, and actionable market insights to identify opportunities in existing and potential markets and assess their competitive positions within changing market scenarios.


Contacts

Technavio Research
Jesse Maida
Media & Marketing Executive
US: +1 844 364 1100
UK: +44 203 893 3200
Email: This email address is being protected from spambots. You need JavaScript enabled to view it.
Website: www.technavio.com/

LONDON--(BUSINESS WIRE)--#FuelDispenserMarket--Technavio has been monitoring the global fuel dispenser market size and it is poised to grow by USD 1.43 billion during 2020-2024, progressing at a CAGR of over 5% during the forecast period. The report offers an up-to-date analysis regarding the current market scenario, latest trends and drivers, and the overall market environment.


Although the COVID-19 pandemic continues to transform the growth of various industries, the immediate impact of the outbreak is varied. While a few industries will register a drop in demand, numerous others will continue to remain unscathed and show promising growth opportunities. Technavio’s in-depth research has all your needs covered as our research reports include all foreseeable market scenarios, including pre- & post-COVID-19 analysis. Download a Free Sample Report on COVID-19 Impacts

Frequently Asked Questions:

  • Based on segmentation by product, which is the leading segment in the market?
    Submersible segment is leading the global fuel dispenser market.
  • What are the major trends in the market?
    Growing focus on reducing carbon footprint is a key trend in the market.
  • At what rate is the market projected to grow?
    The market is expected to grow at a CAGR of over 5% during the forecast period.​​​​​​
  • Who are the top players in the market?
    Beijing SANKI Petroleum Technology Co. Ltd., Bennett Pump Co., Censtar Science & Technology Corp. Ltd., Dover Corp., Gilbarco Inc., HENSHEN MACHINERY Co. Ltd., Scheidt & Bachmann GmbH, SPYRIDIS GROUP, Tatsuno Corp., and Zhejiang Datian machine Co. Ltd. are some of the major market participants.
  • ​​​​​​​What are the key market drivers and challenges?
    Increasing inbound and outbound tourism is expected to drive the global fuel dispenser market. However, the decline in number of fuel stations might hamper market growth.
  • ​​​​​​​How big is the APAC market?
    APAC region will contribute 36% of the market growth.

The market is fragmented, and the degree of fragmentation will accelerate during the forecast period. Beijing SANKI Petroleum Technology Co. Ltd., Bennett Pump Co., Censtar Science & Technology Corp. Ltd., Dover Corp., Gilbarco Inc., HENSHEN MACHINERY Co. Ltd., Scheidt & Bachmann GmbH, SPYRIDIS GROUP, Tatsuno Corp., and Zhejiang Datian machine Co. Ltd. are some of the major market participants. The Increasing inbound and outbound tourism will offer immense growth opportunities. To make most of the opportunities, market vendors should focus more on the growth prospects in the fast-growing segments, while maintaining their positions in the slow-growing segments.

Buy 1 Technavio report and get the second for 50% off. Buy 2 Technavio reports and get the third for free.

View market snapshot before purchasing

Technavio's custom research reports offer detailed insights on the impact of COVID-19 at an industry level, a regional level, and subsequent supply chain operations. This customized report will also help clients keep up with new product launches in direct & indirect COVID-19 related markets, upcoming vaccines and pipeline analysis, and significant developments in vendor operations and government regulations.

Fuel Dispenser Market 2020-2024: Segmentation

Fuel Dispenser Market is segmented as below:

  • Product
    • Submersible
    • Suction
  • Geographic Landscape
    • APAC
    • North America
    • Europe
    • MEA
    • South America

To learn more about the global trends impacting the future of market research, download a free sample: https://www.technavio.com/talk-to-us?report=IRTNTR43097

Fuel Dispenser Market 2020-2024: Scope

Technavio presents a detailed picture of the market by the way of study, synthesis, and summation of data from multiple sources. The fuel dispenser market report covers the following areas:

  • Fuel Dispenser Market Size
  • Fuel Dispenser Market Trends
  • Fuel Dispenser Market Industry Analysis

This study identifies the growing focus on reducing carbon footprint as one of the prime reasons driving the Fuel Dispenser Market growth during the next few years.

Technavio suggests three forecast scenarios (optimistic, probable, and pessimistic) considering the impact of COVID-19. Technavio’s in-depth research has direct and indirect COVID-19 impacted market research reports.

Register for a free trial today and gain instant access to 17,000+ market research reports.

Technavio's SUBSCRIPTION platform

Fuel Dispenser Market 2020-2024: Key Highlights

  • CAGR of the market during the forecast period 2020-2024
  • Detailed information on factors that will assist fuel dispenser market growth during the next five years
  • Estimation of the fuel dispenser market size and its contribution to the parent market
  • Predictions on upcoming trends and changes in consumer behavior
  • The growth of the fuel dispenser market
  • Analysis of the market’s competitive landscape and detailed information on vendors
  • Comprehensive details of factors that will challenge the growth of fuel dispenser market vendors

Table of Contents:

Executive Summary

Market Landscape

  • Market ecosystem
  • Value chain analysis

Market Sizing

  • Market definition
  • Market segment analysis
  • Market size 2019
  • Market outlook: Forecast for 2019 - 2024

Five Forces Analysis

  • Five forces summary
  • Bargaining power of buyers
  • Bargaining power of suppliers
  • Threat of new entrants
  • Threat of substitutes
  • Threat of rivalry
  • Market condition

Market Segmentation by Product

  • Market segments
  • Comparison by Product
  • Submersible - Market size and forecast 2019-2024
  • Suction - Market size and forecast 2019-2024
  • Market opportunity by Product

Customer landscape

  • Customer landscape

Geographic Landscape

  • Geographic segmentation
  • Geographic comparison
  • APAC - Market size and forecast 2019-2024
  • North America - Market size and forecast 2019-2024
  • Europe - Market size and forecast 2019-2024
  • MEA - Market size and forecast 2019-2024
  • South America - Market size and forecast 2019-2024
  • Key leading countries
  • Market opportunity by geography
  • Volume driver - Demand led growth
  • Market challenges
  • Market trends

Vendor Landscape

  • Overview
  • Vendor landscape
  • Landscape disruption

Vendor Analysis

  • Vendors covered
  • Market positioning of vendors
  • Beijing SANKI Petroleum Technology Co. Ltd.
  • Bennett Pump Co.
  • Censtar Science & Technology Corp. Ltd.
  • Dover Corp.
  • Gilbarco Inc.
  • HENSHEN MACHINERY Co. Ltd.
  • Scheidt & Bachmann GmbH
  • SPYRIDIS GROUP
  • Tatsuno Corp.
  • Zhejiang Datian machine Co. Ltd.

Appendix

  • Scope of the report
  • Currency conversion rates for US$
  • Research methodology
  • List of abbreviations

About Us

Technavio is a leading global technology research and advisory company. Their research and analysis focuses on emerging market trends and provides actionable insights to help businesses identify market opportunities and develop effective strategies to optimize their market positions. With over 500 specialized analysts, Technavio’s report library consists of more than 17,000 reports and counting, covering 800 technologies, spanning across 50 countries. Their client base consists of enterprises of all sizes, including more than 100 Fortune 500 companies. This growing client base relies on Technavio’s comprehensive coverage, extensive research, and actionable market insights to identify opportunities in existing and potential markets and assess their competitive positions within changing market scenarios.


Contacts

Technavio Research
Jesse Maida
Media & Marketing Executive
US: +1 844 364 1100
UK: +44 203 893 3200
Email: This email address is being protected from spambots. You need JavaScript enabled to view it.
Website: www.technavio.com/

Offshore Source Logo

Offshore Source keeps you updated with relevant information concerning the Offshore Energy Sector.

Any views or opinions represented on this website belong solely to the author and do not represent those of the people, institutions or organizations that Offshore Source or collaborators may or may not have been associated with in a professional or personal capacity, unless explicitly stated.

Corporate Offices

Technology Systems Corporation
8502 SW Kansas Ave
Stuart, FL 34997

info@tscpublishing.com