Business Wire News

DALLAS--(BUSINESS WIRE)--Kosmos Energy Ltd. (“Kosmos”) (NYSE: KOS) announced today that, subject to market conditions, it intends to offer $400 million aggregate principal amount of senior notes due 2028. Kosmos intends to use the net proceeds from the offering to repay outstanding indebtedness under its revolving credit facility and commercial debt facilities and for general corporate purposes.


The securities to be offered will not be registered under the Securities Act of 1933, as amended (the “Securities Act”), or any state securities laws and unless so registered, the securities may not be offered or sold in the United States without registration or an applicable exemption from the registration requirements of the Securities Act and applicable state securities or blue sky laws and foreign securities laws. The senior notes and the related guarantees will be offered only to persons reasonably believed to be qualified institutional buyers in reliance on the exemption from registration set forth in Rule 144A under the Securities Act and, outside the United States, to non-U.S. persons in reliance on the exemption from registration set forth in Regulation S under the Securities Act.

This press release is being issued pursuant to, and in accordance with, Rule 135c under the Securities Act, and is neither an offer to sell nor a solicitation of an offer to buy the notes or any other securities and shall not constitute an offer to sell or a solicitation of an offer to buy, or a sale of, the notes or any other securities in any jurisdiction in which such offer, solicitation or sale is unlawful.

About Kosmos Energy

Kosmos is a full-cycle deepwater independent oil and gas exploration and production company focused along the Atlantic Margins. Our key assets include production offshore Ghana, Equatorial Guinea and U.S. Gulf of Mexico, as well as a world-class gas development offshore Mauritania and Senegal. Kosmos is listed on The New York Stock Exchange and London Stock Exchange and is traded under the ticker symbol KOS. As an ethical and transparent company, Kosmos is committed to doing things the right way. The Company’s Business Principles articulate our commitment to transparency, ethics, human rights, safety and the environment.

Forward-Looking Statements

This press release contains forward-looking statements within the meaning of Section 27A of the Securities Act of 1933, as amended, and Section 21E of the Securities Exchange Act of 1934, as amended. All statements, other than statements of historical facts, included in this press release that address activities, events or developments that Kosmos expects, believes or anticipates will or may occur in the future are forward-looking statements. Kosmos’ estimates and forward-looking statements are mainly based on its current expectations and estimates of future events and trends, which affect or may affect its businesses and operations. Although Kosmos believes that these estimates and forward-looking statements are based upon reasonable assumptions, they are subject to several risks and uncertainties and are made in light of information currently available to Kosmos. When used in this press release, the words “anticipate,” “believe,” “intend,” “expect,” “plan,” “will” or other similar words are intended to identify forward-looking statements. Such statements are subject to a number of assumptions, risks and uncertainties, many of which are beyond the control of Kosmos, which may cause actual results to differ materially from those implied or expressed by the forward-looking statements. Further information on such assumptions, risks and uncertainties is available in Kosmos’ Securities and Exchange Commission (“SEC”) filings. Kosmos undertakes no obligation and does not intend to update or correct these forward-looking statements to reflect events or circumstances occurring after the date of this press release, except as required by applicable law. You are cautioned not to place undue reliance on these forward-looking statements, which speak only as of the date of this press release. All forward-looking statements are qualified in their entirety by this cautionary statement.

European Economic Area and United Kingdom Notices

Financial Conduct Authority (FCA) stabilization rules apply.

MiFIR professionals / ECPs only / No PRIIPs / UK PRIIPs KID - Manufacturer target market (MiFID II product governance) is eligible counterparties and professional clients only (all distribution channels). No PRIIPs regulation key information document (KID) has been prepared as the notes are not available to retail investors in the EEA or the United Kingdom.


Contacts

Kosmos Energy Ltd.
Investor Relations
Jamie Buckland, +44 (0) 203 954 2831
This email address is being protected from spambots. You need JavaScript enabled to view it.

Media Relations
Thomas Golembeski, +1-214-445-9674
This email address is being protected from spambots. You need JavaScript enabled to view it.

Integration to boost electrical grid performance and resiliency with up to 100x faster grid learning

COSTA MESA, Calif.--(BUSINESS WIRE)--#AI--Veritone, Inc. (Nasdaq: VERI), the creator of the world’s first operating system for artificial intelligence (AI), aiWARE™, today announced the migration of Veritone's aiWARE and patented Cooperative Distributed Inferencing (CDI), a predictive smart grid optimization and control technology, to NVIDIA robust software stack and parallel-processing GPUs in order to meet the challenges of complex real-time AI model and device control optimization in energy delivery and generation.


Addressing the dynamic environments of today’s complex electrical grids, which incorporate distributed energy resources such as solar, batteries, wind and hydropower, requires predictive, responsive AI to ensure that all devices under control across the grid are operating optimally and safely. Based on initial testing, Veritone projects that the CDI running on the NVIDIA EGX edge AI platform, which consists of NVIDIA GPUs optimized with NVIDIA software platforms and tools, will increase processing speeds for updating device models by up to 100x compared with multi-threaded CPUs. This accelerated processing will significantly improve battery control, forecasting, autonomous dispatch, and overall grid performance.

“Leveraging NVIDIA’s software platforms for Veritone CDI exemplifies our commitment to developing cutting-edge technologies for grid optimization and accelerated clean energy adoption,” said CDI inventor and Veritone Chief Data Scientist Dr. Wolf Kohn. “From autonomous, resilient grids to local battery optimization, Veritone sees a significant opportunity to effectively manage our nation’s fragile network of energy systems that grows more complex by the minute. We have more than a decade of engineering invested in this technology, and we are excited to see our responsive, real-time device modeling made possible through strong collaboration with NVIDIA engineers and their technology stack.”

The two companies are currently working to enable Veritone’s accelerated CDI rule-based model optimizer, which uses reinforcement learning for real-time modeling of solar batteries and other distributed energy resources, to run on NVIDIA EGX. Veritone’s solutions model a wide range of battery parameters, including charging/discharging states, operating conditions such as temperature and humidity, and warranty constraints. With the accelerated processing capabilities made possible by NVIDIA, Veritone’s CDI models update continuously in real-time based on constantly changing operating conditions, and the most optimal model is used at any given time to ensure the best operational state. This model optimization is done at the device level, and also synchronizes across multiple devices in a complex energy network so that the entire grid's resources are operating at optimal performance levels.

“We are very excited about how Veritone is leveraging the power of the NVIDIA accelerated computing platforms to streamline the management and optimization of clean energy. We believe that this will help provide more predictable and reliable energy,” said Keith Cockerham, Utilities Industry Lead at NVIDIA. “The combination of Veritone CDI and NVIDIA EGX provides the millisecond-level autonomous decision-making capabilities required for smart grid management and resiliency.”

Veritone's energy solutions use patented CDI technology to deliver real-time dynamic modeling and control of energy devices for predictable, cost-effective and resilient energy dispatch. Some clean energy sources, such as solar and electric car batteries, require extremely fast model refresh times to ensure proper energy charging, discharging and health monitoring. Energy spikes, anomalies and extreme weather events require a real-time approach to device model updating and device control.

Applications for AI model updating using GPUs are abundant. Veritone is focusing their initial NVIDIA migration efforts on energy optimization of complex smart grids, and plan to develop optimized solutions for grid and electric car batteries in the future. For grid batteries, fast and accurate modeling of batteries on NVIDIA EGX are planned to increase battery utilization, reduce the risk of thermal events and extend battery life. For electric car batteries, the two companies plan to integrate Veritone’s dynamic modeling with NVIDIA EGX, which is expected to improve range, battery longevity and reduce the risk of thermal events.

NVIDIA and Veritone are co-hosting a webinar on March 4, 2021, “Optimizing Real-Time Models of Dynamic Energy Systems” Click here to register for the webinar, which will cover the following topics:

  • How high-performance computing (HPC) on NVIDIA GPUs can solve large optimization problems for dynamic grid systems in real-time;
  • Why the battery Data Tomograph modeling system is well suited for NVIDIA GPUs because of its high computational density and high data flow requirements; and
  • How dynamic modeling can dramatically improve the economics of operating smart grids.

The combination of Veritone AI technology and NVIDIA EGX will open doors to real-time AI applications running on-premise, hybrid or in the public cloud, for use in markets such as energy, security, smart cities, media and entertainment, contact centers, and industrial and manufacturing.

For more information about Veritone Energy Solutions and the aiWARE AI operating system, visit veritone.com.

About Veritone

Veritone (Nasdaq: VERI) is a leading provider of artificial intelligence (AI) technology and solutions. The company’s proprietary operating system, aiWARE™ powers a diverse set of AI applications and intelligent process automation solutions that are transforming both commercial and government organizations. aiWARE orchestrates an expanding ecosystem of machine learning models to transform audio, video, and other data sources into actionable intelligence. The company's AI developer tools enable its customers and partners to easily develop and deploy custom applications that leverage the power of AI to dramatically improve operational efficiency and unlock untapped opportunities. Veritone is headquartered in Costa Mesa, California, and has offices in Denver, London, New York and San Diego. To learn more, visit Veritone.com.

Safe Harbor Statement

This news release contains forward-looking statements, including without limitation statements regarding aiWARE Energy’s support of the NVIDIA CUDA platform, the expected processing speed improvements resulting from the integration, the performance and benefits to customers of the use of NVIDIA chipsets with aiWARE, the potential use cases for the integrated solutions, and Veritone’s and NVIDIA’s planned future technology integration efforts for grid and electric car batteries. Without limiting the generality of the foregoing, words such as “may,” “will,” “expect,” “believe,” “anticipate,” “intend,” “could,” “estimate” or “continue” or the negative or other variations thereof or comparable terminology are intended to identify forward-looking statements. In addition, any statements that refer to expectations, projections or other characterizations of future events or circumstances are forward-looking statements. Assumptions relating to the foregoing involve judgments and risks with respect to various matters which are difficult or impossible to predict accurately and many of which are beyond the control of Veritone. Certain of such judgments and risks are discussed in Veritone’s SEC filings. Although Veritone believes that the assumptions underlying the forward-looking statements are reasonable, any of the assumptions could prove inaccurate and, therefore, there can be no assurance that the results contemplated in forward-looking statements will be realized. In light of the significant uncertainties inherent in the forward-looking information included herein, the inclusion of such information should not be regarded as a representation by Veritone or any other person that their objectives or plans will be achieved. Veritone undertakes no obligation to revise the forward-looking statements contained herein to reflect events or circumstances after the date hereof or to reflect the occurrence of unanticipated events.


Contacts

Allison Zullo
Walker Sands, for Veritone
This email address is being protected from spambots. You need JavaScript enabled to view it.
330-554-5965

HINGHAM, Mass.--(BUSINESS WIRE)--O2 Investment Partners, LLC (www.o2investment.com) is pleased to announce that through Mantis Innovation Group, LLC (www.mantisinnovation.com) it has made an investment in and partnered with Fairbanks Energy Services, Inc. (www.fairbanksenergy.com) and its leadership team to enhance both companies’ service offerings focused on improving facility performance and energy efficiency, reducing costs, and implementing and monitoring ESG initiatives.


Dan Marzuola, CEO of Mantis Innovation Group, commented, “We are extremely excited about the addition of Fairbanks Energy Services and its leadership team to the Mantis platform. Fairbanks Energy’s services complement and add to the Mantis product mix that will provide energy-efficient and sustainable solutions to our clients’ facilities, reducing their carbon footprint and annual energy spend. This acquisition positions Mantis to be a premier company in assisting our clients to meet their goal of net zero greenhouse emissions over time.”

Fairbanks Energy Services is an industry leader in providing nationwide energy efficiency solutions for clients across commercial, industrial, data center, education, and healthcare verticals. Fairbanks Energy’s comprehensive services include turnkey project management, engineering, design, controls, and efficiency solutions for HVAC/mechanical, LED lighting, and advanced building automation systems. In addition, Fairbanks Energy’s comprehensive approach and deep knowledge of federal, state, and municipal incentive programs allow them to identify, develop, and execute solutions that maximize savings, reduce carbon footprints, and minimize capital outlay.

Adam Fairbanks, President of Fairbanks Energy Services, commented, “We are thrilled to be joining the Mantis Innovation Group team. Combining Fairbanks Energy with Mantis further extends our ability to improve facility performance with a broader suite of technology-enabled facility management solutions. We view this alliance with Mantis as an excellent cultural fit and a natural next step in the growth of our organization.”

Joe Vallee of O2 Investment Partners added, “We are very fortunate to welcome the Fairbanks Energy Services team to Mantis. Peter, Adam, and Ross Fairbanks bring additional horsepower to our leadership group that will help continue to scale the business in a client-focused direction. Fairbanks Energy immediately adds expertise in energy efficiency solutions, implementing and monitoring ESG initiatives, and automation solutions for facility operators targeting HVAC/mechanical, lighting, and building management systems. We look forward to working closely with the Fairbanks Energy team to continue providing superior services and offer more comprehensive solutions to each other’s client base.”

About Mantis Innovation Group, LLC

Mantis Innovation Group, LLC is a technology-driven firm employing proprietary software and data analytics to improve facility performance. Mantis’ service offering includes electricity and natural gas procurement; proactive roof, pavement, mechanical HVAC, and envelope management; design and quality assurance; demand management; energy monitoring; and solar / renewable implementation. Mantis is headquartered in Houston, TX, with additional operations in Dallas, Texas; Waco, Texas; Coppell, TX; Trenton, New Jersey; Burlington, MA; West Springfield, MA; Hingham, MA; Chicago, IL; King of Prussia, PA; Harrisburg, PA; and Brunswick, ME. Additional information is available at www.mantisinnovation.com.

About Fairbanks Energy Services, Inc.

Fairbanks Energy Services, Inc. provides national energy efficiency solutions for clients across the commercial, industrial, education, healthcare, and data center verticals. Fairbanks Energy’s comprehensive services include turnkey project management, engineering, design, controls, and efficiency solutions for HVAC/mechanical, LED lighting, and building management systems. Fairbanks Energy’s comprehensive approach and deep knowledge of federal, state, and municipal incentive programs allow them to identify, develop, and execute solutions that maximize savings, reduce carbon footprints, and minimize capital outlay. Additional information is available at www.fairbanksenergy.com.

About O2 Investment Partners

O2 Investment Partners is a Midwestern based private equity firm that seeks to acquire majority interests in lower middle market B2B services, technology, and select niche industrial companies. The firm invests in businesses with earnings growth potential and a clear path to the creation of shareholder value.

O2 invests with a view toward partnering with management to build and grow the business and take it to its next stage of development. This requires not only a clear vision and strategic plan to create shareholder value, but a close partnership and alignment of interest with management. Additional information is available at www.o2investment.com.


Contacts

O2 Investment Partners
Joe Vallee, Vice President
This email address is being protected from spambots. You need JavaScript enabled to view it.

HBW Adds More Federal Expertise in Renewable, Traditional Energy

HOUSTON--(BUSINESS WIRE)--#HBWResources--Leading strategic public policy, communications and advocacy firm HBW Resources today announced the hiring of John Northington, Jr., as Director of Federal Affairs, expanding the company’s bipartisan strength and renewable and traditional energy expertise.


He is HBW’s fourth hire in 2021, reflecting the firm’s record 2020 growth.

Northington brings more than a decade of public and private sector energy policy and regulatory experience. A passionate advocate for responsible energy development as the world moves toward a lower-carbon future, Northington specializes in upstream, midstream, and renewable issues.

“John is a tremendous addition to our federal affairs team who embodies our firm’s founding commitment to bipartisanship and finding solutions for clients by seeking common ground,” HBW Resources Managing Partner David Holt said. “John’s experience in midstream, upstream, renewable energy, as well as conservation and environmental regulation, builds on our core expertise and commitment to serving clients across the energy industry, whether in emerging or traditional sectors.”

“The energy world has so many exciting opportunities and daunting challenges right now, and I’m looking forward to bringing my experience working with professionals in the industry and the Biden Administration to help HBW and our clients,” Northington said. “I’m thrilled to join an industry leader that shares my passion for building a bright energy future that wholeheartedly embraces responsible development, environmental stewardship, conservation and innovation.”

Involved in Democratic politics for more than 15 years, Northington is a veteran of local, state, and federal campaigns, including President Barack Obama’s successful 2012 run. During the Obama Administration, Northington served as Special Advisor to the Director of the Bureau of Safety and Environmental Enforcement at the Department of the Interior (DOI).

There, he focused on a wide range of matters involving the safe operations of U.S. Outer Continental Shelf oil and gas activity, including the Well Control Rule finalization and other regulations. John assisted with permitting, monitoring and tribal engagement while working on the Arctic Rule and Arctic Development, and spearheaded the International Regulators’ Forum 2015 meeting. He also worked with the Office of Congressional and International Affairs and the Office of Offshore Regulatory Programs to help achieve various Administration objectives, including sharing U.S. safety and regulatory best practices with foreign nations.

Northington’s other work includes Endangered Species Act consulting. He will work from HBW’s Houston headquarters.

About HBW Resources:

Headquartered in Houston with offices across the U.S., HBW Resources is a strategic advisory firm that excels at navigating clients through the intersection of politics, policy and industry innovation. The company’s multidisciplinary approach helps clients achieve goals by shaping industry dialogue, designing innovative solutions and crafting sensible policy via media and regulatory affairs, government relations and environmental and social governance. HBW’s industry experts offer hands-on experience and strategic counsel, plus consulting and risk mitigation services for businesses dependent on the sociopolitical and economic landscape.


Contacts

Bryson Hull
HBW Resources
P: 202-657-2855
This email address is being protected from spambots. You need JavaScript enabled to view it.

135 Honoree Companies Recognized for Their Unwavering Commitment to Business Integrity. Values-based Leadership Leads to Financial Outperformance.

NEW YORK--(BUSINESS WIRE)--#WorldsMostEthicalCompanies--Ethisphere, a global leader in defining and advancing the standards of ethical business practices, today announced the 135 honorees representing 22 countries and 47 industries that have earned the coveted designation of World’s Most Ethical Companies® in 2021. This is the 15th annual recognition of companies that have demonstrated a commitment to ethical business practices through programs that positively impact employees, communities, and broader stakeholders, and contribute to sustainable and profitable long-term business performance.


In 2021, nine companies are first-time honorees, while six have been recognized 15 times, every year since the awards inception in 2007.

“We continue to be inspired by the actions and initiatives of the World’s Most Ethical Companies honorees. Leadership by this group of companies is a reason that business – above all other institutions – was most trusted during the challenging times of 2020,” stated Ethisphere CEO, Timothy Erblich. “Honorees integrate ethics and values with corporate strategy. They speak up, are transparent, take action, and look for innovative ways to make a difference. We congratulate their efforts.”

“Integrity has been embedded into our DNA and is the foundation for our ethics since we were founded 100 years ago,” said Suphachai Chearavanont, CEO of Charoen Pokphand Group. “Being recognized as one of the World’s Most Ethical Companies is a true honour. We’re still on a journey and I am greatly appreciative of the collective efforts of all our employees.”

“It’s a privilege to have once again been named one of the world’s most ethical companies,” expressed Craig Arnold, Chairman and CEO of Eaton. “This recognition reflects the commitment of our 92,000 employees who serve all our stakeholders with uncompromising integrity and dedication to our mission to improve the quality of life and the environment.”

“It’s an honor to be named as one of the World’s Most Ethical Companies for the 15th consecutive year, a recognition that reflects Ecolab’s values to act with integrity no matter the circumstances,” said Christophe Beck, President and CEO of Ecolab. “I’m proud to lead a company where associates are committed to doing what’s right, every single day, and know that ethical operations are foundational to our long-term success.”

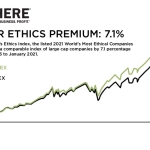
Ethisphere’s 2021 Ethics Index, the collection of publicly-traded companies recognized as recipients of this year’s World’s Most Ethical Companies designation, outperformed a comparable index of large cap companies by 7.1 percentage points over the past five calendar years.

The outperformance, which we refer to as the “Ethics Premium,” has remained consistent since we began tracking the equity performance of honoree companies. We believe this outperformance is the result of the kinds of practices that lead a company to be on our list – practices that demonstrate investment in their people, in their culture, and in their communities. We see in this data that those practices, over time, lead to stronger financial performance.

“As evidenced by this continued outperformance, ethics is good for business,” Erblich added.

Ethisphere will host a Virtual Honoree Gala on March 30, 2021 where Make-A-Wish CEO, Richard K. Davis, will deliver the keynote address. This will be the 15th year we celebrate the standard bearers of integrity at this Gala.

Methodology & Outcomes

Grounded in Ethisphere’s proprietary Ethics Quotient®, the World’s Most Ethical Companies assessment process includes more than 200 data points on culture, environmental and social practices, ethics and compliance activities, governance, diversity and initiatives to support a strong value chain. The process serves as an operating framework to capture and codify the leading practices of organizations across industries and around the globe.

This year, the process was streamlined and the question set expanded to gauge how applicants are adapting and responding to the global health pandemic, environmental, social, and governance factors, safety, equity, and inclusion and social justice.

All companies that participate in the assessment process receive an Analytical Scorecard providing them insights into where their programs stand against the demanding standards of leading companies.

Honorees

The full list of the 2021 World’s Most Ethical Companies can be found at https://worldsmostethicalcompanies.com/honorees/

Follow the conversation on Twitter: 2021 #WorldsMostEthicalCompanies.

About the Ethisphere Institute

The Ethisphere® Institute is the global leader in defining and advancing the standards of ethical business practices that fuel corporate character, marketplace trust, and business success. Ethisphere has deep expertise in measuring and defining core ethics standards using data-driven insights that help companies enhance corporate character and measure and improve culture. Ethisphere honors superior achievement through its World’s Most Ethical Companies recognition program and provides a community of industry experts with the Business Ethics Leadership Alliance (BELA). More information about Ethisphere can be found at https://ethisphere.com.


Contacts

Clea Nabozny
This email address is being protected from spambots. You need JavaScript enabled to view it.
+1 (480) 397-2658

  • Memorandum of Understanding to establish a global strategic partnership for medium duty engine systems.
  • Additional opportunities for collaboration to be evaluated.
  • Cummins Inc. to establish an engine plant within the Mercedes-Benz Mannheim campus to localize medium duty engines compliant with the Euro VII emissions standard for Daimler Trucks and Buses.
  • In the future, global medium duty engine systems for Daimler Trucks and Buses all over the world will be provided by Cummins Inc.
  • Daimler Truck AG is focused on the development of zero-emission drive technologies and the further development of its own heavy-duty engine platform (HDEP).

STUTTGART, Germany & COLUMBUS, Ind.--(BUSINESS WIRE)--Today, Daimler Truck AG and global power leader and independent engine manufacturer Cummins Inc. (NYSE: CMI) announced that the companies have signed a memorandum of understanding establishing a global strategic partnership for medium duty engine systems. The companies added that other opportunities for collaboration are also being evaluated.


As part of the planned strategic partnership, Cummins will invest in the further development of medium duty engine systems for Daimler Trucks and Buses and the global production and delivery of medium duty engines by Cummins for Daimler Trucks and Buses beginning in the second half of the decade.

Martin Daum, Chairman of the Board of Management at Daimler Truck AG and a member of the Board of Management at Daimler AG said, “The memorandum of understanding between Daimler Truck AG and Cummins makes engine production at the Mannheim location fit for the future and at the same time strengthens our competitiveness. With the changeover to Euro VII, we would have to invest considerable resources in the further development of our medium duty engines. We are now freeing up these funds to focus them on the technologies that are crucial to our long-term corporate success in the transformation of our industry.”

“We are pleased to announce this important strategic partnership with Daimler to provide the medium duty engine systems for Daimler Trucks and Buses in global markets,” said Tom Linebarger, Chairman and CEO, Cummins Inc. “Our partnership is a terrific opportunity for both companies to be more competitive, drive global innovation, expand offerings to customers and reduce emissions. We are looking forward to working with Daimler on this and exploring other potential opportunities to grow our respective companies. As the leading independent global power solutions provider, Cummins is committed to ensuring any customer anywhere has the right solution, by offering them a broad range of power solutions from advanced diesel, near-zero natural gas, fully electric, hydrogen and other technologies.”

Production of medium duty Cummins engines at the Daimler Mannheim plant

Cummins Inc. will establish an engine plant within the Mercedes-Benz Mannheim campus, efficiently utilizing existing resources to produce medium duty engines compliant with the Euro VII emissions standard for Mercedes-Benz and ensuring continued joint success in the medium duty vehicle segment. With this strategic partnership, Daimler Truck AG and Cummins will help maintain employment at the Mannheim plant. Cummins will use its existing footprint and strong production and supply chain networks in all other regions for use in other Daimler Trucks’ brands, including those of Daimler Trucks North America.

“By signing this memorandum of understanding, we are presenting a clear future perspective for the Mannheim site, which produces medium duty engines today and will continue to do so moving forward. This is good for Mannheim,” says Martin Daum. “This will of course bring some changes to the site. Together with the works council, we will shape the changes in the coming years and develop joint solutions, always keeping the interests of our customers, employees and the company in mind.”

Daimler Truck’s focus on alternative drive technologies and heavy-duty commercial vehicle engines

Daimler anticipates the partnership with Cummins will enable Daimler to increase and accelerate its development efforts on alternative and emerging technologies, including non-diesel engines. In the future, Daimler Truck AG will focus on the further progression of zero-emission drive technologies, as well as further development of commercial heavy-duty drivetrains. The production of the current medium duty engine generation (MDEG) by Daimler Truck AG will end with the start of production of the Cummins engines at Mannheim. In a next step, the partners will evaluate a broader global strategic cooperation through identifying potential synergies in areas such as powertrain components and engine system components.

The Daimler heavy-duty engine platform (HDEP) for the heavy-duty vehicle segment of Daimler Trucks and Buses will remain in the Daimler Truck AG portfolio. The HDEP engine family will continue to be manufactured by the global production network in Mannheim and Detroit, Michigan and fitted in heavy-duty trucks, in touring coaches as well as in third-party products worldwide.

About Cummins Inc.

Cummins Inc., a global power leader, is a corporation of complementary business segments that design, manufacture, distribute and service a broad portfolio of power solutions. The company’s products range from diesel, natural gas, electric and hybrid powertrains and powertrain-related components including filtration, aftertreatment, turbochargers, fuel systems, controls systems, air handling systems, automated transmissions, electric power generation systems, batteries, electrified power systems, hydrogen generation and fuel cell products. Headquartered in Columbus, Indiana (U.S.), since its founding in 1919, Cummins employs approximately 57,825 people committed to powering a more prosperous world through three global corporate responsibility priorities critical to healthy communities: education, environment and equality of opportunity. Cummins serves its customers online, through a network of company-owned and independent distributor locations, and through thousands of dealer locations worldwide and earned about $1.8 billion on sales of $19.8 billion in 2020. See how Cummins is powering a world that’s always on by accessing news releases and more information at https://www.cummins.com/always-on.

Forward-looking disclosure statement

Information provided in this release that is not purely historical are forward-looking statements within the meaning of the Private Securities Litigation Reform Act of 1995, including statements regarding our forecasts, guidance, preliminary results, expectations, hopes, beliefs and intentions on strategies regarding the future. These forward-looking statements include, without limitation, statements relating to our plans and expectations for our revenues and EBITDA. Our actual future results could differ materially from those projected in such forward-looking statements because of a number of factors, including, but not limited to: any adverse results of our internal review into our emissions certification process and compliance with emission standards; increased scrutiny from regulatory agencies, as well as unpredictability in the adoption, implementation and enforcement of emission standards around the world; policy changes in international trade; the U.K.'s exit from the European Union (EU); changes in taxation; global legal and ethical compliance costs and risks; increasingly stringent environmental laws and regulations; future bans or limitations on the use of diesel-powered products; supply shortages and supplier financial risk, particularly from any of our single-sourced suppliers, including suppliers that may be impacted by the COVID-19 pandemic; market slowdown due to the impacts from the COVID-19 pandemic, other public health crises, epidemics or pandemics; impacts to manufacturing and supply chain abilities from an extended shutdown or disruption of our operations due to the COVID-19 pandemic; supply shortages and supplier financial risk, particularly from any of our single-sourced suppliers, including suppliers that may be impacted by the COVID-19 pandemic; aligning our capacity and production with our demand, including impacts of COVID-19; large truck manufacturers and original equipment manufacturers (OEMs) customers discontinuing outsourcing their engine supply needs or experiencing financial distress, particularly related to the COVID-19 pandemic, bankruptcy or change in control; a slowdown in infrastructure development and/or depressed commodity prices; failure to realize expected results from our investment in Eaton Cummins Automated Transmission Technologies joint venture; the actions of, and income from, joint ventures and other investees that we do not directly control; product recalls; the development of new technologies that reduce demand for our current products and services; lower than expected acceptance of new or existing products or services; variability in material and commodity costs; product liability claims; our sales mix of products; protection and validity of our patent and other intellectual property rights; disruptions in global credit and financial markets as the result of the COVID-19 pandemic; labor relations or work stoppages; reliance on our executive leadership team and other key personnel; climate change and global warming; our plan to reposition our portfolio of product offerings through exploration of strategic acquisitions and divestitures and related uncertainties of entering such transactions; exposure to potential security breaches or other disruptions to our information technology systems and data security; political, economic and other risks from operations in numerous countries; competitor activity; increasing competition, including increased global competition among our customers in emerging markets; foreign currency exchange rate changes; the performance of our pension plan assets and volatility of discount rates, particularly those related to the sustained slowdown of the global economy due to the COVID-19 pandemic; the price and availability of energy; the outcome of pending and future litigation and governmental proceedings; continued availability of financing, financial instruments and financial resources in the amounts, at the times and on the terms required to support our future business; and other risks detailed from time to time in our SEC filings, including particularly in the Risk Factors section of our 2020 Annual Report on Form 10-K and Quarterly Reports on Form 10-Q. Shareholders, potential investors and other readers are urged to consider these factors carefully in evaluating the forward-looking statements and are cautioned not to place undue reliance on such forward-looking statements. The forward-looking statements made herein are made only as of the date of this press release and we undertake no obligation to publicly update any forward-looking statements, whether as a result of new information, future events or otherwise. More detailed information about factors that may affect our performance may be found in our filings with the SEC, which are available at http://www.sec.gov or at http://www.cummins.com in the Investor Relations section of our website.

About the Mercedes-Benz Mannheim plant

Mercedes-Benz and Mannheim are linked by a very special history. On January 29, 1886, this is where engineer Carl Benz invented the world’s first automobile with the patent number 37435 – the Benz Patent Motor Car. What is now the Mercedes-Benz Mannheim plant was founded first in Luzenberg, Mannheim-Waldhof in 1908. The site has over 5,000 employees working on the production of engines and associated components for all categories of commercial vehicles worldwide. The plant’s foundry is one of the world’s leading producers of cast-iron vehicle components. In addition, engines for commercial vehicles as well as passenger cars are remanufactured in the “European Center for Reconditioned Engine Production.” In the Competence Center for Zero-Emission Mobility (KEM), the company has also been accompanying the drive systems of the future for all vehicle categories from prototype to series production for over 25 years. Training and securing new talent are also equally important in Mannheim, where more than 11,000 young people have completed their apprenticeships in its over 100 years of operation.

Daimler Trucks & Buses

Daimler Trucks & Buses is one of the world’s largest commercial vehicle manufacturers, with more than 35 primary locations around the world and approximately 100,000 employees. The company brings together seven vehicle brands under one roof: Mercedes-Benz (light, medium and heavy trucks as well as city, intercity and touring coaches) and Setra (intercity, long-distance and premium coaches) are our traditional European brands; our U.S. brands Freightliner Trucks (trucks in weight classes 5 to 8 for a wide range of commercial vehicle applications), Western Star (heavy trucks for specialized and long-haul transports) and Thomas Built Buses (light to medium duty buses); and our Asian brands Bharat Benz, based in Chennai, India (trucks in the weight classes 10 to 55 t and medium and heavy-duty buses) and FUSO with its headquarters in Japan (trucks and buses for Asia, the Middle East, Africa, Europe and Latin America). This allows Daimler Trucks & Buses to offer its customers around the globe a broad spectrum of commercial vehicles, ranging from minibuses to heavy-duty trucks for special-purpose transport applications – in short: products and solutions for everyone who keeps the world moving. Gottlieb Daimler and Carl Benz laid the foundation for the modern transport industry more than 120 years ago. Over the past decades, Daimler’s truck and bus divisions have consistently set standards for the entire transportation industry – in terms of safety, fuel efficiency and driver and passenger comfort. It is now time for the next evolutionary step: emission-free, automated and connected driving. Daimler Trucks & Buses is working to bring these important technologies to high-volume series production, across brands, divisions and regions. In this way the company intends to take a major step closer to realising its vision of CO2-neutral transport and accident-free driving whilst also contributing to the sustainability of global goods and passenger transport. In 2020, a total of 378,500 trucks and buses were delivered. Revenue was €34.7 billion. EBIT amounted to €525 million. Further information from Daimler Trucks is available online: www.media.daimler.com and www.daimler-truck.com.


Contacts

Media Contacts:
Uta Leitner, +49 7 11 17-53058, This email address is being protected from spambots. You need JavaScript enabled to view it.
Florian Laudan, +49 7 11 17-41526, This email address is being protected from spambots. You need JavaScript enabled to view it.
Jon Mills, Cummins Inc. Director, External Communications, +1 317-658-4540, This email address is being protected from spambots. You need JavaScript enabled to view it.

  • Reported net income attributable to HEP of $51.3 million or $0.49 per unit
  • Announced quarterly distribution of $0.35 per unit
  • Reported EBITDA of $86.8 million and Adjusted EBITDA of $88.3 million

DALLAS--(BUSINESS WIRE)--Holly Energy Partners, L.P. (“HEP” or the “Partnership”) (NYSE:HEP) today reported financial results for the fourth quarter of 2020. Net income attributable to HEP for the fourth quarter was $51.3 million ($0.49 per basic and diluted limited partner unit) compared to $45.7 million ($0.43 per basic and diluted limited partner unit) for the fourth quarter of 2019.


Distributable cash flow was $70.0 million for the quarter, an increase of $5.5 million, or 8.5%, compared to the fourth quarter of 2019. HEP declared a quarterly cash distribution of $0.35 on January 22, 2021.

The increase in net income attributable to HEP was mainly due to lower interest expense and higher equity in earnings of equity method investments, partially offset by lower volumes on our crude and product pipeline systems.

Commenting on our 2020 fourth quarter results, Michael Jennings, Chief Executive Officer, stated, “HEP delivered another quarter of solid financial and operational results demonstrating the strength and resiliency of HEP's business model. Our assets continue to generate strong and steady cash flows, and we believe we are well positioned to progress our deleveraging efforts while continuing to fully fund our quarterly distributions and our anticipated capital expenditures.

Impact of COVID-19 on Our Business

Our business depends in large part on the demand for the various petroleum products we transport, terminal and store in the markets we serve. The impact of the COVID-19 pandemic on the global macroeconomy has created diminished demand, as well as a lack of forward visibility, for refined products and crude oil transportation, and for the terminalling and storage services that we provide. Over the course of the third and fourth quarters, demand for transportation fuels showed incremental improvement over the second quarter of 2020. We expect our customers will continue to adjust refinery production levels commensurate with market demand and ultimately expect demand to return to pre-COVID-19 levels. For additional details of the impact of COVID-19 on our business, please see our Form 10-K for the year ended December 31, 2020.

Fourth Quarter 2020 Revenue Highlights

Revenues for the quarter were $127.5 million, a decrease of $4.2 million compared to the fourth quarter of 2019. The decrease was mainly attributable to lower volumes on our product pipelines servicing Delek US Holdings, Inc. and our crude pipelines systems in New Mexico and Texas, partially offset by higher revenues on our refinery units. Compared to the fourth quarter of 2019, our overall pipeline volumes decreased for the quarter by 11%.

  • Revenues from our refined product pipelines were $28.6 million, a decrease of $2.2 million, on shipments averaging 155.8 thousand barrels per day ("mbpd") compared to 175.7 mbpd for the fourth quarter of 2019. The revenue and volume decreases were mainly due to lower volumes on our product pipelines servicing Delek US Holdings, Inc. partially offset by higher volumes on our product pipelines servicing HFC's Navajo refinery. Revenue also decreased due to a reclassification of certain pipeline income from revenue to interest income under sales-type lease accounting.
  • Revenues from our intermediate pipelines were $7.5 million, consistent with the fourth quarter of 2019. Shipments averaged 134.8 mbpd compared to 136.4 mbpd for the fourth quarter of 2019.
  • Revenues from our crude pipelines were $32.0 million, a decrease of $1.8 million, on shipments averaging 410.4 mbpd compared to 479.2 mbpd for the fourth quarter of 2019. The revenue decreased mainly due to lower volumes on our crude pipeline systems in New Mexico and Texas.
  • Revenues from terminal, tankage and loading rack fees were $38.9 million, a decrease of $2.5 million compared to the fourth quarter of 2019. Refined products and crude oil terminalled in the facilities averaged 440.7 mbpd compared to 456.7 mbpd for the fourth quarter of 2019. The revenue decrease was mainly due to lower butane blending margins and lower reimbursable project revenues.
  • Revenues from refinery processing units were $20.5 million, an increase of $2.3 million compared to the fourth quarter of 2019, and throughputs averaged 63.9 mbpd compared to 55.7 mbpd for the fourth quarter of 2019. The revenue increase was primarily due to higher revenues from our Woods Cross FCC unit, which was unavailable for a portion of the fourth quarter of 2019 due to maintenance. The volume increase was mainly due to higher volumes on our naphtha fractionation unit in El Dorado and the crude unit in Woods Cross.

Year Ended December 31, 2020 Revenue Highlights

Revenues for the year ended December 31, 2020, were $497.8 million, a decrease of $34.9 million compared to the year ended December 31, 2019. The decrease was mainly attributable to an 18% reduction in overall crude and product pipeline volumes predominantly in our Southwest and Northwest regions.

  • Revenues from our refined product pipelines were $116.9 million, a decrease of $15.4 million, on shipments averaging 161.5 mbpd compared to 195.5 mbpd for the year ended December 31, 2019. The volume and revenue decreases were mainly due to lower volumes on pipelines servicing HFC's Navajo refinery, Delek's Big Spring refinery and our UNEV pipeline largely as a result of demand destruction associated with the COVID-19 pandemic as well as the recording of certain pipeline tariffs as interest income as the related throughput contract renewals were determined to be sales-type leases.
  • Revenues from our intermediate pipelines were $30.0 million, an increase of $0.5 million compared to the year ended December 31, 2019. Shipments averaged 137.1 mbpd compared to 140.6 mbpd for the year ended December 31, 2019.
  • Revenues from our crude pipelines were $118.9 million, a decrease of $11.8 million compared to the year ended December 31, 2019. Shipments averaged 387.7 mbpd compared to 501.2 mbpd for the December 31, 2019. The decreases were mainly attributable to decreased volumes on our crude pipeline systems in the Permian Basin, Wyoming and Utah largely as a result of demand destruction associated with the COVID-19 pandemic.
  • Revenues from terminal, tankage and loading rack fees were $151.7 million, a decrease of $8.8 million compared to the year ended December 31, 2019. Refined products and crude oil terminalled in the facilities averaged 442.2 mbpd compared to 483.2 mbpd for the year ended December 31, 2019. The revenue and volume decreases were mainly as a result of demand destruction associated with the COVID-19 pandemic across many of our facilities.
  • Revenues from refinery processing units were $80.3 million, an increase of $0.6 million compared to the year ended December 31, 2019. Throughputs averaged 61.4 mbpd compared to 68.8 mbpd for the year ended December 31, 2019. The decrease in volumes was mainly due to reduced throughput for both our Woods Cross and El Dorado processing units largely as a result of demand destruction associated with the COVID-19 pandemic. Revenues remained relatively constant due to contractual minimum volume guarantees.

Operating Costs and Expenses Highlights

Operating costs and expenses were $64.8 million and $292.9 million for the three months and year ended December 31, 2020, respectively, representing a decrease of $1.6 million and an increase of $24.0 million from the three months and year ended December 31, 2019, respectively. The increase for the year ended December 31, 2020 was mainly due to the goodwill impairment charge related to our Cheyenne business unit, partially offset by lower rental expenses, property taxes and variable costs such as electricity and chemicals associated with lower volumes.

Interest expense was $13.8 million and $59.4 million for the three months and year ended December 31, 2020, respectively, representing decreases of $6.0 million and $17.4 million over the same periods of 2019. The decreases were mainly due to market interest rate decreases under our senior secured revolving credit facility and refinancing our $500 million aggregate principal amount of 6.0% senior notes due 2024 to $500 million aggregate principal amount of 5.0% senior notes due 2028.

We have scheduled a webcast conference call today at 4:00 PM Eastern Time to discuss financial results. This webcast may be accessed at:

https://event.on24.com/wcc/r/2947931/69912ABCD95D2FE2A18BF7810FD7788C

An audio archive of this webcast will be available using the above noted link through March 8, 2021.

About Holly Energy Partners, L.P.

Holly Energy Partners, L.P., headquartered in Dallas, Texas, provides petroleum product and crude oil transportation, terminalling, storage and throughput services to the petroleum industry, including HollyFrontier Corporation subsidiaries. The Partnership, through its subsidiaries and joint ventures, owns and/or operates petroleum product and crude pipelines, tankage and terminals in Texas, New Mexico, Washington, Idaho, Oklahoma, Utah, Nevada, Wyoming and Kansas, as well as refinery processing units in Utah and Kansas.

HollyFrontier Corporation, headquartered in Dallas, Texas, is an independent petroleum refiner and marketer that produces high value light products such as gasoline, diesel fuel, jet fuel and other specialty products. HollyFrontier owns and operates refineries located in Kansas, Oklahoma, New Mexico, Wyoming and Utah and markets its refined products principally in the Southwest U.S., the Rocky Mountains extending into the Pacific Northwest and in other neighboring Plains states. In addition, HollyFrontier produces base oils and other specialized lubricants in the U.S., Canada and the Netherlands, and exports products to more than 80 countries. HollyFrontier also owns a 57% limited partner interest and a non-economic general partner interest in Holly Energy Partners, L.P.

The statements in this press release relating to matters that are not historical facts are “forward-looking statements” within the meaning of the federal securities laws. Forward-looking statements use words such as “anticipate,” “project,” “expect,” “plan,” “goal,” “forecast,” “intend,” “should,” “would,” “could,” “believe,” “may,” and similar expressions and statements regarding our plans and objectives for future operations are intended to identify forward-looking statements. These statements are based on our beliefs and assumptions and those of our general partner using currently available information and expectations as of the date hereof, are not guarantees of future performance and involve certain risks and uncertainties. Although we and our general partner believe that such expectations reflected in such forward-looking statements are reasonable, neither we nor our general partner can give any assurances that our expectations will prove to be correct. Therefore, actual outcomes and results could materially differ from what is expressed, implied or forecast in these statements. Any differences could be caused by a number of factors including, but not limited to:

  • the extraordinary market environment and effects of the COVID-19 pandemic, including a significant decline in demand for refined petroleum products in markets we serve;
  • risks and uncertainties with respect to the actual quantities of petroleum products and crude oil shipped on our pipelines and/or terminalled, stored and throughput in our terminals and refinery processing units;
  • the economic viability of HollyFrontier Corporation, our other customers and our joint ventures’ other customers, including any refusal or inability of our or our joint ventures’ customers or counterparties to perform their obligations under their contracts;
  • the demand for refined petroleum products in markets we serve;
  • our ability to purchase and integrate future acquired operations;
  • our ability to complete previously announced or contemplated acquisitions;
  • the availability and cost of additional debt and equity financing;
  • the possibility of temporary or permanent reductions in production or shutdowns at refineries utilizing our pipelines, terminal facilities and refinery processing units, due to reasons such as infection in the workforce, in response to reductions in demand or lower gross margins due to the economic impact of the COVID-19 pandemic, and any potential asset impairments resulting from such actions;
  • the effects of current and future government regulations and policies, including the effects of current and future restrictions on various commercial and economic activities in response to the COVID-19 pandemic;
  • our operational efficiency in carrying out routine operations and capital construction projects;
  • the possibility of terrorist or cyberattacks and the consequences of any such attacks;
  • general economic conditions, including uncertainty regarding the timing, pace and extent of an economic recovery in the United States;
  • the impact of recent or proposed changes in tax laws and regulations that affect master limited partnerships; and
  • other financial, operational and legal risks and uncertainties detailed from time to time in our Securities and Exchange Commission filings.

The forward-looking statements speak only as of the date made and, other than as required by law, we undertake no obligation to publicly update or revise any forward-looking statements, whether as a result of new information, future events or otherwise.

RESULTS OF OPERATIONS (Unaudited)

Income, Distributable Cash Flow and Volumes
The following tables present income, distributable cash flow and volume information for the three months and the years ended December 31, 2020 and 2019.


Three Months Ended December 31,


Change from


2020


2019


2019


(In thousands, except per unit data)

Revenues


Pipelines:


Affiliates – refined product pipelines

$

18,568


$

16,550


$

2,018


Affiliates – intermediate pipelines

7,537


7,490


47


Affiliates – crude pipelines

20,103


21,969


(1,866

)


46,208


46,009


199


Third parties – refined product pipelines

10,011


14,262


(4,251

)


Third parties – crude pipelines

11,898


11,834


64


68,117


72,105


(3,988

)


Terminals, tanks and loading racks:


Affiliates

35,156


35,802


(646

)


Third parties

3,721


5,543


(1,822

)


38,877


41,345


(2,468

)


Affiliates - refinery processing units

20,462


18,184


2,278


Total revenues

127,456


131,634


(4,178

)


Operating costs and expenses


Operations

37,971


38,952


(981

)


Depreciation and amortization

24,376


24,513


(137

)


General and administrative

2,419


2,929


(510

)


64,766


66,394


(1,628

)


Operating income

62,690


65,240


(2,550

)


Equity in earnings of equity method investments

1,462


(37

)


1,499


Interest expense, including amortization

(13,775

)


(19,764

)


5,989


Interest income

2,787


2,195


592


Gain on sale of assets and other

251


329


(78

)


(9,275

)


(17,277

)


8,002


Income before income taxes

53,415


47,963


5,452


State income tax expense

(58

)


(4

)


(54

)


Net income

53,357


47,959


5,398


Allocation of net income attributable to noncontrolling interests

(2,018

)


(2,292

)


274


Net income attributable to Holly Energy Partners

$

51,339


$

45,667


$

5,672


Limited partners’ earnings per unit – basic and diluted

$

0.49


$

0.43


$

0.06


Weighted average limited partners’ units outstanding

105,440


105,440


EBITDA(1)

$

86,761


$

87,753


$

(992

)


Adjusted EBITDA(1)

$

88,269


$

86,916


$

1,353


Distributable cash flow(2)

$

69,999


$

64,508


$

5,491


Volumes (bpd)


Pipelines:


Affiliates – refined product pipelines

113,400


104,875


8,525


Affiliates – intermediate pipelines

134,780


136,416


(1,636)


Affiliates – crude pipelines

279,695


345,497


(65,802)


527,875


586,788


(58,913)


Third parties – refined product pipelines

42,414


70,871


(28,457)


Third parties – crude pipelines

130,752


133,713


(2,961)


701,041


791,372


(90,331)


Terminals and loading racks:


Affiliates

394,289


399,739


(5,450)


Third parties

46,393


56,952


(10,559)


440,682


456,691


(16,009)


Affiliates – refinery processing units

63,927


55,728


8,199


Total for pipelines, terminals and refinery processing unit assets (bpd)

1,205,650


1,303,791


(98,141)


Years Ended December 31,


Change from


2020


2019


2019


(In thousands, except per unit data)

Revenues


Pipelines:


Affiliates – refined product pipelines

$

73,571


$

77,443


$

(3,872

)


Affiliates – intermediate pipelines

30,023


29,558


465


Affiliates – crude pipelines

80,026


85,415


(5,389

)


183,620


192,416


(8,796

)


Third parties – refined product pipelines

43,371


54,914


(11,543

)


Third parties – crude pipelines

38,843


45,301


(6,458

)


265,834


292,631


(26,797

)


Terminals, tanks and loading racks:


Affiliates

135,867


139,655


(3,788

)


Third parties

15,825


20,812


(4,987

)


151,692


160,467


(8,775

)


Affiliates - refinery processing units

80,322


79,679


643


Total revenues

497,848


532,777


(34,929

)


Operating costs and expenses


Operations

147,692


161,996


(14,304

)


Depreciation and amortization

99,578


96,705


2,873


General and administrative

9,989


10,251


(262

)


Goodwill impairment

35,653


35,653


292,912


268,952


23,960


Operating income

204,936


263,825


(58,889

)


Equity in earnings of equity method investments

6,647


5,180


1,467


Interest expense, including amortization

(59,424

)


(76,823

)


17,399


Interest income

10,621


5,517


5,104


Loss on early extinguishment of debt

(25,915

)


(25,915

)


Gain on sales-type leases

33,834


35,166


(1,332

)


Gain on sale of assets and other

8,691


272


8,419


(25,546

)


(30,688

)


5,142


Income before income taxes

179,390


233,137


(53,747

)


State income tax expense

(167

)


(41

)


(126

)


Net income

179,223


233,096


(53,873

)


Allocation of net income attributable to noncontrolling interests

(8,740

)


(8,212

)


(528

)


Net income attributable to Holly Energy Partners

$

170,483


$

224,884


$

(54,401

)


Limited partners’ earnings per unit—basic and diluted

$

1.61


$

2.13


$

(0.52

)


Weighted average limited partners’ units outstanding

105,440


105,440


EBITDA(1)

$

319,031


$

392,936


$

(73,905

)


Adjusted EBITDA(1)

$

345,978


$

359,308


$

(13,330

)


Distributable cash flow(2)

$

283,057


$

271,431


$

11,626


Volumes (bpd)


Pipelines:


Affiliates – refined product pipelines

115,827


123,986


(8,159

)


Affiliates – intermediate pipelines

137,053


140,585


(3,532

)


Affiliates – crude pipelines

277,025


368,699


(91,674

)


529,905


633,270


(103,365

)


Third parties – refined product pipelines

45,685


71,545


(25,860

)


Third parties – crude pipelines

110,691


132,507


(21,816

)


686,281


837,322


(151,041

)


Terminals and loading racks:


Affiliates

393,300


422,119


(28,819

)


Third parties

48,909


61,054


(12,145

)


442,209


483,173


(40,964

)


Affiliates – refinery processing units

61,416


68,780


(7,364

)


Total for pipelines, terminals and refinery processing unit assets (bpd)

1,189,906


1,389,275


(199,369

)


(1)

Earnings before interest, taxes, depreciation and amortization (“EBITDA”) is calculated as net income attributable to Holly Energy Partners plus (i) interest expense, net of interest income, (ii) state income tax and (iii) depreciation and amortization. Adjusted EBITDA is calculated as EBITDA plus (i) loss on early extinguishment of debt, (ii) goodwill impairment and (iii) pipeline tariffs not included in revenues due to impacts from lease accounting for certain pipeline tariffs minus (iv) gain on sales-type leases, (v) HEP's pro-rata share of gain on business insurance settlement and (vi) pipeline lease payments not included in operating costs and expenses. Portions of our minimum guaranteed pipeline tariffs for assets subject to sales-type lease accounting are recorded as interest income with the remaining amounts recorded as a reduction in net investment in leases. These pipeline tariffs were previously recorded as revenues prior to the renewal of the throughput agreement, which triggered sales-type lease accounting. Similarly, certain pipeline lease payments were previously recorded as operating costs and expenses, but the underlying lease was reclassified from an operating lease to a financing lease, and these payments are now recorded as interest expense and reductions in the lease liability. EBITDA and Adjusted EBITDA are not calculations based upon generally accepted accounting principles ("GAAP"). However, the amounts included in the EBITDA and Adjusted EBITDA calculations are derived from amounts included in our consolidated financial statements. EBITDA and Adjusted EBITDA should not be considered as alternatives to net income attributable to Holly Energy Partners or operating income, as indications of our operating performance or as alternatives to operating cash flow as a measure of liquidity. EBITDA and Adjusted EBITDA are not necessarily comparable to similarly titled measures of other companies. EBITDA and Adjusted EBITDA are presented here because they are widely used financial indicators used by investors and analysts to measure performance. EBITDA and Adjusted EBITDA are also used by our management for internal analysis and as a basis for compliance with financial covenants.

Set forth below is our calculation of EBITDA and Adjusted EBITDA.


Three Months Ended
December 31,


Years Ended
December 31,


2020


2019


2020


2019


(In thousands)

Net income attributable to Holly Energy Partners


$

51,339


$

45,667


$

170,483


$

224,884


Add (subtract):


Interest expense


13,775


19,764


59,424


76,823


Interest income


(2,787

)


(2,195

)


(10,621

)


(5,517

)


State income tax expense


58


4


167


41


Depreciation and amortization


24,376


24,513


99,578


96,705


EBITDA


$

86,761


$

87,753


$

319,031


$

392,936


Loss on early extinguishment of debt


25,915


Gain on sales-type leases


(33,834

)


(35,166

)


Goodwill impairment


35,653


HEP's pro-rata share of gain on business interruption insurance settlement


(6,079

)


Pipeline tariffs not included in revenues


3,114


2,375


11,717


4,750


Lease payments not included in operating costs


(1,606

)


(3,212

)


(6,425

)


(3,212

)


Adjusted EBITDA


$

88,269


$

86,916


$

345,978


$

359,308


(2)


Distributable cash flow is not a calculation based upon GAAP. However, the amounts included in the calculation are derived from amounts presented in our consolidated financial statements, with the general exception of maintenance capital expenditures. Distributable cash flow should not be considered in isolation or as an alternative to net income attributable to Holly Energy Partners or operating income, as an indication of our operating performance, or as an alternative to operating cash flow as a measure of liquidity. Distributable cash flow is not necessarily comparable to similarly titled measures of other companies. Distributable cash flow is presented here because it is a widely accepted financial indicator used by investors to compare partnership performance. It is also used by management for internal analysis and our performance units. We believe that this measure provides investors an enhanced perspective of the operating performance of our assets and the cash our business is generating.


Contacts

John Harrison, Senior Vice President,
Chief Financial Officer and Treasurer
Craig Biery, Vice President, Investor Relations
Holly Energy Partners, L.P.
214/954-6511


Read full story here

OI record in Brent Futures of 2.76 million

Sterling Futures and Options OI record of 19.9 million

LONDON & NEW YORK--(BUSINESS WIRE)--Intercontinental Exchange, Inc. (NYSE:ICE), a leading operator of global exchanges and clearing houses and provider of mortgage technology, data and listings services, announced record Total Futures Open Interest on February 19, 2021.


ICE’s Brent futures contract, which serves as the global benchmark for crude oil, reached an all-time Open Interest record of approximately 2.76 million contracts on February 19, exceeding the previous record set in April 2020. Approximately 80% of the world’s traded crude is priced relative to Brent.

ICE’s Three Month Short Sterling contract, which is the benchmark for managing UK interest rate risk, set a record for total Open Interest of more than 19.9 million contracts across Futures and Options on February 19.

“These records reflect the extraordinary depth of liquidity that our global futures network offers,” said Ben Jackson, President of Intercontinental Exchange. “From global interest rates, to energy markets, to environmental markets, our solutions and technology connects customers every day to an extensive range of efficient and transparent risk management tools.”

About Intercontinental Exchange

Intercontinental Exchange (NYSE: ICE) is a Fortune 500 company and provider of marketplace infrastructure, data services and technology solutions to a broad range of customers including financial institutions, corporations and government entities. We operate regulated marketplaces, including the New York Stock Exchange, for the listing, trading and clearing of a broad array of derivatives contracts and financial securities across major asset classes. Our comprehensive data services offering supports the trading, investment, risk management and connectivity needs of customers around the world and across asset classes. As a leading technology provider for the U.S. residential mortgage industry, ICE Mortgage Technology provides the technology and infrastructure to transform and digitize U.S. residential mortgages, from application and loan origination through to final settlement.

Trademarks of ICE and/or its affiliates include Intercontinental Exchange, ICE, ICE block design, NYSE and New York Stock Exchange. Information regarding additional trademarks and intellectual property rights of Intercontinental Exchange, Inc. and/or its affiliates is located here. Key Information Documents for certain products covered by the EU Packaged Retail and Insurance-based Investment Products Regulation can be accessed on the relevant exchange website under the heading “Key Information Documents (KIDS).”

Safe Harbor Statement under the Private Securities Litigation Reform Act of 1995 -- Statements in this press release regarding ICE's business that are not historical facts are "forward-looking statements" that involve risks and uncertainties. For a discussion of additional risks and uncertainties, which could cause actual results to differ from those contained in the forward-looking statements, see ICE's Securities and Exchange Commission (SEC) filings, including, but not limited to, the risk factors in ICE's Annual Report on Form 10-K for the year ended December 31, 2020, as filed with the SEC on February 4, 2021.

ICE- CORP
Source: Intercontinental Exchange


Contacts

ICE Media Contact:
Rebecca Mitchell
This email address is being protected from spambots. You need JavaScript enabled to view it.
+44 7951 057 351

ICE Investor Contact:
Warren Gardiner
This email address is being protected from spambots. You need JavaScript enabled to view it.
770-835-0114

CANONSBURG, Pa.--(BUSINESS WIRE)--#ETRN--Equitrans Midstream Corporation (NYSE: ETRN), today, announced financial and operational results for the full-year and fourth quarter 2020. Included in the "Non-GAAP Disclosures" section of this news release are important disclosures regarding the use of non-GAAP supplemental financial measures, including information regarding their most comparable GAAP financial measure.


2020 Highlights:

  • Generated $638 million of net income and achieved $1,215 million of adjusted EBITDA
  • Recorded 66% of total operating revenue from firm reservation fees
  • Increased total gathered volumes by approximately 5% year-over-year
  • Reduced gathering operating and maintenance expense per gathered volume by 14% year-over-year

“The past year was transformational on many fronts,” said Thomas F. Karam, ETRN chairman and chief executive officer. “During 2020, our employees remained resilient – navigating the unprecedented times related to the pandemic and strengthening our company by delivering on our ability to generate predictable and stable revenue in any operating environment. We simplified our corporate structure, emerging as a single C-Corp entity; executed a gathering agreement that allows us to optimize our assets and realize meaningful capital savings; and acted with fiscal discipline by controlling costs and deploying capital efficiently in order to strengthen our balance sheet.”

“Looking ahead, we acknowledge the reality of climate change as one of the most critical issues of our time and we continue to embrace the importance of sustainability for future generations,” said Diana M. Charletta, ETRN president and chief operating officer. “Similar to our proactive safety culture, Equitrans’ ESG initiatives are becoming part of our DNA – from biodiversity considerations and the sourcing of our materials, to stakeholder engagement and transparent corporate governance.”

Charletta continued, “In January, we published our initial Climate Policy, which underscores a comprehensive commitment to environmental excellence in every aspect of our operations. As our society transitions to a lower-carbon economy, we will continue to take steps to reduce greenhouse gas emissions and build resiliency in our business to effectively manage the risks and opportunities. Every day must be a step in the right direction and as the journey continues, we will work to achieve our near-term actions, as well as our Net Zero Carbon Goals by 2050.”

2020 YEAR-END AND FOURTH QUARTER SUMMARY RESULTS


Three Months
Ended December 31,


Twelve Months
Ended December 31,

$ millions (except per share metrics)

2020


2020

Net income attributable to ETRN common shareholders

$

117.8


$

364.4


Adjusted net income attributable to ETRN common shareholders

$

133.5


$

443.3


Earnings per diluted share attributable to ETRN common shareholders

$

0.27


$

1.06


Adjusted earnings per diluted share attributable to ETRN common shareholders

$

0.31


$

1.29


Net income

$

136.6


$

638.0


Adjusted EBITDA

$

286.4


$

1,214.6


Deferred revenue

$

76.9


$

225.7


Net cash provided by operating activities

$

316.7


$

1,140.9


Free cash flow

$

86.6


$

317.4


Retained free cash flow

$

21.8


$

(89.8

)

Net income attributable to ETRN common shareholders was impacted by a $21.3 million unrealized loss on derivative instruments for the fourth quarter 2020 and a $16.5 million unrealized gain on derivative instruments for the full-year 2020. The unrealized gain/loss is reported within other income and relates to the contractual agreement with EQT Corporation (EQT) in which ETRN will receive cash from EQT conditioned on the quarterly average of certain Henry Hub natural gas prices exceeding certain thresholds during the three years following the Mountain Valley Pipeline's (MVP) in-service, but in no case extending beyond December 2024. The contract is accounted for as a derivative with the fair value marked-to-market at each quarter-end.

For the full-year 2020, net income attributable to ETRN common shareholders was impacted by several non-recurring items including a $55.6 million impairment of long-lived assets associated with the Hornet gathering system, a $24.9 million loss on early extinguishment of debt associated with the retirement of the ETRN Term Loan B and termination of ETRN's revolving credit facility, $23.8 million of transaction costs primarily related to the acquisition of the outstanding common units of EQM Midstream Partners, LP (EQM), and a $27.3 million premium associated with the redemption of a portion of EQM’s Series A Perpetual Convertible Preferred Units.

As a result of the gathering agreement with EQT entered into in February 2020, revenue from the contracted minimum volume commitment (MVC) is recognized utilizing an average rate applied over the 15-year contract life. The difference between the cash received from the contracted MVC and the revenue recognized results in the deferral of revenue into future periods. For the fourth quarter 2020, deferred revenue was $76.9 million and for the full-year 2020, deferred revenue was $225.7 million.

Operating revenue for the fourth quarter was lower compared to the same quarter last year by $58.7 million, primarily from the impact of deferred revenue. The reduction in operating revenue was partially offset by increased revenue from higher MVCs. Operating expenses decreased by $577.2 million compared to the fourth quarter 2019, primarily as a result of a $583.7 million impairment of goodwill in the fourth quarter 2019. Additionally, operating and maintenance expense decreased versus the prior year quarter while selling, general and administrative and depreciation expense increased.

QUARTERLY DIVIDEND

For the fourth quarter 2020, ETRN paid a quarterly cash dividend of $0.15 per common share on February 12, 2021 to common shareholders of record at the close of business on February 3, 2021.

TOTAL CAPITAL EXPENDITURES AND CAPITAL CONTRIBUTIONS


Three Months
Ended December 31,


Twelve Months
Ended December 31,

$ millions


2020


2020

MVP


$126


$268

Gathering(1)


$37


$303

Transmission(2)


$14


$50

Water


$4


$12

Headquarters


$1


$4

Total


$182


$637

(1)

Excludes $4.5 million and $41.6 million of capital expenditures related to noncontrolling interests in Eureka Midstream Holdings, LLC (Eureka) for the three and twelve months ended December 31, 2020, respectively.

(2)

Includes capital contributions to Mountain Valley Pipeline, LLC (MVP JV) for the MVP Southgate project.

FINANCIAL OUTLOOK

$ millions

Q1 2021

Net income

$45 - $65

Adjusted EBITDA

$280 - $300

Deferred revenue

$72

$ millions

Full-Year 2021

Net income

$335 - $405

Adjusted EBITDA

$1,035 - $1,105

Deferred revenue

$295

Free cash flow

$(180) - $(110)

Retained free cash flow

$(440) - $(370)

CAPITAL EXPENDITURES AND CAPITAL CONTRIBUTIONS OUTLOOK

$ millions


Full-Year 2021

MVP


$670 - $720

Gathering(1)


$305 - $335

Transmission(2)


$45 - $65

Water


$20

Total


$1,040 - $1,140

(1)

Includes approximately $30 million from ETRN’s 60% interest in Eureka.

(2)

Includes capital contributions of approximately $20 million to MVP JV for the MVP Southgate project.

BUSINESS AND PROJECT UPDATES

Outstanding Debt and Liquidity

As of December 31, 2020, ETRN reported $6.4 billion of consolidated long-term debt; $485 million of borrowings and $246 million of letters of credit outstanding under the $3 billion revolving credit facility; and $208 million of cash.

Bond Offering

In January 2021, ETRN's wholly owned subsidiary, EQM, completed its issuance of $800 million of 4.50% senior notes due 2029 and $1,100 million of 4.75% senior notes due 2031. Proceeds from the offering were used to repay $1.4 billion of term loan borrowings and to complete a tender of $500 million of aggregate principal of EQM's 4.75% senior notes due 2023.

Mountain Valley Pipeline

On January 15, 2021, the U.S. Bureau of Land Management granted a right-of-way permit related to MVP’s crossing in the Jefferson National Forest. At present, the only major regulatory authorization outstanding is the approval to cross streams and wetlands. With total project work roughly 92% complete, the MVP JV has applied for a U.S. Army Corps of Engineers’ Individual Permit for certain waterbody crossings that will utilize the open-cut method and, through a Certificate Amendment application to the Federal Energy Regulatory Commission, is seeking authorization to use trenchless construction methods for the remainder of the crossings that were previously approved as open-cut.

The MVP JV continues to target a full in-service date in late 2021. The total project cost estimate is $5.8 - $6.0 billion, of which ETRN expects to fund approximately $2.9 billion based on the midpoint. As of December 31, 2020, ETRN had funded approximately $2.2 billion. ETRN will operate the pipeline and, based on the midpoint of the total project cost estimate, expects to have an approximate 47.6% ownership interest in MVP.

Climate Policy

In January 2021, ETRN published its initial Climate Policy, extending the Company’s commitment to environmental excellence and establishing a multi-faceted approach for evaluating and mitigating ETRN’s carbon footprint. ETRN is responding to the critical issues related to climate change by taking near-term actions to reduce its overall greenhouse gas (GHG) emissions. In 2021, ETRN will establish a foundation for future commitments and will work to assess practicability, costs, and timing to achieve interim targets of a 50% reduction in methane by 2030 and a 50% reduction in total GHG by 2040, with a net zero carbon goal for 2050. The climate policy is available under the Sustainability section of the Company's website at www.equitransmidstream.com.

Full-Year and Fourth Quarter 2020 Earnings Conference Call Information

ETRN will host a conference call with security analysts today, February 23, 2021, at 10:30 a.m. (ET) to discuss full-year and fourth quarter 2020 financial results, operating results, and other business matters.

Call Access: All participants must pre-register online, in advance of the call. Upon completion, registered participants will receive a confirmation email that includes instructions for accessing the call, as well as a unique registration ID and passcode. Please pre-register using the appropriate online registration links below:

Security Analysts :: Audio Registration
Your email confirmation will contain dial-in information, along with your unique ID and passcode.

All Other Participants :: Webcast Registration
Your email confirmation will contain the webcast link, along with your unique ID and passcode.

Call Replay: For 14 days following the call, an audio replay will be available at (800) 585-8367 or (416) 621-4642. The ETRN conference ID: 4233629.

ETRN management speak to investors from time-to-time and the presentation for these discussions, which is updated periodically, is available via www.equitransmidstream.com.

NON-GAAP DISCLOSURES

Adjusted Net Income Attributable to ETRN Common Shareholders and Adjusted Earnings per Diluted Share Attributable to ETRN Common Shareholders

Adjusted net income attributable to ETRN common shareholders and adjusted earnings per diluted share attributable to ETRN common shareholders are non-GAAP supplemental financial measures that management and external users of ETRN’s consolidated financial statements, such as investors, may use to make period-to-period comparisons of earnings trends. Management believes that adjusted net income attributable to ETRN common shareholders and adjusted earnings per diluted share attributable to ETRN common shareholders as presented provide useful information for investors for evaluating period-over-period earnings. Adjusted net income attributable to ETRN common shareholders and adjusted earnings per diluted share attributable to ETRN common shareholders should not be considered as alternatives to net income attributable to ETRN common shareholders, earnings per diluted share attributable to ETRN common shareholders or any other measure of financial performance presented in accordance with GAAP. Adjusted net income attributable to ETRN common shareholders and adjusted earnings per diluted share attributable to ETRN common shareholders as presented have important limitations as analytical tools because they exclude some, but not all, items that affect net income attributable to ETRN common shareholders and earnings per diluted share attributable to ETRN common shareholders, including, as applicable, the premium on redemption of a portion of EQM’s Series A Perpetual Convertible Preferred Units (EQM Series A Preferred Units), transaction costs, impairments of long-lived assets, unrealized loss (gain) on derivative instruments and loss on early extinguishment of debt, which items affect the comparability of results period to period. The impact of noncontrolling interests is also excluded from the calculations of adjustment items to adjusted net income attributable to ETRN common shareholders, as is the tax impact of non-GAAP items. Additionally, because these non-GAAP metrics may be defined differently by other companies in ETRN's industry, ETRN's definitions of adjusted net income attributable to ETRN common shareholders and adjusted earnings per diluted share attributable to ETRN common shareholders may not be comparable to similarly titled measures of other companies, thereby diminishing the utility of the measures. Adjusted net income attributable to ETRN common shareholders and adjusted earnings per diluted share attributable to ETRN common shareholders should not be viewed as indicative of the actual amount of net income attributable to ETRN common shareholders or actual earnings of ETRN in any given period.

The table below reconciles adjusted net income attributable to ETRN common shareholders and adjusted earnings per diluted share attributable to ETRN common shareholders with net income attributable to ETRN common shareholders and earnings per diluted share attributable to ETRN common shareholders as derived from the statements of consolidated comprehensive income to be included in ETRN’s Annual Report on Form 10-K for the year ended December 31, 2020.

Reconciliation of Adjusted Net Income Attributable to ETRN Common Shareholders and Adjusted Earnings per Diluted Share Attributable to ETRN Common Shareholders


Three Months
Ended December 31,


Twelve Months
Ended December 31,

(Thousands, except per share information)

2020


2020

Net income attributable to ETRN common shareholders

$

117,812


$

364,372


Add back / (deduct):


Premium on redemption of EQM Series A Preferred Units


27,253


Transaction costs


23,797


Impairments of long-lived assets


55,581


Unrealized loss (gain) on derivative instruments

21,269


(16,460

)

Loss on early extinguishment of debt


24,864


Noncontrolling interest impact of non-GAAP items


(17,708

)

Tax impact of non-GAAP items(1)

(5,577

)


(18,373

)

Adjusted net income attributable to ETRN common shareholders

$

133,504


$

443,326


Diluted weighted average common shares outstanding

432,872


343,975


Adjusted earnings per diluted share attributable to ETRN common shareholders

$

0.31


$

1.29


(1)

The adjustments were tax effected at the Company’s federal and state statutory tax rate for each period.

Adjusted EBITDA

As used in this news release, Adjusted EBITDA means, as applicable, net income, plus income tax expense, net interest expense, loss on early extinguishment of debt (as applicable), depreciation, amortization of intangible assets, impairments of long-lived assets, payments on the preferred interest in EQT Energy Supply, LLC (Preferred Interest), non-cash long-term compensation expense (income), and transaction costs, less equity income, AFUDC-equity, unrealized loss (gain) on derivative instruments and adjusted EBITDA attributable to noncontrolling interest.

The table below reconciles adjusted EBITDA with net income as derived from the statements of consolidated comprehensive income to be included in ETRN's Annual Report on Form 10-K for the year ended December 31, 2020.

Reconciliation of Adjusted EBITDA


Three Months
Ended December 31,


Twelve Months
Ended December 31,

(Thousands)

2020


2020

Net income

$

136,587


$

638,044


Add:


Income tax expense

23,485


105,331


Net interest expense

87,420


307,380


Loss on early extinguishment of debt


24,864


Depreciation

68,342


259,613


Amortization of intangible assets

16,205


63,195


Impairments of long-lived assets


55,581


Preferred Interest payments

2,766


11,057


Non-cash long-term compensation expense

2,913


12,301


Transaction costs


23,797


Less:


Equity income

(62,600

)


(233,833

)

AFUDC – equity

(144

)


(818

)

Unrealized loss (gain) on derivative instruments

21,269


(16,460

)

Adjusted EBITDA attributable to noncontrolling interest(1)

(9,854

)


(35,424

)

Adjusted EBITDA

$

286,389


$

1,214,628


(1)

Reflects adjusted EBITDA attributable to noncontrolling interest associated with the third-party ownership interest in Eureka. Adjusted EBITDA attributable to noncontrolling interest for the three months ended December 31, 2020 was calculated as net income of $4.1 million, plus depreciation of $3.0 million, plus amortization of intangible assets of $2.1 million and plus interest expense of $0.7 million. Adjusted EBITDA attributable to noncontrolling interest for the twelve months ended December 31, 2020 was calculated as net income of $14.0 million, plus depreciation of $11.0 million, plus amortization of intangible assets of $7.5 million and plus interest expense of $2.9 million.

Free Cash Flow

As used in this news release, free cash flow means net cash provided by operating activities plus principal payments received on the Preferred Interest, and less net cash provided by operating activities attributable to noncontrolling interest, capital expenditures (excluding the noncontrolling interest share (40%) of Eureka capital expenditures), capital contributions to MVP JV, and distributions/dividends and redemption amounts paid to Series A Preferred unitholders/shareholders (as applicable).

Retained Free Cash Flow

As used in this news release, retained free cash flow means free cash flow less dividends paid to common shareholders and distributions paid to noncontrolling interest EQM common unitholders (as applicable).

The table below reconciles free cash flow and retained free cash flow with net cash provided by operating activities as derived from the statements of consolidated cash flows to be included in ETRN's Annual Report on Form 10-K for the year ended December 31, 2020.

Reconciliation of Free Cash Flow and Retained Free Cash Flow


Three Months
Ended December 31,


Twelve Months
Ended December 31,

(Thousands)

2020


2020

Net cash provided by operating activities

$

316,691


$

1,140,886


Add back / (deduct):


Principal payments received on the Preferred Interest

1,277


5,003


Net cash provided by operating activities attributable to noncontrolling interest(1)

(9,934

)


(39,568

)

ETRN Series A Preferred Shares dividends(2)

(14,628

)


(16,879

)

EQM Series A Preferred Unit distributions(3)


(51,002

)

Redemption of Series A Preferred Units(4)


(28,267

)

Capital expenditures(5)(6)

(78,243

)


(419,995

)

Capital contributions to MVP JV

(128,537

)


(272,801

)

Free cash flow

$

86,626


$

317,377


Less:


Dividends paid to common shareholders (7)

(64,871

)


(278,395

)

Distributions paid to noncontrolling interest EQM common unitholders


(128,770

)

Retained free cash flow

$

21,755


$

(89,788

)

(1)

Reflects 40% of $24.8 million and $98.9 million, which was Eureka’s standalone net cash provided by operating activities for the three and twelve months ended December 31, 2020, respectively, which represents the noncontrolling interest portion for the three and twelve months ended December 31, 2020, respectively.

(2)

Reflects cash dividends paid of $0.4873 and $0.5623 per ETRN Series A Perpetual Convertible Preferred Share for the three and twelve months ended December 31, 2020, respectively.

(3)

Reflects cash distributions paid of $2.0728 per EQM Series A Preferred Unit.

(4)

Redemption of EQM Series A Preferred Units included approximately $22 million for partial period distributions for the period 4/1/2020 through 6/17/2020 for the EQM Series A Preferred Units and an approximately $6 million change of control premium (101% of ~$600 MM of such units).

(5)

Does not reflect amounts related to the noncontrolling interest share of Eureka.

(6)

ETRN accrues capital expenditures when the work has been completed but the associated bills have not yet been paid. Accrued capital expenditures are excluded from the statements of consolidated cash flows until they are paid.

(7)

Third quarter 2020 dividend of $0.15 per ETRN common share was paid during the fourth quarter 2020.

Adjusted EBITDA, free cash flow and retained free cash flow are non-GAAP supplemental financial measures that management and external users of ETRN's consolidated financial statements, such as industry analysts, investors, lenders, and rating agencies, may use to assess:

  • ETRN’s operating performance as compared to other publicly traded companies in the midstream energy industry without regard to historical cost basis or, in the case of adjusted EBITDA, financing methods
  • The ability of ETRN’s assets to generate sufficient cash flow to pay dividends to ETRN’s shareholders
  • ETRN’s ability to incur and service debt and fund capital expenditures and capital contributions
  • The viability of acquisitions and other capital expenditure projects and the returns on investment of various investment opportunities

ETRN believes that adjusted EBITDA, free cash flow, and retained free cash flow provide useful information to investors in assessing ETRN's financial condition and results of operations. Adjusted EBITDA, free cash flow, and retained free cash flow should not be considered as alternatives to net income, operating income, net cash provided by operating activities, as applicable, or any other measure of financial performance or liquidity presented in accordance with GAAP. Adjusted EBITDA, free cash flow, and retained free cash flow have important limitations as analytical tools because they exclude some, but not all, items that affect net income, operating income and net cash provided by operating activities. Additionally, because these non-GAAP metrics may be defined differently by other companies in ETRN's industry, ETRN's definitions of adjusted EBITDA, free cash flow, and retained free cash flow may not be comparable to similarly titled measures of other companies, thereby diminishing the utility of the measures. Free cash flow and retained free cash flow should not be viewed as indicative of the actual amount of cash that ETRN has available for dividends or that ETRN plans to distribute and are not intended to be liquidity measures.

ETRN is unable to provide a reconciliation of projected adjusted EBITDA from projected net income (loss), the most comparable financial measure calculated in accordance with GAAP, or a reconciliation of projected free cash flow or retained free cash flow to net cash provided by operating activities, the most comparable financial measure calculated in accordance with GAAP. ETRN has not provided a reconciliation of projected adjusted EBITDA to projected net income (loss), the most comparable financial measure calculated in accordance with GAAP, due to the inherent difficulty and impracticability of predicting certain amounts required by GAAP with a reasonable degree of accuracy.


Contacts

Analyst inquiries:
Nate Tetlow – Vice President, Corporate Development and Investor Relations
412-553-5834
This email address is being protected from spambots. You need JavaScript enabled to view it.

Media inquiries:
Natalie Cox – Communications and Corporate Affairs
412-395-3941
This email address is being protected from spambots. You need JavaScript enabled to view it.


Read full story here

Top Home Solar and Battery Provider to Expand Offering with Energy Hub Inverter Solution

FREMONT, Calif.--(BUSINESS WIRE)--SolarEdge Technologies, Inc. (“SolarEdge”) (NASDAQ: SEDG), a global leader in smart energy technology, announced that it has entered into a strategic supply agreement with Sunrun (Nasdaq: RUN), a leading U.S. provider of residential solar, battery storage, and energy services. As part of the agreement, Sunrun will offer SolarEdge’s next generation PV inverter, Energy Hub, for residential customers.


SolarEdge is a key partner helping Sunrun to support a complete residential energy ecosystem with seamless integration of smart energy devices and optimized home energy management through its Energy Hub inverter. SolarEdge and Sunrun believe in an electrified future and a continued reduction in reliance upon fossil fuels. Together, the companies are focused on expanding value to customers through the offering of products such as smart energy devices, battery storage, EV chargers, and other products to further the electrification of the home.

“SolarEdge is pleased to expand its partnership with Sunrun, a company that is instrumental in bridging the gap between utilities and managed networks of home solar energy systems,“ said Zivi Lando, CEO of SolarEdge.

“We’re expanding our new supply agreement with SolarEdge and advancing our shared vision to accelerate the adoption of innovative, smart energy technologies to power a future that runs on the sun,” said Lynn Jurich, co-founder and CEO of Sunrun. “Sunrun using the SolarEdge Energy Hub will help drive the adoption of more affordable and reliable electricity, powered by home solar and batteries.”

About SolarEdge:

SolarEdge is a global leader in smart energy technology. By leveraging world-class engineering capabilities and with a relentless focus on innovation, SolarEdge creates smart energy solutions that power our lives and drive future progress. SolarEdge developed an intelligent inverter solution that changed the way power is harvested and managed in photovoltaic (PV) systems. The SolarEdge DC optimized inverter seeks to maximize power generation while lowering the cost of energy produced by the PV system. Continuing to advance smart energy, SolarEdge addresses a broad range of energy market segments through its PV, storage, EV charging, batteries, UPS, electric vehicle powertrains, and grid services solutions. SolarEdge is online at solaredge.com

About Sunrun

Sunrun Inc. (Nasdaq: RUN) is the nation's leading home solar, battery storage, and energy services company. Founded in 2007, Sunrun pioneered home solar service plans to make local clean energy more accessible to everyone for little to no upfront cost. Sunrun's innovative home battery solution, Brightbox, brings families affordable, resilient, and reliable energy. The company can also manage and share stored solar energy from the batteries to provide benefits to households, utilities, and the electric grid while reducing our reliance on polluting energy sources. For more information, please visit www.sunrun.com.


Contacts

Press Contacts
SolarEdge Technologies
Lily Salkin
Public and Media Relations
+972-522028240
This email address is being protected from spambots. You need JavaScript enabled to view it.

Investor Relations
Sapphire Investor Relations, LLC
Erica Mannion or Michael Funari
+1 617-542-6180
This email address is being protected from spambots. You need JavaScript enabled to view it.

AKRON, Ohio--(BUSINESS WIRE)--$BW #construction--Babcock & Wilcox (B&W) (NYSE: BW) announced today that its B&W Thermal segment has booked new construction service projects in North America valued at approximately $13 million as the market strengthens and projects continue to restart following delays in 2020.

The projects include services for a range of industries including pulp and paper, mining and petroleum refining and will be executed by Babcock & Wilcox Construction Co., LLC.

“We are seeing an overall strengthening of the market for energy and industrial construction projects in North America, and B&W Thermal is poised to capitalize on these emerging opportunities and grow our business,” said B&W Chief Operating Officer Jimmy Morgan. “Many projects were delayed due to the impact of COVID-19 last year, but we’re seeing customers now moving forward with necessary work that had been previously put on hold. The recent inclement weather also has forced higher loads within the utility sector and we anticipate stronger demand for parts and services going forward.”

“B&W Thermal provides a full range of field construction, construction management and maintenance services for industrial and utility customers and we look forward to serving our customers for these new contracts, which include boiler repairs, equipment installation and other service work,” Morgan said. “As the North American manufacturing sector continues to ramp up as the economy improves, we anticipate significant ongoing demand by customers for construction and maintenance services, and we’re well-positioned to meet the needs of the market.”

B&W Thermal operates regional construction offices strategically located across the U.S. and Canada to quickly and safely respond to fast turnaround requests and effectively manage projects. B&W provides construction services to a variety of industries, including power, oil & gas, oil sands, chemical and petrochemical, pulp & paper, renewables and waste-to-energy and general manufacturing.

About Babcock & Wilcox

Headquartered in Akron, Ohio, Babcock & Wilcox is a global leader in energy and environmental technologies and services for the power and industrial markets. Follow us on LinkedIn and learn more at www.babcock.com.

About B&W Thermal

Babcock & Wilcox Thermal designs, manufactures and erects steam generation equipment, aftermarket parts, construction, maintenance and field services for plants in the power generation, oil & gas, and industrial sectors. Babcock & Wilcox Thermal has an extensive global base of installed equipment for utilities and general industrial applications including refining, petrochemical, food processing, metals and more.

Forward-Looking Statements

B&W cautions that this release contains forward-looking statements, including, without limitation, statements relating to the booking of multiple new construction projects in North America, as well as ongoing demand by customers for construction and maintenance services. These forward-looking statements are based on management’s current expectations and involve a number of risks and uncertainties. For a more complete discussion of these risk factors, see our filings with the Securities and Exchange Commission, including our most recent annual report on Form 10-K. If one or more of these risks or other risks materialize, actual results may vary materially from those expressed. We caution readers not to place undue reliance on these forward-looking statements, which speak only as of the date of this release, and we undertake no obligation to update or revise any forward-looking statement, except to the extent required by applicable law.


Contacts

Investor Contact:
Megan Wilson
Vice President, Corporate Development & Investor Relations
Babcock & Wilcox
704.625.4944 | This email address is being protected from spambots. You need JavaScript enabled to view it.

Media Contact:
Ryan Cornell
Public Relations
Babcock & Wilcox
330.860.1345 | This email address is being protected from spambots. You need JavaScript enabled to view it.

DUBLIN--(BUSINESS WIRE)--The "Deep Sea, Coastal, and Great Lakes Global Market Report 2021: COVID-19 Impact and Recovery to 2030" report has been added to ResearchAndMarkets.com's offering.


Deep Sea, Coastal, and Great Lakes Global Market Report 2021: COVID-19 Impact and Recovery to 2030 provides the strategists, marketers and senior management with the critical information they need to assess the global deep sea, coastal, and great lakes market as it emerges from the COVID-19 shut down.

Major companies in the deep sea, coastal, and great lakes transportation market include Carnival Corporation; A.P. Moller; MSC Mediterranean Shipping Company SA; K-Line America and Seacor Holdings Inc.

The global deep sea, coastal, and great lakes market is expected to grow from $467.85 billion in 2020 to $488.02 billion in 2021 at a compound annual growth rate (CAGR) of 4.3%. The growth is mainly due to the companies rearranging their operations and recovering from the COVID-19 impact, which had earlier led to restrictive containment measures involving social distancing, remote working, and the closure of commercial activities that resulted in operational challenges. The market is expected to reach $587.82 billion in 2025 at a CAGR of 5%.

The deep sea, coastal, and great lakes transportation market consists of sales of deep sea, coastal, and great lakes transportation services and related goods by entities (organizations, sole traders and partnerships) that provide deep sea, coastal, and great lakes transportation of passengers and cargo using watercraft, such as ships, barges, and boats. The deep sea, coastal, and great lakes market is segmented into deep sea transportation and coastal and great lakes transportation.

Asia Pacific was the largest region in the global deep sea, coastal, and great lakes market, accounting for 46% of the market in 2020. Western Europe was the second largest region accounting for 32% of the global deep sea, coastal, and great lakes market. Africa was the smallest region in the global deep sea, coastal, and great lakes market.

Water transportation service companies are increasingly using sensor technologies to enable monitoring of remote locations of ships. A sensor is a device that detects and responds to some type of input from the physical environment. The specific input could be light, heat, motion, moisture, pressure, or any one of a number of other environmental phenomena present in the ship. Sensors in remote locations of ships collect data autonomously and relay the data to the control room in real-time.

The data captured by the sensor allows ship owners to improve overall maintenance cycle of visits, including condition monitoring and condition-based monitoring. For instance, NoraSens and Silicon Radar are some of the company's manufacturing sensors for ships.

Key Topics Covered:

1. Executive Summary

2. Report Structure

3. Deep Sea, Coastal, and Great Lakes Market Characteristics

3.1. Market Definition

3.2. Key Segmentations

4. Deep Sea, Coastal, and Great Lakes Market Product Analysis

4.1. Leading Products/ Services

4.2. Key Features and Differentiators

4.3. Development Products

5. Deep Sea, Coastal, and Great Lakes Market Supply Chain

5.1. Supply Chain

5.2. Distribution

5.3. End Customers

6. Deep Sea, Coastal, and Great Lakes Market Customer Information

6.1. Customer Preferences

6.2. End Use Market Size and Growth

7. Deep Sea, Coastal, and Great Lakes Market Trends and Strategies

8. Impact of COVID-19 on Deep Sea, Coastal, and Great Lakes

9. Deep Sea, Coastal, and Great Lakes Market Size and Growth

9.1. Market Size

9.2. Historic Market Growth, Value ($ Billion)

9.2.1. Drivers of the Market

9.2.2. Restraints on the Market

9.3. Forecast Market Growth, Value ($ Billion)

9.3.1. Drivers of the Market

9.3.2. Restraints on the Market

10. Deep Sea, Coastal, and Great Lakes Market Regional Analysis

10.1. Global Deep Sea, Coastal, and Great Lakes Market, 2020, by Region, Value ($ Billion)

10.2. Global Deep Sea, Coastal, and Great Lakes Market, 2015-2020, 2020-2025F, 2030F, Historic and Forecast, by Region

10.3. Global Deep Sea, Coastal, and Great Lakes Market, Growth and Market Share Comparison, by Region

11. Deep Sea, Coastal, and Great Lakes Market Segmentation

11.1. Global Deep Sea, Coastal, and Great Lakes Market, Segmentation by Type, Historic and Forecast, 2015-2020, 2020-2025F, 2030F, $ Billion

  • Deep Sea Transport
  • Coastal and Great Lakes Transport

12. Deep Sea, Coastal, and Great Lakes Market Metrics

12.1. Deep Sea, Coastal, and Great Lakes Market Size, Percentage of GDP, 2015-2025, Global

12.2. Per Capita Average Deep Sea, Coastal, and Great Lakes Market Expenditure, 2015-2025, Global

Companies Mentioned

  • Carnival Corporation
  • A.P. Moller
  • MSC Mediterranean Shipping Company SA
  • K-Line America
  • Seacor Holdings Inc

For more information about this report visit https://www.researchandmarkets.com/r/6ocz0l


Contacts

ResearchAndMarkets.com
Laura Wood, Senior Press Manager
This email address is being protected from spambots. You need JavaScript enabled to view it.
For E.S.T Office Hours Call 1-917-300-0470
For U.S./CAN Toll Free Call 1-800-526-8630
For GMT Office Hours Call +353-1-416-8900

Ethisphere’s 2021 World’s Most Ethical Companies recognition honors AECOM for its commitment to integrity and making a positive impact

LOS ANGELES--(BUSINESS WIRE)--AECOM (NYSE: ACM), the world’s premier infrastructure consulting firm, announced today that it has been recognized by Ethisphere as one of the 2021 World’s Most Ethical Companies. This is the fifth year AECOM has been honored with this designation for the Company’s commitment to integrity and making a positive impact. Ethisphere is a global leader in defining and advancing the standards of ethical business practices and in 2021, the organization recognized 135 companies spanning 22 countries and 47 industries.

AECOM is committed to acting with the highest level of ethics and integrity, which helps ensure long-term success for our company, people and shareholders,” said Troy Rudd, AECOM’s chief executive officer. “Ethisphere’s recognition honors the dedication of our people in extending a culture and approach that has earned the trust of our clients and the communities where we work and reinforces our leadership on environmental, social and governance efforts.”

Congratulations to everyone at AECOM for earning this prestigious designation,” said Ethisphere CEO, Timothy Erblich. “We saw this year’s honorees lead on earning the trust of stakeholders through resilience and a commitment to ethics and integrity. AECOM continues to demonstrate an unwavering commitment to the highest values by exceeding accessibility and accountability standards with their extensive training program and available tools. Its focus on ethics continues to positively impact the communities it serves year over year.”

AECOM’s commitment to safeguard a workplace culture defined by integrity is paramount to its continued success. Its Ethics and Compliance program is a major focal point and integral part of the company’s culture.

While business results are a critical measure of our success, how we achieve those results is every bit as important,” said David Gan, AECOM’s chief legal officer. “Our teams across the globe are continually committed to doing the right thing and providing our services with integrity. I am proud of our Ethics & Compliance team led by Antonio D’Amico, AECOM’s chief ethics and compliance officer, and that our ethical culture, values and leadership have been recognized by Ethisphere with this distinction.”

Grounded in Ethisphere’s proprietary Ethics Quotient®, this year’s assessment process was composed of more than 200 questions focusing on culture, environmental and social practices, ethics and compliance activities, governance, diversity and initiatives to support a strong value chain. The process served as an operating framework to capture and codify the leading practices of organizations across industries and around the globe.

For this year’s assessment, the question set was expanded to include how applicants are adapting and responding to the global health pandemic, environmental, social, and governance factors, safety, equity, and inclusion and social justice.

For the full list of this year’s honorees, please visit www.worldsmostethicalcompanies.com/honorees.

About AECOM

AECOM (NYSE: ACM) is the world’s premier infrastructure consulting firm, delivering professional services throughout the project lifecycle – from planning, design and engineering to program and construction management. On projects spanning transportation, buildings, water, energy and the environment, our public- and private-sector clients trust us to solve their most complex challenges. Our teams are driven by a common purpose to deliver a better world through our unrivaled technical expertise and innovation, a culture of equity, diversity and inclusion, and a commitment to environmental, social and governance priorities. AECOM is a Fortune 500 firm and its Professional Services business had revenue of $13.2 billion in fiscal year 2020. See how we deliver what others can only imagine at aecom.com and @AECOM.


Contacts

Media Contact:
Brendan Ranson-Walsh
Vice President, Global External Communications
1.213.996.2367
This email address is being protected from spambots. You need JavaScript enabled to view it.

Investor Contact:
Will Gabrielski
Vice President, Investor Relations
1.213.593.8208
This email address is being protected from spambots. You need JavaScript enabled to view it.

PASADENA, Calif.--(BUSINESS WIRE)--Tetra Tech, Inc. (NASDAQ: TTEK), a leading provider of high-end consulting and engineering services, announced today that the United States Agency for International Development (USAID) awarded the Company a five-year, $38.8 million, single-award Sustainable Energy for Indonesia’s Advancing Resilience (USAID SINAR) contract to support Indonesia in delivering reliable and sustainable energy services.


Through USAID SINAR, Tetra Tech energy specialists will develop innovative solutions to accelerate the deployment of sustainable energy systems, promote transparent and consistent policies, and modernize utility services. Tetra Tech will also work with USAID and the Government of Indonesia to achieve its sustainable development goals in the energy sector, including expanding and improving energy services and increasing use of renewable energy resources. Tetra Tech will promote integration of smart grid technologies, including battery storage, for the effective distribution of sustainable, renewable energy that will drive fundamental energy sector transformation.

“Tetra Tech has supported USAID’s sustainable energy programs in Indonesia for more than 10 years,” said Dan Batrack, Tetra Tech Chairman and CEO. “We look forward to continuing to use our Leading with Science® approach to create resilient energy solutions for the people of Indonesia.”

About Tetra Tech

Tetra Tech is a leading provider of high-end consulting and engineering services for projects worldwide. With 20,000 associates working together, Tetra Tech provides clear solutions to complex problems in water, environment, sustainable infrastructure, and renewable energy. We are Leading with Science® to provide sustainable and resilient solutions for our clients. For more information about Tetra Tech, please visit tetratech.com or follow us on LinkedIn, Twitter, and Facebook.

Any statements made in this release that are not based on historical fact are forward-looking statements. Any forward-looking statements made in this release represent management’s best judgment as to what may occur in the future. However, Tetra Tech’s actual outcome and results are not guaranteed and are subject to certain risks, uncertainties and assumptions ("Future Factors"), and may differ materially from what is expressed. For a description of Future Factors that could cause actual results to differ materially from such forward-looking statements, see the discussion under the section "Risk Factors" included in the Company’s Form 10-K and Form 10-Q filings with the Securities and Exchange Commission.


Contacts

Jim Wu, Investor Relations
Charlie MacPherson, Media & Public Relations
(626) 470-2844

Accelerated producer activity and operational optimization drives strong 2020 results with full-year 2020 net loss of $15.3 million and Adjusted EBITDA1 of $580.3 million, a 10% increase over full-year 2019 and above the upper end of the revised guidance range

Fourth quarter outperformance driven by record volumes on the Arrow gathering system in the Bakken as producers accelerated new well connections into the fourth quarter driving strong utilization across Crestwood’s expanded infrastructure

2021E Adjusted EBITDA1 guidance range of $550 million to $610 million; 2021E growth capital program of $35 million to $45 million represents a 72% reduction year-over-year and positions Crestwood to generate meaningful free cash flow after distributions2

Continued commitment to ESG/Sustainability efforts in 2020 and new 2021 initiatives focused on further enhancing Crestwood’s culture of continuous improvement and advancing Crestwood’s midstream sector ESG leadership position across the industry

HOUSTON--(BUSINESS WIRE)--Crestwood Equity Partners LP (NYSE: CEQP) (“Crestwood”) reported today its financial and operating results for the three months ended December 31, 2020.

Fourth Quarter and Full-Year 2020 Highlights1

  • Fourth quarter 2020 net income of $27.8 million, compared to net income of $47.2 million in fourth quarter 2019; Full-year net loss of $15.3 million, compared to net income of $319.9 million in 2019
  • Fourth quarter 2020 Adjusted EBITDA of $165.1 million, compared to $149.0 million in the fourth quarter 2019; Full-year Adjusted EBITDA of $580.3 million, compared to $526.5 million in 2019, an increase of 10% year-over-year
  • Fourth quarter 2020 distributable cash flow (“DCF”) to common unitholders of $106.3 million; The fourth quarter 2020 coverage ratio was 2.3x; Full-year DCF of $361.2 million; The full-year coverage ratio was 2.0x
  • Ended 2020 with approximately $2.5 billion in total debt and a 4.0x leverage ratio; Crestwood has substantial liquidity available under its $1.25 billion revolver with $719 million drawn as of December 31, 2020
  • Fourth quarter 2020 cash distribution of $0.625 per common unit, or $2.50 per common unit on an annualized basis, flat quarter-over-quarter, paid on February 12, 2021, to unitholders of record as of February 5, 2021

Recent Developments and 2021 Capital Summary

  • On January 21, Crestwood closed on the previously announced issuance of $700 million 6.00% senior unsecured notes due 2029 extending its next significant senior note maturity date to 2025 and reducing interest expense by approximately $2 million annually
  • In February, Crestwood’s primary customer in the Powder River Basin, Chesapeake Energy (NYSE: CHK) (“Chesapeake”), exited bankruptcy; Crestwood and Chesapeake proactively reached mutually beneficial commercial agreements on both the Jackalope system in the Powder River Basin and with Stagecoach Gas Services (“Stagecoach”) in the Northeast Marcellus during the bankruptcy process
  • Crestwood continues to monitor legal proceedings on the Dakota Access Pipeline (“DAPL”) and remains well-positioned to manage crude oil volumes at Arrow and the COLT Hub through alternative pipelines, storage, and crude-by-rail services in the event of a temporary shut-down; Crestwood’s integrated asset footprint and market connectivity through diverse takeaway options positions Crestwood to mitigate any risks from a DAPL disruption and creates opportunities for further market share capture in the basin through increasing utilization and optimization of its rail loading, storage, and marketing services
  • Total 2021 capital investment includes $35 million to $45 million of growth capital focused on the expansion and enhancement of the Arrow produced water gathering system, optimization of the Arrow crude oil and natural gas gathering systems, and well connections in the Powder River Basin and Delaware Permian; and $20 million to $25 million of maintenance capital for asset integrity projects

Management Commentary

“Despite 2020 being one of the more challenging years our industry has ever faced, I am very proud of the performance of our team and assets here at Crestwood as we delivered Adjusted EBITDA of $580.3 million and Distributable Cash Flow of $361.2 million. These record annual results were both increases of more than 10% over 2019, well above consensus estimates and the highest levels we have reported in our ten year history despite the unprecedented volatility the industry experienced in the second and third quarters of 2020 due to the pandemic. Most importantly, in a year where most of our industry took a step backwards, we continued to move forward by enhancing our strategic and financial position with strong year-end leverage and coverage ratios of 4.0x and 2.0x, respectively. These results highlight the quality of Crestwood’s integrated asset portfolio and our team’s ability to manage customer relationships in a tough market, keep operating expenses low while delivering reliable services and execute our business plans through adversity,” commented Robert G. Phillips, Chairman, President and Chief Executive Officer of Crestwood’s general partner. “Despite historic commodity price volatility throughout 2020, our gathering and processing segment bounced back in the second half of the year with new rig activity in the Bakken, Delaware Basin and Barnett shale driving increased volumes, which combined with stable contributions from our legacy gas assets, high utilization of our premier northeast storage and transportation infrastructure, and the expansion of our NGL logistics business, drove positive free cash flow after capital expenditures and distributions. These factors led to strong year-end exit rates and resulted in record fourth quarter 2020 performance for Crestwood, which positions the partnership with significant momentum as we begin 2021.”

Mr. Phillips continued, “Looking into 2021, we are increasingly optimistic that the recent improvements in commodity prices are reflective of constructive market fundamentals underpinned by increasing hydrocarbon demand as the vaccination rollout continues and economies begin to fully reopen. With that backdrop, Crestwood expects to generate 2021 Adjusted EBITDA of $550 million to $610 million, with the expectation that the upper end of that guidance range becomes increasingly likely as producers continue to increase activity in a prolonged $55 to $60 per barrel crude oil price environment. During 2021, we have a modest number of highly accretive capital projects to expand key gathering systems for new production under existing contracts. Based on this guidance range, Crestwood expects to generate between $90 million and $160 million in free cash flow after paying its current distribution, that we intend to allocate toward increasing financial flexibility with further debt reduction until we achieve our long-term leverage ratio target between 3.5x and 4.0x. Based on our expected free cash flow generation, our strengthening balance sheet and financial flexibility, and our commitment to leading the MLP industry in sustainability initiatives, Crestwood is well-positioned to benefit from improving markets conditions and to maximize total returns for our unitholders in 2021.”

Fourth Quarter 2020 Segment Results

Gathering and Processing (G&P) segment EBITDA totaled $128.1 million in the fourth quarter 2020, an increase of 13%, compared to $112.9 million in the fourth quarter 2019. During the fourth quarter 2020, segment EBITDA increased primarily as a result of volume growth across the Arrow system in the Bakken as producers accelerated well connections and achieved higher initial production rates. Compared to the fourth quarter 2019, Arrow natural gas processing volumes increased 45%, natural gas gathering volumes increased 38%, water gathering volumes increased 21%, and oil gathering volumes increased 5%. In the fourth quarter 2020, Crestwood had producer rig activity in the Bakken, Delaware Permian and the Barnett shale as producers resumed drilling and completion activities in the backdrop of rising crude prices.

Storage and Transportation segment EBITDA totaled $14.7 million in the fourth quarter 2020, compared to $16.8 million in the fourth quarter 2019. Fourth quarter 2020 natural gas storage and transportation volumes averaged 2.2 Bcf/d, compared to 2.0 Bcf/d in the fourth quarter 2019. During the fourth quarter 2020, Stagecoach achieved record volumes on its transportation assets as producers continue to benefit from stronger dry gas economics that led to an increase in development capital to the region. These assets are also fully contracted for 2021. During the fourth quarter 2020, Stagecoach proactively entered into a new commercial agreement with Chesapeake as part of its bankruptcy process that was approved by the Federal Energy Regulatory Commission (FERC). This new agreement positions Chesapeake and Stagecoach to continue their strong working relationship in the Northeast Marcellus, which Chesapeake has highlighted as a core focus area going forward. At the Tres Palacios facility, Crestwood has continued to see an increased interest in storage from natural gas operators and LNG exporters in the Gulf Coast region, and recently completed a new interconnect with Kinder Morgan’s Permian Highway Pipeline that is expected to drive incremental producer volumes and producer interest in the facility. At the COLT Hub, fourth quarter 2020 rail loading volumes of 44 MBbls/d decreased compared to the fourth quarter 2019 due to reduced production in the Bakken over the course of 2020. Based on continued uncertainty around DAPL, the COLT Hub is beginning to benefit from increased contracts for take-or-pay services as producers begin to diversify take-aways options in the Bakken.

Marketing, Supply and Logistics (MS&L) segment EBITDA totaled $27.5 million in the fourth quarter 2020, compared to $19.3 million in the fourth quarter 2019. For full-year 2020, the MS&L segment generated EBITDA of $89.2 million, which includes nine months of contribution from the Plains All American (“Plains”) assets acquired in early April 2020. All periods exclude the non-cash change in fair value of commodity inventory-related derivative contracts. During the fourth quarter 2020, the NGL marketing and logistics business benefited from consistent demand as a result of on-going stay-at-home orders, slightly offset by more moderate than normal weather in October and November. In 2021, Crestwood estimates its NGL marketing and logistics business to grow year-over-year based on the full integration of the Plains assets, opportunities to capture additional market share, and consistent upstream and downstream demand.

Combined O&M and G&A expenses, net of non-cash unit-based compensation, in the fourth quarter 2020 were $45.7 million compared to $53.1 million in the fourth quarter 2019. The decrease in expenses in fourth quarter 2020 was due to Crestwood’s efforts during the second quarter of 2020 to permanently reduce costs.

Fourth Quarter 2020 Business Update and FY 2021 Outlook

Bakken Update

Arrow

During the fourth quarter 2020, the Arrow system averaged crude oil gathering volumes of 130 MBbls/d, a 21% increase over the third quarter of 2020, natural gas gathering volumes of 142 MMcf/d, 19% above the third quarter 2020, and produced water gathering volumes of 98 MBbls/d, 1% above the third quarter 2020. Stable commodity pricing during the quarter enabled producers to accelerate well connections originally scheduled for 2021 into the fourth quarter 2020 and resulted in the Arrow system achieving new gathering records on all three products during the quarter. During the fourth quarter 2020, producers on the Arrow system connected 21 three-product wells resulting in a total of 70 three-product well connections and 14 water-only well connections in 2020. At current strip pricing, Crestwood estimates there are approximately 500 to 600 three-product drilling locations and approximately 350 to 450 water-only drilling locations on the Arrow system. The Bear Den processing complex averaged volumes of 138 MMcf/d, an increase of 20% over the third quarter 2020. Volumes on the Arrow system continue to benefit from enhanced recovery methods that have driven average initial production rates as high as 10,000 Boe/d allowing Arrow producers to maintain stronger volumes with reduced drilling activity.

In 2021, Crestwood’s capital investments in the Bakken will remain focused on the enhancement and expansion of the produced water gathering system, ongoing natural gas and crude oil optimization projects to support producer development plans, and incremental system compression. Based on current producer forecasts, in a $45 to $50 per barrel crude oil price environment, Crestwood estimates 25 – 35 three-product well connects and 20 - 25 water-only well connects in 2021, and in a $60 per barrel crude oil price environment, estimates more than 45 three-product well connects, resulting in year-over-year growth in natural gas and produced water gathering volumes.

DAPL Update

Crestwood continues to actively monitor the legal proceedings on DAPL and remains well-positioned to manage its Bakken operations under any potential outcome for the pipeline. Over the past few months, Crestwood’s customers have mitigated their exposure to a DAPL shutdown by beginning to establish shipper history on other takeaway options, resulting in significant decrease in customer nominated Arrow redeliveries to DAPL despite overall volume growth on the Arrow system. Currently, in addition to DAPL, Arrow offers its customers connectivity to Kinder Morgan’s Hiland pipeline, Tesoro’s High Plains pipeline, and the True Companies’ Bridger Four Bears pipeline system, in addition to the COLT Hub and trucking takeaway. In total, Arrow has over 200 MBbls/d of takeaway capacity for customers, allowing it to competitively clear all of its producers’ product from the basin in the event operations on DAPL are temporarily suspended. Additionally, Crestwood has already begun to experience increased demand for crude-by-rail services at the COLT Hub facility which is the leading crude oil terminal in the Bakken with multiple pipeline connections, storage capacity of 1.2 MMBbls and rail loading capacity of 160 MBbls/d.

Powder River Basin Update

During the fourth quarter 2020, the Jackalope system averaged gathering volumes of 82 MMcf/d and processing volumes of 84 MMcf/d, increases of 14% and 18%, respectively, over the third quarter of 2020. During the fourth quarter 2020, Chesapeake continued to bring shut-in wells back online and had 90% of its wells flowing by the end of 2020. The remaining shut-in wells were brought back online in January 2021, driving an incremental increase in volumes through the system which is currently flowing approximately 110 - 115 MMcf/d. Crestwood connected 11 wells to the Jackalope system during 2020.

In February 2021, Chesapeake emerged from bankruptcy as a relatively stronger E&P company with a new capital structure, lower operating expenses, and sufficient liquidity to support on-going operations. During the bankruptcy process, Crestwood proactively entered into new commercial agreements with Chesapeake in the Powder River Basin and Northeast Marcellus. Under the new commercial agreement in the Powder River Basin, Chesapeake is in the best position possible to successfully produce and develop its acreage with reduced fees in the short-term that mitigate shut-in risk, and incentivized rates that leverage recent capacity additions to support incremental development over the next few years. The new agreement protects Crestwood’s downside exposure with extended minimum volume commitments (MVCs), and provides upside to Crestwood with a higher long-term fee that generates NPV (net present value) positive economics with new development.

In 2021, Crestwood expects capital investments in the Powder River Basin to support new well connections across the Jackalope gathering system. Based on current producer forecasts, Crestwood expects 15 - 20 new wells to be connected to the Jackalope system in 2021 from the system’s primary producers providing incremental volumes and offsetting natural field decline.

Delaware Basin Update

During the fourth quarter 2020, 18 wells were connected to Crestwood’s Delaware Basin natural gas gathering systems, resulting in average volumes of 172 MMcf/d. Volumes decreased 7% compared to the third quarter 2020 due to frac protection and the new well connections coming later in the quarter and thus driving higher volumes to start 2021. During 2020, 47 wells were connected to the natural gas gathering systems driven by Royal Dutch Shell’s (“Shell”) development program on the Nautilus gathering system and activity by Concho Resources Inc. and Mewbourne Oil Company on the Willow Lake gathering system. Volumes on the recently constructed produced water infrastructure averaged 44 MBbl/d during the fourth quarter 2020, a decrease of 6% quarter-over-quarter, as the anchor producer re-used incremental barrels for fracking as a part of its development program during the quarter. Based on the producer’s current forecast, Crestwood expects average annual produced water volumes to materially increase in 2021.

In 2021, Crestwood expects growth capital in the Delaware Basin to include Nautilus and Willow Lake gathering system expansions and well connections. Based on current producer forecasts, Crestwood estimates 65 - 75 wells to be connected to the Delaware Basin gathering systems during 2021, driven by Shell’s three-rig program on acreage dedicated to the Nautilus system and various operators on the Willow Lake system.

Federal Land Exposure Update

Following the recent executive orders and actions by the Biden Administration, Crestwood continues to assess the impact to its business related to the temporary suspension of new leasing on federal lands. Based on the initial assessment, Crestwood believes that it is well-positioned to manage the orders made to date on its federal land exposure in the Bakken, Powder River and Delaware Basins. In the Bakken, the Arrow system is located on the Fort Berthold Indian Reservation and the Department of the Interior excluded tribal lands from its executive actions; thereby, allowing the Bureau of Indian Affairs (BIA) to continue issuing new permits, rights-of-way, and leases. In the Powder River Basin, Crestwood has minimal surface exposure to federal lands and does not expect any issues with obtaining incremental rights-of-way for additional gathering lines. Crestwood estimates approximately 55% - 60% of its primary producers’ mineral acreage is located on private lands and data from the BLM indicates there are approximately 330 federally approved drilling permits on the Jackalope system, allowing producers to develop new wells in the basin for the foreseeable future with limited impact from any regulatory limitations on federal lands. In New Mexico, the Willow Lake system is 86% on private land; therefore, Crestwood does not expect material issues gaining incremental rights-of-way. Additionally, the major producers on the Willow Lake system have been proactive in permitting wells located on federal lands prior to the Biden Administration taking office.

Barnett Shale Update

In the Barnett shale, there is currently one rig running on the Lake Arlington system and Crestwood expects an eight well pad to be connected in early second quarter 2021. Crestwood anticipates the incremental volumes from this activity to more than offset natural field decline for the year.

2021 Financial Guidance

Crestwood’s 2021 guidance reflects the general business update and outlook noted above, the most recent feedback from customers, and Crestwood’s current outlook on commodity prices. Given continued commodity price volatility resulting from the ongoing demand recovery from COVID-19, Crestwood has factored commodity price sensitivities into the guidance ranges provided below. The guidance range is generally estimated to reflect Crestwood’s business performance at an oil price environment of $45 to $50 per barrel on the low end of the range, up to approximately $60 per barrel at the upper end of the guidance range, taking into consideration the impact commodity price movements may have on Crestwood’s customers’ development plans, as well as the limited direct commodity price exposure Crestwood has under its percent of proceeds and marketing contracts. These projections are subject to risks and uncertainties as described in the “Forward-Looking Statements” section at the end of this release.

  • Net income of $85 million to $145 million
  • Adjusted EBITDA of $550 million to $610 million
  • Contribution by operating segment is set forth below:

$US millions


Adj. EBITDA Range

Operating Segment


Low


High

Gathering & Processing


$435

-

$485

Storage & Transportation


75

-

80

Marketing, Supply & Logistics


95

-

100

Less: Corporate G&A


(55)


(55)

FY 2021 Totals


$550

-

$610

  • Distributable cash flow available to common unitholders of $320 million to $380 million
  • Free cash flow after distributions of $90 million to $160 million
  • Full-year 2021 coverage ratio of 1.7x to 2.0x
  • Full-year 2021 leverage ratio between 3.75x and 4.25x
  • Growth project capital spending and joint venture contributions in the range of $35 million to $45 million
  • Maintenance capital spending in the range of $20 million to $25 million

Capitalization and Liquidity Update

Crestwood invested approximately $5.7 million in consolidated growth capital projects and joint venture contributions during the fourth quarter 2020 and approximately $143.8 million during full-year 2020, coming in at the low end of the revised guidance range. As of December 31, 2020, Crestwood had approximately $2.5 billion of debt outstanding, comprised of $1.787 billion of fixed-rate senior notes and $719 million outstanding under its $1.25 billion revolving credit facility, resulting in a leverage ratio of 4.0x.

On January 6, 2021, Crestwood priced an offering of $700 million 6% senior unsecured notes due 2029 and concurrently launched a tender offer for its existing $700 million 6.25% senior unsecured notes due 2023. Approximately 58% of the 2023 notes were validly tendered and Crestwood closed the offering and funded the tender settlement on January 21, 2021. Pro forma for the closing of the transactions, Crestwood has $2.1 million of senior notes outstanding and approximately $430 million drawn on its revolving credit facility. Crestwood expects to redeem the remaining 2023 senior notes when they become callable at par on April 1, 2021.

Crestwood expects growth capital for 2021 to be in a range of $35 million to $45 million, primarily focused on optimizations to the Arrow gathering system in the Bakken and well connects in the Delaware Permian and Powder River Basin. Crestwood expects to invest between $20 million to $25 million on maintenance capital projects for the year. Based on the current outlook, Crestwood expects to fund its total 2021 capital program with retained cash flow and to generate meaningful free cash flow after distributions.

Crestwood currently has 71.3 million preferred units outstanding (par value of $9.13 per unit) which pay a fixed-rate annual cash distribution of 9.25%, payable quarterly. The preferred units are listed on the New York Stock Exchange and trade under the ticker symbol CEQP-P.

Sustainability Program Update

Since 2018, Crestwood has been a leader in the midstream ESG space by advancing ESG initiatives both within the company and across the energy industry.


Contacts

Crestwood Equity Partners LP
Investor Contacts

Josh Wannarka, 713-380-3081
This email address is being protected from spambots. You need JavaScript enabled to view it.
Senior Vice President, Investor Relations, ESG & Corporate Communications

Rhianna Disch, 713-380-3006
This email address is being protected from spambots. You need JavaScript enabled to view it.
Director, Investor Relations

Sustainability and Media Contact

Joanne Howard, 832-519-2211
This email address is being protected from spambots. You need JavaScript enabled to view it.
Vice President, Sustainability and Corporate Communications


Read full story here

NORTH CHARLESTON, S.C.--(BUSINESS WIRE)--The City of Orlando has announced it will participate in a demonstration program of adsorbed natural gas (ANG) bi-fuel vehicle technology developed by Ingevity Corporation (NYSE: NGVT). Orlando will add two ANG-equipped Ford F-150 pickup trucks to its fleet to assess data related to fuel savings and greenhouse gas (GHG) emissions reductions.


Made possible by the unique characteristics of Ingevity’s Nuchar® FuelSorb™ hardwood-based activated carbon monoliths, ANG technology reduces the onboard storage pressure of natural gas, enabling a low-cost natural gas fueling solution for the light-duty segment.

Bi-fuel ANG trucks can be fueled at public-access compressed natural gas (CNG) stations or conveniently on-site at work through a small fueling compressor, reducing energy consumption by over 50% and markedly reducing fueling time. ANG vehicles emit 25% fewer GHG emissions than comparable gasoline and diesel vehicles and, when fueled with renewable natural gas, GHG emissions can be reduced by up to 125%.

The City of Orlando has converted hundreds of municipal fleet vehicles to alternative fuel sources since launching its Green Works Orlando initiative in 2007,” said Jonathan Ford, CAFS, fleet manager for the City of Orlando. “The city is already equipped with natural gas fueling stations and we have enjoyed the reduced emissions benefits and cost savings of natural gas with our CNG vehicles. We are excited to experience the fleet productivity and fueling convenience enabled by ANG technology.” The City of Orlando has committed to running its fleet on 100% renewable resources by 2030.

Orlando is a leader in alternative fuel adoption,” said David Newton, vice president, corporate strategy, at Ingevity. “Through CNG, the city has already embraced natural gas vehicles and we expect they will further reduce energy consumption and fueling time with these ANG-equipped trucks. We look forward to their participation as we continue to validate the value of ANG.”

Since 2013, the turnkey ANG vehicle and fueling appliance solution has been adopted by SoCalGas in California, Atlanta Gas Light in Georgia, and Ozinga Energy in Illinois. ANG technology has also been EPA-certified on the Ford F-150 since 2018.

Ingevity: Purify, Protect and Enhance
Ingevity provides products and technologies that purify, protect, and enhance the world around us. Through a team of talented and experienced people, we develop, manufacture and bring to market solutions that help customers solve complex problems and make the world more sustainable. We operate in two reporting segments: Performance Chemicals, which includes specialty chemicals and engineered polymers; and Performance Materials, which includes high-performance activated carbon. These products are used in a variety of demanding applications, including asphalt paving, oil exploration and production, agrochemicals, adhesives, lubricants, publication inks, coatings, elastomers, bioplastics and automotive components that reduce gasoline vapor emissions. Headquartered in North Charleston, South Carolina, Ingevity operates from 25 locations around the world and employs approximately 1,750 people. The company is traded on the New York Stock Exchange (NYSE: NGVT). For more information visit www.ingevity.com.


Contacts

Amy Chiconas
843-746-8197
This email address is being protected from spambots. You need JavaScript enabled to view it.

Investors:
Jack Maurer
843-746-8242
This email address is being protected from spambots. You need JavaScript enabled to view it.

 National honor recognizes Ameresco for its excellence in human resource practices and commitment to employee enrichment for second year in a row

FRAMINGHAM, Mass.--(BUSINESS WIRE)--#award--Ameresco, Inc., (NYSE: AMRC), a clean technology integrator specializing in energy efficiency and renewable energy, today announced that it has been named one of the Best and Brightest Companies to Work For in the Nation by the National Association for Business Resources (NABR). Ameresco was also named to Boston’s Best and Brightest Companies to Work For list in 2020. This marks the second straight year that the company was named one of the Best and Brightest Companies to Work For at both a national and regional level.


The 2020 national winning companies were assessed by an independent research firm, which reviewed a number of key measures relative to other nationally recognized winners. This year, 88 winning organizations were honored out of 830 nominations from across the country as the winter Best and Brightest recipients.

“We’re incredibly honored and humbled to be recognized for a second straight year as one of the Best and Brightest,” said president and CEO of Ameresco George Sakellaris. “We would not be able to deliver such innovative advanced energy solutions to our customers if not for our talented and dedicated team of professionals who work day in and day out for a better future.”

“Our commitment to fostering a creative and diverse team of energy professionals lies at the heart of everything we do,” said Lauren Todd, vice president of human resources at Ameresco. “We are continually innovating, not only for our customers but for the future of our employees, and our repeat listing for this honor is a testament to our perseverance in being a leading clean technology integrator.”

With over 20 years of experience conducting the Best and Brightest competitions, the NABR has identified numerous best human resource practices and provided benchmarking for companies that continue to prove themselves as leaders in employment standards.

“Through the second half of 2020, the Best and Brightest Companies To Work For have demonstrated leadership and forward thinking as they pivoted their business and workforce through Covid-19. As the conversation and focus has shifted, our Best and Brightest winning companies have also been a voice for important actions regarding Race. It is in these unique times, the Best and Brightest Companies To Work For excel and share their knowledge with others" said Jennifer Kluge, President and CEO, Best and Brightest Programs.

The companies selected to be recognized nationally as a Best and Brightest Company to Work For® will be featured in the online edition of Corp! Magazine. To learn more about the program, visit www.thebestandbrightest.com.

About Ameresco, Inc.

Founded in 2000, Ameresco, Inc. (NYSE:AMRC) is a leading independent clean technology integrator of comprehensive services, energy efficiency, infrastructure upgrades, asset sustainability and renewable energy solutions for businesses and organizations throughout North America and Europe. Ameresco’s sustainability services include upgrades to a facility’s energy infrastructure and the development, construction and operation of renewable energy plants. Ameresco has successfully completed energy saving, environmentally responsible projects with Federal, state and local governments, healthcare and educational institutions, housing authorities, and commercial and industrial customers. With its corporate headquarters in Framingham, MA, Ameresco has more than 1,000 employees providing local expertise in the United States, Canada, and the United Kingdom. For more information, visit www.ameresco.com.

About the Best and Brightest Programs

The Best and Brightest Companies to Work For® competition identifies and honors organizations that display a commitment to excellence in operations and employee enrichment that lead to increased productivity and financial performance. This competition scores potential winners based on regional data of company performance and a set standard across the nation. This national program celebrates those companies that are making better business, creating richer lives and building a stronger community as a whole. There are numerous regional celebrations throughout the country such as Atlanta, Boston, Chicago, Dallas, Detroit, Grand Rapids, Houston, Milwaukee, San Diego, San Francisco, Miami, New York, Charlotte, Denver, Seattle, Nashville, and Portland. Nominations are now being accepted for all programs. Visit thebestandbrightest.com to nominate your organization.


Contacts

Media:
Ameresco: Leila Dillon, 508-661-2264, This email address is being protected from spambots. You need JavaScript enabled to view it.

AutoGrid Flex enables the 25MW/25MWh system to regulate frequency and support stability of French transmission grid

REDWOOD CITY, Calif.--(BUSINESS WIRE)--AutoGrid, the market leader in AI-powered flexibility management software for the energy industry, deploys award-winning AutoGrid Flex™ Virtual Power Plant (VPP) platform to provide frequency regulation capabilities to Total SE for its largest battery-based energy storage project in France, a 25MW/25MWh lithium-ion system at the Flandres Center in Dunkirk’s port district.


The AutoGrid Flex integrated flexibility management suite enables the system to provide stability to the French power grid in real time (less than 500 milliseconds) and supports Total’s participation in Europe’s Frequency Containment Reserves (FCR) market. AutoGrid Flex controls the project’s end-to-end market reserve purchasing from Reseau Transport Electricité (RTE), the electricity transmission system operator of France. Currently in operation, the €15 million system is based on Saft’s Intensium® Max 20 High Energy solution with 11 integrated 2.3 MWh containers.

Tapping the AutoGrid platform for this milestone project has allowed us to bring for more flexibility on France’s power grid, enabling a more stable and reliable network, and opening up new opportunities in the FCR market,” said Jean-Marc Simandoux, VP Front Office, Trading Division, Gas Renewables & Power at Total. “Our prior work utilizing AutoGrid’s platform, and the company’s successful track record of project delivery on this project, assures us we’re tapping a power trading market-leading partner.”

Total Flex will operate the largest battery on the FCR market and monetize capacity accounting for up to 3% of the French market (total size of 650MW).

We’re proud to provide the technical foundation for this pioneering deployment for the European grid and for batteries’ participation in frequency regulation markets worldwide,” said Amit Narayan, Founder & CEO, AutoGrid. “Working with an energy major like Total, provides significant thrust to our efforts of accelerating the deployment of storage and renewable energy across the globe.”

Total has also been a minority investor in AutoGrid through its corporate venture capital arm Total Carbon Neutrality Ventures since 2016, thus supporting early on AutoGrid’s vision of smart energy networks.

About AutoGrid:

AutoGrid builds AI-powered software solutions that enable a smarter energy world. The company’s suite of flexibility management applications allows utilities, electricity retailers, renewable energy project developers and energy service providers to deliver clean, affordable and reliable energy by managing networked distributed energy resources (DERs) in real time, at scale through different value streams. AutoGrid’s flagship application, AutoGrid Flex, is ranked as the #1 Virtual Power Plant Platform in the world according to the global ranking published in 2020 by industry-leading research and analysis firm Guidehouse (formerly, Navigant Research).


Contacts

Media
AutoGrid
Leo Traub
Antenna Group for AutoGrid
This email address is being protected from spambots. You need JavaScript enabled to view it.

Company will initially focus on developing, growing LNG market in Latin America and Asia

LNG storage and regasification veteran Rob Bryngelson named WaveCrest CEO

HOUSTON--(BUSINESS WIRE)--Macquarie Capital, the corporate advisory, capital markets, and principal investing arm of Macquarie Group, today announced the launch of WaveCrest Energy, LLC (“WaveCrest”), a platform that will develop, construct, own and operate liquefied natural gas (“LNG”) regasification, power and downstream infrastructure assets.

WaveCrest delivers end-to-end project solutions — from early-stage development through project financing, construction and commercial operation – as well as subsequent project expansions. With flexible capital, development and financing capabilities, technical and operational expertise and physical commodity solutions, WaveCrest is uniquely positioned to integrate activities across the LNG value chain, such as: gas supply, liquefaction, LNG supply, regasification, power generation and downstream services.

The company will initially focus on serving Latin American and Asian markets and seek to establish and grow market demand for natural gas by providing greater access to the relatively low-cost fuel source that also has lower carbon emissions than coal and fuel oils. It will support reduced direct emissions by enabling fuel switching to natural gas, which will serve as a natural complement to the growing penetration of renewable energy.

WaveCrest is led by CEO Rob Bryngelson, former co-founder and CEO of Excelerate Energy, which pioneered the use of floating storage and regasification units. Bryngelson has over 20 years of experience in delivering successful projects and developing new markets for natural gas imports. He will blend his experience and innovation with Macquarie Capital’s deep energy infrastructure expertise, financing capabilities and Macquarie Group’s access to natural gas and LNG supply through its Commodities and Global Markets group.

Global energy demand growth, coupled with an increasing focus on climate change, positions natural gas as a key energy source in the transition to a low-carbon energy future,” Bryngelson said. “WaveCrest is designed to bring natural gas to underserved markets around the world through innovative and flexible LNG projects, delivering a cleaner fuel source for both existing and incremental needs.”

We are excited to partner with a proven management team, with a track record of delivering innovative, industry-first solutions, to support global energy security and further enable the energy transition in developing markets around the world,” said Nicholas Gole, Senior Managing Director at Macquarie Capital. “Macquarie will lend its insights and capabilities across various aspects of energy infrastructure to help WaveCrest serve its customers and deliver on its goals.”

About WaveCrest Energy

WaveCrest Energy provides a full suite of LNG project solutions to accelerate market adoption and successfully deliver LNG projects. WaveCrest takes an integrated development approach and considers all opportunities across the LNG spectrum, from production to consumption, to bridge the gap between supply and demand. With this approach, WaveCrest can adapt to changing dynamics and tailor its solutions to unique market needs, while capturing incremental sources of value and growth while delivering reliable, sustainable and profitable LNG projects. For further information visit wavecrestenergy.com

About Macquarie Capital

Macquarie Capital is the corporate advisory, capital markets and principal investment arm of Macquarie Group. Macquarie Capital has been a pioneer and global market leader in the infrastructure sector for over three decades. Macquarie Capital’s Energy Principal team provides flexible capital across the project lifecycle of energy infrastructure projects, from development through operations, to unlock value and enable growth. Macquarie Capital currently has over $25 billion of infrastructure projects currently under construction or development. For further information visit www.macquarie.com


Contacts

David Franecki
+1 212 231 1310
This email address is being protected from spambots. You need JavaScript enabled to view it.

Redwood to expand technology capabilities and digital freight marketplace access with Blue Yonder’s dynamic price discovery service

CHICAGO & SCOTTSDALE, Ariz.--(BUSINESS WIRE)--#AI--Redwood Logistics (Redwood), one of the fastest-growing supply chain and logistics companies in North America, launches its real-time Rating API offering and announces the solution’s integration with Blue Yonder’s dynamic price discovery service. This connection will expose instant truckload rates to any customer directly within their TMS (or any other application), providing guaranteed capacity and superior buying capabilities to shippers of all sizes.


Redwood’s Rating API solution uses algorithmic load matching to provide customers with on-demand pricing and booking using a real-time API connection that integrates directly into existing transportation management systems (TMS). The Rating API adds another asset to Redwood’s integrated LPaaS (Logistics Platform as a Service) model, which connects its customers to the best industry solutions, services, people and technology via RedwoodConnect™. RedwoodConnect™ is a proprietary, turnkey supply chain integration platform-as-a-service (iPaaS) designed to streamline the most complex integration cases.

“Our Rating API is the latest result from Redwood’s overall mission, to simplify connections and bridge communications between a company’s disparate technology platforms to improve operations,” said Michael Reed, Chief Product Officer, Redwood Logistics. “Perhaps most importantly, in addition to providing superior speed—the solution allows our customers to quote and book in a matter of seconds—the product is built on top of our proprietary, machine learning pricing module that delivers reliable service and guaranteed capacity for our shippers.”

Blue Yonder’s dynamic price discovery provides real-time digital connectivity for freight management, reducing shipping costs, and increasing profitability for shippers and freight carriers. The dynamic price discovery service is part of the Blue Yonder Network, built on the Blue Yonder Luminate™ Platform, powered by Microsoft Azure. The Luminate Platform combines data from both internal and external sources—spanning shippers’ digital supply chain ecosystems—to leverage both artificial intelligence and machine learning, enabling smarter and more actionable business decisions.

“Working with a tech-forward company like Redwood Logistics to integrate our dynamic price discovery with their RedwoodConnect platform helps save shippers significant time and money while also providing faster speed to automation, improved visibility and better control. The integration will also drive more volume for Redwood Logistics, which is celebrating 20 years of innovation as it looks to continue to grow,” said Terry Norton, vice president, 3PL & Transportation, Blue Yonder.

Backed by Redwood’s 20 years of supply chain experience, the Rating API connects customers with Redwood’s prebuilt, robust carrier and private capacity networks, enabling one-click access to hundreds of carriers with a drag and drop functionality that delivers speed, security and scalability.

For more information on Redwood’s Rating API, please visit https://www.redwoodlogistics.com/service/move/rating-api/.

For more information on Blue Yonder’s dynamic price discovery service, please visit https://blueyonder.com/knowledge-center/collateral/dynamic-price-discovery-solution-sheet and https://blueyonder.com/knowledge-center/collateral/dynamic-freight-management-white-paper.

About Blue Yonder

Blue Yonder is the world leader in digital supply chain and omni-channel commerce fulfillment. Our intelligent, end-to-end platform enables retailers, manufacturers and logistics providers to seamlessly predict, pivot and fulfill customer demand. With Blue Yonder, you can make more automated, profitable business decisions that deliver greater growth and re-imagined customer experiences. Blue Yonder - Fulfill your Potential™ blueyonder.com

“Blue Yonder” is a trademark or registered trademark of Blue Yonder Group, Inc. Any trade, product or service name referenced in this document using the name “Blue Yonder” is a trademark and/or property of Blue Yonder Group, Inc. All other company and product names may be trademarks, registered trademarks or service marks of the companies with which they are associated.

About Redwood Logistics

Redwood Logistics, a leading logistics platform company headquartered in Chicago, has provided solutions for moving and managing freight for more than 18 years. The company’s diverse portfolio includes digital freight brokerage, flexible freight management, and innovative platform services that simplify integrating disparate supply chain technology. Redwood Logistics connects its distinct roster of customers to the power of supply chain management, technology, and the industry’s brightest minds. For more information, connect with us by visiting our website.


Contacts

Redwood Media Inquiries:
Allison Mills
LeadCoverage
This email address is being protected from spambots. You need JavaScript enabled to view it.
706-200-2148

Blue Yonder Media Inquiries:
Marina Renneke, APR
Blue Yonder
This email address is being protected from spambots. You need JavaScript enabled to view it.
480-308-3037

Offshore Source Logo

Offshore Source keeps you updated with relevant information concerning the Offshore Energy Sector.

Any views or opinions represented on this website belong solely to the author and do not represent those of the people, institutions or organizations that Offshore Source or collaborators may or may not have been associated with in a professional or personal capacity, unless explicitly stated.

Corporate Offices

Technology Systems Corporation
8502 SW Kansas Ave
Stuart, FL 34997

info@tscpublishing.com