Business Wire News

ABS Group-sponsored survey reports 45% of participants estimate threats to their control systems are at high risk with another 15% rating threat as severe/critical

Front-line managers and senior leadership are not aligned on potential risk

HOUSTON--(BUSINESS WIRE)--#ABSGroup--ABSG Consulting Inc. (ABS Consulting), a leading global risk management company, today announced the results of a new survey from SANS Institute, Threat-Informed Operational Technology Defense: Securing Data vs. Enabling Physics.” The ABS Group-sponsored research reveals that cyber attackers have demonstrated a robust understanding of operational technology (OT) and industrial control system (ICS) engineering and have conducted attacks that gain access and negatively impact operations and human safety.


This research concludes that industrial control systems can no longer be ignored,” said Ian Bramson, Global Head of Industrial Cybersecurity at ABS Group. “Organizations that take a ‘copy and paste’ approach to applying IT security tools, processes and best practices into an OT/ICS environment can expect problematic consequences.”

Key findings include:

Gap in Perception around ICS Risks at Different Levels within the Organization

  • 61% of survey participants indicate a gap exists in the perception of cybersecurity risk to their ICS facilities between OT/ICS cybersecurity front-line teams and other parts of the organization.
    • Of these, 35% indicate the gap is between senior management and the OT/ICS cybersecurity front-line teams.

Ransomware is the Biggest Threat to OT

  • The industrial community is seeing ransomware with increasingly sophisticated variants that have the capability to cause more disruption to system assets and process flows.
    • When asked about the threat categories of most concern, 50% of respondents place ransomware at the top.
    • Targeting ICS operations using ransomware is a goal of the adversary as targeting ICS operations can lead to higher and quicker payouts.

ICS Security Resources are Challenged, Even more so than IT

  • Security teams are commonly resource-challenged in IT, but even more so in ICS, where additional security and engineering knowledge is required to perform effective ICS active cyber defense.
    • 47% of ICS organizations do not have internal dedicated 24/7 ICS security response resources to manage OT/ICS incidents, and just a slightly lower percentage (46%) of ICS organizations do have this function, leaving 7% unsure of their current state.
    • OT/ICS security managers can improve their security program and lead their teams to success by allocating resources through new hires, changing internal roles to focus exclusively on ICS security or outsourcing to MSSP support services.

ICS System and Network Visibility Warrants Improvement, Investments are Planned

  • 65% indicate their visibility is limited for control systems, while only 22% have visibility needed to defend against modern threats, and 7% have no visibility into their control systems.
  • Increased visibility into control system assets (52%) and implementing ICS-specific network security monitoring (NSM) for control systems (51%) rank as the top two budgeted initiatives for organizations within the next 18 months.

"Critical infrastructure is targeted by cyber adversaries who have demonstrated their knowledge and desire to cause real-world consequences from cyber-attacks. ICS/OT facilities are advised to establish, maintain and mature an ICS Active Cyber Defense,” said Dean Parsons, Lead Researcher and Certified Instructor, SANS Institute. “Specifically, facilities must ensure ICS/OT defenders have knowledge of their control systems, the evolving threat landscape and, with ICS network visibility, monitor for abnormal events in control system network traffic. Managers and leaders responsible for ICS/OT must understand, embrace the IT/OT differences and support their ICS defense teams with security controls specific to control systems that priority safety."

For more information and to view the full survey of nearly 300 security technology professionals, please visit ABS Group. Join our webinar, Threat-Informed Operational Technology (OT) Defense, on March 8, 2022, hosted by The SANS Institute, to discuss the current views of OT and ICS cyber defense and review conclusions from the research.

About SANS Institute
The SANS Institute was established in 1989 as a cooperative research and education organization. Today, SANS is the most trusted and, by far, the largest provider of cybersecurity training and certification to professionals in government and commercial institutions world-wide. Renowned SANS instructors teach more than 60 courses at in-person and virtual cybersecurity events and on demand. At the heart of SANS are the many security practitioners, representing varied global organizations from corporations to universities, working together to support and educate the global information security community. www.sans.org

About ABS Group
ABS Group of Companies, Inc. (ABS Group) is a wholly-owned subsidiary of American Bureau of Shipping and provides data-driven risk and reliability solutions and technical services that help clients verify the safety, integrity, quality and efficiency of critical assets and operations. Headquartered in Spring, Texas, ABS Group operates with more than 1,000 professionals in over 20 countries serving the marine and offshore, oil, gas and chemical, government, power and energy and industrial sectors.


Contacts

For more information, contact:
Loren Guertin
ABS Group Media Relations
This email address is being protected from spambots. You need JavaScript enabled to view it.

LEAWOOD, KS--(BUSINESS WIRE)--This notice provides stockholders of Tortoise Pipeline & Energy Fund, Inc. (NYSE: TTP) and Tortoise Power and Energy Infrastructure Fund, Inc. (NYSE: TPZ) with information regarding the distributions paid on February 28, 2022 and cumulative distributions paid fiscal year-to-date.


The following table sets forth the estimated amounts of the current distributions, payable February 28, 2022 and the cumulative distributions paid this fiscal year to date from the following sources: net investment income, net realized short-term capital gains, net realized long-term capital gains and return of capital. All amounts are expressed per common share.

Tortoise Pipeline & Energy Fund, Inc.

Estimated Sources of Distributions


($) Current
Distribution


% Breakdown
of the Current
Distribution


($) Total Cumulative
Distributions for the
Fiscal Year to Date


% Breakdown of the
Total Cumulative
Distributions for the
Fiscal Year to Date

Net Investment Income

0.1267

21%

0.1267

21%

Net Realized Short-Term Capital Gains

0.0000

0%

0.0000

0%

Net Realized Long-Term Capital Gains

0.0000

0%

0.0000

0%

Return of Capital

0.4633

79%

0.4633

79%

Total (per common share)

0.5900

100%

0.5900

100%

Average annual total return (in relation to NAV) for the 5 years ending on 1/31/2022

-13.53%

Annualized current distribution rate expressed as a percentage of NAV as of 1/31/2022

7.54%


Cumulative total return (in relation to NAV) for the fiscal year through 1/31/2022

12.02%

Cumulative fiscal year distributions as a percentage of NAV as 1/31/2022

1.88%

Tortoise Power and Energy Infrastructure Fund, Inc.

Estimated Sources of Distributions


($) Current
Distribution


% Breakdown
of the Current
Distribution


($) Total Cumulative
Distributions for the
Fiscal Year to Date


% Breakdown of the
Total Cumulative
Distributions for the
Fiscal Year to Date

Net Investment Income

0.0297

28%

0.0636

28%

Net Realized Short-Term Capital Gains

0.0000

0%

0.0000

0%

Net Realized Long-Term Capital Gains

0.0000

0%

0.0000

0%

Return of Capital

0.0753

72%

0.1614

72%

Total (per common share)

0.1050

100%

0.2250

100%

Average annual total return (in relation to NAV) for the 5 years ending on 1/31/2022

-1.22%

Annualized current distribution rate expressed as a percentage of NAV as of 1/31/2022

7.94%


Cumulative total return (in relation to NAV) for the fiscal year through 1/31/2022

5.98%

Cumulative fiscal year distributions as a percentage of NAV as of 1/31/2022

1.42%

You should not draw any conclusions about TTP’s or TPZ’s investment performance from the amount of this distribution or from the terms of TTP’s and TPZ’s distribution policies.

TTP and TPZ estimate that they have distributed more than their income and net realized capital gains; therefore, a portion of your distribution may be a return of capital. A return of capital may occur, for example, when some or all of the money that you invested in TTP and/or TPZ is paid back to you. A return of capital distribution does not necessarily reflect TTP’s and/or TPZ’s investment performance and should not be confused with “yield” or “income.”

The amounts and sources of distributions reported are only estimates and are not being provided for tax reporting purposes. The actual amounts and sources of the amounts for tax reporting purposes will depend upon TTP’s and TPZ’s investment experience during the remainder of their fiscal years and may be subject to changes based on tax regulations. TTP and/or TPZ will send you a Form 1099-DIV for the calendar year that will tell you how to report these distributions for federal income tax purposes.

Tortoise Capital Advisors is the Adviser to the Tortoise Pipeline & Energy Fund, Inc. and the Tortoise Power and Energy Infrastructure Fund, Inc.

For additional information on these funds, please visit cef.tortoiseecofin.com.

About Tortoise

Tortoise focuses on energy & power infrastructure and the transition to cleaner energy. Tortoise’s solid track record of energy value chain investment experience and research dates back more than 20 years. As one of the earliest investors in midstream energy, Tortoise believes it is well-positioned to be at the forefront of the global energy evolution that is underway. With a steady wins approach and a long-term perspective, Tortoise strives to make a positive impact on clients and communities. To learn more, please visit www.TortoiseEcofin.com.

Cautionary Statement Regarding Forward-Looking Statements

This press release contains certain statements that may include “forward-looking statements” within the meaning of Section 27A of the Securities Act of 1933 and Section 21E of the Securities Exchange Act of 1934. All statements, other than statements of historical fact, included herein are “forward-looking statements.” Although the funds and Tortoise Capital Advisors believe that the expectations reflected in these forward-looking statements are reasonable, they do involve assumptions, risks and uncertainties, and these expectations may prove to be incorrect. Actual results could differ materially from those anticipated in these forward-looking statements as a result of a variety of factors, including those discussed in the fund’s reports that are filed with the Securities and Exchange Commission. You should not place undue reliance on these forward-looking statements, which speak only as of the date of this press release. Other than as required by law, the funds and Tortoise Capital Advisors do not assume a duty to update this forward-looking statement.

Safe Harbor Statement

This press release shall not constitute an offer to sell or a solicitation to buy, nor shall there be any sale of these securities in any state or jurisdiction in which such offer or solicitation or sale would be unlawful prior to registration or qualification under the laws of such state or jurisdiction.


Contacts

For more information contact Jen Ashlock at (913) 981-1020 or This email address is being protected from spambots. You need JavaScript enabled to view it.

Platform Gives Shippers and Carriers On-demand Access to Multimodal Logistics Network and Services via Single Connection


​ATLANTA--(BUSINESS WIRE)--#Carrier--Transportation Insight Holding Company ("TI Holding Company" or "the Company"), a leading provider of non-asset, tech-enabled logistics and brokerage solutions in North America, today announced the launch of its Beon™ digital logistics platform. This platform provides shippers and carriers with a single point of access to Transportation Insight (TI) & Nolan Transportation Group’s (NTG) logistics network and services – from port to porch. ​

​“In today’s challenging supply chain environment, shippers and carriers need a technology solution that goes beyond point-to-point and single-mode transportation,” said Ken Beyer, CEO, TI Holding Company. “Beon provides businesses of all sizes and freight types with the modern tools they need to thrive in the new supply chain.”​

​Beon was built by logistics experts leveraging proprietary technology and advanced machine learning algorithms to match demand to a capacity network of over 850,000 drivers in real-time, at the right price. TI & NTG’s combined team of 2,500 professionals utilize the platform today to manage over $15 billion in logistics spend, from the first to the final mile across all modes, including drayage, truckload, less-than-truckload, expedited and parcel. Beon now gives shippers and carriers direct access to TI & NTG’s digital freight, parcel and warehousing networks via API, web and mobile applications.​

​“The modern technology and data science we’ve leveraged internally across TI and NTG has catapulted our business forward,” said Brian Work, CTO, TI Holding Company. “Our team of logistics experts rely on Beon today to manage and execute millions of transactions on behalf of our customers. By extending our proprietary technology directly to shippers and carriers, they can leverage our scale and data intelligence to grow their business on a proven platform.”

​Geoff Kelley, President and COO, TI Holding Company, added, “Beon is not just another stand-alone software solution that single-mindedly matches freight based on algorithms. It is the result of a deliberate strategy and the significant investments we’ve made to acquire and build the best technology and data products, integrated with expert-led services, required to solve complex supply chain issues from port to porch.” ​

​​To learn more about the Beon digital logistics platform or TI and NTG’s full portfolio of supply chain solutions, visit www.transportationinsight.com and www.ntgfreight.com.

TI Holding Company is a portfolio company of Gryphon Investors, a leading private equity firm focused on profitably growing and competitively enhancing middle-market companies in partnership with experienced management.

About Transportation Insight Holding Company

Transportation Insight Holding Company (TI Holding Company) is the parent company of industry leading 3PL logistics providers Transportation Insight (TI) and Nolan Transportation Group (NTG). TI Holding Company brings over two decades of multi-modal expertise and technology to the logistics industry and ranks amongst North America’s top 10 largest logistics companies. TI Holding Company services more than 10,000 shippers and over 80,000 carriers through its proprietary Beon™ digital logistics platform – a single point of access to TI and NTG’s mode-agnostic network and services. The TI Holding Company services and digital product portfolio spans across North America, offering domestic freight and parcel transportation solutions, warehousing, data intelligence, and supply chain consulting. For more information about TI Holding Company, visit www.TIholdco.com.


Contacts

Ryan Rogers, TI Holding Company, 770-373-0480, This email address is being protected from spambots. You need JavaScript enabled to view it.

NEW YORK--(BUSINESS WIRE)--New Fortress Energy Inc. (NASDAQ: NFE) (“NFE” or the “Company”) today reported its financial results for the fourth quarter and full year 2021.


Fourth Quarter Highlights

Financial results

  • NFE is pleased to report our highest quarterly and annual net income and EPS in our history
    • Net income of over $151 million and EPS of $0.72 per share on a fully diluted basis for Q4 2021
    • Net income of over $92 million and EPS of $0.47 per share on a fully diluted basis for the year ended December 31, 2021
  • NFE is adopting Adjusted EBITDA as our new financial performance measure
    • Adjusted EBITDA(4) increased almost 100% over the previous quarter to approximately $334 million in Q4 2021 from $170 million in Q3 2021
    • Adjusted EBITDA was over $604 million for the year ended December 31, 2021

Business update

  • Robust LNG sales and power revenues produced record revenues in Q4 and FY 2021
  • Signed 10 new commercial contracts in 2021 including:
    • ~30 TBtu, 15-year supply agreement replacing oil-based fuel at Norsk Hydro’s Alunorte alumina refinery with gas to be supplied from our Barcarena Terminal in Brazil
    • Gas supply agreement with CFEnergia supplied from our La Paz, Mexico terminal for the fuel supply of two power plants in Baja California Sur, Mexico
  • Elevated and volatile commodity market environment creates significant tailwinds for NFE’s business
  • Our development projects in Nicaragua and Brazil are advancing on schedule
    • Nicaragua power plant is fully complete and awaiting First Gas (2)
    • Construction of the Barcarena offshore terminal, its associated pipeline and citygate are significantly advanced and the marine terminal at near physical completion
    • Construction at our Santa Catarina Terminal is significantly advanced, with onshore and offshore pipeline laying already commenced, the FSRU approaching drydocking and the terminal projected to be ready for FSRU mooring in early Q2 2022
  • NFE has signed a term sheet (5) with Transnet Port Terminals, a division of Transnet SOC Limited, for use of a marine berth for a large ship in Richards Bay, South Africa

Fast LNG update

  • Executed HOA for deployment of our first Fast LNG asset scheduled for Q2 2023 with Eni S.p.A.’s fully owned subsidiary, Eni Congo (“Eni”)(6)
    • FLNG 1 will be deployed on Eni’s Marine 12 project offshore of The Republic of Congo; NFE will receive a combination of a tolling fee for the next 20 years plus the right to purchase 50% of the LNG created(6)
  • We have taken FID(3) on our second Fast LNG unit which is expected to be placed into service in Q3 2023
    • This asset will utilize the same modularized liquefaction technology as our FLNG 1 asset and have a nameplate capacity of 1.4 mtpa
    • NFE has also purchased two marine assets that can be used as the operational base for FLNG 2 and future FLNG assets

LNG supply

  • During 2021 NFE purchased over 0.75 mtpa of additional annual supply taking us to over 2.4 mtpa which fully covers estimated downstream demand through 2026
  • In addition, we are actively looking to add long-term volumes from US producers to best match long-term demand in high-growth markets.

Energy transition

  • We are making significant progress in the development of our clean hydrogen business, NFE Zero Parks
  • We are nearing FID(3) on our first NFE Zero Parks facility, a 100MW green hydrogen facility expected to be one of the largest of its kind in the United States
  • We expect to capitalize NFE Zero Parks to fund development of a portfolio of clean hydrogen projects, our next step in building the world’s leading energy transition company

Financing update

  • Expanded access to capital to fund our developments
    • Issuing up to $285 million of bonds in Jamaica, $160 million funded to date
    • Expanding revolver capacity by up to $200 million
    • Achieved a credit rating upgrade to BB-
  • Exploring financing alternatives, including assets sales that will allow us to redeploy capital at significantly higher yields
  • Our Board of Directors approved a dividend of $0.10 per share, with a record date of March 18, 2022 and a payment date of March 29, 2022

Financial Highlights


Three Months Ended


Year Ended

(in millions, except Average Volumes)

September 30, 2021


December 31, 2021


December 31, 2021

Revenues

$304.7


$648.6


$1,322.8

Net (loss) income

($17.8)


$151.7


$92.7

Terminals and Infrastructure Segment Operating Margin(1)

$115.7


$278.4


$481.2

Ships Segment Operating Margin(1)

$94.8


$94.8


$265.2

Total Segment Operating Margin(1)

$210.5


$373.2


$746.4

Adjusted EBITDA(4)

$169.9


$334.0


$604.6

Average Volumes (k GPD)

2,051


2,881


2,005

  • Record quarterly revenue of over $648mm, increasing approximately $344mm from the third quarter; revenue for the year ended December 31, 2021 was over $1.3 billion
  • Adjusted EBITDA(4) of approximately $334 million in Q4. Record quarterly Total Segment Operating Margin(1) of approximately $373 million, resulting from:
    • Terminals and Infrastructure Segment Operating Margin increased due to the impact of increased natural gas pricing and LNG cargo sales
    • Consistent contribution from Ships Segment Operating Margin from Q3 2021
  • Annual Adjusted EBIDTA(4) of over $604 million and Annual Total Segment Operating Margin(1) of over $746 million
    • Record Terminals and Infrastructure Segment Operating Margin(1) led by LNG cargo sales and the inclusion of the results of our investment in the Sergipe Power Plant acquired as part of the acquisition of Hygo Energy Transition Limited (“Hygo”) in the second quarter of 2021.
    • Our Ships Segment, acquired in the acquisitions of Golar LNG Partners Limited (“GMLP”) and Hygo in the second quarter of 2021, contributed $265 million to Total Segment Operating Margin(1)

Please refer to our Q4 2021 Investor Presentation (the “Presentation”) for further information about the following terms:

1) “Total Segment Operating Margin” is the total of our Terminals and Infrastructure Segment Operating Margin and Ships Segment Operating Margin. Terminals and Infrastructure Segment Operating Margin includes our effective share of revenue, expenses and operating margin attributable to our 50% ownership of Centrais Elétricas de Sergipe Participações S.A. (“CELSEPAR”). Ships Segment Operating Margin includes our effective share of revenue, expenses and operating margin attributable to our ownership of 50% of the common units of Hilli LLC. Hilli LLC owns Golar Hilli Corporation (“Hilli Corp”), the disponent owner of the Hilli.

2) “First Gas” means the date on which (or, for future dates, management's current estimate of the date on which) natural gas is first made available to our projects, including our facilities in development. Full commercial operations of such projects will occur later than, and may occur substantially later than, the First Gas date. We cannot assure you if or when such projects will reach the date of delivery of First Gas, or full commercial operations. Actual results could differ materially from the illustration and there can be no assurance we will achieve our goal.

3) “FID” means management has made an internal commitment to commit resources (including capital) to a particular project. Our management has not made an FID decision on certain projects as of the date of this press release, and there can be no assurance that we will be willing or able to make any such decision, based on a particular project’s time, resource, capital and financing requirements.

4) “Adjusted EBITDA” see definition and reconciliation of this non-GAAP measure in the exhibits to this press release.

5) NFE’s term sheet with Transnet Port Terminals is subject to entering into definitive agreements.

6) NFE’s project with Eni is subject to entering into definitive agreements.

Additional Information

For additional information that management believes to be useful for investors, please refer to the presentation posted on the Investors section of New Fortress Energy’s website, www.newfortressenergy.com, and the Company’s most recent Annual Report on Form 10-K, which is available on the Company’s website. Nothing on our website is included or incorporated by reference herein.

Earnings Conference Call

Management will host a conference call on Tuesday, March 1, 2022 at 8:00 A.M. Eastern Time. The conference call may be accessed by dialing (866) 953-0778 (from within the U.S.) or (630) 652-5853 (from outside of the U.S.) fifteen minutes prior to the scheduled start of the call; please reference “NFE Fourth Quarter 2021 Earnings Call."

A simultaneous webcast of the conference call will be available to the public on a listen-only basis at www.newfortressenergy.com. Please allow extra time prior to the call to visit the website and download any necessary software required to listen to the internet broadcast.

A replay of the conference call will be available after 11:00 A.M. Eastern Time on March 1, 2022 through 11:00 A.M. Eastern Time on March 8, 2022 at (855) 859-2056 (from within the U.S.) or (404) 537-3406 (from outside of the U.S.), Passcode: 2763528.

About New Fortress Energy Inc.

New Fortress Energy Inc. (NASDAQ: NFE) is a global energy infrastructure company founded to help accelerate the world’s transition to clean energy. The company funds, builds and operates natural gas infrastructure and logistics to rapidly deliver fully integrated, turnkey energy solutions that enable economic growth, enhance environmental stewardship and transform local industries and communities.

Cautionary Statement Concerning Forward-Looking Statements

Certain statements contained in this press release constitute “forward-looking statements” including our expected volumes of LNG and our ability to supply LNG and natural gas in the future, including under our definitive agreements, such as the agreements with Norsk Hydro and CFEnergia; current elevated and volatile commodity market environment creating significant tailwinds for NFE’s business; expected First Gas date for our Nicaragua Power Plant; completion of construction and commissioning of our Nicaragua and Brazil projects; ability to maintain our expected development timelines; our ability to finalize and execute definitive agreements in connection with our term sheet with Transnet Port Terminals; our ability to finalize and execute definitive agreements with Eni and to fulfill all of the conditions precedent to effectiveness under our HOA; expectations regarding our benefits from our Fast LNG asset and ability to use our current assets for our Fast LNG project; expectations regarding our ability to place our Fast LNG asset into service within our expected timeline; our ability to match our LNG supply and demand profile; our expected needs for LNG supply in the future; our ability to reach FID on our NFE Zero Parks facility; capitalization of NFE Zero Parks; and the implementation and success of our financing alternatives, including any asset sales. You can identify these forward-looking statements by the use of forward-looking words such as “expects,” “may,” “will,” “approximately,” “predicts,” “intends,” “plans,” “estimates,” “anticipates,” or the negative version of those words or other comparable words. These forward-looking statements represent the Company’s expectations or beliefs concerning future events, and it is possible that the results described in this press release will not be achieved. These forward-looking statements are subject to risks, uncertainties and other factors, many of which are outside of the Company’s control, that could cause actual results to differ materially from the results discussed in the forward-looking statements. Factors that could cause or contribute to such differences include, but are not limited to: the risk that the volumes we are able to sell are less than we expect due to decreased customer demand or our inability to supply; our ability to successfully benefit from current elevated and volatile commodity market environment; the risk that our development, construction or commissioning of our facilities will take longer than we expect; the risk that we may not develop our Fast LNG project on the timeline we expect or at all, or that we do not receive the benefits we expect from the Fast LNG project; cyclical or other changes in the demand for and price of LNG and natural gas; the risk that the foregoing or other factors negatively impact our liquidity and our ability to capitalize our projects; and the risk that we may be unable to implement our financing strategy or to effectively leverage our assets. Accordingly, readers should not place undue reliance on forward-looking statements as a prediction of actual results.

Any forward-looking statement speaks only as of the date on which it is made, and, except as required by law, the Company does not undertake any obligation to update or revise any forward-looking statement, whether as a result of new information, future events or otherwise. New factors emerge from time to time, and it is not possible for the Company to predict all such factors. When considering these forward-looking statements, you should keep in mind the risk factors and other cautionary statements included in the Company’s annual and quarterly reports filed with the SEC, which could cause its actual results to differ materially from those contained in any forward-looking statement.

Exhibits – Financial Statements

Condensed Consolidated Statements of Operations

For the three months ended September 20, 2021 and December 31, 2021

(Unaudited, in thousands of U.S. dollars, except share and per share amounts)


For the Three Months Ended


September 30,

2021

December 31,

2021

Revenues


Operating revenue


$

188,389


548,395


Vessel charter revenue


78,656


87,592


Other revenue


37,611


12,644


Total revenues


304,656


648,631


Operating expenses


Cost of sales


135,432


282,477


Vessel operating expenses


15,301


20,976


Operations and maintenance


20,144


18,356


Selling, general and administrative


46,802


74,927


Transaction and integration costs


1,848


2,107


Depreciation and amortization


31,194


30,297


Total operating expenses


250,721


429,140


Operating income


53,935


219,491


Interest expense


57,595


46,567


Other (income), net


(5,400

)


(3,692

)

Loss on extinguishment of debt, net


-


10,975


Net income before income from equity method investments and income taxes


1,740


165,641


Loss from equity method investments


(15,983

)


(8,515

)

Tax provision


3,526


5,403


Net (loss) income


(17,769

)


151,723


Net loss (income) attributable to non-controlling interest


7,963


(866

)


Net (loss) income attributable to stockholders


$

(9,806

)


150,857


Net (loss) income per share – basic


$

(0.05

)


$

0.73


Net (loss) income per share – diluted


$

(0.05

)


$

0.72


Weighted average number of shares outstanding – basic


207,497,013


207,479,963


Weighted average number of shares outstanding – diluted


207,497,013


210,511,076


Adjusted EBITDA

For the three months ended December 31, 2021

(Unaudited, in thousands of U.S. dollars)

Adjusted EBITDA is not a measurement of financial performance under GAAP and should not be considered in isolation or as an alternative to income/(loss) from operations, net income/(loss), cash flow from operating activities or any other measure of performance or liquidity derived in accordance with GAAP. We believe this non-GAAP measure, as we have defined it, offers a useful supplemental view of the overall operation of our business in evaluating the effectiveness of our ongoing operating performance in a manner that is consistent with metrics used for management’s evaluation of the Company’s overall performance and to compensate employees. We believe that Adjusted EBITDA is widely used by investors to measure a company’s operating performance without regard to items such as interest expense, taxes, depreciation, and amortization which vary substantially from company to company depending on capital structure, the method by which assets were acquired and depreciation policies. Further, we exclude certain items from our SG&A not otherwise indicative of ongoing operating performance.

We calculate Adjusted EBITDA as net loss, plus transaction and integration costs, contract termination charges and loss on mitigations sales, depreciation and amortization, interest expense (net of interest income), other expense (income), net, loss on extinguishment of debt, changes in fair value of non-hedge derivative instruments and contingent consideration, tax expense, and adjusting for certain items from our SG&A not otherwise indicative of ongoing operating performance, including non-cash share-based compensation and severance expense, non-capitalizable development expenses, cost to pursue new business opportunities and expenses associated with changes to our corporate structure, plus our pro rata share of Adjusted EBITDA from unconsolidated entities, less the impact of equity in earnings (losses) of unconsolidated entities.

Adjusted EBITDA is mathematically equivalent to our Total Segment Operating Margin, as reported in the segment disclosures within our financial statements, minus Core SG&A, including our pro rata share of such expenses of unconsolidated entities. Core SG&A is defined as total SG&A adjusted for non-cash share-based compensation and severance expense, non-capitalizable development expenses, cost to pursue new business opportunities and expenses associated with changes to our corporate structure. Core SG&A excludes certain items from our SG&A not otherwise indicative of ongoing operating performance.

The principal limitation of this non-GAAP measure is that it excludes significant expenses and income that are required by GAAP to be recorded in our financial statements. Investors are encouraged to review the related GAAP financial measures and the reconciliation of the non-GAAP financial measure to our GAAP net income/(loss), and not to rely on any single financial measure to evaluate our business. Adjusted EBITDA does not have a standardized meaning, and different companies may use different Adjusted EBITDA definitions. Therefore, Adjusted EBITDA may not be necessarily comparable to similarly titled measures reported by other companies. Moreover, our definition of Adjusted EBITDA may not necessarily be the same as those we use for purposes of establishing covenant compliance under our financing agreements or for other purposes. Adjusted EBITDA should not be construed as alternatives to net income (loss) and diluted earnings (loss) per share attributable to New Fortress Energy, which are determined in accordance with GAAP.

The following table sets forth a reconciliation of net income (loss) to Adjusted EBITDA for the 3 months ended September 30, 2021 and December 31, 2021:


Three Months Ended

September 30, 2021


Three Months Ended

December 31, 2021


Year Ended

December 31, 2021


Total Segment Operating Margin

210,478


373,150


746,430


Less: Core SG&A (see definition above)


38,496


38,033


137,144


Less: Pro rata share of Core SG&A from unconsolidated entities


2,047


1,110


4,726


Adjusted EBITDA

169,935


334,007


604,560


Net (loss) income

$

(17,769

)


$

151,723


$

92,711


Add: Interest expense (net of interest income)


57,595


46,567


154,324


Add: Tax provision


3,526


5,403


12,461


Add: Depreciation and amortization


31,194


30,297


98,377


Add: SG&A items excluded from Core SG&A (see definition above)


8,306


36,894


62,737


Add: Transaction and integration costs


1,848


2,107


44,671


Add: Other (income), net


(5,400

)


(3,692

)


(17,150

)


Add: Changes in fair value of non-hedge derivative instruments and contingent consideration


2,316


472


2,788


Add: Loss on extinguishment of debt, net


-


10,975


10,975


Add: Pro rata share of Adjusted EBITDA from unconsolidated entities(1)


72,336


44,746


157,109


Less: (Income) loss from equity method investments


15,983


8,515


(14,443

)


Adjusted EBITDA

169,935


334,007


604,560


(1)

Includes the Company’s effective share of Adjusted EBITDA of CELSEPAR of $52,179 and $24,173 for the three months ended September 30, 2021 and December 31, 2021, respectively, and the Company’s effective share of the Adjusted EBITDA of Hilli LLC of $20,157 and $20,573 for the three months ended September 30, 2021 and December 31, 2021, respectively. Includes the Company’s effective share of Adjusted EBITDA of CELSEPAR of 99,512 for the period after the acquisition of Hygo Energy Transition Ltd through December 31, 2021, and the Company’s effective share of the Adjusted EBITDA of Hilli LLC of $57,597 for the period after the acquisition of Golar LNG Partners Limited through December 31, 2021.


Segment Operating Margin

(Unaudited, in thousands of U.S. dollars)


Performance of our two segments, Terminals and Infrastructure and Ships, is evaluated based on Segment Operating Margin. Segment Operating Margin reconciles to Consolidated Segment Operating Margin as reflected below, which is a non-GAAP measure. We define Consolidated Segment Operating Margin as GAAP net loss, adjusted for selling, general and administrative expense, transaction and integration costs, contract termination charges and loss on mitigation sales, depreciation and amortization, interest expense, other (income) expense, loss on extinguishment of debt, net, income from equity method investments and tax expense. Consolidated Segment Operating Margin is mathematically equivalent to Revenue minus Cost of sales minus Operations and maintenance minus Vessel operating expenses, each as reported in our financial statements.

Three Months Ended December 31, 2021
(in thousands of $)

Infrastructure and

Terminals (1)

Ships (2)

Total Segment

Consolidation and

Other (3)

Consolidated

Segment Operating Margin

$

278,354

$

94,796

$

373,150

$

(46,328

)

$

326,822


Less:
Selling, general and administrative


74,927


Transaction and integration costs


2,107


Depreciation and amortization


30,297


Interest expense


46,567


Other (income), net


(3,692

)

Loss from extinguishment of debt


10,975


Loss from equity method investments


8,515


Tax provision


5,403


Net income


151,723


(1) Terminals and Infrastructure includes the Company's effective share of revenues, expenses and operating margin attributable to 50% ownership of CELSEPAR. The losses attributable to the investment of $18,580 for the three months ended December 31, 2021 are reported in loss from equity method investments on the consolidated statements of operations and comprehensive income (loss). Terminals and Infrastructure does not include the unrealized mark-to-market loss on derivative instruments of $472 for the three months ended December 31, 2021 reported in Cost of sales.

(2) Ships includes the Company's effective share of revenues, expenses and operating margin attributable to 50% ownership of the Hilli Common Units. The earnings attributable to the investment of $10,065 for the three months ended December 31, 2021 are reported in loss from equity method investments on the condensed consolidated statements of operations and comprehensive income (loss).

(3) Consolidation and Other adjusts for the inclusion of the effective share of revenues, expenses and operating margin attributable to 50% ownership of CELSEPAR and Hilli Common Units in our segment measure and exclusion of the unrealized mark-to-market gain or loss on derivative instruments.


Contacts

IR and Media:
Brett Magill
This email address is being protected from spambots. You need JavaScript enabled to view it.


Read full story here

Dividend Finance adds Tigo Energy Intelligence residential solar solution to Approved Vendor List for U.S. solar installers.

CAMPBELL, Calif.--(BUSINESS WIRE)--Tigo Energy, Inc., the solar industry’s worldwide leader in Flex MLPE (Module Level Power Electronics), today announced that its Energy Intelligence (EI) residential solar solution has been added to the Approved Vendor List (AVL) for financial products at Dividend Finance, a leading national provider of technology-enabled financing solutions for renewable energy, energy-efficient upgrades, and general home improvement. In addition to the recent California Energy Commission (CEC) certification of the Tigo platform, this new financing option ensures that solar installers and homeowners have confidence in their decision to choose Tigo Energy for residential home energy management solutions.


“We listen to the market and are responsive to our customers to deliver true value to them,” said Eric White, CEO at Dividend Finance, on a recent episode of the Suncast podcast. By approving Tigo Energy’s EI solution for its AVL, Dividend Finance expands its installation partners’ suite of options in order to grow the United States residential solar market to meet consumer demand.

Dividend Finance allows its customers to secure financing through a comprehensive suite of financing options with a seamless process for clean energy and home improvement verticals. Additionally, Dividend Finance offers commercial property assessed clean energy (PACE), a public-private financing mechanism for energy efficiency, renewable energy, water conservation, and seismic upgrades on privately owned property.

“Dividend Finance is a pioneer in the residential solar business, and we are thrilled to see our Energy Intelligence solution on the company’s AVL,” said Jing Tian, chief growth officer at Tigo Energy. “This approval gives our U.S. solar installers a simple path to financing Tigo products, enabling yet another path for our growth and driving more clean solar energy into the market.”

The Tigo EI Residential solar-plus-storage product line allows for maximum flexibility in an integrated system that is easy to install, fast to commission, and convenient to maintain through the Tigo EI mobile app and a browser-based program. The platform provides energy production monitoring, system diagnostics, and remote software upgrades for streamlined operations and maintenance for Tigo installers. With industry-leading warranties on all hardware, homeowners and installers can rely on product performance and support from Tigo Energy over the life of their energy systems.

For inquiries, visit the Tigo ‘where to buy’ page or contact the sales team here. To learn more about Dividend Finance, listen to episode 406 of the Suncast podcast with Nico Johnson. To find out more about the Tigo Energy Intelligence residential solution or Tigo Flex MLPE products, please visit www.tigoenergy.com.

About Tigo Energy

Tigo Energy, the worldwide leader in Flex MLPE (Module Level Power Electronics), designs innovative solar power conversion and storage products that provide customers more choice and flexibility. The Tigo TS4 platform increases solar production, decreases operating costs, and enhances safety. When combined with the Tigo Energy Intelligence (EI) platform, it delivers module, system, and fleet-level insights to maximize solar performance and minimize operating costs. The Tigo EI Residential Solar Solution, a flexible solar-plus-storage solution for home installations, rounds out the Company’s portfolio of solar energy technology. Tigo was founded in Silicon Valley in 2007 to accelerate the adoption of solar energy, and its global team supports customers whose systems reliably produce gigawatt hours of safe solar energy on seven continents. Find us online at www.tigoenergy.com.


Contacts

Mike Gazzano
North America Marketing Manager at Tigo Energy
(408) 806-9626 Ext. 9783
This email address is being protected from spambots. You need JavaScript enabled to view it.

JUNO BEACH, Fla.--(BUSINESS WIRE)--Florida Power & Light Company (FPL) today announced Cummins Inc. (NYSE: CMI) will supply a 25-megawatt (MW) electrolyzer system for the groundbreaking FPL Cavendish NextGen Hydrogen Hub – Florida’s first of its kind “green” hydrogen plant – which could lay the groundwork for a 100% carbon-free energy future.

“At FPL, we are always looking over the horizon and focused on making smart, long-term investments to build a more modern, stronger and cleaner energy grid that future generations can depend on,” said Eric Silagy, FPL President and CEO. “Since building our first solar energy center in 2009, FPL has constructed 50 solar energy centers, commissioned the world’s largest solar-powered battery and embarked on innovative pilot programs to advance microgrid technology and electric vehicle (EV) charging while eliminating coal from our fleet in Florida. Now, we are helping usher in the next era of Florida’s clean energy future with a 'green' hydrogen pilot project that could be key to unlocking 100% carbon-free electricity.”

The FPL Cavendish NextGen Hydrogen Hub will leverage solar energy to power the electrolysis process that produces “green,” or carbon-free, hydrogen from water. Once produced, the “green” hydrogen will be blended with natural gas and used to power an existing combustion turbine at the co-located FPL Okeechobee Clean Energy Center – creating cleaner energy that will help power FPL customers across the grid. The system will be composed of five Cummins HyLYZER®-1000 PEM electrolyzers for a total of 25 MW – or 10.8 tons of hydrogen produced per day.

“This project is exciting for Cummins as we establish green hydrogen as a viable way to decarbonize the economy here in the United States,” said Amy Davis, Vice President and President of New Power at Cummins. “An electrolyzer installation of this magnitude further solidifies PEM technology as a key to reaching zero emissions in energy-intensive industries. FPL’s commitment to the acceleration of the energy transition and support of future demand for affordable renewables is one we passionately share.”

FPL’s rapid clean energy expansion in Florida

FPL is executing on its “green” hydrogen pilot alongside the largest solar expansion in America. The company is now over 50% of the way toward completing its “30-by-30" goal of installing 30 million solar panels – a goal now expected to come five years earlier in 2025. Last year, the company also commissioned the world’s largest solar-powered battery located in Manatee County, in addition to closing and dismantling the company’s last coal plant in Florida.

Cummins accelerating hydrogen innovation

Cummins has a long history of advanced technology and engineering capabilities and has a broad portfolio of market-leading renewable hydrogen technologies. Cummins has more than 600 active electrolyzers across the globe and has deployed more than 2,000 hydrogen fuel cells. Cummins technology has been part of many of the world’s hydrogen “firsts,” including powering the world’s largest PEM electrolyzer in operation at 20 MW in Bécancour, Canada; the world’s first hydrogen-powered passenger train, operating across Europe; the world’s first hydrogen refueling station for ships, cars, trucks and industrial customers in Antwerp, Belgium; and being selected to power the largest PEM electrolysis plant in the U.S.

Florida Power & Light Company

Florida Power & Light Company is the largest vertically integrated rate-regulated electric utility in the U.S. as measured by retail electricity produced and sold. The company serves more than 5.7 million customer accounts supporting more than 11 million residents across Florida with clean, reliable and affordable electricity. FPL operates one of the cleanest power generation fleets in the U.S and in 2021 won the ReliabilityOne® National Reliability Award for the sixth time in the last seven years. The company received the top ranking in the southern U.S. among large electric providers, according to J.D. Power’s 2021 Electric Utility Residential Customer Satisfaction StudySM and 2021 Electric Utility Business Customer Satisfaction StudySM. The company was also recognized in 2020 as one of the most trusted U.S. electric utilities by Escalent for the seventh consecutive year. FPL is a subsidiary of Juno Beach, Florida-based NextEra Energy, Inc. (NYSE: NEE), a clean energy company widely recognized for its efforts in sustainability, corporate responsibility, ethics and compliance, and diversity. NextEra Energy is ranked No. 1 in the electric and gas utilities industry in Fortune’s 2022 list of “World’s Most Admired Companies” and recognized on Fortune’s 2021 list of companies that “Change the World.” NextEra Energy is also the parent company of NextEra Energy Resources, LLC, which, together with its affiliated entities, is the world’s largest generator of renewable energy from the wind and sun and a world leader in battery storage. For more information about NextEra Energy companies, visit these websites: www.NextEraEnergy.com, www.FPL.com, www.NextEraEnergyResources.com.

About Cummins Inc.

Cummins Inc., a global power leader, is a corporation of complementary business segments that design, manufacture, distribute and service a broad portfolio of power solutions. The company’s products range from diesel, natural gas, electric and hybrid powertrains and powertrain-related components including filtration, aftertreatment, turbochargers, fuel systems, controls systems, air handling systems, automated transmissions, electric power generation systems, batteries, electrified power systems, hydrogen generation and fuel cell products. Headquartered in Columbus, Indiana (U.S.), since its founding in 1919, Cummins employs approximately 59,900 people committed to powering a more prosperous world through three global corporate responsibility priorities critical to healthy communities: education, environment and equality of opportunity. Cummins serves its customers online, through a network of company-owned and independent distributor locations, and through thousands of dealer locations worldwide and earned about $2.1 billion on sales of $24.0 billion in 2021. See how Cummins is powering a world that’s always on by accessing news releases and more information at https://www.cummins.com/always-on.


Contacts

Jon Mills
External Communications
This email address is being protected from spambots. You need JavaScript enabled to view it.

317-658-4540

PARIS--(BUSINESS WIRE)--Jointly organized by the World Water Council and the Senegalese government, the 9th edition of the World Water Forum will be held in Dakar, Senegal, from March 21 to 26, 2022 with the theme "Water Security for Peace and Development". This is the first time that this international event will be held in sub-Saharan Africa.


Conceived as a catalyst for engagement and action, the World Water Forum aims to strengthen the world's capacity to respond to contemporary water-related challenges. This 9th edition of the event is structured around four priorities: water security and sanitation; water for rural development; cooperation; "Tools and Means" including the crucial issues of financing, governance, knowledge management and innovation.

Dubbed the "Forum of Answers", the 9th World Water Forum aims to achieve meaningful results and solutions for communities around the world. It will bring together a high-level audience from all continents, including representatives of international and non-governmental organizations, major corporations, humanitarian foundations and associations, researchers and academics, and politicians.

The 9th World Water Forum is also intended to be a platform of expression for all stakeholders (including women's groups, youth, farmers, herders and fishermen) and will thus contribute to the qualitative transformation of people's daily lives and to the improvement of the performance of productive sectors.

"We are very proud to bring together governments, the private sector and civil society organizations to strengthen the implementation of actions needed to achieve the Sustainable Development Goals" said Abdoulaye Sene, the Executive Secretary of the 9th World Water Forum.

To participate in the Forum: https://signup.worldwaterforum.org/en/


Contacts

Press contact :
Keshia Dupros
This email address is being protected from spambots. You need JavaScript enabled to view it.
+33(0)628342562

HARTFORD, Conn.--(BUSINESS WIRE)--The Travelers Institute, the public policy division of The Travelers Companies, Inc. (NYSE: TRV), will host a webinar on Wednesday, March 2, at 1:00 pm ET, titled “Power Up: Growth Opportunities in Renewable Energy.” The event will explore the renewable energy market and the advancement of such energy sources as wind, solar, battery energy storage and biomass.


“Travelers has played an active role in the alternative energy market since the late 1990s, from writing the property coverage for one of the first modern-day wind turbines to supporting new technologies and innovations in sustainable growth,” said Eileen Kauffman, Vice President and Global Practice Leader for Renewable Energy at Travelers. “I look forward to sharing our industry expertise and discussing the many opportunities within this sector that business leaders can capitalize on.”

Joan Woodward, President of the Travelers Institute and Executive Vice President of Public Policy at Travelers, will moderate the discussion. Kauffman will serve as a panelist and will be joined by:

  • Duncan Frederick, Vice President of Business Development for Rosendin Renewable Energy Group, one of the largest electrical contractors in the United States.
  • Justin Johnson, Executive Vice President and Chief Operating Officer at Arevon, a renewable energy company that develops, owns and operates renewable energy facilities serving utilities and corporations.

“I look forward to sharing our view on future prospects for the U.S. utility scale photovoltaic/battery energy storage system industry, in addition to discussing the many shorter-term challenges facing engineering, procurement and construction companies in the current marketplace,” said Frederick.

“There are innumerable opportunities for companies that invest in bringing renewable energy online, not to mention the potential benefits for communities and individuals. I look forward to this timely discussion of how the adoption of renewable technologies can positively impact all business sectors,” Johnson added.

The session, which is part of the Travelers Institute® Wednesdays with Woodward® series, is free and open to the public. Anyone interested in registering can sign up here.

To learn more about the Travelers Institute, please visit Travelers.com/Travelers-Institute.

About the Travelers Institute

The Travelers Institute, the public policy division of The Travelers Companies, Inc., engages in discussion and analysis of public policy topics of importance to the insurance marketplace and to the financial services industry more broadly. The Travelers Institute draws upon the industry expertise of Travelers’ senior management as well as the technical expertise of many of Travelers’ underwriters, risk managers and other experts to provide information, analysis and solutions to public policymakers and regulators. Travelers is a leading provider of property casualty insurance for auto, home and business. For more information, visit Travelers.com.


Contacts

Media:
Chesleigh Fowler, 860-277-5102
This email address is being protected from spambots. You need JavaScript enabled to view it.

CHARLOTTESVILLE, Va.--(BUSINESS WIRE)--#batteries--East Point Energy, a leading energy storage developer, announced the sale of the Yadkins Energy Storage project to Aypa Power, a Blackstone portfolio company and developer, owner and operator of energy storage and hybrid generation assets. The 100 MW project will be located in Chesapeake, Virginia. East Point will continue to provide development services to the project.


Energy storage projects like Yadkins are an essential component of Virginia’s 100% clean energy future, as outlined in the Virginia Clean Economy Act. The project will increase grid resilience and is well-sited to support the Hampton Roads load growth and planned offshore wind interconnecting nearby.

“East Point was an early mover in Virginia; development of the Yadkins project began in 2018,” said East Point Energy CEO, Andrew Foukal. “The Project reflects East Point’s fundamentals-based approach to project siting, which is a result of over a decade of developing renewable energy projects across the country. It has been a pleasure to work with the Aypa Power team, and we look forward to making this project a success.”

“It was great to work with East Point on this acquisition, and we are excited to have their continued development support going forward,” said Aypa Power CEO, Moe Hajabed. “Demand for renewable generation continues to grow in Virginia, and storage is needed to provide flexible capacity to better integrate such renewables into the grid.”

About East Point Energy
East Point Energy is a leading energy storage project development firm located in Charlottesville, Virginia. East Point is developing over 4 gigawatts of energy storage projects in various markets around the country, helping to transform the grid into a renewable, resilient, and affordable system for generations to come. For more information, visit www.eastpointenergy.com.


Contacts

Anne Eschenroeder
Chief of Staff
(434) 465-6210, This email address is being protected from spambots. You need JavaScript enabled to view it.

LIBERTY LAKE, Wash.--(BUSINESS WIRE)--Itron, Inc. (NASDAQ:ITRI), which is innovating the way utilities and cities manage energy and water, announced today financial results for its fourth quarter and full year ended Dec. 31, 2021. Highlights for the quarter and full year include:


  • Quarterly and full year revenue of $486 million and $2.0 billion;
  • Quarterly and full year gross margin of 25.0% and 28.9%;
  • Quarterly and full year GAAP net loss of $(59) million and $(81) million;
  • Quarterly and full year GAAP loss per share of $(1.30) and $(1.83);
  • Quarterly and full year non-GAAP diluted earnings per share of $0.75 and $1.75;
  • Quarterly and full year adjusted EBITDA of $3 million and $115 million; and
  • Backlog of $4.0 billion and 12-month backlog of $1.5 billion.

"Customer demand for Itron’s solutions is at an all-time high, as demonstrated by record bookings and backlog in the fourth quarter,” said Tom Deitrich, Itron’s president and CEO.

“Unfortunately, headwinds due to semiconductor component shortages impacted our fourth quarter results and we anticipate these conditions continuing through at least the first half of 2022.”

Summary of Fourth Quarter Consolidated Financial Results
(All comparisons made are against the prior year period unless otherwise noted)

Revenue
Total revenue of $486 million decreased 8%, or 6% excluding the impact of changes in foreign currency exchange rates, compared with the fourth quarter of 2020.

By segment, Outcomes revenue increased 4%, driven by an increase in software and professional services. Networked Solutions revenue decreased 5% and Device Solutions revenue decreased 16%.

Gross Margin
Consolidated gross margin of 25.0% decreased 330 basis points compared with the fourth quarter of 2020 driven primarily by higher component costs and manufacturing inefficiencies.

Operating Income (loss), Net Income (loss) and Earnings (loss) per Share (EPS)
GAAP operating loss of $(107) million compared with operating income of $33 million in 2020. The decrease was primarily due to lower gross profit and higher GAAP operating expenses. The higher GAAP operating expenses were primarily driven by expenses related to restructuring activities and higher variable compensation. Also, we recognized a pre-tax loss related to the sale of certain gas device assets.

Non-GAAP operating loss $(7) million compared with non-GAAP operating income of $44 million in 2020. The decrease was due to lower gross profit and higher non-GAAP operating expenses, primarily driven by higher variable compensation.

GAAP net loss attributable to Itron, Inc. for the quarter was $(59) million, or $(1.30) per share, compared with net income of $22 million, or $0.53 per diluted share, in 2020. The reduction in net income and EPS was primarily due to lower GAAP operating income.

Non-GAAP net income was $34 million, or $0.75 per diluted share, compared with $26 million, or $0.65 per diluted share in 2020. The increase was due to a non-GAAP tax benefit driven by the impact of certain transfers of business activities and assets.

Cash Flow
In the fourth quarter, cash provided by operating activities was $14 million compared with $39 million in 2020. Free cash flow was $7 million compared with $29 million in the prior year. The decrease in cash flow was due to reduced non-GAAP EBITDA and lower cash inflows from working capital.

Other Measures

Bookings were a record $1.1 billion in the fourth quarter. This is a book to bill ratio of 2.2 to 1 for the quarter. Total backlog and 12-month backlog are both at record levels of $4.0 billion and $1.5 billion, respectively, at the end of the quarter.

Financial Guidance

Itron’s guidance for the full year 2022 is as follows:

  • Revenue between $2.0 and $2.1 billion
  • Non-GAAP diluted EPS between $1.25 and $1.75

Guidance assumes an average euro to U.S. dollar foreign currency exchange rate of $1.14 in 2022, diluted weighted average shares outstanding of approximately 45.5 million for the year, and a non-GAAP effective tax rate for the year of approximately 25%.

A reconciliation of forward-looking non-GAAP diluted EPS to the GAAP diluted EPS has not been provided because we are unable to predict with reasonable certainty the potential amount or timing of restructuring and acquisition and integration related expenses and their related tax effects without unreasonable effort. These items are uncertain, depend on various factors and could have a material impact on GAAP results for the guidance period.

Other Events

Share Repurchase Program

On Nov. 1, 2021 Itron's board of directors authorized a share repurchase program up to $100 million over an 18-month period. As of today, we have completed $25 million under the share repurchase program at an average share price of $61.67, totaling approximately 400 thousand shares.

Sale of European C+I Mechanical Gas / Stations / Global Gas Regulator Business

On Nov. 2, 2021, Itron entered into a definitive securities and asset purchase agreement to sell certain of its Gas device manufacturing and business operations in Europe and North America to Dresser Utility Solutions (Dresser). Itron anticipates this transaction to close today, Feb. 28, 2022.

Earnings Conference Call

Itron will host a conference call to discuss the financial results and guidance contained in this release at 10 a.m. EST on Feb. 28, 2022. The call will be webcast in a listen-only mode. Webcast information and conference call materials will be made available 10 minutes before the start of the call and will be accessible on Itron’s website at http://investors.itron.com/events.cfm. A replay of the audio webcast will be made available at http://investors.itron.com/events.cfm. A telephone replay of the conference call will be available through March 5, 2022. To access the telephone replay, dial (888) 203-1112 (domestic) or (719) 457-0820 (international) and enter passcode 5471582.

About Itron

Itron® enables utilities and cities to safely, securely and reliably deliver critical infrastructure services to communities in more than 100 countries. Our portfolio of smart networks, software, services, meters and sensors helps our customers better manage electricity, gas and water resources for the people they serve. By working with our customers to ensure their success, we help improve the quality of life, ensure the safety and promote the well-being of millions of people around the globe. Itron is dedicated to creating a more resourceful world. Join us: www.itron.com.

Itron® is a registered trademark of Itron, Inc. All third-party trademarks are property of their respective owners and any usage herein does not suggest or imply any relationship between Itron and the third party unless expressly stated.

Cautionary Note Regarding Forward Looking Statements

This release contains, and our officers and representatives may from time to time make, "forward-looking statements" within the meaning of the safe harbor provisions of the U.S. Private Securities Litigation Reform Act of 1995. Forward-looking statements are neither historical factors nor assurances of future performance. These statements are based on our expectations about, among others, revenues, operations, financial performance, earnings, liquidity, earnings per share, cash flows and restructuring activities including headcount reductions and other cost savings initiatives. This document reflects our current strategy, plans and expectations and is based on information currently available as of the date of this release. When we use words such as "expect", "intend", "anticipate", "believe", "plan", "goal", "seek", "project", "estimate", "future", "strategy", "objective", "may", "likely", "should", "will", "will continue", and similar expressions, including related to future periods, they are intended to identify forward-looking statements. Forward-looking statements rely on a number of assumptions and estimates. Although we believe the estimates and assumptions upon which these forward-looking statements are based are reasonable, any of these estimates or assumptions could prove to be inaccurate and the forward-looking statements based on these estimates and assumptions could be incorrect. Our operations involve risks and uncertainties, many of which are outside our control, and any one of which, or a combination of which, could materially affect our results of operations and whether the forward-looking statements ultimately prove to be correct. Actual results and trends in the future may differ materially from those suggested or implied by the forward-looking statements depending on a variety of factors. Therefore, you should not rely on any of these forward-looking statements. Some of the factors that we believe could affect our results include our ability to execute on our restructuring plans, our ability to achieve estimated cost savings, the rate and timing of customer demand for our products, rescheduling of current customer orders, changes in estimated liabilities for product warranties, adverse impacts of litigation, changes in laws and regulations, our dependence on new product development and intellectual property, future acquisitions, changes in estimates for stock-based and bonus compensation, increasing volatility in foreign exchange rates, international business risks, uncertainties caused by adverse economic conditions, including, without limitation those resulting from extraordinary events or circumstances such as the COVID-19 pandemic and other factors that are more fully described in Part I, Item 1A: Risk Factors included in our Annual Report on Form 10-K for the year ended Dec. 31, 2020 and other reports on file with the Securities and Exchange Commission. Itron undertakes no obligation to update or revise any information in this press release.

Non-GAAP Financial Information

To supplement our consolidated financial statements, which are prepared in accordance with accounting principles generally accepted in the United States (GAAP), we use certain adjusted or non-GAAP financial measures, including non-GAAP operating expense, non-GAAP operating income, non-GAAP net income, non-GAAP diluted earnings per share (EPS), adjusted EBITDA, adjusted EBITDA margin, constant currency, and free cash flow. We provide these non-GAAP financial measures because we believe they provide greater transparency and represent supplemental information used by management in its financial and operational decision making. We exclude certain costs in our non-GAAP financial measures as we believe the net result is a measure of our core business. We believe these measures facilitate operating performance comparisons from period to period by eliminating potential differences caused by the existence and timing of certain expense items that would not otherwise be apparent on a GAAP basis. Non-GAAP performance measures should be considered in addition to, and not as a substitute for, results prepared in accordance with GAAP. We strongly encourage investors and shareholders to review our financial statements and publicly-filed reports in their entirety and not to rely on any single financial measure. Our non-GAAP financial measures may be different from those reported by other companies. A more detailed discussion of why we use non-GAAP financial measures, the limitations of using such measures, and reconciliations between non-GAAP and the nearest GAAP financial measures are included in this press release.

ITRON, INC.

CONSOLIDATED STATEMENTS OF OPERATIONS


(Unaudited, in thousands, except per share data)


Three Months Ended December 31,


Twelve Months Ended December 31,


2021


2020


2021


2020

Revenues


Product revenues

$

412,725


$

451,393


$

1,678,195


$

1,889,173


Service revenues


72,912


73,764


303,377


284,177


Total revenues


485,637


525,157


1,981,572


2,173,350


Cost of revenues


Product cost of revenues


322,307


336,344


1,231,230


1,408,615


Services cost of revenues


42,043


39,980


177,173


162,568


Total cost of revenues


364,350


376,324


1,408,403


1,571,183


Gross profit


121,287


148,833


573,169


602,167


Operating expenses


Sales, general and administrative


78,546


61,902


300,520


276,920


Research and development


49,856


45,102


197,235


194,101


Amortization of intangible assets


8,887


11,223


35,801


44,711


Restructuring


55,453


(4,518

)


54,623


37,013


Loss on sale of business


36,015


2,522


64,289


59,817


Total operating expenses


228,757


116,231


652,468


612,562


Operating income (loss)


(107,470

)


32,602


(79,299

)


(10,395

)

Other income (expense)


Interest income


231


833


1,557


2,998


Interest expense


(1,531

)


(10,230

)


(28,638

)


(44,001

)

Other income (expense), net


(746

)


(1,827

)


(17,430

)


(5,241

)

Total other income (expense)


(2,046

)


(11,224

)


(44,511

)


(46,244

)


Income (loss) before income taxes


(109,516

)


21,378


(123,810

)


(56,639

)

Income tax benefit (provision)


51,093


128


45,512


(238

)

Net income (loss)


(58,423

)


21,506


(78,298

)


(56,877

)

Net income (loss) attributable to noncontrolling interests


443


(14

)


2,957


1,078


Net income (loss) attributable to Itron, Inc.

$

(58,866

)

$

21,520


$

(81,255

)

$

(57,955

)


Net income (loss) per common share - Basic

$

(1.30

)

$

0.53


$

(1.83

)

$

(1.44

)

Net income (loss) per common share - Diluted

$

(1.30

)

$

0.53


$

(1.83

)

$

(1.44

)


Weighted average common shares outstanding - Basic


45,246


40,412


44,301


40,253

Weighted average common shares outstanding - Diluted

45,246

40,762

44,301

40,253

ITRON, INC.

SEGMENT INFORMATION


(Unaudited, in thousands)


Three Months Ended December 31,

Twelve Months Ended December 31,


2021

2020

2021

2020

Product revenues


Device Solutions

$

154,295


$

183,360


$

635,103


$

684,517


Networked Solutions


238,134


250,233


974,531


1,148,698


Outcomes


20,296


17,800


68,561


55,958


Total Company

$

412,725


$

451,393


$

1,678,195


$

1,889,173


Service revenues


Device Solutions

$

2,827


$

3,063


$

10,001


$

9,478


Networked Solutions


26,627


27,185


118,100


100,704


Outcomes


43,458


43,516


175,276


173,995


Total Company

$

72,912


$

73,764


$

303,377


$

284,177


Total revenues


Device Solutions

$

157,122


$

186,423


$

645,104


$

693,995


Networked Solutions


264,761


277,418


1,092,631


1,249,402


Outcomes


63,754


61,316


243,837


229,953


Total Company

$

485,637


$

525,157


$

1,981,572


$

2,173,350


Gross profit


Device Solutions

$

14,127


$

22,016


$

99,355


$

86,859


Networked Solutions


80,006


100,538


378,633


432,906


Outcomes


27,154


26,279


95,181


82,402


Total Company

$

121,287


$

148,833


$

573,169


$

602,167


Operating income (loss)


Device Solutions

$

3,433


$

12,674


$

57,217


$

40,769


Networked Solutions


49,363


70,633


254,434


308,099


Outcomes


15,984


18,151


50,631


47,619


Corporate unallocated


(176,250

)


(68,856

)


(441,581

)


(406,882

)

Total Company

$

(107,470

)

$

32,602


$

(79,299

)

$

(10,395

)

ITRON, INC.

CONSOLIDATED BALANCE SHEETS


(Unaudited, in thousands)


December 31, 2021

December 31, 2020

ASSETS


Current assets


Cash and cash equivalents

$

162,579


$

206,933


Accounts receivable, net


298,459


369,828


Inventories


165,799


182,377


Other current assets


123,092


171,124


Total current assets


749,929


930,262


Property, plant, and equipment, net


163,184


207,816


Deferred tax assets, net


181,472


76,142


Other long-term assets


42,178


51,656


Operating lease right-of-use assets, net


65,523


76,276


Intangible assets, net


92,529


132,955


Goodwill


1,098,975


1,131,916


Total assets

$

2,393,790


$

2,607,023


LIABILITIES AND EQUITY


Current liabilities


Accounts payable

$

193,129


$

215,639


Other current liabilities


81,253


72,591


Wages and benefits payable


113,532


86,249


Taxes payable


12,208


15,804


Current portion of debt


18,359


Current portion of warranty


18,406


28,329


Unearned revenue


82,816


112,928


Total current liabilities


501,344


549,899


Long-term debt, net


450,228


902,577


Long-term warranty


13,616


13,061


Pension benefit obligation


87,863


119,457


Deferred tax liabilities, net


2,000


1,921


Operating lease liabilities


57,314


66,823


Other long-term obligations


138,666


113,012


Total liabilities


1,251,031


1,766,750


Equity


Common stock


1,779,775


1,389,419


Accumulated other comprehensive loss, net


(148,098

)


(138,526

)

Accumulated deficit


(515,600

)


(434,345

)

Total Itron, Inc. shareholders' equity


1,116,077


816,548


Noncontrolling interests


26,682


23,725


Total equity


1,142,759


840,273


Total liabilities and equity

$

2,393,790


$

2,607,023


ITRON, INC.

CONSOLIDATED STATEMENTS OF CASH FLOWS


(Unaudited, in thousands)

Year Ended December 31,


2021


2020

Operating activities


Net income (loss)

$

(78,298

)

$

(56,877

)

Adjustments to reconcile net income (loss) to net cash provided by operating activities:


Depreciation and amortization of intangible assets


84,153


97,290


Non-cash operating lease expense


17,107


18,178


Stock-based compensation


23,618


25,053


Amortization of prepaid debt fees


18,253


4,130


Deferred taxes, net


(85,574

)


(12,939

)

Loss on sale of business


64,289


59,817


Loss on extinguishment of debt, net


10,000


Restructuring, non-cash


8,744


5,888


Other adjustments, net


2,930


10,392


Changes in operating assets and liabilities, net of acquisitions:


Accounts receivable


60,242


108,256


Inventories


(3,721

)


35,403


Other current assets


41,461


(11,832

)

Other long-term assets


4,515


(11,391

)

Accounts payable, other current liabilities, and taxes payable


(23,391

)


(111,724

)

Wages and benefits payable


30,915


(34,664

)

Unearned revenue


(29,366

)


8,212


Warranty


(8,169

)


(13,538

)

Other operating, net


17,086


(10,140

)

Net cash provided by operating activities


154,794


109,514


Investing activities


Net proceeds related to the sale of business


3,142


1,133


Acquisitions of property, plant, and equipment


(34,682

)


(46,208

)

Business acquisitions, net of cash and cash equivalents acquired


(8,670

)


Other investing, net


5,326


4,039


Net cash used in investing activities


(34,884

)


(41,036

)


Financing activities


Proceeds from borrowings


460,000


400,000


Payments on debt


(946,094

)


(414,063

)

Issuance of common stock


5,080


8,886


Proceeds from common stock offering


389,419


Proceeds from sale of warrants


45,349


Purchases of convertible note hedge contracts


(84,139

)


Repurchase of common stock


(8,028

)


Prepaid debt fees


(12,031

)


(1,571

)

Other financing, net


(2,443

)


(4,828

)

Net cash used in financing activities


(152,887

)


(11,576

)


Less: Cash classified within assets held for sale


(9,750

)


Effect of foreign exchange rate changes on cash and cash equivalents


(1,627

)


127


Increase (decrease) in cash and cash equivalents


(44,354

)


57,029


Cash and cash equivalents at beginning of period


206,933


149,904

Cash and cash equivalents at end of period

$

162,579

$

206,933

About Non-GAAP Financial Measures

To supplement our consolidated financial statements, which are prepared in accordance with GAAP, we use certain non-GAAP financial measures, including non-GAAP operating expense, non-GAAP operating income, non-GAAP net income, non-GAAP diluted EPS, adjusted EBITDA, free cash flow, and constant currency. The presentation of this financial information is not intended to be considered in isolation or as a substitute for, or superior to, the financial information prepared and presented in accordance with GAAP, and other companies may define such measures differently. For a reconciliation of each non-GAAP measure to the most comparable financial measure prepared and presented in accordance with GAAP, please see the table captioned Reconciliations of Non-GAAP Financial Measures to the Most Directly Comparable GAAP Financial Measures.

We use these non-GAAP financial measures for financial and operational decision making and/or as a means for determining executive compensation. Management believes that these non-GAAP financial measures provide meaningful supplemental information regarding our performance and ability to service debt by excluding certain expenses that may not be indicative of our recurring core operating results. These non-GAAP financial measures facilitate management's internal comparisons to our historical performance, as well as comparisons to our competitors' operating results. Our executive compensation plans exclude non-cash charges related to amortization of intangibles and certain discrete cash and non-cash charges, such as acquisition and integration related expenses, loss on sale of business, or restructuring charges. We believe that both management and investors benefit from referring to these non-GAAP financial measures in assessing our performance and when planning, forecasting and analyzing future periods. We believe these non-GAAP financial measures are useful to investors because they provide greater transparency with respect to key metrics used by management in its financial and operational decision making and because they are used by our institutional investors and the analyst community to analyze the health of our business.

Non-GAAP operating expenses and non-GAAP operating income – We define non-GAAP operating expenses as operating expenses excluding certain expenses related to the amortization of intangible assets, restructuring, loss on sale of business, corporate transition cost, and acquisition and integration. We define non-GAAP operating income as operating income (loss) excluding the expenses related to the amortization of intangible assets, restructuring, loss on sale of business, corporate transition cost, and acquisition and integration. Acquisition and integration related expenses include costs, which are incurred to affect and integrate business combinations, such as professional fees, certain employee retention and salaries related to integration, severances, contract terminations, travel costs related to knowledge transfer, system conversion costs, and asset impairment charges. We consider these non-GAAP financial measures to be useful metrics for management and investors because they exclude the effect of expenses that are related to acquisitions and restructuring projects. By excluding these expenses, we believe that it is easier for management and investors to compare our financial results over multiple periods and analyze trends in our operations. For example, in certain periods, expenses related to amortization of intangible assets may decrease, which would improve GAAP operating margins, yet the improvement in GAAP operating margins due to this lower expense is not necessarily reflective of an improvement in our core business. There are some limitations related to the use of non-GAAP operating expenses and non-GAAP operating income versus operating expenses and operating income calculated in accordance with GAAP.


Contacts

Itron, Inc.
Kenneth P. Gianella
Vice President, Investor Relations
(669) 770-4643
This email address is being protected from spambots. You need JavaScript enabled to view it.
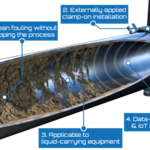
David Means
Director, Investor Relations
(737) 242-8448
This email address is being protected from spambots. You need JavaScript enabled to view it.

Rebecca Hussey
Manager, Investor Relations
(509) 891-3574
This email address is being protected from spambots. You need JavaScript enabled to view it.


Read full story here

DUBLIN--(BUSINESS WIRE)--The "Home Energy Management Systems Market: Global Industry Trends, Share, Size, Growth, Opportunity and Forecast 2022-2027" report has been added to ResearchAndMarkets.com's offering.


The global home energy management systems market reached a value of US$ 2.1 Billion in 2021. Looking forward, the publisher expects the market to reach US$ 6 Billion by 2027, exhibiting a CAGR of 16.5% during 2022-2027.

Companies Mentioned

  • Honeywell International, Inc.
  • Nest Labs, Inc.
  • Vivint, Inc.
  • General Electric Company
  • Ecobee, Inc.
  • Alarm.Com
  • Comcast Cable (Xfinity)
  • Panasonic Corporation
  • Ecofactor, Inc.
  • Energyhub, Inc.

Keeping in mind the uncertainties of COVID-19, we are continuously tracking and evaluating the direct as well as the indirect influence of the pandemic. These insights are included in the report as a major market contributor.

Home energy management system is a smart electronic device that is used to manage the consumption of energy in households. This device enables the homeowners to efficiently monitor their energy requirements and to get an individual appliance's electricity consumption pattern and power consumption data. The hardware part of the system includes a hub which can be mounted on an electrical board. The hub mediates between the software and the user, and can be operated virtually through a wireless device. It can also be connected to other smart devices at home. The software part of the system allows the user to monitor and customize the usage. It can be accessed through apps and web portals. The HEMS interface can be specific to the effectiveness of the performance of the system or it can be dedicated to the mobility of the device. Some of the basic functions of the device include monitoring the usage of electricity, management of backup with the help of battery storage, and efficient use of solar energy.

Catalyzed by rising awareness among consumers towards the sustainable use of energy resources, a strong growth has been witnessed in the demand of energy-efficient appliances and home energy management systems. Consumers are realizing that these systems are not only helping in reducing energy expenses, but are also playing a major part in making the available energy resources more sustainable. Other major factor driving the home energy management systems market include rising penetration of the internet across both developed and developing economies, increasing role of Internet of Things (IoT) and Big Data in energy management, growing market for smart homes, etc.

Key Questions Answered in this Report

1. What is the size of the global home energy management system market?

2. What are the key factors driving the global home energy management system market?

3. What has been the impact of COVID-19 on the global home energy management system market?

4. What is the breakup of the global home energy management system market based on the product type?

5. What are the key regions in the global home energy management system market?

6. Who are the key companies/players in the global home energy management system market?

Key Topics Covered:

1 Preface

2 Scope and Methodology

3 Executive Summary

4 Introduction

4.1 Overview

4.2 Key Industry Trends

5 Global Home Energy Management Systems Market

5.1 Market Overview

5.2 Market Performance

5.3 Impact of COVID-19

5.4 Market Breakup by Product Type

5.5 Market Breakup by Communication Technology

5.6 Market Breakup by Software & Service

5.7 Market Breakup by Region

5.8 Market Forecast

5.9 SWOT Analysis

5.9.1 Overview

5.9.2 Strengths

5.9.3 Weaknesses

5.9.4 Opportunities

5.9.5 Threats

5.10 Value Chain Analysis

5.11 Porters Five Forces Analysis

5.11.1 Overview

5.11.2 Bargaining Power of Buyers

5.11.3 Bargaining Power of Suppliers

5.11.4 Degree of Competition

5.11.5 Threat of New Entrants

5.11.6 Threat of Substitutes

6 Market Breakup by Product Type

7 Market Breakup by Communication Technology

8 Market Breakup by Software & Service

9 Market Breakup by Region

10 Competitive Landscape

10.1 Market Structure

10.2 Key Players

10.3 Profiles of Key Players

For more information about this report visit https://www.researchandmarkets.com/r/a1r5ty


Contacts

ResearchAndMarkets.com
Laura Wood, Senior Press Manager
This email address is being protected from spambots. You need JavaScript enabled to view it.
For E.S.T Office Hours Call 1-917-300-0470
For U.S./CAN Toll Free Call 1-800-526-8630
For GMT Office Hours Call +353-1-416-8900

BOSTON--(BUSINESS WIRE)--#3Dprint--Desktop Metal (NYSE:DM) today announced it has shipped its first Production System™ P-50 printer to Stanley Black & Decker (NYSE: SWK), marking the commercialization of the company’s flagship additive manufacturing technology for mass production of end-use, metal parts.


As one of the most highly anticipated advanced manufacturing systems ever introduced, the P-50 is the product of nearly $100 million in investment and a four-year development program overseen by Desktop Metal engineers and materials scientists. The P-50 is designed to mass produce high-performance metal parts with the repeatability and cost required to compete with conventional manufacturing.

Stanley Black & Decker, the first P-50 customer, is a purpose-driven industrial organization that operates the world’s largest tools and storage business, including such iconic brands as DEWALT, BLACK+DECKER and CRAFTSMAN.

The Production System - World’s Fastest Way to 3D Print Metal Parts At-Scale

Created by the inventors of binder jetting and single-pass inkjet technology, the Production System is an industrial manufacturing platform powered by Desktop Metal’s Single Pass Jetting™ technology. It is designed to achieve speeds up to 100 times those of legacy powder bed fusion additive manufacturing technologies and enable production quantities of up to millions of parts per year at costs competitive with conventional mass production techniques. The platform supports a robust materials library including ten qualified metal alloys - from commercially pure copper to stainless steels such as 17-4PH - with additional metal alloys in active development.

For more information on the P-1, the P-50, and Production System technology, visit www.desktopmetal.com/products/production.

About Desktop Metal

Desktop Metal, Inc., based in Burlington, Massachusetts, is accelerating the transformation of manufacturing with an expansive portfolio of 3D printing solutions, from rapid prototyping to mass production. Founded in 2015 by leaders in advanced manufacturing, metallurgy, and robotics, the company is addressing the unmet challenges of speed, cost, and quality to make additive manufacturing an essential tool for engineers and manufacturers around the world. Desktop Metal was selected as one of the world’s 30 most promising Technology Pioneers by the World Economic Forum, named to MIT Technology Review’s list of 50 Smartest Companies, and the 2021 winner of Fast Company’s Innovation by Design Award in materials and Fast Company’s Next Big Things in Tech Award for sustainability. For more information, visit www.desktopmetal.com.

About Stanley Black & Decker

Headquartered in the USA, Stanley Black & Decker (NYSE: SWK) is the world’s largest tool company operating nearly 50 manufacturing facilities across America and more than 100 worldwide. Guided by its purpose – for those who make the world – the company’s more than 60,000 diverse and high-performing employees produce innovative, award-winning power tools, hand tools, storage, digital tool solutions, lifestyle products, outdoor products, engineered fasteners and other industrial equipment to support the world’s makers, creators, tradespeople and builders. The company’s iconic brands include DEWALT, BLACK+DECKER, CRAFTSMAN, STANLEY, Cub Cadet, Hustler and Troy-Bilt. Recognized for its leadership in environmental, social and governance (ESG), Stanley Black & Decker strives to be a force for good in support of its communities, employees, customers and other stakeholders.

Forward-looking Statements

This press release may contain certain forward-looking statements within the meaning of the federal securities laws. Forward-looking statements generally are identified by the words “believe,” “project,” “expect,” “anticipate,” “estimate,” “intend,” “strategy,” “future,” “opportunity,” “plan,” “may,” “should,” “will,” “would,” “will be,” “will continue,” “will likely result,” and similar expressions. Forward-looking statements are predictions, projections and other statements about future events that are based on current expectations and assumptions and, as a result, are subject to risks, uncertainties. Many factors could cause actual future events to differ materially from the forward-looking statements in this document, including but not limited to, the risks and uncertainties set forth in Desktop Metal, Inc.’s filings with the U.S. Securities and Exchange Commission. These filings identify and address other important risks and uncertainties that could cause actual events and results to differ materially from those contained in the forward-looking statements. Forward-looking statements speak only as of the date they are made. Readers are cautioned not to put undue reliance on forward-looking statements, and Desktop Metal, Inc. assumes no obligation and does not intend to update or revise these forward-looking statements, whether as a result of new information, future events, or otherwise.


Contacts

Media Relations:
Caroline Legg
This email address is being protected from spambots. You need JavaScript enabled to view it.

(203) 313-4228

Investor Relations:
Jay Gentzkow
This email address is being protected from spambots. You need JavaScript enabled to view it.
(781) 730-2110

DUBLIN--(BUSINESS WIRE)--The "Warship and Naval Vessels Market: Global Industry Trends, Share, Size, Growth, Opportunity and Forecast 2022-2027" report has been added to ResearchAndMarkets.com's offering.


The global warship and naval vessels market reached a value of US$ 60.7 Billion in 2021. Looking forward, the publisher expects the market to reach US$ 85.1 Billion by 2027, exhibiting a CAGR of 5.96% during 2022-2027.

Companies Mentioned

  • Babcock International Group
  • General Dynamics
  • Kawasaki Heavy Industries
  • Lockheed Martin
  • Mitsubishi Heavy Industries
  • CSIC
  • DSME
  • Fincantieri
  • Garden Reach Shipbuilders & Engineers
  • Hyundai Heavy Industries
  • Navantia
  • Reliance Naval and Engineering Limited.

Keeping in mind the uncertainties of COVID-19, we are continuously tracking and evaluating the direct as well as the indirect influence of the pandemic. These insights are included in the report as a major market contributor.

Warships and naval vessels are intently built to serve in war and belong to the naval forces of a country. Warships are much faster, safer and more maneuverable than merchant ships and represent a key component of a country's naval force. Unlike merchant ships that carries cargo, warships are designed to carry only weapons, ammunition, and essential supplies for the crew onboard. Although warships and naval vessels belong to the navy; individuals, cooperatives, and corporations have also been operating them.

One of the biggest factors driving the global market for warships and naval vessels is the continuous growth in the global defense spending. Driven by a rise in regional conflicts, the global defense spending has been rising continuously in recent years. In 2018, the global defense spending reached around US$ 1.8 Trillion. This growth has been largely catalyzed by a rise in defense budgets by countries in the Asia Pacific and the Middle East regions, such as China, India and Saudi Arabia. Countries are currently spending extensively on upgrading and expanding their current fleet of naval vessels. Apart from participating in offensive operations against enemy forces, naval vessels are also involved in providing humanitarian assistance and disaster relief operations.

Key Questions Answered in this Report

1. What was the global warship and naval vessels market size in 2021?

2. What will be the global warship and naval vessels market outlook during the forecast period (2022-2027)?

3. What are the global warship and naval vessels market drivers?

4. What are the major trends in the global warship and naval vessels market?

5. What is the impact of COVID-19 on the global warship and naval vessels market?

6. What is the global warship and naval vessels market breakup by type?

7. What is the global warship and naval vessels market breakup by application?

8. What are the major regions in the global warship and naval vessels market?

9. Who are the leading warship and naval vessels manufacturers?

Key Topics Covered:

1 Preface

2 Scope and Methodology

3 Executive Summary

4 Introduction

4.1 Overview

4.2 Key Industry Trends

5 Global Warship and Naval Vessels Market

5.1 Market Overview

5.2 Market Performance

5.3 Impact of COVID-19

5.4 Market Breakup by Type

5.5 Market Breakup by Application

5.6 Market Breakup by Region

5.7 Market Forecast

5.8 SWOT Analysis

5.9 Value Chain Analysis

5.10 Porters Five Forces Analysis

5.11 Price Analysis

6 Market Breakup by Type

7 Market Breakup by Application

8 Market Breakup by Region

9 Competitive Landscape

9.1 Market Structure

9.2 Key Players

9.3 Profiles of Key Players

For more information about this report visit https://www.researchandmarkets.com/r/6v2e1k


Contacts

ResearchAndMarkets.com
Laura Wood, Senior Press Manager
This email address is being protected from spambots. You need JavaScript enabled to view it.

For E.S.T Office Hours Call 1-917-300-0470
For U.S./CAN Toll Free Call 1-800-526-8630
For GMT Office Hours Call +353-1-416-8900

DUBLIN--(BUSINESS WIRE)--The "French Door Refrigerator Market - Growth, Trends, COVID-19 Impact, and Forecasts (2022 - 2027)" report has been added to ResearchAndMarkets.com's offering.


In developed as well as developing economies, the presence of international as well as emerging players targeting their customers with cost-effective products integrated with the IoT (Internet of Things) technology is expected to fuel the demand for French door refrigerators in the next few years.

Major players operating in the French door refrigerator market are focused on the development of innovative refrigerators by opting for newer freezing technologies that offer key advantages in terms of improvement in food quality and meeting consumers' expectations. Emerging players in the market are focusing on collaborations with mega retailing channels and online platforms to increase the sale of their products.

In addition, manufacturers of French door refrigerators are emphasizing the promotion of their refrigerators through celebrity endorsement. However, use of French door refrigerators powered by electric energy generated from fossil fuel is directly hampering the environment.

Moreover, conventional refrigerators with advanced technologies can be a major substitute for French door refrigerators. These factors are projected to hinder the global French door refrigerator market.

COVID-19 has disrupted the global supply chain of the major brands of French door refrigerators. China is one of the largest consumers and producers of French door refrigerator products but also caters to a wide range of countries by exporting several input supplies that are essentially used to produce finished goods. Shut down of production in China has forced other French door refrigerator manufacturers based in the US and Europe to temporarily hold the production of the finished goods. This led to the increase in the supply and demand gap and the product market.

Key Market Trends

Asia-Pacific Region Is Anticipated To Grow At Highest Rate

Led by rapid urbanization and increasing disposable income, Asia-Pacific region is the fastest-growing market with a substantial growth rate over the forecast period. The regional market growth is accredited to the region's developing economies and growing population.

The overall demand and popularity of French door refrigerators could augment in developing countries such as China and India owing to the growing inclination of customers toward an expenditure on kitchen electrical appliances, growing per capita disposable income along with the increasing number of households.

Asia-Pacific region is leading the industry owing to rapid urbanization, technology developments, innovations in products, and developments in electric and electronic industries. Advancements in technology, coupled with an increase in the number of product innovations, are among the key factors supporting the demand for French Door Refrigerator Market in this region.

Furthermore, a robust increase in the number of commercial kitchens, food services, and retailers is expected to fuel the regional French door refrigerator market.

Demand for the Energy-Efficient French Door Refrigerators is Driving Market

Refrigerators have been an integral part of the majority of households for several decades. The focus on energy efficiency exerts a growing influence on the development of French door refrigeration appliances.

The demand for energy-efficient and energy management devices (smart thermostat and smart lighting systems) has increased for efficient electricity consumption and reducing the electricity bills and can reduce carbon footprints. The major benefit of energy-efficient French door refrigerators lies in the improved energy efficiency, which has socio-economic benefits in terms of increased energy security and environmental benefits, i.e. lower GHG emissions, and lower environmental impact of electricity generation.

In addition, energy-efficient refrigerators may lead to cost-savings for the consumer over the life-cycle of the appliance. The GHG emissions savings associated with energy efficiency improvements of refrigerators depend on the CO2 intensity of the electricity mix. The increasing awareness towards the environment and eco-friendly products, the demand for energy-efficient French Door Refrigerators are increasing.

Companies Mentioned

  • Haier
  • Whirlpool Corporation
  • Electrolux
  • Midea
  • Samsung
  • Bosch
  • LG
  • Miele
  • Panasonic
  • Arcelik AS
  • Sharp

For more information about this report visit https://www.researchandmarkets.com/r/yfxkz9


Contacts

ResearchAndMarkets.com
Laura Wood, Senior Press Manager
This email address is being protected from spambots. You need JavaScript enabled to view it.
For E.S.T Office Hours Call 1-917-300-0470
For U.S./CAN Toll Free Call 1-800-526-8630
For GMT Office Hours Call +353-1-416-8900

DUBLIN--(BUSINESS WIRE)--The "Global Specialty Gases Market Analysis By Application, By Type, By Region, Competition Forecast and Opportunities, 2015-2030" report has been added to ResearchAndMarkets.com's offering.


The global Specialty Gas demand stood at 1.85 Million Tonnes in 2020 and is forecast to reach 3.31 Million Tonnes by 2030, growing at a healthy CAGR of 5.88% until 2030.

Major Players

  • Air Liquid SA
  • Linde Group
  • Praxair Inc
  • Air products and Chemicals Inc
  • Taiyo Nippon Sanso Corporation
  • Messer Group Gmbh
  • Iwatawi Corporation
  • Air Water Inc
  • Showa Denko K.K.
  • Coregas Pty Ltd

A high level of purity required for the special purpose application falls under the category of special gases. The global specialty gases market is predominantly driven by growing demand for chemicals and specialty gases in the developing economies along with the growing metal and mining industry. The ongoing deployment of power projects, growing construction activities, and rising demand for electronic products have resulted in the increased consumptions of the chemicals used during the production process.

The processing of chemicals involves the usage of specialty gases and the growing chemicals market is expected to eventually boost the demand for specialty gases. Based on end-user demand, chemical processing dominates the global Specialty Gas market. The increasing market consumption and increased acceptance trends of the industry are driving the growth of the market in the upcoming ten years. Manufacturing, electronics, healthcare, and academics industry is aiding the growth of the global specialty gas market in the forecast period.

Due to the outbreak of COVID-19 in 2020, the world economy was disrupted. The market was affected drastically, and production and manufacturing units were shut down. Furthermore, the major market players intentionally halted the production keeping their employee's health and wellness in mind. With imposed new regulations of the COVID-19 and proper precautions, the market is anticipated to regain its growth in the years to come. The pandemic is slowly being subsided and the effects are tried to be overcome by various methods. Once the market regains the full function of its production unit, the market is bound to show robust growth in the forecast period.

Pure gases accounted for the largest market share in 2016 and are projected to maintain dominance during the forecast period. Pure gases are used as carrier gases, blanketing gases, etc., and in major applications such as electronics & semiconductors, analytical & calibration, etc.

Specialty Gas is to be distributed in packaged cylinders and the distribution of these gases are mainly carried out in remote locations for which larger distance is needed to be covered. Moreover, the cylinders are required to be properly secured to prevent them from striking each other or from falling which requires extra safety measures. These parameters result in higher transportation charges for specialty gases. The high transportation cost directly impacts the specialty gases price which affects the purchase of specialty gases.

Asia-Pacific is the largest region in the global specialty gases market. The region is likely to maintain its market dominance during the forecast period on account of the presence of major developing economies in the region where the healthcare and electronics sectors are growing rapidly, where specialty gases are majorly used, thereby pushing the growth of global specialty gases market in the coming years. China, India and Indonesia are some of the emerging economies that are undergoing rapid economic transformation and are growing markets for the global Speciality Gas market.

Objective of the Study:

  • The primary objective of the study was to evaluate and forecast Specialty Gas' capacity, production, demand, inventory, and demand-supply gap globally.
  • To categorize Specialty Gas' demand based on end use, type, region and distribution channel.
  • To identify major customers of Specialty Gas globally.
  • To evaluate and forecast Specialty Gas' pricing globally.
  • To identify and profile major companies operating in the global Specialty Gas market.
  • To identify major news, deals and expansion plans in the global Specialty Gas market.

Key Topics Covered:

1. Global Specialty Gases Market Outlook, 2015-2030

2. Global Specialty Gases Demand Outlook, 2015-2030, By Volume

3. North America Specialty Gases Market Outlook, 2015-2030

4. North America Specialty Gases Demand Outlook, 2015-2030, By Volume

5. Asia Pacific Specialty Gases Market Outlook, 2015-2030

6. Asia Pacific Specialty Gases Demand Outlook, 2015-2030, By Volume

7. Europe Specialty Gases Market Outlook, 2015-2030

8. Europe Specialty Gases Demand Outlook, 2015-2030, By Volume

9. MEA Specialty Gases Market Outlook, 2015-2030

10. MEA Specialty Gases Demand Outlook, 2015-2030, By Volume

11. South America Specialty Gases Market Outlook, 2015-2030

12. South America Specialty Gases Demand Outlook, 2015-2030, By Volume

13. By Region

14. News and Deals

For more information about this report visit https://www.researchandmarkets.com/r/dsmcwt


Contacts

ResearchAndMarkets.com
Laura Wood, Senior Press Manager
This email address is being protected from spambots. You need JavaScript enabled to view it.

For E.S.T Office Hours Call 1-917-300-0470
For U.S./CAN Toll Free Call 1-800-526-8630
For GMT Office Hours Call +353-1-416-8900

DUBLIN--(BUSINESS WIRE)--The "Global Outdoor LED Lighting Market (2021-2026) by Offering Type, Installation Type, Wattage Type, End-Use Type, Geography, Competitive Analysis and the Impact of Covid-19 with Ansoff Analysis" report has been added to ResearchAndMarkets.com's offering.


The Global Outdoor LED Lighting Market is estimated to be USD 21.76 Bn in 2021 and is expected to reach USD 43.96 Bn by 2026, growing at a CAGR of 15.1%.

The Global Outdoor LED Lighting Market Growing demand for outdoor LED lighting is associated with developing and modernizing infrastructures such as smart cities and economic corridors, reducing LED prices. Increasing demand for smart control in street lighting systems drives the market's growth.

Additionally, the growing need to improve driver and pedestrian safety and visibility in roadways, highways, architecture, public places, and others is fuelling the market's growth. On the other hand, lack of awareness for innovative lighting installation cost and payback and developing laser light technology as a substitute solution restrict the market's growth.

Furthermore, developing wireless and Internet of Things (IoT) technologies in smart street lighting in smart city projects and increasing energy efficiency adoption in emerging economies will create potential opportunities for the market to grow in the forecasted period.

Moreover, the lack of appropriate standards for consumer ownership in utility-owned street lighting and the rising cost for product testing is a challenge that may negatively hamper the market's growth.

Market Segmentation

  • The Global Market is segmented further based on Offering Type, Installation Type, Wattage Type, End-Use Type, and Geography.
  • By Offering Type, the market is classified into Hardware, Software, and Service.
  • By Installation Type, the market is classified into New and Retrofit.
  • By Wattage Type, the market is classified into less than 50W, Between 50W and 150W, and more than 150W.
  • By End-Use Type, the market is classified into Architectural, Highways & Roadways, Public Places (includes Airport Perimeters, Commercials, Entertainment, Parking Structures, and Stadium and Area Floodlighting), and Others.
  • By Geography, Asia Pacific is projected to lead the market.

Recent Developments

1. Dialight plc launched ProSite LED Floodlight available for non-hazardous as well as hazardous locations models by offering maximum protection against dust, water, vibration, and debris-August 16, 2021

2. ams OSRAM partnership with ViewSonic Corp for latest LS600W WXGA LED Projector, a brightness WXGA Lamp-Free Projector for business and education-July 19, 2021

3. Signify Holding B.V. partnership with National Hockey League for the transition of sustainable LED and connected lighting by improving energy efficient-March 24, 2021

Competitive Quadrant

The report includes a Competitive Quadrant, a proprietary tool to analyze and evaluate the position of companies based on their Industry Position score and Market Performance score. The tool uses various factors for categorizing the players into four categories. Some of these factors considered for analysis are financial performance over the last 3 years, growth strategies, innovation score, new product launches, investments, growth in market share, etc.

Why buy this report?

  • The report offers a comprehensive evaluation of the Global Outdoor LED Lighting Market. The report includes in-depth qualitative analysis, verifiable data from authentic sources, and projections about market size. The projections are calculated using proven research methodologies.
  • The report has been compiled through extensive primary and secondary research. The primary research is done through interviews, surveys, and observation of renowned personnel in the industry.
  • The report includes an in-depth market analysis using Porter's 5 forces model and the Ansoff Matrix. In addition, the impact of Covid-19 on the market is also featured in the report.
  • The report also includes the regulatory scenario in the industry, which will help you make a well-informed decision. The report discusses major regulatory bodies and major rules and regulations imposed on this sector across various geographies.
  • The report also contains the competitive analysis using Positioning Quadrants, the analyst's competitive positioning tool.

Report Highlights:

  • A complete analysis of the market, including parent industry
  • Important market dynamics and trends
  • Market segmentation
  • Historical, current, and projected size of the market based on value and volume
  • Market shares and strategies of key players
  • Recommendations to companies for strengthening their foothold in the market

Market Influencers

Drivers

  • Growing Demand due to Developing and Modernising Infrastructure
  • Increasing Demand for Smart Control Lighting System
  • Escalating Need for Improving Drive's Safety and Visibility

Restraints

  • Lack of Awareness for Installation Cost and Payback Periods
  • Developing Laser Light Technology Solutions

Opportunities

  • Developing Wireless and IoT Technologies in Smart Lighting Projects
  • Increase in Adoption of Energy-Efficiency in Emerging Economies

Challenges

  • Lack of Appropriate Standards for Consumer Ownership
  • Rising Cost for Product Testing

Companies Mentioned

  • ABB Ltd
  • Acuity Brands, Inc
  • Astute Lighting
  • Bamford Lighting Ltd
  • Daisalux
  • Dialight plc
  • Eaton Corporation plc
  • Everlight Electronics Co Ltd
  • Evluma
  • General LED, Inc
  • Gooee
  • Halco Lighting Technologies
  • Hubbell Incorporated
  • Kingsun Optoelectronic Co Ltd
  • LED Roadway Lighting Ltd
  • Legrand
  • LIGMAN Lighting Co Ltd
  • Masco Corporation
  • Neptune Light, Inc
  • Nichia Corporation
  • NVC International Holdings Limited
  • OSRAM Licht AG
  • Panasonic Corporation
  • RAB Lighting, Inc
  • Samsung Electronics Co Ltd
  • Signify Holding B.V
  • SYSKA LED
  • Tanko Lighting, Inc
  • Tapan Solar Energy Pvt Ltd
  • The Zumtobel Group
  • Virtual Extension
  • Wolfspeed, Inc


For more information about this report visit https://www.researchandmarkets.com/r/ipxvx


Contacts

ResearchAndMarkets.com
Laura Wood, Senior Press Manager
This email address is being protected from spambots. You need JavaScript enabled to view it.

For E.S.T Office Hours Call 1-917-300-0470
For U.S./CAN Toll Free Call 1-800-526-8630
For GMT Office Hours Call +353-1-416-8900

SAN JOSE, Calif.--(BUSINESS WIRE)--Power Integrations (Nasdaq: POWI) today announced that Balu Balakrishnan and Sandeep Nayyar, the company’s CEO and CFO, will participate in an online fireside chat at the Susquehanna Technology Conference on March 4 at 10:40 a.m. Eastern time. A live webcast of the event will be available via the investor page of the company’s website, investors.power.com.

About Power Integrations

Power Integrations, Inc. is a leading innovator in semiconductor technologies for high-voltage power-conversion. The company’s products are key building blocks in the clean-power ecosystem, enabling the generation of renewable energy as well as the efficient transmission and consumption of power in applications ranging from milliwatts to megawatts. For more information please visit www.power.com.

Power Integrations and the Power Integrations logo are trademarks or registered trademarks of Power Integrations, Inc.


Contacts

Joe Shiffler
Power Integrations, Inc.
(408) 414-8528
This email address is being protected from spambots. You need JavaScript enabled to view it.

ANN ARBOR, Mich.--(BUSINESS WIRE)--The Coretec Group, Inc., (OTCQB: CRTG), a developer of engineered silicon and 3D volumetric displays, has filed a full utility patent on its provisional patent for the development of advanced silicon anodes using cyclohexasilane (CHS) and other silanes.


The full-utility patent – filed February 24, 2022 – builds on a provisional patent filed a year earlier. This patent application covers the use of CHS to produce a wide variety of silicon anodes for use in lithium-ion batteries.

Filing the utility patent is a necessary step to formally protect The Coretec Group’s work on the battery initiative it embarked upon last year.

Next-generation lithium-ion batteries require high energy and power density, rapid charging, and long-term cycling stability. Industry is actively pursuing the use of silicon as an electrode material because of its natural abundance and its ability to store more lithium than conventionally used graphite.

“This patent provides us the necessary protection as we develop our battery,” said CEO Matthew Kappers. “Developing our own silicon anode is an essential component of our battery development. This initiative will explore the use of CHS to develop a battery with higher density and improved cycling stability.”

About The Coretec Group

The Coretec Group, Inc. is developing a portfolio of engineered silicon to improve energy-focused verticals, including electric vehicle and consumer batteries, solid-state lighting (LEDs), and semiconductors, as well as 3D volumetric displays and printable electronics. The Coretec Group serves the global technology markets in energy, electronics, semiconductor, solar, health, environment, and security.

For more information, please visit thecoretecgroup.com. Follow The Coretec Group on Twitter and LinkedIn.

Forward-Looking Statements

The statements in this press release that relate to The Coretec Group’s expectations with regard to the future impact on the Company’s results from operations are forward-looking statements, and may involve risks and uncertainties, some of which are beyond our control. Such risks and uncertainties are described in greater detail in our filings with the U.S. Securities and Exchange Commission. Since the information in this press release may contain statements that involve risk and uncertainties and are subject to change at any time, the Company’s actual results may differ materially from expected results. We make no commitment to disclose any subsequent revisions to forward-looking statements. This release does not constitute an offer to sell or a solicitation of offers to buy any securities of any entity.


Contacts

Corporate Contact
The Coretec Group, Inc.
Lindsay McCarthy
This email address is being protected from spambots. You need JavaScript enabled to view it.
+1 (866) 916-0833

DALLAS--(BUSINESS WIRE)--Primoris Services Corporation (NASDAQ GS: PRIM) (“Primoris” or the “Company”) today announced financial results for its fourth quarter and full year ended December 31, 2021 and provided the Company’s outlook for 2022.


For the full year 2021, Primoris reported the following highlights (1):

  • Revenue of $3.5 billion
    • Utility Segment revenue up 21 percent
    • Energy/Renewables Segment revenue up 15 percent
  • Net income attributable to Primoris of $115.6 million, an increase of 10 percent over prior year
  • Fully diluted earnings per share (“EPS”) of $2.17
  • Adjusted net income attributable to Primoris (“Adjusted Net Income”) of $143.3 million
  • Adjusted diluted earnings per share (“Adjusted EPS”) of $2.70
  • Adjusted earnings before interest, income taxes, depreciation and amortization (“Adjusted EBITDA”) of $297.6 million
  • Record Backlog of $4.0 billion, an increase of 44 percent over prior year

For the fourth quarter 2021, Primoris reported the following highlights(1):

  • Revenue of $884.4 million
  • Net income attributable to Primoris of $29.4 million
  • Fully diluted earnings per share of $0.54
  • Adjusted Net Income of $34.3 million
  • Adjusted EPS of $0.63
  • Adjusted EBITDA of $66.9 million
  • Maintained quarterly dividend of $0.06

(1)

Please refer to “Non-GAAP Measures” and Schedule 1, 2 and 3 for the definitions and reconciliations of our Non-GAAP financial measures, including “Adjusted Net Income,” “Adjusted EPS” and “Adjusted EBITDA.”

“We wrapped up 2021 with a record backlog over $4 billion, an increase of more than 40 percent compared to year-end 2020,” said Tom McCormick, President and Chief Executive Officer of Primoris. “During the fourth quarter we announced over $1.8 billion in Energy/Renewables and Utilities segment contracts. Of these, approximately $1 billion was directly related to utility-scale solar projects. Add this backlog to our strong revenue of $3.5 billion for the year, and it is clear that we are on solid ground with incredible momentum going forward.”

“We achieved these results despite headwinds in the first half of the year from weather events and supply chain and permitting challenges, all while maintaining our high standards for quality and safety,” McCormick added. “I particularly want to thank our Primoris crews for achieving our best-ever safety performance, with a Total Recordable Incident Rate of 0.49, well below our Corporate target, and the industry average.”

Summarizing the segment results for the year, McCormick noted: “Our Utilities segment led the revenue growth with a 21 percent increase compared to 2020, primarily due to the Future Infrastructure Holdings, LLC (“FIH”) acquisition and increased activity with utility customers in Texas and the Southeast. Utility-scale solar projects continued to drive progress in our Energy/Renewables segment. Revenue increased by 15 percent during 2021 compared to last year. Gross profit for the same segment increased by 58 percent during 2021 compared to 2020. The Pipeline segment revenue declined, although our gross profit, as a percentage of revenue, increased to 19 percent in 2021 compared to 11 percent in the previous year.”

Fourth Quarter 2021 Results Overview
Revenue was $884.4 million for the three months ended December 31, 2021, a decrease of $12.9 million, compared to the same period in 2020. The decrease was primarily due to a decrease in revenue in our Pipeline segment offset by growth in our Utilities and Energy/Renewables segments, including $68.1 million from our acquisition of FIH. Gross profit was $96.0 million for the three months ended December 31, 2021, a decrease of $1.7 million compared to the same period in 2020. The decrease was primarily due to a net decrease in revenue from the Company’s legacy operations, partially offset by an increase from the FIH acquisition ($11.6 million). Gross profit as a percentage of revenue, was consistent at 11 percent for the three months ended December 31, 2021 and 2020.

Beginning with the third quarter of 2021, the Company initiated the inclusion of Non-GAAP financial measures. The Company believes these measures enable investors, analysts and management to evaluate Primoris’ performance excluding the effects of certain items that management believes impact the comparability of operating results between reporting periods. In addition, management believes these measures are useful in comparing the Company’s operating results with those of its competitors. Please refer to “Non-GAAP Measures” and Schedule 1, 2 and 3 for the definitions and reconciliations of the Company’s Non-GAAP financial measures, including “Adjusted Net Income,” “Adjusted EPS” and “Adjusted EBITDA”.

During the fourth quarter of 2021, net income attributable to Primoris was $29.4 million compared to $31.8 million in the previous year. Adjusted Net Income was $34.3 million for the fourth quarter compared to $35.2 million for the same period in 2020. EPS was $0.54 compared to $0.66 in the previous year. Adjusted EPS was $0.63 for the fourth quarter of 2021 compared to $0.73 for the fourth quarter of 2020. Both EPS and Adjusted EPS in 2021 were affected by the 4.5 million shares from the secondary offering in the first quarter of 2021. Adjusted EBITDA was $66.9 million for the fourth quarter of 2021, compared to $68.8 million for the same period in 2020.

Beginning with the first quarter of 2021, the Company consolidated and reorganized its reportable segments. The three segments are: Utilities, Energy/Renewables and Pipeline Services. Revenue and gross profit for the segments for the three months ended December 31, 2021 and 2020 were as follows:

Segment Revenue

(in thousands, except %)

(unaudited)


For the three months ended December 31,


2021


2020


% of


% of


Total


Total

Segment


Revenue


Revenue


Revenue


Revenue

Utilities


$

442,870


50.1%


$

362,353


40.4%

Energy/Renewables


369,311


41.8%


333,406


37.2%

Pipeline


72,267


8.2%


201,579


22.5%

Total


$

884,448


100.0%


$

897,338


100.0%

Segment Gross Profit


(in thousands, except %)

(unaudited)


For the three months ended December 31,


2021


2020


% of


% of


Segment


Segment

Segment


Gross Profit


Revenue


Gross Profit


Revenue

Utilities


$

52,007


11.7%


$

47,550


13.1%

Energy/Renewables


38,461


10.4%


24,314


7.3%

Pipeline


5,549


7.7%


25,892


12.8%

Total


$

96,017


10.9%


$

97,756


10.9%

Utilities Segment (“Utilities”): Revenue increased by $80.5 million, or 22 percent, for the three months ended December 31, 2021, compared to the same period in 2020, primarily due to the FIH acquisition ($68.1 million) and increased activity with the Company’s gas and electric utility customers, partially offset by decreased activity from the impact of customer project and material delays. Gross profit for the three months ended December 31, 2021 increased by $4.5 million, or 9 percent, compared to the same period in 2020. The increase is primarily attributable to the incremental impact of the FIH acquisition ($11.6 million), partially offset by lower margins from our legacy operations. Gross profit as a percentage of revenue decreased to 12 percent during the three months ended December 31, 2021 compared to 13 percent for the same period in 2020, primarily due to customer project and material delays, a decrease in higher margin storm work in 2021 and strong performance and favorable margins realized on projects in the Southeast in 2020. These amounts were partially offset by the favorable margins realized by FIH.

Energy and Renewables Segment (“Energy/Renewables”): Revenue increased by $35.9 million, or 11 percent, for the three months ended December 31, 2021, compared to the same period in 2020, primarily due to increased renewable energy activity ($68.4 million), partially offset by the substantial completion of industrial projects in Louisiana and California in 2020. Gross profit for the three months ended December 31, 2021, increased by $14.1 million, or 58 percent, compared to the same period in 2020, primarily due to higher revenue and margins. Gross profit as a percentage of revenue increased to 10 percent during the three months ended December 31, 2021, compared to 7 percent in the same period in 2020, primarily due to higher costs associated with a liquified natural gas (“LNG”) plant project in the Northeast in 2020.

Pipeline Services (“Pipeline”): Revenue decreased by $129.3 million, or 64 percent, for the three months ended December 31, 2021, compared to the same period in 2020. The decrease is primarily due to the substantial completion of several projects in 2020 and a decline in the overall midstream pipeline market demand from historically high levels, along with challenges in permitting new pipelines. Gross profit for the three months ended December 31, 2021 decreased by $20.3 million, or 79 percent, compared to the same period in 2020, primarily due to lower revenue and margins. Gross profit as a percentage of revenue decreased to 8 percent during the three months ended December 31, 2021, compared to 13 percent in the same period in 2020, primarily due to higher costs associated with unfavorable weather conditions experienced on a Louisiana pipeline project in 2021 and strong performance and favorable margins realized on a Texas pipeline project in 2020.

Full Year 2021 Results Overview
Revenue for the year ended December 31, 2021 increased by $6.1 million, compared to 2020. The increase was primarily due to growth in the Company’s Energy/Renewables and Utilities segments, including $266.6 million from its acquisition of FIH, partially offset by a decrease in revenue in the Company’s Pipeline segment.

For the year ended December 31, 2021, gross profit increased by $46.4 million, or 13 percent, compared to 2020. The increase was primarily due to the Company’s acquisition of FIH ($43.6 million) and an increase in margins from its legacy operations. Gross profit as a percentage of revenue increased to 12 percent from 11 percent in the same period in 2020.

During 2021, net income attributable to Primoris was $115.6 million compared to $105.0 million in the previous year, an increase of 10 percent. Adjusted Net Income was $143.3 million for the full year 2021 compared to $117.7 million for the same period in 2020. EPS was $2.17 compared to $2.16 in the previous year. Adjusted EPS was $2.70 for the full year of 2021 compared to $2.42 for 2020. Both EPS and Adjusted EPS in 2021 were affected by the 4.5 million shares from the secondary offering in the first quarter of 2021. Adjusted EBITDA was $297.6 million for 2021, an increase of 17 percent, compared to $253.8 million for the same period in 2020.

Revenue and gross profit for the Utilities, Energy/Renewables and Pipeline segments for the years ended December 31, 2021 and 2020 were as follows:

Segment Revenue

(in thousands, except %)

(unaudited)


For the year ended December 31,


2021


2020


% of


% of


Total


Total

Segment


Revenue


Revenue


Revenue


Revenue

Utilities


$

1,657,957


47.4%


$

1,365,635


39.1%

Energy/Renewables


1,408,211


40.3%


1,228,821


35.2%

Pipeline


431,464


12.3%


897,041


25.7%

Total


$

3,497,632


100.0%


$

3,491,497


100.0%

Segment Gross Profit

(in thousands, except %)

(unaudited)


For the year ended December 31,


2021


2020


% of


% of


Segment


Segment

Segment


Gross Profit


Revenue


Gross Profit


Revenue

Utilities


$

186,287


11.2%


$

177,836


13.0%

Energy/Renewables


150,286


10.7%


94,919


7.7%

Pipeline


80,087


18.6%


97,459


10.9%

Total


$

416,660


11.9%


$

370,214


10.6%

Utilities: Revenue increased by $292.4 million, or 21 percent, during 2021 compared to 2020. The increase is primarily attributable to the FIH acquisition ($266.6 million) and increased activity with electric utility customers. These amounts were partially offset by lower activity with gas utility customers as well as the impact of customer project and material delays. Gross profit increased $8.5 million, or 5 percent, during 2021 compared to 2020. The increase is primarily attributable to the incremental impact of the FIH acquisition ($43.6 million), partially offset by lower margins from the Company’s legacy operations. Gross profit as a percentage of revenue decreased to 11 percent in 2021 compared to 13 percent in 2020 primarily due to unfavorable weather conditions, customer project and material delays and a decrease in higher margin storm work in 2021, as well as strong performance and favorable margins realized on projects in the Southeast in 2020. These amounts were partially offset by the favorable margins realized by FIH.

Energy/Renewables: Revenue increased by $179.4 million, or 15 percent, during 2021 compared to 2020, primarily due to increased renewable energy activity ($286.2 million), partially offset by the substantial completion of industrial projects in Texas, Louisiana, and California in 2020. Gross profit increased by $55.4 million, or 58 percent, during 2021 compared to 2020, primarily due to higher revenue and margins. Gross profit as a percentage of revenue increased to 11 percent in 2021 compared to 8 percent in 2020 primarily due to favorable claims resolution on an industrial plant project in 2021. In addition, we experienced higher costs in 2020 associated with an LNG plant project in the Northeast. These amounts were partially offset by the favorable impact of the Canadian Emergency Wage Subsidy in 2020.

Pipeline: Revenue decreased by $465.5 million, or 52 percent, during 2021 compared to 2020. The decrease is primarily due to the substantial completion of pipeline projects in 2020 ($416.7 million) and a decline in the overall midstream pipeline market demand from historically high levels, along with challenges in permitting new pipelines. The revenue levels in 2021 are more consistent with those experienced historically and with the Company’s expectations for the Pipeline segment. Gross profit decreased by $17.4 million, or 18 percent, during 2021 compared to 2020, primarily due to lower revenue, partially offset by higher margins. Gross profit as a percentage of revenue increased to 19 percent in 2021 compared to 11 percent in 2020, primarily due to the favorable impact from the closeout of multiple pipeline projects in 2021 and higher costs on pipeline projects in Virginia and Texas in 2020, partially offset by strong performance and favorable margins realized on a Texas pipeline project in 2020. Gross profit as a percentage of revenue experienced in 2020 is more consistent with those experienced historically and with the Company’s expectations going forward for the Pipeline segment.

Other Income Statement Information
Selling, general and administrative (“SG&A”) expenses were $230.1 million during the year ended December 31, 2021, an increase of $27.3 million, or 13 percent, compared to 2020 primarily due to a $28.7 million increase in incremental expense from the FIH acquisition during the period. SG&A expense as a percentage of revenue increased to 6.6 percent in 2021 compared to 5.8 percent in 2020 primarily due to increased expense as the Company integrates FIH into its operations as well as lower revenue from its legacy operations.

Interest expense, net for the year ended December 31, 2021 was $18.5 million compared to $19.9 million for the year ended December 31, 2020. The decrease of $1.4 million was due to a $4.9 million unrealized gain in 2021 and a $2.8 million unrealized loss in 2020 on the Company’s interest rate swap, as well as a lower weighted average interest rate. This decrease was partially offset by higher average debt balances in 2021 from the borrowings incurred related to the FIH acquisition.

The effective tax rate on income attributable to Primoris (excluding noncontrolling interests) was 23.8 percent for the year ended December 31, 2021. The decrease was primarily due to the temporary change allowing full deductibility of per diem expenses through 2022, partially offset by tax on increased pre-tax profits.

Outlook
The Company is providing its estimates for the year ending December 31, 2022. Net income attributable to Primoris is expected to be between $2.10 and $2.30 per fully diluted share. Adjusted EPS is estimated in the range of $2.39 to $2.59 for 2022.

The Company is targeting SG&A expense as a percentage of revenue in the low-to-mid six percent range for full year 2022. The Company estimates capital expenditures for 2022 in the range of $120 to $140 million, which includes $70 to $90 million for construction equipment. The Company’s targeted gross margins by segment are as follows: Utilities in the range of 12 to 14 percent; Energy/Renewables in the range of 9 to 12 percent; and Pipeline in the range of 9 to 11 percent. The Company expects its effective tax rate for 2022 to be approximately 27 percent but may vary depending on the mix of states in which the Company operates.

The guidance provided above constitutes forward-looking statements, which are based on current economic conditions and estimates, and the Company does not include other potential impacts, such as changes in accounting or unusual items. Supplemental information relating to the Company’s financial outlook is posted in the Investor Relations section of the Company’s website at www.primoriscorp.com.

Backlog

(in millions)


Backlog at December 31, 2021

Segment


Fixed Backlog


MSA Backlog


Total Backlog

Utilities


$

37


$

1,347


$

1,384

Energy/Renewables


2,328


127


2,455

Pipeline


114


50


164

Total


$

2,479


$

1,524


$

4,003

At December 31, 2021, Fixed Backlog was $2.5 billion, an increase of $839.6 million, or 51 percent compared to $1.6 billion at December 31, 2020. MSA Backlog represents estimated MSA revenue for the next four quarters. MSA Backlog was $1.5 billion, an increase of 34 percent or $0.4 billion, compared to $1.1 billion at December 31, 2020. Total Backlog as of December 31, 2021 was $4.0 billion. The Company expects that during the next four quarters, the Company will recognize as revenue approximately 74 percent of the total backlog at December 31, 2021, comprised of backlog of approximately: 100 percent of Utilities; 57 percent of Energy/Renewables; and 97 percent of Pipeline.

Backlog, including estimated MSA revenue, should not be considered a comprehensive indicator of future revenue. Revenue from certain projects where scope, and therefore contract value, is not adequately defined, is not included in Fixed Backlog. At any time, any project may be cancelled at the convenience of the Company’s customers.

Liquidity and Capital Resources
At December 31, 2021, the Company had $200.5 million of unrestricted cash and cash equivalents. The Company had no outstanding borrowings under the revolving credit facility, commercial letters of credit outstanding were $42.0 million and the available borrowing capacity was $158.0 million.

Dividend
The Company also announced that on February 24, 2022, its Board of Directors declared a $0.06 per share cash dividend to stockholders of record on March 31, 2022, payable on April 14, 2022.

The Company has paid consecutive quarterly cash dividends since 2008, and currently expects that comparable cash dividends will continue to be paid for the foreseeable future. The declaration and payment of future dividends is contingent upon the Company’s revenue and earnings, capital requirements, and general financial conditions, as well as contractual restrictions and other considerations deemed to be relevant by the Board of Directors.

Share Purchase Program
In November 2021, the Company’s Board of Directors authorized a $25.0 million share purchase program. During the year ended December 31, 2021, the Company purchased and cancelled 635,763 shares of common stock, which in the aggregate equaled $14.7 million at an average share price of $23.15. In February 2022, the Company’s Board of Directors replenished the limit to $25.0 million. The share purchase plan expires on December 31, 2022.

RESPONSE TO THE COVID-19 PANDEMIC
The Company continues to take steps to protect its employees’ health and safety during the COVID-19 pandemic. Primoris has a written corporate COVID-19 Plan in place, as well as Business Continuity Plans (by business unit and segment), based on guidelines from the U.S. Centers for Disease Control and Prevention, the Occupational Safety and Health Administration, and their Canadian counterparts.

Conference Call and Webcast
As previously announced, management will host a teleconference call on Tuesday, March 1, 2022, at 9 a.m. U.S. Central Time (10 a.m. U.S. Eastern Time). Tom McCormick, President and Chief Executive Officer, and Ken Dodgen, Executive Vice President and Chief Financial Officer, will discuss the Company’s results and financial outlook.

Investors and analysts are invited to participate in the call by phone at 1-833-476-0954, or internationally at 1-236-714-2611 (access code: 1418976) or via the Internet at www.primoriscorp.com. A replay of the call will be available on the Company’s website or by phone at 1-800-585-8367, or internationally at 1-416-621-4642 (access code: 1418976), for a seven-day period following the call.

Presentation slides to accompany the conference call are available for download in the Investor Relations section of Primoris’ website at www.primoriscorp.com. Once at the Investor Relations section, please click on “Events & Presentations.”

Non-GAAP Measures
This press release contains certain financial measures that are not recognized under generally accepted accounting principles in the United States (“GAAP”). Primoris uses earnings before interest, income taxes, depreciation and amortization (“EBITDA”), Adjusted EBITDA, Adjusted Net Income, and Adjusted EPS as important supplemental measures of the Company’s operating performance. The Company believes these measures enable investors, analysts, and management to evaluate Primoris’ performance excluding the effects of certain items that management believes impact the comparability of operating results between reporting periods. In addition, management believes these measures are useful in comparing the Company’s operating results with those of its competitors. The non-GAAP measures presented in this press release are not intended to be considered in isolation or as a substitute for, or superior to, the financial information prepared and presented in accordance with GAAP. In addition, Primoris’ method of calculating these measures may be different from methods used by other companies, and, accordingly, may not be comparable to similarly titled measures as calculated by other companies that do not use the same methodology as Primoris. Please see the accompanying tables to this press release for reconciliations of the following non‐GAAP financial measures for Primoris’ current and historical results: EBITDA, Adjusted EBITDA, Adjusted Net Income and Adjusted EPS.

About Primoris
Primoris Services Corporation is a leading specialty contractor providing critical infrastructure services to the utility, energy/renewables and pipeline services markets throughout the United States and Canada. The Company supports a diversified base of blue-chip customers with engineering, procurement, construction and maintenance services. A focus on multi-year master service agreements and an expanded presence in higher-margin, higher-growth markets such as utility-scale solar facility installations, renewable fuels, electrical transmission and distribution systems and communications infrastructure have also increased the Company’s potential for long-term growth.


Contacts

Ken Dodgen
Executive Vice President, Chief Financial Officer
(214) 740-5608
This email address is being protected from spambots. You need JavaScript enabled to view it.

Brook Wootton
Vice President, Investor Relations
(214) 545-6773
This email address is being protected from spambots. You need JavaScript enabled to view it.


Read full story here

Dynamic Ocean platform enhancements reset the bar for international ocean shipping visibility

AMSTERDAM--(BUSINESS WIRE)--FourKites® introduces several powerful capabilities to help international shippers identify and mitigate the risks and costs associated with runaway demurrage and detention (D&D) fees more quickly and proactively. Shippers can also prioritise exceptions according to likely business impact and adjust carriers, lanes or other factors as necessary.


Port congestion, vessel delays, and incorrect or incomplete documentation are common challenges for ocean shippers. Unprecedented global container shortages, port closures, natural disasters, COVID-19 and other recent incidents have exacerbated these issues. D&D fees have reached thousands of dollars per container per day and millions of dollars in annual transportation costs for many shippers. This prompted the Federal Maritime Commission (FMC) to consider new regulations to reign in ocean carrier billing practices.

FourKites’ new D&D product suite is available as part of the company’s Dynamic Ocean℠ platform. This platform includes precise end-to-end freight tracking, the industry’s most accurate predictive ETAs, international document management and booking functionality.

“Detention and demurrage fees have become a scourge for shippers, and when piled on top of rising transportation expenses, can make profit margins plummet,” said Chris Stauber, vice president of products and international solutions at FourKites. “Attacking D&D fees requires a true end-to-end visibility solution that combines document visibility, yard visibility and robust notifications and alerting so shippers can mitigate fees before they occur. That’s Dynamic Ocean in a nutshell.”

The new capabilities include:

  • Exception dashboards, notifications and alerts that monitor and track containers that are likely to incur D&D fees based on real-time rerouting alerts and dwell time data for all ocean shipments. Using these real-time dashboards, customers can prioritise the containers that are currently accumulating fees, or that are at risk of doing so.
  • Analytics dashboards that scrutinise performance trends by lane, carrier, stop and other factors to pinpoint systemic problem areas.
  • Ability to monetise the potential (and actual) financial impacts of demurrage and detention fees on your transportation costs, enabling you to prioritise the most costly cargo.
  • A digital document hub to manage essential international shipping documents accurately and on time, with powerful collaboration tools and easily customisable workflows, alerts and notifications to mitigate shipping delays and unnecessary D&D fees.

Momentum builds for FourKites in international ocean shipping

Over the last 12 months, ocean volume tracked on the FourKites platform has increased 232%, while ocean customers have increased nearly 4X over the same period. Customers include Cardinal Health, Arizona Tile, LyondellBasell, McCain Foods, Roehm, Rove Concepts and Yamaha Motors. Dynamic Ocean covers 98% of global ocean shipments, 100% of terminals in North America, and the majority of terminals in Europe and Australia/New Zealand.

“FourKites’ automated reporting and tracking for ocean provides more accurate and real-time data, which allows Canfor to respond to customer inquiries quicker with up-to-date information on our upcoming shipments that would have otherwise had to be manually tracked,” said Bob Hayes, Vice President of Global Supply Chain at Canfor.

About FourKites

FourKites® is the #1 supply chain visibility platform in the world, extending visibility beyond transportation into yards, warehouses, stores and beyond. Tracking more than 2.5 million shipments daily across road, rail, ocean, air, parcel and courier, and reaching 176 countries, FourKites combines real-time data and powerful machine learning to help companies digitise their end-to-end supply chains. More than 1,000 of the world’s most recognised brands — including 9 of the top-10 CPG and 18 of the top-20 food and beverage companies — trust FourKites to transform their business and create more agile, efficient and sustainable supply chains. To learn more, visit https://www.fourkites.com/.

About FourKites’ Dynamic Ocean

FourKites’ Dynamic Ocean platform addresses the full spectrum of ocean shipping issues through advanced document management and collaboration features; state-of-the-art real-time tracking capabilities, including predictive ETAs that are 20% to 40% more accurate than carrier-generated ETAs; and comprehensive multimodal visibility from port to door, including the yard, so shippers can identify and manage the root causes of escalating fees.

Within the context of ongoing volatility and rising costs in ocean shipping, FourKites has experienced dramatic growth in its ocean business since it introduced its state-of-the-art Dynamic Ocean platform.


Contacts

Scott Johnston
European PR Director, FourKites
+31 62 147 8442
This email address is being protected from spambots. You need JavaScript enabled to view it.

Offshore Source Logo

Offshore Source keeps you updated with relevant information concerning the Offshore Energy Sector.

Any views or opinions represented on this website belong solely to the author and do not represent those of the people, institutions or organizations that Offshore Source or collaborators may or may not have been associated with in a professional or personal capacity, unless explicitly stated.

Corporate Offices

Technology Systems Corporation
8502 SW Kansas Ave
Stuart, FL 34997

info@tscpublishing.com