Business Wire News

Conserve Power Between 3 p.m. and 10 p.m. Friday, Aug. 14

SAN FRANCISCO--(BUSINESS WIRE)--Pacific Gas and Electric Company (PG&E) urges customers to conserve electricity in response to a statewide Flex Alert called for Friday Aug. 14 from 3 to 10 p.m., by the California Independent System Operator (ISO), which manages the state's power grid.

A Flex Alert is an urgent call to immediately conserve electricity and shift power demand to off-peak hours to ease strain on the grid. The ISO issued the alert in response to forecasted high temperatures and a predicted increase in electric demand, primarily from residential air conditioning use.

Above-normal temperatures for California are expected to last through the weekend and into late next week. Prolonged heat over several consecutive days is expected to drive electricity demand higher, as nighttime temperatures are also forecast to be above average.

PG&E encourages customers to reduce electricity use during the Flex Alert on Friday, especially during the afternoon and evening, when air conditioners are typically at peak use. Customers should also follow these conservation tips:

  • Adjust your thermostat to 78 degrees or higher if health permits or turn it off if you will be away from home. Use a fan instead of air conditioning, when possible.
  • Draw drapes and turn off unnecessary lighting.
  • Unplug phone charges, power strips (those without a switch) and other equipment when not in use. Taken together, these small items can use as much power as your refrigerator. Avoid using electrical appliances and devices. Put off tasks such as vacuuming, laundry, dish washing and computer time until after 10 p.m.
  • Set your pool pump to run overnight instead of during the day.

These Flex Alert-related conservation efforts could reduce the risk of further emergency measures, including rotating power outages.

About PG&E

Pacific Gas and Electric Company, a subsidiary of PG&E Corporation (NYSE:PCG), is one of the largest combined natural gas and electric energy companies in the United States. Based in San Francisco, with more than 23,000 employees, the company delivers some of the nation's cleanest energy to 16 million people in Northern and Central California. For more information, visit pge.com and pge.com/news.


Contacts

MEDIA RELATIONS:
415-973-5930

Subscription Period for Rights Offering to Commence on August 18, 2020, for Holders of Record on August 17, 2020

Investors Interested in Participating in the Rights Offering Must Acquire Shares by Market close Today in Order to Participate

CARNEGIE, Pa.--(BUSINESS WIRE)--Ampco-Pittsburgh Corporation (NYSE: AP) (the “Corporation” or “Ampco-Pittsburgh”) today announced the pricing of the units and Series A warrants being offered as part of its previously announced $20.0 million rights offering (the “rights offering”). The rights offering will allow Ampco-Pittsburgh’s shareholders of record as of August 17, 2020, to purchase up to 12,800,795 units. Units consist of shares of common stock (the “Common Shares”) and Series A warrants to purchase Common Shares, which expires on August 1, 2025. The subscription price for units entitling participants in the rights offering to a whole Common Share and receive a Series A warrant to purchase a whole Common Share has been set at $3.50, representing a 17% premium to the closing price for the Common Shares on the New York Stock Exchange on August 12, 2020. In addition, the exercise price for Series A warrants to purchase a whole Common Share has been set at $5.75 per share. The units and Series A warrants will be exercisable only for whole Common Shares.


For additional information on the rights offering, please see the prospectus included in the Corporation’s registration statement on Form S-1 and related amendments, which has not yet become effective, at https://www.sec.gov/edgar/searchedgar/companysearch.html

Commenting on the rights offering, Brett McBrayer, Ampco-Pittsburgh’s Chief Executive Officer, said, “We have made significant progress in turning around the business. The restructuring of our portfolio, cost reduction measures, and operation efficiency improvements over the past two years have helped position us to achieve positive results. Moving ahead with this equity rights offering will support our desire to accelerate our restructuring efforts through capital investments and strengthen our balance sheet and liquidity.”

The Corporation anticipates that all directors and executive officers of the Corporation will participate in the rights offering.

The rights offering includes an over-subscription privilege, entitling each rights holder that exercises all its basic subscription privileges in full the right to purchase additional units that remain unsubscribed at the expiration of the rights offering. Both the basic and over-subscription privileges are subject to the availability and pro-rata allocation of shares among participants. All basic subscription rights and over-subscription privileges may be exercised during the subscription period of Tuesday, August 18, 2020, through 5:00 PM ET, Wednesday, September 16, 2020.

In addition, the Corporation recommends that current shareholders consider notifying their broker or financial advisor to ensure they will maximize their ability to participate in the rights offering. Ampco-Pittsburgh reminds shareholders that most purchases settle two trading days following the transaction date, so Common Shares must be acquired by market close at 4:00 PM Eastern Time on Thursday, August 13, 2020, to be considered a shareholder of record on the record date.

The rights offering is being made pursuant to Ampco-Pittsburgh’s registration statement on Form S-1 (Reg. No. 333-239446), which is not yet effective, on file with the U.S. Securities and Exchange Commission (the “SEC”). Investors should consider the information in the prospectus contained in the registration statement carefully before making any decision to participate in the rights offering. Copies of the prospectus and related materials are being sent to holders of record on the record date of August 17, 2020. Requests for copies of the prospectus and questions from shareholders relating to the rights offering may be directed to the information agent for the rights offering at the address, phone number, and e-mail address below.

Ampco-Pittsburgh has engaged Advisory Group Equity Services, Ltd. d/b/a RHK Capital to act as dealer-manager for the rights offering.

Questions about the rights offering may be directed to and, when available, copies of the prospectus may be obtained from the information agent for the rights offering, as follows:

Rights Offering Information Agent

D.F. King & Co., Inc.
48 Wall Street, 22nd Floor
New York, NY 10005
Telephone at (212) 269-5550 (bankers and brokers) or (800) 290-6432 (all others)
This email address is being protected from spambots. You need JavaScript enabled to view it.

RHK Capital invites any broker-dealers interested in participating in the rights offering to contact This email address is being protected from spambots. You need JavaScript enabled to view it.

A registration statement relating to these securities has been filed with the SEC but has not yet become effective. The securities may not be sold nor offers to buy be accepted prior to the time the registration statement becomes effective. This announcement shall not constitute an offer to sell, or the solicitation of an offer to buy, any securities, nor shall there be any sale of these securities in any state in which such offer, solicitation or sale would be unlawful prior to the registration or qualification under the securities laws of any such state. The rights offering, which is expected to be launched immediately following the effectiveness of the registration statement, will be made only by means of a prospectus.

About Ampco-Pittsburgh Corporation

Ampco-Pittsburgh Corporation manufactures and sells highly engineered, high-performance specialty metal products and customized equipment utilized by industry throughout the world. Through its operating subsidiary, Union Electric Steel Corporation, it is a leading producer of forged and cast rolls for the global steel and aluminum industry. It also manufactures open-die forged products that principally are sold to customers in the steel distribution market, oil and gas industry, and the aluminum and plastic extrusion industries. The Corporation is also a producer of air and liquid processing equipment, primarily custom-engineered finned tube heat exchange coils, large custom air handling systems, and centrifugal pumps. It operates manufacturing facilities in the United States, England, Sweden, Slovenia, and participates in three operating joint ventures located in China. It has sales offices in North and South America, Asia, Europe, and the Middle East. Corporate headquarters is located in Carnegie, Pennsylvania.

Forward-Looking Statements

The Private Securities Litigation Reform Act of 1995 (the “Act”) provides a safe harbor for forward-looking statements made by or on behalf of the Corporation. The information contained in this press release may include, but are not limited to, statements about undertaking the rights offering described herein, operating performance, trends, events that we expect or anticipate will occur in the future, statements about sales levels, restructuring, the impact from global pandemics (including COVID-19), profitability and anticipated expenses and cash outflows. All statements in this document other than statements of historical fact are statements that are, or could be, deemed “forward-looking statements” within the meaning of the Act and words such as “may,” “intend,” “believe,” “expect,” “anticipate,” “estimate,” “project,” “forecast” and other terms of similar meaning that indicate future events and trends are also generally intended to identify forward-looking statements. Forward-looking statements speak only as of the date on which such statements are made, are not guarantees of future performance or expectations and involve risks and uncertainties. For the Corporation, these risks and uncertainties include, but are not limited to: cyclical demand for products and economic downturns; excess global capacity in the steel industry; increases in commodity prices or shortages of key production materials; consequences of global pandemics (including COVID-19); new trade restrictions and regulatory burdens associated with “Brexit”; inability of the Corporation to successfully restructure its operations; limitations in availability of capital to fund the Corporation’s operations and strategic plan; inability to satisfy the continued listing requirements of the New York Stock Exchange; potential attacks on information technology infrastructure and other cyber-based business disruptions; and those discussed more fully in documents filed with the SEC by the Corporation, particularly in Item 1A, Risk Factors, in Part I of the Corporation’s Form 10-K for the year ended December 31, 2019, and Part II of the Corporation’s Form 10-Q for the quarter ended March 31, 2020. The Corporation cannot guarantee any future results, levels of activity, performance or achievements. In addition, there may be events in the future that the Corporation may not be able to predict accurately or control which may cause actual results to differ materially from expectations expressed or implied by forward-looking statements. Except as required by applicable law, we assume no obligation, and disclaim any obligation, to update forward-looking statements whether as a result of new information, events or otherwise.


Contacts

Michael G. McAuley
Senior Vice President, Chief Financial Officer and Treasurer
(412) 429-2472
This email address is being protected from spambots. You need JavaScript enabled to view it.

3,300 crew members continue work, focusing on highly impacted areas

CHICAGO--(BUSINESS WIRE)--ComEd has restored power to more than 695,000 families and businesses, or more than 90 percent of the customers affected by the derecho that slammed northern Illinois on Monday afternoon causing significant damage across the entire region. The storm brought hurricane force winds with gusts higher than 90 miles per hour, extensive lightning, golf ball-sized hail and 10 confirmed tornados in communities that ComEd serves. About 66,000 customers remain without power.


ComEd’s focus is on areas with significant devastation. Following the storms, some communities saw block-long lines of poles and wires down, transmission towers that were blown onto distribution lines and decades-old trees that toppled into electrical equipment.

“This was a storm of historical proportion, both meteorologically and in its impact on our system,” said Terry Donnelly, president and COO of ComEd. “In many hard-hit areas, we are not repairing the system, we’re rebuilding it. There are instances where the damage would take weeks to repair under normal circumstances. We’re getting it done in days. Our redoubled efforts have reduced the amount of time our customers are out of power.”

More than 1,900 ComEd employees and contractors have been working around the clock since Monday afternoon to restore power to customers quickly and safely. Additionally, More than 1,400 mutual assistance workers from across the country are assisting with the restoration effort.

ComEd is on target to restore power to over 95 percent of customers by Friday night. Hundreds of additional customers are being restored each hour, but outages in areas where tornados or other intense storm events occurred may take longer to restore.

In spite of the extensive damage caused by the tornados and derecho, ComEd restored power to 540,000 customers within a day, the fastest restoration of 500,000 customers in the company’s history. This is due in large part to the smart grid investments ComEd has made since 2012, including in technologies that automatically detect outages and reroute power around problem areas, avoiding significant outages that otherwise would have occurred. These technologies helped avoid more than 700,000 additional interruptions from the storm.

ComEd offers the following tips and information for customers to stay safe following severe weather:

  • If you encounter a downed power line, immediately call ComEd at 1-800-EDISON1 (1-800-334-7661) or go to ComEd.com to report the location. Spanish-speaking customers should call 1-800-95-LUCES (1-800-955-8237).
  • Never approach a downed power line. Always assume a power line is energized and extremely dangerous.
  • In the event of an outage, do not approach ComEd crews working to restore power to ask about restoration times. Crews may be working on live electrical equipment and the perimeter of the work zone may be hazardous.

ComEd urges customers to contact the company immediately if they experience a power outage. Customers can text OUT to 26633 (COMED) to report an outage and receive restoration information, and can follow the company on Twitter @ComEd or on Facebook at Facebook.com/ComEd. Customers can also call 1-800 EDISON1 (1-800-334-7661), or report outages via the website at www.ComEd.com/report. Spanish-speaking customers should call 1-800-95-LUCES (1-800-955-8237).

ComEd has introduced a mobile app for iPhone and Android® smart phones that gives customers the ability to report power outages and manage their accounts; download the app at www.ComEd.com/app.

ComEd has an interactive outage map on its website at www.ComEd.com/map, which allows customers to easily find information on the location and size of outages and get estimated power restoration times.

ComEd is a unit of Chicago-based Exelon Corporation (NASDAQ: EXC), a Fortune 100 energy company with approximately 10 million electricity and natural gas customers – the largest number of customers in the U.S. ComEd powers the lives of more than 4 million customers across northern Illinois, or 70 percent of the state’s population. For more information visit ComEd.com and connect with the company on Facebook, Twitter, Instagram and YouTube.


Contacts

ComEd Media Relations
312-394-3500

The state is constructing tens of thousands of new buildings that cost more to build and lock in higher CO2 emissions all amid growing efforts to accelerate emission reductions

DENVER--(BUSINESS WIRE)--A report commissioned by Community Energy finds that the upfront cost to build new residential buildings with all-electric space and water heating is roughly 25% less expensive than comparable equipment powered by natural gas. Similar, but smaller percentage savings arise for new all-electric commercial buildings. This shift to all-electric has not yet occurred, however, principally because current electricity rates and rebate programs for all-electric systems in Colorado produce higher total costs.


Prepared by Group14 Engineering, the report further concludes that once buildings are constructed, the economics of retrofitting from natural gas to all-electric are far more difficult — bordering on cost prohibitive. As a result, Colorado is currently building tens of thousands of new residential and commercial buildings that both cost more and lock in higher CO2 emissions for the majority of a building’s +50-year life.

“Colorado spent over $16 billion on new residential and commercial construction in 2019, with the overwhelming majority of these new buildings relying on natural gas,” said Eric Blank, Co-Founder and Director of Community Energy, Inc. “Colorado has a near-term opportunity to modify its energy rates and rebate programs to encourage building electrification and accelerate the clean energy transition.”

Through a detailed economic case study of an individual single-family residence and commercial building in Colorado, the report shows that the state can quickly modify its rates and rebates to make all-electric the most cost-effective choice. This would begin to move new construction toward all-electric, enabling a low-carbon future.

“Simple changes today can make a large difference in realizing the low-hanging fruit of electrifying new building construction and reducing carbon emissions, all while providing comparable comfort and service,” said the report’s lead author Celeste Cizik, Principal at Group14 Engineering.

------------------------------------------------------------------------------------------------------------------------------------------

About Community Energy:

For more than twenty years, Community Energy has partnered with utilities, Fortune 500 companies and local communities to develop roughly 2,000 MW of wind and solar, representing a close to $4 Billion investment. As an early entrant in commercializing clean energy, Community Energy leverages emerging technologies and resources to support decarbonization of our energy systems and promote fuel-free approaches. Headquartered in Radnor, Pennsylvania, with offices in Boulder, Colorado and Chapel Hill, North Carolina, Community Energy has a strong presence in diverse geographical markets. For more information about Community Energy please visit www.communityenergyinc.com.

About Group14 Engineering:

Group14 Engineering is a nationally recognized engineering and sustainability consulting firm delivering technical expertise, practical solutions and innovative best practices in the built environment that benefit developers, building owners, their occupants and society throughout the life-cycle of the building. Group14’s mission is to transform the built environment to realize a more resilient future. Based in Denver and in business since 1992, Group14 Engineering brings solutions to projects throughout the United States. For more information about Group14 Engineering, please visit www.group14eng.com.

The Full Report is available at www.communityenergyinc.com/COelec


Contacts

Antenna Group on behalf of Community Energy
Regan Keller
415-977-1933
This email address is being protected from spambots. You need JavaScript enabled to view it.

SOUTHFIELD, Mich.--(BUSINESS WIRE)--Power management company Eaton today announced its eMobility business has launched a new and improved line of Eaton OMNEX Trusted Wireless™ mobile control solutions for heavy machinery and field operations. The 900 MHz two-way remote-control units allow for the wireless control of high-value machinery in harsh environments, including mining, construction, agriculture, locomotive and marine markets.


“Our next generation of rugged, weatherproof OMNEX wireless controllers were designed with customer input, and offer a number of benefits, including enhanced safety and productivity for machine operators,” said Scott Adams, president, eMobility, Eaton. “Overall, we’ve improved upon the reliability and connectivity that was always a benefit over the competition – and we continue to advance our wireless technology in those areas.”

On a construction site, the wireless controllers can operate heavy machinery, such as vacuum trucks, tow trucks, concrete mixers and cranes. Remote operation provides a number of benefits, including reducing the amount of personnel on-site and keeping workers out of harm’s way. The new units have a range of up to 1,650 feet and can be programmed for a wide range of functions. For example, an operator could remotely control boom functions, rotate a mixer barrel, or raise and lower a crane, all from a safe distance. The wireless controls can also be programmed to provide feedback via a screen, haptic response or sequenced light-emitting diodes. This function can be used to signal an operator when a crane is fully extended or be programmed to display the amount of weight a trailer is carrying.

The units have undergone Eaton’s proprietary cyber security protocols to prevent the signal being hacked into by an outside source, while sophisticated control algorithms guarantee fail-safe operation. Each controller can be programmed to connect with a vehicle that has been equipped with a receiver installed in the electronic systems of a remote vehicle or machinery.

The wireless controls are compliant with Ingress Protection Code 65 & 67 (IP65 & IP67) ratings, which are “dust tight” and protected against water spray as well as complete, continuous submersion in water. They have been redesigned for better form, fit and function, making them easier to hold and control. The new control units also feature updated radios and lithium ion batteries for better performance.

Eaton’s new wireless lineup offers flexible solutions for customers, and includes the following models:

  • Hand-held TD110
  • Hand-held TD1140 with optional E-Stop
  • Pistol-grip TD2100
  • Small belly-pack TD3100

In addition to the 900 MHz two-way wireless remote-control units, 2.4 GHz versions will launch later this year. Learn more at Eaton.com/wireless.

Eaton’s eMobility business was formed by combining products, expertise and global manufacturing capabilities from Eaton’s Electrical and Vehicle businesses. Eaton plans to further develop new products and technologies, including smart diagnostics, intelligent power electronics and predictive health monitoring systems, to strengthen its global capabilities and deliver intelligent electrification solutions to passenger car, commercial vehicle and off-highway customers. Learn more about Eaton’s eMobility business at Eaton.com/eMobility.

Eaton’s mission is to improve the quality of life and the environment through the use of power management technologies and services. We provide sustainable solutions that help our customers effectively manage electrical, hydraulic, and mechanical power – more safely, more efficiently, and more reliably. Eaton’s 2019 revenues were $21.4 billion, and we sell products to customers in more than 175 countries. We have approximately 93,000 employees. For more information, visit www.eaton.com.


Contacts

Thomas Nellenbach
This email address is being protected from spambots. You need JavaScript enabled to view it.
(216) 333-2876 (cell)

DUBLIN--(BUSINESS WIRE)--The "Motor Soft Starters - Global Market Trajectory & Analytics" report has been added to ResearchAndMarkets.com's offering.


The publisher brings years of research experience to the 6th edition of this report. The 204-page report presents concise insights into how the pandemic has impacted production and the buy side for 2020 and 2021. A short-term phased recovery by key geography is also addressed.

Global Motor Soft Starters Market to Reach $2.1 Billion by 2027

Amid the COVID-19 crisis, the global market for Motor Soft Starters estimated at US$1.5 Billion in the year 2020, is projected to reach a revised size of US$2.1 Billion by 2027, growing at a CAGR of 4.9% over the analysis period 2020-2027.

Oil & Gas, one of the segments analyzed in the report, is projected to record a 4.6% CAGR and reach US$745.1 Million by the end of the analysis period. After an early analysis of the business implications of the pandemic and its induced economic crisis, growth in the Mining segment is readjusted to a revised 5.4% CAGR for the next 7-year period.

The U.S. Market is Estimated at $405.1 Million, While China is Forecast to Grow at 7.5% CAGR

The Motor Soft Starters market in the U.S. is estimated at US$405.1 Million in the year 2020. China, the world`s second largest economy, is forecast to reach a projected market size of US$426.7 Million by the year 2027 trailing a CAGR of 7.5% over the analysis period 2020 to 2027. Among the other noteworthy geographic markets are Japan and Canada, each forecast to grow at 2.7% and 4.4% respectively over the 2020-2027 period. Within Europe, Germany is forecast to grow at approximately 3.1% CAGR.

Power Segment to Record 5.1% CAGR

In the global Power segment, USA, Canada, Japan, China and Europe will drive the 4.7% CAGR estimated for this segment. These regional markets accounting for a combined market size of US$213.5 Million in the year 2020 will reach a projected size of US$294.2 Million by the close of the analysis period. China will remain among the fastest growing in this cluster of regional markets. Led by countries such as Australia, India, and South Korea, the market in Asia-Pacific is forecast to reach US$279.2 Million by the year 2027, while Latin America will expand at a 6.2% CAGR through the analysis period.

Competitors identified in this market include, among others:

  • Siemens AG
  • ABB Ltd.
  • General Electric Company
  • Schneider Electric SA
  • Eaton Corporation PLC
  • Rockwell Automation, Inc.
  • Emerson Electric Company
  • Crompton Greaves Ltd.
  • Littelfuse, Inc.
  • Danfoss A/S
  • WEG SA
  • Toshiba International Corporation Pty., Ltd.
  • Carlo Gavazzi Holding AG
  • Fairford Electronics Ltd.

Key Topics Covered:

I. INTRODUCTION, METHODOLOGY & REPORT SCOPE

II. EXECUTIVE SUMMARY

1. MARKET OVERVIEW

  • Global Competitor Market Shares
  • Motor Soft Starter Market Competitor Market Share Scenario Worldwide (in %): 2019 & 2025
  • Impact of Covid-19 and a Looming Global Recession

2. FOCUS ON SELECT PLAYERS

3. MARKET TRENDS & DRIVERS

4. GLOBAL MARKET PERSPECTIVE

III. MARKET ANALYSIS

IV. COMPETITION

Total Companies Profiled: 57

For more information about this report visit https://www.researchandmarkets.com/r/v8icak


Contacts

ResearchAndMarkets.com
Laura Wood, Senior Press Manager
This email address is being protected from spambots. You need JavaScript enabled to view it.
For E.S.T Office Hours Call 1-917-300-0470
For U.S./CAN Toll Free Call 1-800-526-8630
For GMT Office Hours Call +353-1-416-8900

HOUSTON--(BUSINESS WIRE)--Sunnova Energy International Inc. (“Sunnova”) (NYSE: NOVA) today announced the pricing of its underwritten public offering (the “Offering”) of 10,000,000 shares of Sunnova’s common stock by certain of its stockholders, including affiliates of Energy Capital Partners (collectively, the “Selling Stockholders”), at $25.00 per share. Certain of the Selling Stockholders have granted the underwriters a 30-day option to purchase an additional 1,500,000 shares of common stock. Sunnova is not offering any shares of its common stock in the Offering and will not receive any proceeds from the sale of shares by the Selling Stockholders in the Offering.

BofA Securities, J.P. Morgan, Credit Suisse and Goldman Sachs & Co. LLC are acting as joint book-running managers. Baird and Roth Capital Partners are acting as co-managers.

Sunnova has filed a shelf registration statement on Form S-3 relating to the Offering (including a prospectus) with the Securities and Exchange Commission (the “SEC”) that has become effective. A prospectus supplement relating to the Offering has also been filed with the SEC. Before you invest, you should read the prospectus, the prospectus supplement and other documents that Sunnova may file with the SEC for more complete information about Sunnova and this Offering. A copy of the prospectus supplement and accompanying prospectus relating to the Offering may be obtained from BofA Securities, NC1-004-03-43, 200 North College Street, 3rd Floor, Charlotte, NC 28255-0001, Attention: Prospectus Department or by email at This email address is being protected from spambots. You need JavaScript enabled to view it.; J.P. Morgan Securities LLC, Attention: Broadridge Financial Solutions, 1155 Long Island Avenue, Edgewood, NY 11717, by telephone 1-866-803-9204 or by email at This email address is being protected from spambots. You need JavaScript enabled to view it.; Credit Suisse Securities (USA) LLC, Attn: Prospectus Department, 6933 Louis Stephens Drive, Morrisville, North Carolina 27560, United States, Telephone: 1-800-221-1037, Email: This email address is being protected from spambots. You need JavaScript enabled to view it.; or Goldman Sachs & Co. LLC, Prospectus Department, 200 West Street, New York, NY 10282, Telephone: 1-866-471-2526, Facsimile: 212-902-9316, Email: This email address is being protected from spambots. You need JavaScript enabled to view it..

To obtain a copy of the prospectus supplement or prospectus, free of charge, visit the SEC’s website, www.sec.gov, and search under the registrant’s name “Sunnova Energy International Inc.”

This press release shall not constitute an offer to sell or the solicitation of an offer to buy these securities, nor shall there be any sale of these securities in any state or jurisdiction in which such offer, solicitation or sale would be unlawful prior to registration or qualification under the securities laws of any such state or jurisdiction.

ABOUT SUNNOVA

Sunnova Energy International Inc. (NYSE: NOVA) is a leading residential solar and energy storage service provider, with customers across the U.S. and its territories. Sunnova's goal is to be the source of clean, affordable and reliable energy, with a simple mission: to power energy independence so that homeowners have the freedom to live life uninterrupted™.

FORWARD LOOKING STATEMENTS

This press release contains forward-looking statements within the meaning of Section 27A of the Securities Act of 1933, as amended, and Section 21E of the Securities Exchange Act of 1934, as amended. Forward-looking statements generally relate to future events or Sunnova's future financial or operating performance. In some cases, you can identify forward-looking statements because they contain words such as "may," "will," "should," "expect," "plan," "anticipate," "going to," "could," "intend," "target," "project," "contemplates," "believe," "estimate," "predict," "potential" or "continue" or the negative of these words or other similar terms or expressions that concern Sunnova's expectations, strategy, priorities, plans or intentions. Forward-looking statements in this release include, but are not limited to, statements regarding the conduct of the Offering and the size and terms of the Offering. Sunnova's expectations and beliefs regarding these matters may not materialize, and actual results in future periods are subject to risks and uncertainties that could cause actual results to differ materially from those projected, including risks regarding our ability to forecast our business due to our limited operating history, the effects of the coronavirus pandemic on our business and operations, results of operations and financial position, our competition, fluctuations in the solar and home-building markets, availability of capital, our ability to attract and retain dealers and customers and our dealer and strategic partner relationships. The forward-looking statements contained in this release are also subject to other risks and uncertainties, including those more fully described in Sunnova's filings with the SEC, including our Annual Report on Form 10-K for the year ended December 31, 2019, our Quarterly Reports on Form 10-Q for the quarters ended March 31 and June 30, 2020 and in the registration statement on Form S-3 related to the Offering filed with the SEC. The forward-looking statements in this release are based on information available to Sunnova as of the date hereof, and Sunnova disclaims any obligation to update any forward-looking statements, except as required by law.


Contacts

INVESTOR AND ANALYST CONTACT
Rodney McMahan
Sunnova Energy International Inc.
This email address is being protected from spambots. You need JavaScript enabled to view it.
(281) 971-3323

PRESS AND MEDIA CONTACT
Kelsey Hultberg
Sunnova Energy International Inc.
This email address is being protected from spambots. You need JavaScript enabled to view it.

HOUSTON--(BUSINESS WIRE)--Calpine Corporation:

Summary of Second Quarter 2020 Financial Results (in millions):


Three Months Ended June 30,


Six Months Ended June 30,


2020


2019


% Change


2020


2019


% Change


Operating Revenues

$

1,744


$

2,599


(32.9

)%


$

4,036


$

5,198


(22.4

)%

Income from operations

$

312


$

444


(29.7

)%


$

661


$

802


(17.6

)%

Cash provided by operating activities

$

221


$

278


(20.5

)%


$

434


$

519


(16.4

)%

Net Income1

$

163


$

266


(38.7

)%


$

291


$

441


(34.0

)%

Commodity Margin2

$

723


$

752


(3.9

)%


$

1,311


$

1,531


(14.4

)%

Adjusted Unlevered Free Cash Flow2

$

319


$

360


(11.4

)%


$

545


$

779


(30.0

)%

Adjusted Free Cash Flow2

$

182


$

203


(10.3

)%


$

262


$

467


(43.9

)%

1 Reported as Net Income attributable to Calpine on our Consolidated Condensed Statements of Operations.

2 Non-GAAP financial measure, see “Regulation G Reconciliations” for further details.

Calpine Corporation today reported Net Income of $163 million for the second quarter of 2020 compared to $266 million in the prior year period. The period-over-period decrease in Net Income was primarily due to a decrease in Commodity Margin2 driven in large part by a reduction in capacity revenue received in the ISO-NE and PJM markets and a decrease in non-cash, mark-to-market earnings on our commodity hedge positions for the three months ended June 30, 2020, compared to the same period in 2019. The decrease was partially offset by a favorable period-over-period change in our income taxes resulting from the partial release of our valuation allowance associated with our NOLs during the second quarter of 2020. Cash provided by operating activities for the second quarter of 2020 was $221 million compared to $278 million in the prior year period. The decrease in Cash provided by operating activities, after adjusting for non-cash items, was primarily due to the decrease in Commodity Margin,2 as previously discussed, and an increase in working capital employed primarily resulting from a period-over-period change in energy margin posting requirements due to the return of cash collateral to a counterparty in exchange for a letter of credit during the second quarter of 2020.

Net Income for the first half of 2020 was $291 million compared to Net Income of $441 million in the prior year period. The period-over-period decrease in Net Income was primarily due to a decrease in Commodity Margin2 driven in large part by a reduction in capacity revenue received in the ISO-NE and PJM markets as well as a reduction in contribution from hedges as a result of milder weather in the first quarter of 2020. Cash provided by operating activities for the first half of 2020 was $434 million compared to $519 million in the prior year period. The period-over-period decrease in cash provided by operating activities was primarily due to the decrease in Commodity Margin,2 as previously discussed, partially offset by a decrease in working capital employed primarily resulting from a period-over-period net decrease in energy margin posting requirements and lower inventory purchases.

REGIONAL SEGMENT REVIEW OF RESULTS

Table 1: Commodity Margin by Segment (in millions)


Three Months Ended June 30,


Six Months Ended June 30,


2020


2019


Variance


2020


2019


Variance

West


$

269


$

251


$

18


$

503


$

515


$

(12

)

Texas


172


173


(1

)


285


335


(50

)

East


193


235


(42

)


343


500


(157

)

Retail


89


93


(4

)


180


181


(1

)

Total


$

723


$

752


$

(29

)


$

1,311


$

1,531


$

(220

)

West Region

Second Quarter: Commodity Margin in our West segment increased by $18 million in the second quarter of 2020 compared to the prior year period. Primary drivers were:

+ higher resource adequacy revenue,

+ increased contribution from higher generation driven in part by the restart of our South Point Energy Center during the second half of 2019, and

+ the acquisition on January 28, 2020 of the 25% noncontrolling interest of Russell City Energy Company, LLC which was previously owned by a third party.

Year-to-Date: Commodity Margin in our West segment decreased by $12 million in the first half of 2020 compared to the prior year period. Primary drivers were:

– lower market spark spreads in January and February 2020 resulting largely from lower natural gas prices in Southern California, and

– lower contribution from hedging activity, partially offset by

+ higher resource adequacy revenue, and

+ increased contribution from higher generation driven in part by the restart of our South Point Energy Center during the second half of 2019.

Texas Region

Second Quarter: Commodity Margin in our Texas segment decreased by $1 million in the second quarter of 2020 compared to the prior year period. Primary drivers were:

– lower contribution from hedging activity largely offset by

+ modestly higher market spark spreads.

Year-to-Date: Commodity Margin in our Texas segment decreased by $50 million in the first half of 2020 compared to the prior year period, primarily due to lower contribution from hedging activity.

East Region

Second Quarter: Commodity Margin in our East segment decreased by $42 million in the second quarter of 2020 compared to the prior year period. Primary drivers were:

– lower regulatory capacity revenue in ISO-NE and PJM and

– the sale of our Garrison and RockGen Energy Centers in July 2019.

Year-to-Date: Commodity Margin in our East segment decreased by $157 million in the first half of 2020 compared to the prior year period. Primary drivers were:

– lower regulatory capacity revenue in ISO-NE and PJM,

– the sale of our Garrison and RockGen Energy Centers in July 2019, and

– lower contribution from hedging activity resulting from milder weather during the first quarter of 2020, partially offset by

+ the commencement of commercial operations at our 828 MW York 2 Energy Center in March 2019.

Retail

Second Quarter: Commodity Margin in our Retail segment remained largely unchanged in the second quarter of 2020 compared to the prior year period.

Year-to-Date: Commodity Margin in our Retail segment remained largely unchanged in the first half of 2020 compared to the prior year period.

LIQUIDITY, CASH FLOW AND CAPITAL RESOURCES

Table 2: Liquidity (in millions)


June 30, 2020


December 31, 2019

Cash and cash equivalents, corporate(1)

$

574


$

1,072


Cash and cash equivalents, non-corporate

103


59


Total cash and cash equivalents

677


1,131


Restricted cash

241


345


Corporate Revolving Facility availability(2)

1,534


1,392


CDHI revolving facility availability(3)

1


1


Other facilities availability(4)

37


3


Total current liquidity availability(5)

$

2,490


$

2,872


(1) Our ability to use corporate cash and cash equivalents is unrestricted. On January 21, 2020, we used the remaining cash on hand from the issuance of our 2028 First Lien Notes and 2028 Senior Unsecured Notes to redeem approximately $1,052 million aggregate principal amount of our 2022 and 2024 First Lien Notes and 2023 Senior Unsecured Notes.

(2) Our ability to use availability under our Corporate Revolving Facility is unrestricted. At June 30, 2020, the approximately $2.0 billion in total capacity under our Corporate Revolving Facility is comprised of $462 million in letters of credit outstanding, no borrowings outstanding and $1,534 million in remaining available capacity.

(3) Our CDHI revolving facility is restricted to support certain obligations under PPAs and power transmission and natural gas transportation agreements as well as fund the construction of our Washington Parish Energy Center.

(4) On April 9, 2020, we amended one of our unsecured letter of credit facilities to partially extend the maturity of $100 million in commitments from June 20, 2020 to June 20, 2022. On June 9, 2020, we entered into the GPC Term Loan which provides for $200 million in letter of credit facilities.

(5) Includes $23 million and $127 million of margin deposits posted with us by our counterparties at June 30, 2020 and December 31, 2019, respectively.

Liquidity was approximately $2.5 billion as of June 30, 2020. Cash, cash equivalents and restricted cash decreased by $558 million during the first half of 2020, largely due to the redemption of the remaining $1.1 billion aggregate principal amount of our 2022 and 2024 First Lien Notes and our 2023 Senior Unsecured Notes on January 21, 2020, as further discussed below, partially offset by cash provided by operating activities.

Table 3: Cash Flow Activities (in millions)


Six Months Ended June 30,


2020


2019

Beginning cash, cash equivalents and restricted cash

$

1,476


$

406


Net cash provided by (used in):


Operating activities

434


519


Investing activities

(304

)


(315

)

Financing activities

(688

)


(51

)

Net increase (decrease) in cash, cash equivalents and restricted cash

(558

)


153


Ending cash, cash equivalents and restricted cash

$

918


$

559


Cash provided by operating activities for six months ended June 30, 2020 was $434 million compared to $519 million in the prior year period. The period-over-period decrease in cash provided by operating activities is primarily driven by the reduction in Commodity Margin for the six months ended June 30, 2020, when compared to the same period in 2019. This reduction is partially offset by a reduction in cash employed for working capital driven by a reduction in energy margin posting requirements and lower inventory purchases.

Cash used in investing activities was $304 million for six months ended June 30, 2020 compared to $315 million in the prior year period. The period-over period decrease in cash used is primarily attributable to a decrease in capital expenditures associated with the completion of construction of our York 2 Energy Center in March 2019 as well as timing differences in normal, recurring maintenance projects.

Cash used in financing activities was $688 million during the six months ended June 30, 2020 compared to $51 million in the prior period. The cash used during the first half of 2020 is primarily attributable to the redemption of the outstanding aggregate principal amount of $623 million of our 2023 Senior Unsecured Notes, $245 million of our 2022 First Lien Notes and $184 million of our 2024 First Lien Notes with the proceeds from our 2028 Senior Unsecured Notes and 2028 First Lien Notes issued in December of 2019. In addition, we issued our $900 million Geysers Power Company, LLC (GPC) Term Loan in June 2020 and used a portion of the proceeds to repay approximately $348 million in aggregate principal amount of project debt. We also acquired the 25% noncontrolling interest in Russell City Energy Center, LLC for $35 million plus working capital adjustments of approximately $14 million for a total purchase price of approximately $49 million in January 2020.

COVID-19 Pandemic Update

In March 2020, the World Health Organization categorized the novel coronavirus disease 2019 (COVID-19) as a pandemic, and the President declared the COVID-19 outbreak a national emergency. COVID-19 continues to spread throughout the United States and other countries across the world negatively affecting the global economy, disrupting global supply chains and workforce participation and resulting in significant volatility and disruption of financial markets. While we have noted recovery in certain key geographic areas where we own generation facilities, we continue to closely monitor the impact of the COVID-19 outbreak on all aspects of our business, including how it has affected and continues to affect our employees, customers, suppliers and the communities in which we operate.

Our first priority with regard to the COVID-19 outbreak is to ensure the health and safety of our employees and contractors. As one of the largest independent power producers in the U.S., we are designated as an “essential business” and have an obligation to operate our fleet of power plants to sustain the bulk electric system and manage retail customer power delivery obligations. To ensure the continued reliable operations of our generation fleet and delivery of power to our retail customers, we continue to abide by a set of safety and health measures as a means to ensure we are able to provide reliable energy to the markets we serve. These measures include restricting access at our power plants to only mission-critical individuals and adherence to social distancing protocols wherever possible. Additionally, our commercial and retail operations, including all support staff such as legal, accounting, finance, information technology and human resources, continue to work remotely.

To date, the COVID-19 outbreak has not had a material adverse effect on our operations, financial condition or cash flows. While the ultimate determination depends on the length and severity of the crisis, at this time, we anticipate our cash flows from operations and our available sources of liquidity will be sufficient to meet our current cash requirements during this period. As the impact of the COVID-19 outbreak on the economy and our operations evolves, we will continue to assess and manage our liquidity needs.

The ultimate extent to which the COVID-19 pandemic may impact our business, operating results, financial condition or liquidity will depend on future developments, including the duration of the outbreak, continued business and workforce disruptions, the effectiveness of actions taken to contain and treat the disease and the lasting effect on the economy, especially in the geographic areas where we own and operate power generating facilities and serve retail customers. Given the uncertainty concerning the overall impact of the COVID-19 outbreak, while we do not anticipate the effect of the outbreak to have a material adverse effect on our financial condition, results of operations or cash flows for the year ended December 31, 2020, we are unable to predict the ultimate impact of the outbreak on our future results. For further discussion, see “Item 1A. Risk Factors” in Part II of our Form 10-Q for the quarterly period ended June 30, 2020.

Portfolio Management

On January 28, 2020, we completed the acquisition of the 25% noncontrolling interest of Russell City Energy Company, LLC for $35 million plus working capital adjustments of approximately $14 million for a total purchase price of approximately $49 million. Prior to the acquisition, we accounted for the third party ownership interest as a noncontrolling interest.

Balance Sheet Management

On January 21, 2020, we redeemed the outstanding aggregate principal amount of $245 million of our 2022 First Lien Notes, $184 million of our 2024 First Lien Notes and $623 million of our 2023 Senior Unsecured Notes, which were included in debt, current portion on our Consolidated Condensed Balance Sheet at December 31, 2019, with the proceeds from the 2028 First Lien Notes and 2028 Senior Unsecured Notes that we issued in December 2019, which were included in cash and cash equivalents on our Consolidated Condensed Balance Sheet at December 31, 2019.

On June 9, 2020, GPC and the guarantors party thereto entered into a seven-year $900 million first lien senior secured term loan facility and three senior secured revolving letter of credit facilities totaling $200 million. The GPC Term Loan is certified under the Climate Bonds Standard. Any letters of credit issued under the GPC Term Loan letter of credit facilities must be at the request of and for the account of GPC. The GPC Term Loan bears interest, at GPC’s option, at either (i) the Base Rate, equal to the highest of (a) the Federal Funds Rate plus 0.50% per annum, (b) the prime rate published in the Wall Street Journal, or (c) 1.0% plus an applicable margin of 1.0%, increasing by 0.125% every three years, or (ii) LIBOR plus an applicable margin of 2.0% per annum, increasing by 0.125% every three years. The GPC Term Loan matures on June 9, 2027, but may be prepaid at any time upon irrevocable notice to the Administrative Agent. We used a portion of the proceeds from the GPC Term Loan to repay approximately $348 million of project debt.

The GPC Term Loan is secured by certain real and personal property of GPC consisting primarily of the Geysers Assets. The GPC Term Loan is not guaranteed by Calpine Corporation and is without recourse to Calpine Corporation or any of our non-GPC subsidiaries or assets; however, GPC generates a portion of its cash flows from an intercompany tolling agreement with Calpine Energy Services, L.P. and has various service agreements in place with other subsidiaries of Calpine Corporation.

On August 10, 2020, we issued $650 million in aggregate principal amount of 4.625% senior unsecured notes due 2029 and $850 million in aggregate principal amount of 5.000% senior unsecured notes due 2031 in private placements. The 2029 Senior Unsecured Notes bear interest at 4.625% per annum and the 2031 Senior Unsecured Notes bear interest at 5.000% per annum with interest payable on both series of notes semi-annually on February 1 and August 1 of each year, beginning on February 1, 2021. The 2029 Senior Unsecured Notes and 2031 Senior Unsecured Notes mature on February 1, 2029 and February 1, 2031, respectively.

On August 10, 2020, we utilized proceeds from our 2029 Senior Unsecured Notes and 2031 Senior Unsecured Notes, together with cash on hand, to purchase approximately $255 million and $1,045 million in aggregate principal amount of our 2024 Senior Unsecured Notes and 2025 Senior Unsecured Notes, respectively. On August 12, 2020, we redeemed the remaining amounts outstanding under our 2024 Senior Unsecured Notes and 2025 Senior Unsecured Notes.

PG&E Bankruptcy

On July 1, 2020, PG&E and PG&E Corporation emerged from bankruptcy. Under PG&E's plan of reorganization, our PPAs were assumed and any restrictions on our projects arising from the bankruptcy were cured.

We currently have several power plants that provide energy and energy-related products to PG&E under PPAs, many of which have PG&E collateral posting requirements. Subsequent to the bankruptcy filing, we received all material payments under the PPAs, either directly or through the application of collateral. We also currently have numerous other agreements with PG&E related to the operation of our power plants in Northern California, under which PG&E continued to provide service subsequent to its bankruptcy filing.

ABOUT CALPINE

Calpine Corporation is America’s largest generator of electricity from natural gas and geothermal resources with operations in competitive power markets. Our fleet of 78 power plants in operation or under construction represents over 26,000 megawatts of generation capacity. Through wholesale power operations and our retail businesses Calpine Energy Solutions and Champion Energy, we serve customers in 23 states, Canada and Mexico. Our clean, efficient, modern and flexible fleet uses advanced technologies to generate power in a low-carbon and environmentally responsible manner. We are uniquely positioned to benefit from the secular trends affecting our industry, including the abundant and affordable supply of clean natural gas, environmental regulation, aging power generation infrastructure and the increasing need for dispatchable power plants to successfully integrate intermittent renewables into the grid. Please visit www.calpine.com to learn more about how Calpine is creating power for a sustainable future.

Calpine’s Quarterly Report on Form 10-Q for the quarter ended June 30, 2020, will be filed with the Securities and Exchange Commission (SEC) and will be available on the SEC’s website at www.sec.gov.

FORWARD-LOOKING INFORMATION

In addition to historical information, this release contains “forward-looking statements” within the meaning of the Private Securities Litigation Reform Act of 1995, Section 27A of the Securities Act, and Section 21E of the Exchange Act. Forward-looking statements may appear throughout this release. We use words such as “believe,” “intend,” “expect,” “anticipate,” “plan,” “may,” “will,” “should,” “estimate,” “potential,” “project” and similar expressions to identify forward-looking statements. Such statements include, among others, those concerning our expected financial performance and strategic and operational plans, as well as all assumptions, expectations, predictions, intentions or beliefs about future events. We believe that the forward-looking statements are based upon reasonable assumptions and expectations. However, you are cautioned that any such forward-looking statements are not guarantees of future performance and that a number of risks and uncertainties could cause actual results to differ materially from those anticipated in the forward-looking statements. Such risks and uncertainties include, but are not limited to:

  • Public health threats or outbreaks of communicable diseases, such as the ongoing COVID-19 pandemic and its impact on our business, suppliers, customers, employees and supply chains;
  • Financial results that may be volatile and may not reflect historical trends due to, among other things, seasonality of demand, fluctuations in prices for commodities such as natural gas and power, changes in U.S. macroeconomic conditions, fluctuations in liquidity and volatility in the energy commodities markets and our ability and the extent to which we hedge risks;
  • Laws, regulations and market rules in the wholesale and retail markets in which we participate and our ability to effectively respond to changes in laws, regulations or market rules or the interpretation thereof including those related to the environment, derivative transactions and market design in the regions in which we operate;
  • Our ability to manage our liquidity needs, access the capital markets when necessary and comply with covenants under our Senior Unsecured Notes, First Lien Term Loans, First Lien Notes, Corporate Revolving Facility, CCFC Term Loan and other existing financing obligations;
  • Risks associated with the operation, construction and development of power plants, including unscheduled outages or delays and plant efficiencies;
  • Risks related to our geothermal resources, including the adequacy of our steam reserves, unusual or unexpected steam field well and pipeline maintenance requirements, variables associated with the injection of water to the steam reservoir and potential regulations or other requirements related to seismicity concerns that may delay or increase the cost of developing or operating geothermal resources;
  • Extensive competition in our wholesale and retail business, including from renewable sources of power, interference by states in competitive power markets through subsidies or similar support for new or existing power plants, lower prices and other incentives offered by retail competitors, and other risks associated with marketing and selling power in the evolving energy markets;
  • Structural changes in the supply and demand of power resulting from the development of new fuels or technologies and demand-side management tools (such as distributed generation, power storage and other technologies);
  • The expiration or early termination of our PPAs and the related results on revenues;
  • Future capacity revenue may not occur at expected levels;
  • Natural disasters, such as hurricanes, earthquakes, droughts and floods, acts of terrorism, cyber attacks or wildfires that may affect our power plants or the markets our power plants or retail operations serve and our corporate offices;
  • Disruptions in or limitations on the transportation of natural gas or fuel oil and the transmission of power;
  • Our ability to manage our counterparty and customer exposur

Contacts

Media Relations:
Brett Kerr
713-830-8809
This email address is being protected from spambots. You need JavaScript enabled to view it.

Investor Relations:
Bryan Kimzey
713-830-8777
This email address is being protected from spambots. You need JavaScript enabled to view it.


Read full story here

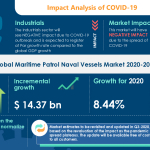
LONDON--(BUSINESS WIRE)--#GlobalMaritimePatrolNavalVesselsMarket--Technavio has been monitoring the maritime patrol naval vessels market and it is poised to grow by $ 14.37 bn during 2020-2024, progressing at a CAGR of almost 9% during the forecast period. The report offers an up-to-date analysis regarding the current market scenario, latest trends and drivers, and the overall market environment.


Although the COVID-19 pandemic continues to transform the growth of various industries, the immediate impact of the outbreak is varied. While a few industries will register a drop in demand, numerous others will continue to remain unscathed and show promising growth opportunities. Technavio’s in-depth research has all your needs covered as our research reports include all foreseeable market scenarios, including pre- & post-COVID-19 analysis. Download a Free Sample Report on COVID-19 Impacts

The market is fragmented, and the degree of fragmentation will accelerate during the forecast period. Austal Ltd., BAE Systems Plc, Damen Shipyards Group NV, Fincantieri Spa, Fr. Fassmer GmbH & Co. KG, Fr. Lürssen Werft GmbH & Co. KG, Mitsubishi Heavy Industries Ltd., Naval Group SA, NAVANTIA SA, and Saab AB are some of the major market participants. To make the most of the opportunities, market vendors should focus more on the growth prospects in the fast-growing segments, while maintaining their positions in the slow-growing segments.

Buy 1 Technavio report and get the second for 50% off. Buy 2 Technavio reports and get the third for free.

View market snapshot before purchasing

Increasing transnational maritime crimes has been instrumental in driving the growth of the market. However, high costs associated with patrol naval vessels might hamper market growth.

Technavio's custom research reports offer detailed insights on the impact of COVID-19 at an industry level, a regional level, and subsequent supply chain operations. This customized report will also help clients keep up with new product launches in direct & indirect COVID-19 related markets, upcoming vaccines and pipeline analysis, and significant developments in vendor operations and government regulations.

Maritime Patrol Naval Vessels Market 2020-2024: Segmentation

Maritime Patrol Naval Vessels Market is segmented as below:

  • Type
    • Manned Maritime Patrol Vessels
    • Unmanned Maritime Patrol Vessels
  • Geographic Landscape
    • APAC
    • Europe
    • MEA
    • North America
    • South America

To learn more about the global trends impacting the future of market research, download a free sample: https://www.technavio.com/talk-to-us?report=IRTNTR40050

Maritime Patrol Naval Vessels Market 2020-2024: Scope

Technavio presents a detailed picture of the market by the way of study, synthesis, and summation of data from multiple sources. The maritime patrol naval vessels market report covers the following areas:

  • Maritime Patrol Naval Vessels Market Size
  • Maritime Patrol Naval Vessels Market Trends
  • Maritime Patrol Naval Vessels Market Industry Analysis

This study identifies the adoption of innovative approaches in procuring patrol naval vessels as one of the prime reasons driving the maritime patrol naval vessels market growth during the next few years.

Technavio suggests three forecast scenarios (optimistic, probable, and pessimistic) considering the impact of COVID-19. Technavio’s in-depth research has direct and indirect COVID-19 impacted market research reports.

Register for a free trial today and gain instant access to 17,000+ market research reports.

Technavio's SUBSCRIPTION platform

Maritime Patrol Naval Vessels Market 2020-2024: Key Highlights

  • CAGR of the market during the forecast period 2020-2024
  • Detailed information on factors that will assist maritime patrol naval vessels market growth during the next five years
  • Estimation of the maritime patrol naval vessels market size and its contribution to the parent market
  • Predictions on upcoming trends and changes in consumer behavior
  • The growth of the maritime patrol naval vessels market
  • Analysis of the market’s competitive landscape and detailed information on vendors
  • Comprehensive details of factors that will challenge the growth of maritime patrol naval vessels market, vendors

Table of Contents:

PART 01: EXECUTIVE SUMMARY

PART 02: SCOPE OF THE REPORT

  • 2.1 Preface
  • 2.2 Preface
  • 2.3 Currency conversion rates for US$

PART 03: MARKET LANDSCAPE

  • Market ecosystem
  • Market characteristics
  • Market segmentation analysis

PART 04: MARKET SIZING

  • Market definition
  • Market sizing 2019
  • Market size and forecast 2019-2024

PART 05: FIVE FORCES ANALYSIS

  • Bargaining power of buyers
  • Bargaining power of suppliers
  • Threat of new entrants
  • Threat of substitutes
  • Threat of rivalry
  • Market condition

PART 06: MARKET SEGMENTATION BY TYPE

  • Market segmentation by type
  • Comparison by type
  • Manned maritime patrol vessels - Market size and forecast 2019-2024
  • Unmanned maritime patrol vessels - Market size and forecast 2019-2024
  • Market opportunity by type

PART 07: CUSTOMER LANDSCAPE

PART 08: GEOGRAPHIC LANDSCAPE

  • Geographic segmentation
  • Geographic comparison
  • APAC - Market size and forecast 2019-2024
  • North America - Market size and forecast 2019-2024
  • Europe - Market size and forecast 2019-2024
  • MEA - Market size and forecast 2019-2024
  • South America - Market size and forecast 2019-2024
  • Key leading countries
  • Market opportunity

PART 09: DECISION FRAMEWORK

PART 10: DRIVERS AND CHALLENGES

  • Market drivers
  • Market challenges

PART 11: MARKET TRENDS

  • Development of high-speed patrol naval vessels
  • Adoption of innovative approaches in procuring patrol naval vessels
  • Growing adoption of 3D printing

PART 12: VENDOR LANDSCAPE

  • Overview
  • Landscape disruption
  • Competitive scenario

PART 13: VENDOR ANALYSIS

  • Vendors covered
  • Vendor classification
  • Market positioning of vendors
  • Austal Ltd.
  • BAE Systems Plc
  • Damen Shipyards Group NV
  • Fincantieri Spa
  • Fr. Fassmer GmbH & Co. KG
  • Fr. Lürssen Werft GmbH & Co. KG
  • Mitsubishi Heavy Industries Ltd.
  • Naval Group SA
  • NAVANTIA SA
  • Saab AB

PART 14: APPENDIX

  • Research methodology
  • List of abbreviations
  • Definition of market positioning of vendors

PART 15: EXPLORE TECHNAVIO

About Us

Technavio is a leading global technology research and advisory company. Their research and analysis focuses on emerging market trends and provides actionable insights to help businesses identify market opportunities and develop effective strategies to optimize their market positions. With over 500 specialized analysts, Technavio’s report library consists of more than 17,000 reports and counting, covering 800 technologies, spanning across 50 countries. Their client base consists of enterprises of all sizes, including more than 100 Fortune 500 companies. This growing client base relies on Technavio’s comprehensive coverage, extensive research, and actionable market insights to identify opportunities in existing and potential markets and assess their competitive positions within changing market scenarios.


Contacts

Technavio Research
Jesse Maida
Media & Marketing Executive
US: +1 844 364 1100
UK: +44 203 893 3200
Email: This email address is being protected from spambots. You need JavaScript enabled to view it.
Website: www.technavio.com/

Through a partnership with Loma Linda University Health, virtual medical group HubMD P.C. acquires additional expertise from top tier specialists, improving the quality and reach of its service to safety-net populations in the region.


REDLANDS, Calif.--(BUSINESS WIRE)--#InlandEmpire--HubMD P.C., a virtual medical group comprised of fully-credentialed and licensed, board-certified specialist physicians, is proud to announce its partnership with Loma Linda University Health, effective July 1.

The Loma Linda University Health Faculty Medical Group (LLUHFMG) is comprised of 544 physicians across 72 specialties in 62 office locations. By joining HubMD, LLUHFMG spurs the expansion of the virtual medical group and fuels its purpose—to improve access to specialty care for safety-net and vulnerable populations.

“Our Faculty Medical Group is built up from a profound knowledge base and rich set of experiences from skilled specialists,” remarked Dr. Anthony Hilliard, Chief Operating Officer; LLUHFMG. “We are thrilled to be joining HubMD in collectively channeling skills and efforts to improve specialty care access among medically underserved populations in the region.”

HubMD specialists offer their expertise to primary care physicians (PCPs) and patients in programs including VideoConsults and eConsult. Short for "electronic consultation," eConsult is a virtual care process that enables PCPs to message specialists regarding patient care and the need for specialty referral. A secure web-based application facilitates this message exchange, allowing specialists to respond, usually within a day, to PCPs’ questions. Through this PCP-specialist dialog, all patients gain virtual access to specialty care and can obtain referrals in a quicker, more efficient manner.

134 carefully selected HubMD specialists covering over 20 specialties have reached hundreds of thousands of patients through safety net hospitals, physicians, health systems, and health plans. HubMD’s recent partnership with the Inland Empire Health Plan (IEHP) allows HubMD specialists to communicate with 530+ primary care physicians across 93 clinics via eConsult through the IEHP-funded Multi-County eConsult Initiative (MCeI). Through this work, HubMD specialists are helping to facilitate access to specialty care for over 1.25 million safety-net patients.

Over 30 LLUHFMG specialists in cardiology, hepatology, pulmonology, infectious diseases, and endocrinology have already been working with HubMD. The newly signed contract holds that HubMD will continue to work with LLUHFMG to fill any needed gaps among safety net physicians for which LLUHFMG possesses unique expertise, such as transplant hematology and nephrology.

“With the addition of the Loma Linda Health Faculty Medical Group’s expansive specialty expertise, HubMD will continue its work for IEHP and expand access to other safety net providers,” said HubMD CEO Dr. Stanley Frencher Jr.

About HubMD P.C.

HubMD P.C. is a virtual care medical group of physician specialists transforming how healthcare is delivered. Enabling virtual care and telehealth through professional services provided by fully-credentialed and licensed, board-certified doctors, HubMD's primary mission lies in improving access to quality care for vulnerable patients—those who are geographically isolated in rural communities, socially isolated in correctional facilities, as well as economically disadvantaged in often racially and ethnically segregated communities. 100 carefully selected specialists covering over 20 specialties have reached hundreds of thousands of patients through HubMD’s work with safety net hospitals, physicians, health systems, and health plans. HubMD specialists offer their expertise to primary care physicians and patients in programs like eConsult and VideoConsults.

Together, HubMD and WISE Healthcare are broadening their reach and ability to impact patient lives through innovative means. Activating collaborative ethics, HubMD specialists are shaping a future where both access and delivery of healthcare prove flexible, mindful, and, most of all, empowering to patients and to clinicians alike.

For more information, please visit www.HubMD.org

About Loma Linda University Health

Loma Linda University Health includes Loma Linda University's eight professional schools, Loma Linda University Medical Center's six hospitals and more than 1,200 faculty physicians located in the Inland Empire of Southern California. Established in 1905, Loma Linda University Health is a global leader in education, research and clinical care. It offers over 100 academic programs and provides quality health care to over 40,000 inpatients and 1.5 million outpatients each year.

For more information, please visit https://lluh.org/


Contacts

WISE Healthcare
Lisa Aubry
This email address is being protected from spambots. You need JavaScript enabled to view it.

HubMD
Dr. Stanley Frencher Jr.
This email address is being protected from spambots. You need JavaScript enabled to view it.

SPRING, Texas--(BUSINESS WIRE)--Southwestern Energy Company (“Southwestern Energy”) (NYSE: SWN) priced its previously announced underwritten public offering of 55,000,000 shares of its common stock (the “offering”) at a price to the public of $2.50 per share, before underwriting discounts and commissions. The total gross proceeds of the offering (before underwriter's discounts and commissions and estimated offering expenses) are expected to be approximately $137.5 million. In addition, Southwestern Energy granted the respective underwriters a 30-day option to purchase up to 8,250,000 additional shares of its common stock.


Southwestern Energy intends to use the net proceeds from the offering to partially redeem Montage Resource Corporation’s (“Montage”) issued and outstanding senior notes that it will assume upon the closing of its recently announced merger with Montage (the “Merger”). If the Merger is not consummated, Southwestern Energy intends to use the net proceeds from this offering for general corporate purposes, including the repayment of debt. Until Southwestern Energy applies the net proceeds from this offering for the purposes described above, it may invest such proceeds in short-term, liquid investments or to reduce the balance under its credit agreement. The net proceeds from any exercise by the underwriters of their option to purchase additional shares of common stock from us will be used to redeem additional Montage notes after the consummation of the Merger or for general corporate purposes, including the repayment of debt. The closing of the offering, which is expected to occur on August 18, 2020, is subject to customary closing conditions.

Citigroup, Goldman Sachs & Co. LLC and J.P. Morgan are acting as representatives of the underwriters and joint book-running managers for the offering. BofA Securities, BMO Capital Markets, RBC Capital Markets and Wells Fargo Securities are also serving as joint book-running managers for the offering.

The offering is being made under an effective automatic shelf registration statement on Form S-3 (Registration No. 333-238633) filed by Southwestern Energy with the Securities and Exchange Commission (“SEC”) and only by means of a prospectus supplement and accompanying base prospectus. A preliminary prospectus supplement has been filed with the SEC to which this communication relates. Prospective investors should read the preliminary prospectus supplement and the accompanying base prospectus included in the registration statement and other documents Southwestern Energy has filed with the SEC for more complete information about Southwestern Energy and the offering. These documents are available at no charge by visiting EDGAR on the SEC website at http://www.sec.gov.

Alternatively, a copy of the base prospectus and the preliminary prospectus supplement may be obtained, when available, from:

Citigroup
c/o Broadridge Financial Solutions
1155 Long Island Avenue
Edgewood, NY 11717
Telephone: 800-831-9146

Goldman Sachs & Co. LLC
Attention: Prospectus Department
200 West Street
New York, NY 10282
Telephone: 866-471-2526
Facsimile: 212-902-9316
Email: This email address is being protected from spambots. You need JavaScript enabled to view it.

J.P. Morgan Securities LLC
c/o Broadridge Financial Solutions
Attention: Prospectus Department
1155 Long Island Avenue
Edgewood, NY 11717
Telephone: 866-803-9204

This news release shall not constitute an offer to sell or the solicitation of an offer to buy these securities, nor shall there be any sale of these securities, in any state or jurisdiction in which such offer, solicitation or sale of these securities would be unlawful prior to registration or qualification under the securities laws of any such state or jurisdiction.

About Southwestern Energy

Southwestern Energy Company is an independent energy company engaged in natural gas, natural gas liquids and oil exploration, development, production and marketing.

Forward Looking Statement

This news release contains forward-looking statements. Forward-looking statements relate to future events, including, but not limited to, anticipated results of operations, business strategies, other aspects of Southwestern Energy’s operations or operating results, the proposed offering, the use of proceeds of the offering and the consummation of the Merger. In many cases you can identify forward-looking statements by terminology such as words “believe,” “expect,” “anticipate,” “plan,” “intend,” “foresee,” “predict,” “budget,” “should,” “would,” “could,” “attempt,” “appears,” “forecast,” “outlook,” “estimate,” “continue,” “project,” “projection,” “goal,” “model,” “target,” “potential,” “may,” “will,” “objective,” “guidance,” “outlook,” “effort,” “are likely” and other similar expressions. Where, in any forward-looking statement, the company expresses an expectation or belief as to future results, such expectation or belief is expressed in good faith and believed to have a reasonable basis. However, there can be no assurance that such expectation or belief will result or be achieved. The actual results of operations can and will be affected by a variety of risks and other matters including, but not limited to, changes in commodity prices; changes in expected levels of natural gas and oil reserves or production; operating hazards, drilling risks, unsuccessful exploratory activities; limited access to capital or significantly higher cost of capital related to illiquidity or uncertainty in the domestic or international financial markets; international monetary conditions; unexpected cost increases; potential liability for remedial actions under existing or future environmental regulations; potential liability resulting from pending or future litigation; and general domestic and international economic and political conditions; as well as changes in tax, environmental and other laws applicable to the company’s business. Other factors that could cause actual results to differ materially from those described in the forward-looking statements include other economic, business, competitive and/or regulatory factors affecting the company’s business generally as set forth in the company’s filings with the SEC. Unless legally required, Southwestern Energy Company undertakes no obligation to update publicly any forward-looking statements, whether as a result of new information, future events or otherwise.


Contacts

Investor Contacts
Brittany Raiford
Director, Investor Relations
(832) 796-7906
This email address is being protected from spambots. You need JavaScript enabled to view it.

Bernadette Butler
Investor Relations Advisor
(832) 796-6079
This email address is being protected from spambots. You need JavaScript enabled to view it.

DUBLIN--(BUSINESS WIRE)--The "Drilling Waste Management - Global Market Trajectory & Analytics" report has been added to ResearchAndMarkets.com's offering.


The publisher brings years of research experience to the 6th edition of this report. The 173-page report presents concise insights into how the pandemic has impacted production and the buy side for 2020 and 2021. A short-term phased recovery by key geography is also addressed.

Global Drilling Waste Management Market to Reach $6.4 Billion by 2027

Amid the COVID-19 crisis, the global market for Drilling Waste Management estimated at US$4.7 Billion in the year 2020, is projected to reach a revised size of US$6.4 Billion by 2027, growing at a CAGR of 4.6% over the analysis period 2020-2027.

Treatment & Disposal, one of the segments analyzed in the report, is projected to record a 4.4% CAGR and reach US$2.7 Billion by the end of the analysis period. After an early analysis of the business implications of the pandemic and its induced economic crisis, growth in the Containment & Handling segment is readjusted to a revised 4.1% CAGR for the next 7-year period.

The U.S. Market is Estimated at $1.4 Billion, While China is Forecast to Grow at 4.3% CAGR

The Drilling Waste Management market in the U.S. is estimated at US$1.4 Billion in the year 2020. China, the world's second largest economy, is forecast to reach a projected market size of US$1.1 Billion by the year 2027 trailing a CAGR of 4.3% over the analysis period 2020 to 2027. Among the other noteworthy geographic markets are Japan and Canada, each forecast to grow at 4.3% and 3.6% respectively over the 2020-2027 period. Within Europe, Germany is forecast to grow at approximately 3.8% CAGR.

Solids Control Segment to Record 5.2% CAGR

In the global Solids Control segment, USA, Canada, Japan, China and Europe will drive the 5.2% CAGR estimated for this segment. These regional markets accounting for a combined market size of US$1.2 Billion in the year 2020 will reach a projected size of US$1.7 Billion by the close of the analysis period. China will remain among the fastest growing in this cluster of regional markets. Led by countries such as Australia, India, and South Korea, the market in Asia-Pacific is forecast to reach US$731.5 Million by the year 2027.

Competitors identified in this market include, among others:

  • Augean plc
  • Baker Hughes, a GE company
  • Derrick Equipment Company
  • Halliburton
  • HeBei GN Solids Control Co.Ltd.
  • Imdex Ltd
  • National Oilwell Varco, Inc.
  • Nuverra Environmental Solutions, Inc.
  • Ridgeline Canada, Inc.
  • Schlumberger Ltd.
  • Scomi Group Bhd
  • Secure Energy Services Inc.
  • Soiltech AS
  • Soli-Bond, Inc.
  • Specialty Drilling Fluids Ltd.
  • STEP OILTOOLS
  • Tervita Corporation
  • Twma Ltd.
  • Weatherford International Ltd.
  • Xi'an Kosun Machinery Co., Ltd.

Key Topics Covered:

I. INTRODUCTION, METHODOLOGY & REPORT SCOPE

II. EXECUTIVE SUMMARY

1. MARKET OVERVIEW

  • Global Competitor Market Shares
  • Drilling Waste Management Competitor Market Share Scenario Worldwide (in %): 2019 & 2025
  • Impact of COVID-19 and a Looming Global Recession

2. FOCUS ON SELECT PLAYERS

3. MARKET TRENDS & DRIVERS

4. GLOBAL MARKET PERSPECTIVE

III. MARKET ANALYSIS

IV. COMPETITION

Total Companies Profiled: 41

For more information about this report visit https://www.researchandmarkets.com/r/mbtc73


Contacts

ResearchAndMarkets.com
Laura Wood, Senior Press Manager
This email address is being protected from spambots. You need JavaScript enabled to view it.
For E.S.T Office Hours Call 1-917-300-0470
For U.S./CAN Toll Free Call 1-800-526-8630
For GMT Office Hours Call +353-1-416-8900

AI is already used in commercial facilities to reduce energy consumption and improve operations, and could help create safer socially distant spaces during COVID-19


BOULDER, Colo.--(BUSINESS WIRE)--#AI--A new report from Guidehouse Insights defines artificial intelligence (AI) for the commercial building space, discusses how AI can help solve problems in commercial buildings, and offers a roadmap for assessing and deploying AI solutions.

Despite its hype across many sectors, AI is simply the use of advanced computer science techniques that mimic human cognition to solve problems. In commercial buildings, the technology is already being used to reduce energy consumption and improve operations, and is also being evaluated for its ability to support social distancing protocols arising from COVID-19. Click to tweet: According to a new report from @WeAreGHInsights, beyond the hype, use cases demonstrate AI’s value to building owners, managers, and tenants.

“Vendors often tout their solutions for commercial buildings in ways that sound almost magical,” says Neil Strother, principal research analyst at Guidehouse Insights. “But seen in its proper context, AI is the implementation of advanced computer science techniques that emulate human-like capabilities to solve problems, create greater efficiencies, and deliver positive business outcomes for commercial facilities.”

To position for success, Guidehouse Insights recommends stakeholders overlook AI’s hype and learn from companies already using the technology. Stakeholders should embrace AI as part of a short-term and long-term strategy, and must focus on using quality data to support implementations.

The report, The Future of AI for Smart Buildings, examines AI for the commercial building space and discusses how AI can help solve problems in commercial buildings. In addition, the report offers a roadmap for assessing and deploying AI solutions, as well as recommendations for stakeholders. An executive summary of the report is available for free download on the Guidehouse Insights website.

About Guidehouse Insights

Guidehouse Insights, the dedicated market intelligence arm of Guidehouse, provides research, data, and benchmarking services for today’s rapidly changing and highly regulated industries. Our insights are built on in-depth analysis of global clean technology markets. The team’s research methodology combines supply-side industry analysis, end-user primary research, and demand assessment, paired with a deep examination of technology trends, to provide a comprehensive view of emerging resilient infrastructure systems. Additional information about Guidehouse Insights can be found at www.guidehouseinsights.com.

About Guidehouse

Guidehouse is a leading global provider of consulting services to the public and commercial markets with broad capabilities in management, technology, and risk consulting. We help clients address their toughest challenges with a focus on markets and clients facing transformational change, technology-driven innovation and significant regulatory pressure. Across a range of advisory, consulting, outsourcing, and technology/analytics services, we help clients create scalable, innovative solutions that prepare them for future growth and success. Headquartered in Washington DC, the company has more than 7,000 professionals in more than 50 locations. Guidehouse is led by seasoned professionals with proven and diverse expertise in traditional and emerging technologies, markets and agenda-setting issues driving national and global economies. For more information, please visit: www.guidehouse.com.

* The information contained in this press release concerning the report, The Future of AI for Smart Buildings, is a summary and reflects the current expectations of Guidehouse Insights based on market data and trend analysis. Market predictions and expectations are inherently uncertain and actual results may differ materially from those contained in this press release or the report. Please refer to the full report for a complete understanding of the assumptions underlying the report’s conclusions and the methodologies used to create the report. Neither Guidehouse Insights nor Guidehouse undertakes any obligation to update any of the information contained in this press release or the report.


Contacts

Lindsay Funicello-Paul
+1.781.270.8456
This email address is being protected from spambots. You need JavaScript enabled to view it.

DULUTH, Minn.--(BUSINESS WIRE)--ALLETE Clean Energy, a wholly owned subsidiary of ALLETE (NYSE: ALE), announced today a $50,000 grant in partnership with GE Renewable Energy and Wanzek to the Mill Creek School District in Mill Creek, Oklahoma.


The school district will use most of the money to purchase about 70 iPads for students and 16 laptops for teachers. With the grant money in hand, in addition to a $33,000 federal grant, the school district can afford to supply all K-12 students and teachers with the devices and curriculum they need for remote learning.

“We have a long tradition at ALLETE Clean Energy of working with our partners to donate to communities near our wind sites, which deliver clean energy while also supporting local communities and economies. We saw a timely grant to equip the school district with the tools it needs to conduct remote classes, and to keep students and staff safer at home, as the most meaningful way we could help during COVID-19,” said ALLETE Clean Energy President Allan S. Rudeck Jr. “Anything we can do to sustain students’ engagement and learning during this challenging time will help keep their education on track. We appreciate GE and Wanzek as strong partners who share our values, and are happy to have their support as we make a difference in our host communities.”

ALLETE Clean Energy owns and is developing the nearby Diamond Spring wind project, which will supply Walmart, Starbucks and Smithfield Foods with renewable energy. Diamond Spring, which is expected to be operational this fall, will be capable of producing 303 megawatts of electricity, enough to power about 110,000 homes. GE Renewable Energy supplied 112 2.X MW turbines for Diamond Spring, and Wanzek is the engineering, procurement and construction contractor at the site.

“Wanzek enters every project with the understanding that we are simply guests in the local community,” said Diamond Spring Senior Project Manager Brendon Lamppa. “Part of our planning process is to find creative ways to integrate ourselves into these communities while we are in the area. When the opportunity to partner up with ALLETE Clean Energy to assist a local school in their time of need amidst the current pandemic presented itself, Wanzek was on board without hesitation. Wanzek team members truly believe that leaving a positive and lasting memory that exists long after our departure is of the utmost importance.”

Vikas Anand, GE Renewable Energy’s CEO for Onshore Wind, Americas, said, “GE Renewable Energy is a proud partner with ALLETE Clean Energy on the Diamond Spring wind project. Together with ALLETE and Wanzek, we’re happy to support the Mill Creek School District and local community with critical technology necessary for students and teachers during these unprecedented times.”

The donation is a relief to Mill Creek School administrators facing the daunting task of educating students during a pandemic.

“These companies have never been in this school nor have I met their people and they were so willing to help,” said School Superintendent Lorinda Chancellor. “I look forward to the day we can meet soon and I can personally thank them for this amazing donation. We are so grateful and blessed!”

ALLETE Clean Energy acquires, develops and operates clean and renewable energy projects. ALLETE Clean Energy owns, operates and has in advanced construction approximately 1,300 megawatts of nameplate capacity wind energy generation in seven states that is contracted under PSAs of various durations. ALLETE Clean Energy also engages in the development of wind energy facilities to operate under long-term PSAs or for sale to others upon completion.

ALLETE Inc. is an energy company headquartered in Duluth, Minnesota. In addition to its electric utilities, Minnesota Power and Superior Water, Light and Power of Wisconsin, ALLETE owns ALLETE Clean Energy, based in Duluth; BNI Energy in Bismarck, North Dakota; and has an eight percent equity interest in the American Transmission Co. More information about ALLETE is available at www.allete.com. ALE-CORP

The statements contained in this release and statements that ALLETE may make orally in connection with this release that are not historical facts, are forward-looking statements. Actual results may differ materially from those projected in the forward-looking statements. These forward-looking statements involve risks and uncertainties and investors are directed to the risks discussed in documents filed by ALLETE with the Securities and Exchange Commission.


Contacts

Amy Rutledge
Manager - Corporate Communications
Minnesota Power/ALLETE
218-723-7400
This email address is being protected from spambots. You need JavaScript enabled to view it.

DUBLIN--(BUSINESS WIRE)--The "Global Wind Energy Equipment Logistics Market 2020-2024" report has been added to ResearchAndMarkets.com's offering.


The global wind energy equipment logistics market is poised to grow by $23.85 billion during 2020-2024, progressing at a CAGR of 7% during the forecast period.

This report provides a holistic analysis, market size and forecast, trends, growth drivers, and challenges, as well as vendor analysis covering around 25 vendors. The report offers an up-to-date analysis regarding the current global market scenario, latest trends and drivers, and the overall market environment.

The market is driven by the growing global oversized cargo transportation market, increased capacity of trailers and shipping vessels, and increased service reliability by implementing new technologies in logistics industry.

The study identifies the increasing long-term revenues driven by long-term agreements in wind energy projects as one of the prime reasons driving the wind energy equipment logistics market growth during the next few years. Also, augmented demand for offshore wind projects, and increased use of multimodal transportation in wind energy projects will lead to sizable demand in the market.

The global wind energy equipment logistics market is segmented as below:

By End-user

  • Road
  • Sea
  • Rail
  • Air

By Geographic Landscapes

  • APAC
  • Europe
  • North America
  • South America
  • MEA

The robust vendor analysis is designed to help clients improve their market position, and in line with this, this report provides a detailed analysis of several leading wind energy equipment logistics market vendors that include:

  • A.P. Moller-Maersk
  • BDP International Inc.
  • C.H. Robinson Worldwide Inc.
  • CEVA Logistics
  • DB Schenker
  • Deutsche Post DHL Group
  • DSV Panalpina A/S
  • Expeditors International of Washington Inc.
  • FedEx Corp.
  • Nippon Express Co. Ltd.

Also, the wind energy equipment logistics market analysis report includes information on upcoming trends and challenges that will influence market growth. This is to help companies strategize and leverage on all forthcoming growth opportunities.

For more information about this report visit https://www.researchandmarkets.com/r/yz0av


Contacts

ResearchAndMarkets.com
Laura Wood, Senior Press Manager
This email address is being protected from spambots. You need JavaScript enabled to view it.
For E.S.T Office Hours Call 1-917-300-0470
For U.S./CAN Toll Free Call 1-800-526-8630
For GMT Office Hours Call +353-1-416-8900

DUBLIN--(BUSINESS WIRE)--The "Industrial Pump Rentals - Global Market Trajectory & Analytics" report has been added to ResearchAndMarkets.com's offering.


The publisher brings years of research experience to the 8th edition of this report. The 290-page report presents concise insights into how the pandemic has impacted production and the buy side for 2020 and 2021. A short-term phased recovery by key geography is also addressed.

Global Industrial Pump Rentals Market to Reach $3.9 Billion by 2027

Amid the COVID-19 crisis, the global market for Industrial Pump Rentals estimated at US$2.5 Billion in the year 2020, is projected to reach a revised size of US$3.9 Billion by 2027, growing at a CAGR of 7% over the analysis period 2020-2027.

Bypass Pumping, one of the segments analyzed in the report, is projected to record a 7.5% CAGR and reach US$1.7 Billion by the end of the analysis period. After an early analysis of the business implications of the pandemic and its induced economic crisis, growth in the Dewatering segment is readjusted to a revised 6.7% CAGR for the next 7-year period.

The U.S. Market is Estimated at $664.4 Million, While China is Forecast to Grow at 10.7% CAGR

The Industrial Pump Rentals market in the U.S. is estimated at US$664.4 Million in the year 2020. China, the world's second largest economy, is forecast to reach a projected market size of US$868.8 Million by the year 2027 trailing a CAGR of 10.7% over the analysis period 2020 to 2027. Among the other noteworthy geographic markets are Japan and Canada, each forecast to grow at 3.8% and 6.3% respectively over the 2020-2027 period. Within Europe, Germany is forecast to grow at approximately 4.5% CAGR.

Large Volume Pumping Segment to Record 6.4% CAGR

In the global Large Volume Pumping segment, USA, Canada, Japan, China and Europe will drive the 5.9% CAGR estimated for this segment. These regional markets accounting for a combined market size of US$605.4 Million in the year 2020 will reach a projected size of US$905.9 Million by the close of the analysis period. China will remain among the fastest growing in this cluster of regional markets. Led by countries such as Australia, India, and South Korea, the market in Asia-Pacific is forecast to reach US$538.8 Million by the year 2027, while Latin America will expand at a 7.7% CAGR through the analysis period.

Competitors identified in this market include, among others:

  • ACTION International Services
  • Barco Pump
  • CORNELL PUMP COMPANY
  • Global Pump Company, LLC
  • Holland Pump Company
  • Integrated Pump Rental (Pty.) Ltd.
  • MWI Pumps
  • Selwood Ltd.
  • Thompson Pump
  • Tsurumi America, Inc.
  • United Rentals, Inc.
  • Xylem, Inc.

Key Topics Covered:

I. INTRODUCTION, METHODOLOGY & REPORT SCOPE

II. EXECUTIVE SUMMARY

1. MARKET OVERVIEW

  • Global Competitor Market Shares
  • Industrial Pump Rental Competitor Market Share Scenario Worldwide (in %): 2019 & 2025
  • Impact of COVID-19 and a Looming Global Recession

2. FOCUS ON SELECT PLAYERS

3. MARKET TRENDS & DRIVERS

4. GLOBAL MARKET PERSPECTIVE

III. MARKET ANALYSIS

IV. COMPETITION

Total Companies Profiled: 47

For more information about this report visit https://www.researchandmarkets.com/r/6yjwjm


Contacts

ResearchAndMarkets.com
Laura Wood, Senior Press Manager
This email address is being protected from spambots. You need JavaScript enabled to view it.
For E.S.T Office Hours Call 1-917-300-0470
For U.S./CAN Toll Free Call 1-800-526-8630
For GMT Office Hours Call +353-1-416-8900

GREENWICH, Conn.--(BUSINESS WIRE)--Diamond S Shipping Inc. (NYSE: DSSI) (“Diamond S”, or the “Company”), one of the largest publicly listed owners and operators of crude oil and product tankers, today announced results for the second quarter of 2020.


Highlights for the Second Quarter and Recent Events

-- Net income attributable to Diamond S of $45.7 million, or $1.15 per basic share, and Adjusted EBITDA (see Non-GAAP Measures section below) of $84.1 million.

-- Repaid $73.6 million of debt in the quarter, $40.0 million on revolving credit facilities in addition to $33.6 million of scheduled repayments. Net debt at June 30, 2020 was $640.0 million, implying a net debt to asset value leverage ratio of 41% based on broker valuations as of June 2020. At quarter end, total free liquidity available to the Company was $128.4 million.

-- Entered into a strategic partnership with NORDEN A/S, DiaNor, to facilitate the commercial consolidation of two of the world’s largest owner/operators of product tankers. As of June 30, 2020, five of the expected 28 vessels were delivered into the Norient Product Pool. The remaining 23 vessels are expected to deliver in the first half of Q3 2020.

-- Entered into floating-to-fixed LIBOR interest rate swaps on approximately 25% of the Company’s total outstanding debt. The average fixed LIBOR rate of 0.54% matures in December 2024.

-- As of August 12, 2020, fixed approximately 59% of Crude Fleet revenue days operating in the spot market at an average rate of approximately $25,700 per day and approximately 55% of Product Fleet revenue days operating in the spot market at an average rate of approximately $11,000 per day in the third quarter of 2020.

Craig H. Stevenson Jr., President and CEO of Diamond S, commented: “We are pleased with our performance in the second quarter, which is reflected in our strong financial results. Our primary focus is on positioning Diamond S to deliver outstanding cash flows in normalized market conditions. For this reason, we continue to lower our leverage, thereby improving our already competitive breakeven levels. We allocated excess capital in the quarter to paying down our debt by reducing exposure on our revolving credit facilities. These amounts may be redrawn in the future to provide liquidity or capital for opportunistic strategic moves. We remain positive in our long-term market outlook and we strongly believe the current market price of our shares does not reflect the underlying value of our vessels.”

Second Quarter 2020 Results

Net income attributable to Diamond S for the second quarter of 2020 was $45.7 million, or $1.15 basic and $1.14 diluted earnings per share, compared to a net loss of $8.5 million, or $0.21 basic and diluted loss per share, for the second quarter of 2019. The increase is primarily related to improved tanker market conditions in both the crude and product tanker segments.

The Company groups its business primarily by commodity transported and segments its fleet into a 16-vessel crude oil transportation fleet (the “Crude Fleet”) and a 50-vessel refined petroleum product transportation fleet (the “Product Fleet”). The Crude Fleet consists of 15 Suezmax vessels and one Aframax vessel. The Product Fleet consists of 44 medium range (“MR2”) vessels and 6 Handysize (“MR1”) vessels.

Net revenues for the Company, which represents voyage revenues less voyage expenses, were $134.2 million for the second quarter of 2020 compared to $83.4 million for the second quarter of 2019. Net revenues from the Crude Fleet were $55.2 million in the second quarter of 2020 compared to $24.4 million for the second quarter of 2019. Net revenues from the Product Fleet were $79.0 million in the second quarter of 2020 compared to $59.0 million for the second quarter of 2019. The increase in net revenues in both the Crude Fleet and Product Fleet was principally driven by stronger market conditions. Despite the demand destruction caused by the global pandemic, tanker markets were firm because of the sharp contango structure of the crude oil price curve, where the future price of oil was expected to be substantially greater than current prices. This led to a strong demand for the floating storage of oil and petroleum products on tankers, which effectively decreased the supply of ships for transport cargos and increased freight rates.

Vessel expenses were $41.7 million for the second quarter of 2020 compared to $42.4 million for the second quarter of 2019. Vessel expenses, which include crew costs, insurance, repairs and maintenance, lubricants and spare parts, technical management fees and other miscellaneous expenses, decreased by $0.7 million primarily due to the sale of the two MR2 vessels in the third quarter of 2019.

Depreciation and amortization expense was $28.8 million in the second quarter of 2020 compared to $29.2 million for the second quarter of 2019. The decrease in depreciation and amortization expense was primarily due to the sale of two MR2 vessels in the third quarter of 2019.

General and administrative expenses were $7.5 million in the second quarter of 2020 compared to $7.3 million for the second quarter of 2019.

Interest expense was $9.7 million in the second quarter of 2020 compared to $13.4 million for the second quarter of 2019. Interest expense decreased in the second quarter of 2020 due to a lower average debt balance as a result of mandatory debt repayments and a decrease in the effective interest rate.

Other income, which consists primarily of interest income, was less than $0.1 million in the second quarter of 2020, compared to $0.3 million for the second quarter of 2019.

Liquidity

As of June 30, 2020, the Company had $124.1 million in cash and restricted cash. Restricted cash and minimum cash required by debt covenants was $55.7 million. In the second quarter of 2020, the Company repaid $40.0 million drawn from its revolving credit facilities, increasing available liquidity to $128.4 million net of minimum cash requirements as of June 30, 2020.

Outlook

Tanker market conditions are expected to weaken in the third quarter as the inventory storage cycle reverses during a seasonally weak period for demand. Demand has not yet fully recovered from the impact of COVID-19, although it has improved from low levels at the start of the second quarter of 2020. In the near term, however, effective fleet supply is expected to increase as the number of vessels used for storage decreases, while tanker demand is expected to be low due to drawdowns of inventory coupled with seasonal market weakness.

As of August 12, 2020, approximately 59% of the Crude Fleet revenue days operating in the spot market in the third quarter of 2020 have been fixed at an average rate of $25,700 per day. Approximately 55% of the Product Fleet revenue days operating in the spot market have been fixed at an average rate of $11,000 per day in the third quarter of 2020.

Conference Call

The Company will hold a conference call on August 13, 2020 at 8:00 a.m. Eastern Time to discuss its results for the second quarter of 2020.

To access the call, participants should dial +1 866 211-4137 for domestic callers and +1 647 689-6723 for international callers. Participants are encouraged to dial in ten minutes prior to the call. Please enter passcode 3179296.

A live webcast of the conference call will be available from the Company’s website at www.diamondsshipping.com.

An audio replay of the conference call will be available starting at 11 a.m. ET on Thursday August 13, 2020 through Thursday, August 20, 2020 by dialing in +1 800 585-8367 or +1 416 621-4642 and entering the passcode 3179296.

About Diamond S Shipping Inc.

Diamond S Shipping Inc. (NYSE: DSSI) owns and operates 66 vessels on the water, including 15 Suezmax vessels, one Aframax and 50 medium-range (MR) product tankers. Diamond S is one of the largest energy shipping companies providing seaborne transportation of crude oil, refined petroleum and other petroleum products. The Company is headquartered in Greenwich, CT. More information about Diamond S can be found at www.diamondsshipping.com.

Disclosure Regarding Forward-Looking Statements

Matters discussed in this press release may constitute forward‐looking statements including statements concerning plans, objectives, goals, strategies, future events or performance, and underlying assumptions. Although management believes that these assumptions were reasonable when made, because these assumptions are inherently subject to significant uncertainties and contingencies which are difficult or impossible to predict and are beyond the Company’s control, there can be no assurance that the Company will achieve or accomplish these expectations, beliefs or projections. Some of the factors that could cause our actual results or conditions to differ materially include unforeseen liabilities; future capital expenditures, revenues, expenses, earnings, synergies, economic performance, indebtedness, financial condition, losses, future prospects, business and management strategies for the management, expansion and growth of the Company’s operations; risks relating to the integration of assets or operations of entities that it has or may in the future acquire and the possibility that the anticipated synergies and other benefits of such acquisitions may not be realized within expected timeframes or at all; the failure of counterparties to fully perform their contracts with the Company; the strength of world economies and currencies; the duration and impact of the COVID-19 (coronavirus) outbreak; general market conditions, including fluctuations in charter rates and vessel values; changes in demand for tanker vessel capacity; changes in the Company’s operating expenses, including bunker prices; drydocking and insurance costs; the market for the Company’s vessels; availability of financing and refinancing; charter counterparty performance; ability to obtain financing and comply with covenants in such financing arrangements; changes in governmental rules and regulations or actions taken by regulatory authorities; potential liability from pending or future litigation; general domestic and international political conditions; potential disruption of shipping routes due to accidents or political events; vessels breakdowns and instances of off‐hires; and other factors. Please see the Company's filings with the SEC for a more complete discussion of certain of these and other risks and uncertainties. The Company undertakes no obligation, and specifically declines any obligation, except as required by law, to publicly update or revise any forward‐looking statements, whether as a result of new information, future events or otherwise.


DIAMOND S SHIPPING INC. AND SUBSIDIARIES

Condensed Consolidated Balance Sheets

as of June 30, 2020 and December 31, 2019

(In Thousands, except for share and per share data)

(Unaudited)


June 30,

2020

December 31,

2019

Assets


Current assets:


Cash and cash equivalents

$

118,392


$

83,609


Due from charterers – Net of provision for doubtful accounts of $1,717 and $1,415, respectively


80,663


80,691


Inventories


21,730


32,071


Prepaid expenses and other current assets


13,815


13,179


Total current assets


234,600


209,550


Noncurrent assets:


Vessels – Net of accumulated depreciation of $605,350 and $553,483, respectively


1,821,428


1,865,738


Other property – Net of accumulated depreciation of $737 and $584, respectively


508


642


Deferred drydocking costs – Net of accumulated amortization of $21,505 and $17,975, respectively


35,720


37,256


Restricted cash


5,679


5,610


Advances to Norient pool


1,390


Time charter contracts acquired – Net of accumulated amortization of $3,914 and $2,296, respectively


3,486


5,004


Other noncurrent assets


3,543


4,582


Total noncurrent assets


1,871,754


1,918,832


Total

$

2,106,354


$

2,128,382


Liabilities and Equity


Current liabilities:


Current portion of long-term debt

$

134,389


$

134,389


Accounts payable and accrued expenses


37,569


44,062


Deferred charter hire revenue


6,482


1,934


Derivative liability


456


Total current liabilities


178,896


180,385


Long-term debt – Net of deferred financing costs of $14,258 and $15,866, respectively


633,468


744,055


Derivative liability


440


Total liabilities


812,804


924,440


Equity:


Common stock, par value $0.001; 100,000,000 shares authorized; issued and outstanding 39,912,877 and 39,890,699 shares at June 30, 2020 and December 31, 2019, respectively


40


40


Treasury stock – at cost; 137,289 shares at June 30, 2020


(1,418

)


Additional paid-in capital


1,239,408


1,237,658


Accumulated other comprehensive loss


(896

)


Retained earnings (accumulated deficit)


22,189


(68,567

)

Total Diamond S Shipping Inc. equity


1,259,323


1,169,131


Noncontrolling interests


34,227


34,811


Total equity


1,293,550


1,203,942


Total

$

2,106,354


$

2,128,382


DIAMOND S SHIPPING INC. AND SUBSIDIARIES

Condensed Consolidated Statements of Operations

for the Three and Six Months Ended June 30, 2020 and 2019

(In Thousands, except for share and per share data)

(Unaudited)


For the Three Months Ended
June 30,

For the Six Months Ended
June 30,


2020

2019

2020

2019

Revenue:


Spot revenue

$

162,419


$

129,344


$

350,071


$

227,793


Time charter revenue


20,815


19,951


42,888


24,158


Pool revenue


319


319


Total revenue


183,553


149,295


393,278


251,951


Operating expenses:


Voyage expenses


49,349


65,895


124,030


107,473


Vessel expenses


41,738


42,376


83,274


67,177


Depreciation and amortization expense


28,771


29,243


57,531


51,199


General and administrative expenses


7,485


7,320


15,609


13,608


Total operating expenses


127,343


144,834


280,444


239,457


Operating income


56,210


4,461


112,834


12,494


Other (expense) income:


Interest expense


(9,711

)


(13,422

)


(21,087

)


(22,792

)

Other income


3


384


336


901


Total other expense – Net


(9,708

)


(13,038

)


(20,751

)


(21,891

)

Net income (loss)


46,502


(8,577

)


92,083


(9,397

)

Less: Net income (loss) attributable to noncontrolling interest


790


(74

)


1,327


132


Net income (loss) attributable to Diamond S Shipping Inc.

$

45,712


$

(8,503

)

$

90,756


$

(9,529

)


Net earnings (loss) per share – basic

$

1.15


$

(0.21

)

$

2.28


$

(0.28

)

Net earnings (loss) per share – diluted

$

1.14


$

(0.21

)

$

2.26


$

(0.28

)


Weighted average common shares outstanding – basic


39,920,559


39,890,698


39,861,943


33,774,260


Weighted average common shares outstanding – diluted


40,111,348


39,890,698


40,091,647


33,774,260


(1)

The Company is a 51% owner in NT Suez Holdco LLC (“NT Suez”), a joint venture that owns two Suezmax vessels. The Company also performs commercial, technical and administrative services for this joint venture.


DIAMOND S SHIPPING INC. AND SUBSIDIARIES

Condensed Consolidated Statements of Cash Flows

for the Six Months Ended June 30, 2020 and 2019

(In Thousands)

(Unaudited)


For the Six Months Ended
June 30,


2020

2019

Cash flows from Operating Activities:


Net income (loss)

$

92,083


$

(9,397

)

Adjustments to reconcile net income (loss) to net cash provided by operating activities:


Depreciation and amortization expense


57,531


51,199


Amortization of deferred financing costs


1,771


1,892


Amortization of time charter hire contracts acquired


1,518


872


Amortization of the realized gain from recouponing swaps


(1,377

)

Stock-based compensation expense


2,443


861


Changes in assets and liabilities


6,802


(24,313

)

Cash paid for drydocking


(3,014

)


(7,691

)

Net cash provided by operating activities


159,134


12,046


Cash flows from Investing Activities:


Acquisition costs, net of cash acquired of $16,568


(292,683

)

Transaction costs


(18,804

)

Payments for vessel additions and other property


(7,481

)


(7,388

)

Net cash used in investing activities


(7,481

)


(318,875

)


Cash flows from Financing Activities:


Borrowings on long-term debt


300,000


Principal payments on long-term debt


(67,195

)


(35,496

)

Borrowings on revolving credit facilities


56,000


Repayments on revolving credit facilities


(45,000

)


(26,323

)

NT Suez Holdco LLC distribution


(1,911

)


Shares repurchased


(1,418

)


Cash paid to net settle employee withholding taxes on equity awards


(693

)


Proceeds from partners’ contributions in subsidiaries


980


Payments for deferred financing costs


(584

)


(6,959

)

Net cash (used in) provided by financing activities


(116,801

)


288,202


Net increase (decrease) in cash, cash equivalents and restricted cash


34,852


(18,627

)

Cash, cash equivalents and restricted cash – Beginning of period


89,219


88,158


Cash, cash equivalents and restricted cash – End of period

$

124,071


$

69,531


Supplemental disclosures:


Cash paid for interest

$

20,538


$

22,075


Unpaid transaction costs in Accounts payable and

accrued expenses at the end of the period

$


$

280


Unpaid vessel additions in Accounts payable and

accrued expenses at the end of the period

$


$

2,485


DIAMOND S SHIPPING INC. AND SUBSIDIARIES

Other Operating Data

(Unaudited)


For the Three Months Ended June 30,


For the Six Months Ended June 30,

2020


2019


2020


2019

Crude
Fleet

Product
Fleet


Crude
Fleet

Product
Fleet


Crude
Fleet


Product
Fleet


Crude
Fleet


Product
Fleet

Time Charter TCE per day(1)

$

26,372

$

14,558

$

26,105

$

13,953

$

26,380

$

14,352

$

26,117

$

14,335

Spot TCE per day (1),(2)


44,214


18,956


15,528


12,815


45,510


17,686


17,862


13,463

Total TCE per day(1),(2)

$

40,626

$

18,073

$

16,200

$

13,118

$

41,769

$

16,999

$

18,174

$

13,639

Vessel operating expenses per day(3)

$

7,030

$

6,407

$

7,195

$

6,677

$

7,367

$

6,535

$

6,745

$

6,590

Revenue days(4)


1,357


4,422


1,433


4,617


2,786


8,937


2,516


7,399

Operating days(4)


1,456


4,550


1,456


4,732


2,912


9,100


2,552


7,606

(1)

Time charter equivalent (“TCE”) revenue represents voyage revenues, which commence at the time a vessel departs its last discharge port and end at the time the discharge of cargo at the next discharge port is complete, less voyage expenses incurred over such time. TCE rates are a non-GAAP measure, generally used in the shipping industry, used to compare revenue generated from voyage charters to revenue generated from time charters. TCE rates assist the Company’s management in making decisions regarding the deployment and use of its vessels and in evaluating the financial performance of vessels under commercial management. See Non-GAAP Measures below.

(2)

Revenues are derived on a discharge-to-discharge basis less voyage expenses which primarily consist of fuel costs and port charges incurred over the same period. Voyage revenues, as presented in the income statement, are reported under a load-to-discharge basis under U.S. GAAP. A reconciliation is provided in the Non-GAAP Measures section of the press release.

(3)

The vessel operating expenses primarily consist of crew wages and associated costs, insurance premiums, lubricants and spare parts, technical management fees and repair and maintenance costs and excludes nonrecurring items.

(4)

Operating days include the calendar days in the period of owned vessels. Revenue days represent operating days less technical off-hire and drydocking.

Non-GAAP Measures

To supplement the Company’s financial information presented in accordance with accounting principles generally accepted in the U.S. (“GAAP”), management uses certain “non-GAAP financial measures” as such term is defined in Regulation G promulgated by the Securities and Exchange Commission (the “SEC”). Generally, a non-GAAP financial measure is a numerical measure of a company’s operating performance, financial position or cash flows that excludes or includes amounts that are included in, or excluded from, the most directly comparable measure calculated and presented in accordance with GAAP. Management believes the presentation of these measures provides investors with greater transparency and supplemental data relating to the Company’s financial condition and results of operations, and therefore a more complete understanding of factors affecting its business than GAAP measures alone.

TCE revenue, TCE per day, earnings before interest, taxes, depreciation and amortization (“EBITDA”), and EBITDA adjusted for the impact of certain items that we do not consider indicative of our ongoing operating performance (“Adjusted EBITDA”) are non-GAAP financial measures that are presented in this press release and that the Company believes provide investors with a means of evaluating and understanding how the Company’s management evaluates the Company’s operating performance. These non-GAAP financial measures should not be considered in isolation from, as substitutes for, nor superior to financial measures prepared in accordance with GAAP. Please see below for reconciliations of TCE revenue, TCE per day, EBITDA and Adjusted EBITDA.

Reconciliation of Voyage Revenue to TCE per Day

(in thousands of U.S. dollars, except fleet data)

For the Three Months Ended June 30,


For the Six Months Ended June 30,

2020


2019


2020


2019

Crude
Fleet

Product
Fleet


Crude
Fleet

Product
Fleet


Crude
Fleet

Product
Fleet


Crude
Fleet

Product
Fleet

Voyage revenue

$

69,873


$

113,680


$

51,474


$

97,821


$

160,502


$

232,776


$

86,883


$

165,068


Voyage expense


(14,660

)


(34,689

)


(27,094

)


(38,801

)


(43,009

)


(81,021

)


(41,464

)


(66,009

)

Amortization of time charter contracts acquired


581


197


581


215


1,162


356


600


272


Off-hire bunkers in voyage expenses


147


227


211


230


281


301


211


603


Commercial management pool fees


-


9


-


-


-


9


-


-


Load-to-discharge/Discharge-to-discharge


(793

)


481


(1,955

)


1,096


(2,562

)


(495

)


(501

)


943


Revenue from sold vessels


-


4


-


-


-


(11

)


-


30


TCE Revenue

$

55,148


$

79,909


$

23,217


$

60,561


$

116,374


$

151,915


$

45,729


$

100,907


Operating days


1,456


4,550


1,456


4,732


2,912


9,100


2,552


7,606


Off-hire/Dry Docking days


99


128


23


115


126


163


36


207


Revenue days


1,357


4,422


1,433


4,617


2,786


8,937


2,516


7,399


TCE per day

$

40,626


$

18,073


$

16,200


$

13,118


$

41,769


$

16,999


$

18,174


$

13,639


Reconciliation of Net Income/(Loss) to EBITDA and Adjusted EBITDA

EBITDA represents net income (loss) before interest expense, income taxes and depreciation and amortization expense. Adjusted EBITDA consists of EBITDA adjusted for the impact of certain items that we do not consider indicative of our ongoing operating performance. EBITDA and Adjusted EBITDA are presented to provide investors with meaningful additional information that management uses to monitor ongoing operating results and evaluate trends over comparative periods. EBITDA and Adjusted EBITDA do not represent, and should not be considered a substitute for, net income (loss) or cash flows from operations determined in accordance with GAAP. EBITDA and Adjusted EBITDA have limitations as analytical tools, and should not be considered in isolation, or as a substitute for analysis of our results reported under GAAP. Some limitations are:

  • EBITDA and Adjusted EBITDA do not reflect our cash expenditures, or future requirements for capital expenditures or contractual commitments;
  • EBITDA and Adjusted EBITDA do not reflect changes in, or cash requirements for, our working capital needs; and
  • EBITDA and Adjusted EBITDA do not reflect the significant interest expense, or the cash requirements necessary to service interest or principal payments, on our debt.

Contacts

Investor Relations Inquiries:
Robert Brinberg
Tel: +1-212-517-0810
E-mail: This email address is being protected from spambots. You need JavaScript enabled to view it.


Read full story here

-- Preparing for a New Climate Reality, JetBlue Begins Offsetting Emissions for All Domestic Flights and Investing in Sustainable Aviation Fuel, Significantly Reducing its Contribution to the Climate Crisis --

-- Recognizing the Critical Role Renewable Fuel Options Will Play in the Aviation Industry’s Transition to Lower-Carbon Operations, JetBlue Starts Flying with Neste’s Sustainable Aviation Fuel on Flights from San Francisco --

NEW YORK--(BUSINESS WIRE)--JetBlue (Nasdaq: JBLU) today announced it has followed through on its commitment to go carbon neutral on all domestic flights. Earlier this year, JetBlue became the first major U.S. airline to commit to this critical and measurable step toward reducing its contribution to global warming, and is now the first U.S. airline to achieve carbon neutrality on all domestic flying.


On July 1, the airline began offsetting its carbon dioxide emissions (CO2) from jet fuel for all domestic JetBlue-operated flights. JetBlue views carbon offsetting as a bridge to other industry-wide environmental improvements like fuel with lower emissions. Therefore, JetBlue is also investing in sustainable aviation fuel (SAF) and to start, the airline is fueling flights from San Francisco International Airport (SFO) with SAF.

Carbon neutrality is just one way JetBlue is preparing for a changing climate and ensuring a more sustainable business for its crewmembers, customers, shareholders and communities. JetBlue’s carbon reduction strategy focuses on reducing emissions in the first place. This includes investments to shrink its impact through fuel-saving technologies and aircraft, and advocating for a more fuel-efficient air traffic control system. JetBlue has achieved reductions in emissions on an intensity basis since 2015, and most recently improved 2.2 percent per available seat mile (ASM) from 2018 to 2019. Offsetting all remaining emissions from domestic flights and investing in SAF will help JetBlue move toward the lower-carbon economy for which aviation and all sectors must plan.

“The global pandemic reinforces the need to mitigate risks that threaten the health of our business. Our commitment to sustainability has only become more important as we prepare our business for a new climate reality,” said Joanna Geraghty, president and chief operating officer, JetBlue. “Even with a long recovery ahead following the COVID-19 pandemic, JetBlue remains focused on short- and long-term environmental opportunities, particularly lessening our largest impact – carbon emissions – and more fuel efficient flying.”

Offsetting emissions from all domestic flights

Since 2008, JetBlue has been offsetting CO2 emissions from jet fuel with programs to balance customer flying, including a month of carbon neutral flying network-wide in 2015 and again in 2019. Offsetting all domestic flying expands those efforts in a bigger and more impactful way. Prior to this announcement, JetBlue had already offset more than 2.6 billion pounds of CO2 emissions in partnership with CarbonFund.org Foundation—a leading U.S. based nonprofit carbon reduction and climate solutions organization. JetBlue’s new carbon offsetting partners include two experts in climate solutions and carbon offsetting – South Pole and EcoAct, in addition to Carbonfund.org.

JetBlue will offset all emissions from jet fuel for domestic routes and expects to ramp up to offset 15-17 billion pounds (7 to 8 million metric tons) of CO2 emissions each year – the annual equivalent of removing more than 1.5 million passenger vehicles from the road.

As part of its offsetting program, JetBlue selects projects around the globe that will balance the emissions from its jet fuel. Many projects operate in developed countries where a bigger community impact can be made. Emissions reduction projects reduce the amount of greenhouse gas in the atmosphere in at least one of three ways – avoiding greenhouse gas emissions in favor of renewable sources, removing emissions from the atmosphere, and destroying emissions when possible.

JetBlue’s sustainable aviation fuel program begins on flights from San Francisco

JetBlue has started purchasing and flying on sustainable aviation fuel (SAF) from Neste, the world’s third most sustainable company and the largest producer of renewable diesel and SAF made from waste and residue materials, starting in July 2020 for flights from San Francisco International Airport (SFO). Neste’s SAF will contribute to JetBlue’s efforts to reach its climate goals, providing an immediate reduction in greenhouse gas emissions from any aircraft using the fuel.

“Neste is proud to be supplying and working with JetBlue, an airline with a strong track record of sustainability leadership," says Chris Cooper, Vice President for Renewable Aviation at Neste North America. "We are bringing additional SAF production capacity online and stand ready to provide JetBlue with even more of this low-emission, high-quality fuel to help them achieve carbon neutral growth. Our work with JetBlue is sending a clear signal to anyone wondering what the future of air travel is - it will be lower-emission, it will be more sustainable, and it will be increasingly powered by SAF.”

Neste is now successfully delivering SAF to SFO via pipeline, a milestone the airport has called a “climate quantum leap”. Once Neste’s SAF enters SFO’s fuel consortium storage, it is available to the commercial, cargo or business aviation entities that operate at the airport. JetBlue was a first mover in adopting Neste’s SAF at SFO, recently taking delivery of the fuel at the airport. With agreements like this, JetBlue is helping to kick-start the SAF market by improving the economics and increasing the use of these lower carbon fuels.

Neste’s SAF is produced from 100 percent renewable and sustainably sourced waste and residue materials. Over the lifecycle and in neat form, it has up to 80 percent smaller carbon footprint compared to fossil jet fuel whilst also emitting less particulate matter, SOX, and other pollutants. The fuel is shipped via the fuel pipeline, and is fully compatible with the existing jet engine technology and fuel distribution infrastructure when blended with fossil jet fuel. Safety is JetBlue’s number one priority, and the fuel is used alongside regular fuel without any changes in safety or impact.

How carbon offsetting works – When projects that reduce CO₂ emissions are developed, every ton of emissions reduced results in the creation of one carbon offset or carbon credit. A carbon credit is a tradeable certificate that represents the avoidance or removal of one ton of carbon dioxide emissions. Buying carbon credits means investing in emission reduction projects that require carbon offsets financing in order to take place (a.).

JetBlue will support carbon offsets projects focused on but not limited to:

  • Landfill Gas Capture (LFG): Landfill gas is a natural byproduct of the decomposition of organic material in landfills. Instead of escaping into the air, LFG can be captured, converted and used as a renewable energy resource. LFG energy projects generate revenue and create jobs in the local community and beyond.
  • Solar/Wind: These projects develop expansive solar and wind farms, generating power that otherwise would have been supplied by fossil fuels like coal, diesel and furnace oil. These projects also create jobs and revenues for local communities.
  • Forestry: Forest conservation projects prevent deforestation by helping voluntarily forego plans that would have converted forests for other purposes, while having additional co-benefits for communities and local wildlife.

All of JetBlue’s purchased carbon offsets are audited, verified and retired on the airline’s behalf. These projects are audited to confirm the carbon reductions are permanent and ongoing. The sale of carbon offsets help to finance the projects. (b.)

JetBlue’s focus on climate leadership – JetBlue’s environmental social governance (ESG) strategy focuses on issues that have the potential to impact its business and the industry in the long-term. Customers, crewmembers and community, as well as stakeholders, are key to JetBlue's climate and sustainability strategy. Demand from these groups for responsible service is one of the motivations to further reduce the airline’s environmental impact. Shareholders, including many crewmembers, have demanded that JetBlue’s ESG strategy benefit stakeholders and the airline’s financial position. Tying ESG to its treasury function, including cash investments and a sustainability-linked loan with some terms dependent on the airline’s ESG scores, further demonstrates JetBlue’s commitment to combat climate change.

Carbon offsetting is just one example of how JetBlue is mitigating its contribution to climate change in response to public and market demand. JetBlue’s 2019 Environmental Social Governance (ESG) Report identifies key sustainability factors that affect the airline’s business and financial performance. For more information, visit jetblue.com/sustainability.

About JetBlue

JetBlue is New York's Hometown Airline®, and a leading carrier in Boston, Fort Lauderdale-Hollywood, Los Angeles, Orlando, and San Juan. JetBlue carries customers across the U.S., Caribbean, and Latin America. For more information, visit jetblue.com.

About Neste:

Neste (NESTE, Nasdaq Helsinki) creates sustainable solutions for transport, business, and consumer needs. Our wide range of renewable products enable our customers to reduce climate emissions. We are the world's largest producer of renewable diesel refined from waste and residues, introducing renewable solutions also to the aviation and plastics industries. We are also a technologically advanced refiner of high-quality oil products. We want to be a reliable partner with widely valued expertise, research, and sustainable operations. In 2019, Neste's revenue stood at EUR 15.8 billion. In 2020, Neste placed 3rd on the Global 100 list of the most sustainable companies in the world. Learn more about Neste and its mission to fight climate change at Neste.com. Follow Neste on twitter: @Neste_NA and on LinkedIn.

(a.)

Sourced with permission from www.southpole.com/carbon-offsets-explained


(b.)

Carbon Offsets Project Certification – JetBlue has purchased high-quality carbon credits that adhere to a strict set of standards. Projects are registered with a third-party internationally recognized verification standard, including the Gold Standard, Verra's Verified Carbon Standard (VCS), Social Carbon and Climate, Community and Biodiversity Standards (CCBS), or standards verified by the UNFCCC. These standards also help highlight different benefits while ensuring that the project is real, verified, permanent and additional.


Projects certified under each standard means that they have been developed following the rules and requirements of the particular standard; have been independently audited and verified; follow defined GHG emission reduction quantification methodology; and carbon credits are assigned serial numbers and are issued, transferred and permanently retired in publicly accessible emission registries.

JetBlue follows the below principles when selecting projects:

  • Real: All GHG emission reductions must be proven to have occurred.
  • Measurable: All GHG emission reductions must be able to be quantified.
  • Permanent: Steps must be in place to ensure a minimal risk of reversing the project emissions reductions, and if reversal takes place, a plan to rebalance the expected reduction.
  • Additional: All GHG emission reductions must be in addition to what would have happened if the project were not developed.
  • Independently Audited: An accredited verification entity experienced in the relevant sector and location has assured all stated emissions reductions have occurred.
  • Unique: No double counting of carbon credits has occurred, with each assigned a unique serial number.
  • Transparent: All GHG-related information must be disclosed.
  • Conservative: Approaches and assumptions are conservative to avoid over-estimation.


Contacts

Media Contacts
JetBlue Corporate Communications
Tel: +1 718 709 3089
This email address is being protected from spambots. You need JavaScript enabled to view it.

Theodore Rolfvondenbaumen
Manager, Communications in North America, Neste
+1 832 799 7029
This email address is being protected from spambots. You need JavaScript enabled to view it.

Sypris Electronics Sales up 28%; Gross Profit Up 73%

LOUISVILLE, Ky.--(BUSINESS WIRE)--$SYPR--Sypris Solutions, Inc. (Nasdaq/GM: SYPR) today reported financial results for its second quarter ended July 5, 2020. Having completed a series of strategic initiatives over the past several years, Sypris Solutions is now better positioned to achieve long-term growth and a return to profitable operations. These steps have included reducing and realigning the Company’s cost structure while diversifying its book of business in terms of both customers and markets.


Results for the second quarter of 2020 fundamentally reflected these expectations, highlighted by the improved performance of Sypris Electronics. The global economic impact of the COVID-19 pandemic was felt in the majority of the Company’s markets during the quarter, however the essential nature of the defense and communication programs served by Sypris Electronics allowed this segment to sustain operations near planned levels. The Company expects customer demand will improve sequentially in its other markets during the third quarter, albeit with continued uncertainty related to the pandemic.

HIGHLIGHTS
─────────────────────

  • The Company’s second quarter revenue decreased 29.8% compared to the prior-year quarter and 23.5% sequentially, reflecting lower market volumes driven by the temporary closure of customer operations in response to the pandemic, while the subsequent restart of operations in June has had a corresponding positive impact on demand.
  • Sypris Electronics revenue increased 28.3% during the quarter compared to the prior-year period and 11.5% sequentially, supported by a strong backlog of orders, which has increased 22.5% since year-end 2019.
  • Sypris Electronics gross profit increased 72.9% and 61.6% on a year-over-year and sequential basis, respectively. Gross margin increased 470 basis points compared to the prior year and 570 basis points sequentially to 18.3%.
  • As a result of the higher levels of shipments, operating margins for Sypris Electronics increased to 10.6%, reflecting a material improvement over its historical results on both a year-over-year and sequential basis.
  • Sypris Technologies revenue decreased 55.9% during the quarter compared to the prior-year period and 45.7% sequentially due to many customers idling operations throughout the quarter in response to the pandemic. These operations have since reopened, resulting in a positive impact on demand.
  • During the second quarter, the Company completed the sale of its 90-year-old former manufacturing facility that was located on approximately 20 acres of land in Louisville, Kentucky, for $1.7 million. The facility had been closed and unoccupied since the fourth quarter of 2017.
  • The Company secured a $3.6 million loan in May under the Paycheck Protection Program of the Coronavirus Aid, Relief and Economic Securities Act. The proceeds have been used to cover payroll costs, rent and utility costs in accordance with the terms and conditions of the loan.
  • Subsequent to quarter-end, Sypris Electronics announced an initial contract award from the Leonardo DRS Naval Electronics business unit to manufacture and test electronic assemblies for a shipboard system with production to begin during 2020.
  • Subsequent to quarter-end, Sypris Technologies announced the award of orders for projects in Brazil and Canada. The contracts, which provide for the use of Ultra-High-Pressure closures in the Libra Oil Field deep water project in Brazil and Double-Bolt closures in the Trans Mountain Pipeline Expansion project in Canada, call for shipments to begin in the second half of 2020.

─────────────────────

“While the economic headwinds and disruptions in the quarter had an impact on our results, we are pleased with our performance during the period,” commented Jeffrey T. Gill, President and Chief Executive Officer. “In the face of unprecedented challenges brought on by the pandemic, our businesses pulled together to protect our people, while balancing the needs of our customers, communities and business partners during these difficult times.

“Revenue for Sypris Electronics increased 28.3% from the prior-year quarter and 11.5% sequentially, reflecting its strong backlog and improved electronic component availability. Sales are up 67.6% for the first half of 2020 compared to the prior year, while backlog has increased 22.5% since year-end. We have been designated as an essential supplier to our customers serving the defense and communications industries and as such, our team has done an excellent job making sure that we were able to provide for their increasing needs during the period.

“The temporary closure of operations by customers serving the energy, automotive, commercial vehicle, sport utility and off-highway markets had a significant impact on Sypris Technologies during the months of April and May, before we began to see demand recover in June. The outlook going forward has much improved with all customer plants open at this time. It is worth noting that this business of ours has remained profitable on a year-to-date basis, which is a remarkable feat and serves as testimony to the capabilities of our people.

“Sypris Technologies has also been designated as an essential supplier to our customers serving the energy and transportation sectors of our country and as a result, our team will continue to take whatever steps are necessary to ensure that the needs of our customers are reliably met without delay.”

Concluding, Mr. Gill said, “Our customer base and the markets we serve are considerably more diversified than at any point in our recent history. As an essential business, we have a responsibility to ensure that our defense, communications, energy and transportation sectors remain vibrant. We will continue to monitor developments, act promptly to mitigate the risks and take the necessary steps required to ensure deliveries continue to be made in a timely manner.”

Second Quarter Results

The Company reported revenue of $17.2 million for the second quarter ended July 5, 2020, compared to $24.4 million for the prior-year period. Additionally, the Company reported a net loss of $0.3 million for the second quarter, or $0.02 per share, compared to net income of $1.5 million, or $0.07 per share, for the prior‑year period. Results for the quarter ended July 5, 2020, include net gains of $0.8 million from the sale of idle assets by Sypris Technologies. Results for the quarter ended June 30, 2019, include a gain of $1.5 million in connection with a contract settlement with one of its customers.

For the six months ended July 5, 2020, the Company reported revenue of $39.6 million compared with $44.0 million for the first half of 2019. The Company reported a net loss for the six-month period of $0.7 million, or $0.03 per share, compared with a net loss of $1.5 million, or $0.07 per share, for the prior year period. Results for the six months ended July 5, 2020, include gains of $1.0 million from the sale of idle asset by Sypris Technologies. Results for the six months ended June 30, 2019, include a gain of $1.5 million in connection with a contract settlement with one of its customers and net gains of $0.5 million from the sale of idle assets.

Sypris Technologies

Revenue for Sypris Technologies was $7.4 million in the second quarter of 2020 compared to $16.9 million for the prior-year period, primarily reflecting reduced demand attributable to the COVID-19 pandemic coupled with the anticipated cyclical decline in the commercial vehicle market. Gross profit for the second quarter was $0.2 million, or 3.1% of revenue, compared to $3.0 million, or 17.6% of revenue, for the same period in 2019.

Sypris Electronics

Revenue for Sypris Electronics was $9.7 million in the second quarter of 2020 compared to $7.6 million for the prior-year period. Shipments during the second quarter reflected the fact that our customer base serving the defense and communications markets remained open at near normal levels throughout the period. Additionally, many of the challenges faced during the prior year with electronic component shortages and extensive lead-times have been resolved. Gross profit for the quarter was $1.8 million, or 18.3% of revenue, compared to $1.0 million, or 13.6% of revenue, for the same period in 2019.

Outlook

Commenting on the future, Mr. Gill added, “First and foremost, we are focused on the health and safety of our employees, their families and our customers. We are closely monitoring local, state and federal government agencies and will follow all recommendations. The environment is changing rapidly with regard to customers, suppliers and public policy, and we are paying close attention to developments on a daily basis. The extent and duration of the impacts that the pandemic may have on our business are not known at this time, but we are monitoring developments as we seek to navigate the challenging conditions in our markets.

“As anticipated, the impact of the pandemic has been felt less on customers in defense-related markets and as a result, the outlook for Sypris Electronics remains positive. We have seen a rebound in orders within the commercial vehicle market since June, resulting in an improvement in our outlook for Sypris Technologies to approach pre-pandemic expectations during the second half of 2020. While the energy market continues to be volatile, we continue to see wins on important large projects around the world.

“Our operations have remained open to meet the important needs of our customers who serve defense, communications, energy, transportation and other critical infrastructure industries. We expect the road back for the economy to be a potentially uncertain journey.”

Sypris Solutions is a diversified provider of truck components, oil and gas pipeline components and aerospace and defense electronics. The Company performs a wide range of manufacturing services, often under multi-year, sole-source contracts. For more information about Sypris Solutions, visit its Web site at www.sypris.com.

Forward Looking Statements

This press release contains “forward-looking” statements within the meaning of the federal securities laws. Forward-looking statements include our plans and expectations of future financial and operational performance. Such statements may relate to projections of the company’s revenue, earnings, and other financial and operational measures, our liquidity, our ability to mitigate or manage disruptions posed by COVID-19, and the impact of COVID-19 and economic conditions on our future operations, among other matters. In March 2020, the President of the United States declared the COVID-19 outbreak a national emergency. COVID-19 continues to spread throughout the United States and other countries across the world, and the duration and severity of its effects are currently unknown. The COVID-19 pandemic has resulted, and is likely to continue to result, in significant economic disruption and has and will likely adversely affect our business. The Company has continued to operate at each location and sought to remain compliant with government regulations imposed due to the COVID-19 pandemic.

Each forward-looking statement herein is subject to risks and uncertainties, as detailed in our most recent Form 10-K and Form 10-Q and other SEC filings. Briefly, we currently believe that such risks also include the following: the impact of COVID-19 and economic conditions on our future operations; possible public policy response to the pandemic, including legislation or restrictions that may impact our operations or supply chain; our ability to comply with the requirements of the SBA and seek forgiveness of all or a portion of the PPP Loan; our failure to successfully complete final contract negotiations with regard to our announced contract “orders”, “wins” or “awards”; our failure to achieve and maintain profitability on a timely basis by steadily increasing our revenues from profitable contracts with a diversified group of customers, which would cause us to continue to use existing cash resources or other assets to fund operating losses; our failure to achieve targeted gains and cash proceeds from the anticipated sale of certain equipment; the fees, costs and supply of, or access to, debt, equity capital, or other sources of liquidity; dependence on, retention or recruitment of key employees and distribution of our human capital; the cost, quality, timeliness, efficiency and yield of our operations and capital investments, including the impact of tariffs, product recalls or related liabilities, employee training, working capital, production schedules, cycle times, scrap rates, injuries, wages, overtime costs, freight or expediting costs; disputes or litigation involving governmental, supplier, customer, employee, creditor, stockholder, product liability or environmental claims; our inability to develop new or improved products or new markets for our products; cost, quality and availability of raw materials such as steel, component parts (especially electronic components), natural gas or utilities; breakdowns, relocations or major repairs of machinery and equipment, especially in our Toluca Plant; our inability to regain compliance with the NASDAQ listing standards minimum closing bid price in a timely manner our reliance on a few key customers, third party vendors and sub-suppliers; continued shortages and extensive lead-times for electronic components; inventory valuation risks including excessive or obsolescent valuations or price erosions of raw materials or component parts on hand or other potential impairments, non-recoverability or write-offs of assets or deferred costs; other potential weaknesses in internal controls over financial reporting and enterprise risk management; failure to adequately insure or to identify environmental or other insurable risks; unanticipated or uninsured disasters, public health crises, losses or business risks; volatility of our customers’ forecasts, scheduling demands and production levels which negatively impact our operational capacity and our effectiveness to integrate new customers or suppliers, and in turn cause increases in our inventory and working capital levels; the costs of compliance with our auditing, regulatory or contractual obligations; labor relations; strikes; union negotiations; pension valuation, health care or other benefit costs; our inability to patent or otherwise protect our inventions or other intellectual property from potential competitors; adverse impacts of new technologies or other competitive pressures which increase our costs or erode our margins; U.S. government spending on products and services that Sypris Electronics provides, including the timing of budgetary decisions; changes in licenses, security clearances, or other legal rights to operate, manage our work force or import and export as needed; risks of foreign operations; currency exchange rates; war, terrorism, or political uncertainty; cyber security threats and disruptions; inaccurate data about markets, customers or business conditions; or unknown risks and uncertainties. We undertake no obligation to update our forward-looking statements, except as may be required by law.


SYPRIS SOLUTIONS, INC.

Financial Highlights

(In thousands, except per share amounts)


Three Months Ended


July 5,


June 30,


2020


2019


(Unaudited)

Revenue

 $

        17,153


 $

        24,444


Net (loss) income

 $

            (348

)

 $

          1,503


(Loss) income per common share:
Basic

 $

           (0.02

)

 $

            0.07


Diluted

 $

           (0.02

)

 $

            0.07


Weighted average shares outstanding:
Basic


21,016


20,875


Diluted


21,016


20,875


Six Months Ended

July 5,


June 30,

2020


2019

(Unaudited)

Revenue

 $

        39,578


 $

        44,008


Net loss

 $

            (653

)

 $

         (1,533

)

Loss per common share:
Basic

 $

           (0.03

)

 $

           (0.07

)

Diluted


             (0.03

)


             (0.07

)

Weighted average shares outstanding:
Basic


21,005


20,772


Diluted


21,005


20,772


Sypris Solutions, Inc.

Consolidated Statements of Operations

(in thousands, except for per share data)


Three Months Ended


Six Months Ended


July 5,


June 30,


July 5,


June 30,


2020


2019


2020


2019


(Unaudited)


(Unaudited)

Net revenue:
Sypris Technologies

 $

       7,445


 $

     16,878


 $

     21,162


 $

      33,019


Sypris Electronics


          9,708


          7,566


        18,416


         10,989


Total net revenue


17,153


24,444


39,578


44,008


Cost of sales:
Sypris Technologies


7,216


13,915


18,440


27,752


Sypris Electronics


          7,934


          6,540


        15,544


         11,407


Total cost of sales


15,150


20,455


33,984


39,159


Gross profit (loss):
Sypris Technologies


            229


          2,963


          2,722


           5,267


Sypris Electronics


          1,774


          1,026


          2,872


             (418

)

Total gross profit


          2,003


          3,989


          5,594


           4,849


Selling, general and administrative


2,830


3,604


6,053


7,058


Severance, relocation and other costs


              33


            103


            124


              201


Operating (loss) income


           (860

)


            282


           (583

)


          (2,410

)

Interest expense, net


193


232


420


449


Other (income), net


           (769

)


        (1,493

)


           (486

)


          (1,442

)

(Loss) income before taxes


           (284

)


          1,543


           (517

)


          (1,417

)

Income tax expense, net


              64


              40


            136


              116


Net (loss) income

 $

        (348

)

 $

       1,503


 $

        (653

)

 $

       (1,533

)

(Loss) income per common share:
Basic

 $

       (0.02

)

 $

         0.07


 $

       (0.03

)

 $

         (0.07

)

Diluted

 $

       (0.02

)

 $

         0.07


 $

       (0.03

)

 $

         (0.07

)

Dividends declared per common share

 $

            -


 $

            -


 $

            -


 $

             -


Weighted average shares outstanding:
Basic


21,016


20,875


21,005


20,772


Diluted


21,016


20,875


21,005


20,772


Sypris Solutions, Inc.

Consolidated Balance Sheets

(in thousands, except for share data)


July 5,


December 31,


2020


2019


(Unaudited)


(Note)

ASSETS
Current assets:
Cash and cash equivalents

 $

            7,810


 $

            5,095


Accounts receivable, net


6,376


7,444


Inventory, net


18,485


20,784


Other current assets


               4,309


               4,282


Assets held for sale


               1,230


               2,233


Total current assets


38,210


39,838


Property, plant and equipment, net


9,883


11,675


Operating lease right-of-use assets


6,523


7,014


Other assets


               1,407


               1,529


Total assets

 $

          56,023


 $

          60,056


LIABILITIES AND STOCKHOLDERS' EQUITY
Current liabilities:
Accounts payable

 $

            6,536


 $

            9,346


Accrued liabilities


             12,358


             12,495


Operating lease liabilities, current portion


                  919


                  841


Finance lease obligations, current portion


                  587


                  684


Note payable - related party, current portion


               2,500


                    -


Note payable - PPP loan, current portion


               1,581


                    -


Total current liabilities


24,481


23,366


Operating lease liabilities, net of current portion


               6,433


               6,906


Finance lease obligations, net of current portion


               2,128


               2,351


Note payable - related party


               3,971


               6,463


Note payable - PPP Loan


               1,977


                    -


Other liabilities


               5,515


               7,539


Total liabilities


44,505


46,625


Stockholders’ equity:
Preferred stock, par value $0.01 per share, 975,150 shares authorized; no shares issued


                    -


                    -


Series A preferred stock, par value $0.01 per share, 24,850 shares authorized; no shares issued


                    -


                    -


Common stock, non-voting, par value $0.01 per share, 10,000,000 shares authorized; no shares issued


                    -


                    -


Common stock, par value $0.01 per share, 30,000,000 shares authorized; 21,384,618 shares issued and 21,369,580 outstanding in 2020 and 21,324,618 shares issued and 21,298,426 outstanding in 2019


                  213


213


Additional paid-in capital


           154,923


154,702


Accumulated deficit


          (118,086

)


          (117,433

)

Accumulated other comprehensive loss


            (25,532

)


            (24,051

)

Treasury stock, 15,038 and 26,192 in 2020 and 2019


                    -


                    -


Total stockholders’ equity


             11,518


             13,431


Total liabilities and stockholders’ equity

 $

          56,023


 $

          60,056


Note: The balance sheet at December 31, 2019, has been derived from the audited consolidated financial statements at that date but does not include all information and footnotes required by accounting principles generally accepted in the United States for a complete set of financial statements.


Sypris Solutions, Inc.

Consolidated Cash Flow Statements

(in thousands)


Six Months Ended


July 5,


June 30,


2020


2019


(Unaudited)

Cash flows from operating activities:
Net loss

 $

              (653

)

 $

          (1,533

)

Adjustments to reconcile net loss to net cash used in operating activities:
Depreciation and amortization


                1,259


              1,407


Stock-based compensation expense


                  228


                 283


Deferred loan costs recognized


7


7


Net gain on the sale of assets


                 (958

)


                (477

)

Provision for excess and obsolete inventory


                  125


                 283


Non-cash lease expense


                  491


                 452


Other noncash items


                  100


                (130

)

Contributions to pension plans


                   (34

)


                  (45

)

Changes in operating assets and liabilities:
Accounts receivable


                1,053


             (1,248

)

Inventory


                1,813


             (1,425

)

Prepaid expenses and other assets


                 (457

)


             (1,088

)

Accounts payable


              (2,697

)


             (2,457

)

Accrued and other liabilities


              (1,318

)


                 177


Net cash used in operating activities


              (1,041

)


             (5,794

)

Cash flows from investing activities:
Capital expenditures


(833

)


(671

)

Proceeds from sale of assets


                1,968


                 634


Net cash provided by (used in) investing activities


                1,135


                  (37

)

Cash flows from financing activities:
Finance lease payments


                 (320

)


                (304

)

Proceeds from Paycheck Protection Program loan


                3,558


                    -


Indirect repurchase of shares for minimum statutory tax withholdings


                     (7

)


                (133

)

Net cash provided by (used in) financing activities


                3,231


                (437

)

Effect of exchange rate changes on cash balances


                 (610

)


                   26


Net increase (decrease) in cash and cash equivalents


                2,715


             (6,242

)

Cash and cash equivalents at beginning of period


                5,095


             10,704


Cash and cash equivalents at end of period

 $

             7,810


 $

            4,462


Contacts

Anthony C. Allen
Chief Financial Officer
(502) 329-2000


Read full story here

Renewable Properties breaks ground on Silveira Ranch solar project

SAN FRANCISCO--(BUSINESS WIRE)--#SEIA--Renewable Properties, a developer and investor of small-scale utility and community solar energy projects throughout the U.S., begins construction on the Silveira Ranch Solar Project, the largest community solar array in Marin County to date, after months of development, planning and preparation.


Renewable Properties developed the utility-scale solar project to supply Marin Clean Energy (MCE), California’s first Community Choice Aggregation Program, with 3 MWac of in-service area solar electricity. This is the firm’s first project in Marin County, and third overall developed for MCE to deliver clean, locally-produced electricity to its customers through a 20-year power purchase agreement.

“Climate change is a global problem requiring creative local solutions like the collaborative effort behind this solar installation,” said Aaron Halimi, President of Renewable Properties. “We appreciate the opportunity to continue our work with MCE to supply affordable, locally sourced solar energy to its customers throughout the North Bay, and are especially grateful to the local landowners for making it all possible by leasing us a portion of their cattle ranch to house this project.

The community-scale solar array will occupy 11 acres of a larger 41-acre site privately owned by a local cattle ranching family. Portions of the site will continue to be grazed by cattle to meet county requirements for the project to include continued on-site agricultural use.

We’re grateful to have partners like Renewable Properties we can work with on energy infrastructure projects that lower our carbon footprint,” said Kate Sears, Marin County Third District Supervisor and Board Chair of MCE. “Knowing the concerns around COVID-19 and the economy, these solar projects will not only provide necessary upgrades to our aging grid infrastructure and reduce our dependence on traditional energy sources, but also keep local crews employed in outdoor physically-distanced working conditions when unemployment rates are climbing.”

“The Silveira Ranch solar project is a continuation of MCE’s mission to reduce energy-related greenhouse gas emissions with renewable energy at cost-competitive rates,” said Dawn Weisz, CEO of MCE. “We are grateful to work again with the team at Renewable Properties, who have been excellent partners on several other local projects. Successful partnerships like this allow MCE to further our workforce development efforts with local, fair-wage jobs while increasing the amount of local renewable energy available to our customers.”

Using a fixed tilt racking technology and more than 8,604 bifacial solar photovoltaic (PV) modules, the installation will produce enough clean electricity to power 800 single-family homes in Marin County annually. This is equivalent to avoiding more than 4,723 metric tons of CO₂ emissions annually which is similar to the volume of greenhouse gases emitted from 1,020 passenger vehicles driven over the course of one year1.

Like the recently announced Soscol Ferry Road Solar Project in neighboring Napa County, Silveira Ranch Solar is the first community-scale solar installation in Marin County to include a pollinator plant meadow; the result of a collaboration with San Francisco-based Pollinator Partnership, the world’s largest nonprofit devoted solely to the health of all pollinators.

1 According to US EPA Greenhouse Gas Equivalencies calculations.

About Renewable Properties:

Founded in 2017, Renewable Properties specializes in developing and investing in small-scale utility and community solar energy projects throughout the U.S. Led by experienced renewable energy professionals with development and investment experience, Renewable Properties works closely with communities, developers, landowners, utilities and financial institutions looking to invest in large solar energy systems. For more information about Renewable Properties, visit www.renewprop.com.

About MCE:

As California’s first Community Choice Aggregation Program, MCE is a groundbreaking, not-for-profit, public agency that has been setting the standard for energy innovation in our communities since 2010. MCE offers cleaner power at stable rates, significantly reducing energy-related greenhouse emissions and enabling millions of dollars of reinvestment in local energy programs. MCE is a load-serving entity supporting a 1,000 MW peak load. MCE provides electricity service to more than 480,000 customer accounts and more than one million residents and businesses in 34 member communities across four Bay Area counties: Contra Costa, Napa, Marin and Solano. For more information about MCE, visit mceCleanEnergy.org.


Contacts

Philip Hall
310-430-1091
This email address is being protected from spambots. You need JavaScript enabled to view it.

Offshore Source Logo

Offshore Source keeps you updated with relevant information concerning the Offshore Energy Sector.

Any views or opinions represented on this website belong solely to the author and do not represent those of the people, institutions or organizations that Offshore Source or collaborators may or may not have been associated with in a professional or personal capacity, unless explicitly stated.

Corporate Offices

Technology Systems Corporation
8502 SW Kansas Ave
Stuart, FL 34997

info@tscpublishing.com