Business Wire News

HALIFAX, Nova Scotia--(BUSINESS WIRE)--Today Emera (TSX: EMA) announced financial results for the second quarter of 2020.


Q2 2020 and Year-to-Date Highlights:

Reported Net Income

  • Q2 2020 reported net income was $58 million, or $0.24 per common share, compared with net income of $103 million, or $0.43 per common share, in Q2 2019.
  • Year-to-date reported net income was $581 million, or $2.37 per common share, compared with net income of $415 million, or $1.75 per common share, in the 2019 period.

Adjusted Net Income (1)

  • Q2 2020 adjusted net income was $118 million, or $0.48 per common share, compared with $130 million, or $0.54 per common share, in Q2 2019.
  • Year-to-date adjusted net income was $311 million, or $1.27 per common share, compared with $354 million, or $1.49 per common share, in the 2019 period.

“As our communities continue to deal with the challenges of the global pandemic, our employees remain focused on safely providing the essential energy to our customers,” says Scott Balfour, President and Chief Executive Officer of Emera. “Our businesses delivered solid financial results this quarter and as we look forward, Emera remains committed to our long-term strategy and capital program which are focused on safely delivering cleaner, affordable and reliable energy.”

Significant Items Affecting Reported and Adjusted Net Income

  • Reported earnings for the quarter included a $12 million adjustment to the gain on sale of Emera Maine bringing the final year-to-date gain to $309 million, net of tax and transaction costs. In addition, impairment charges of $3 million quarter-to-date and $26 million year-to date after-tax were recognized on certain assets.
  • Adjusted earnings were impacted by asset sales, including Emera Maine, the New England Gas Generating (“NEGG”) and Bayside generation facilities (the “Gas Plants”), and the property in Florida:
    • Earnings contribution from Emera Maine was $12 million lower in Q2 2020 than in Q2 2019 and $16 million lower year-to-date due to the sale of Emera Maine in March 2020.
    • Earnings contribution from Emera Energy Generation was $21 million lower year-to-date than in 2019 due to the sale of the Gas Plants in March 2019.
    • 2019 year-to-date adjusted net earnings included a $10 million gain on sale of property in Florida.
  • Emera’s earnings for the quarter were also impacted by items that are not expected to recur:
    • Q2 2020 results were lower by $11 million due to the timing of the approval of preferred dividends. In 2019, these dividends approved were expensed in Q3.
    • Q2 2019 adjusted net earnings included $12 million due to the 2019 recognition of tax reform benefits at New Mexico Gas Company (“NMGC”).
  • Emera’s earnings year-to-date, were also impacted by items that are not expected to recur:
    • 2020 year-to-date adjusted earnings were lower by $14 million due to the revaluation of net deferred income tax assets and liabilities due to the reduction in the Nova Scotia provincial corporate income tax rate, recorded in Q1.
    • 2020 year-to-date adjusted earnings were higher due to the recognition of corporate income tax recovery of $10 million deferred as a regulatory liability at Barbados Light & Power Company Limited (“BLPC”).

Cash Flow

  • Year-to-date operating cash flow, before changes in working capital, increased by $41 million to $816 million, compared with $775 million in the 2020 period.

(1) See “Non-GAAP Measures” noted below.

Financial Highlights:


For the

Three months ended

Six months ended

millions of Canadian dollars (except per share
amounts)

June 30

June 30


2020


2019


2020


2019

Net income attributable to common shareholders

$

58

$

103

$

581

$

415

Gain on sale and impairment charges, net of tax

$

(15)


-

$

283


-

After-tax mark-to-market gain (loss)


(45)


(27)


(13)


61

Adjusted net income attributable to common
shareholders (1)(2)

$

118

$

130

$

311

$

354


Earnings per common share – basic

$

0.24

$

0.43

$

2.37

$

1.75

Adjusted earnings per common share – basic (1)(2)

$

0.48

$

0.54

$

1.27

$

1.49


Weighted average shares of common stock
outstanding - basic (millions of shares)


247


239


246


238


(1) See “Non-GAAP Measures” noted below
(2) Adjusted net income and adjusted earnings per common share exclude the effect of mark-to-market adjustments, gain on sale and impairment charges

Emera’s adjusted earnings and adjusted earnings per share increased for the quarter and year-to-date when normalized for the impacts of the one-time items, and asset sales referenced above ($35 million or $0.15 earnings per share for the quarter and $52 million for the year-to-date or $0.22 earnings per share). The increase earnings and earnings per share in these periods was driven by favourable results at Tampa Electric, partially offset by reduced earnings at NSP and Emera Caribbean.

After-tax mark-to-market losses increased $18 million to $45 million in Q2 2020, compared to $27 million in Q2 2019. This increase was due to changes in existing positions on gas contracts and higher amortization of gas transportation assets in 2020, partially offset by gains related to foreign exchange cash flow hedges entered in 2020 to manage foreign exchange earnings exposure. Year-to-date, after-tax mark-to-market decreased $74 million to a $13 million loss in 2020, compared to a $61 million gain in 2019. This decrease was due to higher amortization of gas transportation assets in 2020 and larger reversal of mark-to-market losses in 2019, partially offset by changes in existing positions on gas contracts in Emera Energy and gains related to foreign exchange cash flow hedges.

The weakening of the CAD exchange rates increased earnings by $9 million and adjusted earnings by $3 million in Q2 2020 compared to Q2 2019. The weakening of the CAD exchange rates increased earnings by $14 million and adjusted earnings by $4 million year-to-date in 2020 compared to the same period in 2019.

Consolidated Financial Review:

The following table highlights significant changes in adjusted net income from 2019 to 2020 in the second quarter and year-to-date periods.


For the

Three months ended

Six months ended

millions of Canadian dollars

June 30

June 30

Adjusted net income – 2019(1)(2)

$

130

$

354

Increased earnings at Tampa Electric in both periods due to customer
growth, increased sales to residential customers, higher allowance for
funds used during construction ("AFUDC") earnings from the Big Bend
modernization and solar projects, lower operating, maintenance and
general ("OM&G") expenses, in-service of solar generation and lower
depreciation and amortization expense as a result of a regulatory
settlement. In addition, favourable weather contributed to the year-over-
year increase


21


39

Increased earnings at Emera Energy Services due to favourable
hedges, lower fixed commitments for gas transportation and storage
assets and more favorable market conditions


9


-

Decreased earnings at Nova Scotia Power Inc. (“NSPI”) due to the
impacts of COVID-19 on sales volumes, unfavourable weather in Q1
2020, a corporate income tax recovery in Q2 2019 related to a change
in legislation which impacted the timing of property, plant and equipment
deductions, a higher effective tax rate and higher storm costs


(6)


(11)

Timing of preferred share dividend declaration


(11)


(11)

2019 recognition of tax reform benefits from 2018 in NMGC


(12)


(12)

Revaluation of Corporate, NSPI and Emera Energy net deferred income
tax assets and liabilities due to the Q1 2020 reduction in the Nova
Scotia provincial corporate income tax rate


-


(14)

Lower earnings contribution from the Caribbean utilities in both periods
due to the impacts of COVID-19 at BLPC and Grand Bahama Power
Company Limited (“GBPC”) and the continued recovery from Hurricane
Dorian at GBPC. Year-over-over year decrease partially offset by
recognition of corporate income tax recovery of $10 million deferred as a
regulatory liability in 2018 at BLPC


(12)


(4)

Lower earnings contribution from Emera Maine due to the sale in Q1
2020


(12)


(16)

Decreased earnings year-over year from Emera Energy Generation due
to the sale of Gas Plants in March 2019


3


(21)

Other variances


8


7

Adjusted net income – 2020(1)(2)

$

118

$

311


(1) See “Non-GAAP Measures” noted below
(2) Excludes the effect of mark-to-market adjustments, gain on sale and impairment charges, net of tax

Segmented Results:


For the


Three months ended
June 30


Six Months ended
June 30

millions of Canadian dollars (except per
share amounts)


2020


2019


2020


2019

Adjusted net income (1)


Florida Electric Utility

$

146

$

125

$

225

$

186

Canadian Electric Utilities


37


42


129


138

Other Electric Utilities (2)


(1)


23


19


39

Gas Utilities and Infrastructure


27


40


97


107

Other (2)


(91)


(100)


(159)


(116)

Adjusted net income (1)

$

118

$

130

$

311

$

354


Gain on sale and impairment charges, net of
tax


(15)


-


283


-

After-tax mark-to-market gain (loss)


(45)


(27)


(13)


61

Net income attributable to common
shareholders

$

58

$

103

$

581

$

415

EPS (basic)

$

0.24

$

0.43

$

2.37

$

1.75

Adjusted EPS (basic) (1)(2)

$

0.48

$

0.54

$

1.27

$

1.49


(1) See “Non-GAAP Measures” noted below.
(2) Excludes the effect of mark-to-market adjustments, gain on sale and impairment charges, net of tax

Florida Electric Utility’s CAD net income increased by $21 million to $146 million in Q2 2020, compared to $125 million in Q2 2019. Earnings increased due to higher AFUDC earnings as a result of the Big Bend modernization and solar projects, lower OM&G expenses, higher base revenues and lower depreciation and amortization expense. Operating revenues decreased due to lower clause revenues, however, base revenues increased as a result of customer growth, a greater mix of sales to residential customers and the in-service of solar generation projects. Year-to-date, Florida Electric Utility’s CAD net income increased by $39 million to $225 million, compared to $186 million in 2019. Earnings increased due to higher base revenues, higher AFUDC earnings and lower OM&G expenses. Operating revenues decreased due to lower clause revenues, however, base revenues increased as a result of the in-service of solar generation projects, customer growth, a greater mix of residential sales and favourable weather.

Canadian Electric Utilities’ net income decreased by $5 million to $37 million, compared to $42 million in Q2 2019. Year-to-date, Canadian Electric Utilities’ net income was $129 million, compared to $138 million in 2019 period. The decrease in both periods was due to lower contribution from NSPI. Quarter-to-date, the decrease was due to the impacts of COVID-19 on sales volumes, increased income taxes reflecting a Q2 2019 corporate income tax recovery due to enactment of tax legislation and a higher effective tax rate, and higher storm costs, partially offset by regulatory deferral timing. Year-to-date, the decrease was due to the impacts of COVID-19 and unfavourable weather on sales volumes, increased income taxes reflecting a higher effective tax rate, and higher storm costs, partially offset by regulatory deferral timing The timing of regulatory deferrals causes quarterly earnings volatility, while full year results are more predictable.

Other Electric Utilities’ CAD net income, adjusted to exclude mark-to-market, decreased by $24 million to a loss of $1 million in Q2 2020, compared to $23 million in Q2 2019. Year-to-date, Other Electric Utilities’ CAD net income, adjusted to exclude mark-to-market, decreased by $20 million to $19 million, compared to $39 million in 2019. Lower contribution from Emera Maine as a result of the sale in Q1 2020 decreased earnings in both periods. Emera Caribbean’s contribution decreased in both periods as a result of lower revenue due to the impact of the COVID-19 pandemic and lower revenue at GBPC due to the impact of Hurricane Dorian. Year-to-date, the decrease was partially offset by the recognition of a previously deferred corporate income tax recovery related to the enactment of a lower corporate income tax rate in December 2018 at BLPC.

Gas Utilities and Infrastructure’s CAD net income decreased by $13 million to $27 million in Q2 2020, compared to $40 million in Q2 2019. Year-to-date, Gas Utilities and Infrastructure’s CAD net income decreased by $10 million to $97 million, compared to $107 million in 2019. Decreases in both periods were due to NMGC’s recognition of tax reform benefits in Q2 2019, lower base revenues at PGS due to the impacts of COVID-19 on commercial sales, and higher OM&G expenses and depreciation expenses at PGS. These decreases were partially offset by higher customer growth and higher return on investment in Cast Iron/Bare Steel replacement rider at PGS and lower OM&G expenses and depreciation rates at NMGC.

Other’s net loss, adjusted to exclude after-tax mark-to-market and the after-tax gain on sale and impairment charges recognized on certain other assets decreased by $9 million to $91 million in Q2 2019, compared to $100 million in Q2 2019. Year-to-date, Other’s contribution decreased $43 million to a loss of $159 million compared to a loss of $116 million in 2019. In Q2 2020, the decreased losses were due to higher marketing and trading margin and lower interest, partially offset by timing of preferred stock dividends and lower income tax recovery. Year-over-year the increased losses were due to the impact of the sale of NEGG and Bayside Power, timing of preferred stock dividends, revaluation of net deferred income tax assets resulting from the enactment of a lower Nova Scotia provincial corporate income tax rate in Q1 2020, higher OM&G and the 2019 sale of property in Florida. These decreases were partially offset by increased income tax recovery due to the impact of effective state tax rates and lower interest.

Non-GAAP Measures

Emera uses financial measures that do not have standardized meaning under USGAAP and may not be comparable to similar measures presented by other entities. Emera calculates the non-GAAP measures by adjusting certain GAAP and non-GAAP measures for specific items the Company believes are significant, but not reflective of underlying operations in the period. Refer to the Non-GAAP Financial Measures section of our Management's Discussion and Analysis ("MD&A") for further discussion of these items.

Forward Looking Information

This news release contains forward-looking information within the meaning of applicable securities laws. By its nature, forward-looking information requires Emera to make assumptions and is subject to inherent risks and uncertainties. These statements reflect Emera management’s current beliefs and are based on information currently available to Emera management. There is a risk that predictions, forecasts, conclusions and projections that constitute forward-looking information will not prove to be accurate, that Emera’s assumptions may not be correct and that actual results may differ materially from such forward-looking information. Additional detailed information about these assumptions, risks and uncertainties is included in Emera’s securities regulatory filings, including under the heading “Business Risks and Risk Management” in Emera’s annual Management’s Discussion and Analysis, and under the heading “Principal Risks and Uncertainties” in the notes to Emera’s annual and interim financial statements, which can be found on SEDAR at www.sedar.com.

Teleconference Call

The company will be hosting a teleconference today, Wednesday, August 12, 2020 at 9:30 a.m. Atlantic (8:30 a.m. Eastern) to discuss the Q2 2020 financial results.

Analysts and other interested parties in North America are invited to participate by dialing 1-866-521-4909. International parties are invited to participate by dialing 1-647-427-2311. Participants should dial in at least 10 minutes prior to the start of the call. No pass code is required.

A live and archived audio webcast of the teleconference will be available on the Company's website, www.emera.com. A replay of the teleconference will be available two hours after the conclusion of the call until September 15, 2020, by dialing 1-800-585-8367 and entering pass code 9866959.

About Emera

Emera Inc. is a geographically diverse energy and services company headquartered in Halifax, Nova Scotia, with approximately $32 billion in assets and 2019 revenues of more than $6.1 billion. The company primarily invests in regulated electricity generation and electricity and gas transmission and distribution with a strategic focus on transformation from high carbon to low carbon energy sources. Emera has investments throughout North America, and in four Caribbean countries. Emera’s common and preferred shares are listed on the Toronto Stock Exchange and trade respectively under the symbol EMA, EMA.PR.A, EMA.PR.B, EMA.PR.C, EMA.PR.E, EMA.PR.F and EMA.PR.H. Depositary receipts representing common shares of Emera are listed on the Barbados Stock Exchange under the symbol EMABDR and on The Bahamas International Securities Exchange under the symbol EMAB. Additional Information can be accessed at www.emera.com or at www.sedar.com.


Contacts

Emera Inc.

Investor Relations:
Ken McOnie, VP, Investor Relations and Treasurer
902-428-6945
This email address is being protected from spambots. You need JavaScript enabled to view it.

Scott Hastings, Senior Director, Capital Markets
902-474-4787
This email address is being protected from spambots. You need JavaScript enabled to view it.

Media:
902-222-2683
This email address is being protected from spambots. You need JavaScript enabled to view it.

Wappingers Central School District will leverage energy cost savings to implement new conservation measures and install solar arrays

FRAMINGHAM, Mass.--(BUSINESS WIRE)--#efficiency--Ameresco, Inc., (NYSE: AMRC), a leading energy efficiency and renewable energy company, today announced that it has begun the second phase of comprehensive energy infrastructure projects for Wappingers Central School District in New York. Wappingers Central School District selected Ameresco to implement a range of energy conservation measures and install solar photovoltaic (PV) systems to reduce electricity consumption and annual utility costs.


The Wappingers Central School District completed a phase one energy project with Ameresco in 2013 and has now undertaken a second phase to achieve even greater savings and invest in renewable energy. Wappingers Central School District is financing its project with an ESPC and estimates it will save $8.4 million over the course of its 18-year contract term. Phase two of the Wappingers Central School District project involves a variety of energy conservation measures at 14 district buildings and the installation of 1.9 MW of solar PV capacity at five school buildings.

“As one of the largest school districts in the State of New York, we believe that our energy infrastructure project can serve as a model for others that seek to update and upgrade their facilities,” said Ron Broas, Director of Facilities and Operations for Wappingers Central School District. “We strive to create a comfortable learning environment for each of the more than 11,000 students enrolled at our schools and believe that the improvements made as a result of our work with Ameresco will further that aim.”

With work already underway, the project is expected to be complete in March 2021.

“Wappingers Central School District is going above and beyond traditional energy saving initiatives to establish its own sources of on-site renewable energy in the form of solar power,” said David J. Anderson, EVP and Director at Ameresco. “What makes this project truly impressive is that it is entirely budget-neutral, as the District will leverage the energy cost savings to pay for the investment in infrastructure upgrades. Furthermore, by combining the implementation of energy efficiency improvements with a renewable energy solution, the District will also have a significant impact in reducing its carbon footprint.”

About Wappingers Central School District

The Wappingers Central School District is one of the largest central school districts in New York State, with an enrollment of over 11,000 students. The mission of the Wappingers Central School District is to empower all of our students with the competencies and confidence to challenge themselves, to pursue their passions, and to realize their potential while growing as responsible members of their community.

About Ameresco, Inc.

Founded in 2000, Ameresco, Inc. (NYSE:AMRC) is a leading independent provider of comprehensive services, energy efficiency, infrastructure upgrades, asset sustainability and renewable energy solutions for businesses and organizations throughout North America and Europe. Ameresco’s sustainability services include upgrades to a facility’s energy infrastructure and the development, construction and operation of renewable energy plants. Ameresco has successfully completed energy saving, environmentally responsible projects with Federal, state and local governments, healthcare and educational institutions, housing authorities, and commercial and industrial customers. With its corporate headquarters in Framingham, MA, Ameresco has more than 1,000 employees providing local expertise in the United States, Canada, and the United Kingdom. For more information, visit www.ameresco.com.

The announcement of a customer’s entry into a project contract is not necessarily indicative of the timing or amount of revenue from such contract, of the company’s overall revenue for any particular period or of trends in the company’s overall total project backlog. This project was included in our previously reported contracted backlog as of June 30, 2020.


Contacts

Ameresco: Leila Dillon, 508-661-2264, This email address is being protected from spambots. You need JavaScript enabled to view it.

LONDON--(BUSINESS WIRE)--#GlobalInspectionRobotsMarket--Technavio has been monitoring the inspection robots market and it is poised to grow by USD 3.72 billion during 2020-2024, progressing at a CAGR of almost 19% during the forecast period. The report offers an up-to-date analysis regarding the current market scenario, latest trends and drivers, and the overall market environment.


Although the COVID-19 pandemic continues to transform the growth of various industries, the immediate impact of the outbreak is varied. While a few industries will register a drop in demand, numerous others will continue to remain unscathed and show promising growth opportunities. Technavio’s in-depth research has all your needs covered as our research reports include all foreseeable market scenarios, including pre- & post-COVID-19 analysis. Download a Free Sample Report on COVID-19 Impacts

Frequently Asked Questions-

  • Based on the segmentation by end-user, which is the leading segment in the market?
  • The oil and gas industry is expected to be the leading segment.
  • At what rate is the market projected to grow?
  • Growing at a CAGR of almost 19%, the incremental growth of the market is anticipated to be USD 3.72 billion during the same.
  • Who are the top players in the market?
  • Cognex Corp., Eddyfi NDT Inc., Ensign-Bickford Industries Inc., FARO Technologies Inc., General Electric Co., Groupe Gorgé, IPG Photonics Corp., MISTRAS Group Inc., TechnipFMC Plc, and Teradyne Inc. are some of the major market participants.
  • What are the key market drivers and challenges?
  • Benefits of robotic inspection and integration of IoT and AI to optimize inspection operations are the major factors driving the market. However, the high cost associated with SBH solutions restraints the market growth.

The market is fragmented, and the degree of fragmentation will accelerate during the forecast period. Cognex Corp., Eddyfi NDT Inc., Ensign-Bickford Industries Inc., FARO Technologies Inc., General Electric Co., Groupe Gorgé, IPG Photonics Corp., MISTRAS Group Inc., TechnipFMC Plc, and Teradyne Inc. are some of the major market participants. The benefits of robotic inspection will offer immense growth opportunities. To make most of the opportunities, market vendors should focus more on the growth prospects in the fast-growing segments, while maintaining their positions in the slow-growing segments.

Buy 1 Technavio report and get the second for 50% off. Buy 2 Technavio reports and get the third for free.

View market snapshot before purchasing

Technavio's custom research reports offer detailed insights on the impact of COVID-19 at an industry level, a regional level, and subsequent supply chain operations. This customized report will also help clients keep up with new product launches in direct & indirect COVID-19 related markets, upcoming vaccines and pipeline analysis, and significant developments in vendor operations and government regulations.

Inspection Robots Market 2020-2024: Segmentation

Inspection Robots Market is segmented as below:

  • End-user
    • Oil And Gas
    • Petrochemicals
    • Food and Beverages
    • Others
  • Type
    • ROVs
    • Autonomous Robots
  • Geographic Landscape
    • APAC
    • Europe
    • MEA
    • North America
    • South America

To learn more about the global trends impacting the future of market research, download a free sample: https://www.technavio.com/talk-to-us?report=IRTNTR40023

Inspection Robots Market 2020-2024: Scope

Technavio presents a detailed picture of the market by the way of study, synthesis, and summation of data from multiple sources. The inspection robots market report covers the following areas:

  • Inspection Robots Market Size
  • Inspection Robots Market Trends
  • Inspection Robots Market Analysis

This study identifies the integration of IoT and AI to optimize inspection operations as one of the prime reasons driving the inspection robots market growth during the next few years.

Technavio suggests three forecast scenarios (optimistic, probable, and pessimistic) considering the impact of COVID-19. Technavio’s in-depth research has direct and indirect COVID-19 impacted market research reports.

Register for a free trial today and gain instant access to 17,000+ market research reports. Technavio's SUBSCRIPTION platform

Inspection Robots Market 2020-2024: Key Highlights

  • CAGR of the market during the forecast period 2020-2024
  • Detailed information on factors that will assist inspection robots market growth during the next five years
  • Estimation of the inspection robots market size and its contribution to the parent market
  • Predictions on upcoming trends and changes in consumer behavior
  • The growth of the inspection robots market
  • Analysis of the market’s competitive landscape and detailed information on vendors
  • Comprehensive details of factors that will challenge the growth of inspection robots market vendors

Table of Contents:

PART 01: EXECUTIVE SUMMARY

PART 02: SCOPE OF THE REPORT

  • 2.1 Preface
  • 2.2 Preface
  • 2.3 Currency conversion rates for US$

PART 03: MARKET LANDSCAPE

  • Market ecosystem
  • Value chain analysis
  • Market characteristics
  • Market segmentation analysis

PART 04: MARKET SIZING

  • Market definition
  • Market sizing 2019
  • Market Outlook
  • Market size and forecast 2019-2024

PART 05: FIVE FORCES ANALYSIS

  • Bargaining power of buyers
  • Bargaining power of suppliers
  • Threat of new entrants
  • Threat of substitutes
  • Threat of rivalry
  • Market condition

PART 06: MARKET SEGMENTATION BY TYPE

  • Market segmentation by type
  • Comparison by type
  • ROVs - Market size and forecast 2019-2024
  • Autonomous robots - Market size and forecast 2019-2024
  • Market opportunity by type

PART 07: CUSTOMER LANDSCAPE

PART 08: MARKET SEGMENTATION BY END-USER

  • Market segmentation by end-user
  • Comparison by end-user
  • Oil and gas - Market size and forecast 2019-2024
  • Petrochemicals - Market size and forecast 2019-2024
  • Food and beverages - Market size and forecast 2019-2024
  • Others - Market size and forecast 2019-2024
  • Market opportunity by end-user

PART 09: GEOGRAPHIC LANDSCAPE

  • Geographic segmentation
  • Geographic comparison
  • Europe - Market size and forecast 2019-2024
  • North America - Market size and forecast 2019-2024
  • APAC - Market size and forecast 2019-2024
  • South America - Market size and forecast 2019-2024
  • MEA - Market size and forecast 2019-2024
  • Key leading countries
  • Market opportunity

PART 10: DECISION FRAMEWORK

PART 11: DRIVERS AND CHALLENGES

  • Market drivers
  • Market challenges

PART 12: MARKET TRENDS

  • Advances in robotic inspection
  • Integration of IoT and AI to optimize inspection operations
  • Advances in mobile robots

PART 13: VENDOR LANDSCAPE

  • Overview
  • Landscape disruption
  • Competitive scenario

PART 14: VENDOR ANALYSIS

  • Vendors covered
  • Vendor classification
  • Market positioning of vendors
  • Cognex Corp.
  • Eddyfi NDT, Inc.
  • Ensign-Bickford Industries Inc.
  • FARO Technologies Inc.
  • General Electric Co.
  • Groupe Gorgé
  • IPG Photonics Corp.
  • MISTRAS Group Inc.
  • TechnipFMC Plc
  • Teradyne Inc.

PART 15: APPENDIX

  • Research methodology
  • List of abbreviations
  • Definition of market positioning of vendors

PART 16: EXPLORE TECHNAVIO

About Us

Technavio is a leading global technology research and advisory company. Their research and analysis focuses on emerging market trends and provides actionable insights to help businesses identify market opportunities and develop effective strategies to optimize their market positions. With over 500 specialized analysts, Technavio’s report library consists of more than 17,000 reports and counting, covering 800 technologies, spanning across 50 countries. Their client base consists of enterprises of all sizes, including more than 100 Fortune 500 companies. This growing client base relies on Technavio’s comprehensive coverage, extensive research, and actionable market insights to identify opportunities in existing and potential markets and assess their competitive positions within changing market scenarios.


Contacts

Technavio Research
Jesse Maida
Media & Marketing Executive
US: +1 844 364 1100
UK: +44 203 893 3200
Email: This email address is being protected from spambots. You need JavaScript enabled to view it.
Website: www.technavio.com/


Grant program has provided nearly $4M to date for STEM education and research programs reaching 200,000 students nationwide

BALTIMORE--(BUSINESS WIRE)--#EnergyMadeEfficient--With the coronavirus pandemic causing significant disruptions to the education system, the challenge is greater than ever to provide innovation and resources to support the development of the next generation of STEM and energy leaders. Constellation, an Exelon company, is responding by adapting its annual STEM funding awards to the virtual learning environment.


Constellation is now accepting applications for its 2020 E2 Energy to Educate grant program, which provides funding for student projects focusing on energy innovation. Educators and students in grades 6-12 can apply for program grants up to $25,000, and two- and four-year colleges can apply for grants up to $50,000. The deadline for applications is Oct. 1, 2020.

“Since its inception, Energy to Educate has supported students and educators that bring unparalleled creativity, curiosity, and passion to STEM and energy learning,” said Jorge Acevedo, senior vice president, Innovation and Strategy for Constellation. “Those attributes will be put to the test as the pandemic alters the environment and structure in which students nationwide are learning. We’re eager to see the ingenuity that results from this challenge and look forward to another stellar group of student-led projects.”

In 2019, Energy to Educate awarded more than $467,000 across 18 projects and reached nearly 20,000 students nationwide. Projects included solar car competitions, fuel cell technology, energy storage, wind power, and teaching energy concepts via an interactive gaming platform. To date, the grant program has provided nearly $4 million for research and education projects that have fueled the exploration into STEM fields for more than 200,000 students.

“Without the E2 Energy to Educate grant, Rochester Institute of Technology would not have been able to host area students for its 2019 fuel cell summer camp,” says Stephanie Rankin, Director of Foundation Relations for Rochester Institute of Technology. “This camp enables students to see that experiments around energy can be fun, and through a university experience, envision themselves pursuing a fulfilling career in energy.”

To be eligible for funding, a project must align with the following energy innovation themes. Project content must also be delivered virtually or through small and safe in-person settings:

  • Smart Home: How will new technologies and artificial intelligence transform our home energy usage in the future? More and more, homes are generating their own electricity and interactive technology is becoming a part of our daily lives.
  • Electrification: What will the future of transportation look like? New technologies can power us into a cleaner energy future via electrification.
  • Clean Energy & Zero Waste: How do we understand which energy sources and choices will have the greatest impact on our collective and individual carbon footprint? What if we could harness and store energy that would otherwise be wasted? The recycling and storage movement is catching on in energy thanks to innovative technologies.

Exelon companies, together with Constellation, contributed more than $50 million to nonprofits in 2019 supporting education, the environment, culture and arts, and community development.

Grant recipients are announced each year during American Education Week. To learn more about the program and application criteria, visit the Community Outreach section of www.constellation.com.

About Constellation

Constellation is a leading competitive retail supplier of power, natural gas and energy products and services for homes and businesses across the continental United States. Constellation's family of retail businesses serves approximately 2 million residential, public sector and business customers, including more than three-fourths of the Fortune 100. Baltimore-based Constellation is a subsidiary of Exelon Corporation (NASDAQ: EXC), the nation’s leading competitive energy provider, with 2019 revenues of approximately $34 billion, and more than 31,000 megawatts of owned capacity comprising one of the nation’s cleanest and lowest-cost power generation fleets. Learn more at www.constellation.com or on Twitter at @ConstellationEG.


Contacts

Dave Snyder
Constellation
410-470-9700
This email address is being protected from spambots. You need JavaScript enabled to view it.

HOUSTON--(BUSINESS WIRE)--Genesis Energy, L.P. (NYSE: GEL) announced today that it will participate in the 2020 Citi One-on-One Midstream / Energy Infrastructure Virtual Conference. The conference is being held August 12th and 13th.


The Partnership’s latest presentation materials are available and may be downloaded by visiting the Partnership’s website at www.genesisenergy.com under “Presentations” under the Investors tab.

Genesis Energy, L.P. is a diversified midstream energy master limited partnership headquartered in Houston, Texas. Genesis’ operations include offshore pipeline transportation, sodium minerals and sulfur services, onshore facilities and transportation and marine transportation. Genesis’ operations are primarily located in the Gulf Coast region of the United States, Wyoming and the Gulf of Mexico.


Contacts

Genesis Energy, L.P.
Ryan Sims
SVP – Finance and Corporate Development
(713) 860-2521

2019 accomplishments include a 10% growth in renewable energy use, 20% incident rate reduction and 93% of global sites hosted community outreach activities

SAN JOSE, Calif.--(BUSINESS WIRE)--Flex (NASDAQ: FLEX) today released its 2020 sustainability report, summarizing the company’s global sustainability activities, performance and results from calendar year 2019. The report provides a look at how Flex is stewarding sustainable manufacturing operations to minimize its environmental impact, driving responsible business practices and contributing to the communities in which it operates.


Flex’s sustainability efforts focus on five areas, including people, community, environment, social innovation and integrity, and align with 20 goals the company set out to reach by the end of 2020. The company’s 20 goals support the advancement of the United Nations Sustainable Development Goals and the UN Global Compact’s principles.

2019 key highlights

  • 10% increase in renewable energy use year-over-year
  • 20% safety incident rate reduction from 2018
  • 98% of new global suppliers were screened using social and environmental criteria
  • Women represented 42% of the company’s total workforce and 30% of the Board of Directors
  • 93% of sites hosted community outreach activities, supported by 48,000+ employee volunteer hours
  • Nearly 100,000 people benefited from 20+ projects through the Flex Foundation

In 2019, Flex was recognized as an FTSE4Good Index Series constituent for the fourth consecutive year, received an A- rating from CDP (formerly Carbon Disclosure Project) for its disclosures in climate change and water security and earned the highest disclosure and transparency score on environmental, social and corporate governance factors from Institutional Shareholder Services, among other honors for sustainability initiatives.

Sustainability is core to Flex’s mission of becoming the most trusted technology, supply chain and manufacturing partner. As we determine our next set of sustainability targets, we remain committed to driving programs that help address broader societal and environmental issues, such as climate change, and transparently disclosing our progress toward our goals,” said Kyra Whitten, vice president, Marketing, Communications and Sustainability at Flex.

Prepared in accordance with the Global Reporting Initiative (GRI) standards: Core Option, the Flex 2020 sustainability report can be viewed at https://flex.com/company/our-sustainability/reporting-and-alignment.

About Flex

Flex (Reg. No. 199002645H) is the manufacturing partner of choice that helps a diverse customer base design and build products that improve the world. Through the collective strength of a global workforce across 30 countries and responsible, sustainable operations, Flex delivers technology innovation, supply chain, and manufacturing solutions to diverse industries and end markets.


Contacts

Media & Press
Jessica Anderson
Corporate Communications Manager
(408) 577-4789
This email address is being protected from spambots. You need JavaScript enabled to view it.

Investors & Analysts
David Rubin
Vice President, Investor Relations
(408) 577-4632
This email address is being protected from spambots. You need JavaScript enabled to view it.

TULSA, Okla.--(BUSINESS WIRE)--NGL Energy Partners LP (NYSE:NGL) today announced that it will participate in the Citi 2020 One-on-One Midstream/Energy Infrastructure Virtual Conference on August 12 and 13, 2020. Members of NGL’s management team will be participating in a series of virtual meetings with members of the investment community.


NGL’s slide presentation referenced at the Conference is available on NGL’s website at www.nglenergypartners.com on the “Presentations” sub-tab under the “Investor Relations” section.

About NGL Energy Partners LP

NGL Energy Partners LP, a Delaware limited partnership, is a diversified midstream energy company that transports, stores, markets and provides other logistics services for crude oil, natural gas liquids and other products and transports, treats and disposes of produced water generated as part of the oil and natural gas production process. For further information, visit the Partnership’s website at www.nglenergypartners.com.


Contacts

Trey Karlovich, 918-481-1119
Executive Vice President and Chief Financial Officer
This email address is being protected from spambots. You need JavaScript enabled to view it.
or
Linda Bridges, 918-481-1119
Senior Vice President – Finance and Treasurer
This email address is being protected from spambots. You need JavaScript enabled to view it.


LONDON--(BUSINESS WIRE)--#AutomationSolutionsMarketintheOilandGasIndustry--Technavio has been monitoring the automation solutions market in the oil and gas industry and it is poised to grow by USD 1.49 billion during 2020-2024, progressing at a CAGR of over 3% during the forecast period. The report offers an up-to-date analysis regarding the current market scenario, latest trends and drivers, and the overall market environment.


Although the COVID-19 pandemic continues to transform the growth of various industries, the immediate impact of the outbreak is varied. While a few industries will register a drop in demand, numerous others will continue to remain unscathed and show promising growth opportunities. Technavio’s in-depth research has all your needs covered as our research reports include all foreseeable market scenarios, including pre- & post-COVID-19 analysis. Download a Free Sample Report on COVID-19 Impacts.

Frequently Asked Questions-

  • Based on segmentation by product, which is the leading segment in the market?
  • The SCADA systems segment is expected to be the leading segment in the global market during the forecast period.
  • At what rate is the market projected to grow?
  • Growing at a CAGR of over 3%, the incremental growth of the market is anticipated to be USD 1.49 billion during the forecast period.
  • Who are the top players in the market?
  • ABB Ltd., Eaton Corp. Plc, Emerson Electric Co., Honeywell International Inc., Mitsubishi Electric Corp., OMRON Corp., Rockwell Automation Inc., Schneider Electric SE, Siemens AG, and Yokogawa Electric Corp. are some of the major market participants.
  • What is the key market driver?
  • Rise in the global demand for oil and gas is the major factor driving the market.

The market is fragmented, and the degree of fragmentation will accelerate during the forecast period. ABB Ltd., Eaton Corp. Plc, Emerson Electric Co., Honeywell International Inc., Mitsubishi Electric Corp., OMRON Corp., Rockwell Automation Inc., Schneider Electric SE, Siemens AG, and Yokogawa Electric Corp. are some of the major market participants. The rise in the global demand for oil and gas will offer immense growth opportunities. To make most of the opportunities, market vendors should focus more on the growth prospects in the fast-growing segments, while maintaining their positions in the slow-growing segments.

Buy 1 Technavio report and get the second for 50% off. Buy 2 Technavio reports and get the third for free.

View market snapshot before purchasing

Technavio's custom research reports offer detailed insights on the impact of COVID-19 at an industry level, a regional level, and subsequent supply chain operations. This customized report will also help clients keep up with new product launches in direct & indirect COVID-19 related markets, upcoming vaccines and pipeline analysis, and significant developments in vendor operations and government regulations.

Automation Solutions Market in the Oil and Gas Industry 2020-2024: Segmentation

Automation Solutions Market in the Oil and Gas Industry is segmented as below:

  • Product
    • SCADA
    • DCS
    • PLC
    • MES
  • Geography
    • North America
    • APAC
    • Europe
    • MEA
    • South America

To learn more about the global trends impacting the future of market research, download a free sample: https://www.technavio.com/talk-to-us?report=IRTNTR40070

Automation Solutions Market in the Oil and Gas Industry 2020-2024: Scope

Technavio presents a detailed picture of the market by the way of study, synthesis, and summation of data from multiple sources. The automation solutions market in the oil and gas industry report covers the following areas:

  • Automation Solutions Market in the Oil and Gas Industry Size
  • Automation Solutions Market in the Oil and Gas Industry Trends
  • Automation Solutions Market in the Oil and Gas Industry Analysis

This study identifies the growing importance of big data analytics and IoT as one of the prime reasons driving the automation solutions market growth in the oil and gas industry during the next few years.

Technavio suggests three forecast scenarios (optimistic, probable, and pessimistic) considering the impact of COVID-19. Technavio’s in-depth research has direct and indirect COVID-19 impacted market research reports.

Register for a free trial today and gain instant access to 17,000+ market research reports. Technavio's SUBSCRIPTION platform

Automation Solutions Market in the Oil and Gas Industry 2020-2024: Key Highlights

  • CAGR of the market during the forecast period 2020-2024
  • Detailed information on factors that will assist automation solutions market growth in the oil and gas industry during the next five years
  • Estimation of the automation solutions market size in the oil and gas industry and its contribution to the parent market
  • Predictions on upcoming trends and changes in consumer behavior
  • The growth of the automation solutions market in the oil and gas industry
  • Analysis of the market’s competitive landscape and detailed information on vendors
  • Comprehensive details of factors that will challenge the growth of automation solutions market vendors in the oil and gas industry

Table of Contents:

PART 01: EXECUTIVE SUMMARY

PART 02: SCOPE OF THE REPORT

  • 2.1 Preface
  • 2.2 Preface
  • 2.3 Currency conversion rates for US$

PART 03: MARKET LANDSCAPE

  • Market ecosystem
  • Value chain analysis
  • Market characteristics
  • Market segmentation analysis

PART 04: MARKET SIZING

  • Market definition
  • Market sizing 2019
  • Market size and forecast 2019-2024

PART 05: FIVE FORCES ANALYSIS

  • Bargaining power of buyers
  • Bargaining power of suppliers
  • Threat of new entrants
  • Threat of substitutes
  • Threat of rivalry
  • Market condition

PART 06: MARKET SEGMENTATION BY PRODUCT

  • Market segmentation by product
  • Comparison by product
  • SCADA - Market size and forecast 2019-2024
  • DCS - Market size and forecast 2019-2024
  • PLC - Market size and forecast 2019-2024
  • MES - Market size and forecast 2019-2024
  • Market opportunity by product

PART 07: CUSTOMER LANDSCAPE

PART 08: GEOGRAPHIC LANDSCAPE

  • Geographic segmentation
  • Geographic comparison
  • North America - Market size and forecast 2019-2024
  • APAC - Market size and forecast 2019-2024
  • Europe - Market size and forecast 2019-2024
  • MEA - Market size and forecast 2019-2024
  • South America - Market size and forecast 2019-2024
  • Key leading countries
  • Market opportunity

PART 09: DECISION FRAMEWORK

PART 10: DRIVERS AND CHALLENGES

  • Market drivers
  • Market challenges

PART 11: MARKET TRENDS

  • Growing importance of big data analytics and IoT
  • Value chain integration
  • Shift from on-premise to cloud-based systems

PART 12: VENDOR LANDSCAPE

  • Overview
  • Landscape disruption
  • Competitive scenario

PART 13: VENDOR ANALYSIS

  • Vendors covered
  • Vendor classification
  • Market positioning of vendors
  • ABB Ltd.
  • Eaton Corp. Plc
  • Emerson Electric Co.
  • Honeywell International Inc.
  • Mitsubishi Electric Corp.
  • OMRON Corp.
  • Rockwell Automation Inc.
  • Schneider Electric SE
  • Siemens AG
  • Yokogawa Electric Corp.

PART 14: APPENDIX

  • Research methodology
  • List of abbreviations
  • Definition of market positioning of vendors

PART 15: EXPLORE TECHNAVIO

About Us

Technavio is a leading global technology research and advisory company. Their research and analysis focuses on emerging market trends and provides actionable insights to help businesses identify market opportunities and develop effective strategies to optimize their market positions. With over 500 specialized analysts, Technavio’s report library consists of more than 17,000 reports and counting, covering 800 technologies, spanning across 50 countries. Their client base consists of enterprises of all sizes, including more than 100 Fortune 500 companies. This growing client base relies on Technavio’s comprehensive coverage, extensive research, and actionable market insights to identify opportunities in existing and potential markets and assess their competitive positions within changing market scenarios.


Contacts

Technavio Research
Jesse Maida
Media & Marketing Executive
US: +1 844 364 1100
UK: +44 203 893 3200
Email: This email address is being protected from spambots. You need JavaScript enabled to view it.
Website: www.technavio.com/

LEAWOOD, KS--(BUSINESS WIRE)--Tortoise announced the launch of an open-end fund, Ecofin Global Renewables Infrastructure Fund (ECOIX), built to capitalize on the energy transition underway to reduce global CO2 emissions. The fund carries a strong performance track record of nearly five years*, has a AAA MSCI ESG rating (as of August 7, 2020) and is available to U.S. retail and institutional investors through its institutional class shares.


“Our competitive advantage is the investment team experience and we have a track record managing this strategy for nearly five years, delivering double-digit annualized returns with lower risk than the market, while providing a measurable decarbonization impact,” said Michel Sznajer, Portfolio Manager. “This strategy is focused specifically on the rapidly growing migration into renewable and related clean electricity infrastructure as renewables are now the lowest-cost option for new-build electricity capacity in most markets in the world.” Please click here for the fund's standardized performance and beta.

Performance data quoted represents past performance; past performance does not guarantee future results. The investment return and principal value of an investment will fluctuate so that an investor’s shares, when redeemed, may be worth more or less than their original cost. Current performance of the fund may be lower or higher than the performance quoted. Performance data current to the most recent month end may be obtained by calling 855-822-3863.

“Our team has been focused on and investing across the energy transition universe for over a decade,” said Matt Breidert, Senior Portfolio Manager. “We are at the start of a long shift towards clean electricity growing its share within the global energy mix, driven by consumer changes in transportation (electric vehicles), digitization and electrification in commerce, demand from multi-national corporates requiring reduced carbon footprints in their global supply chains, and soon supplying zero-carbon electricity to kick-off the green hydrogen industry. This strategy offers investors an opportunity to capitalize on all of these structural shifts.”

Key reasons to invest:

  • Access to the fast-growing decarbonization theme
  • Track record for nearly five years of strong performance with lower risk than the market
  • Measurable impact on emissions reductions; highest AAA ESG rating from MSCI (as of August 7, 2020)

“At Ecofin, our mission is to identify global challenges in need of capital and create investment strategies that optimize returns to investors and maximize the measurable impact to society,” said Brent Newcomb, President - Ecofin. “Universally, we believe investors are materially underweight climate change and renewables, including the technology driving renewable adoption. Bringing this type of product to U.S. investors was part of our strategic plan when Tortoise acquired Ecofin Limited in 2018.”

To learn more about ECOIX visit ecofininvest.com/ecoix.

About Ecofin

Ecofin unites ecology and finance and has roots back to the early 1990s. Our mission is to generate strong risk-adjusted returns and measurable impacts. We invest in essential assets and services that contribute to more sustainable human ecosystems and communities. We are socially-minded, ESG-attentive investors, successfully harnessing years of expertise investing in social impact, sustainable infrastructure, energy transition and clean water & environment. Our strategies are accessible through a variety of investment solutions and seek to achieve positive impacts that align with UN Sustainable Development Goals by addressing pressing global issues surrounding climate action, clean energy and water, education, healthcare and sustainable communities. For additional information, please visit ecofininvest.com.

*The Ecofin Global Renewables Infrastructure Fund (the Fund) is a newly registered mutual fund and does not have a full calendar year of performance as a mutual fund. Prior performance shown above is for the Ecofin Global Renewables Infrastructure Fund Limited, established in November 2015 (which later changed its name to the Tortoise Global Renewables Infrastructure Fund Limited in May 2019), (the “Predecessor Fund”), an unregistered Cayman Islands limited liability company. The Predecessor Fund was reorganized into the Fund by transferring substantially all of the Predecessor Fund’s assets to the Fund in exchange for Institutional Class shares of the Fund on August 7, 2020, the date that the Fund commenced operations (the “Reorganization”). The Predecessor Fund has been managed in the same style as the Fund. The Sub-Adviser served as the investment adviser to the Predecessor Fund and will be responsible for the portfolio management and trading for the Fund. Each of the Fund’s portfolio managers was a portfolio manager of the Predecessor Fund at the time of the Reorganization. The Fund’s investment objective, policies, guidelines and restrictions are, in all material respects, the same as those of the Predecessor Fund.

Before investing in the fund, investors should consider their investment goals, time horizons and risk tolerance. The fund’s investment objective, risks, charges and expenses must be considered carefully before investing. The summary and statutory prospectus contains this and other important information about the fund and may be obtained by calling 855-822-3863 or visiting www.ecofininvest.com. Read it carefully before investing.

Investing involves risks. Principal loss is possible. The fund is non-diversified, meaning it may concentrate its assets in fewer individual holdings than a diversified fund. Therefore, the fund is more exposed to individual stock volatility than a diversified fund. Investing in specific sectors such as energy infrastructure and renewable energy infrastructure may involve greater risk and volatility than less concentrated investments. If for any taxable year the Fund fails to qualify as a RIC, the Fund’s taxable income will be subject to federal income tax at regular corporate rates. The resulting increase to the Fund’s expenses will reduce its performance and its income available for distribution to shareholders. Investments in foreign companies involve risk not ordinarily associated with investments in securities and instruments of U.S. issuers, including risks related to political, social and economic developments abroad, differences between U.S. and foreign regulatory and accounting requirements, tax risk and market practices, as well as fluctuations in foreign currencies. These risks are greater for investments in emerging markets. The fund invests in small and mid-cap companies, which involve additional risks such as limited liquidity and greater volatility than larger companies. Investments in debt securities typically decrease in value when interest rates rise. This risk is usually greater for longer-term debt securities. The fund may also invest in derivatives including options, futures and swap agreements, which can be highly volatile, illiquid and difficult to value, and changes in the value of a derivative held by the fund may not correlate with the underlying instrument or the fund’s other investments and can include additional risks such as liquidity risk, leverage risk and counterparty risk that are possibly greater than risks associated with investing directly in the underlying investments.

Tortoise Capital Advisors, L.L.C. is the adviser to the Fund and Ecofin Advisors Limited is the sub-adviser. Primary responsibility for the day-to-day management of the Fund’s portfolio is the joint responsibility of Matthew Breidert and Michel Sznajer, both of the Sub-Adviser. Mr. Breidert is a Senior Portfolio Manager of the Sub- Adviser. Mr. Sznajer is a Portfolio Manager of the Sub-Adviser. Each portfolio manager has managed the Fund since its inception in July 2020. Mr. Breidert and Mr. Sznajer were portfolio managers of the Predecessor Fund since its inception in 2015 and since joining the firm in 2016, respectively.

The MSCI ESG rating represents the aggregate ranking of the Fund’s holdings as of 8/7/2020. Certain information ©2020 MSCI ESG Research LLC. Reproduced by permission; no further distribution.

MSCI ESG Research LLC’s (“MSCI ESG”) Fund Metrics and Ratings (the “Information”) provide environmental, social and governance data with respect to underlying securities within more than 31,000 multi-asset class Mutual Funds and ETFs globally. MSCI ESG is a Registered Investment Adviser under the Investment Advisers Act of 1940. MSCI ESG materials have not been submitted to, nor received approval from, the US SEC or any other regulatory body. None of the Information constitutes an offer to buy or sell, or a promotion or recommendation of, any security, financial instrument or product or trading strategy, nor should it be taken as an indication or guarantee of any future performance, analysis, forecast or prediction. None of the Information can be used to determine which securities to buy or sell or when to buy or sell them. The Information is provided “as is” and the user of the Information assumes the entire risk of any use it may make or permit to be made of the Information. The MSCI ESG Fund Ratings is designed to assess the resilience of a fund’s aggregate holdings to long term ESG risks. Highly rated funds consist of issuers with leading or improving management of key ESG risks.

  • AAA, AA: Leader- The companies that the fund invests in tend to show strong and/or improving management of financially relevant environmental, social and governance issues. These companies may be more resilient to disruptions arising from ESG events.
  • A, BB, BB: Average- The fund invests in companies that tend to show average management of ESG issues, or in a mix of companies with both above-average and below-average ESG risk management.
  • B, CCC: Laggard- The fund is exposed to companies that do not demonstrate adequate management of the ESG risks that they face or show worsening management of these issues. These companies may be more vulnerable to disruptions arising from ESG events.

The Fund ESG Rating is calculated as a direct mapping of “Fund ESG Quality Score” to letter rating categories.

  • 8.6- 10: AAA
  • 7.1- 8.6: AA
  • 5.7- 7.1: A
  • 4.3- 5.7: BBB
  • 2.9- 4.3: BB
  • 1.4- 2.9: B
  • 0.0- 1.4: CCC

The “Fund ESG Quality Score” assesses the resilience of a fund’s aggregate holdings to long term ESG risks. Highly rated funds consist of issuers with leading or improving management of key ESG risks, based on a granular breakdown of each issuer’s business: its core product or business segments, the locations of its assets or revenues, and other relevant measures such as outsourced production. The “Fund ESG Quality Score” is provided on a 0-10 score, with 0 and 10 being the respective lowest and highest possible fund scores.

The “Fund ESG Quality Score” is assessed using the underlying holding’s “Overall ESG Scores”, “Overall ESG Ratings”, and “Overall ESG Rating Trends”. It is calculated in a series of 3 steps.

Step 1: Calculate the “Fund Weighted Average ESG Score” of the underlying holding’s “Overall ESG Scores”. The Overall ESG Scores represent either the ESG Ratings Final Industry-Adjusted Score or Government Adjusted ESG Score of the issuer. Methodology for the issuer level scores are available in the MSCI ESG Ratings Methodology document.

Step 2: Calculate adjustment % based on fund exposure to “Fund ESG Laggards ()”, “Fund ESG Trend Negative ()”, and “Fund ESG Trend Positive (%)”.

Step 3: Multiply the “Fund Weighted Average ESG Score” by (1 + Adjustment %).

For more information please visit https://www.msci.com/esg-fund-ratings.

Quasar Distributors, LLC, distributor

Safe harbor statement

This press release shall not constitute an offer to sell or a solicitation to buy, nor shall there be any sale of these securities in any state or jurisdiction in which such offer or solicitation or sale would be unlawful prior to registration or qualification under the laws of such state or jurisdiction.

Cautionary Statement Regarding Forward-Looking Statements

This press release contains certain statements that may include “forward-looking statements” within the meaning of Section 27A of the Securities Act of 1933 and Section 21E of the Securities Exchange Act of 1934. All statements, other than statements of historical fact, included herein are "forward-looking statements." Although the fund and its adviser and sub-adviser believe that the expectations reflected in these forward-looking statements are reasonable, they do involve assumptions, risks and uncertainties, and these expectations may prove to be incorrect. Actual results could differ materially from those anticipated in these forward-looking statements as a result of a variety of factors, including those discussed in the fund’s reports that are filed with the Securities and Exchange Commission. You should not place undue reliance on these forward-looking statements, which speak only as of the date of this press release. Other than as required by law, the funds and is adviser and sub-adviser do not assume a duty to update this forward-looking statement.


Contacts

Maggie Zastrow
(913) 981-1020
This email address is being protected from spambots. You need JavaScript enabled to view it.

LONDON--(BUSINESS WIRE)--#AutomationSolutionsMarketintheOilandGasIndustry--Technavio has been monitoring the automation solutions market in the oil and gas industry and it is poised to grow by USD 1.49 billion during 2020-2024, progressing at a CAGR of over 3% during the forecast period. The report offers an up-to-date analysis regarding the current market scenario, latest trends and drivers, and the overall market environment.


Although the COVID-19 pandemic continues to transform the growth of various industries, the immediate impact of the outbreak is varied. While a few industries will register a drop in demand, numerous others will continue to remain unscathed and show promising growth opportunities. Technavio’s in-depth research has all your needs covered as our research reports include all foreseeable market scenarios, including pre- & post-COVID-19 analysis. Download a Free Sample Report on COVID-19 Impacts

Frequently Asked Questions-

  • Based on segmentation by product, which is the leading segment in the market?
  • The SCADA systems segment is expected to be the leading segment in the global market during the forecast period.
  • At what rate is the market projected to grow?
  • Growing at a CAGR of over 3%, the incremental growth of the market is anticipated to be USD 1.49 billion during the forecast period.
  • Who are the top players in the market?
  • ABB Ltd., Eaton Corp. Plc, Emerson Electric Co., Honeywell International Inc., Mitsubishi Electric Corp., OMRON Corp., Rockwell Automation Inc., Schneider Electric SE, Siemens AG, and Yokogawa Electric Corp. are some of the major market participants.
  • What is the key market driver?
  • Rise in the global demand for oil and gas is the major factor driving the market.

The market is fragmented, and the degree of fragmentation will accelerate during the forecast period. ABB Ltd., Eaton Corp. Plc, Emerson Electric Co., Honeywell International Inc., Mitsubishi Electric Corp., OMRON Corp., Rockwell Automation Inc., Schneider Electric SE, Siemens AG, and Yokogawa Electric Corp. are some of the major market participants. The rise in the global demand for oil and gas will offer immense growth opportunities. To make most of the opportunities, market vendors should focus more on the growth prospects in the fast-growing segments, while maintaining their positions in the slow-growing segments.

Buy 1 Technavio report and get the second for 50% off. Buy 2 Technavio reports and get the third for free.

View market snapshot before purchasing

Technavio's custom research reports offer detailed insights on the impact of COVID-19 at an industry level, a regional level, and subsequent supply chain operations. This customized report will also help clients keep up with new product launches in direct & indirect COVID-19 related markets, upcoming vaccines and pipeline analysis, and significant developments in vendor operations and government regulations.

Automation Solutions Market in the Oil and Gas Industry 2020-2024: Segmentation

Automation Solutions Market in the Oil and Gas Industry is segmented as below:

  • Product
    • SCADA
    • DCS
    • PLC
    • MES
  • Geography
    • North America
    • APAC
    • Europe
    • MEA
    • South America

To learn more about the global trends impacting the future of market research, download a free sample: https://www.technavio.com/talk-to-us?report=IRTNTR40070

Automation Solutions Market in the Oil and Gas Industry 2020-2024: Scope

Technavio presents a detailed picture of the market by the way of study, synthesis, and summation of data from multiple sources. The automation solutions market in the oil and gas industry report covers the following areas:

  • Automation Solutions Market in the Oil and Gas Industry Size
  • Automation Solutions Market in the Oil and Gas Industry Trends
  • Automation Solutions Market in the Oil and Gas Industry Analysis

This study identifies the growing importance of big data analytics and IoT as one of the prime reasons driving the automation solutions market growth in the oil and gas industry during the next few years.

Technavio suggests three forecast scenarios (optimistic, probable, and pessimistic) considering the impact of COVID-19. Technavio’s in-depth research has direct and indirect COVID-19 impacted market research reports.

Register for a free trial today and gain instant access to 17,000+ market research reports. Technavio's SUBSCRIPTION platform

Automation Solutions Market in the Oil and Gas Industry 2020-2024: Key Highlights

  • CAGR of the market during the forecast period 2020-2024
  • Detailed information on factors that will assist automation solutions market growth in the oil and gas industry during the next five years
  • Estimation of the automation solutions market size in the oil and gas industry and its contribution to the parent market
  • Predictions on upcoming trends and changes in consumer behavior
  • The growth of the automation solutions market in the oil and gas industry
  • Analysis of the market’s competitive landscape and detailed information on vendors
  • Comprehensive details of factors that will challenge the growth of automation solutions market vendors in the oil and gas industry

Table of Contents:

PART 01: EXECUTIVE SUMMARY

PART 02: SCOPE OF THE REPORT

  • 2.1 Preface
  • 2.2 Preface
  • 2.3 Currency conversion rates for US$

PART 03: MARKET LANDSCAPE

  • Market ecosystem
  • Value chain analysis
  • Market characteristics
  • Market segmentation analysis

PART 04: MARKET SIZING

  • Market definition
  • Market sizing 2019
  • Market size and forecast 2019-2024

PART 05: FIVE FORCES ANALYSIS

  • Bargaining power of buyers
  • Bargaining power of suppliers
  • Threat of new entrants
  • Threat of substitutes
  • Threat of rivalry
  • Market condition

PART 06: MARKET SEGMENTATION BY PRODUCT

  • Market segmentation by product
  • Comparison by product
  • SCADA - Market size and forecast 2019-2024
  • DCS - Market size and forecast 2019-2024
  • PLC - Market size and forecast 2019-2024
  • MES - Market size and forecast 2019-2024
  • Market opportunity by product

PART 07: CUSTOMER LANDSCAPE

PART 08: GEOGRAPHIC LANDSCAPE

  • Geographic segmentation
  • Geographic comparison
  • North America - Market size and forecast 2019-2024
  • APAC - Market size and forecast 2019-2024
  • Europe - Market size and forecast 2019-2024
  • MEA - Market size and forecast 2019-2024
  • South America - Market size and forecast 2019-2024
  • Key leading countries
  • Market opportunity

PART 09: DECISION FRAMEWORK

PART 10: DRIVERS AND CHALLENGES

  • Market drivers
  • Market challenges

PART 11: MARKET TRENDS

  • Growing importance of big data analytics and IoT
  • Value chain integration
  • Shift from on-premise to cloud-based systems

PART 12: VENDOR LANDSCAPE

  • Overview
  • Landscape disruption
  • Competitive scenario

PART 13: VENDOR ANALYSIS

  • Vendors covered
  • Vendor classification
  • Market positioning of vendors
  • ABB Ltd.
  • Eaton Corp. Plc
  • Emerson Electric Co.
  • Honeywell International Inc.
  • Mitsubishi Electric Corp.
  • OMRON Corp.
  • Rockwell Automation Inc.
  • Schneider Electric SE
  • Siemens AG
  • Yokogawa Electric Corp.

PART 14: APPENDIX

  • Research methodology
  • List of abbreviations
  • Definition of market positioning of vendors

PART 15: EXPLORE TECHNAVIO

About Us

Technavio is a leading global technology research and advisory company. Their research and analysis focuses on emerging market trends and provides actionable insights to help businesses identify market opportunities and develop effective strategies to optimize their market positions. With over 500 specialized analysts, Technavio’s report library consists of more than 17,000 reports and counting, covering 800 technologies, spanning across 50 countries. Their client base consists of enterprises of all sizes, including more than 100 Fortune 500 companies. This growing client base relies on Technavio’s comprehensive coverage, extensive research, and actionable market insights to identify opportunities in existing and potential markets and assess their competitive positions within changing market scenarios.


Contacts

Technavio Research
Jesse Maida
Media & Marketing Executive
US: +1 844 364 1100
UK: +44 203 893 3200
Email: This email address is being protected from spambots. You need JavaScript enabled to view it.
Website: www.technavio.com/

At-market, all-stock, in-basin acquisition delivers step change in free cash flow, captures synergies and is accretive to all key financial metrics

SPRING, Texas--(BUSINESS WIRE)--Southwestern Energy Company (NYSE: SWN) and Montage Resources Corporation (NYSE: MR) today announced that they have entered into a definitive merger agreement under which Southwestern Energy will acquire Montage Resources in an all-stock transaction. Based on the 3-day average closing share prices of the companies as of August 11, 2020 and under the terms of the agreement, Montage Resources shareholders will receive 1.8656 shares of Southwestern for each Montage Resources share. The transaction is expected to close in the fourth quarter of 2020, subject to customary closing conditions, including the approval of the Montage Resources shareholders.


Highlights include:

  • Represents a step change in free cash flow; approximately $100 million annual free cash flow beginning in 2021 based on current strip pricing;
  • Accretive to per share financial metrics as well as leverage, margin and returns;
  • Anticipated synergies of approximately $30 million in annual G&A savings captured following the transaction close, in addition to operational efficiencies;
  • Maintains peer leading maturity runway and strong balance sheet;
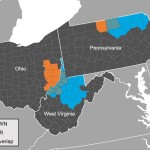
  • Combined company will be the third largest producer in Appalachia, expected total equivalent production of approximately 3 Bcfe per day; and
  • Enhances economic inventory, with investment opportunities in proven, high-return Marcellus super rich and core Utica dry gas windows.

“This is an exciting step for Southwestern as we expand our Appalachia footprint with the high-quality assets of Montage. As we have consistently stated, we are firm believers in the benefits of value-creating consolidation. This transaction further solidifies the Company’s position as a premier Appalachia operator and provides additional scale and synergies strengthened by our leading operational execution. Consistent with our strategy, this transaction is expected to deliver increased free cash flow, improved returns and long-term value to shareholders,” said Bill Way, Southwestern Energy President and Chief Executive Officer.

Way continued, “This acquisition is expected to deliver on all criteria of an accretive, value-adding transaction for the shareholders of both Southwestern Energy and Montage Resources. Southwestern Energy has consistently and methodically taken steps to enhance its resilience over the last few years, and this transaction solidifies that path and delivers on the commitment to responsibly manage the balance sheet and return to free cash flow.”

John Reinhart, President and CEO of Montage Resources, commented, “This transaction creates a compelling opportunity for both Southwestern Energy and Montage Resources shareholders to benefit from the strength of the consolidated company. The combination creates a Company of substantial scale with capabilities to enhance cash flow generation and a strong balance sheet that provides opportunities for enhanced shareholder value creation. We appreciate all of the great work by Montage employees in forming a very attractive business that will continue to build upon the success of Southwestern Energy.”

Concurrently, Southwestern also commenced a registered underwritten public offering of 55,000,000 shares of its common stock, with the proceeds expected to be used to retire a portion of Montage Resources’ 8.875% Senior Notes due 2023. The remaining portion of the Montage notes outstanding have the potential to be refinanced opportunistically.

This transaction delivers on the key strategic objectives that Southwestern Energy has been targeting:

  • No premium transaction
  • Enhances free cash flow
  • Improves leverage ratio
  • Capture of tangible synergies
  • In-basin assets where technical and operating expertise can be leveraged
  • High-quality inventory included in go forward development plans
  • Retains peer leading maturity runway

Certain key metrics of the new combined enterprise are shown below.


SWN


MR


SWN + MR

Production (for the quarter ended June 30, 2020)


Natural Gas (Bcf)


158


42


200

Oil/Condensate (MBbls)


1,083


440


1,523

NGLs (MBbls)


6,111


974


7,085

Total Production (Bcfe)


201


50


251


Net Acres(1)


Northeast Appalachia


173,994


34,900


208,894

Southwest Appalachia


287,693


289,600


577,293

Total Net Acres


461,687


324,500


786,187


Proved Reserves (as of December 31, 2019)


Natural Gas (Bcf)


8,630


2,138


10,768

Oil/Condensate (MMBbls)


72.9


30.3


103.2

NGLs (MMBbls)


608.8


68.4


677.2

Total Proved Reserves (Bcfe)


12,721


2,730


15,451


Net Debt / Adjusted EBITDA (as of June 30, 2020)(2)


Total Debt ($MM)


$2,457


$670


$3,127

Less: Cash ($MM)


(10)


(9)


(19)

Net Debt ($MM) (non-GAAP)


$2,447


$661


$3,108

Adjusted EBITDA ($MM)(3) (non-GAAP)


780


271


1,051

Net Debt / Adjusted EBITDA (non-GAAP)


3.1x


2.4x


3.0x

(1)


Net acres for Southwestern Energy and Montage Resources as of December 31, 2019 and June 30, 2020, respectively.

(2)


The balances of the combined companies are based solely on historical information, and may not be indicative of the pro forma financial information relating to the combined company once available.

(3)


For the twelve months ended June 30, 2020. Montage’s comparative financial non-GAAP metric as defined in its public filings is EBITDAX

Advisors

Citi and Goldman Sachs & Co. LLC are acting as financial advisors and Skadden, Arps, Slate, Meagher & Flom LLP is acting as legal advisor to Southwestern. Barclays is acting as financial advisor and Norton Rose Fulbright LLP is acting as legal advisor to Montage Resources. Vinson & Elkins LLP is acting as legal advisor to EnCap Investments, L.P.

Conference Call

Southwestern Energy will host a conference call today at 10:00 a.m. Central to discuss this transaction. To participate, dial US toll-free 877-879-1183, or international 412-902-6703 and enter access code 1383175. A live webcast will also be available at ir.swn.com.

About Southwestern Energy

Southwestern Energy Company is an independent energy company engaged in natural gas, natural gas liquids and oil exploration, development, production and marketing.

About Montage Resources

Montage Resources is an exploration and production company with approximately 195,000 net effective core undeveloped acres currently focused on the Utica and Marcellus Shales of Southeast Ohio, West Virginia and North Central Pennsylvania.

Forward Looking Statement

Certain statements and information in this news release may constitute “forward-looking statements” within the meaning of the Private Securities Litigation Reform Act of 1995. The words “believe,” “expect,” “anticipate,” “plan,” “intend,” “foresee,” “should,” “would,” “could,” “attempt,” “appears,” “forecast,” “outlook,” “estimate,” “project,” “potential,” “may,” “will,” “are likely” and other similar expressions are intended to identify forward-looking statements, which are generally not historical in nature. Examples of forward-looking statements in this release include, but are not limited to, statements regarding expected generation of free cash flow, benefits to the combined company’s financial metrics, anticipated synergies, expected production, the expected closing of the merger and the proposed retirement of Montage’s senior notes with proceeds from the announced equity offering. These forward-looking statements are based on our current expectations and beliefs concerning future developments and their potential effect on us. The forward-looking statements contained in this document are largely based on our expectations for the future, which reflect certain estimates and assumptions made by our management. These estimates and assumptions reflect our best judgment based on currently known market conditions, operating trends, and other factors. Although we believe such estimates and assumptions to be reasonable, they are inherently uncertain and involve a number of risks and uncertainties that are beyond our control. As such, management’s assumptions about future events may prove to be inaccurate. For a more detailed description of the risks and uncertainties involved, see “Risk Factors” in our most recently filed Annual Report on Form 10-K, subsequent Quarterly Reports on Form 10-Q, Current Reports on Form 8-K, and other SEC filings. We do not intend to publicly update or revise any forward-looking statements as a result of new information, future events, changes in circumstances, or otherwise. These cautionary statements qualify all forward-looking statements attributable to us, or persons acting on our behalf. Management cautions you that the forward-looking statements contained in this presentation are not guarantees of future performance, and we cannot assure you that such statements will be realized or that the events and circumstances they describe will occur. Factors that could cause actual results to differ materially from those anticipated or implied in the forward-looking statements herein include, but are not limited to: the timing and extent of changes in market conditions and prices for natural gas, oil and natural gas liquids (“NGLs”), including regional basis differentials and the impact of reduced demand for our production and products in which our production is a component due to governmental and societal actions taken in response to the COVID-19 pandemic; our ability to fund our planned capital investments; a change in our credit rating, an increase in interest rates and any adverse impacts from the discontinuation of the London Interbank Offered Rate; the extent to which lower commodity prices impact our ability to service or refinance our existing debt; the impact of volatility in the financial markets or other global economic factors, including the impact of COVID-19; difficulties in appropriately allocating capital and resources among our strategic opportunities; the timing and extent of our success in discovering, developing, producing and estimating reserves; our ability to maintain leases that may expire if production is not established or profitably maintained; our ability to realize the expected benefits from recent acquisitions and the Proposed Transaction (defined below) between the Company and Montage Resources Corporation ("Montage"); our ability to enter into an amendment to our credit agreement to permit the assumption of the senior notes of Montage in the merger; the consummation of or failure to consummate the Proposed Transaction and the timing thereof; costs in connection with the Proposed Transaction; integration of operations and results subsequent to the Proposed Transaction; our ability to transport our production to the most favorable markets or at all; the impact of government regulation, including changes in law, the ability to obtain and maintain permits, any increase in severance or similar taxes, and legislation or regulation relating to hydraulic fracturing, climate and over-the-counter derivatives; the impact of the adverse outcome of any material litigation against us or judicial decisions that affect us or our industry generally; the effects of weather; increased competition; the financial impact of accounting regulations and critical accounting policies; the comparative cost of alternative fuels; credit risk relating to the risk of loss as a result of non-performance by our counterparties; and any other factors listed in the reports we have filed and may file with the SEC that are incorporated by reference herein. All written and oral forward-looking statements attributable to us are expressly qualified in their entirety by this cautionary statement.

Use of Non-GAAP Information

This news release contains non-GAAP financial measures, such as net cash flow, free cash flow, net debt and adjusted EBITDA, including certain key statistics and estimates. We report our financial results in accordance with accounting principles generally accepted in the United States of America (“GAAP”). However, management believes certain non-GAAP performance measures may provide users of this financial information additional meaningful comparisons between current results and the results of our peers and of prior periods. Please see the Appendix for definitions of the non-GAAP financial measures that are based on reconcilable historical information.

Additional Information and Where To Find It

In connection with the proposed acquisition by the Company of Montage (the “Proposed Transaction”), the Company will file with the SEC a registration statement on Form S-4 to register the shares of the Company’s common stock to be issued in connection with the Proposed Transaction. The registration statement will include a document that serves as a prospectus of the Company and a proxy statement of Montage (the “proxy statement/prospectus”), and each party will file other documents regarding the Proposed Transaction with the SEC. INVESTORS AND SECURITY HOLDERS OF THE COMPANY AND MONTAGE ARE URGED TO READ THE REGISTRATION STATEMENT, THE PROXY STATEMENT/PROSPECTUS, INCLUDING ANY AMENDMENTS OR SUPPLEMENTS TO THOSE DOCUMENTS, AND ANY OTHER RELEVANT DOCUMENTS THAT WILL BE FILED WITH THE SEC CAREFULLY AND IN THEIR ENTIRETY WHEN THEY BECOME AVAILABLE BECAUSE THEY WILL CONTAIN IMPORTANT INFORMATION ABOUT THE COMPANY, MONTAGE, THE PROPOSED TRANSACTION AND RELATED MATTERS. A definitive proxy statement/prospectus will be sent to Montage’s stockholders when it becomes available. Investors and security holders will be able to obtain copies of the registration statement and the proxy statement/prospectus and other documents containing important information about the Company and Montage free of charge from the SEC’s website or from the Company or Montage when it becomes available. The documents filed by the Company with the SEC may be obtained free of charge at the Company’s website at www.swn.com or at the SEC’s website at www.sec.gov. These documents may also be obtained free of charge from the Company by requesting them by mail at Investor Relations, 10000 Energy Drive, Spring, Texas 77389, or by telephone at (832) 796-4068. The documents filed by Montage with the SEC may be obtained free of charge at Montage’s website at www.montageresources.com or at the SEC’s website at www.sec.gov. These documents may also be obtained free of charge from Montage by requesting them by mail at Investor Relations, 122 W. John Carpenter Fwy, Suite 300, Irving, TX 75039, or by telephone at (469) 444-1736.

Participants in the Solicitation

The Company, Montage and certain of their respective directors, executive officers and other members of management and employees may be deemed to be participants in the solicitation of proxies from Montage’s stockholders with respect to the Proposed Transaction. Information about the Company’s directors and executive officers is available in the Company’s Annual Report on Form 10-K for the fiscal year ended 2019 filed with the SEC on February 27, 2020 and its definitive proxy statement for the 2020 annual meeting of shareholders filed with the SEC on April 9, 2020. Information concerning the ownership of Montage’s securities by Montage’s directors and executive officers is included in their SEC filings on Forms 3, 4 and 5, and additional information regarding the names, affiliations and interests of such individuals is available in Montage’s Annual Report on Form 10-K for the fiscal year ended 2019 filed with the SEC on March 10, 2020 and its definitive proxy statement for the 2020 annual meeting of shareholders filed with the SEC on April 28, 2020. Other information regarding the participants in the proxy solicitation and a description of their direct and indirect interests, by security holdings or otherwise, will be contained in the registration statement, the proxy statement/prospectus and other relevant materials to be filed with the SEC regarding the Proposed Transaction when they become available. Stockholders, potential investors and other readers should read the proxy statement/prospectus carefully when it becomes available before making any voting or investment decisions.

Registration Statement

The Company has filed a registration statement (including a prospectus and the related Preliminary Prospectus Supplement) with the SEC for the offering of common stock to which this communication relates. Before you invest, you should read the prospectus in that registration statement, the Preliminary Prospectus Supplement and any other documents the Company has filed with the SEC for more complete information about the Company and the offering. You may get these documents for free by visiting EDGAR on the SEC Web site at www.sec.gov. Alternatively, the Company, any underwriter or any dealer participating in the offering will arrange to send you the prospectus if you request it by contacting Citigroup Global Markets Inc., c/o Broadridge Financial Solutions 1155 Long Island Avenue, Edgewood, NY 11717, or via telephone: 1-800-831-9146.

Explanation of Non-GAAP Financial Measures

The Company reports its financial results in accordance with accounting principles generally accepted in the United States of America (“GAAP”). However, management believes certain non-GAAP performance measures may provide financial statement users with additional meaningful comparisons between current results, the results of its peers and of prior periods.

Non-GAAP financial measures the Company may present from time to time are net debt, net cash flow, free cash flow and adjusted EBITDA, which excludes certain charges or amounts. Net debt is defined as short-term debt plus long-term debt less cash and cash equivalents. Adjusted EBITDA is defined as net income (loss) plus interest, income tax expense (benefit), depreciation, depletion and amortization, expenses associated with the restructuring charges, impairments, legal settlements and gains (losses) on unsettled derivatives less gains (losses) on sale of assets and gains on early extinguishment of debt over the prior 12 month period. Net cash flow is defined as cash flow from operating activities before changes in operating assets and liabilities. Free cash flow is defined as net cash flow less accrual based capital expenditures, and estimated free cash flow for future periods is based on strip pricing as of July 30, 2020. The Company has included information concerning Net debt / Adjusted EBITDA because it is used by certain investors as a measure of the ability of a company to service or incur indebtedness and because it is a financial measure commonly used in the energy industry. Net debt / Adjusted EBITDA should not be considered in isolation or as a substitute for net income, net cash provided by operating activities or other income or cash flow data prepared in accordance with generally accepted accounting principles or as a measure of the Company’s profitability or liquidity. Net debt / Adjusted EBITDA, as defined above, may not be comparable to similarly titled measures of other companies. Management presents these measures because (i) they are consistent with the manner in which the Company’s position and performance are measured relative to the position and performance of its peers, (ii) these measures are more comparable to earnings estimates provided by securities analysts, and (iii) charges or amounts excluded cannot be reasonably estimated and guidance provided by the Company excludes information regarding these types of items. These adjusted amounts are not a measure of financial performance under GAAP.

The Company does not provide a reconciliation to estimated free cash flow because the Company does not provide the GAAP financial measures of net income or loss or net cash provided by operating activities on a forward-looking basis because it is unable to predict, without unreasonable effort, certain components thereof including, but not limited to capital expenditures, production and realized prices for production. These items are inherently uncertain and depend on various factors, many of which are beyond its control. As such, any associated estimate and its impact on GAAP performance and cash flow measures could vary materially based on a variety of acceptable management assumptions.


Contacts

Investor Contacts
Brittany Raiford
Director, Investor Relations
(832) 796-7906
This email address is being protected from spambots. You need JavaScript enabled to view it.

Bernadette Butler
Investor Relations Advisor
(832) 796-6079
This email address is being protected from spambots. You need JavaScript enabled to view it.

Ready Access to AI-Driven Capabilities Can Help Insurers, TPAs and Self-Insured Organizations Drive Growth, Profitability, Efficiencies in Underwriting and Claims Operations

CHICAGO & BOSTON--(BUSINESS WIRE)--#AI--Origami Risk LLC and Gradient AI today announced they have formed a strategic partnership to make Gradient’s claims and policy modeling capabilities and predictive analytics resources available on Origami’s industry-leading digital platform.


Gradient’s AI-driven tools and resources help drive efficiencies in policy underwriting and claims adjusting processes, such as enabling claim teams to focus greater attention on claims with a high probability of becoming significant cost-drivers. Gradient’s predictions, as well as associated contributing factors, are fully integrated with the Origami platform's robust workflow, reporting and digital engagement tools.

Insurers, TPAs, risk pools, and self-insured organizations can leverage Origami's automation capabilities along with Gradient’s vast proprietary data sets of millions of claims and policies to expand new business, streamline underwriting, speed delivery of quotes and enhance overall performance and profitability.

“As insurers strive to operate more profitably while maintaining market share and achieving targeted growth, new AI-driven solutions are increasingly helping them achieve their goals,” said Robert Petrie, CEO, Origami Risk. “Our collaboration with Gradient AI offers insurers, risk pools and large self-administered plans using our platform ready access to robust tools that can have measurable impacts on their performance and growth.”

“There’s no question that speed and accuracy in both claims management and underwriting have become paramount for insurers,” Stan Smith, CEO, Gradient AI said. “The seamless integration of our tools with Origami’s capabilities will facilitate improved decision-making, faster responses and measurable improvements in claims experience and underwriting results.”

Additional information on Gradient’s tools now available on Origami’s digital platform is available by visiting: https://bit.ly/3fNCP70.

About Gradient AI

Gradient AI was founded in order to address the need for state-of-the-art Artificial Intelligence (AI) solutions designed specifically for the trillion-dollar insurance industry. AI has emerged as a disruptive force revolutionizing the way insurance professionals achieve their objectives, and Gradient is leading that charge. Our solutions include software and models utilized by many of the world’s most recognized insurance carriers, MGAs, TPAs, pools, PEOs and more. Gradient’s stellar client base continues to grow rapidly. Gradient’s team of expert data scientists and insurance technology experts have an exceptional history of building wildly successful insurance technology companies, with the most satisfied customers in the industry. At Gradient, we focus exclusively on delivering measurable results in your underwriting and claims operations. To learn more about Gradient AI, please visit www.gradientai.com.

About Origami Risk

Origami Risk is a leading provider of integrated SaaS solutions for the risk, safety, and insurance industry — from insured corporate and public entities to brokers and risk consultants, insurers, third party claims administrators (TPAs), and risk pools. Highly configurable and completely scalable, Origami Risk delivers a full suite of risk management tools and insurance core system solutions from a secure, cloud-based platform accessible via web browser and mobile app. Visit origamirisk.com or contact Origami at This email address is being protected from spambots. You need JavaScript enabled to view it..


Contacts

Al Modugno, 917-414-4569
This email address is being protected from spambots. You need JavaScript enabled to view it.

SPRING, Texas--(BUSINESS WIRE)--Southwestern Energy Company (“Southwestern Energy”) (NYSE: SWN) today announced the commencement of an underwritten public offering of 55,000,000 shares of its common stock (the “offering”), subject to market and other conditions. Southwestern Energy intends to grant the respective underwriters a 30-day option to purchase up to 8,250,000 additional shares of its common stock. Southwestern Energy intends to use the net proceeds from the offering to partially redeem Montage Resource Corporation’s (“Montage”) issued and outstanding senior notes that it will assume upon the closing of its recently announced merger with Montage (the “Merger”). If the Merger is not consummated, Southwestern Energy intends to use the net proceeds from the offering for general corporate purposes, including the repayment of debt. Until Southwestern Energy applies the net proceeds from this offering for the purposes described above, it may invest such proceeds in short-term, liquid investments or to reduce the balance under its credit agreement. The net proceeds from any exercise by the underwriters of their option to purchase additional shares of common stock from us will be used to redeem additional Montage notes after the consummation of the Merger or for general corporate purposes, including the repayment of debt.


Citigroup, Goldman Sachs & Co. LLC and J.P. Morgan are acting as representatives of the underwriters and joint book-running managers for the offering.

The offering is being made under an effective automatic shelf registration statement on Form S-3 (Registration No. 333-238633) filed by Southwestern Energy with the Securities and Exchange Commission (“SEC”) and only by means of a prospectus supplement and accompanying prospectus. A preliminary prospectus supplement has been filed with the SEC to which this communication relates. Prospective investors should read the preliminary prospectus supplement and the accompanying prospectus included in the registration statement and other documents Southwestern Energy has filed with the SEC for more complete information about Southwestern Energy and the offering. These documents are available at no charge by visiting EDGAR on the SEC website at http://www.sec.gov.

Alternatively, a copy of the base prospectus and the preliminary prospectus supplement may be obtained, when available, from:

Citigroup
c/o Broadridge Financial Solutions
1155 Long Island Avenue
Edgewood, NY 11717
Telephone: 800-831-9146

Goldman Sachs & Co. LLC
Attention: Prospectus Department
200 West Street
New York, NY 10282
Telephone: 866-471-2526
Facsimile: 212-902-9316
Email: This email address is being protected from spambots. You need JavaScript enabled to view it.

J.P. Morgan Securities LLC
c/o Broadridge
Financial Solutions
Attention: Prospectus Department
1155 Long Island Avenue
Edgewood, NY 11717
Telephone: 866-803-9204

This news release shall not constitute an offer to sell or the solicitation of an offer to buy these securities, nor shall there be any sale of these securities, in any state or jurisdiction in which such offer, solicitation or sale of these securities would be unlawful prior to registration or qualification under the securities laws of any such state or jurisdiction.

About Southwestern Energy

Southwestern Energy Company is an independent energy company engaged in natural gas, natural gas liquids and oil exploration, development, production and marketing.

Forward Looking Statement

This news release contains forward-looking statements. Forward-looking statements relate to future events, including, but not limited to, anticipated results of operations, business strategies, other aspects of Southwestern Energy’s operations or operating results, the proposed offering, the use of proceeds of the offering and the consummation of the Merger. In many cases you can identify forward-looking statements by terminology such words “believe,” “expect,” “anticipate,” “plan,” “intend,” “foresee,” “predict,” “budget,” “should,” “would,” “could,” “attempt,” “appears,” “forecast,” “outlook,” “estimate,” “continue,” “project,” “projection,” “goal,” “model,” “target,” “potential,” “may,” “will,” “objective,” “guidance,” “outlook,” “effort,” “are likely” and other similar expressions. Where, in any forward-looking statement, the company expresses an expectation or belief as to future results, such expectation or belief is expressed in good faith and believed to have a reasonable basis. However, there can be no assurance that such expectation or belief will result or be achieved. The actual results of operations can and will be affected by a variety of risks and other matters including, but not limited to, changes in commodity prices; changes in expected levels of natural gas and oil reserves or production; operating hazards, drilling risks, unsuccessful exploratory activities; limited access to capital or significantly higher cost of capital related to illiquidity or uncertainty in the domestic or international financial markets; international monetary conditions; unexpected cost increases; potential liability for remedial actions under existing or future environmental regulations; potential liability resulting from pending or future litigation; and general domestic and international economic and political conditions; as well as changes in tax, environmental and other laws applicable to the company’s business. Other factors that could cause actual results to differ materially from those described in the forward-looking statements include other economic, business, competitive and/or regulatory factors affecting the company’s business generally as set forth in the company’s filings with the SEC. Unless legally required, Southwestern Energy Company undertakes no obligation to update publicly any forward-looking statements, whether as a result of new information, future events or otherwise.


Contacts

Brittany Raiford
Director, Investor Relations
(832) 796-7906
This email address is being protected from spambots. You need JavaScript enabled to view it.

Bernadette Butler
Investor Relations Advisor
(832) 796-6079
This email address is being protected from spambots. You need JavaScript enabled to view it.

LONDON--(BUSINESS WIRE)--#GlobalMaritimeInformationMarket--Technavio has been monitoring the maritime information market and it is poised to grow by $ 736.98 million during 2020-2024, progressing at a CAGR of over 9% during the forecast period. The report offers an up-to-date analysis regarding the current market scenario, latest trends and drivers, and the overall market environment.


Technavio suggests three forecast scenarios (optimistic, probable, and pessimistic) considering the impact of COVID-19. Please Request Latest Free Sample Report on COVID-19 Impact

The market is fragmented, and the degree of fragmentation will accelerate during the forecast period. FLIR Systems Inc., Garmin Ltd., Inmarsat Group Ltd., Kongsberg Gruppen ASA, L3Harris Technologies Inc., Maxar Technologies Inc., ORBCOMM Inc., Raytheon Co., Saab AB, and Thales Group are some of the major market participants. To make the most of the opportunities, market vendors should focus more on the growth prospects in the fast-growing segments, while maintaining their positions in the slow-growing segments.

The need to comply with strict regulations has been instrumental in driving the growth of the market.

Maritime Information Market 2020-2024 : Segmentation

Maritime Information Market is segmented as below:

  • End-user
    • Commercial
    • Government
  • Application
    • MIA
    • MIP
    • VT
    • AIS
  • Geography
    • Europe
    • North America
    • APAC
    • MEA
    • South America

To learn more about the global trends impacting the future of market research, download a free sample: https://www.technavio.com/talk-to-us?report=IRTNTR40416

Maritime Information Market 2020-2024 : Scope

Technavio presents a detailed picture of the market by the way of study, synthesis, and summation of data from multiple sources. Our maritime information market report covers the following areas:

  • Maritime Information Market size
  • Maritime Information Market trends
  • Maritime Information Market industry analysis

This study identifies an increase in seaborne trade as one of the prime reasons driving the maritime information market growth during the next few years.

Maritime Information Market 2020-2024 : Vendor Analysis

We provide a detailed analysis of around 25 vendors operating in the maritime information market, including some of the vendors such as FLIR Systems Inc., Garmin Ltd., Inmarsat Group Ltd., Kongsberg Gruppen ASA, L3Harris Technologies Inc., Maxar Technologies Inc., ORBCOMM Inc., Raytheon Co., Saab AB, and Thales Group. Backed with competitive intelligence and benchmarking, our research reports on the maritime information market are designed to provide entry support, customer profile and M&As as well as go-to-market strategy support.

Register for a free trial today and gain instant access to 17,000+ market research reports.

Technavio's SUBSCRIPTION platform

Maritime Information Market 2020-2024 : Key Highlights

  • CAGR of the market during the forecast period 2020-2024
  • Detailed information on factors that will assist maritime information market growth during the next five years
  • Estimation of the maritime information market size and its contribution to the parent market
  • Predictions on upcoming trends and changes in consumer behavior
  • The growth of the maritime information market
  • Analysis of the market’s competitive landscape and detailed information on vendors
  • Comprehensive details of factors that will challenge the growth of maritime information market vendors

Table Of Contents :

Executive Summary

Market Landscape

  • Market ecosystem
  • Value chain analysis

Market Sizing

  • Market definition
  • Market segment analysis
  • Market size 2019
  • Market outlook: Forecast for 2019 - 2024

Five Forces Analysis

  • Five force summary
  • Bargaining power of buyers
  • Bargaining power of suppliers
  • Threat of new entrants
  • Threat of substitutes
  • Threat of rivalry
  • Market condition

Market Segmentation by Application

  • Market segments
  • Comparison by Application
  • MIA - Market size and forecast 2019-2024
  • MIP - Market size and forecast 2019-2024
  • VT - Market size and forecast 2019-2024
  • AIS - Market size and forecast 2019-2024
  • Market opportunity by Application

Market Segmentation by End-user

  • Market segments
  • Comparison by End-user
  • Commercial - Market size and forecast 2019-2024
  • Government - Market size and forecast 2019-2024
  • Market opportunity by End-user

Customer Landscape

Geographic Landscape

  • Geographic segmentation
  • Geographic comparison
  • Europe - Market size and forecast 2019-2024
  • North America - Market size and forecast 2019-2024
  • APAC - Market size and forecast 2019-2024
  • MEA - Market size and forecast 2019-2024
  • South America - Market size and forecast 2019-2024
  • Key leading countries
  • Market opportunity by geography

Market Drivers

Market Challenges

Market Trends

Vendor Landscape

  • Vendor landscape
  • Landscape disruption

Vendor Analysis

  • Vendors covered
  • Market positioning of vendors
  • FLIR Systems Inc.
  • Garmin Ltd.
  • Inmarsat Group Ltd.
  • Kongsberg Gruppen ASA
  • L3Harris Technologies Inc.
  • Maxar Technologies Inc.
  • ORBCOMM Inc.
  • Raytheon Co.
  • Saab AB
  • Thales Group

Appendix

  • Scope of the report
  • Currency conversion rates for US$
  • Research methodology
  • List of abbreviations

About Us

Technavio is a leading global technology research and advisory company. Their research and analysis focuses on emerging market trends and provides actionable insights to help businesses identify market opportunities and develop effective strategies to optimize their market positions. With over 500 specialized analysts, Technavio’s report library consists of more than 17,000 reports and counting, covering 800 technologies, spanning across 50 countries. Their client base consists of enterprises of all sizes, including more than 100 Fortune 500 companies. This growing client base relies on Technavio’s comprehensive coverage, extensive research, and actionable market insights to identify opportunities in existing and potential markets and assess their competitive positions within changing market scenarios.


Contacts

Technavio Research
Jesse Maida
Media & Marketing Executive
US: +1 844 364 1100
UK: +44 203 893 3200
Email: This email address is being protected from spambots. You need JavaScript enabled to view it.
Website: www.technavio.com/


LIVONIA, Mich.--(BUSINESS WIRE)--An increase in customer satisfaction and loyalty metrics of Texas retail electric providers (REPs) comes at an opportune time as one in four Texans is now actively shopping for a new electric provider. The average Texas REP Net Promoter Score (NPS) has improved significantly to 15.1 in Q2 2020 from 14.0 the previous quarter. Before Q2 2020, REP NPS (a measure of customer satisfaction) had been rapidly declining. These and other findings are from the 2020 Cogent Syndicated Texas REP Trusted Brand study from Escalent, a top human behavior and analytics firm.

Texas REP Net Promoter Score Trending

Q2 2020


15.1


Q1 2020


14.0


Q4 2019


14.8


Q3 2019


14.8


Q2 2019


15.8


Q1 2019


17.5


Q4 2018


17.6


Q3 2018


19.0


Source: Escalent. Cogent Syndicated. Texas REP Trusted Brand. August 2020.

“It’s clear from our research that many Texas REPs are being challenged with customer loyalty right now,” said Chris Oberle, senior vice president at Escalent. “Our analysis built a model that identifies critical brand qualities and market trends required for REPs to attract new customers and increase NPS. The good news is we found that REP responsiveness to customer needs during the COVID-19 pandemic has helped many REPs turn around a negative slide in loyalty.”

The study monitors and benchmarks NPS among all Texas REPs on a quarterly basis. Some of the findings regarding NPS performance are:

  • Over half of customers are Passives or Detractors, meaning they are unlikely to recommend their REP to anyone.
  • Only four REPs post a negative NPS in Q2 2020.
  • Over one in four customers would prefer to purchase power from their local transmission and distribution utility (TDSP) rather than a REP.
  • Gen Zers (customers age 18–24) have weak relationships with REPs and post a negative NPS.
  • 19 REPs significantly increased customer loyalty (measured by NPS) and 19 decreased on loyalty.
  • For those currently seeking a new REP, 74% said being a trusted and innovative brand is important, half want the lowest rate, while 44% seek great service levels.

The following is REP Net Promoter Score performance rankings as well as scoring changes from year-end 2019.

Texas Retail Electric Provider Net Promoter Scoring

NEC Retail

70.3

American Light & Power

54.5

WTU Retail

53.1

Xoom Energy

47.1

Ameripower

41.5

Acacia Energy

36.3

Champion Energy Services

33.5

4Change Energy

32.5

Cirro Energy

31.6

Spark Energy

30.3

Alliance Power

25.0

Green Mountain Energy

24.6

Discount Power

24.5

TriEagle Energy

19.4

Amigo Energy

18.2

Stream Energy

15.8

Constellation

14.6

TXU Energy

13.4

First Choice Power

13.2

Bounce Energy

11.9

Accent Energy

11.2

Direct Energy

10.6

Ambit Energy

10.3

Payless Power

8.6

Reliant Energy

7.1

CPL Retail Energy

5.9

Gexa Energy

2.9

Just Energy

-0.7

Frontier

-8.7

Entrust Energy

-16.8

Brilliant Energy

-22.6

Largest Net Promoter Score Changes From Year-End 2019

Largest Increases


Largest Declines


Gexa Energy

2.0


Ambit Energy

-0.2


WTU Retail

1.3


Pennywise

-0.2


Cirro Energy

1.2


Our Energy

-0.2


TXU Energy

1.0


Tara Energy

-0.2


Infinite Energy

0.8


YEP Energy

-0.2


Champion Energy Services

0.6


Ameripower

-0.2


First Choice Power

0.6


Alliance Power

-0.2


Griddy

0.5


Entrust Energy

-0.4


Breeze

0.5


Amigo Energy

-0.5


Xoom Energy

0.5


CPL Retail Energy

-0.5


NEC Retail

0.4


Discount Power

-0.5


Green Mountain Energy

0.4


Brilliant Energy

-0.6


Spark Energy

0.4


Direct Energy

-0.7


4Change Energy

0.3


TriEagle Energy

-0.7


American Light & Power

0.3


Summer Energy

-0.9


Beyond Power

0.3


Bounce Energy

-1.0


Stream Energy

0.2


Frontier

-1.3


Veteran Energy

0.2


Just Energy

-2.3


Constellation

0.2


Reliant Energy

-3.6


About Texas REP Trusted Brand™

Cogent Syndicated measures Customer Engagement and Brand Trust among customers of Texas retail electric providers by surveying 5,146 customers across providers based upon data-driven models. The study measures key performance indicators (KPIs) to provide management perspectives on how to improve REP brand positioning, sales and promotion, customer trust, effective messaging, product sales, customer experiences, service quality, customer acquisition and loyalty. Escalent’s Brand Trust Index comprises nine factors: community support, customer focus, communications effectiveness, environmental dedication, local reputation, reliable quality, competitive rates, enhanced offerings, and billing and customer service. The study collects a demographically representative sample across all Texas service territories open for retail electric competition. Escalent will supply the exact wording of any survey question upon request.

About Escalent

Escalent is a top human behavior and analytics firm specializing in industries facing disruption and business transformation. As catalysts of progress for more than 40 years, we tell stories that transform data and insight into a profound understanding of what drives human beings. And we help businesses turn those drivers into actions that build brands, enhance customer experiences and inspire product innovation. Visit escalent.co to see how we are helping shape the brands that are reshaping the world.


Contacts

Sarah Keller, 734.779.6847
This email address is being protected from spambots. You need JavaScript enabled to view it.

JACKSONVILLE, Fla.--(BUSINESS WIRE)--BAE Systems has received an $83.5 million contract from the U.S. Navy to modernize the guided-missile destroyers USS Carney (DDG 64) and USS Winston S. Churchill (DDG 81). The modernization work will be performed sequentially by the company’s shipyard in Jacksonville. The contracts include options that, if exercised, would bring the cumulative value to $211.6 million.


The USS Carney will be first in the shipyard, arriving in September 2020. The 23-year-old ship just returned from a six-year operational period in Rota, Spain, and will undergo extensive repair and upgrade work that will take more than 400 days to complete. The shipyard will drydock the ship and perform maintenance of the underwater hull, renovation of crew habitability spaces and upgrades to shipboard systems. The modernization is scheduled to be completed in November 2021.

The Winston S. Churchill will undergo a 390-day maintenance period when the ship arrives in June 2021. The shipyard’s work aboard the 18-year-old ship will include drydocking, replacement of steel structures onboard and support of the electronic systems upgrades. The modernization of the Winston S. Churchill is scheduled to be completed in July 2022.

“The modernization work aboard the Carney and Winston S. Churchill are significant for our Jacksonville maritime team and important for the service lives and mission capability of these combatants,” said Tim Spratto, general manager of BAE Systems Jacksonville Ship Repair. “The back-to-back sequencing of work is efficient and beneficial for our employees, our subcontractors and our Navy customer.”

BAE Systems’ Jacksonville shipyard has posted jobs and is expecting to hire workers in a number of trades, including welders, pipefitters, electricians, and painters, over the next two years to work on the two destroyers and for its ongoing repair and modernization work on other ships. The award of these two ships will also provide work for our team of subcontractor partners and third-party vendors in the port.

Commissioned in 1996, the USS Carney is named after Admiral Robert Carney, who served as chief of naval operations during the Eisenhower administration. The USS Winston S. Churchill is named after the renowned British prime minister and was commissioned in 2001.

BAE Systems is a leading provider of ship repair, maintenance, modernization, conversion, and overhaul services for the Navy, other government agencies, and select commercial customers. The company operates four full-service shipyards in California, Florida, Hawaii and Virginia, and offers a highly skilled, experienced workforce, eight dry docks/marine railways, and significant pier space and ship support services. For information about company jobs, visit www.jobs.baesystems.com.


Contacts

Karl Johnson, BAE Systems
Mobile: 757-375-5086
This email address is being protected from spambots. You need JavaScript enabled to view it.
www.baesystems.com/US
@BAESystemsInc

Full Project Capacity to Serve C&I Offtakers Through PPAs and Retail Electric Services


CHARLOTTESVILLE, Va.--(BUSINESS WIRE)--#cleanenergy--Apex Clean Energy today announced the sale of White Mesa Wind, located in Crockett County, Texas, to an unnamed buyer. When complete, the 500 MW White Mesa project will be the third-largest single-phase, single-site wind farm in the United States, following the largest—the 525 MW Aviator Wind, also developed by Apex and located in West Texas.

The deal includes a number of power purchase agreements that Apex negotiated with corporate customers: an aggregation of global technology leaders, a Fortune 500 energy technology company, a Fortune 500 leader in materials engineering solutions, among others—including Apex’s largest-ever power purchase transaction.

“White Mesa Wind illustrates the continued and robust demand for renewable energy projects with strong attributes, including a remarkable wind resource and negotiated offtake agreements,” said Mark Goodwin, president and CEO of Apex Clean Energy. “Apex is pleased to bring this project to fruition, deliver the myriad benefits of clean power to these corporate customers, and support and strengthen the Lone Star State.”

White Mesa Wind is expected to complete development this year and enter commercial operations in 2021.

About Apex Clean Energy

Apex Clean Energy develops, constructs, and operates utility-scale wind and solar power facilities across North America. Our mission-driven team of more than 200 renewable energy experts uses a data-focused approach and an unrivaled portfolio of projects to create solutions for the world’s most innovative and forward-thinking customers. For more information on how Apex is leading the transition to a clean energy future, visit www.apexcleanenergy.com or follow us on Facebook, Twitter, and LinkedIn.


Contacts

Cat Strumlauf
Apex Clean Energy
Manager | Corporate Communications
(434) 227-4196
This email address is being protected from spambots. You need JavaScript enabled to view it.

DUBLIN--(BUSINESS WIRE)--The "Global Pyrolysis Oil Market: Growth, Trends and Forecast (2020-2025)" report has been added to ResearchAndMarkets.com's offering.


The global market for Pyrolysis Oil is expected to grow at a CAGR of over 4% during the forecast period.

Major factors driving the market studied are increasing demand of pyrolysis oil for generating heat & power and rising demand from fuels segment. On the flipside, problems associated with storage and transportation of pyrolysis oil and unfavourable conditions arising due to COVID-19 outbreak are the major restraints, which are expected to hinder the growth of market.

Key Highlights

  • Growing application of pyrolysis oil in biorefineries is expected to offer various lucrative opportunities for the growth of market.
  • By application, heat & power segment is expected to dominate the market owing to the increase in the usage in boilers, gas turbines, and diesel engines.
  • North America region dominated the pyrolysis oil market across the globe with the largest consumption from countries such as United States and Canada.

Market Trends

Increasing Demand from the Heat & Power Segment

  • Pyrolysis oil is a synthetic fuel which is manufactured as a substitute for petroleum. It is also known as biocrude or bio-oil.
  • The growing usage of pyrolysis oil to produce heat by direct combustion in a boiler or furnace is projected to increase the demand of pyrolysis oil and stimulate its market during the forecast period.
  • The application of pyrolysis oil in boiler is expected to grow during the forecast period as the usage of pyrolysis oil can reduce the carbon emissions by 90% due to which it can replace natural gas and heavy & light fuel oils, thus increasing the demand for pyrolysis oil.
  • Additionally, the usage of pyrolysis oil in gas turbines and diesel engines to generate heat & power is likely to provide lucrative opportunities for the growth of pyrolysis oil market during the forecast period.
  • The industrial boilers market is expected to grow at a CAGR of above 5% during the forecast period. Due to this, the demand for pyrolysis oil is expected to increase, which will stimulate its market during the forecast period.
  • Owing to all the above-mentioned factors for pyrolysis oil, its market is expected to grow rapidly over the forecast period.

North America Region to Dominate the World Market

  • North America region is expected to dominate the market for pyrolysis oil during the forecast period. In countries like United States and Canada, owing to the growth in the industrial diesel engines and industrial boilers industry, the demand for pyrolysis oil has been increasing in the region.
  • Pyrolysis oil contains different levels of oxygen. Due to this oxygen, pyrolysis oil is non-corrosive, non-volatile, tends to polymerize when exposed to air, and offers thermal stability. Owing to these superior properties pyrolysis oil can be used as an alternative for fossil fuels, which is likely to increase the demand of pyrolysis oil in the region.
  • Additionally, pyrolysis oil when co-fired in power plants can replace natural gas, heavy oil and coal. This factor is further anticipated to boost the pyrolysis oil market in the region.
  • Furthermore, pyrolysis oil contains a large number of different components which are used to derive new products. Pyrolysis oil can be fractionated into product streams like pyrolytic lignin, pyrolytic sugars, and watery phase containing smaller organic compounds. Owing to this the demand of pyrolysis oil is expected to increase in the region.
  • The United States combined heat & power market is expected to grow at a CAGR of above 7% during the forecast period which is likely to increase the demand of pyrolysis oil and stimulate its market during the forecast period.
  • Some of the major companies operating in North America region are - Klean Fuels (Klean Industries Inc.) and Chevron Phillips Chemical Company.
  • The aforementioned factors, coupled with government support, are contributing to the increasing demand for pyrolysis oil during the forecast period.

Competitive Landscape

The pyrolysis oil market is consolidated with top players accounting for a major share of the market. Some of the major companies in the market include BTG Biomass Technology Group, Divya International, Chevron Phillips Chemical Company, Biogreen (ETIA Group), and Klean Fuels (Klean Industries Inc.).

Key Topics Covered

1 INTRODUCTION

1.1 Study Assumptions

1.2 Scope of the Study

2 RESEARCH METHODOLOGY

3 EXECUTIVE SUMMARY

4 MARKET DYNAMICS

4.1 Drivers

4.1.1 Increasing Demand for Generating Heat & Power

4.1.2 Rising Demand from Fuels Segment

4.2 Restraints

4.2.1 Problems Associated to Storage and Transportation of Pyrolysis Oil

4.2.2 Unfavourable Conditions Arising due to COVID-19 Outbreak

4.3 Industry Value Chain Analysis

4.4 Porters Five Forces Analysis

5 MARKET SEGMENTATION

5.1 Raw Material

5.1.1 Waste Plastic

5.1.2 Waste Tire

5.1.3 Waste Rubber

5.1.4 Oil Sludge

5.2 Application

5.2.1 Fuels

5.2.2 Chemicals

5.2.3 Heat

5.2.4 Power

5.3 Geography

5.3.1 Asia-Pacific

5.3.2 North America

5.3.3 Europe

5.3.4 South America

5.3.5 Middle-East & Africa

6 COMPETITIVE LANDSCAPE

6.1 Mergers & Acquisitions, Joint Ventures, Collaborations, and Agreements

6.2 Market Share (%)/Ranking Analysis

6.3 Strategies Adopted by Leading Players

6.4 Company Profiles

6.4.1 Biogreen (ETIA Group)

6.4.2 BTG Biomass Technology Group

6.4.3 Chevron Phillips Chemical Company

6.4.4 Divya International

6.4.5 Ecomation Oy

6.4.6 Kingtiger (Shanghai) Environmental Technology Co. Ltd.

6.4.7 Klean Fuels (Klean Industries Inc.)

6.4.8 Pyro-Oil Nig. Ltd.

6.4.9 Recor

6.4.10 Trident Fuels Pty. Ltd.

7 MARKET OPPORTUNITIES AND FUTURE TRENDS

7.1 Growing Application in Biorefineries

7.2 Other Opportunities

For more information about this report visit https://www.researchandmarkets.com/r/vqiz0y


Contacts

ResearchAndMarkets.com
Laura Wood, Senior Press Manager
This email address is being protected from spambots. You need JavaScript enabled to view it.

For E.S.T Office Hours Call 1-917-300-0470
For U.S./CAN Toll Free Call 1-800-526-8630
For GMT Office Hours Call +353-1-416-8900

New Division Bringing Traditional Capital Markets into the Digital Era

BOSTON--(BUSINESS WIRE)--BitOoda is expanding its suite of digital asset financial services through the launch of a digital private placement and SAFT brokerage division, following approval of the company’s application to advise and act as a placement agent on private primary offerings of digital securities and broker secondary-market transactions for SAFTs (Simple Agreements for Future Tokens). BitOoda is a U.S. Securities and Exchange Commission registered broker-dealer and a FINRA member.

Within the digital private placement division, BitOoda will harness the potential of the blockchain to bring traditional capital markets to the digital era by providing advisory services to digital asset token issuers, as well as acting as a placement agent for digital securities.

“At BitOoda we envision a future where currencies, equity, debt, and alterative assets are blockchain native. The launch of our digital private placement division marks the first step in contributing to this transition” BitOoda CEO Tim Kelly stated.

BitOoda’s SAFT brokerage division gives the U.S. digital asset ecosystem its first financial services firm for secondary-market SAFT trading that is fully compliant with securities regulations.

“This represents a milestone and much-needed regulatory clarity for the digital asset industry, and provides institutional investors with the oversight and protection in trading SAFTs that they are accustomed to when trading traditional securities,” said BitOoda Head of Business Development Ryan Porter.

Tim Kelly concluded, “We are now uniquely positioned as one of the first firms to compliantly offer investment advisory and brokerage services for digital assets, extending our already-robust regulatory credentials to help legitimize new sectors of the digital asset market.”

About BitOoda: BitOoda Holdings Inc. is a global financial services platform with a mission to accelerate the global adoption of transformational technologies by promoting transparent and efficient marketplaces through innovative and professional capital markets solutions. BitOoda’s subsidiaries include Ooda Commodities LLC, a CFTC/NFA-registered Introducing Broker; BitOoda Technologies LLC, an SEC/FINRA-registered Broker-Dealer; and BitOoda Digital LLC, which has applied for a NY DFS BitLicense. BitOoda HashTM, BitOoda Difficulty®, and BitOoda Bitcoin Transaction FeeTM are trademarks of BitOoda Holdings Inc. For more information, please visit www.bitooda.io or email This email address is being protected from spambots. You need JavaScript enabled to view it..


Contacts

Tom Nath
BitOoda Technologies, LLC
This email address is being protected from spambots. You need JavaScript enabled to view it.

Enhancing support for legacy products, white-labeled versions of the first- and second-generation ALiEn plunger controllers, best-selling Cyclops arrival sensor, and Sasquatch velocity sensor has been a primary focus for ETC as they enter their 20th year in business.

CALGARY, Alberta--(BUSINESS WIRE)--#artificiallift--2020 has been a whopper of a year so far for the North American oil and gas industry. Between regulatory roadblocks, a massive reduction in global demand for natural resources, newly negotiated trade terms, and a whole host of unforeseen challenges related to the COVID-19 outbreak, the entire sector has taken one massive blow after another. The struggles faced by equipment manufacturers, service providers, and producers have greatly impacted several other industries, with hope for a quick recovery seemingly whittling away as we enter the back half the year.


In spite of the hardship that the oil and gas industry has endured in recent months, traditionally change-resistant businesses have pivoted and adjusted to a new normal with an impressive amount of agility. There has been a significant evolution in the way we, our partners, and our customers do business, and there’s no turning back now. The digital revolution began many years ago, but the acceleration in recent months is a huge testament to the adaptability and resilience of the industry.

As a technology company with close ties to the field, ETC understands the demands and challenges service companies and producers face. Optimizing well production requires precise analytics, reliable equipment, and a lot of underlying knowledge and experience. Enhancing support for legacy products, white-labeled versions of the first- and second-generation ALiEn plunger controllers, the best-selling Cyclops arrival sensor, and Sasquatch velocity sensor has been a primary focus for ETC this year. The latest investment to ensure ETC products continue to create value and ROI is a new online Product Support Center. New articles and resources will be added on a regular basis so customers can find all the information needed to get the most of ETC plunger lift controls and sensors. Regularly scheduled live video training sessions are available, with recorded versions available on-demand at support.etcorp.ca.

To help oil and gas companies keep natural gas wells producing at optimal levels for a lower capital investment, ETC is pleased to announce several new programs; Refurbished controllers and replacement faceplates are now available at a reduced price. Please visit etcorp.ca or contact an authorized reseller for information on these programs, available for a limited time only.

ETC is proud to be a leading manufacturer of high quality, low power, certified plunger controls and sensors. Historically white labeled under other brand names, nearly 12,000 ALiEn and ALiEn2 controllers are optimizing gas wells in the field today, while just shy of 60,000 sensors provide acutely accurate plunger arrival alerts. ETC has seen their share of changes and weathered plenty of storms throughout two decades of business. They’ve stood strong and stable while resellers and customers completed acquisitions, mergers, and splits. Despite many unknowns ahead, the team at ETC look to the future with relentless optimism that the grit and determination of the North American oil and gas industry will propel us back into prosperity once again.

If you would like more information, please contact Mark Scantlebury at (403) 290-6300 or This email address is being protected from spambots. You need JavaScript enabled to view it.


Contacts

Mark Scantlebury, CEO
Extreme Telematics Corp
(403) 290-6300
This email address is being protected from spambots. You need JavaScript enabled to view it.

Offshore Source Logo

Offshore Source keeps you updated with relevant information concerning the Offshore Energy Sector.

Any views or opinions represented on this website belong solely to the author and do not represent those of the people, institutions or organizations that Offshore Source or collaborators may or may not have been associated with in a professional or personal capacity, unless explicitly stated.

Corporate Offices

Technology Systems Corporation
8502 SW Kansas Ave
Stuart, FL 34997

info@tscpublishing.com