Business Wire News

DUBLIN--(BUSINESS WIRE)--The "United States Oil and Gas Downstream Market - Growth, Trends, and Forecasts (2020 - 2025)" report has been added to ResearchAndMarkets.com's offering.


The United States oil and gas downstream market is expected to register a CAGR of 0.92% during the forecast period

On account of factors, such as abundant feedstock availability from the Shale gas deposits, robust pipeline, storage facilities, extensive rail infrastructure, and oil companies are moving ahead with billions of dollars in investments to upgrade the existing refining capacity.

However, factors, such as the sanction on Venezuela, are expected to decrease the availability of cheap crude and, thereby, decrease the interest of the operators of complex refineries in the country for further investment. This is expected to restrain the market during the forecast period. Overall, the refinery market in the United States appears to be saturated in the short term as the country has not many new refinery projects to be commissioned until 2025, and the market growth in terms of investment will be witnessed in the expansion and upgradation of existing facilities.

  • Refining industry to register growth due to the several expansion projects proposed during the forecast period.
  • According to the International Energy Agency, in Clean Technology Scenario, petrochemicals are expected to become the only growing segment of global oil demand by 2050. Moreover, several petrochemical projects are expected to come online in the United States during the forecast period. Hence, the petrochemical sector is expected to present a huge growth opportunity for the downstream players in the country.
  • Increasing demand for refined petroleum products, such as gasoline, diesel fuel, jet fuel, unfinished oils, and other liquids, such as fuel ethanol, blending components for gasoline, and others, are expected to drive the market studied.

Key Market Trends

Refining Sector to Register a Modest Growth

As of 2019, the Gulf Coast accounted for 45% of total petroleum refining capacity and 51% of total natural gas processing capacity in the United States. The United States Gulf Coast region is expected to witness a fresh wave of investment in the downstream business, during the forecast period.

  • Adding to this, the United States shale production has almost doubled since the shale revolution started in 2009 and is expected to increase further. Hence, increased production is expected to proliferate the growth of the United States oil and gas refining market during the forecast period.
  • With continuous investments and high competition, the refining throughput of the United States increased at the rate of 5.67% in 2019, reaching to 18.6MBPD from the 2010s 17.6 MBPD value.
  • For instance, in 2018, ExxonMobil announced the construction of an additional unit, that will increase crude refining capacity by more than 250,000 barrels per day by 2022.
  • Therefore, such investments and the need for the new infrastructure are expected to provide a huge impetus to the growth of the United States refining market.

Increasing Demand for Petroleum Products

Petroleum includes refined petroleum products, such as gasoline, diesel fuel, jet fuel, unfinished oils, and other liquids, such as fuel ethanol, blending components for gasoline, and other refinery inputs.

  • The United States produces a large share of the petroleum it consumes, but the country still relies on imports to meet the increasing demand. In 2018, the country produced about 17.7 million barrels of petroleum per day (mbpd), and it consumed more than 20.5 mbpd. Imports from other countries help to meet the domestic demand for petroleum.
  • However, in 2018, net imports of petroleum averaged to 2.3 mbpd, which is the equivalent of 11% of total petroleum consumption in the United States and the lowest percentage since 1957. This decline in imports is attributed to improved downstream infrastructure and increased refining capacities.
  • In August 2019, the petroleum demand reached 21.5 mbpd, representing an increase of 0.8% compared to that in August 2018 and highest for any month since August 2005.
  • Therefore, factors, such as increasing demand for petroleum products and the improvement in downstream infrastructure, are expected to drive the downstream market in the United States.

Competitive Landscape

The market for United States oil and gas downstream remains fragmented, with a number of key players, including Marathon Petroleum Corp., Chevron Corporation, Valero Energy Corporation, Exxon Mobil Corporation, Phillips 66, and Royal Dutch Shell plc.

Key Topics Covered:

1 INTRODUCTION

2 EXECUTIVE SUMMARY

3 RESEARCH METHODOLOGY

4 MARKET OVERVIEW

4.1 Introduction

4.2 Refining Capacity and Forecast in million barrels per day, till 2025

4.3 Recent Trends and Developments

4.4 Government Policies and Regulations

4.5 Market Dynamics

4.5.1 Drivers

4.5.2 Restraints

4.6 PESTLE Analysis

5 MARKET SEGMENTATION BY SECTOR

5.1 Refining

5.1.1 Market Overview

5.1.2 Key Project Information

5.2 Petrochemical

5.2.1 Market Overview

5.2.2 Key Project Information

6 COMPETITIVE LANDSCAPE

6.1 Mergers and Acquisitions, Joint Ventures, Collaborations, and Agreements

6.2 Strategies Adopted by Leading Players

6.3 Company Profiles

6.3.1 Marathon Petroleum Corp

6.3.2 Phillips 66

6.3.3 Valero Energy Corporation

6.3.4 Exxon Mobil Corporation

6.3.5 Royal Dutch Shell Plc

6.3.6 Hunt Refining Company

6.3.7 U.S. Oil & Refining Co.

7 MARKET OPPORTUNITIES AND FUTURE TRENDS

For more information about this report visit https://www.researchandmarkets.com/r/igfbk


Contacts

ResearchAndMarkets.com
Laura Wood, Senior Press Manager
This email address is being protected from spambots. You need JavaScript enabled to view it.

For E.S.T Office Hours Call 1-917-300-0470
For U.S./CAN Toll Free Call 1-800-526-8630
For GMT Office Hours Call +353-1-416-8900

HARTFORD, Conn. and BOSTON--(BUSINESS WIRE)--Eversource Energy (NYSE: ES) today reported earnings of $346.3 million, or $1.01 per share, in the third quarter of 2020, compared with earnings of $318.9 million, or $0.98 per share, in the third quarter of 2019. In the first nine months of 2020, Eversource Energy earned $933.2 million, or $2.76 per share, compared with earnings of $659 million, or $2.05 per share, in the first nine months of 2019.


Results for the first nine months of 2019 included an after-tax impairment charge of $204.4 million, or $0.64 per share, related to Eversource Energy’s investment in the Northern Pass Transmission (NPT) project. Excluding that impairment charge, Eversource Energy earned $863.4 million, or $2.69 per share, in the first nine months of 2019.

Eversource Energy also today reaffirmed both its 2020 earnings per share (EPS) projection of $3.60 to $3.70 per share, excluding costs related to the recently completed acquisition of assets of Columbia Gas of Massachusetts, and its long-term EPS growth rate from its core regulated businesses.

The past few months have been one of the most challenging periods we have ever experienced as a result of extreme late summer weather compounded by drought conditions. Beginning with Tropical Storm Isaias and continuing with tornadoes in south central Connecticut and a damaging wind storm in early October, our crews have been working tirelessly and safely, ensuring that our 4.3 million customers receive the high level of service they expect and deserve,” said Jim Judge, Eversource chairman, president and chief executive officer. “I cannot thank our Eversource first responders enough for their outstanding work throughout this pandemic-challenged year. I’m also grateful to our customers for their patience and understanding while our line crews and hundreds of other Eversource employees have worked around the clock on their behalf.”

Electric Distribution

Eversource Energy’s electric distribution segment earned $205.5 million in the third quarter of 2020 and $450.6 million in the first nine months of 2020, compared with earnings of $197.3 million in the third quarter of 2019 and $422.7 million in the first nine months of 2019. Third quarter and year-to-date results reflect higher revenues, offset in part by higher operation and maintenance expense, due largely to higher storm restoration costs, as well as higher depreciation and interest.

Electric Transmission

Eversource Energy’s transmission segment earned $125.6 million in the third quarter of 2020 and $381.8 million in the first nine months of 2020, compared with earnings of $107.5 million in the third quarter of 2019 and earnings of $342.8 million1 in the first nine months of 2019, excluding the NPT impairment charge noted above. Aside from the NPT impairment charge, transmission segment results improved due to a higher level of investment in Eversource’s electric transmission system.

Natural Gas Distribution

Eversource Energy’s natural gas distribution segment lost $14 million in the third quarter of 2020 and earned $73.8 million in the first nine months of 2020, compared with a $17.1 million loss in the third quarter of 2019 and earnings of $57.6 million in the first nine months of 2019. Improved results were due to higher revenues, partially offset by higher depreciation, operation and maintenance and property tax expense.

Water Distribution

Eversource’s Aquarion Water Company subsidiary earned $23.1 million in the third quarter of 2020 and $35.6 million in the first nine months of 2020, compared with earnings of $17.5 million in the third quarter of 2019 and $26.3 million in the first nine months of 2019. Improved results were primarily due to gains on the sale of the Hingham, Massachusetts water distribution system and on a sale of land and lower interest expense.

Eversource Parent and Other Companies

Eversource Energy parent and other companies earned $6.1 million in the third quarter of 2020 and lost $8.6 million in the first nine months of 2020, compared with earnings of $13.7 million in the third quarter of 2019 and $14 million in the first nine months of 2019. The 2020 results include after-tax charges of $5.3 million in the third quarter and $12.8 million in the first nine months related to Eversource Energy’s acquisition of Columbia Gas of Massachusetts’ assets. Excluding Columbia Gas impacts, lower nine months 2020 results reflect lower mark-to-market earnings on an unregulated clean energy investment.

The following table reconciles 2020 and 2019 third quarter and first nine months earnings per share:


Third Quarter

First Nine Months

2019

Reported EPS

$0.98

$2.05


Higher electric distribution revenues in 2020, offset by

higher O&M, depreciation, interest expense and

dilution


(0.01)


0.01


Higher electric transmission earnings in 2020, excluding

NPT impairment, offset by dilution


0.03


0.06


Higher natural gas revenues in 2020, offset by higher

depreciation, O&M, property tax expense and dilution


0.01


0.04


Higher water earnings in 2020, offset by dilution

0.01

0.03


Lower earnings in 2020 related to clean energy fund investment and all Other

0.00

(0.03)


Absence of NPT impairment charge

0.00

0.64


Charges related to Columbia Gas of MA asset purchase *

(0.01)

(0.04)

2020

Reported EPS

$1.01

$2.76

* Results for the third quarter and first nine months of 2020 included charges of $5.3 million and $12.8 million, respectively, related to Eversource’s recently completed acquisition of the assets of Columbia Gas of Massachusetts. Absent those charges, Eversource earned $351.6 million1, or $1.02 per share, in the third quarter of 2020 and $946 million1, or $2.80 per share, in the first nine months of 2020.

Financial results by segment for the third quarter and first nine months of 2020 and 2019 are noted below:

Three months ended:


(in millions, except EPS)

September 30,
2020

September 30,
2019

Increase/
(Decrease)


2020 EPS1

Electric Distribution

$205.5

$197.3

$8.2

$0.60

Electric Transmission

125.6

107.5

18.1

0.36

Natural Gas Distribution

(14.0)

(17.1)

3.1

(0.04)

Water Distribution

23.1

17.5

5.6

0.07

Eversource Parent and Other Companies1

11.4

13.7

(2.3)

0.03

Columbia Gas of MA asset acquisition costs

(5.3)

0.0

(5.3)

(0.01)

Reported Earnings

$346.3

$318.9

$27.4

$1.01

Nine months ended:


(in millions, except EPS)

September 30,
2020

September 30,
2019

Increase/
(Decrease)


2020 EPS1

Electric Distribution

$450.6

$422.7

$27.9

$1.33

Electric Transmission, ex NPT charge1

381.8

342.8

39.0

1.13

Natural Gas Distribution

73.8

57.6

16.2

0.22

Water Distribution

35.6

26.3

9.3

0.11

Eversource Parent and Other Companies1

4.2

14.0

(9.8)

0.01

NPT impairment charge

0.0

(204.4)

204.4

0.00

Columbia Gas of MA asset acquisition costs

(12.8)

0.0

(12.8)

(0.04)

Reported Earnings

$933.2

$659.0

$274.2

$2.76

Eversource Energy has approximately 343 million common shares outstanding and operates New England’s largest energy delivery system. It serves approximately 4.3 million electric, natural gas and water customers in Connecticut, Massachusetts and New Hampshire.

Note: Eversource Energy will webcast a conference call with senior management on November 4, 2020, beginning at 9 a.m. Eastern Time. The webcast and associated slides can be accessed through Eversource Energy’s website at www.eversource.com.

1 All per-share amounts in this news release are reported on a diluted basis. The only common equity securities that are publicly traded are common shares of Eversource Energy. The earnings and EPS of each business do not represent a direct legal interest in the assets and liabilities of such business, but rather represent a direct interest in Eversource Energy's assets and liabilities as a whole. EPS by business is a non-GAAP (not determined using generally accepted accounting principles) financial measure that is calculated by dividing the net income or loss attributable to common shareholders of each business by the weighted average diluted Eversource Energy common shares outstanding for the period. Earnings discussions also include non-GAAP financial measures referencing 2020 earnings and EPS excluding certain acquisition costs and second quarter 2019 earnings and EPS excluding the NPT impairment charge. Eversource Energy uses these non-GAAP financial measures to evaluate and provide details of earnings results by business and to more fully compare and explain 2020 and 2019 results without including these items. Management believes the acquisition costs and the NPT impairment charge are not indicative of Eversource Energy’s ongoing costs and performance. Due to the nature and significance of these items on net income attributable to common shareholders, management believes that the non-GAAP presentation is a more meaningful representation of Eversource Energy’s financial performance and provides additional and useful information to readers in analyzing historical and future performance of the business. Non-GAAP financial measures should not be considered as alternatives to Eversource Energy’s consolidated net income attributable to common shareholders or EPS determined in accordance with GAAP as indicators of Eversource Energy’s operating performance.

This document includes statements concerning Eversource Energy’s expectations, beliefs, plans, objectives, goals, strategies, assumptions of future events, future financial performance or growth and other statements that are not historical facts. These statements are “forward-looking statements” within the meaning of the Private Securities Litigation Reform Act of 1995. Generally, readers can identify these forward-looking statements through the use of words or phrases such as “estimate,” “expect,” “anticipate,” “intend,” “plan,” “project,” “believe,” “forecast,” “should,” “could” and other similar expressions. Forward-looking statements involve risks and uncertainties that may cause actual results or outcomes to differ materially from those included in the forward-looking statements. Factors that may cause actual results to differ materially from those included in the forward-looking statements include, but are not limited to: cyberattacks or breaches, including those resulting in the compromise of the confidentiality of our proprietary information and the personal information of our customers; disruptions in the capital markets or other events that make our access to necessary capital more difficult or costly; the negative impacts of the novel coronavirus (COVID-19) pandemic on our customers, vendors, employees, regulators, and operations; changes in economic conditions, including impact on interest rates, tax policies, and customer demand and payment ability; ability or inability to commence and complete our major strategic development projects and opportunities; acts of war or terrorism, physical attacks or grid disturbances that may damage and disrupt our electric transmission and electric, natural gas, and water distribution systems; actions or inaction of local, state and federal regulatory, public policy and taxing bodies; substandard performance of third-party suppliers and service providers; fluctuations in weather patterns, including extreme weather due to climate change; changes in business conditions, which could include disruptive technology or development of alternative energy sources related to our current or future business model; contamination of, or disruption in, our water supplies; changes in levels or timing of capital expenditures; changes in laws, regulations or regulatory policy, including compliance with environmental laws and regulations; changes in accounting standards and financial reporting regulations; actions of rating agencies; and other presently unknown or unforeseen factors.

Other risk factors are detailed in Eversource Energy’s reports filed with the Securities and Exchange Commission (SEC). They are updated as necessary and available on Eversource Energy’s website at www.eversource.com and on the SEC’s website at www.sec.gov. All such factors are difficult to predict and contain uncertainties that may materially affect Eversource Energy’s actual results, many of which are beyond our control. You should not place undue reliance on the forward-looking statements, as each speaks only as of the date on which such statement is made, and, except as required by federal securities laws, Eversource Energy undertakes no obligation to update any forward-looking statement or statements to reflect events or circumstances after the date on which such statement is made or to reflect the occurrence of unanticipated events.

EVERSOURCE ENERGY AND SUBSIDIARIES

CONDENSED CONSOLIDATED STATEMENTS OF INCOME

(Unaudited)


For the Three Months Ended September 30,


For the Nine Months Ended September 30,

(Thousands of Dollars, Except Share Information)

2020


2019


2020


2019


Operating Revenues

$

2,343,642


$

2,175,797


$

6,670,497


$

6,476,084


Operating Expenses:


Purchased Power, Fuel and Transmission

806,254


730,255


2,312,957


2,326,041


Operations and Maintenance

332,031


331,054


1,006,148


994,660


Depreciation

244,453


222,599


721,179


656,632


Amortization

57,515


73,854


130,687


183,760


Energy Efficiency Programs

145,047


136,832


408,794


382,785


Taxes Other Than Income Taxes

197,112


171,965


556,726


537,636


Impairment of Northern Pass Transmission


239,644


Total Operating Expenses

1,782,412


1,666,559


5,136,491


5,321,158


Operating Income

561,230


509,238


1,534,006


1,154,926


Interest Expense

134,066


135,216


403,067


399,654


Other Income, Net

29,218


26,968


83,565


103,818


Income Before Income Tax Expense

456,382


400,990


1,214,504


859,090


Income Tax Expense

108,242


80,226


275,621


194,435


Net Income

348,140


320,764


938,883


664,655


Net Income Attributable to Noncontrolling Interests

1,880


1,880


5,639


5,639


Net Income Attributable to Common Shareholders

$

346,260


$

318,884


$

933,244


$

659,016


Basic Earnings Per Common Share

$

1.01


$

0.98


$

2.77


$

2.06


Diluted Earnings Per Common Share

$

1.01


$

0.98


$

2.76


$

2.05


Weighted Average Common Shares Outstanding:


Basic

343,076,614


324,037,169


337,375,172


320,442,253


Diluted

343,773,602


326,008,342


338,424,100


321,570,926


The data contained in this report is preliminary and is unaudited. This report is being submitted for the sole purpose of providing information to shareholders about Eversource Energy and Subsidiaries and is not a representation, prospectus, or intended for use in connection with any purchase or sale of securities.


Contacts

Jeffrey R. Kotkin
(860) 665-5154

DUBLIN--(BUSINESS WIRE)--The "Oil Refining Industry in Pakistan 2020" report has been added to ResearchAndMarkets.com's offering.


The downstream energy sector report, "Oil Refining Industry in Pakistan" is a complete source of information on Pakistan crude oil refining industry.

It provides refinery level information relating to existing and planned (new build) refineries such as insights and forecasts of refinery capacities, refined petroleum products production and consumption, refinery complexity factor and comparison against peer group countries in the respective region.

The report also covers complete details of major players operating in the refining sector in Pakistan and in depth analysis of the latest industry news and deals.

Report Scope

  • Outlook of Country Oil Refining Industry and refined petroleum products beyond 2020
  • Forecasts of refined products production and consumption along with major refining companies and operators.
  • Historic and Forecasted Refining capacity and secondary units capacities beyond 2020
  • Key Opportunities and Restraints in country Refinery market
  • Benchmark with five peer group countries on Nelson Complexity Factor.
  • Market structure of Country Refining Industry, companies, capacities and market share.
  • Information on planned refineries such as planned capacity, equity structure, Operator Company, expected commissioning date and project cost.
  • Refined petroleum products production and demand beyond 2020.
  • Refinery level information such as refinery name, commissioned year, primary and secondary units installed capacities along with future capacity expansions, refinery complexity factor, ownership and operator details.
  • Company profiles of major refining companies including SWOT Analysis.
  • Latest mergers, acquisitions, contract announcements and all related industry news and deals analysis.


Key Topics Covered:


1 Table of Contents

1.1 List of Figures

1.2 List of Tables


2 Introduction to Pakistan Refining Markets

2.1 What is This Report About?

2.2 Market Definition


3 Refining Industry in Pakistan

3.1 Pakistan Refining Market Snapshot, 2019

3.2 Role of Pakistan in Global and Regional Refining Markets

3.2.1 Contribution to Asia Pacific and Global Refining Capacity, 2019

3.2.2 Pakistan Average Nelson Complexity Factor (NCF) vs. Asia Pacific and Global, 2019


4 Pakistan Refining Market- Drivers and Restraints

4.1 Pakistan Refining Industry: Trends and Issues

4.1.1 Pakistan Refining Industry: Major Trends

4.2 Major Restrains of Investing in Pakistan Refining Sector


5 Pakistan Oil Products Demand and Supply Forecast to 2025

5.1 Pakistan Refined Products Demand Forecast to 2025

5.1.1 Pakistan Gasoline Demand Forecast to 2025

5.1.2 Pakistan Diesel Oil Demand Forecast to 2025

5.1.3 Pakistan Kerosene Demand Forecast to 2025

5.1.4 Pakistan LPG Demand Forecast to 2025

5.2 Pakistan Refined Products Production Forecast to 2025

5.2.1 Pakistan Gasoline Production Forecast to 2025

5.2.2 Pakistan Diesel Oil Production Forecast to 2025

5.2.3 Pakistan Kerosene Production Forecast to 2025

5.2.4 Pakistan LPG Production Forecast to 2025


6 Pakistan Refinery Capacities Forecast to 2025

6.1 Location, Operator, Ownership, Startup Details of Operational Refineries in Pakistan

6.1.1 Refinery Location, Operator, Ownership, Startup Details

6.2 Pakistan Total Refining Capacity Historic and Forecast, 2012-2025

6.3 Pakistan Refining Capacity Historic and Forecast, 2012-2025

6.4 Pakistan Refinery wise Secondary Conversion Unit-1 Capacity, 2012-2025

6.5 Pakistan Refinery wise Secondary Conversion Unit-2 Capacity, 2012-2025

6.6 Pakistan Refinery wise Secondary Conversion Unit-3 Capacity, 2012-2025


7 Pakistan Refining Industry- Future Developments and Investment Opportunities

7.1 Capital Investment Details of All Upcoming Refineries

7.2 Location, Operator, Ownership, Start Up Details of Planned Refineries in Pakistan

7.2.1 Refinery Location, Operator, Ownership, Startup Details

7.3 Refinery Capacities of All Upcoming Refineries


8 Key Strategies Pakistan Refining Companies

8.1 Pakistan Company wise Refining Capacity Forecast, 2012-2025


9 Attock Refinery Limited (ARL) Company Profile

9.1 Attock Refinery Limited (ARL) Key Information

9.2 Attock Refinery Limited (ARL) Company Overview

9.3 Attock Refinery Limited (ARL) Business Description

9.4 Attock Refinery Limited (ARL) SWOT Analysis

9.5 Attock Refinery Limited (ARL) Financial Ratios - Capital Market Ratios

9.6 Attock Refinery Limited (ARL) Financial Ratios - Annual Ratios

9.7 Attock Refinery Limited (ARL) Financial Ratios - Interim Ratios


10 Pakistan Refining Industry Latest Tenders and Contracts


11 Pakistan Refining Industry Updates


12 Pakistan Refining Industry Deals

12.1 Detailed Deal Summary


13 Appendix

Companies Mentioned

  • Attock Refinery Limited

For more information about this report visit https://www.researchandmarkets.com/r/8h6csj.


Contacts

ResearchAndMarkets.com
Laura Wood, Senior Press Manager
This email address is being protected from spambots. You need JavaScript enabled to view it.

For E.S.T. Office Hours Call 1-917-300-0470
For U.S./CAN Toll Free Call 1-800-526-8630
For GMT Office Hours Call +353-1-416-8900

Earns $0.22 per share (GAAP) and adjusted earnings per share of $0.23 (Non-GAAP)
Refines 2020 annual adjusted earnings guidance to the top end of the $1.53 to $1.58 range
Signs agreement with Lower Makefield for 11,000 customer connections
Publishes Environmental, Social and Governance (ESG) report

BRYN MAWR, Pa.--(BUSINESS WIRE)--Essential Utilities Inc. (NYSE: WTRG), today reported results for the third quarter ended Sept. 30, 2020.


Company Highlights

Our commitment to providing safe, reliable, affordable resources during these uncertain times has never been more important for our customers and the communities we serve,” said Essential Chairman and CEO Christopher Franklin. The company has made donations to several nonprofits to support communities in need and enhanced the low-income assistance program to ensure customers continue to receive its services.

We are pleased to have published our 2019 Environmental, Social and Governance (ESG) report, highlighting our commitment to environmental stewardship, sustainable business practices, employee safety, diversity and inclusion, customer experience and community engagement. We look to bring the same ESG focus to the natural gas business as we expect to announce a companywide emissions reduction target in the next six months. We are also pleased that, due to the combined efforts across our 10-state footprint, we are able to refine our annual adjusted earnings per share guidance to the top end of the $1.53 to $1.58 range,” stated Franklin.

Operating Results

Essential reported net income of $55.7 million (GAAP) for the third quarter 2020, or $0.22 per share (GAAP), compared to $88.5 million, or $0.38 per share, for the third quarter 2019. Results for the third quarter of 2020 include the operating results of Peoples, which largely comprises the company’s regulated natural gas segment, and results for the third quarter of 2019 include Peoples transaction-related items. Adjusting for transaction-related water rate credits issued to utility customers, adjusted net income in the third quarter of 2020 was $58.6 million (non-GAAP), or $0.23 per share (non-GAAP). Please refer to the reconciliation of GAAP to non-GAAP financial measures later in this press release for additional information on Essential’s use of non-GAAP financial measures as a supplement to its GAAP results.

Revenues for the quarter were $348.6 million, an increase of 43.1% compared to $243.6 million in the third quarter of 2019. The natural gas utility acquired in the first quarter contributed $92.1 million of this revenue growth, while the remainder was due to increased volume, growth and rate and surcharge increases in the regulated water segment. Adjusted revenues for the third quarter of 2020, which exclude water rate credits issued to utility customers, were $352.7 million (non-GAAP). Operations and maintenance expenses increased to $136.2 million for the third quarter of 2020 compared to $82.0 million in the third quarter of 2019. The increase in operations and maintenance expenses was primarily a result of operations and maintenance expenses of $62.2 million from the acquisition of Peoples.

The regulated water segment reported revenues for the quarter of $255.7 million, an increase of 5.3% compared to $242.9 million in the third quarter of 2019. Increased volume and rates and surcharges were the largest contributors to the increase in revenues for the period, in addition to customer growth from both organic growth and acquisitions. Operations and maintenance expenses for the regulated water segment decreased by 2.2% to $79.3 million for the third quarter of 2020.

The regulated natural gas segment reported revenues for the third quarter of 2020 of $88.9 million. Operations and maintenance for the same period for the regulated natural gas segment were $59.6 million and purchased gas costs were $14.8 million.

For the first nine months of 2020, the company reported revenues of $988.7 million compared to $663.7 million in the first nine months of 2019. Adjusted revenues for the first nine months, which exclude water rate credits issued to utility customers, were $992.8 million (non-GAAP). Operations and maintenance expenses for the first nine months of 2020 were $371.4 million compared to $247.8 million in 2019.

As of Sept. 30, 2020, Essential reported year-to-date net income of $182.1 million or $0.71 per share (GAAP) compared to $160.3 million or $0.76 per share (GAAP) reported through the same period of 2019. Adjusted income and adjusted income per share (both non-GAAP financial measures) for the first nine months of 2020, exclude the impact of both the Peoples transaction-related water rate credits issued to utility customers of $4.1 million and Peoples transaction-related expenses, and include a normalized pro forma adjustment for the Peoples operating results for the period Jan. 1, 2020 to March 15, 2020 to provide the basis for a 2020 full-year run rate of operating results. Adjusted income for the first nine months of 2020 was $286.9 million or $1.12 per share (non-GAAP). The fourth quarter of 2020 will include additional rate credits to be issued to gas utility customers of $18.9 million. Please refer to the reconciliation of GAAP to non-GAAP financial measures later in this press release for additional information on Essential’s use of non-GAAP financial measures as a supplement to its GAAP results.

Dividend

On Oct. 21, 2020, Essential’s board of directors declared a quarterly cash dividend of $0.2507 per share of common stock. This dividend will be payable on Dec. 1, 2020 to shareholders of record on Nov. 13, 2020. The company has paid a consecutive quarterly cash dividend for more than 75 years.

Financing

In August, Essential announced an offering of 6.7 million shares of common stock via a forward equity sale agreement. The company will not receive any proceeds from the sale of our common stock by the forward purchaser until settlement of all or a portion of the agreement. If assuming full settlement today, the company would receive approximately $306 million in proceeds which are expected to be used to fund general corporate purposes, including the acquisition of the Delaware County Regional Water Quality Control Authority (DELCORA) and other water and wastewater acquisitions in its pipeline. The forward sale agreement allows the company to settle the transaction between now and Aug. 10, 2021.

Water utility acquisition growth

Essential’s continued acquisition growth allows the company to provide safe and reliable water and wastewater service to an even larger customer base. On October 8, 2020, the company’s regulated water segment subsidiary, Aqua Illinois, closed its acquisition of the Rockwell Utilities water and wastewater system, adding approximately $5.15 million in rate base. In the first nine months of 2020, customer growth for the company’s water utilities has totaled 1.5% including organic growth.

The company has signed purchase agreements for other municipal water and wastewater acquisitions that are expected to add the equivalent of over 212,000 water and wastewater retail customers and approximately $363 million in expected rate base. This includes the recently announced, signed purchase agreement to acquire the wastewater system of Lower Makefield, a Pennsylvania utility with approximately 11,000 customer connections and the previously announced, signed purchase agreement between Essential’s regulated water segment subsidiary, Aqua Pennsylvania Wastewater, and DELCORA.

We remain focused on advancing the DELCORA acquisition, while continuing to partner with municipalities, like Lower Makefield, to provide the operational excellence that has become synonymous with our 134-year-old company,” added Franklin.

Capital expenditures

Essential invested $554.1 million in the first nine months of the year to improve its regulated water and natural gas infrastructure systems and to enhance its customer service across its operations. This does not include an additional $53.5 million that was invested by Peoples, pre-closing, during the period from Jan. 1, 2020 to March 15, 2020. The company remains on track to replace and expand its water and wastewater utility infrastructure by investing approximately $550 million in 2020. Additionally, the company expects to invest approximately $400 million in 2020 to replace and upgrade its natural gas utility infrastructure (including capital invested in 2020 prior to Essential’s ownership), leading to significant reductions in methane emissions that occur in aged gas pipes. In total, infrastructure investments of approximately $2.8 billion are expected through 2022 to improve water and natural gas systems (including capital invested at Peoples in 2020 prior to Essential’s ownership) and better serve our customers through improved information technology. The capital investments made to rehabilitate and expand the infrastructure of the communities Essential serves are critical to its mission of safely and reliably delivering Earth’s most essential resources.

Rate activity

To date in 2020, the regulated water segment has received rate awards or infrastructure surcharges in Illinois, Indiana, North Carolina, Ohio, Virginia and Pennsylvania totaling an estimated increase in annualized revenues of $21.0 million. Additionally, the regulated natural gas segment has received infrastructure surcharges in Kentucky and Pennsylvania totaling an estimated increase to annualized revenues of $1.0 million. The company currently has proceedings pending in New Jersey, Virginia and Indiana for its regulated water segment, which would add $2.9 million in incremental revenue.

Essential refines 2020 guidance

The company continues to monitor the effects of the COVID-19 pandemic on its customers, employees and the business and will update guidance impacts from the pandemic in the future if needed. At this time, the company’s updated 2020 full-year guidance is:

  • Expects adjusted income per diluted common share (non-GAAP) at the top end of the $1.53 to $1.58 range
  • Earnings growth CAGR of 5 to 7 percent for 2019 through 2022
  • Regulated water segment infrastructure investments of approximately $550 million in 2020
  • Regulated natural gas segment infrastructure investments of approximately $400 million in 2020 on full-year basis (adjusted to include capital invested in 2020 prior to Essential’s ownership)
  • Infrastructure investments of approximately $2.8 billion through 2022 in existing operations to rehabilitate and strengthen water, wastewater, and natural gas systems (including regulated natural gas segment capital invested in 2020 prior to Essential’s ownership)
  • Regulated water segment rate base compound annual growth rate of 6 to 7 percent through 2022
  • Regulated natural gas segment rate base compound annual growth rate of 8 to 10 percent through 2022
  • Total annual regulated water segment customer growth of between 2 and 3 percent on average depending upon regulatory approval
  • Gas customer count expected to be relatively stable for 2020

Please refer to the reconciliation of GAAP and non-GAAP financial measures later in this press release for additional information on Essential’s use of non-GAAP financial measures as a supplement to its GAAP results.

Essential Utilities does not guarantee future results of any kind. Guidance is subject to risks and uncertainties, including, without limitation, those factors outlined in the “Forward Looking Statements” of this release and the “Risk Factors” section of the company’s annual and quarterly reports filed with the Securities and Exchange Commission.

Earnings Call Information

Date: Nov. 4, 2020
Time: 11 a.m. EST (please dial in by 10:45 a.m.)
Webcast and slide presentation link: https://www.essential.co/events-and-presentations/events-calendar
Replay Dial-in #: 888.203.1112 (U.S.) & +1 719.457.0820 (International)
Confirmation code: 8195013

The company’s conference call with financial analysts will take place Wednesday, Nov. 4, 2020 at 11 a.m. Eastern Standard Time. The call and presentation will be webcast live so that interested parties may listen over the internet by logging on to Essential.co and following the link for Investors. The conference call will be archived in the Investor Relations section of the company’s website for 90 days following the call. Additionally, the call will be recorded and made available for replay at 2 p.m. on Nov. 4, 2020 for 10 business days following the call. To access the audio replay in the U.S., dial 888-203-1112 (pass code 8195013). International callers can dial +1 719-457-0820 (pass code 8195013).

About Essential

Essential is one of the largest publicly traded water, wastewater and natural gas providers in the U.S., serving approximately 5 million people across 10 states under the Aqua and Peoples brands. Essential is committed to excellence in proactive infrastructure investment, regulatory expertise, operational efficiency and environmental stewardship. The company recognizes the importance water and natural gas play in everyday life and is proud to deliver safe, reliable services that contribute to the quality of life in the communities it serves. For more information, visit http://www.essential.co.

Forward-looking statements

This release contains forward-looking statements within the meaning of the Private Securities Litigation Reform Act of 1995, including, among others: the guidance range of adjusted income per diluted common share for the fiscal year ending in 2020; the 3-year earnings growth from 2019 to 2022; the projected total regulated water segment customer growth for 2020; the anticipated amount of capital investment in 2020; the anticipated amount of capital investment from 2020 through 2022; and the company’s anticipated rate base growth from 2020 through 2022. There are important factors that could cause actual results to differ materially from those expressed or implied by such forward-looking statements including: disruptions in the global economy; financial and workforce impacts from the COVID-19 pandemic; the continuation of the company's growth-through-acquisition program; the company’s continued ability to adapt itself for the future and build value by fully optimizing company assets; general economic business conditions; the company’s ability to fund needed infrastructure; housing and customer growth trends; unfavorable weather conditions; the success of certain cost-containment initiatives; changes in regulations or regulatory treatment; availability and access to capital; the cost of capital; disruptions in the credit markets; the success of growth initiatives; the company’s ability to successfully close municipally owned systems presently under agreement; the company’s ability to continue to deliver strong results; the company’s ability to continue to pay its dividend, add shareholder value and grow earnings; municipalities’ willingness to privatize their water and/or wastewater utilities; the company’s ability to control expenses and create and maintain efficiencies; the company’s ability to acquire municipally owned water and wastewater systems listed in its “pipeline”; and other factors discussed in our Annual Report on Form 10-K and our Quarterly Reports on Form 10-Q, which are filed with the Securities and Exchange Commission. For more information regarding risks and uncertainties associated with Essential's business, please refer to Essential's annual, quarterly and other SEC filings. Essential is not under any obligation - and expressly disclaims any such obligation - to update or alter its forward-looking statements whether as a result of new information, future events or otherwise.

WTRGF

Essential Utilities, Inc. and Subsidiaries
Selected Operating Data
(In thousands, except per share amounts)
(Unaudited)
 

Quarter Ended


Nine Months Ended

September 30,


September 30,

2020


2019


2020


2019

 
Operating revenues

$

348,647

$

243,626

$

988,700

$

663,650

Operations and maintenance expense

$

136,174

$

82,022

$

371,415

$

247,781

 
Net income

$

55,732

$

88,489

$

182,142

$

160,316

 
Basic net income per common share

$

0.22

$

0.38

$

0.73

$

0.76

Diluted net income per common share

$

0.22

$

0.38

$

0.71

$

0.76

 
Basic average common shares outstanding


254,280


232,053


248,212


209,971

Diluted average common shares outstanding


255,162


232,464


255,139


210,335

Essential Utilities, Inc. and Subsidiaries
Consolidated Statement of Income
(In thousands, except per share amounts)
(Unaudited)
 

Quarter Ended


Nine Months Ended

September 30,


September 30,

2020

2019


2020

2019

 
Operating revenues

$

348,647


$

243,626


$

988,700


$

663,650


Cost & expenses:
Operations and maintenance


136,174


82,022


371,415


247,781


Purchased gas


16,744


-


72,934


-


Depreciation


68,175


39,489


181,666


118,113


Amortization


1,766


444


4,412


(2,140

)

Taxes other than income taxes


20,555


15,201


56,424


45,038


Total


243,414


137,156


686,851


408,792


Operating income


105,233


106,470


301,849


254,858


Other expense (income):
Interest expense


49,861


32,643


136,650


92,239


Interest income


(114

)


(9,680

)


(5,346

)


(18,117

)

Allowance for funds used during construction


(3,543

)


(4,613

)


(8,721

)


(12,280

)

Change in fair value of interest rate swap agreements


-


-


-


23,742


Loss on debt extinguishment


-


-


-


18,920


Gain on sale of other assets


(233

)


(175

)


(358

)


(443

)

Equity loss (earnings) in joint venture


3,626


(135

)


3,283


(1,918

)

Other


(4,127

)


1,494


(3,170

)


4,293


Income before income taxes


59,763


86,936


179,511


148,422


Provision for income taxes (benefit)


4,031


(1,553

)


(2,631

)


(11,894

)

Net income

$

55,732


$

88,489


$

182,142


$

160,316


Net income per common share:
Basic

$

0.22


$

0.38


$

0.73


$

0.76


Diluted

$

0.22


$

0.38


$

0.71


$

0.76


Average common shares outstanding:
Basic


254,280


232,053


248,212


209,971


Diluted


255,162


232,464


255,139


210,335


Essential Utilities, Inc. and Subsidiaries
Reconciliation of GAAP to Non-GAAP Financial Measures
(In thousands, except per share amounts)
(Unaudited)

The Company is providing disclosure of the reconciliation of the non-GAAP financial measures to the most comparable GAAP financial measures. The Company believes that the non-GAAP financial measures "adjusted operating revenues," "adjusted income," and "adjusted income per common share" provide investors the ability to measure the Company’s financial operating performance by adjustment, which is more indicative of the Company’s ongoing performance and is more comparable to measures reported by other companies. The Company further believes that the presentation of these non-GAAP financial measures is useful to investors as a more meaningful way to compare the Company’s operating performance against its historical financial results.

This reconciliation includes a presentation of the non-GAAP financial measures "adjusted operating revenues," “adjusted income,” and “adjusted income per common share” and have been adjusted for the following items:

(1) Transaction-related water rate credits issued to Pennsylvania utility customers in September 2020.

(2) Transaction-related expenses for the Company's Peoples acquisition that closed on March 16, 2020, which consists of costs of $2,496 recorded as operations and maintenance expenses for the three months ended September 30, 2019 and $25,397 and $21,886 for the nine months ended September 30, 2020 and 2019, respectively, primarily representing expenses associated with investment banking fees, obtaining regulatory approvals, legal expenses, and integration planning. Additionally included in transaction-related expenses for the nine months ended September 30, 2019 are mark-to-market fair value adjustments of $23,742 associated with interest rate swap agreements for debt issued related to the Peoples transaction. The interest rate swap agreements were settled on April 24, 2019, which coincided with the debt financings to partially fund the Peoples acquisition. Further, expenses of $871 for the three months ended September 30, 2019 and $19,825 for the nine months ended September 30, 2019 associated with the refinancing of existing debt that occurred in May 2019 are included in transaction-related expenses;

(3) In order to illustrate the full-year 2020 effects of the Peoples acquisition as if this transaction closed on January 1, 2020, this adjustment includes both the estimated impact of Peoples Gas pre-tax operating results for the period in 2020 prior to closing from January 1, 2020 to March 15, 2020, as well as the additional net interest expense expected to have been incurred for partially funding the estimated purchase price of Peoples;

(4) Pre-acquisition interest expense of $4,757, net of interest income of $2,757, for the three months ended September 30, 2019 and $8,249, net of interest income of $4,931 for the nine months ended September 30, 2019, commencing in the second quarter of 2019 for funds borrowed prior to the completion of the Company's Peoples acquisition on March 16, 2020;

(5) On April 26, 2019, the Company issued $313,500 of notes so as to complete an early extinguishment of $313,500 of existing debt on May 18, 2019. The Company incurred overlapping interest expense during this 22-day period of $858, net of interest income earned of $406, on the borrowed funds, and considers this overlapping net interest expense of $452 to be a transaction-related expense;

(6) Interest income earned on the proceeds received from our April 2019 equity offerings of common shares and tangible equity units prior to the completion of the Company's Peoples acquisition on March 16, 2020;

(7) The income tax impact of the non-GAAP adjustments described above; and

(8) The effect on average diluted shares outstanding of the shares issued in April 2019 for our common share and tangible equity unit issuances prior to the completion of the Company's Peoples acquisition on March 16, 2020.

These financial measures are measures of the Company’s operating performance that do not comply with U.S. generally accepted accounting principles (GAAP), and are thus considered to be “non-GAAP financial measures” under applicable Securities and Exchange Commission regulations. These non-GAAP financial measures are derived from our consolidated financial information, if available, and is provided to supplement the Company's GAAP measures, and should not be considered as a substitute for measures of financial performance prepared in accordance with GAAP.

The following reconciles our GAAP results to the non-GAAP information we disclose :

Quarter Ended


Nine Months Ended

September 30,


September 30,


2020


2019


2020


2019

Operating revenues (GAAP financial measure)

$

348,647


$

243,626


$

988,700


$

663,650


(1) Transaction-related water rate credits issued to utility customers


4,080


-


4,080


-


Adjusted operating revenues (Non-GAAP financial measure)

$

352,727


$

243,626


$

992,780


$

663,650


Net income (GAAP financial measure)

$

55,732


$

88,489


$

182,142


$

160,316


(1) Transaction-related water rate credits issued to utility customers


4,080


-


4,080


-


(2) Transaction-related expenses for the Peoples transaction closed March 16, 2020


-


3,367


25,573


65,453


(3) Adjustments to provide full-year 2020 run rate of Peoples operating results, including additional net interest expense


-


-


108,132


-


(4) Pre-acquisition interest expense for funds borrowed for acquisition of Peoples, net


-


2,000


-


3,318


(5) Overlapping interest expense on refinanced debt


-


-


-


452


(6) Interest income earned on proceeds from April 2019 equity offerings


-


(9,071

)


-


(16,479

)

(7) Income tax effect of non-GAAP adjustments


(1,179

)


810


(32,982

)


(10,926

)

Adjusted income (Non-GAAP financial measure)

$

58,633


$

85,595


$

286,945


$

202,134


Net income per common share (GAAP financial measure):
Basic

$

0.22


$

0.38


$

0.73


$

0.76


Diluted

$

0.22


$

0.38


$

0.71


$

0.76


Adjusted income per common share (Non-GAAP financial measure):
Diluted

$

0.23


$

0.48


$

1.12


$

1.13


Average common shares outstanding:
Basic


254,280


232,053


248,212


209,971


Diluted


255,162


232,464


255,139


210,335


Average common shares outstanding:
Shares used in calculating diluted net income per common share


255,162


232,464


255,139


210,335


(8) Less: Adjustment for effects of April 2019 common share issuance


-


(37,370

)


-


(22,039

)

(8) Less: Adjustment for effects of April 2019 tangible equity unit issuance


-


(16,270

)


-


(9,595

)

Shares used in calculating adjusted diluted income per common share (Non-GAAP financial measure)


255,162


178,824


255,139


178,701


Contacts

Brian Dingerdissen
Essential Utilities Inc.
Investor Relations
O: 610.645.1191
This email address is being protected from spambots. You need JavaScript enabled to view it.

Gretchen Toner
Communications and Marketing
484.368.4816
This email address is being protected from spambots. You need JavaScript enabled to view it.


Read full story here

EDISON, N.J.--(BUSINESS WIRE)--Eos Energy Storage LLC (“Eos”), a leading manufacturer of safe, reliable, low-cost zinc battery storage systems, today announced that it has signed a broad-ranging agreement to provide over 1 GWh of energy storage projects at an estimated value of more than $250 million to Hecate Energy (“Hecate”), a leading global developer, owner and operator of solar, natural gas, wind, and energy-storage projects.


Eos will design, manufacture, and deliver its zinc-based battery solutions to Hecate over the course of the next 24 months across Colorado, New Mexico, and Texas. The projects are a mix of standalone battery storage and storage paired with solar photovoltaics (“PV”) for renewable energy capacity. The announcement of the agreement with Hecate further expands Eos’ pipeline commitments to 3 GWh and, upon the completion of several customary closing conditions, purchase orders from Hecate are expected in the next six to nine months.

These projects are indicative of the shifting dynamics of the energy storage market from shorter duration systems, which are commonly used for quick response power (such as frequency regulation or peak shaving), to longer duration systems, which are much better suited for improving overall grid resiliency and capacity-firming purposes.

“We are excited to be working with a top-tier developer like Hecate,” said Joe Mastrangelo, Chief Executive Officer at Eos. “During the last 18 months, we have been intensely focused on operationalizing our company and bringing our low-cost, nontoxic, nonflammable, zinc-based battery solutions to the marketplace. The investment in our state-of-the-art manufacturing facility in Pittsburgh, PA is paying dividends as we are processing battery orders from customers all over the world. This agreement with Hecate is another significant milestone in our company’s tremendous growth and, importantly, it’s further confirmation that major energy developers are increasingly searching for lower cost and competitive non-lithium options like ours for major projects. Our tangible pipeline has grown by over 70 percent in the last several months and we look forward to continuing this positive commercial momentum.”

“Hecate is thrilled to work with Eos,” said Fazli Qadir, Chief Technology Officer of Hecate Energy. “Eos’ technology is a great fit for the longer-duration application requirements of these projects, and we’re excited by the ability of Eos’ solutions to flexibly operate across a range of use cases that are front and center in the energy industry.”

Eos’ zinc-based battery systems are made in the United States and were designed specifically for the stationary storage market. They are unique for their scalable design, ability to withstand extreme temperatures, widely available and non-rare earth materials, and full recyclability. The system is also a cost-effective energy storage solution, with a 15-year to 30-year life and minimal installation and maintenance costs.

As previously announced, B. Riley Principal Merger Corp. II (“BMRG”), a publicly traded special purpose acquisition company, and Eos have entered into a definitive merger agreement for a business combination that would result in Eos becoming a publicly listed company. Upon closing of the transaction, the combined company will be renamed Eos Energy Enterprises, Inc. (“Eos Energy”) and intends to list its shares of common stock on Nasdaq under the ticker symbol “EOSE”.

About Eos Energy Storage LLC

At Eos, we are on a mission to accelerate clean energy by deploying stationary storage solutions that can help deliver the reliable and cost-competitive power that the market expects in a safe and environmentally sustainable way. Eos has been pursuing this opportunity since 2008 when it was founded. Eos has more than 10 years of experience in battery storage testing, development, deployment, and operation. The Eos Aurora® system integrates Eos’ aqueous, Znyth® technology to provide a safe, scalable, and sustainable alternative to lithium-ion. https://eosenergystorage.com

About Hecate Energy

Headquartered in Chicago, Illinois, Hecate Energy is a leading developer, owner and operator of utility scale solar, wind and energy storage projects. Over the last 8 years, Hecate has developed and built hundreds of megawatts of operating renewable projects totaling over $1 billion in asset value, and has entered into more than 1 GW of renewable energy PPAs. Hecate has leveraged its extensive knowledge of power markets, energy development and operations experience to become one of the fastest growing renewable energy companies in the United States. The company is in offtake negotiations for over an additional 2GW of new solar projects, with a mid-stage pipeline of about 12 GW of projects under development, and an active pipeline in excess of 20 GW. https://www.hecateenergy.com/

About B. Riley Principal Merger Corp. II

BMRG was formed for the purpose of effecting a merger, share exchange, asset acquisition, share purchase, reorganization or similar business combination with one or more businesses.

Additional Information about the Business Combination

In connection with the business combination, BMRG has filed a definitive proxy statement with the United States Securities and Exchange Commission (“SEC”). BMRG stockholders and other interested persons are advised to read the definitive proxy statement, in connection with BMRG’s solicitation of proxies for the meeting of stockholders to be held to approve, among other things, the proposed business combination, because the proxy statement will contain important information about BMRG, Eos and the proposed business combination. The definitive proxy statement has been mailed to BMRG stockholders as of the record date established for voting on the proposed business combination. Stockholders can obtain copies of the proxy statement, without charge at the SEC’s website at www.sec.gov. Copies of the documents filed with the SEC by BMRG when and if available, can be obtained free of charge by directing a written request to B. Riley Principal Merger Corp. II, 299 Park Avenue, 21st Floor, New York, New York 10171 or by telephone at (212) 457-3300.


Contacts

For Eos Energy Storage LLC

Investors
Ed Yuen
This email address is being protected from spambots. You need JavaScript enabled to view it.

Media
James McCusker
This email address is being protected from spambots. You need JavaScript enabled to view it.

KANSAS CITY, Mo.--(BUSINESS WIRE)--Kansas City Southern (KCS) (NYSE: KSU) Executive Vice President and Chief Financial Officer, Michael W. Upchurch, will address the Stephens Annual Investment Conference 2020 at 8:00 a.m. eastern time on Tuesday, November 17, 2020. Interested investors not attending the conference may listen to the presentation via a simultaneous webcast on KCS’ website at http://investors.kcsouthern.com. A link to the replay will be available following the event.


Headquartered in Kansas City, Mo., Kansas City Southern (KCS) (NYSE: KSU) is a transportation holding company that has railroad investments in the U.S., Mexico and Panama. Its primary U.S. holding is The Kansas City Southern Railway Company, serving the central and south central U.S. Its international holdings include Kansas City Southern de Mexico, S.A. de C.V., serving northeastern and central Mexico and the port cities of Lázaro Cárdenas, Tampico and Veracruz, and a 50 percent interest in Panama Canal Railway Company, providing ocean-to-ocean freight and passenger service along the Panama Canal. KCS' North American rail holdings and strategic alliances are primary components of a railway network, linking the commercial and industrial centers of the U.S., Mexico and Canada. More information about KCS can be found at www.kcsouthern.com.


Contacts

KCS: Ashley Thorne, 816-983-1530, This email address is being protected from spambots. You need JavaScript enabled to view it.

DUBLIN--(BUSINESS WIRE)--The "Carbon Capture, Utilization, and Storage Market by Service (Capture, Transportation, Utilization, Storage), End-Use Industry (Oil & Gas, Iron & Steel, Cement, Chemical & Petrochemical, Power Generation), and Region - Global Forecast to 2025" report has been added to ResearchAndMarkets.com's offering.


The global carbon capture, utilization, and storage market size is expected to grow from USD 1.6 billion in 2020 to USD 3.5 billion by 2025, at a CAGR of 17.0% during the forecast period.

Carbon capture, utilization, and sequestration is extensively used in oil & gas, power generation, fertilizer, and various other sectors. Increasing usage of captured carbon for enhanced oil recovery operations in the oil & gas industry is laying a key role behind the growth of CCUS market.

Capture segment to dominate the market in terms of value.

The Capture segment holds the majority of the share in the CCUS market. Carbon capture is the first stage of the CCUS process and involves capturing CO2 from its emission source. It can be applied to any large-scale emission process, including coal-fired power generation plants; gas and oil production; and manufacturing industries, such as cement, iron, and steel. The cost of capturing CO2 is heavily dependent on technical, economic, and financial factors associated with the design and operation of the production process, along with the design and operation of the CO2 capture technology

Power Generation is the fastest-growing segment in the market in terms of value.

Fossil fuel power plants generate significant amounts of CO2 emissions into the atmosphere, which are believed to be the main cause of climate change. And Power Generation industry is projected to be the fastest-growing segment in the carbon capture, utilization, and sequestration market. Various upcoming CCUS equipped projects in the power generation sector, such as Project TUNDRA (US), Cal Capture Project (US), CLEAN GAS project (UK), and Korea CCS (APAC) are the major driver the behind the high growth in the segment.

Europe is the fastest-growing carbon capture, utilization, and sequestration, in terms of volume.

Europe is projected to be the fastest-growing carbon capture, utilization, and sequestration market during the forecast period. Norway has been very active in curbing carbon emissions since 1990. The upcoming projects in the Netherlands and the UK are also projected to drive the market in the region. Norway Full Chain (Norway), Caledonia Clean (UK), Hynet North West (UK), and Por of Rotterdam (Also known as PORTHOS) (Netherlands) are few projects that are scheduled to start before 2025 an are the major reason behind the high growth of CCUS market in Europe.

Market Dynamics

Drivers

  • Growing Focus On Reducing Co2 Emissions
  • Government Support
  • Increasing Demand For Co2-Eor Techniques

Restraints

  • High Cost Of Carbon Capture And Sequestration
  • Decreasing Crude Oil Prices

Opportunities

  • Large Number Of Upcoming Projects In APAC
  • Continuous Investments In Developing Innovative Capturing Technologies Enabling Economic Operations

Challenges

  • Reducing Co2 Capturing Costs
  • Safety Concerns At Storage Sites

Companies Mentioned

  • Royal Dutch Shell Plc
  • Fluor Corporation
  • Mitsubishi Heavy Industries, Ltd.
  • Linde Plc
  • Exxon Mobil Corporation
  • JGC Holdings Corporation
  • Schlumberger Limited
  • Aker Solutions
  • Honeywell International Inc.
  • Halliburton
  • Hitachi, Ltd.
  • Siemens AG
  • General Electric
  • Total S.A.
  • Equinor ASA
  • C-Capture Ltd.
  • Tandem Technical
  • Carbicrete
  • Climeworks Ag
  • Carbon Clean
  • Newlight Technologies, Inc.
  • Electrochaea Gmbh
  • Carbonfree Chemicals
  • Carbon Engineering, Ltd.
  • Green Minerals

For more information about this report visit https://www.researchandmarkets.com/r/mt9tua


Contacts

ResearchAndMarkets.com
Laura Wood, Senior Press Manager
This email address is being protected from spambots. You need JavaScript enabled to view it.

For E.S.T Office Hours Call 1-917-300-0470
For U.S./CAN Toll Free Call 1-800-526-8630
For GMT Office Hours Call +353-1-416-8900

HOUSTON--(BUSINESS WIRE)--Waste Management (NYSE: WM) announced today that it will redeem the entire outstanding principal amount of its 4.60% Senior Notes due 2021 (the “Notes”). The redemption date for the Notes is December 3, 2020 (the “Redemption Date”). The aggregate principal amount of the Notes outstanding is $400 million. The redemption price for the Notes is equal to 100% of the aggregate principal amount of the Notes, plus accrued and unpaid interest on the Notes to, but not including, the Redemption Date.


Notices of redemption are being sent to all currently registered holders of the Notes. For more information, holders of the Notes may call The Bank of New York Mellon Trust Company, N.A., the Trustee, at 1-800-254-2826. This press release is not an offer to sell or a solicitation of an offer to buy any securities.

ABOUT WASTE MANAGEMENT
Waste Management, based in Houston, Texas, is the leading provider of comprehensive waste management environmental services in North America. Through its subsidiaries, Waste Management provides collection, transfer, disposal services, and recycling and resource recovery. It is also a leading developer, operator and owner of landfill gas-to-energy facilities in the United States. The Company’s customers include residential, commercial, industrial, and municipal customers throughout North America. To learn more information about Waste Management, visit www.wm.com.

FORWARD-LOOKING STATEMENT
This press release contains forward-looking statements that involve risks and uncertainties. Factors that could cause actual results to differ materially from those expressed or implied by the forward-looking statements in this press release are discussed in Waste Management’s most recent Annual Report on Form 10-K and subsequent reports on Form 10-Q.


Contacts

Waste Management
Web site
https://www.wm.com

Analysts
Ed Egl
713.265.1656
This email address is being protected from spambots. You need JavaScript enabled to view it.

Media
Janette Micelli
602.579.6152
This email address is being protected from spambots. You need JavaScript enabled to view it.

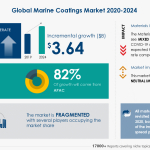
LONDON--(BUSINESS WIRE)--#GlobalMarineCoatingsMarket--According to the latest report published by Technavio, the marine coatings market size is poised to grow by USD 3.64 billion during 2020-2024, progressing at a CAGR of almost 6% during the forecast period.


The report offers an up-to-date analysis regarding the current market scenario, the latest trends and drivers, and the overall market environment facing direct and indirect COVID-19 impact.

To learn more about the global trends impacting the future of market research, download a free sample now

Market Competitive Analysis:

The market is fragmented due to the presence of marine coatings manufacturing companies. Akzo Nobel NV, BASF SE, and Chugoku Marine Paints Ltd. are some of the major market participants.

  • Although the development in technology based on the regulations will offer immense growth opportunities, the fluctuating raw material prices will challenge the growth of the market participants. To make the most of the opportunities, market vendors should focus more on the growth prospects in the fast-growing segments, while maintaining their position in the slow-growing segments.
  • To help clients improve their market position, this marine coatings market forecast report provides a detailed analysis of the market leaders. It offers information on the competencies and capacities of these companies.
  • The report also covers details on the market's competitive landscape and offers information on the products offered by various companies. Moreover, this marine coatings market analysis report also provides information on the upcoming trends and challenges that will influence market growth.

This will help companies create strategies to make the most of their future growth opportunities.

Buy 1 Technavio report and get the second for 50% off. Buy 2 Technavio reports and get the third for free.

View market snapshot before purchasing

This report provides information on the production, sustainability, and prospects of several leading companies, including:

  • Akzo Nobel NV
  • BASF SE
  • Chugoku Marine Paints Ltd.
  • DuPont de Nemours Inc.
  • Hempel AS
  • Nippon Paint Holdings Co. Ltd.
  • Orkla ASA
  • PPG Industries Inc.
  • The Carlyle Group Inc.
  • The Sherwin-Williams Co.

Global Marine Coatings Market: COVID-19 Impact Analysis

Market Impact:

As the business impact of COVID-19 spreads, the global marine coatings market 2020-2024 is expected to have an at par growth.

Industry Impact:

The materials industry is expected to have a mixed impact due to the spread of the COVID-19 virus. The materials market will have a direct impact due to the spread. Even if the spread of the virus is contained, we expect that it may take more than two quarters (six months) to reach a normal state of economic activity.

Register for a free trial today and gain instant access to 17,000+ market research reports.
Technavio's SUBSCRIPTION platform

Key Highlights of the Report for 2020-2024:

  • CAGR of the market during the forecast period 2019-2024
  • Detailed information on factors that will drive marine coatings market growth during the next five years
  • Precise estimation of the marine coatings market size and its contribution to the parent market
  • Accurate predictions on upcoming trends and changes in market dynamics
  • The growth of the marine coatings industry across APAC, Europe, MEA, North America, and South America
  • A thorough analysis of the market's competitive landscape and detailed information on vendors
  • Comprehensive details of factors that will challenge the growth of marine coatings market vendors

Download a free sample of the report with COVID-19 crisis and recovery analysis.

Executive Summary

Market Landscape

  • Market ecosystem
  • Value chain analysis

Market Sizing

  • Market definition
  • Market segment analysis
  • Market size 2019
  • Market outlook: Forecast for 2019 - 2024

Five Forces Analysis

  • Five forces summary
  • Bargaining power of buyers
  • Bargaining power of suppliers
  • Threat of new entrants
  • Threat of substitutes
  • Threat of rivalry
  • Market condition

Market Segmentation by Application

  • Market segments
  • Comparison by Application
  • Coastal - Market size and forecast 2019-2024
  • Deepsea - Market size and forecast 2019-2024
  • Containers - Market size and forecast 2019-2024
  • Offshore house - Market size and forecast 2019-2024
  • Others - Market size and forecast 2019-2024
  • Market opportunity by Application

Market Segmentation by Type

  • Market segments
  • Comparison by Type
  • Anti-corrosive - Market size and forecast 2019-2024
  • Anti-fouling - Market size and forecast 2019-2024
  • Others - Market size and forecast 2019-2024
  • Market opportunity by Type

Market Segmentation by Chemistry

  • Market segments
  • Comparison by Chemistry
  • Epoxy - Market size and forecast 2019-2024
  • Polyurethane - Market size and forecast 2019-2024
  • Others - Market size and forecast 2019-2024
  • Market opportunity by Chemistry

Customer landscape

Geographic Landscape

  • Geographic segmentation
  • Geographic comparison
  • APAC - Market size and forecast 2019-2024
  • Europe - Market size and forecast 2019-2024
  • North America - Market size and forecast 2019-2024
  • MEA - Market size and forecast 2019-2024
  • South America - Market size and forecast 2019-2024
  • Key leading countries
  • Market opportunity by geography
  • Market drivers
  • Market challenges
  • Market trends

Vendor Landscape

  • Overview
  • Vendor landscape
  • Landscape disruption

Vendor Analysis

  • Vendors covered
  • Market positioning of vendors
  • Akzo Nobel NV
  • BASF SE
  • Chugoku Marine Paints Ltd.
  • DuPont de Nemours Inc.
  • Hempel AS
  • Nippon Paint Holdings Co. Ltd.
  • Orkla ASA
  • PPG Industries Inc.
  • The Carlyle Group Inc.
  • The Sherwin-Williams Co.

Appendix

  • Scope of the report
  • Currency conversion rates for US$
  • Research methodology
  • List of abbreviations

About Us
Technavio is a leading global technology research and advisory company. Their research and analysis focuses on emerging market trends and provides actionable insights to help businesses identify market opportunities and develop effective strategies to optimize their market positions. With over 500 specialized analysts, Technavio’s report library consists of more than 17,000 reports and counting, covering 800 technologies, spanning across 50 countries. Their client base consists of enterprises of all sizes, including more than 100 Fortune 500 companies. This growing client base relies on Technavio’s comprehensive coverage, extensive research, and actionable market insights to identify opportunities in existing and potential markets and assess their competitive positions within changing market scenarios.


Contacts

Technavio Research
Jesse Maida
Media & Marketing Executive
US: +1 844 364 1100
UK: +44 203 893 3200
Email: This email address is being protected from spambots. You need JavaScript enabled to view it.
Website: www.technavio.com/

RICHMOND, Va.--(BUSINESS WIRE)--Synalloy Corporation (Nasdaq: SYNL) plans to announce its third quarter 2020 earnings results in a press release that will be issued before the market opens on Monday, November 9, 2020. Following the earnings release, Synalloy will conduct a conference call and webcast at 9:00 AM EDT to discuss the earnings results. Interested parties may listen to this discussion by calling 1 (877) 303-6648; Conference ID code 4682214. The conference call will be webcast live through Synalloy's website at www.synalloy.com under the Investor Relations tab.


The webcast archive of the conference call will be available by 12:00 PM ET on November 12, 2020 on Synalloy's website at www.synalloy.com under the Investor Relations tab.

Synalloy Corporation (Nasdaq: SYNL) is a growth oriented company that engages in a number of diverse business activities including the production of stainless steel and galvanized pipe and tube, the master distribution of seamless carbon pipe and tube, and the production of specialty chemicals. For more information about Synalloy Corporation, please visit our website at www.synalloy.com.

Forward-Looking Statements

Statements included herein that are not historical in nature, are intended to be, and are hereby identified as "forward-looking statements" within the meaning of federal securities laws. These forward-looking statements are based on current expectations, estimates and projections about our industry, our business, our customer relationships, management's beliefs and assumptions made by management. These forward-looking statements are not guarantees of future performance and are subject to risks, uncertainties and assumptions that are difficult to predict and, in many cases, are beyond the control or knowledge of management. Therefore, actual results may differ materially from those expressed or forecasted in such forward-looking statements. We undertake no obligation to publicly update or revise forward-looking statements, whether as a result of new information, future events or otherwise. Additional information concerning some of the factors that could cause materially different results is included in our reports on Forms 10-K, 10-Q and 8-K filed with the Securities and Exchange Commission. Such reports are available from the Securities and Exchange Commission's public reference facilities and its website, http://www.sec.gov.

For more information about Synalloy Corporation, please visit our web site at www.synalloy.com.


Contacts

Sally Cunningham, (804) 822-3267


AMES, Iowa--(BUSINESS WIRE)--Renewable Energy Group, Inc. (NASDAQ:REGI) today announced that its management team will present at Baird 2020 Virtual Global Industrial Conference on November 12, 2020, at 9:40 AM ET.


The Company will also host virtual investor meetings throughout the day. Attendance at the conference is by invitation only for clients of Baird. Interested investors should contact your Baird sales representative to secure a meeting time.

About Renewable Energy Group

Renewable Energy Group, Inc. (NASDAQ: REGI) is leading the energy industry's transition to sustainability by transforming renewable resources into high quality, cleaner fuels. REG is North America’s largest producer of biodiesel and an industry leading producer of renewable diesel. REG solutions are alternatives for petroleum diesel and produce significantly lower carbon emissions. REG utilizes a global integrated procurement, distribution and logistics network to operate 13 biorefineries in the U.S. and Europe. In 2019, REG produced 495 million gallons of cleaner fuel delivering over 4.2 million metric tons of carbon reduction. REG is meeting the growing global demand for lower-carbon fuels and leading the way to a more sustainable future.


Contacts

Investor Relations:
Renewable Energy Group
Todd Robinson
Treasurer
+1 (515) 239-8048
This email address is being protected from spambots. You need JavaScript enabled to view it.

HOUSTON--(BUSINESS WIRE)--Tidewater Inc. (NYSE:TDW) (the “Company”) today announced it is soliciting consents (the “Consent Solicitation”) from holders (the “Holders”) of its outstanding 8.00% Senior Secured Notes due 2022 (the “Notes”) to approve a waiver under and amendments to the indenture relating to the Notes (the “Indenture”, and such waiver and amendments collectively, the “Proposed Amendments”). The Proposed Amendments would increase the Company’s operational and financial flexibility given its financial and liquidity position. Adoption of the Proposed Amendments requires the consent of Holders of at least a majority of the outstanding aggregate principal amount of the Notes (the “Requisite Consents”).


The Company also announced today that it is concurrently commencing (i) a tender offer to purchase up to $50,000,000 aggregate principal amount of the Notes through a cash tender offer, subject to receipt of the Requisite Consents in the Consent Solicitation (the “Tender Offer”), and (ii) a tender offer to purchase up to $28,705,881 aggregate principal amount of the Notes through a cash tender offer under the provisions of the Indenture which require the Company to make a cash offer to the holders of the Notes (“Holders”) within 60 days of the date that the Company realizes proceeds from Asset Sales (as defined in the Indenture) in excess of $25 million (the “Asset Sale Offer”). On September 14, 2020, this $25 million threshold was exceeded, triggering the Company’s obligation to commence the Asset Sale Offer no later than November 13, 2020. If the Requisite Consents in the Consent Solicitation are obtained, the Company plans to complete the Tender Offer and to terminate the Asset Sale Offer. Alternatively, if the Requisite Consents in the Consent Solicitation are not obtained, the Company plans to terminate the Tender Offer and complete the Asset Sale Offer.

Certain information regarding the Notes is set forth in the table below.

Title of Security


CUSIP/ISIN Number


Principal Amount
Outstanding

8.00% Senior Secured Notes due 2022


88642RAA7/
US88642RAA77


$197,049,428

The Consent Solicitation

The Consent Solicitation will expire at 5:00 p.m., New York City time, on November 17, 2020, unless the Company extends it at its sole discretion (such date and time, as it may be extended, the “Solicitation Expiration Time”). The Company anticipates that the effective time of the Proposed Amendments (the “Effective Time”) will occur promptly after the receipt of the Requisite Consents at or prior to the Solicitation Expiration Time. The Effective Time may be prior to the Solicitation Expiration Time, and Holders will not be given prior notice of the Effective Time. Consents that have been validly delivered may be validly revoked until, but not after, the Effective Time. The Proposed Amendments will become operative upon payment of the Consent Payment (as defined below), subject to the satisfaction of all other conditions of the Consent Solicitation. If the Proposed Amendments are approved, the amendments will be binding on all Holders, including those that did not deliver their consent, but only Holders delivering valid and unrevoked consents on or prior to the Solicitation Expiration Time will receive a Consent Payment as described below. The Consent Solicitation is contingent upon the satisfaction of certain conditions, including the receipt of the Requisite Consents at or prior to the Solicitation Expiration Time. The Company may amend, extend or terminate the Consent Solicitation in its sole discretion and subject to applicable law.

The Company is offering to pay each Holder who validly consents and does not revoke such consent prior to the Solicitation Expiration Time a consent payment of $2.50 in cash per $1,000 in principal amount of Notes (the “Consent Payment”) for such Notes whose consents has validly delivered in the manner described in the Consent Solicitation Statement, subject to satisfaction or waiver of all conditions to the Consent Solicitation. No portion of the Consent Payment will be payable with respect to any Consents received after the Solicitation Expiration Time.

For a complete statement of the terms and conditions of the Consent Solicitation and the proposed amendments to the Indenture, Holders should refer to the Consent Solicitation Statement. Questions concerning the terms of the Consent Solicitation should be directed to Deutsche Bank Securities Inc., the Solicitation Agent, at (toll-free) (855) 287-1922 or (collect) (212) 250-7527. D.F. King & Co., Inc. has been retained to serve as the information agent for the Consent Solicitation. Requests for copies of the Consent Solicitation Statement should be directed to D.F. King & Co., Inc. at (toll-free) (866) 751-6313 or (collect) (212) 269-5550 or email: This email address is being protected from spambots. You need JavaScript enabled to view it..

The Tender Offer

The Tender Offer will expire at 11:59 p.m., New York City time, on December 2, 2020 (such date and time, as it may be extended, the “Tender Offer Expiration Date”), unless earlier terminated. Under the terms of the Tender Offer, Holders who validly tender and do not validly withdraw their Notes and consents prior to 5:00 p.m., New York City time, on November 17, 2020, which time and date may be extended (the “Early Tender Time”), will be eligible to receive the “Total Consideration,” which is equal to $1,005.00 per $1,000.00 principal amount of Notes validly tendered. The Total Consideration is equal to the sum of (i) $955.00 per $1,000.00 in principal amount of Notes validly tendered, or the “Tender Offer Consideration,” plus (ii) $50.00 per $1,000.00 in principal amount of the Notes validly tendered, or the “Early Tender Premium.”

Tendered Notes may be withdrawn and the related consents may be revoked at any time prior to 5:00 p.m., New York City time, on November 17, 2020, which time and date may be extended, but not thereafter.

Holders who validly tender their Notes after the Early Tender Time but on or before the Expiration Time will receive only the Tender Offer Consideration.

In both cases, Holders that tender their Notes in the Tender Offer will also be paid accrued and unpaid interest from the most recent interest payment date on the Notes to, but not including, the applicable settlement date.

The completion of the Tender Offer is subject to the satisfaction or waiver of certain conditions that are set forth in the Offer to Purchase, including, among other things, receipt by the Company of the Requisite Consents to approve the Proposed Amendments and the execution and delivery of the new supplemental indenture.

For a complete statement of the terms and conditions of the Tender Offer, Holders should refer to the Offer to Purchase. Questions concerning the terms of the Tender Offer should be directed to Deutsche Bank Securities Inc., the Dealer Manager, at (toll-free) (855) 287-1922 or (collect) (212) 250-7527.

D.F. King & Co., Inc. has been retained to serve as tender agent for the Tender Offer. Requests for copies of the Offer to Purchase should be directed to D.F. King & Co., Inc. at (toll-free) (866) 751-6313 or (collect) (212) 269-5550 or email: This email address is being protected from spambots. You need JavaScript enabled to view it..

The Asset Sale Offer

The Asset Sale Offer will expire at 11:59 p.m., New York City time, on December 2, 2020 unless extended (such time and date, as the same may be extended, the “Expiration Time”). Notes validly tendered and accepted for payment pursuant to the Asset Sale Offer will be purchased at a purchase price equal to the stated principal amount of the Notes (the “Purchase Price”). Holders of Notes must validly tender and not validly withdraw their Notes prior to the Expiration Time to be eligible to receive the Purchase Price. Holders whose Notes are purchased pursuant to the Asset Sale Offer will also receive accrued and unpaid interest thereon (“Accrued Interest”) from the immediately-preceding interest payment date up to, but not including, the initial date of payment of the Purchase Price for such Notes (the “Settlement Date”). The Purchase Price and the Accrued Interest on the Notes purchased pursuant to the Asset Sale Offer will be paid by the Company in immediately-available funds promptly after the expiration of the Asset Sale Offer on the Settlement Date. Assuming the Notes are validly tendered and accepted for purchase at the Expiration Time, the Company currently expects that Notes purchased pursuant to the Asset Sale Offer would be paid for on December 4, 2020.

The completion of the Asset Sale Offer is subject to the satisfaction or waiver of certain conditions that are set forth in the Offer to Purchase. For a complete statement of the terms and conditions of the Asset Sale Offer, Holders should refer to the Offer to Purchase.

Questions and requests for assistance relating to the procedures for tendering Notes or for additional copies of the offer documents, including the Offer to Purchase, should be directed to Wilmington Trust, National Association, the Depositary and Paying Agent, at Rodney Square North, 1100 North Market Street, Wilmington, Delaware 19890-1615, Attention: WorkFlow Management, or DTC Desk (This email address is being protected from spambots. You need JavaScript enabled to view it.). Requests for assistance relating to the terms and conditions of the Offer should be directed to the Company at 6002 Rogerdale Road, Suite 600, Houston, TX 77072, Attention: Treasurer, Telephone: (713) 470-5300. Requests for additional copies of the offer documents may also be directed to your brokers, dealers, commercial banks or trust companies.

Concurrent Transactions

The Consent Solicitation, Tender Offer and Asset Sale Offer are three separate transactions. Each of the transactions will be open to all Holders, and each Holder is free to participate in any of the Tender Offer, the Consent Solicitation and the Asset Sale Offer. However, any Notes tendered in the Tender Offer cannot be tendered in the Asset Sale Offer, and any Notes tendered in the Asset Sale Offer cannot be tendered in the Tender Offer. No Holder is required to tender such Holder’s Notes in the Tender Offer or the Asset Sale Offer, or to provide a consent in the Consent Solicitation and receive the Consent Payment, nor is any Holder required to provide its consent to this Consent Solicitation in order to tender such Holder’s Notes in either the Tender Offer or the Asset Sale Offer and receive the applicable Tender Offer or Asset Sale Offer consideration. This Consent Solicitation is not conditioned on whether some, all or none of the Holders participate in the Tender Offer or the Asset Sale Offer, however, the Company’s acceptance of Notes for payment in the Tender Offer is conditioned, in addition to the satisfaction of other conditions, upon the receipt of Requisite Consents of the Notes in this Consent Solicitation and the execution and delivery of a new Supplemental Indenture giving effect to the Proposed Amendments. The Company intends to terminate (i) the Asset Sale Offer, if the Requisite Consents of the Notes in the Consent Solicitation are received and the Company thereupon expects to complete the execution and delivery of the new Supplemental Indenture giving effect to the Proposed Amendments, or (ii) the Tender Offer, if the Requisite Consents of the Notes are not received in accordance with terms and conditions of the Consent Solicitation.

None of the Company, its subsidiaries or affiliates, the Solicitation Agent, the Dealer Manager, the Information Agent, the Tabulation and Payment Agent or the Depositary and Paying Agent is making any recommendation as to whether holders of the Notes should consent or refrain from consenting to the Proposed Amendments or participate in the Tender Offer or the Asset Sale Offer. Holders must make their own decision as to whether to consent or participate in the Tender Offer or the Asset Sale Offer. This press release is not a solicitation of consents with respect to the Notes and does not constitute an offer to sell or the solicitation of an offer to buy any security and shall not constitute an offer, solicitation or sale in any jurisdiction in which such offering, solicitation or sale would be unlawful. The Consent Solicitation is being made solely by the Consent Solicitation Statement, dated November 3, 2020, which sets forth the complete terms of the Consent Solicitation. The Tender Offer is being made solely by the Offer to Purchase, dated November 3, 2020, which sets forth the complete terms of the Tender Offer. The Asset Sale Offer is being made solely by the Offer to Purchase, dated November 3, 2020, which sets forth the complete terms of the Asset Sale Offer.

Cautionary Statement on Forward-Looking Language

In accordance with the safe harbor provisions of the Private Securities Litigation Reform Act of 1995, Tidewater notes that certain statements set forth in this press release provide other than historical information and are forward looking. The unfolding of future economic or business developments may happen in a way not as anticipated or projected by Tidewater and may involve numerous risks and uncertainties that may cause Tidewater’s actual achievement of any forecasted results to be materially different from that stated or implied in the forward-looking statement. Among those risks and uncertainties, many of which are beyond the control of Tidewater include, without limitation, fluctuations in worldwide energy demand and oil and natural gas prices, and continuing depressed levels of oil and natural gas prices without a clear indication of if, or when, prices will recover to a level to support renewed offshore exploration activities; fleet additions by competitors and industry overcapacity; our limited capital resources available to replenish our asset base, as needed, including through acquisitions or vessel construction, and to fund our capital expenditure needs; uncertainty of global financial market conditions and potential constraints in accessing capital or credit if and when needed with favorable terms, if at all; changes in decisions and capital spending by customers in the energy industry and the industry expectations for offshore exploration, field development and production; consolidation of our customer base; loss of a major customer; changing customer demands for vessel specifications, which may make some of our older vessels technologically obsolete for certain customer projects or in certain markets; rapid technological changes; delays and other problems associated with vessel maintenance; the continued availability of qualified personnel and our ability to attract and retain them; the operating risks normally incident to our lines of business, including the potential impact of liquidated counterparties; our ability to comply with covenants in our indentures and other debt instruments; acts of terrorism and piracy; the impact of regional or global public health crises or pandemics; the impact of potential information technology, cybersecurity or data security breaches; integration of acquired businesses and entry into new lines of business; disagreements with our joint venture partners; natural disasters or significant weather conditions; unsettled political conditions, war, civil unrest and governmental actions, such as expropriation or enforcement of customs or other laws that are not well developed or consistently enforced; the risks associated with our international operations, including local content, local currency or similar requirements especially in higher political risk countries where we operate; interest rate and foreign currency fluctuations; labor changes proposed by international conventions; increased regulatory burdens and oversight; changes in laws governing the taxation of foreign source income; retention of skilled workers; enforcement of laws related to the environment, labor and foreign corrupt practices; the potential liability for remedial actions or assessments under existing or future environmental regulations or litigation; the effects of asserted and unasserted claims and the extent of available insurance coverage; and the resolution of pending legal proceedings; and. Readers should consider all of these risk factors, as well as other information contained in Tidewater’s Form 10-K and Form 10-Qs.

About Tidewater

Tidewater owns and operates the largest fleet of Offshore Support Vessels in the industry, with over 60 years of experience supporting offshore energy exploration and production activities worldwide.

To learn more, visit the Tidewater website at: www.tdw.com.


Contacts

Jason Stanley
Vice President Investor Relations & ESG
+1-713-470-5292
This email address is being protected from spambots. You need JavaScript enabled to view it.

SOURCE: Tidewater Inc.

CHESEAUX-SUR-LAUSANNE, Switzerland & PHOENIX--(BUSINESS WIRE)--#assettracking--The Kudelski Group (SIX: KUD.S), the world leader in digital security and IoT solutions, today announced the availability of its solution for secure, effortless access to vehicles using an authorized mobile phone or other digital key option. A user simply enrolls their device, and once approved by the vehicle manager, gets access and usage rights based on their device’s proximity to the vehicle and any other conditions set by the owner (time, location, vehicle status, etc.). The solution will even work without a cellular connection once rights are given to a device (e.g. in the basement of a parking garage). California-based Canoo is an early adopter of this technology for use in their line of electric vehicles.

In a world where physical keys and cards are increasingly being replaced by digital options, smartphones are emerging as the dominant platform to enable that. Kudelski IoT’s technology allows people to use their smartphones to automatically and securely provide touchless access to valuable assets like vehicles. The solution allows control of who has vehicle access, and exactly when and for how long that access is granted. If authorized, a user can easily share temporary access to the vehicle with another party, like a restaurant valet or a family member, using the associated app. Not only does this lead to increased convenience and security, it empowers companies like Canoo to introduce exciting new business models that have the potential to change the way people use urban transportation.

The solution leverages the Kudelski IoT keySTREAM security stack to enable trusted access commands and Bluetooth Low Energy (BLE) multi-point proximity detection, which is a common technology available in most smart devices today. NFC cards and web portal-based access options are also available.

“COVID-19 has highlighted the need for more touchless access options to vehicles, buildings and other valuable assets. We are very excited that Canoo has given us the opportunity to deliver a solution for their innovative new line of electric vehicles,” said Hardy Schmidbauer, SVP Kudelski IoT. “Our combination of expertise in both security and access control gives our solution an unparalleled level of robustness while delivering on the promise of convenience and ease of use.”

“The Kudelski solution perfectly fits Canoo’s objective of providing disruptive business models such as no-commitment, effortless subscription programs for urban transportation,” said Phil Weicker, In Charge of Propulsion & Electronics at Canoo. “Sharing vehicles among different users would require a highly secure and flexible access solution and the Kudelski team has the experience and the skills that will ensure our success.”

The Kudelski technology can also be applied to smart building and other access control applications to provide the same level of secure access management, control and convenience.


Contacts

Christopher Schouten
Sr. Director - Product Marketing
+1 480 819 5781

DUBLIN--(BUSINESS WIRE)--The "Submarine Batteries - Global Market Trajectory & Analytics" report has been added to ResearchAndMarkets.com's offering.


The publisher brings years of research experience to the 6th edition of this report. The 127-page report presents concise insights into how the pandemic has impacted production and the buy side for 2020 and 2021. A short-term phased recovery by key geography is also addressed.

Global Submarine Batteries Market to Reach $1.3 Billion by 2027

Amid the COVID-19 crisis, the global market for Submarine Batteries estimated at US$921.9 Million in the year 2020, is projected to reach a revised size of US$1.3 Billion by 2027, growing at a CAGR of 5.2% over the analysis period 2020-2027.

SSK, one of the segments analyzed in the report, is projected to record a 4.8% CAGR and reach US$693.9 Million by the end of the analysis period. After an early analysis of the business implications of the pandemic and its induced economic crisis, growth in the SSN segment is readjusted to a revised 5.8% CAGR for the next 7-year period.

The U.S. Market is Estimated at $271.7 Million, While China is Forecast to Grow at 5% CAGR

The Submarine Batteries market in the U.S. is estimated at US$271.7 Million in the year 2020. China, the world's second largest economy, is forecast to reach a projected market size of US$233.2 Million by the year 2027 trailing a CAGR of 5% over the analysis period 2020 to 2027. Among the other noteworthy geographic markets are Japan and Canada, each forecast to grow at 4.7% and 4.4% respectively over the 2020-2027 period. Within Europe, Germany is forecast to grow at approximately 4.9% CAGR.

SSBN Segment to Record 5.4% CAGR

In the global SSBN segment, USA, Canada, Japan, China and Europe will drive the 5.5% CAGR estimated for this segment. These regional markets accounting for a combined market size of US$148.4 Million in the year 2020 will reach a projected size of US$216.3 Million by the close of the analysis period. China will remain among the fastest growing in this cluster of regional markets. Led by countries such as Australia, India, and South Korea, the market in Asia-Pacific is forecast to reach US$147.3 Million by the year 2027.

Competitors identified in this market include, among others:

  • EnerSys
  • Exide Technologies
  • GS Yuasa Corporation
  • HBL Power Systems Ltd.
  • SAFT

Key Topics Covered:

I. INTRODUCTION, METHODOLOGY & REPORT SCOPE

II. EXECUTIVE SUMMARY

1. MARKET OVERVIEW

  • Global Competitor Market Shares
  • Submarine Battery Competitor Market Share Scenario Worldwide (in %): 2019 & 2025
  • Impact of Covid-19 and a Looming Global Recession

2. FOCUS ON SELECT PLAYERS

3. MARKET TRENDS & DRIVERS

4. GLOBAL MARKET PERSPECTIVE

III. MARKET ANALYSIS

IV. COMPETITION

  • Total Companies Profiled: 40

For more information about this report visit https://www.researchandmarkets.com/r/jy7wtu


Contacts

ResearchAndMarkets.com
Laura Wood, Senior Press Manager
This email address is being protected from spambots. You need JavaScript enabled to view it.
For E.S.T Office Hours Call 1-917-300-0470
For U.S./CAN Toll Free Call 1-800-526-8630
For GMT Office Hours Call +353-1-416-8900

PEORIA, Ill.--(BUSINESS WIRE)--#RLI--RLI Corp. (NYSE: RLI) -- RLI Corp. announced today that it has promoted two product leaders to Vice President, effective immediately.


Blake A. Ahrens, Assistant Vice President, Marine has been promoted to Vice President, Inland Marine. In his new role, he will continue to lead RLI’s Inland Marine business. Ahrens has 23 years of industry experience and holds the Chartered Property Casualty Underwriter designation. He joined RLI in 2006 as Director, Underwriting and was promoted to Assistant Vice President, Inland Marine in 2010. Prior to joining RLI, he served in a leadership role at Arthur J. Gallagher. Ahrens holds a bachelor’s degree in economics from Truman State University and a master’s degree from Washington University in St. Louis Olin School of Business.

Bob W. Hartje, Assistant Vice President, Excess Liability, has been promoted to Vice President, Excess Liability. In his new role, he will continue to lead RLI’s Excess Liability business. Hartje has 35 years of industry experience and holds the Associates in Reinsurance designation. He joined RLI in 2013 as Senior Underwriter, and was promoted to Assistant Vice President, Excess Liability in 2018. Prior to RLI, he served in leadership roles at AIX Group, Quanta US Holdings and Aetna. Hartje holds a bachelor’s degree in management from Keene State College.

“Blake and Bob are outstanding leaders that have strong management ability and deep underwriting expertise,” said RLI Insurance Company President & COO Craig Kliethermes. “I am highly confident that they will both continue to further the success of their respective product lines in their enhanced leadership roles.”

ABOUT RLI

RLI Corp. (NYSE: RLI) is a specialty insurer serving niche property, casualty and surety markets. The company provides deep underwriting expertise and superior service to commercial and personal lines customers nationwide. RLI’s products are offered through its insurance subsidiaries RLI Insurance Company, Mt. Hawley Insurance Company and Contractors Bonding and Insurance Company. All of RLI’s subsidiaries are rated A+ “Superior” by AM Best Company. RLI has paid and increased regular dividends for 45 consecutive years and delivered underwriting profits for 24 consecutive years. To learn more about RLI, visit www.rlicorp.com.


Contacts

MEDIA CONTACT
Aaron Diefenthaler
Vice President, Chief Investment Officer & Treasurer
309-693-5846
This email address is being protected from spambots. You need JavaScript enabled to view it.


CANONSBURG, Pa.--(BUSINESS WIRE)--#ETRN--Equitrans Midstream Corporation (NYSE: ETRN), today, announced financial and operational results for the third quarter 2020. Included in the "Non-GAAP Disclosures" section of this news release are important disclosures regarding the use of non-GAAP supplemental financial measures, including information regarding their most comparable GAAP financial measure.


Q3 2020 Highlights:

  • Delivered third quarter 2020 results ahead of guidance
  • Generated $168 million of net income and achieved $282 million of adjusted EBITDA
  • Recorded 68% of total operating revenue from firm reservation fees
  • Raised full-year 2020 adjusted EBITDA and free cash flow guidance

"Our third quarter results demonstrate our ability to generate predictable and stable revenue in any type of operating environment," said Thomas F. Karam, ETRN chairman and chief executive officer. "The transformative actions that we took earlier in the year have allowed us to focus on controlling costs and efficiently deploying capital, which ultimately enables us to strengthen our balance sheet and generate substantial free cash flow."

"Our results also reflect the benefits we are realizing as a result of the new gathering agreement executed earlier this year," said Diana M. Charletta, ETRN president and chief operating officer. "This new agreement allows us to optimize our assets by eliminating redundancies, scheduling efficient construction plans, and safely streamlining operations, all of which lead to meaningful capital reductions."

Charletta continued, "In addition, as our nation continues to navigate the uncertainties of the COVID-19 pandemic, ETRN is proud to play a part in safely transporting critical energy resources during these unprecedented times. By implementing strict pandemic-related working protocols early on, our operations teams have continued to provide safe, reliable, and uninterrupted midstream services for our customers."

THIRD QUARTER 2020 SUMMARY RESULTS

$ millions (except per share metrics)


Net income attributable to ETRN common shareholders

$

149.8


Adjusted net income attributable to ETRN common shareholders

$

135.1


Earnings per diluted share attributable to ETRN common shareholders

$

0.35


Adjusted earnings per diluted share attributable to ETRN common shareholders

$

0.31


Net income

$

168.4


Adjusted EBITDA

$

281.6


Deferred revenue

$

74.6


Net cash provided by operating activities

$

231.2


Free cash flow

$

44.6


Retained free cash flow

$

(20.3)


Net income attributable to ETRN common shareholders for the third quarter 2020 was impacted by a $21.0 million unrealized gain on derivative instruments. The unrealized gain is reported within other income and relates to the contractual agreement with EQT Corporation (EQT) in which ETRN will receive cash from EQT conditioned on the quarterly average of certain Henry Hub natural gas prices exceeding certain thresholds during the three years following the Mountain Valley Pipeline's (MVP) in-service, but in no case extending beyond December 2024. The contract is accounted for as a derivative with the fair value marked-to-market at each quarter-end.

As a result of the gathering agreement with EQT entered into in February 2020, revenue from the contracted minimum volume commitment (MVC) is recognized utilizing an average rate applied over the 15-year contract life. The difference between the cash received from the contracted MVC and the revenue recognized results in the deferral of revenue into future periods. In the third quarter 2020, deferred revenue was $74.6 million.

Operating revenue for the third quarter was lower compared to the same quarter last year by $58.4 million, primarily from the impact of deferred revenue. The reduction in operating revenue was partially offset by increased revenue from higher MVCs. Operating expenses decreased by $297.4 million compared to the third quarter 2019, primarily as a result of a $305.5 million impairment of goodwill in the third quarter 2019. Additionally, operating and maintenance expense decreased versus the prior year quarter while selling, general and administrative and depreciation expense increased.

QUARTERLY DIVIDEND
For the third quarter 2020, ETRN will pay a quarterly cash dividend of $0.15 per common share on November 13, 2020 to ETRN common shareholders of record at the close of business on November 3, 2020.

TOTAL CAPITAL EXPENDITURES AND CAPITAL CONTRIBUTIONS

$ millions


Three Months Ended
September 30, 2020


Nine Months Ended
September 30, 2020


Full-Year 2020
Forecast

MVP


$63


$142


$265 - $275

Gathering(1)


$77


$266


$330 - $340

Transmission(2)


$9


$36


$45 - $55

Water


$3


$8


$15

Headquarters


$1


$3


$5

Total


$153


$455


$660 - $690

(1)

Excludes $13.5 million and $37.1 million of capital expenditures related to noncontrolling interests in Eureka Midstream Holdings, LLC (Eureka) for the three and nine months ended September 30, 2020, respectively. Full-year 2020 forecast excludes approximately $45 million of capital expenditures related to the noncontrolling interests in Eureka.

(2)

Includes capital contributions to Mountain Valley Pipeline, LLC (MVP JV) for the MVP Southgate project.

OUTLOOK

$ millions

Full-Year 2020

Net income attributable to ETRN

$430 - $450

Adjusted EBITDA

$1,200 - $1,220

Deferred revenue

$225

Free cash flow

$320 - $340

Retained free cash flow

$(90) - $(70)

BUSINESS AND PROJECT UPDATES
Outstanding Debt and Liquidity
As of September 30, 2020, ETRN reported $6.4 billion of consolidated long-term debt; $485 million of borrowings and $235 million of letters of credit outstanding under the $3 billion revolving credit facility; and $182.5 million of cash.

Water Services
Water operating income was $10.1 million and water EBITDA was $18.2 million in the third quarter 2020. Water EBITDA is forecast to be approximately $70 - $75 million for the full-year 2020.

Volume Curtailment Update
Third quarter 2020 gathered volumes and revenue were impacted by temporary production curtailments by EQT. The curtailed volumes averaged approximately 570 MMcf per day during the month of September and were brought back online in a phased approach during the first half of October.

Mountain Valley Pipeline
Recently, the MVP JV obtained a number of key permits and authorizations. In September, the MVP JV received the project's new Biological Opinion, and the U.S. Army Corps of Engineers (USACE) approved the project's Nationwide Permit 12 (NWP12); and in early October, the MVP JV received approval from the U.S. Federal Energy Regulatory Commission (FERC) to resume forward construction along the majority of the route. In mid-October, the Fourth Circuit Court of Appeals issued a temporary administrative stay of the project’s NWP12, which prevents construction of waterbody crossings under the USACE's NWP12 program until the Court rules on the full motion to stay. The Court has scheduled oral arguments for November 9 on the full motion to stay. Additionally, in late October, a challenge was filed against the project's new Biological Opinion.

Due to unanticipated delays during the prime 2020 construction seasons resulting from the current inability to complete certain construction work related to the NWP12 and the remaining FERC stop work order related to approximately 25 miles of the project, the MVP JV is targeting a full in-service date for the project during the second half of 2021. The total project cost estimate is $5.8 - $6.0 billion, of which ETRN expects to fund approximately $2.9 billion. As of September 30, 2020, ETRN had funded approximately $2.1 billion. Based on the midpoint of the total project cost estimate, ETRN expects to have an approximate 47.6% ownership interest in MVP and will operate the pipeline.

MVP Southgate
In June 2020, the FERC issued the Certificate of Public Convenience and Necessity for the MVP Southgate project. In August 2020, North Carolina regulators denied the MVP JV's application for a Section 401 water quality certification, which was appealed in September 2020. Project construction is expected to begin in 2021, upon receiving all necessary permits and authorizations, and MVP Southgate is targeted to enter service during 2022. The approximately 75-mile pipeline is expected to receive gas from MVP in Virginia and transport the gas to new delivery points in Rockingham and Alamance Counties, North Carolina. With a total project cost estimate of approximately $450 million to $500 million, MVP Southgate is backed by a 300 MMcf per day firm capacity commitment from Dominion Energy North Carolina and, as designed, the pipeline has expansion capabilities that could provide up to 900 MMcf per day of total capacity. ETRN has a 47.2% ownership interest in MVP Southgate and will operate the pipeline.

Q3 2020 Earnings Conference Call Information
ETRN will host a conference call with security analysts today, November 3, 2020, at 10:30 a.m. (ET) to discuss third quarter 2020 financial results, operating results, and other business matters.

Call Access: All participants must pre-register online, in advance of the call. Upon completion, registered participants will receive a confirmation email that includes instructions for accessing the call, as well as a unique registration ID and passcode. Please pre-register using the appropriate online registration links below:

Security Analysts :: Audio Registration
Your email confirmation will contain dial-in information, along with your unique ID and passcode.

All Other Participants :: Webcast Registration
Your email confirmation will contain the webcast link, along with your unique ID and passcode.

Call Replay: For 14 days following the call, an audio replay will be available at (800) 585-8367 or (416) 621-4642. The ETRN conference ID: 7529126.

ETRN management speak to investors from time-to-time and the presentation for these discussions, which is updated periodically, is available via www.equitransmidstream.com.

NON-GAAP DISCLOSURES
Adjusted Net Income Attributable to ETRN Common Shareholders and Adjusted Earnings per Diluted Share Attributable to ETRN Common Shareholders
Adjusted net income attributable to ETRN common shareholders and adjusted earnings per diluted share attributable to ETRN common shareholders are non-GAAP supplemental financial measures that management and external users of ETRN’s consolidated financial statements, such as investors, may use to make period-to-period comparisons of earnings trends. Management believes that adjusted net income attributable to ETRN common shareholders and adjusted earnings per diluted share attributable to ETRN common shareholders as presented provide useful information for investors for evaluating period-over-period earnings. Adjusted net income attributable to ETRN common shareholders and adjusted earnings per diluted share attributable to ETRN common shareholders should not be considered as alternatives to net income attributable to ETRN common shareholders, earnings per diluted share attributable to ETRN common shareholders or any other measure of financial performance presented in accordance with GAAP. Adjusted net income attributable to ETRN common shareholders and adjusted earnings per diluted share attributable to ETRN common shareholders as presented have important limitations as analytical tools because they exclude some, but not all, items that affect net income attributable to ETRN common shareholders and earnings per diluted share attributable to ETRN common shareholders, including, as applicable, the premium on redemption of a portion of EQM Midstream Partners, LP (EQM) Series A Perpetual Convertible Preferred Units (EQM Series A Preferred Units), separation and other transaction costs, impairments of long-lived assets, changes in the fair value of derivative instruments and loss on early extinguishment of debt, which items affect the comparability of results period to period. The impact of noncontrolling interests is also excluded from the calculations of adjustment items to adjusted net income attributable to ETRN common shareholders, as is the tax impact of non-GAAP items. Additionally, because these non-GAAP metrics may be defined differently by other companies in ETRN's industry, ETRN's definitions of adjusted net income attributable to ETRN common shareholders and adjusted earnings per diluted share attributable to ETRN common shareholders may not be comparable to similarly titled measures of other companies, thereby diminishing the utility of the measures. Adjusted net income attributable to ETRN common shareholders and adjusted earnings per diluted share attributable to ETRN common shareholders should not be viewed as indicative of the actual amount of net income attributable to ETRN common shareholders or actual earnings of ETRN in any given period.

The table below reconciles adjusted net income attributable to ETRN common shareholders and adjusted earnings per diluted share attributable to ETRN common shareholders with net income attributable to ETRN common shareholders and earnings per diluted share attributable to ETRN common shareholders as derived from the statements of consolidated comprehensive income to be included in ETRN’s Quarterly Report on Form 10-Q for the three months ended September 30, 2020.

Reconciliation of Adjusted Net Income Attributable to ETRN Common Shareholders and Adjusted Earnings per Diluted Share Attributable to ETRN Common Shareholders


Three Months Ended September 30,

(Thousands, except per share information)

2020


2019

Net income (loss) attributable to ETRN common shareholders

$

149,838


$

(65,825)


Add back / (deduct):


Separation and other transaction costs

984


256


Impairments of long-lived assets


305,459


Unrealized gain on derivative instruments

(21,005)


Noncontrolling interest impact of non-GAAP items


(96,913)


Tax impact of non-GAAP items(1)

5,265


(54,909)


Adjusted net income attributable to ETRN common shareholders

$

135,082


$

88,068


Diluted weighted average common shares outstanding

432,821


254,915


Adjusted earnings per diluted share attributable to ETRN common shareholders

$

0.31


$

0.35


(1)

The adjustments were tax effected at the Company’s federal and state statutory tax rate for each period.

Adjusted EBITDA
As used in this news release, Adjusted EBITDA means net income, plus income tax expense, net interest expense, loss on early extinguishment of debt (as applicable), depreciation, amortization of intangible assets, impairments of long-lived assets, payments on the preferred interest in EQT Energy Supply, LLC (Preferred Interest), non-cash long-term compensation expense (income), and separation and other transaction costs, less equity income, AFUDC-equity, unrealized gain (loss) on derivative instruments and adjusted EBITDA attributable to noncontrolling interest.

The table below reconciles adjusted EBITDA with net income as derived from the statements of consolidated comprehensive income to be included in ETRN's Quarterly Report on Form 10-Q for the three months ended September 30, 2020.

Reconciliation of Adjusted EBITDA


Three Months Ended September 30,

(Thousands)

2020


2019

Net income (loss)

$

168,439


$

(61,489)


Add:


Income tax expense

28,440


1,948


Net interest expense

86,411


65,606


Depreciation

66,772


59,460


Amortization of intangible assets

16,204


14,540


Impairments of long-lived assets


305,459


Preferred Interest payments

2,765


2,746


Non-cash long-term compensation expense (income)

3,048


(718)


Separation and other transaction costs

984


256


Less:


Equity income

(60,917)


(44,448)


AFUDC – equity

(192)


(474)


Unrealized gain on derivative instruments

(21,005)


Adjusted EBITDA attributable to noncontrolling interest(1)

(9,363)


(9,149)


Adjusted EBITDA

$

281,586


$

333,737


(1)

Reflects adjusted EBITDA attributable to noncontrolling interest associated with the third-party ownership interest in Eureka. Adjusted EBITDA attributable to noncontrolling interest for the three months ended September 30, 2020 was calculated as net income of $4.0 million plus depreciation of $2.8 million, plus amortization of intangible assets of $2.1 million and plus interest expense of $0.5 million. Adjusted EBITDA attributable to noncontrolling interest for the three months ended September 30, 2019 was calculated as net loss of $29.7 million, plus depreciation of $2.6 million, plus amortization of intangible assets of $1.3 million, plus impairments of long-lived assets of $34.0 million and plus interest expense of $1.0 million.

Free Cash Flow
As used in this news release, free cash flow means net cash provided by operating activities plus principal payments received on the Preferred Interest, and less net cash provided by operating activities attributable to noncontrolling interest, capital expenditures (excluding the noncontrolling interest share (40%) of Eureka capital expenditures), capital contributions to MVP JV, and distributions/dividends and redemption amounts paid to Series A Preferred unitholders/shareholders (as applicable).

Retained Free Cash Flow
As used in this news release, retained free cash flow means free cash flow less dividends paid to common shareholders and distributions paid to noncontrolling interest EQM common unitholders (as applicable).

The table below reconciles free cash flow and retained free cash flow with net cash provided by operating activities as derived from the statements of consolidated cash flows to be included in ETRN's Quarterly Report on Form 10-Q for the three months ended September 30, 2020.

Reconciliation of Free Cash Flow and Retained Free Cash Flow


Three Months Ended September 30,

(Thousands)

2020


2019

Net cash provided by operating activities

$

231,195


$

267,926


Add back / (deduct):


Principal payments received on the Preferred Interest

1,259


1,173


Net cash provided by operating activities attributable to noncontrolling interest(1)

(13,828)


(4,744)


ETRN Series A Preferred Shares dividends(2)

(2,251)


EQM Series A Preferred Unit distributions(3)

(10,929)


(22,979)


Capital expenditures(4)(5)

(95,243)


(280,394)


Capital contributions to MVP JV

(65,630)


(211,677)


Free cash flow

$

44,573


$

(250,695)


Less:


Dividends paid to common shareholders (6)

(64,871)


(114,634)


Distributions paid to noncontrolling interest EQM common unitholders


(96,526)


Retained free cash flow

$

(20,298)


$

(461,855)


(1)

Reflects 40% of $34.6 million and $11.9 million, or Eureka’s standalone net cash provided by operating activities, representing the noncontrolling interest portion for the three months ended September 30, 2020 and 2019, respectively.

(2)

Reflects cash dividends paid of $0.075 per ETRN Series A Perpetual Convertible Preferred Share.

(3)

Reflects partial period distributions paid for the period 4/1/2020 through 6/17/2020 and cash distributions of $1.0364 per EQM Series A Preferred Unit in the third quarter of 2019.

(4)

Does not reflect amounts related to the noncontrolling interest share of Eureka.

(5)

ETRN accrues capital expenditures when the work has been completed but the associated bills have not yet been paid. Accrued capital expenditures are excluded from the statements of consolidated cash flows until they are paid.

(6)

Second quarter 2020 dividend of $0.15 per ETRN common share was paid during the third quarter 2020.

Adjusted EBITDA, free cash flow and retained free cash flow are non-GAAP supplemental financial measures that management and external users of ETRN's consolidated financial statements, such as industry analysts, investors, lenders, and rating agencies, may use to assess:

  • ETRN’s operating performance as compared to other publicly traded companies in the midstream energy industry without regard to historical cost basis or, in the case of adjusted EBITDA, financing methods
  • The ability of ETRN’s assets to generate sufficient cash flow to pay dividends to ETRN’s shareholders
  • ETRN’s ability to incur and service debt and fund capital expenditures and capital contributions
  • The viability of acquisitions and other capital expenditure projects and the returns on investment of various investment opportunities

ETRN believes that adjusted EBITDA, free cash flow, and retained free cash flow provide useful information to investors in assessing ETRN's financial condition and results of operations. Adjusted EBITDA, free cash flow, and retained free cash flow should not be considered as alternatives to net income, operating income, net cash provided by operating activities or any other measure of financial performance or liquidity presented in accordance with GAAP. Adjusted EBITDA, free cash flow, and retained free cash flow have important limitations as analytical tools because they exclude some, but not all, items that affect net income, operating income and net cash provided by operating activities. Additionally, because these non-GAAP metrics may be defined differently by other companies in ETRN's industry, ETRN's definitions of adjusted EBITDA, free cash flow, and retained free cash flow may not be comparable to similarly titled measures of other companies, thereby diminishing the utility of the measures. Free cash flow and retained free cash flow should not be viewed as indicative of the actual amount of cash that ETRN has available for dividends or that ETRN plans to distribute and are not intended to be liquidity measures.

ETRN is unable to provide a reconciliation of projected adjusted EBITDA from projected net income (loss), the most comparable financial measure calculated in accordance with GAAP, or a reconciliation of projected free cash flow or retained cash flow to net cash provided by operating activities, the most comparable financial measure calculated in accordance with GAAP. ETRN has not provided a reconciliation of projected adjusted EBITDA to projected net income (loss), the most comparable financial measure calculated in accordance with GAAP, due to the inherent difficulty and impracticability of predicting certain amounts required by GAAP with a reasonable degree of accuracy. Net income (loss) includes the impact of depreciation expense, income tax expense, the revenue impact of changes in the projected fair value of derivative instruments prior to settlement, potential changes in estimates for certain contract liabilities and unbilled revenues and certain other items that impact comparability between periods and the tax effect of such items, which may be significant and difficult to project with a reasonable degree of accuracy. Therefore, a reconciliation of projected adjusted EBITDA to projected net income (loss) is not available without unreasonable effort.

ETRN is unable to project net cash provided by operating activities because this metric includes the impact of changes in operating assets and liabilities related to the timing of cash receipts and disbursements that may not relate to the period in which the operating activities occurred. ETRN is unable to project these timing differences with any reasonable degree of accuracy to a specific day, three or more months in advance. Therefore, ETRN is unable to provide projected net cash provided by operating activities, or the related reconciliation of each of projected free cash flow and projected retained free cash flow to projected net cash provided by operating activities without unreasonable effort.


Contacts

Analyst inquiries:
Nate Tetlow – Vice President, Corporate Development and Investor Relations
412-553-5834
This email address is being protected from spambots. You need JavaScript enabled to view it.

Media inquiries:
Natalie Cox – Communications and Corporate Affairs
412-395-3941
This email address is being protected from spambots. You need JavaScript enabled to view it.


Read full story here

MORRISVILLE, N.C.--(BUSINESS WIRE)--The JF Petroleum Group, a MidOcean Partners portfolio company and the premier provider of fueling system solutions in North America, announced today that it has acquired McCon Building & Petroleum Services, Inc (“McCon”). Headquartered in Flower Mound, Texas, McCon is a full-service provider of petroleum equipment distribution, maintenance and construction services to customers across Texas. The addition of McCon to the JF Petroleum Group strengthens its leadership position in the petroleum equipment industry and enhances its ability to serve customers’ fueling equipment needs in Texas and other Southwestern US markets.


Keith Shadrick, CEO of the JF Petroleum Group, stated “This is one of the most meaningful acquisitions our company has ever conducted from the perspective of delivering the highest quality service and overall value to our customers. McCon’s reputation for quality is built on a foundation of operational excellence and exceptional customer service. Under the leadership of Chris Lawson, McCon positioned itself as an elite supplier of the highest quality construction and service capabilities in our industry. We are proud to welcome Chris and the entire McCon team to the JF Petroleum Group!”

I am extremely proud of what McCon has accomplished over the years and how we have been able to support the growth of our customers across Texas,” said Chris Lawson, the former owner of McCon. “The JF Petroleum Group is the perfect home for McCon given the shared values of our companies as well as our commitment to quality and customer service.”

Barrett Gilmer, Managing Director of MidOcean Partners, said “Acquiring McCon supports our strategy of building the North American petroleum equipment industry’s leading solution provider in The JF Petroleum Group. We look forward to continuing to grow our footprint across North America both organically and through acquisition, further solidifying our position as the industry’s leader.”

ABOUT JF PETROLEUM GROUP

The JF Petroleum Group (formerly Jones & Frank) is a leading provider of turn-key distribution, construction and service solutions to the North American fueling infrastructure industry. The company serves retail fueling stations, commercial and government fleets, and emergency power customers through its network of 30 branch offices, 4 distribution centers and over 1,000 employees located across the United States. The JF Petroleum Group represents the premier products in the fueling infrastructure marketplace, including Gilbarco Veeder-Root, VeriFone, OPW, Franklin Fueling and Containment Solutions. To learn more, visit www.jfpetrogroup.com.


Contacts

Alex Perez
Director of Marketing & Communications
This email address is being protected from spambots. You need JavaScript enabled to view it.

BROOKLYN HEIGHTS, Ohio--(BUSINESS WIRE)--GrafTech International Ltd. (NYSE: EAF) (GrafTech or the Company) today announced financial results for the quarter ended September 30, 2020, including net income of $94 million, or $0.35 per share, and Adjusted EBITDA(1) of $153 million.


"We are pleased with GrafTech's third quarter financial results while operating in a challenging environment and appreciate the ongoing commitment of our team through the COVID-19 pandemic," said David Rintoul, President and Chief Executive Officer. "We continue to work closely with our customers and are committed to helping them navigate the current market conditions."

Third Quarter Results and Key Financial Measures


For the Three Months
Ended September 30,


For the Nine Months
Ended September 30,

(dollars in thousands, except per share amounts)

2020

2019


2020

2019


Net sales

$

286,987


$

420,797


$

886,351


$

1,376,181


Net income

$

94,234


$

175,876


$

309,278


$

569,680


Earnings per share (2)

$

0.35


$

0.61


$

1.15


$

1.96


Adjusted EBITDA(1)

$

153,105


$

245,454


$

483,408


$

813,673


(1)

A non-GAAP financial measure, see below for more information and a reconciliation of EBITDA and Adjusted EBITDA to Net income, the most directly comparable financial measure calculated and presented in accordance with GAAP.

(2)

Earnings per share represents diluted earnings per share.

Net sales for the quarter ended September 30, 2020 were $287 million, compared to $421 million in the third quarter of 2019. Lower net sales reflect reduced sales volumes driven primarily by the impact of COVID-19 on steel production levels and continued customer inventory destocking.

Net income for the third quarter of 2020 was $94 million, or $0.35 per share, compared to $176 million, or $0.61 per share in the third quarter of 2019. Adjusted EBITDA was $153 million in the third quarter of 2020 compared to $245 million in the third quarter of 2019.

Cash flow from operating activities was $129 million in the third quarter of 2020, compared to $226 million in the third quarter 2019. We ended the quarter with a strong liquidity position of approximately $406 million, consisting of cash and cash equivalents of $159 million and availability of $247 million under our revolving credit facility.

Key operating metrics


For the Three Months
Ended September 30,


For the Nine Months
Ended September 30,

(in thousands)


2020

2019


2020

2019

Sales volume (MT) (1)

33


40


98


130


Production volume (MT) (2)

32


40


98


136


Production capacity excluding St. Marys (MT) (3)(4)

48


48


150


150


Capacity utilization excluding St. Marys (3)(5)

67

%

83

%


65

%

91

%

Total production capacity (MT) (4)(6)

55


55


171


171


Total capacity utilization (5)(6)

58

%

73

%


57

%

80

%

(1)

Sales volume reflects only graphite electrodes manufactured by GrafTech.

(2)

Production volume reflects graphite electrodes we produced during the period.

(3)

In the first quarter of 2018, our St. Marys facility began graphitizing a limited number of electrodes sourced from our Monterrey, Mexico facility.

(4)

Production capacity reflects expected maximum production volume during the period under normal operating conditions, standard product mix and expected maintenance outage. Actual production may vary.

(5)

Capacity utilization reflects production volume as a percentage of production capacity.

(6)

Includes graphite electrode facilities in Calais, France; Monterrey, Mexico; Pamplona, Spain and St. Marys, Pennsylvania.

Sales volume was 33 thousand metric tons (MT) in the third quarter of 2020 and consisted of 27 thousand MT shipped under our long-term agreements (LTAs) and 6 thousand MT of spot sales. Production volume, aligned with sales volume, was 32 thousand MT in the third quarter of 2020 compared to 40 thousand MT in the same period of 2019.

COVID-19 and Operational Update

GrafTech continues to proactively manage through the COVID-19 crisis. Our executive-led COVID-19 response team meets three times per week to monitor the ongoing situation and respond as needed.

Our plants have remained operational through the current pandemic and maintained a 98% on-time delivery rate. Our global footprint gives us the flexibility to move or adjust production if needed.

We continue to focus on containing our costs and aligning production to current sales levels for the remainder of the year. We expect to meet our reduced full year capital expenditure estimate of approximately $35 million.

Commercial Update

GrafTech services customers at over 300 locations across the globe all of which have been impacted by COVID-19. We are seeing a measured recovery in the global steel markets compared to the second quarter 2020, with each region recovering at different rates, and anticipate this will have a positive influence on graphite electrode demand. In the third quarter 2020, the global (ex-China) steel market capacity utilization rate improved to over 60%1. In the U.S., the third quarter capacity utilization rate was approximately 64%2. By late October, the capacity utilization rate in the U.S. steel market approached 70%2.

The commercial team has worked diligently to achieve solid results in the current environment. Year-to-date sales volumes through the third quarter were 98 thousand MT, consisting of LTA volumes of 82 thousand MT and non-LTA volumes of 16 thousand MT.

During the third quarter, our average price from LTAs declined slightly to approximately $9,300 per MT, reflecting the impacts of product mix, LTA modifications and other adjustments. Due to favorable mix in the quarter, the average price for our non-LTA business increased slightly to approximately $5,700 per MT. However, as anticipated, we believe the general spot price of graphite electrodes continued to trend lower during the third quarter.

The current market conditions are challenging for our customers, including those with LTAs, and we have some customers that are continuing to struggle to take their committed volumes. This is causing some non-performance and disputes, including a few arbitrations associated with, among other things, efforts to modify existing contracts. As such, we will continue to work to preserve our rights under the LTAs.

We are working hard with our valued customers to develop mutually beneficial solutions and have successfully negotiated LTA modifications with several of these customers during the third quarter. We are able to provide near-term relief in exchange for additional contractual commitments going forward. We expect to continue to finalize more of these beneficial negotiations in the coming months.

Capital Structure and Capital Allocation

During the third quarter we reduced our debt by approximately $150 million. After quarter end, we further reduced our debt by an additional $60 million, bringing 2020 debt reduction to $313 million through the end of October. We will continue to prioritize balance sheet flexibility and expect to use the majority of fourth quarter incremental free cash flow to reduce debt.

Outlook

For the remainder of 2020, we anticipate our full year LTA sales volumes to be above the midpoint of the expected range of 100 thousand - 115 thousand MT. We now expect our full year LTA revenue will be between $1,000 million and $1,080 million in 2020.

With the LTA modifications and ongoing customer discussions, we are able to provide estimated shipments of graphite electrodes for the final two years of the initial term under our LTAs and for the years 2023 through 2024 as follows:


2021


2022


2023 through 2024

Estimated LTA volume(1)

98-108


95-105


35-45

Estimated LTA revenue(2)

$925-$1,025


$910-$1,010


$350-$450 (3)

(1)

In thousands of metric tons

(2)

In millions

(3)

Includes expected termination fees from a few customers that have failed to meet certain obligations under their LTAs

The environmental and economic advantages of electric arc furnace steel production positions both that industry and the graphite electrode industry for continued long-term growth.

We believe GrafTech's leadership position, strong cash flows, and advantaged low cost structure and vertical integration are sustainable competitive advantages. The services and solutions we provide will position our customers and us for a better future.

Conference Call

In conjunction with this earnings release, you are invited to listen to our earnings call being held on November 3, 2020 at 10:00 a.m. Eastern Standard Time. The webcast and accompanying slide presentation will be available at www.GrafTech.com, in the Investors section. The earnings call dial-in number is +1 (866) 521-4909 toll-free in the U.S. and Canada or +1 (647) 427-2311, conference ID: 6767702 for overseas calls. A replay of the Conference Call will be available until February 3, 2021 by dialing +1 (800) 585-8367 toll-free in the U.S. and Canada or +1 (416) 621-4642 for overseas calls, conference ID: 6767702. A replay of the webcast will also be available on our website until February 3, 2021, at www.GrafTech.com, in the Investors section. GrafTech also makes its complete financial reports that have been filed with the Securities and Exchange Commission (the "SEC") and other information available at www.GrafTech.com. The information in our website is not part of this release or any report we file or furnish to the SEC.

About GrafTech

GrafTech International Ltd. is a leading manufacturer of high-quality graphite electrode products essential to the production of electric arc furnace steel and other ferrous and non-ferrous metals. The Company has a competitive portfolio of low-cost graphite electrode manufacturing facilities, including three of the highest capacity facilities in the world. GrafTech is also the only large-scale graphite electrode producer that is substantially vertically integrated into petroleum needle coke, a key raw material for graphite electrode manufacturing. This unique position provides competitive advantages in product quality and cost.

Special note regarding Forward-Looking Statements

This news release and related discussions may contain forward-looking statements that reflect our current views with respect to, among other things, future events and financial performance. You can identify these forward-looking statements by the use of forward-looking words such as “will,” “may,” “plan,” “estimate,” “project,” “believe,” “anticipate,” “expect,” “foresee”, “intend,” “should,” “would,” “could,” “target,” “goal,” “continue to,” “positioned to,” "are confident", or the negative versions of those words or other comparable words. Any forward-looking statements contained in this news release are based upon our historical performance and on our current plans, estimates and expectations considering information currently available to us. The inclusion of this forward-looking information should not be regarded as a representation by us that the future plans, estimates, or expectations contemplated by us will be achieved. Our expectations and targets are not predictions of actual performance and historically our performance has deviated, often significantly, from our expectations and targets. These forward-looking statements are subject to various risks and uncertainties and assumptions relating to our operations, financial results, financial condition, business, prospects, growth strategy and liquidity. Accordingly, there are or will be important factors that could cause our actual results to differ materially from those indicated in these statements. We believe that these factors include, but are not limited to: the ultimate impact that the COVID-19 pandemic has on our business, results of operations, financial condition and cash flows; the cyclical nature of our business and the selling prices of our products may lead to periods of reduced profitability and net losses in the future; the possibility that we may be unable to implement our business strategies, including our ability to secure and maintain longer-term customer contracts, in an effective manner; the risks and uncertainties associated with litigation, arbitration, and like disputes, including the recently filed stockholder litigation and disputes related to contractual commitments; the possibility that global graphite electrode overcapacity may adversely affect graphite electrode prices; pricing for graphite electrodes has historically been cyclical and the price of graphite electrodes may continue to decline in the future; the sensitivity of our business and operating results to economic conditions and the possibility others may not be able to fulfill their obligations to us in a timely fashion or at all; our dependence on the global steel industry generally and the electric arc furnace steel industry in particular; the competitiveness of the graphite electrode industry; our dependence on the supply of petroleum needle coke; our dependence on supplies of raw materials (in addition to petroleum needle coke) and energy; the possibility that our manufacturing operations are subject to hazards; changes in, or more stringent enforcement of, health, safety and environmental regulations applicable to our manufacturing operations and facilities; the legal, compliance, economic, social and political risks associated with our substantial operations in multiple countries; the possibility that fluctuation of foreign currency exchange rates could materially harm our financial results; the possibility that our results of operations could deteriorate if our manufacturing operations were substantially disrupted for an extended period, including as a result of equipment failure, climate change, regulatory issues, natural disasters, public health crises, such as the COVID-19 pandemic, political crises or other catastrophic events; our dependence on third parties for certain construction, maintenance, engineering, transportation, warehousing and logistics services; the possibility that we are unable to recruit or retain key management and plant operating personnel or successfully negotiate with the representatives of our employees, including labor unions; the possibility that we may divest or acquire businesses, which could require significant management attention or disrupt our business; the sensitivity of goodwill on our balance sheet to changes in the market; the possibility that we are subject to information technology systems failures, cybersecurity attacks, network disruptions and breaches of data security; our dependence on protecting our intellectual property; the possibility that third parties may claim that our products or processes infringe their intellectual property rights; the possibility that significant changes in our jurisdictional earnings mix or in the tax laws of those jurisdictions could adversely affect our business; the possibility that our indebtedness could limit our financial and operating activities or that our cash flows may not be sufficient to service our indebtedness; the possibility that restrictive covenants in our financing agreements could restrict or limit our operations; the fact that borrowings under certain of our existing financing agreements subjects us to interest rate risk; the possibility of a lowering or withdrawal of the ratings assigned to our debt; the possibility that disruptions in the capital and credit markets could adversely affect our results of operations, cash flows and financial condition, or those of our customers and suppliers; the possibility that highly concentrated ownership of our common stock may prevent minority stockholders from influencing significant corporate decisions; the possibility that we may not pay cash dividends on our common stock in the future; the fact that certain of our stockholders have the right to engage or invest in the same or similar businesses as us; the possibility that the market price of our common stock could be negatively affected by sales of substantial amounts of our common stock in the public markets, including by Brookfield Asset Management Inc. and its affiliates; the fact that certain provisions of our Amended and Restated Certificate of Incorporation and our Amended and Restated By-Laws could hinder, delay or prevent a change of control; the fact that the Court of Chancery of the State of Delaware will be the exclusive forum for substantially all disputes between us and our stockholders; and our status as a "controlled company" within the meaning of the New York Stock Exchange corporate governance standards, which allows us to qualify for exemptions from certain corporate governance requirements.

These factors should not be construed as exhaustive and should be read in conjunction with the other cautionary statements, including the Risk Factors sections included in our most recent Annual Report on Form 10-K, our Quarterly Reports on Form 10-Q for the quarterly periods ended March 31, 2020 and June 30, 2020, and other filings with the SEC. The forward-looking statements made in this press release relate only to events as of the date on which the statements are made. We do not undertake any obligation to publicly update or review any forward-looking statement, except as required by law, whether as a result of new information, future developments or otherwise.

Non-GAAP financial measures

In addition to providing results that are determined in accordance with GAAP, we have provided certain financial measures that are not in accordance with GAAP. EBITDA and Adjusted EBITDA are non-GAAP financial measures. We define EBITDA, a non-GAAP financial measure, as net income or loss plus interest expense, minus interest income, plus income taxes, and depreciation and amortization. We define adjusted EBITDA as EBITDA plus any pension and other post-employment benefit ("OPEB") plan expenses, initial and follow-on public offering and related expenses, non-cash gains or losses from foreign currency remeasurement of non-operating assets and liabilities in our foreign subsidiaries where the functional currency is the U.S. dollar, related party Tax Receivable Agreement adjustments, stock-based compensation, and non-cash fixed asset write-offs. Adjusted EBITDA is the primary metric used by our management and our Board of Directors to establish budgets and operational goals for managing our business and evaluating our performance.

We monitor adjusted EBITDA as a supplement to our GAAP measures, and believe it is useful to present to investors, because we believe that it facilitates evaluation of our period-to-period operating performance by eliminating items that are not operational in nature, allowing comparison of our recurring core business operating results over multiple periods unaffected by differences in capital structure, capital investment cycles and fixed asset base. In addition, we believe adjusted EBITDA and similar measures are widely used by investors, securities analysts, ratings agencies, and other parties in evaluating companies in our industry as a measure of financial performance and debt-service capabilities. We also monitor the ratio of total debt to adjusted EBITDA, because we believe it is a useful and widely used way to assess our leverage.

Our use of adjusted EBITDA has limitations as an analytical tool, and you should not consider it in isolation or as a substitute for analysis of our results as reported under GAAP. Some of these limitations are:

  • adjusted EBITDA does not reflect changes in, or cash requirements for, our working capital needs;
  • adjusted EBITDA does not reflect our cash expenditures for capital equipment or other contractual commitments, including any capital expenditure requirements to augment or replace our capital assets;
  • adjusted EBITDA does not reflect the interest expense or the cash requirements necessary to service interest or principal payments on our indebtedness;
  • adjusted EBITDA does not reflect tax payments that may represent a reduction in cash available to us;
  • adjusted EBITDA does not reflect expenses relating to our pension and OPEB plans;
  • adjusted EBITDA does not reflect the non-cash gains or losses from foreign currency remeasurement of non-operating assets and liabilities in our foreign subsidiaries where the functional currency is the U.S. dollar;
  • adjusted EBITDA does not reflect initial and follow-on public offering and related expenses;
  • adjusted EBITDA does not reflect related party Tax Receivable Agreement adjustments;
  • adjusted EBITDA does not reflect stock-based compensation or the non-cash write-off of fixed assets; and
  • other companies, including companies in our industry, may calculate EBITDA and adjusted EBITDA differently, which reduces its usefulness as a comparative measure.

In evaluating EBITDA and adjusted EBITDA, you should be aware that in the future, we will incur expenses similar to the adjustments in the reconciliation presented below. Our presentations of EBITDA and adjusted EBITDA should not be construed as suggesting that our future results will be unaffected by these expenses or any unusual or non-recurring items. When evaluating our performance, you should consider EBITDA and adjusted EBITDA alongside other financial performance measures, including our net income and other GAAP measures.


GRAFTECH INTERNATIONAL LTD. AND SUBSIDIARIES

CONDENSED CONSOLIDATED BALANCE SHEETS

(Dollars in thousands)

Unaudited


As of
September 30,
2020


As of
December 31,
2019

ASSETS


Current assets:


Cash and cash equivalents

$

158,841


$

80,935


Accounts and notes receivable, net of allowance for doubtful accounts of
$8,973 as of September 30, 2020 and $5,474 as of December 31, 2019

164,195


247,051


Inventories

299,236


313,648


Prepaid expenses and other current assets

35,299


40,946


Total current assets

657,571


682,580


Property, plant and equipment

765,822


733,417


Less: accumulated depreciation

264,304


220,397


Net property, plant and equipment

501,518


513,020


Deferred income taxes

40,767


55,217


Goodwill

171,117


171,117


Other assets

96,616


104,230


Total assets

$

1,467,589


$

1,526,164


LIABILITIES AND STOCKHOLDERS’ EQUITY


Current liabilities:


Accounts payable

$

49,056


$

78,697


Short-term debt

147


141


Accrued income and other taxes

81,756


65,176


Other accrued liabilities

65,058


48,335


Related party payable - tax receivable agreement

16,115


27,857


Total current liabilities

212,132


220,206


Long-term debt

1,564,431


1,812,682


Other long-term obligations

76,403


72,562


Deferred income taxes

44,251


49,773


Related party payable - tax receivable agreement long-term

42,479


62,014


Stockholders’ equity:


Preferred stock, par value $0.01, 300,000,000 shares authorized, none issued


Common stock, par value $0.01, 3,000,000,000 shares authorized, 267,188,547
shares issued and outstanding as of September 30, 2020 and 270,485,308
as of December 31, 2019

2,672


2,705


Additional paid-in capital

757,576


765,419


Accumulated other comprehensive loss

(39,161

)


(7,361

)


Accumulated deficit

(1,193,194

)


(1,451,836

)


Total stockholders’ deficit

(472,107

)


(691,073

)


Total liabilities and stockholders’ equity

$

1,467,589


$

1,526,164


GRAFTECH INTERNATIONAL LTD. AND SUBSIDIARIES

CONDENSED CONSOLIDATED STATEMENTS OF OPERATIONS

(Dollars in thousands)

Unaudited


For the Three Months
Ended September 30,


For the Nine Months
Ended September 30,


2020


2019


2020


2019


CONSOLIDATED STATEMENTS OF OPERATIONS


Net sales

$

286,987


$

420,797


$

886,351


$

1,376,181


Cost of sales

131,862


178,497


401,379


571,068


Gross profit

155,125


242,300


484,972


805,113


Research and development

650


611


2,072


1,961


Selling and administrative expenses

19,062


15,708


49,995


46,328


Operating profit

135,413


225,981


432,905


756,824


Other expense (income), net

694


(688

)


(2,309

)


642


Related party Tax Receivable Agreement benefit


(3,346

)


Interest expense

22,474


31,803


69,026


98,472


Interest income

(93

)


(1,765

)


(1,582

)


(2,910

)


Income before provision for income taxes

112,338


196,631


371,116


660,620


Provision for income taxes

18,104


20,755


61,838


90,940


Net income

$

94,234


$

175,876


$

309,278


$

569,680


Basic income per common share:


Net income per share

$

0.35


$

0.61


$

1.15


$

1.96


Weighted average common shares outstanding

267,265,705


290,112,233


267,908,427


290,410,859


Diluted income per common share:


Income per share

$

0.35


$

0.61


$

1.15


$

1.96


Weighted average common shares outstanding

267,279,555


290,127,296


267,920,890


290,422,351


Contacts

Wendy Watson
216-676-2000


Read full story here

EWING, N.J.--(BUSINESS WIRE)--$OLED #100fastestgrowingcompanies--Universal Display Corporation (Nasdaq: OLED), enabling energy-efficient displays and lighting with its UniversalPHOLED® technology and materials, announced today that the Company was named the 96th fastest-growing company on Fortune’s 2020 100 Fastest-Growing Companies list. This is the fourth time that Universal Display has ranked on the publication’s annual ranking.


“We are delighted to be named by Fortune Magazine as one of the fastest growing global companies,” said Steven V. Abramson, President and Chief Executive Officer of Universal Display. “This recognition is a reflection of the hardworking and brilliant global team at UDC. As a leader in the OLED ecosystem, we will continue to cultivate our corporate culture of integrity, collaboration and diversity as well as foster our steadfast drive for innovation, continuous improvement and operational excellence.”

As noted by Fortune, its 2020 ranking of the world’s best three-year performers in revenues, profits, and stock returns offers some insights into the forces driving the global economy. Fortune’s list ranks public companies, with market capitalization of $250 million or more, based on revenue growth rate, EPS growth rate and three-year annualized total return for the period ended June 30, 2020. To compute the revenue and EPS growth rates, Fortune uses a trailing-four-quarters log linear least square regression fit. Please visit Universal Display’s full profile on Fortune’s list for more information.

About Universal Display Corporation

Universal Display Corporation (Nasdaq: OLED) is a leader in the research, development and commercialization of organic light emitting diode (OLED) technologies and materials for use in display, solid-state lighting applications with subsidiaries and offices around the world. Founded in 1994, the Company currently owns, exclusively licenses or has the sole right to sublicense more than 5,000 patents issued and pending worldwide. Universal Display licenses its proprietary technologies, including its breakthrough high-efficiency UniversalPHOLED® phosphorescent OLED technology that can enable the development of energy-efficient and eco-friendly displays and solid-state lighting. The Company also develops and offers high-quality, state-of-the-art UniversalPHOLED materials that are recognized as key ingredients in the fabrication of OLEDs with peak performance. In addition, Universal Display delivers innovative and customized solutions to its clients and partners through technology transfer, collaborative technology development and on-site training. To learn more about Universal Display Corporation, please visit https://oled.com/.

Universal Display Corporation and the Universal Display Corporation logo are trademarks or registered trademarks of Universal Display Corporation. All other company, brand or product names may be trademarks or registered trademarks.

All statements in this document that are not historical, such as those relating to the impact of the COVID-19 pandemic on the Company and otherwise, the Company’s technologies and potential applications of those technologies, the Company’s expected results and future declaration of dividends, as well as the growth of the OLED market and the Company’s opportunities in that market, are forward-looking financial statements within the meaning of the Private Securities Litigation Reform Act of 1995. You are cautioned not to place undue reliance on any forward-looking statements in this document, as they reflect Universal Display Corporation’s current views with respect to future events and are subject to risks and uncertainties that could cause actual results to differ materially from those contemplated. These risks and uncertainties are discussed in greater detail in Universal Display Corporation’s periodic reports on Form 10-K and Form 10-Q filed with the Securities and Exchange Commission, including, in particular, the sections entitled “Risk Factors” in Universal Display Corporation’s Annual Report on Form 10-K for the year ended December 31, 2019 and subsequent Quarterly Reports on Form 10-Q. Universal Display Corporation disclaims any obligation to update any forward-looking statement contained in this document.

Follow Universal Display Corporation

Twitter
Facebook
YouTube

(OLED-C)


Contacts

Universal Display Contact:
Darice Liu
This email address is being protected from spambots. You need JavaScript enabled to view it.
+1 609-964-5123

Earnings Release Highlights


  • GAAP Net Income of $0.51 per share and Adjusted (non-GAAP) Operating Earnings of $1.04 per share for the third quarter of 2020
  • Raising our guidance range for full year 2020 Adjusted (non-GAAP) Operating Earnings from $2.80 - $3.10 per share to $3.00 - $3.20 per share
  • Strong utility reliability and customer operations performance - every utility achieved top quartile in outage frequency & duration, customer satisfaction, abandon rate and gas odor response
  • Generation’s nuclear fleet ran with a capacity factor of 96.0%
  • Pepco filed the second multi-year plan in Maryland; filing proposes flat distribution rates for the first two years
  • Conducting a strategic review of our corporate structure to determine how best to create value and position our businesses for success


CHICAGO--(BUSINESS WIRE)--Exelon Corporation (Nasdaq: EXC) today reported its financial results for the third quarter of 2020.

“Our financial results exceeded expectations, and our utility and generation operational performance remained strong despite the challenges of the pandemic, record heat and extreme storms, including tropical storm Isaias on the East Coast and a hurricane-scale derecho that spawned 13 tornadoes across our ComEd territory in the Midwest,” said Christopher M. Crane, president and CEO of Exelon. “We also confronted difficult strategic decisions on specific generation assets during the quarter, including our plans to prematurely retire our Byron and Dresden nuclear stations in Illinois in 2021 due to broken energy policies that don’t fairly value clean energy resources. In addition, our gas-fired Mystic plant in Boston will retire in 2024 when its cost of service agreement expires. We expect to finish the year strong as we maintain our focus on safe, reliable operations, reducing costs, supporting clean energy policies and positioning the company for the future.”

“Excellent operational performance and our success in managing costs during the pandemic continues to drive strong financial performance, resulting in adjusted (non-GAAP) third-quarter earnings of $1.04 per share, which exceeded our guidance of $0.80 to $0.90 per share,” said Joseph Nigro, senior executive vice president and CFO of Exelon. “So far this year, we have invested $4.5 billion at our utilities to improve infrastructure and further increase grid reliability for customers, with more on the way as we move forward with new proposed capital projects across our service territories over the next several years. We are raising our year-end earnings guidance to $3.00 to $3.20 per share from $2.80 to $3.10 per share.”

Third Quarter 2020

Exelon's GAAP Net Income for the third quarter of 2020 decreased to $0.51 per share from $0.79 per share in the third quarter of 2019. Adjusted (non-GAAP) Operating Earnings for the third quarter of 2020 increased to $1.04 per share from $0.92 per share in the third quarter of 2019. For the reconciliations of GAAP Net Income to Adjusted (non-GAAP) Operating Earnings, refer to the tables beginning on page 5.

Adjusted (non-GAAP) Operating Earnings in the third quarter of 2020 primarily reflect:

  • Higher utility earnings primarily due to regulatory rate increases at BGE and PHI and favorable weather conditions at PECO, partially offset by storm costs related to the August 2020 storm at PECO, net of tax repairs, and at PHI; and
  • Higher Generation earnings primarily due to higher capacity revenues and lower operating and maintenance expense, partially offset by a reduction in load due to COVID-19.

Operating Company Results1

ComEd

ComEd's third quarter of 2020 GAAP Net Income and Adjusted (non-GAAP) Operating Earnings remained relatively consistent with the third quarter of 2019. Due to revenue decoupling, ComEd's distribution earnings are not affected by actual weather or customer usage patterns.

PECO

PECO’s third quarter of 2020 GAAP Net Income and Adjusted (non-GAAP) Operating Earnings remained relatively consistent with the third quarter of 2019, primarily due to favorable weather conditions, offset by higher storm costs due to the August 2020 storm net of tax repairs.

BGE

BGE’s third quarter of 2020 GAAP Net Income and Adjusted (non-GAAP) Operating Earnings remained relatively consistent with the third quarter of 2019, primarily due to regulatory rate increases, offset by an increase in various expenses. Due to revenue decoupling, BGE's distribution earnings are not affected by actual weather or customer usage patterns.

PHI

PHI’s third quarter of 2020 GAAP Net Income increased to $216 million from $189 million in the third quarter of 2019. PHI’s Adjusted (non-GAAP) Operating Earnings for the third quarter of 2020 increased to $220 million from $209 million in the third quarter of 2019, primarily due to regulatory rate increases, partially offset by storm costs related to the August 2020 storm. Due to revenue decoupling, PHI's distribution earnings related to Pepco Maryland, DPL Maryland and Pepco District of Columbia are not affected by actual weather or customer usage patterns.

Generation

Generation's third quarter of 2020 GAAP Net Income decreased to $49 million from $257 million in the third quarter of 2019. Generation’s Adjusted (non-GAAP) Operating Earnings for the third quarter of 2020 increased to $456 million from $352 million in the third quarter of 2019, primarily due to higher capacity revenues and lower operating and maintenance expense, partially offset by a reduction in load due to COVID-19.

As of Sep. 30, 2020, the percentage of expected generation hedged is 97%-100% and 87%-90% for 2020 and 2021, respectively.

___________

1Exelon’s five business units include ComEd, which consists of electricity transmission and distribution operations in northern Illinois; PECO, which consists of electricity transmission and distribution operations and retail natural gas distribution operations in southeastern Pennsylvania; BGE, which consists of electricity transmission and distribution operations and retail natural gas distribution operations in central Maryland; PHI, which consists of electricity transmission and distribution operations in the District of Columbia and portions of Maryland, Delaware, and New Jersey and retail natural gas distribution operations in northern Delaware; and Generation, which consists of owned and contracted electric generating facilities and wholesale and retail customer supply of electric and natural gas products and services, including renewable energy products and risk management services.

Recent Developments and Third Quarter Highlights

  • COVID-19: Exelon continues to monitor developments related to the global outbreak (pandemic) of the 2019 novel coronavirus (COVID-19) pandemic and has taken proactive measures to protect the health and safety of employees, contractors and customers. As a provider of critical resources, Exelon has robust plans and contingencies in place to ensure business and operational continuity across a wide range of potentially disruptive events, including extensive preparedness for major public health crises. Exelon and its operating companies are working in close coordination with designated state and local emergency preparedness and health officials, and at the federal level through the Electric Subsector Coordinating Council. All Exelon employees have access to up-to-date information and resources and are following Centers for Disease Control guidelines to ensure safety. In addition, Exelon utilities have established incident command centers to address emergent customer and employee needs in real time.

    The estimated impact to Generation’s Net income as a result of COVID-19 is approximately $45 million and $140 million for the three and nine months ended Sept. 30, 2020, respectively, and primarily reflects the impact of reduction in load, incremental credit loss expense and direct costs related to COVID-19.

    The estimated impact to the Utility Registrants’ Net income as a result of COVID-19 is approximately $65 million for the nine months ended Sep. 30, 2020, and primarily reflects the impact of reduction in load for the Utility Registrants and direct costs related to COVID-19 primarily for PECO. The estimated net impact to the Utility Registrants’ Net income for the three months ended Sep. 30, 2020, is approximately $15 million and primarily reflects the impact of reduction in load offset by the reversal of incremental credit loss expense and direct costs related to COVID-19 recorded in the second quarter of 2020, which were recorded as regulatory assets in the third quarter of 2020.

    At Generation and PECO, direct costs related to COVID-19 are excluded from Adjusted (non-GAAP) Operating Earnings.

    Generation also expects a reduction in operating revenues in the fourth quarter of 2020 primarily due to expected reduction in electric load.

    Exelon identified and is pursuing approximately $250 million in cost savings across its operating companies to offset the expected unfavorable impacts on operating revenues. The cost savings for the year are expected to be higher than originally anticipated.
  • Early Retirement of Generation Facilities: In August 2020, Exelon Generation announced that it intends to retire the Byron Generating Station (Byron) in September 2021, Dresden Generating Station (Dresden) in November 2021, and Mystic Units 8 & 9 (Mystic) at the expiration of the cost of service commitment in May 2024. As a result, in the third quarter of 2020, Exelon and Generation recognized a $500 million impairment of the New England asset group and one-time non-cash charges for Byron, Dresden, and Mystic of $260 million related to materials and supplies inventory reserve adjustments, employee-related costs, and construction work-in-progress impairments, among other items. In addition, there will be ongoing annual financial impacts stemming from shortening the expected economic useful lives of these facilities, primarily related to accelerated depreciation of plant assets (including any Asset Retirement Costs (ARC)) and accelerated amortization of nuclear fuel. Exelon’s and Generation’s third quarter 2020 results include an incremental $180 million of pre-tax expense for these items. These charges are excluded from Adjusted (non-GAAP) Operating Earnings.
  • PECO Pennsylvania Natural Gas Distribution Rate Case: On Sep. 30, 2020, PECO filed an application with the Pennsylvania Public Utility Commission (PAPUC) to increase its annual natural gas distribution rates by $69 million, reflecting an ROE of 10.95%. PECO currently expects a decision in the second quarter of 2021 but cannot predict if the PAPUC will approve the application as filed.
  • Pepco Maryland Electric Rate Case: On Oct. 26, 2020, Pepco filed an application for a three-year cumulative multi-year plan for April 1, 2021, through March 31, 2024, with the Maryland Public Service Commission (MDPSC) to increase its electric distribution rates by $56 million effective April 1, 2023, and $54 million effective April 1, 2024, to recover capital investments made in 2019 and planned capital investments from 2020 to March 31, 2024, reflecting an ROE of 10.2%. Pepco currently expects a decision in the second quarter of 2021 but cannot predict if the MDPSC will approve the application as filed.
  • Nuclear Operations: Generation’s nuclear fleet, including its owned output from the Salem Generating Station and 100% of the CENG units, produced 44,884 gigawatt-hours (GWhs) in the third quarter of 2020, compared with 46,215 GWhs in the third quarter of 2019. Excluding Salem, the Exelon-operated nuclear plants at ownership achieved a 96.0% capacity factor for the third quarter of 2020, compared with 95.5% for the third quarter of 2019. The number of planned refueling outage days in the third quarter of 2020 totaled 17, compared with 15 in the third quarter of 2019. There were 4 non-refueling outage days in the third quarter of 2020 and 15 in the third quarter of 2019.
  • Fossil and Renewables Operations: The Dispatch Match rate for Generation’s fossil and hydro fleet was 98.9% in the third quarter of 2020, compared with 97.5% in the third quarter of 2019. Energy Capture for the wind and solar fleet was 91.9% in the third quarter of 2020, compared with 96.5% in the third quarter of 2019. The lower performance in the quarter was attributed to turbines in outage awaiting parts to perform repairs.
  • Financing Activities: On Sep. 23, 2020, Pepco issued $150 million of its First Mortgage Bonds, 3.28% Series due Sept. 23, 2050. Pepco used the proceeds to repay existing indebtedness and for general corporate purposes.
  • Review of Corporate Structure: Exelon is currently conducting a strategic review of its corporate structure to determine how to best create value and position its businesses for success. As part of the review, Exelon is considering separating Exelon Generation from Exelon Utilities. As Exelon continues this review, it is focused on creating value and taking into account the interests of all stakeholders – investors, employees, customers and the communities it serves. There can be no assurance that the strategic review will result in any particular action, nor can there be any assurance regarding the timing of any action. Exelon will provide an update on its progress on its next earnings call. Exelon has retained advisors to assist with the review process.

GAAP/Adjusted (non-GAAP) Operating Earnings Reconciliation

Adjusted (non-GAAP) Operating Earnings for the third quarter of 2020 do not include the following items (after tax) that were included in reported GAAP Net Income:

(in millions)

Exelon
Earnings per
Diluted
Share

Exelon

ComEd

PECO

BGE

PHI

Generation

2020 GAAP Net Income (Loss)

$

0.51


$

501


$

196


$

138


$

53


$

216


$

49


Mark-to-Market Impact of Economic Hedging Activities (net of taxes of $62 and $64, respectively)

(0.19

)


(183

)


(192

)


Unrealized Gains Related to Nuclear Decommissioning Trust (NDT) Fund Investments (net of taxes of $161)

(0.18

)


(172

)


(172

)


Asset Impairments (net of taxes of $126)

0.38


375


375


Plant Retirements and Divestitures (net of taxes of $111)

0.34


329


329


Cost Management Program (net of taxes of $5, $0, $0, $1 and $4, respectively)

0.02


15


1


1


1


12


Change in Environmental Liabilities (net of taxes of $6)

0.02


17


17


COVID-19 Direct Costs (net of taxes of $3, $1, $0, and $2, respectively)

0.01


10


2


1


7


Asset Retirement Obligation (net of taxes of $1)


3


3


Acquisition Related Costs (net of taxes of $1)


2


2


Income Tax-Related Adjustments (entire amount represents tax expense)

0.06


62


(1

)


(28

)


Noncontrolling Interests (net of taxes of $12)

0.06


57


57


2020 Adjusted (non-GAAP) Operating Earnings

$

1.04


$

1,017


$

197


$

141


$

54


$

220


$

456


Adjusted (non-GAAP) Operating Earnings for the third quarter of 2019 do not include the following items (after tax) that were included in reported GAAP Net Income:

(in millions)

Exelon
Earnings per
Diluted
Share

Exelon

ComEd

PECO

BGE

PHI

Generation

2019 GAAP Net Income

$

0.79


$

772


$

200


$

140


$

55


$

189


$

257


Mark-to-Market Impact of Economic Hedging Activities (net of taxes of $2 and $4, respectively)


(2

)


(10

)


Unrealized Gains Related to NDT Fund Investments (net of taxes of $34)

(0.04

)


(39

)


(39

)


Asset Impairments (net of taxes of $53)

0.12


113


113


Plant Retirements and Divestitures (net of taxes of $40)

0.12


119


119


Cost Management Program (net of taxes of $3, $0, $0, $0 and $3, respectively)

0.01


14


1


1


2


10


Asset Retirement Obligation (net of taxes of $9)

(0.09

)


(84

)


(84

)


Change in Environmental Liabilities (net of taxes of $5, $5 and $0, respectively)

0.02


18


17


1


Income Tax-Related Adjustments (entire amount represents tax expense)

0.01


13


1


9


Noncontrolling Interests (net of taxes of $3)

(0.02

)


(24

)


(24

)


2019 Adjusted (non-GAAP) Operating Earnings

$

0.92


$

900


$

200


$

141


$

56


$

209


$

352


Note:
Amounts may not sum due to rounding.
Unless otherwise noted, the income tax impact of each reconciling item between GAAP Net Income and Adjusted (non-GAAP) Operating Earnings is based on the marginal statutory federal and state income tax rates for each Registrant, taking into account whether the income or expense item is taxable or deductible, respectively, in whole or in part. For all items except the unrealized gains and losses related to NDT fund investments, the marginal statutory income tax rates for 2020 and 2019 ranged from 26.0% to 29.0%. Under IRS regulations, NDT fund investment returns are taxed at different rates for investments if they are in qualified or non-qualified funds. The effective tax rates for the unrealized gains and losses related to NDT fund investments were 48.3% and 47.1% for the three months ended Sep. 30, 2020 and 2019, respectively.

Webcast Information

Exelon will discuss third quarter 2020 earnings in a conference call scheduled for today at 9 a.m. Central Time (10 a.m. Eastern Time). The webcast and associated materials can be accessed at www.exeloncorp.com/investor-relations.

About Exelon

Exelon Corporation (Nasdaq: EXC) is a Fortune 100 energy company with the largest number of electricity and natural gas customers in the U.S. Exelon does business in 48 states, the District of Columbia, and Canada and had 2019 revenue of $34 billion. Exelon serves approximately 10 million customers in Delaware, the District of Columbia, Illinois, Maryland, New Jersey, and Pennsylvania through its Atlantic City Electric, BGE, ComEd, Delmarva Power, PECO, and Pepco subsidiaries. Exelon is one of the largest competitive U.S. power generators, with more than 31,000 megawatts of nuclear, gas, wind, solar and hydroelectric generating capacity comprising one of the nation’s cleanest and lowest-cost power generation fleets. The company’s Constellation business unit provides energy products and services to approximately 2 million residential, public sector, and business customers, including three fourths of the Fortune 100. Follow Exelon on Twitter @Exelon.

Non-GAAP Financial Measures

In addition to net income as determined under generally accepted accounting principles in the United States (GAAP), Exelon evaluates its operating performance using the measure of Adjusted (non-GAAP) Operating Earnings because management believes it represents earnings directly related to the ongoing operations of the business. Adjusted (non-GAAP) Operating Earnings exclude certain costs, expenses, gains and losses, and other specified items. This measure is intended to enhance an investor’s overall understanding of period over period operating results and provide an indication of Exelon’s baseline operating performance excluding items that are considered by management to be not directly related to the ongoing operations of the business. In addition, this measure is among the primary indicators management uses as a basis for evaluating performance, allocating resources, setting incentive compensation targets, and planning and forecasting of future periods. Adjusted (non-GAAP) Operating Earnings is not a presentation defined under GAAP and may not be comparable to other companies’ presentation. The Company has provided the non-GAAP financial measure as supplemental information and in addition to the financial measures that are calculated and presented in accordance with GAAP. Adjusted (non-GAAP) Operating Earnings should not be deemed more useful than, a substitute for, or an alternative to the most comparable GAAP Net Income measures provided in this earnings release and attachments. This press release and earnings release attachments provide reconciliations of Adjusted (non-GAAP) Operating Earnings to the most directly comparable financial measures calculated and presented in accordance with GAAP, are posted on Exelon’s website: www.exeloncorp.com, and have been furnished to the Securities and Exchange Commission on Form 8-K on Nov. 3, 2020.

Cautionary Statements Regarding Forward-Looking Information

This press release contains certain forward-looking statements within the meaning of the Private Securities Litigation Reform Act of 1995 that are subject to risks and uncertainties including among others those related to the expected or potential impact of the novel coronavirus (COVID-19) pandemic, and the related responses of various governments and regulatory bodies, our customers, and the company, on our business, financial condition, and results of operations; any such forward-looking statements, whether concerning the COVID-19 pandemic or otherwise, involve risks, assumptions, and uncertainties. Words such as “could,” “may,” “expects,” “anticipates,” “will,” “targets,” “goals,” “projects,” “intends,” “plans,” “believes,” “seeks,” “estimates,” “predicts,” and variations on such words, and similar expressions that reflect our current views with respect to future events and operational, economic, and financial performance, are intended to identify such forward-looking statements.

The factors that could cause actual results to differ materially from the forward-looking statements made by Exelon Corporation, Exelon Generation Company, LLC, Commonwealth Edison Company, PECO Energy Company, Baltimore Gas and Electric Company, Pepco Holdings LLC, Potomac Electric Power Company, Delmarva Power & Light Company, and Atlantic City Electric Company (Registrants) include those factors discussed herein, as well as the items discussed in (1) the Registrants' 2019 Annual Report on Form 10-K in (a) Part I, ITEM 1A. Risk Factors, (b) Part II, ITEM 7. Management’s Discussion and Analysis of Financial Condition and Results of Operations, and (c) Part II, ITEM 8. Financial Statements and Supplementary Data: Note 18, Commitments and Contingencies; (2) the Registrants' Third Quarter 2020 Quarterly Report on Form 10-Q (to be filed on Nov. 3, 2020) in (a) Part II, ITEM 1A. Risk Factors, (b) Part I, ITEM 2. Management’s Discussion and Analysis of Financial Condition and Results of Operations, and (c) Part I, ITEM 1. Financial Statements: Note 14, Commitments and Contingencies; and (3) other factors discussed in filings with the SEC by the Registrants.

Investors are cautioned not to place undue reliance on these forward-looking statements, whether written or oral, which apply only as of the date of this press release. None of the Registrants undertakes any obligation to publicly release any revision to its forward-looking statements to reflect events or circumstances after the date of this press release.

Exelon

GAAP Consolidated Statements of Operations and

Adjusted (non-GAAP) Operating Earnings Reconciling Adjustments

(unaudited)

(in millions, except per share data)


Three Months Ended
September 30, 2020


Three Months Ended
September 30, 2019


GAAP (a)


Non-GAAP
Adjustments


GAAP (a)


Non-GAAP
Adjustments


Operating revenues

$

8,853


$

(37

)


(b)


$

8,929


$

(77

)


(b)

Operating expenses


Purchased power and fuel

3,614


194


(b),(c)


3,952


(63

)


(b),(c)

Operating and maintenance

2,732


(718

)


(c),(d),(e),(f),

(g),(h),(i)


2,072


18


(c),(d),(e),(f),

(i)

Depreciation and amortization

1,289


(262

)


(c)


1,083


(96

)


(c)

Taxes other than income taxes

452


452


Total operating expenses

8,087


7,559


Gain (loss) on sales of assets and businesses

3


(17

)


18


(c)

Operating income

769


1,353


Other income and (deductions)


Interest expense, net

(404

)


8


(b)


(409

)


14


(b)

Other, net

421


(333

)


(j)


158


(75

)


(c),(j)

Total other income and (deductions)

17


(251

)


Income before income taxes

786


1,102


Income taxes

216


(34

)


(b),(c),(d),(e),

(f),(g),(h),(i),

(j),(k)


172


33


(b),(c),(d),(e),

(f),(i),(j),(k)

Equity in losses of unconsolidated affiliates

(1

)


(170

)


164


(f)

Net income

569


760


Net income (loss) attributable to noncontrolling interests

68


(57

)


(l)


(12

)


24


(l)

Net income attributable to common shareholders

$

501


$

772


Effective tax rate(m)

27.5

%


15.6

%


Earnings per average common share


Basic

$

0.51


$

0.79


Diluted

$

0.51


$

0.79


Average common shares outstanding


Basic

976


973


Diluted

977


974


Contacts

Paul Adams
Corporate Communications
410-245-8717

Emily Duncan
Investor Relations
312-394-2345


Read full story here
Offshore Source Logo

Offshore Source keeps you updated with relevant information concerning the Offshore Energy Sector.

Any views or opinions represented on this website belong solely to the author and do not represent those of the people, institutions or organizations that Offshore Source or collaborators may or may not have been associated with in a professional or personal capacity, unless explicitly stated.

Corporate Offices

Technology Systems Corporation
8502 SW Kansas Ave
Stuart, FL 34997

info@tscpublishing.com