Business Wire News

Latest Solar Power World rankings reaffirm continued market growth


OVERLAND PARK, Kan.--(BUSINESS WIRE)--Continuing its ascent as part of a diversified energy portfolio in an evolving, rapidly decarbonizing power industry, the U.S. solar market has eclipsed 100 gigawatts of installed electric generating capacity, doubling the solar sector’s size since 2018, a recent report found. And Black & Veatch, a global leader in power infrastructure solutions, continues to play a key role in helping satisfy the demand.

Newly released rankings by Solar Power World – the solar industry’s leading business-to-business publication – recognizes the achievements of U.S. solar developers, subcontractors and installers within the utility, commercial and residential markets. The rankings are based on kilowatts (kWs) installed by contractors in the previous year.

According to the U.S. Solar Market Insight 2020 Year-in-Review report, released in March by the Solar Energy Industries Association and energy research consultant Wood Mackenzie, the U.S. solar market grew by 43 percent in 2020, nearly double the 23-percent increase in 2019. Last year’s installed U.S. electric generating capacity was a record 19.2 gigawatts.

At a transformational time when the power industry is repowering itself, clean and affordable solar power continues to prove itself to clients as a critical option in lowering their carbon footprints,” said Paul Skurdahl, senior vice president of Black & Veatch's solar business. “With our deep expertise in helping utilities and power producers diversify their generation portfolios through renewable energy, we remain committed to delivering on the promise of solar power for a cleaner, greener world.”

The U.S. solar momentum continues to be driven by declining system costs and accelerating government and corporate mandates for clean energy. The federal government’s passage of a two-year extension on the solar investment tax credit (ITC) at the end of 2020 also is expected to accelerate solar adoption across all market segments.

Wood Mackenzie expects the U.S. solar market to quadruple by 2030, when the equivalent of one in eight American homes is projected to have solar.

Not even COVID-19 closures and slowdowns could prevent the solar industry from installing fantastic numbers last year,” said Kelly Pickerel, Solar Power World’s editor in chief. “The Solar Power World team is so glad to recognize over 400 companies on the 2021 top solar contractors list that not only survived a pandemic but thrived in spite of it.”

Editor’s Note:

  • The recently released 2021 Engineering News-Record (ENR) Sourcebook ranks Black & Veatch’s power business No. 1 for solar power services.
  • With 2.3 million kilowatts of solar capacity installed to date and nearly 949,000 kilowatts last year, Black & Veatch ranked ninth overall in Solar Power World’s latest rankings and seventh among solar engineering, procurement and construction (EPC) providers. The company also is the second-ranked solar installer in Florida.
  • Black & Veatch has been delivering solar and floating solar photovoltaic (PV) project development and implementation since 1973.
  • The company provides siting and permitting, design, independent and owner’s engineering, operations and maintenance (O&M), integration with transmission networks and full engineering, procurement and construction solutions to global clients seeking to deploy solar technologies.

About Black & Veatch

Black & Veatch is an employee-owned global engineering, procurement, consulting and construction company with a more than 100-year track record of innovation in sustainable infrastructure. Since 1915, we have helped our clients improve the lives of people around the world by addressing the resilience and reliability of our most important infrastructure assets. Our revenues in 2020 exceeded US$3.0 billion. Follow us on www.bv.com and on social media.


Contacts

JIM SUHR | +1 913-458-6995 P | +1 314-422-6927 M | This email address is being protected from spambots. You need JavaScript enabled to view it.
24-HOUR MEDIA HOTLINE | +1 866-496-9149

DIVERSITY AND GROWTH OPPORTUNITIES THROUGH NEW MWBE PROGRAM

HOUSTON--(BUSINESS WIRE)--Port Houston has announced its new MWBE Business Equity Program and Initiative, receiving praise and support from Houston Mayor Sylvester Turner and Harris County Commissioners Rodney Ellis, Adrian Garcia, and other community and business leaders at Thursday’s official announcement regarding Port Houston’s newly-formed Business Equity Division.


Port Houston has created this new division to create greater equity for minority and women-owned business enterprises participating in its procurement and contracting processes.

“I am proud that the new division will elevate the profile of Diversity, Equity, and Inclusion (DEI) at Port Houston,” said Executive Director Roger Guenther. “I assure you that it will have the organizational support and leadership needed to produce meaningful and sustainable long-term change.”

Mayor Turner and other elected officials described the new program as “historic.” Each also emphasized the potential of the program for minority and women-owned and small businesses, to sustain and grow their businesses through access, education, and opportunities – economic impacts helping families, and the community as well.

“The new Business Equity Division will report directly to me,” said Executive Director Guenther. “It will include Port Houston’s successful Small Business Program and will champion the new MWBE initiatives and DEI efforts.”

Guenther added that as Port Houston addresses DEI, it considers this new business equity program as “forward-looking,” and a “public declaration,” capturing the initiative and vision for DEI at Port Houston.

This new initiative also includes the Port Commission’s June adoption of a DEI Position Statement, reorganization in March of the Port Commission’s Procurement and Small Business Development Task Force as the Business Equity Committee, adoption of a new MWBE Development Policy in April, with an aggressive 30% aspirational goal for participation, and the creation of a strategic marketing plan for outreach about the new MWBE program to the community.

More details on Port Houston Business Equity Program are found here: https://porthouston.com/business-equity-enrollment/. Statements and full quotes provided by Port Houston Chairman Ric Campo, Port Commissioner and Business Equity Committee Chair Wendy Montoya Cloonan, Harris County Judge Lina Hidalgo, and Harris County Pct 1 Commissioner Rodney Ellis can also be found here: https://porthouston.com/business-equity-quotes/.

About Port Houston

For more than 100 years, Port Houston has owned and operated the public wharves and terminals along the Houston Ship Channel, including the area’s largest breakbulk facility and two of the most efficient and fastest-growing container terminals in the country. Port Houston is the advocate and a strategic leader for the Channel. The Houston Ship Channel complex and its more than 200 public and private terminals, collectively known as the Port of Houston, is the nation’s largest port for waterborne tonnage and an essential economic engine for the Houston region, the state of Texas, and the U.S. The Port of Houston supports the creation of nearly 1.35 million jobs in Texas and 3.2 million jobs nationwide, and economic activity totaling $339 billion in Texas – 20.6 percent of Texas’ total gross domestic product (GDP) – and $801.9 billion in economic impact across the nation. For more information, visit the website at www.PortHouston.com.


Contacts

Lisa Ashley, Director, Media Relations
Office: 713-670-2644; Mobile: 832-247-8179
E-mail: This email address is being protected from spambots. You need JavaScript enabled to view it.

Acadia Series delivers industry-leading total performance and improved indoor air quality

ROCKLAND, Mass.--(BUSINESS WIRE)--The Acadia Series washable energy recovery plates from Airxchange are now available to deliver unmatched total performance and improved building HVAC system efficiency.


Acadia’s polymer plate design aligns with Airxchange’s proprietary polymer energy recovery wheel design to offer engineers, building owners and original equipment manufacturers a comprehensive choice of washable residential, commercial and industrial air-to-air energy recovery components.

“We developed the Acadia Series to deliver performance levels not seen in other plates, while also making them washable to help engineers and facility managers improve indoor air quality,” said Randall Steele, CEO of Airxchange. “Because you can clean them – and because we incorporated polymer media that won’t degrade – the plates are designed for an extended lifespan.”

The Acadia Series is available in a range of sizes, from 50 to 4,000 CFM, has a high-structured plate strength with up to five inches of pressure differential, includes an antibacterial coating and is easy to clean.

Sequoia and Sedona Series round out new lineup of plates

The Sequoia Series offers a lower cost alternative to the Acadia Series with all the same range of sizes and features except the washable media.

Additionally, the new Sedona Series is designed for smaller systems and solutions, where a max airflow of 450 CFM is ideal. Also polymer, the Sedona delivers 75-85% sensible heat transfer efficiency in a cross-counter airflow design.

“While the washable media plays an important role in maintaining performance levels, we know high-quality, non-corroding polymer energy recovery components are a favorite among engineers and our original equipment manufacturing (OEM) customer base,” Steele said. “For that reason, we wanted to deliver several more premium options to select from.”

For more information on Airxchange’s new energy recovery plates, visit Airxchange.com.

About Airxchange

Airxchange has over 35 years of experience in the energy recovery industry. Its mission is to design and manufacture high-quality products that perform reliably and effectively for the life of an HVAC system, reduce energy consumption, and improve indoor air quality. The addition of high-tech materials and innovative designs to a technology based on fundamental scientific principles has earned Airxchange the trust of OEMs around the world. Airxchange continues to innovate and support customers to meet evolving market demands for energy recovery ventilation technology. Visit Airxchange.com for more information.


Contacts

Media contact: Andrea Leung, This email address is being protected from spambots. You need JavaScript enabled to view it.
Photos: https://www.dropbox.com/sh/yey2l51cc5t08hm/AABeS0PR_h7ULyLkTyfoLFzha?dl=0

PARIS--(BUSINESS WIRE)--Regulatory News:

Technip Energies N.V. ("Technip Energies") (Paris:TE) (ISIN: NL0014559478) announces that on 26 July, 2021, it published its Half-Year Financial Report for the six months ended 30 June 2021.

The Half-Year Financial Report includes condensed consolidated financial statements (prepared in accordance with IAS 34), an interim management report and a statement of the persons responsible for the Half-Year Financial Report.

A copy of the Half-Year Financial Report can be found on Technip Energies’ website (https://investors.technipenergies.com/financial-information/results-center) and is, or will shortly be, available for inspection at https://www.info-financiere.fr.

About Technip Energies

Technip Energies is a leading Engineering & Technology company for the Energy Transition, with leadership positions in LNG, hydrogen and ethylene as well as growing market positions in blue and green hydrogen, sustainable chemistry and CO2 management. The Company benefits from its robust project delivery model supported by an extensive technology, products and services offering.

Operating in 34 countries, our 15,000 people are fully committed to bringing our clients’ innovative projects to life, breaking boundaries to accelerate the energy transition for a better tomorrow.

Technip Energies shares are listed on Euronext Paris. In addition, Technip Energies has a Level 1 sponsored American Depositary Receipts (“ADR”) program, with its ADRs trading over-the-counter.

For further information: www.technipenergies.com.


Contacts

Investor Relations
Phillip Lindsay
Vice President, Investor Relations
Tel: +44 20 3429 3929
Email: This email address is being protected from spambots. You need JavaScript enabled to view it.

Media Relations
Stella Fumey
Director Press Relations & Digital Communications
Tel: +33 1 85 67 40 95
Email: This email address is being protected from spambots. You need JavaScript enabled to view it.

AirWarden™ System Provides Pilot and Drone Detection and Location in New York City During Joint Agency Materiel Experiment

OCEANPORT, N.J.--(BUSINESS WIRE)--#Army--AeroDefense was invited to provide its mobile drone detection capabilities in October 2020 at the US ARMY Combat Capabilities Development Command (DEVCOM) in Partnership with the New York Police Department – Subterranean/Dense Urban Community of Practice: Counter Unmanned Aircraft System Materiel Experiment in Lower Manhattan.

Dense Urban Environments (DUEs) challenge drone detection systems due to heavy Radio Frequency (RF) traffic and large obstructions. Complex structures that cause signal multipath and blockage issues necessitate high placement of equipment and typically cause radar systems to fail. Hardware must be discreet and easily portable as the area of protection can suddenly change in real-world scenarios.

AeroDefense tested its RF-based AirWarden system temporary/portable and vehicle-based sensors that operate while in motion. AeroDefense did not know in advance flight paths, launch locations, or the type or number of drones to be flown and only knew the designated protection area. The host agencies used several different drones which varied in size. One was custom built and several were fit with 3D printed boxes to mimic a payload.

The host agencies have published a detailed report that explains how the AirWarden system performed during the experiment with flight by flight analysis. Federal, state, and local government agencies can request access to the report. Please email This email address is being protected from spambots. You need JavaScript enabled to view it. for instructions.

Linda Ziemba, Founder and CEO of AeroDefense, said, “Our AirWarden system, developed in New York metro, has been deployed in a high RF stadium environment since 2018 and had previously proven effective in New York City’s Times Square, so we felt very confident going into the experiment. The AirWarden system’s ability to compete with all the RF noise and operate in motion, coupled with its ruggedized and compact hardware design make it a very unique and practical solution for DUEs.”

About AeroDefense: AeroDefense offers fixed and mobile drone detection solutions for stadiums, airports, correctional facilities, military forces, and other critical infrastructure. AeroDefense’s patented Radio Frequency (RF) based drone detection system, AirWarden, detects, classifies, locates, and tracks both drone and pilot simultaneously, providing actionable intelligence to respond effectively (and safely) to drone threats. Because the AirWarden system passively detects drone signals via RF spectrum sensing, it recognizes devices it has not seen before, unlike systems reliant on signature databases, and does not violate federal criminal surveillance laws. Based in Oceanport, NJ, AeroDefense is privately held with all engineering, manufacturing, and support based in the US. The AirWarden system is the first and only drone detection solution to receive the Department of Homeland Security Support Anti-Terrorism by Fostering Effective Technologies Act Developmental Testing and Evaluation Designation. To learn more about AeroDefense and AirWarden, please visit www.AeroDefense.tech.


Contacts

Lexi Rinaudo, Marketing Manager
AeroDefense
This email address is being protected from spambots. You need JavaScript enabled to view it.
225.270.1347

NEW YORK--(BUSINESS WIRE)--International Seaways, Inc. (NYSE: INSW) (the “Company” or “INSW”) announced today that it plans to release second quarter 2021 results before market open on Monday, August 9, 2021.


The Company will host a conference call to discuss its second quarter 2021 results at 9:00 a.m. Eastern Time (“ET”) on Monday, August 9, 2021.

To access the call, participants should dial (855) 940-9471 for domestic callers and (412) 317-5211 for international callers. Please dial in ten minutes prior to the start of the call.

A live webcast of the conference call will be available from the Investor Relations section of the Company’s website at https://www.intlseas.com/.

An audio replay of the conference call will be available starting at 12:00 p.m. ET on Monday, August 9, 2021 through 11:59 p.m. ET on Monday, August 16, 2021 by dialing (877) 344-7529 for domestic callers and (412) 317-0088 for international callers, and entering Access Code 10159011.

About International Seaways, Inc.

International Seaways, Inc. (NYSE: INSW) is one of the largest tanker companies worldwide providing energy transportation services for crude oil and petroleum products in International Flag markets. International Seaways owns and operates a fleet of 102 vessels, including 13 VLCCs (including three newbuildings), 15 Suezmaxes, five Aframaxes/LR2s, 13 Panamaxes/LR1s, 48 MR tankers and six Handy tankers. Through joint ventures, it has ownership interests in two floating storage and offloading service vessels. International Seaways has an experienced team committed to the very best operating practices and the highest levels of customer service and operational efficiency. International Seaways is headquartered in New York City, NY. Additional information is available at https://www.intlseas.com.

Forward-Looking Statements

This release contains forward-looking statements. In addition, the Company may make or approve certain statements in future filings with the U.S. Securities and Exchange Commission (SEC), in press releases, or in oral or written presentations by representatives of the Company. All statements other than statements of historical facts should be considered forward-looking statements. These matters or statements may relate to the Company’s merger with Diamond S and plans to issue dividends, its prospects, including statements regarding vessel acquisitions, expected synergies, trends in the tanker markets, and possibilities of strategic alliances and investments. Forward-looking statements are based on the Company’s current plans, estimates and projections, and are subject to change based on a number of factors. Investors should carefully consider the risk factors outlined in more detail in the Annual Report on Form 10-K for 2020 for the Company, the Quarterly Report on Form 10-Q for the quarter ended June 30, 2021, the Company’s Amended Registration Statement on Form S-4 dated June 3, 2021, and in similar sections of other filings made by the Company with the SEC from time to time. The Company assumes no obligation to update or revise any forward-looking statements. Forward-looking statements and written and oral forward-looking statements attributable to the Company or its representatives after the date of this release are qualified in their entirety by the cautionary statements contained in this paragraph and in other reports previously or hereafter filed by the Company with the SEC.


Contacts

Investor Relations & Media:
International Seaways, Inc.
David Siever, 212-578-1635
This email address is being protected from spambots. You need JavaScript enabled to view it.

Ameresco expands its U.K. presence with £1.1 million project delivering roof-mounted solar PV to 7 courts and 3 prisons in the Midlands

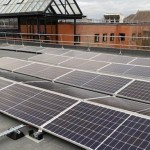
FRAMINGHAM, Mass. & LONDON--(BUSINESS WIRE)--#cleanenergy--Ameresco, Inc., (NYSE: AMRC), a leading cleantech integrator specializing in energy efficiency and renewable energy, today announced the completion of its roof mount solar PV project with the United Kingdom’s Ministry of Justice. The centrally funded £1.1 million project saw the delivery of roof-mounted solar to seven courts and three prisons in the U.K.’s Midlands.


The implemented solar PV will provide an energy savings of 427,602 kWh per year, which is equivalent to a carbon savings of 106.2 tonnes per year. Ameresco worked with Ministry of Justice project managers throughout the installation process to ensure that there was no disruption to the court buildings’ day-to-day operations, even given an influx of traffic due to a backlog of cases as a result of the Covid-19 pandemic. Initial project construction on the Midlands courts began in December of 2020 and was expected to be completed by March 2021.

Ameresco will continue to deliver 12 months of operations and maintenance support, as well as ongoing metering of the arrays across all sites. The completed project will advance the Ministry of Justice’s long-term goals to decarbonize federal buildings, improve grid resilience and facilitate a return-to-work of the building and renewables sector following the lift of pandemic restrictions and ordinances.

“We are pleased to support the Ministry of Justice in their continued efforts to develop a more sustainable future,” said Britta MacIntosh, senior vice president, Ameresco. “Utilizing rooftop space for renewable energy generation is a prime example of sustainable leadership from a government entity that works at the heart of the justice system.”

Construction was completed in March 2021.

To learn more about the energy efficiency solutions offered by Ameresco, visit www.ameresco.com/energy-efficiency/.

About Ameresco, Inc.

Founded in 2000, Ameresco, Inc. (NYSE:AMRC) is a leading cleantech integrator and renewable energy asset developer, owner and operator. Our comprehensive portfolio includes energy efficiency, infrastructure upgrades, asset sustainability and renewable energy solutions delivered to clients throughout North America and the United Kingdom. Ameresco’s sustainability services in support of clients’ pursuit of Net Zero include upgrades to a facility’s energy infrastructure and the development, construction, and operation of distributed energy resources. Ameresco has successfully completed energy saving, environmentally responsible projects with Federal, state and local governments, healthcare and educational institutions, housing authorities, and commercial and industrial customers. With its corporate headquarters in Framingham, MA, Ameresco has more than 1,000 employees providing local expertise in the United States, Canada, and the United Kingdom. For more information, visit www.ameresco.com.

About U.K. Ministry of Justice

The Ministry of Justice is a major UK government department, at the heart of the justice system. We work to protect and advance the principles of justice. Our vision is to deliver a world-class justice system that works for everyone in society. For more information visit www.gov.uk/government/organisations/ministry-of-justice.

The announcement of completion of a customer’s project contract is not necessarily indicative of the timing or amount of revenue from such contract, of the company’s overall revenue for any particular period or of trends in the company’s overall total project backlog. This project was included in our previously reported contracted backlog as of March 31, 2021.


Contacts

Media Contact:
Ameresco: Leila Dillon, 508-661-2264, This email address is being protected from spambots. You need JavaScript enabled to view it.

HOUSTON--(BUSINESS WIRE)--SilverBow Resources, Inc. (NYSE: SBOW) (“SilverBow” or “the Company”) announced today that it will present at EnerCom’s The Oil & Gas Conference in Denver, Colorado on Monday, August 16, 2021. The Corporate Presentation being used will be accessible on the Company’s website at www.sbow.com under the “Investor Relations” section.


ABOUT SILVERBOW RESOURCES, INC.

SilverBow Resources, Inc. (NYSE: SBOW) is a Houston-based energy company actively engaged in the exploration, development, and production of oil and gas in the Eagle Ford Shale in South Texas. With over 30 years of history operating in South Texas, the Company possesses a significant understanding of regional reservoirs which it leverages to assemble high quality drilling inventory while continuously enhancing its operations to maximize returns on capital invested. For more information, please visit www.sbow.com.


Contacts

Jeff Magids
Director of Finance & Investor Relations
(281) 874-2700, (888) 991-SBOW

Logistics professionals will gain insights for managing disruptions and advancing strategies during August 4th webinar

DALLAS--(BUSINESS WIRE)--#3PL--Transplace, the leading provider of advanced logistics technology and solutions, announces its Third Quarter 2021 Logistics Market Update Report and Webinar with strategies for greater supply chain stability in the face of industry-wide imbalances and uncertainty.

Logistics and supply chain professionals are invited to a complimentary webinar on August 4 at 1 p.m. ET to access the full report. Attendees will learn about transportation trends and economic indicators from Transplace SVP of Data Science & Engineering, Matt Harding, and Transplace SVP of Consulting & Network Services, Ben Cubitt. Transplace CMO Carmen Palo will moderate the enlightening event, featuring a live audience Q&A.


During the webinar, discover data-backed intelligence and best practices for North American and European shippers to advance logistics strategies, including:

  • Strong recommendations for cultivating shipper-carrier partnerships and collaborations, including frequent bids and rates revisions to reduce capacity risk and mitigate cost increases
  • Suggestions for improving forecast accuracy to raise allocations on extremely tight lanes for both import and export
  • Vital guidance for adding secondary carriers who may grow if volumes increase or core carrier services falter
  • Assistance for staying watchful of market conditions and exploring new modes of transportation
  • Advice on alternate ports that may have higher freight rates but are less congested, such as Baltimore, Wilmington, Philadelphia and Mobile

Logistics, supply chain and transportation professionals are invited to register for the August 4 webinar here.

About Transplace
Transplace powers one of the largest managed transportation and logistics networks in the world. Our tech-enabled services and solutions platform are backed by the unrivaled combination of innovative technology and a dedicated team of domain experts, engineers and data scientists. We are committed to thrilling our customers by consistently improving supply chain performance and providing greater visibility and control of their logistics networks. Companies of all sizes rely on Transplace to deliver trusted outcomes through best-in-class logistics management, strategic capacity and cross-border services. Follow the company on Twitter, Facebook, Transplace.com and the Transplace Industry Blog.


Contacts

Media Contact: This email address is being protected from spambots. You need JavaScript enabled to view it.
Grace Platon | +1 214.901.4744
This email address is being protected from spambots. You need JavaScript enabled to view it.

BROOKLYN HEIGHTS, Ohio--(BUSINESS WIRE)--GrafTech International Ltd. (NYSE:EAF), a leading manufacturer of high-quality graphite electrode products essential to the production of electric arc furnace steel, announced the opening of a new sales office in Chiba-shi, Japan. This new office will provide GrafTech’s customers in the region with local commercial, customer service and technical support. This office also expands the company’s global sales and technical support personnel.


“We are fully committed to the Japanese market where we have been operating successfully for over 25 years,” said Inigo Perez, Senior Vice President, Commercial. “We are very pleased to be able to provide our Japanese customers commercial and technical support from our newest location in Chiba-shi, Japan. This office reflects our dedication to this region and to building highly skilled teams that serve our customers across our global footprint.”

About GrafTech

GrafTech International Ltd. is a leading manufacturer of high-quality graphite electrode products essential to the production of electric arc furnace steel and other ferrous and non-ferrous metals. The Company has a competitive portfolio of low-cost, ultra-high power graphite electrode manufacturing facilities, including three of the highest capacity facilities in the world. We are the only large-scale graphite electrode producer that is substantially vertically integrated into petroleum needle coke, a key raw material for graphite electrode manufacturing. This unique position provides us with competitive advantages in product quality and cost.

Forward-looking statements

This press release contains forward-looking statements that reflect management's current views of future events and operations. You can identify these forward-looking statements by the use of forward-looking words such as “will,” “may,” “plan,” “estimate,” “project,” “believe,” “anticipate,” “expect,” “foresee,” “intend,” “should,” “would,” “could,” “target,” “goal,” “continue to,” “positioned to,” “are confident,” or the negative versions of those words or other comparable words. These forward-looking statements are based on information currently available to the Company as of the date of this press release. It is important to note that these forward-looking statements are not guarantees of future performance and involve risks and uncertainties, including, but not limited to, the ability of the Company to implement its strategy and expand its operations. Certain of the risks and uncertainties to which the Company is subject are described in the “Forward Looking Statements” and “Risk Factors” in reports and statements filed by the Company with the U.S. Securities and Exchange Commission. The Company does not undertake any obligation to update or revise these forward-looking statements to reflect new events or circumstances except as required by law.


Contacts

Wendy Watson
216-676-2600

CHICAGO--(BUSINESS WIRE)--The Board of Directors of Exelon Corporation declared a regular quarterly dividend of $0.3825 per share on Exelon’s common stock. The dividend is payable on Friday, September 10, 2021, to shareholders of record of Exelon as of 5 p.m. Eastern time on Friday, August 13, 2021.


About Exelon Corporation

Exelon Corporation (Nasdaq: EXC) is a Fortune 100 energy company with the largest number of electricity and natural gas customers in the U.S. Exelon does business in 48 states, the District of Columbia and Canada and had 2019 revenue of $33 billion. Exelon serves approximately 10 million customers in Delaware, the District of Columbia, Illinois, Maryland, New Jersey and Pennsylvania through its Atlantic City Electric, BGE, ComEd, Delmarva Power, PECO and Pepco subsidiaries. Exelon is one of the largest competitive U.S. power generators, with 31,000 megawatts of nuclear, gas, wind, solar and hydroelectric generating capacity comprising one of the nation’s cleanest and lowest-cost power generation fleets. The company’s Constellation business unit provides energy products and services to approximately 2 million residential, public sector and business customers, including three fourths of the Fortune 100. Follow Exelon on Twitter @Exelon.


Contacts

Exelon Investor Relations Hotline
312-394-2345
 
Paul Adams
Exelon Corporate Communications
410-470-4167
This email address is being protected from spambots. You need JavaScript enabled to view it.

Completes Two Demonstrations for DGI Dissolved Gas Infusion Water Treatment Technology

WARRENVILLE, Ill.--(BUSINESS WIRE)--Fuel Tech, Inc. (NASDAQ: FTEK), a technology company providing advanced engineering solutions for the optimization of combustion systems, emissions control and water treatment in utility and industrial applications, today announced the receipt of multiple air pollution control (APC) contracts from customers in Korea, North America, and Europe. These awards have an aggregate value of approximately $4.5 million.


The Company also announced the completion of two on-site US demonstrations of its DGI Dissolved Gas Infusion water treatment technology.

APC Awards

An order from Korea was received for Selective Catalytic Reduction (SCR) technology including an ULTRA® system, that will be installed on a natural gas-fired Combined Cycle plant in the Pacific Rim. SCR technology uses a catalyst along with urea or ammonia as the reagent to provide high levels of nitrogen oxide (NOx) reduction. Fuel Tech’s ULTRA process provides for the safe and cost-effective on-site conversion of urea to ammonia for use as a reagent where SCR is used to reduce NOx, eliminating the hazards associated with the transport, storage and handling of anhydrous or aqueous ammonia. This is the second unit on which we have installed the SCR and ULTRA technologies at the same site. Deliveries are expected to be completed in the second quarter of 2022.

An order was received in Europe for catalyst replacement for an existing Fuel Tech SCR system. Delivery is scheduled for the third quarter of 2021.

In North America a contract was received for a NOxOUT® Selective Non-Catalytic Reduction (SNCR) system for a biomass-fired unit. Fuel Tech’s SNCR technology is a proven solution for utility and industrial combustion unit owners looking to comply with more stringent NOx control requirements. Work is expected to be completed by the fourth quarter of 2021.

Vincent J. Arnone, President and Chief Executive Officer, commented, “We are pleased to announce these contract awards and we have begun to see activity in our markets increase with the improved economic outlook as the effects of the COVID-19 pandemic subside. The order from Korea demonstrates Fuel Tech’s on-going commitment and our long-term partnership approach to meet the environmental compliance needs of utility plant operators implementing our advanced technology solutions.”

DGI Dissolved Gas Infusion Demonstrations

Fuel Tech also announced the completion of two demonstration contracts in the US where DGI technology provided a source of dissolved oxygen for wastewater treatment plants evaluating the use of advanced aeration in addition to their existing treatment processes to accommodate periods of high wastewater treatment demand.

Mr. Arnone concluded, “We are excited to announce the incremental demonstrations of our DGI wastewater treatment technology as we look to expand the use of DGI to meet customer needs in a variety of market segments. We continue to develop DGI as a potential cost-effective retrofit technology for sites with physical or capital constraints.”

About Fuel Tech

Fuel Tech develops and commercializes state-of-the-art proprietary technologies for air pollution control, process optimization, water treatment, and advanced engineering services. These technologies enable customers to operate in a cost-effective and environmentally sustainable manner. Fuel Tech is a leader in nitrogen oxide (NOx) reduction and particulate control technologies and its solutions have been in installed on over 1,200 utility, industrial and municipal units worldwide. The Company’s FUEL CHEM® technology improves the efficiency, reliability, fuel flexibility, boiler heat rate, and environmental status of combustion units by controlling slagging, fouling, corrosion and opacity. Water treatment technologies include DGI™ Dissolved Gas Infusion Systems which utilize a patented nozzle to deliver supersaturated oxygen solutions and other gas-water combinations to target process applications or environmental issues. This infusion process has a variety of applications in the water and wastewater industries, including remediation, aeration, biological treatment and wastewater odor management. Many of Fuel Tech’s products and services rely heavily on the Company’s exceptional Computational Fluid Dynamics modeling capabilities, which are enhanced by internally developed, high-end visualization software. For more information, visit Fuel Tech’s web site at www.ftek.com.

NOTE REGARDING FORWARD-LOOKING STATEMENTS

This press release contains “forward-looking statements” as defined in Section 21E of the Securities Exchange Act of 1934, as amended, which are made pursuant to the safe harbor provisions of the Private Securities Litigation Reform Act of 1995 and reflect Fuel Tech’s current expectations regarding future growth, results of operations, cash flows, performance and business prospects, and opportunities, as well as assumptions made by, and information currently available to, our management. Fuel Tech has tried to identify forward-looking statements by using words such as “anticipate,” “believe,” “plan,” “expect,” “estimate,” “intend,” “will,” and similar expressions, but these words are not the exclusive means of identifying forward-looking statements. These statements are based on information currently available to Fuel Tech and are subject to various risks, uncertainties, and other factors, including, but not limited to, those discussed in Fuel Tech’s Annual Report on Form 10-K in Item 1A under the caption “Risk Factors,” and subsequent filings under the Securities Exchange Act of 1934, as amended, which could cause Fuel Tech’s actual growth, results of operations, financial condition, cash flows, performance and business prospects and opportunities to differ materially from those expressed in, or implied by, these statements. Fuel Tech undertakes no obligation to update such factors or to publicly announce the results of any of the forward-looking statements contained herein to reflect future events, developments, or changed circumstances or for any other reason. Investors are cautioned that all forward-looking statements involve risks and uncertainties, including those detailed in Fuel Tech’s filings with the Securities and Exchange Commission.


Contacts

Vince Arnone
President and Chief Executive Officer
(630) 845-4500

Devin Sullivan
Senior Vice President
The Equity Group Inc.
(212) 836-9608

LINDEN, N.J. & HOUSTON--(BUSINESS WIRE)--Linden Cogeneration (Linden Cogen) and Phillips 66 (NYSE: PSX) have reached an agreement for Linden Cogen to take Bayway Refinery produced hydrogen-containing fuel gas, and blend it with natural gas used to fuel the 172MW F-class Linden Cogen unit 6 gas turbine. This project will improve overall refinery and Linden Cogen operational efficiency and will reduce air emissions primarily through improved furnace and flare efficiencies.


“We will be making the modifications to the unit 6 gas turbine, including PSM’s FlameSheet™ system, that will enable using a refinery produced fuel gas and up to 40% hydrogen in 2022,” said Todd Kerschbaum, Chief Technical Officer for JERA Americas, the asset management company for Linden Cogen. “While the actual reductions will be based on how much hydrogen is used at any given time of plant operation, we anticipate a reduction in CO2 emissions up to approximately 10% of annual CO2 emissions in unit 6.”

“Both Bayway Refinery and Linden Cogeneration are part of the Bayway Industrial Complex where company operations are interdependent,” said Chris Gallo, Bayway General Manager. “The Phillips 66 Bayway Refinery is very pleased to be part of this investment that improves energy efficiency and reduces carbon intensity. This is an example of how a collaborative project can simultaneously result in improved operations and emission reductions.”

LINDEN COGENERATION
Linden Cogen is a 972 MW natural gas-fueled thermal cogeneration plant located in Linden, New Jersey. Power and steam produced from the power generation facility is supplied for industrial use under long-term contracts and most of the electricity is also sold into the New York Independent System Operator and PJM power markets. The facility, which began operating in 1992, has six gas turbines and three steam turbines. Linden Cogen is owned by JERA Americas (50%), EGCO (28%), DBJ (12%), GS-Platform Partners (10%).

PHILLIPS 66
Phillips 66 is a diversified energy manufacturing and logistics company. With a portfolio of Midstream, Chemicals, Refining, and Marketing and Specialties businesses, the company processes, transports, stores and markets fuels and products globally. Headquartered in Houston, the company has 14,200 employees committed to safety and operating excellence. Phillips 66 had $55 billion of assets as of March 31, 2021. Phillips 66’s Bayway Refinery, located on New York Harbor in Linden, processes mainly light, low-sulfur crude oil. For more information, visit www.phillips66.com.

PSM (a Hanwha company)
PSM is a leading supplier of innovative, technologically advanced service solutions for large-frame multi-OEM gas turbine power generating assets owners worldwide. PSM, based in Jupiter, FL and sister company, Thomassen Energy, based in the Netherlands, are owned by Hanwha General Chemical, part of the Hanwha Group. For more information, visit www.psm.com.


Contacts

This email address is being protected from spambots. You need JavaScript enabled to view it.


STAMFORD, Conn.--(BUSINESS WIRE)--Crane Co., a diversified manufacturer of highly engineered industrial products, today announced its regular quarterly dividend of $0.43 per share for the third quarter of 2021. The dividend is payable on September 8, 2021 to shareholders of record as of the close of business on August 31, 2021.


Crane Co. is a diversified manufacturer of highly engineered industrial products. Founded in 1855, Crane Co. provides products and solutions to customers in the chemicals, oil & gas, power, automated payment solutions, banknote design and production and aerospace & defense markets, along with a wide range of general industrial and consumer related end markets. The Company has four business segments: Aerospace & Electronics, Process Flow Technologies, Payment & Merchandising Technologies, and Engineered Materials. On May 24, 2021, Crane announced that it had signed an agreement to divest its Engineered Materials segment; that sale is pending, subject to customary closing conditions and regulatory approval. Crane Co. has approximately 11,000 employees in the Americas, Europe, the Middle East, Asia and Australia. Crane Co. is traded on the New York Stock Exchange (NYSE:CR). For more information, visit www.craneco.com.


Contacts

Jason D. Feldman
Vice President, Investor Relations
203-363-7329
www.craneco.com

EVPassport Participates in 5G Studio, a Collaboration Between Newlab and Verizon, to Pilot 5G EV Chargers for Large EV Fleets at the Brooklyn Navy Yard

NEW YORK--(BUSINESS WIRE)--EVPassport, the EV charging hardware and software platform for purpose-driven organizations, today unveiled its 5G EV charging and edge computing platform powered by Verizon’s 5G Ultra Wideband network. In May, EVPassport was chosen to participate in Newlab’s 5G Studio, created by Newlab and Verizon (NYSE: VZ). EVPassport installed three Level 2 chargers at Newlab in the Brooklyn Navy Yard to demonstrate the company's ability to provide the fastest, simplest and most reliable charging solutions for EV fleets.


The powerful combination of Verizon’s 5G Ultra Wideband network and mobile edge compute allowed EVPassport to reduce latency in charging sessions by more than 50% and orchestrate chargers in real-time to rebalance load based on EV charging levels -- enabling the ability to automatically prioritize power to vehicles with lower charges. Combining 5G technology with EVPassport’s seamless charging experience, large EV fleets and consumer-facing brands can now deliver faster and more reliable power to their drivers.

“The only way to provide EV charging that actually works is to build a platform around open data and APIs,” said EVPassport CEO and Co-founder, Aaron Fisher. “The challenge is networks powered by 4G do not provide the level of connectivity required to limit latency and ensure reliability with the amount of data flowing across an intelligent platform, especially at the scale required by large fleets. The work we did through our participation in the 5G Studio allowed us to solve this issue.”

Open APIs enable integrations with popular services like Google Maps and Apple Pay, allowing drivers to see charger locations and click directly through to start a charging session. EVPassport’s robust APIs enable fleets and large brands to integrate live EVPassport chargers directly into their existing driver-facing applications and services to control their customers' experience and ensure fast and reliable charging.

“We have had EVPassport chargers on our properties since the company launched its open platform concept,” said Newlab CEO, Shaun Stewart. “The new 5G chargers allow us to install additional EV chargers without increasing power resources. I can’t wait to see what EVPassport does next to raise the bar even higher for how EV charging should work.”

About EVPassport

EVPassport is the EV charging hardware and software platform for purpose-driven organizations. Brands committed to sustainability rely on EVPassport to provide their customers with the most seamless payment experience to charge any electric vehicle without requiring a separate app, account or a top-up balance. And EVPassport is the only platform that enhances customer engagement for these companies by providing custom branded hardware with API-powered software that easily integrates with their existing applications and services. For more information, follow EVPassport on Twitter (@EVPassport), Instagram (@EVPassport) and LinkedIn, or visit www.EVPassport.com.


Contacts

Media Contact
Jake Schuster
fama PR for EVPassport
This email address is being protected from spambots. You need JavaScript enabled to view it.

HOUSTON--(BUSINESS WIRE)--Black Stone Minerals, L.P. (NYSE: BSM) (“Black Stone,” “BSM,” or “the Company”) today declared the distribution attributable to the second quarter of 2021. Additionally, the Company announced a new sustainability initiative and the date of its second quarter 2021 earnings call.


Common Distribution

The Board of Directors of the general partner (the “Board”) has approved a cash distribution for common units attributable to the second quarter of 2021 of $0.25 per unit. This represents an increase of approximately 43% over the common distribution paid with respect to the prior quarter. In determining the distribution level with respect to the second quarter, the Board considered a base distribution of $0.20 per unit, which it expects will be sustainable through the end of 2021, plus a special distribution of $0.05 per unit which reflects certain positive, non-recurring items in the quarter which will be discussed in greater detail in the earnings release scheduled for August 2, 2021. Distributions will be payable on August 20, 2021 to unitholders of record on August 13, 2021.

Thomas L. Carter, Jr., Black Stone Minerals’ Chief Executive Officer and Chairman, commented, “We are pleased to announce a significant distribution increase for the second quarter. The increase in our base distribution rate to $0.20 per unit was driven by the more constructive commodity price environment and the positive momentum in our core development areas. In addition, our very low debt balance allows us greater flexibility to reward our unitholders when we have positive one-time items occur in a quarter. Even with this additional $0.05 per unit special distribution we expect to have solid coverage for the quarter.

Our improved distribution outlook extends beyond the remainder of 2021. With the uplift in our hedge prices into next year, we anticipate strong potential for further increases in the regular distribution level as we look forward to 2022.”

New Sustainability Initiative

Black Stone has created a nascent Carbon Responsibility Program and has taken first steps towards proactive measures in environmental responsibility. The Company expects to evaluate numerous alternatives in the future to be among the leaders in the mineral space in this area.

Black Stone has entered into several arrangements over the course of 2021 where the Company has granted surface use waivers on its mineral acreage in favor of solar developers. Proceeds to Black Stone from these efforts total approximately $1.1 million year-to-date. The Company plans to use a portion of these proceeds to purchase carbon credits to offset part of the CO2 emissions associated with its minerals production. Black Stone expects that the carbon credits purchased with these proceeds may more than offset the direct CO2 emissions from its Shelby Trough Angelina County 2021 royalty production.

Mr. Carter commented, “This new initiative, while modest in scale, is in recognition that we all need to do our part to lower our carbon footprint. As a minerals company, we have limited ways to directly impact emissions. This program builds on the positive environmental impact of supporting solar power generation on certain of our mineral acreage and further promotes our environmental stewardship by using those proceeds to offset emissions from one of our core areas.”

Earnings Conference Call

The Company is scheduled to release details regarding its results for the second quarter of 2021 after the close of trading on August 2, 2021. A conference call to discuss these results is scheduled for August 3, 2021 at 9:00 a.m. Central time (10:00 a.m. Eastern time). The conference call will be broadcast live in listen-only mode on the company’s investor relations website at www.blackstoneminerals.com. If you would like to ask a question, the dial-in number for the conference call is 877-447-4732 for domestic participants and 615-247-0077 for international participants. The conference ID for the call is 5597384. Call participants are advised to call in 10 minutes in advance of the call start time.

A telephonic replay of the conference call will be available approximately two hours after the call through September 2, 2021, at 855-859-2056 for domestic replay and 404-537-3406 for international replay. The conference ID for the replay is 5597384.

About Black Stone Minerals, L.P.

Black Stone Minerals is one of the largest owners of oil and natural gas mineral interests in the United States. The Company owns mineral interests and royalty interests in 41 states in the continental United States. Black Stone believes its large, diversified asset base and long-lived, non-cost-bearing mineral and royalty interests provide for stable to growing production and reserves over time, allowing the majority of generated cash flow to be distributed to unitholders.

Information for Non-U.S. Investors

This press release is intended to be a qualified notice under Treasury Regulation Section 1.1446-4(b). Although a portion of Black Stone Minerals’ income may not be effectively connected income and may be subject to alternative withholding procedures, brokers and nominees should treat 100% of Black Stone Minerals’ distributions to non-U.S. investors as being attributable to income that is effectively connected with a United States trade or business. Accordingly, Black Stone Minerals’ distributions to non-U.S. investors are subject to federal income tax withholding at the highest marginal rate, currently 37.0% for individuals.

Forward-Looking Statements

This news release includes forward-looking statements. All statements, other than statements of historical facts, included in this news release that address activities, events or developments that the Company expects, believes or anticipates will or may occur in the future are forward-looking statements. Terminology such as “will,” “may,” “should,” “expect,” “anticipate,” “plan,” “project,” “intend,” “estimate,” “believe,” “target,” “continue,” “potential,” the negative of such terms, or other comparable terminology often identify forward-looking statements. Except as required by law, Black Stone Minerals undertakes no obligation and does not intend to update these forward-looking statements to reflect events or circumstances occurring after this news release. You are cautioned not to place undue reliance on these forward-looking statements, which speak only as of the date of this news release. All forward-looking statements are qualified in their entirety by these cautionary statements. These forward-looking statements involve risks and uncertainties, many of which are beyond the control of Black Stone Minerals, which may cause the Company’s actual results to differ materially from those implied or expressed by the forward-looking statements. Important factors that could cause actual results to differ materially from those in the forward-looking statements include, but are not limited to, those summarized below:

  • the Company’s ability to execute its business strategies;
  • the scope and duration of the COVID-19 pandemic and actions taken by governmental authorities and other parties in response to the pandemic;
  • the volatility of realized oil and natural gas prices;
  • the level of production on the Company’s properties;
  • overall supply and demand for oil and natural gas, as well as regional supply and demand factors, delays, or interruptions of production;
  • conservation measures, technological advances, and general concern about the environmental impact of the production and use of fossil fuels;
  • the Company’s ability to replace its oil and natural gas reserves;
  • the Company’s ability to identify, complete, and integrate acquisitions;
  • general economic, business, or industry conditions;
  • competition in the oil and natural gas industry; and
  • the level of drilling activity by the Company's operators, particularly in areas such as the Shelby Trough where the Company has concentrated acreage positions.


Contacts

Black Stone Minerals, L.P. Contacts

Jeff Wood
President and Chief Financial Officer

Evan Kiefer
Vice President, Finance and Investor Relations
Telephone: (713) 445-3200
This email address is being protected from spambots. You need JavaScript enabled to view it.

HOUSTON--(BUSINESS WIRE)--JERA Americas, the US-based subsidiary of global energy leader JERA, has announced plans to blend hydrogen at two plants, where it has ownership interests, in support of reducing CO2 emissions.


“Our parent company, JERA, has set an ambitious goal to be net zero CO2 by 2050, with an interim goal of 20% reduction in CO2 emission intensity for its business in Japan by 2030,” said Steven C Winn, Chief Executive Officer of JERA Americas. “They set the vision to be a global leader in LNG and renewables, sparking the transition to a clean energy economy. We support that goal and will also be working toward the same net zero CO2 emission goals here in North America.”

The Company has made initial progress toward that goal with plans to employ hydrogen fuel blending in its US power generation portfolio.

  • Linden Cogeneration – Linden Cogeneration (Linden Cogen) signed an agreement with Phillips 66 (NYSE: PSX), for Linden Cogen to take Bayway Refinery produced hydrogen-containing fuel gas and blend it with natural gas used to fuel the 172MW Linden Cogen unit 6 gas turbine. The modification will enable using a fuel gas blend containing up to 40% hydrogen. The work, expected to be completed in 2022, will improve overall refinery and Linden Cogen operational efficiency, and will reduce air emissions primarily through improved furnace and flare efficiencies. While actual reductions will be based on how much hydrogen is used at any given time of plant operation, the Company anticipates a reduction in CO2 emissions up to approximately 10% of annual CO2 emissions from unit 6.

“The work we are doing here in Linden has the potential for dramatic emission reductions not just in North America but also globally,” continued Winn. “This is the first step in what could ultimately be the modification of one of the largest gas turbine fleets in the world.”

JERA Americas acquired a 50% interest in Linden Cogen in 2017 and serves as the asset manager for the facility. Power and steam produced from the 972 MW natural gas-fueled thermal cogeneration plant is supplied for industrial use under long-term contracts and electricity is also sold into the NY-ISO and PJM wholesale markets. The facility, which began operating in 1992, has six gas turbine units and three steam turbines and is jointly owned by JERA Americas, EGCO, DBJ and GS-Platform Partners. Phillips 66’s Bayway Refinery, located on New York Harbor in Linden, processes mainly light, low-sulfur crude oil.

  • Cricket Valley Energy Center (CVEC) – JERA Americas is also involved in a second project to employ hydrogen technology to reduce carbon emissions. The Company is part owner of CVEC which signed a memorandum of understanding with GE (NYSE: GE) to develop a green hydrogen demonstration project in New York state. The agreement calls for using hydrogen for 5% of the fuel in one of the three units at the power station. This initiates the first step toward converting to a 100% hydrogen fuel capable plant.

“We intend to move forward on many fronts to achieve meaningful CO2 reductions,” said Winn. “These two agreements at Linden Cogen and Cricket Valley Energy Center are a starting point on our journey to a clean energy future.”

ABOUT JERA AMERICAS

A subsidiary of Tokyo-based JERA, the company that produces about 30% of all electricity in Japan, JERA Americas delivers innovative energy solutions for customers through a diversified portfolio of low carbon assets and technologies. The Company is a leading integrated energy provider supporting the Americas’ energy transition in an environmentally and socially responsible manner.

Under its “JERA Zero CO2 Emissions 2050” objective, JERA has been working to eliminate CO2 emissions from its domestic and overseas businesses by 2050. JERA, which stands for Japanese Energy for a New Era, will contribute to the development of a sustainable society, and seek to become a global company that is worthy of the regard of the global energy market and indispensable to the people of the world. https://www.jera.co.jp/english/.


Contacts

This email address is being protected from spambots. You need JavaScript enabled to view it.

Second Quarter 2021 Highlights


  • GAAP earnings from continuing operations per diluted share (EPS) of $1.87 compared to $0.23 in the second quarter of 2020.
  • Excluding Special Items, record EPS from continuing operations of $1.83 increased 205% compared to $0.60 in the second quarter of 2020.
  • Core year-over-year sales growth of 19% and core year-over-year order growth of 45%.
  • Raising GAAP EPS from continuing operations guidance to $6.05-$6.25, from $5.75-$5.95.
  • Raising EPS from continuing operations guidance, excluding Special Items, to $5.95-$6.15, from $5.65-$5.85.

STAMFORD, Conn.--(BUSINESS WIRE)--Crane Co. (NYSE: CR), a diversified manufacturer of highly engineered industrial products, reported second quarter 2021 financial results and updated its full-year 2021 outlook.

Max Mitchell, Crane Co. President and Chief Executive Officer stated: “We delivered another quarter of exceptionally strong results with record adjusted operating margins of 17.6% and record adjusted EPS. All three of our strategic growth platforms continue to perform extremely well, and we continue to see strengthening underlying trends in our primary end markets as reflected in our core year-over-year order growth of 45% and core year-over-year backlog growth of 7%.”

"Considering our strong performance in the second quarter and our outlook for the balance of the year, we are raising our adjusted EPS from continuing operations guidance by $0.30 to a range of $5.95-$6.15 reflecting an approximate 70% year-over-year increase. The midpoint of our guidance range is also above our prior-peak 2019 total adjusted EPS of $6.02 despite Engineered Materials' current classification as discontinued operations, and with the majority of our end markets in the very early stages of recovery and still well below pre-COVID levels. We are also continuing our substantial investments in technology and strategic growth initiatives positioning us for continued outgrowth through the post-COVID recovery, and we expect strong operating leverage given our consistently solid execution. I am confident that we remain on a path to generate substantial and sustainable value for all of our stakeholders by continuing to drive above-market growth, paired with ongoing active portfolio management.”

Second Quarter 2021 Results from Continuing Operations

Second quarter 2021 GAAP earnings from continuing operations per diluted share (EPS) of $1.87, compared to $0.23 in the second quarter of 2020. Excluding Special Items, second quarter 2021 EPS from continuing operations was $1.83, compared to $0.60 in the second quarter of 2020. Both GAAP and Adjusted EPS from continuing operations in the second quarter of 2021 included an excess tax benefit of approximately $4 million, or $0.07 per share, related to stock options exercised during the quarter. (Please see the attached Non-GAAP Financial Measures tables for a detailed reconciliation of reported results to adjusted measures.)

Second quarter 2021 sales were $796 million, an increase of 24% compared to the second quarter of 2020. The sales increase was comprised of a $120 million, or 19%, increase in core sales, and a $32 million, or 5%, benefit from favorable foreign exchange.

Second quarter 2021 operating profit was $137 million, compared to $29 million in the second quarter of 2020. Operating profit margin was 17.2%, compared to 4.5% last year, with the improvement driven primarily by higher volumes as well as benefits from 2020 cost actions and the non-recurrence of repositioning charges. Excluding Special Items, second quarter 2021 operating profit was $140 million, compared to $58 million last year. Excluding Special Items, operating profit margin was a record 17.6%, compared to 9.0% last year. (Please see the attached Non-GAAP Financial Measures tables for a detailed reconciliation of reported results to adjusted measures.)

Summary of Second Quarter 2021 Results from Continuing Operations


Second Quarter


Change

(dollars in millions)


2021


2020


$


%

Net sales (GAAP)


$

796


$

644


$

152


24%

Core sales


120


19%

Foreign exchange


32


5%


Operating profit


$

137


$

29


$

108


377%

Operating profit, before special Items (adjusted)*


$

140


$

58


$

82


141%


Operating profit margin


17.2

%


4.5

%


1,270bps

Operating profit margin, before special items (adjusted)*


17.6

%


9.0

%


860bps

*Please see the attached Non-GAAP Financial Measures tables

Cash Flow and Other Financial Metrics

Cash provided by operating activities from continuing operations in the first half of 2021 was $198 million, compared to $76 million in the first half of 2020. Capital expenditures in the first half of 2021 were $14 million, compared to $13 million last year. First half 2021 free cash flow (cash provided by operating activities less capital spending) was $184 million, compared to $62 million last year.

During the second quarter, we received cash proceeds of approximately $9 million from the sale of real estate in Phoenix, Arizona. This follows the first quarter receipt of approximately $15 million from the sale of real estate in Long Beach, California. Both of these sales were recorded as cash from investing activities, and consequently, excluded from free cash flow. Since 2017, we have received proceeds from the sale of real estate and other assets facilitated by repositioning activities and active management of excess assets of approximately $56 million.

The Company held cash and short-term investments of $387 million at June 30, 2021, compared to $581 million at December 31, 2020. Total debt was $858 million at June 30, 2021, compared to $1,219 million at December 31, 2020.

Rich Maue, Crane Co. Senior Vice President and Chief Financial Officer, added: “Crane Co’s free cash generation continues to be robust and our balance sheet is extremely strong, with our credit metrics and financial capacity already back above pre-COVID levels. We will continue to drive shareholder return through capital deployment with strict financial discipline and a focus on long-term sustainable value creation.”

Second Quarter 2021 Segment Results

All comparisons detailed in this section refer to operating results for the second quarter 2021 versus the second quarter 2020.

Aerospace & Electronics


Second Quarter


Change

(dollars in millions)


2021


2020


$


%

Net sales


$

158


$

157


$


—%


Operating profit


$

31


$

20


$

11


58%

Operating profit, before special items (adjusted)*


$

31


$

24


$

7


27%


Operating profit margin


19.6

%


12.4

%


720bps

Operating profit margin, before special items (adjusted)*


19.6

%


15.4

%


420bps

*Please see the attached Non-GAAP Financial Measures tables


Sales of $158 million were approximately flat compared to the prior year. Operating profit margin improved to 19.6%, from 12.4% last year, primarily reflecting benefits from 2020 cost actions and the non-recurrence of repositioning charges. Excluding Special Items, operating profit margin improved to 19.6%, from 15.4% last year. Aerospace & Electronics' order backlog was $473 million at June 30, 2021, compared to $491 million at December 31, 2020, and compared to $506 million at June 30, 2020.

Process Flow Technologies


Second Quarter


Change

(dollars in millions)


2021


2020


$


%

Net sales


$

311


$

239


$

71


30%

Core sales


53


22%

Foreign exchange


19


8%


Operating profit


$

47


$

20


$

26


130%

Operating profit, before special Items (adjusted)*


$

49


$

27


$

22


83%


Operating profit margin


15.0

%


8.4

%


660bps

Operating profit margin, before special items (adjusted)*


15.7

%


11.2

%


450bps

*Please see the attached Non-GAAP Financial Measures tables


Sales of $311 million increased $71 million, or 30%, driven by a $53 million, or 22%, increase in core sales, and a $19 million, or 8%, benefit from favorable foreign exchange. Operating profit margin increased to 15.0%, compared to 8.4% last year, primarily reflecting higher volumes and productivity benefits. Excluding Special Items, operating margin increased to 15.7%, compared to 11.2% last year. Process Flow Technologies order backlog was $344 million at June 30, 2021, compared to $313 million at December 31, 2020, and compared to $299 million at June 30, 2020.

Payment & Merchandising Technologies


Second Quarter


Change

(dollars in millions)


2021


2020


$


%

Net sales


$

328


$

248


$

81


33

%

Net sales, including acquisition-related deferred revenue*


328


250


78


31

%

Core sales


68


27

%

Foreign exchange


13


5

%


Operating profit


$

78


$

2


76


NM

Operating profit, before special Items (adjusted)*


$

78


$

20


58


285

%


Operating profit margin


23.7

%


0.8

%


2,290bps

Operating profit margin, before special items (adjusted)*


23.7

%


8.1

%


1,560bps

*Please see the attached Non-GAAP Financial Measures tables

Sales of $328 million increased $81 million, or 33%, driven by a $68 million, or 27%, increase in core sales, and a $13 million, or 5%, benefit from favorable foreign exchange. Operating profit margin increased to 23.7%, from 0.8% last year, primarily reflecting higher volumes, favorable mix, the non-recurrence of repositioning charges, and benefits from 2020 cost actions. Excluding Special Items, operating profit margin increased to 23.7%, from 8.1% last year.

Updating Full Year Outlook

On May 24, 2021, Crane Co. announced that it had signed an agreement to sell its Engineered Materials segment and that Engineered Materials would be presented as discontinued operations beginning with the second quarter of 2021. Consequently, all components of guidance, both GAAP and adjusted, are provided on a continuing operations basis and exclude all contribution from Engineered Materials, consistent with our most recent prior guidance which was issued on May 24, 2021.

We are raising our 2021 full year GAAP EPS from continuing operations guidance to a range of $6.05-$6.25, compared to the prior range of $5.75-$5.95.

We are raising our 2021 full year EPS from continuing operations guidance excluding Special Items (adjusted) to a range of $5.95-$6.15, compared to the prior range of $5.65-$5.85. Revised guidance now assumes core sales growth of +7% to +9% and an adjusted tax rate of approximately 20.5%. Additional details of our revised guidance are shown in the following table (Please see the attached non-GAAP Financial Measures tables.)

Full Year 2021 Guidance Details (Continuing Operations Basis)*

($ Millions, except per share amounts)

Prior Guidance (5/24/2021)

Updated Guidance

Net sales

$3,015

$3,100

Core sales growth

+5% to +7%

+7% to +9%

Acquisition benefit

~$5

~$5

FX translation

+2.5%

+3.5%

Diluted earnings per share, GAAP

$5.75 to $5.95

$6.05 to $6.25

Diluted earnings per share, non-GAAP (adjusted)

$5.65 to $5.85

$5.95 to $6.15

Operating cash flow

$375 to $405

$390 to $420

Capital expenditures

$75

$70

Free cash flow

$300 to $330

$320 to $350

Corporate expense

$77

$80

Adjusted tax rate

~21.0%

~20.5%

Non-operating expense, net

$31

$31

Full-year diluted share count

~59 million

~59 million

*Please see the attached Non-GAAP Financial Measures tables

Additional Information

Additional information with respect to the Company’s asbestos liability and related accounting provisions and cash requirements is set forth in the Current Report on Form 8-K filed with a copy of this press release.

Conference Call

Crane Co. has scheduled a conference call to discuss the second quarter financial results on Tuesday, July 27, 2021 at 10:00 A.M. (Eastern). All interested parties may listen to a live webcast of the call at http://www.craneco.com. An archived webcast will also be available to replay this conference call directly from the Company’s website under Investors, Events & Presentations. Slides that accompany the conference call will be available on the Company’s website.

Crane Co. is a diversified manufacturer of highly engineered industrial products. Founded in 1855, Crane Co. provides products and solutions to customers in the chemicals, oil & gas, power, automated payment solutions, banknote design and production and aerospace & defense markets, along with a wide range of general industrial and consumer related end markets. The Company has four business segments: Aerospace & Electronics, Process Flow Technologies, Payment & Merchandising Technologies, and Engineered Materials. On May 24, 2021, Crane announced that it had signed an agreement to divest its Engineered Materials segment; that sale is pending, subject to customary closing conditions and regulatory approval. Crane Co. has approximately 11,000 employees in the Americas, Europe, the Middle East, Asia and Australia. Crane Co. is traded on the New York Stock Exchange (NYSE:CR). For more information, visit www.craneco.com.

This press release may contain forward-looking statements as defined by the Private Securities Litigation Reform Act of 1995. These statements are based on the management’s current beliefs, expectations, plans, assumptions and objectives regarding Crane Co.’s future financial performance and are subject to significant risks and uncertainties. Any discussions contained in this press release, except to the extent that they contain historical facts, are forward-looking and accordingly involve estimates, assumptions, judgments and uncertainties. There are a number of factors, including risks and uncertainties related to the ongoing COVID-19 pandemic, that could cause actual results or outcomes to differ materially from those expressed or implied in these forward-looking statements. Such factors also include, among others: uncertainties regarding the extent and duration of the impact of the COVID-19 pandemic on many aspects of our business, operations and financial performance; changes in economic, financial and end-market conditions in the markets in which we operate; fluctuations in raw material prices; the financial condition of our customers and suppliers; economic, social and political instability, currency fluctuation and other risks of doing business outside of the United States; competitive pressures, including the need for technology improvement, successful new product development and introduction and any inability to pass increased costs of raw materials to customers; our ability to value and successfully integrate acquisitions, to realize synergies and opportunities for growth and innovation, and to attract and retain highly qualified personnel and key management; the risks that any regulatory approval that may be required for the Engineered Materials divestiture is delayed or is not obtained, that the Engineered Materials divestiture does not close or that the related transaction agreement is terminated, or that the benefits expected from the Engineered Materials divestiture will not be realized or will not be realized within the expected time period; a reduction in congressional appropriations that affect defense spending and our ability to predict the timing and award of substantial contracts in our banknote business; adverse effects on our business and results of operations, as a whole, as a result of increases in asbestos claims or the cost of defending and settling such claims; adverse effects as a result of environmental remediation activities, costs, liabilities and related claims; investment performance of our pension plan assets and fluctuations in interest rates, which may affect the amount and timing of future pension plan contributions; and other risks noted in reports that we file with the Securities and Exchange Commission, including the Company’s Annual Report on Form 10-K for the fiscal year ended December 31, 2020 and subsequent reports filed with the Securities and Exchange Commission. Crane Co. does not undertake any obligation to update or revise any forward-looking statements.

(Financial Tables Follow)

CRANE CO.

Income Statement Data

(in millions, except per share data)


Three Months Ended

June 30,


Six Months Ended

June 30,


2021


2020


2021


2020

Net sales:


Aerospace & Electronics

$

157.5


$

157.4


$

311.5


$

350.3


Process Flow Technologies

310.7


239.3


598.8


495.9


Payment & Merchandising Technologies

328.2


247.6


665.6


544.9


Total net sales

$

796.4


$

644.3


$

1,575.9


$

1,391.1


Operating profit:


Aerospace & Electronics

$

30.8


$

19.5


$

56.8


$

63.3


Process Flow Technologies

46.5


20.2


96.6


48.2


Payment & Merchandising Technologies

77.9


2.0


163.7


28.4


Corporate

(18.3)


(13.0)


(40.2)


(29.5)


Total operating profit

$

136.9


$

28.7


$

276.9


$

110.4


Interest income

$

0.4


$

0.3


$

0.9


$

0.7


Interest expense

(11.4)


(14.4)


(25.0)


(26.9)


Miscellaneous, net

9.7


2.4


13.6


6.2


Income from continuing operations before income taxes

135.6


17.0


266.4


90.4


Provision for income taxes

24.9


3.6


52.3


19.3


Net income from continuing operations attributable to common shareholders

110.7


13.4


214.1


71.1


Income from discontinued operations, net of tax 1

27.6


1.4


32.6


6.5


Net income attributable to common shareholders

$

138.3


$

14.8


$

246.7


$

77.6


Earnings per diluted share from continuing operations

$

1.87


$

0.23


$

3.62


$

1.20


Earnings per diluted share from discontinued operations

0.46


0.02


0.55


0.11


Earnings per diluted share

$

2.33


$

0.25


$

4.17


$

1.31


Average diluted shares outstanding

59.3


58.5


59.1


59.1


Average basic shares outstanding

58.5


58.0


58.4


58.5


Supplemental data:


Cost of sales

$

476.8


$

425.1


$

947.3


$

899.4


Selling, general & administrative

182.7


190.5


351.7


381.3


Acquisition-related and integration charges 2


2.3


7.5


Disposition costs 2

0.8


0.8


Repositioning related charges (gains), net 2

2.2


24.5


(9.5)


24.6


Depreciation and amortization 2

30.1


32.1


60.8


61.1


Stock-based compensation expense 2

6.1


4.5


12.3


10.2


1 Includes $21.5 million of deferred tax benefit associated with the pending disposition of the Engineered Materials segment.

2 Amounts included within Cost of sales and/or Selling, general & administrative costs.

CRANE CO.

Condensed Balance Sheets

(in millions)


June 30,
2021


December 31,
2020

Assets


Current assets


Cash and cash equivalents


$

386.7


$

551.0


Accounts receivable, net


458.6


423.9


Current insurance receivable - asbestos


14.4


14.4


Inventories, net


456.9


429.7


Other current assets


129.8


137.3


Current assets held for sale


225.9


17.4


Total current assets


1,672.3


1,573.7


Property, plant and equipment, net


538.2


573.7


Long-term insurance receivable - asbestos


65.8


72.5


Other assets


720.9


757.5


Goodwill


1,426.0


1,437.7


Long-term assets held for sale


199.9


Total assets


$

4,423.2


$

4,615.0


Liabilities and equity


Current liabilities


Short-term borrowings


$

15.0


$

375.7


Accounts payable


242.2


198.9


Current asbestos liability


66.5


66.5


Accrued liabilities


388.4


388.0


Income taxes


8.8


0.1


Current liabilities held for sale


37.9


27.4


Total current liabilities


758.8


1,056.6


Long-term debt


843.4


842.9


Long-term deferred tax liability


54.1


53.6


Long-term asbestos liability


576.7


603.6


Other liabilities


462.1


501.0


Long-term liabilities held for sale


26.2


Total equity


1,728.1


1,531.1


Total liabilities and equity


$

4,423.2


$

4,615.0


CRANE CO.

Condensed Statements of Cash Flows

(in millions)


Three Months Ended

June 30,


Six Months Ended

June 30,


2021


2020


2021


2020

Operating activities from continuing operations:


Net income from continuing operations attributable to common shareholders


$

110.7


$

13.4


$

214.1


$

71.1


Gain on sale of property


(5.7

)


(18.5

)


Depreciation and amortization


30.1


32.1


60.8


61.1


Stock-based compensation expense


6.1


4.5


12.4


10.2


Defined benefit plans and postretirement credit


(2.5

)


(1.0

)


(4.2

)


(2.7

)

Deferred income taxes


(0.2

)


1.3


0.1


7.5


Cash provided by (used for) operating working capital


25.9


67.8


(25.7

)


(46.5

)

Defined benefit plans and postretirement contributions


(1.4

)


(0.8

)


(17.2

)


(2.3

)

Environmental payments, net of reimbursements


(2.2

)


(1.0

)


(3.6

)


(3.7

)

Asbestos related payments, net of insurance recoveries


(9.4

)


(7.4

)


(20.2

)


(19.2

)

Other


(1.5

)


(0.9

)


(0.5

)


0.1


Total provided by operating activities from continuing operations


$

149.9


$

108.0


$

197.5


$

75.6


Investing activities from continuing operations:


Payments for acquisitions, net of cash acquired


$


$

(0.3

)


$


$

(172.3

)

Proceeds from disposition of capital assets


8.8


0.3


23.4


2.7


Capital expenditures


(9.2

)


(5.6

)


(13.9

)


(13.3

)

Purchase of marketable securities


(10.0

)


Proceeds from sale of marketable securities


10.0


40.0


Total provided by (used for) investing activities from continuing operations


$

9.6


$

(5.6

)


$

39.5


$

(182.9

)

Financing activities from continuing operations:


Dividends paid


$

(25.2

)


$

(24.9

)


$

(50.2

)


$

(50.4

)

Reacquisition of shares on open market


(70.0

)

Stock options exercised, net of shares reacquired


(2.0

)


0.5


5.2


0.6


Debt issuance costs


(1.2

)


(1.2

)

Proceeds from issuance of commercial paper with maturities greater than 90 days


81.3


251.3


Repayments of commercial paper with maturities greater than 90 days


(96.5

)


(27.1

)


(96.5

)

Net proceeds (repayments) from issuance of commercial paper with maturities of 90 days or less


15.0


(77.3

)


15.0


(62.8

)

Proceeds from revolving credit facility


32.0


77.2


Repayments of revolving credit facility


(77.2

)


(77.2

)

Proceeds from term loan


343.9


343.9


Repayment of term loan


(348.1

)


(348.1

)


Total (used for) provided by financing activities from continuing operations


$

(360.3

)


$

180.6


$

(405.2

)


$

314.9


Discontinued operations:


Total provided by operating activities


$

6.6


$

4.2


$

9.2


$

1.0


Total used for investing activities


(0.5

)


(0.1

)


(0.8

)


(0.2

)

Increase in cash and cash equivalents from discontinued operations


6.1


4.1


8.4


0.8


Effect of exchange rate on cash and cash equivalents


3.0


2.2


(4.5

)


(10.2

)

(Decrease) increase in cash and cash equivalents


(191.7

)


289.3


(164.3

)


198.2


Cash and cash equivalents at beginning of period


578.4


302.8


551.0


393.9


Cash and cash equivalents at end of period


$

386.7


$

592.1


$

386.7


$

592.1


CRANE CO.

Order Backlog

(in millions)


June 30,

2021


March 31,

2021


December 31,

2020


September 30,

2020


June 30,

2020

Aerospace & Electronics


$

472.9


$

481.6


$

491.2


$

498.1


$

505.7


Process Flow Technologies


344.1


325.4


313.4


304.8


298.6


Payment & Merchandising Technologies


374.7


337.0


347.6


270.1


285.5


Total backlog


$

1,191.7


$

1,144.0


$

1,152.2


$

1,073.0


$

1,089.8


CRANE CO.

Non-GAAP Financial Measures

(in millions, except per share data)


Three Months Ended June 30,


2021


2020


% Change


$


Per Share


$


Per Share


(on $)

Net sales (GAAP)


$

796.4


$

644.3


23.6

%

Acquisition-related deferred revenue1


2.6


Net sales before special items (adjusted)


$

796.4


$

646.9


23.1

%


Operating profit (GAAP)


$

136.9


$

28.7


377.0

%

Operating profit margin (GAAP)


17.2

%


4.5

%


Special items impacting operating profit:


Acquisition-related deferred revenue 1


2.6


Acquisition-related and integration charges


2.3


Disposition costs


0.8


Repositioning related charges, net


2.2


24.5


Operating profit before special items (adjusted)


$

139.9


$

58.1


140.8

%

Operating profit margin before special items (adjusted)


17.6

%


9.0

%


Net income from continuing operations attributable to common shareholders (GAAP)


$

110.7


$

1.87


$

13.4


$

0.23


726.1

%


Special items, net of tax, impacting net income from continuing operations attributable to common shareholders:


Acquisition-related deferred revenue 1


1.9


0.03


Acquisition-related and integration charges


1.8


0.03


Disposition costs


0.6


0.01


Repositioning related charges, net


1.7


0.03


18.2


0.31


Gain on sale of property


(4.5)


(0.08)


Net income from continuing operations, net of tax, attributable to common shareholders before special items (adjusted)


$

108.5


$

1.83


$

35.3


$

0.60


207.4

%


Special items impacting provision for income taxes from continuing operations:


Provision for income taxes (GAAP)


$

24.9


$

3.6


Tax effect of acquisition-related deferred revenue 1


0.7


Tax effect of acquisition-related and integration charges


0.5


Tax effect of disposition costs


0.2


Tax effect of repositioning related charges, net


0.5


6.3


Tax effect of gain on sale of property


(1.2)


Provision for income taxes before special items (adjusted)


$

24.4


$

11.1


1 Acquisition-related revenue that would otherwise be recognized but for the purchase accounting treatment of acquisitions.

Totals may not sum due to rounding


Contacts

Jason D. Feldman
Vice President, Investor Relations
203-363-7329
www.craneco.com


Read full story here

LEMONT, Ill.--(BUSINESS WIRE)--#AmericaResilient2021--Combating climate change is one of the most pressing challenges of the 21st century. To discuss this challenge, the U.S. Department of Energy’s (DOE) Argonne National Laboratory convened the America Resilient virtual climate conference on April 14, 2021. The conference report is now available for free download on the America Resilient website.


Everyone is feeling the increasing effects of climate change across the United States, from the record-breaking 2020 wildfire season to the Southern freeze of February 2021, which caused the electrical grid in Texas to collapse. Participants at Argonne’s conference focused on ways to mitigate likely human suffering, loss of biodiversity, and disruptions to critical societal systems and functions. Three key themes emerged: prioritizing environmental justice; addressing the need for high-accuracy, high-resolution climate models; and equipping decision-makers to plan for adaptation and resilience.

Currently, some communities encounter greater risks from climate change due to their location, demographics and access to resources and healthcare. ​“There are inequities that are baked into the energy system, and when you are trying to make your energy system more resilient, you need to make sure you’re not doing it in a way that’s going to further entrench these inequalities,” said Shalanda Baker, DOE Deputy Director for Energy Justice and the Secretary of Energy’s Advisor on Equity.

To build resilient communities, leaders and community members need science-based information about the impacts climate change will have. ​“While it’s critical that we decarbonize our economy as quickly as possible, the emissions we’ve produced have already baked in weather patterns that will unfold over years to come,” said U.S. Secretary of Energy Jennifer Granholm. ​“These once-in-a-century storms are going to keep coming, but not all of them need to be crises.”

High-accuracy, high-resolution climate models can help us avoid crises by projecting climate impacts down to regional and local scales and taking action to mitigate their effects.

These localized models allow communities to more effectively assess immediate and future climate-related risks.

At the conference, experts sought to increase climate-change-related education and training and to democratize access to climate data to support informed decision-making.

The America Resilient Climate Conference report summarizes key discussions from the panels and keynote speakers. This resource is available to coordinate research, industry, government and community efforts to enhance climate resilience in the United States, and potentially around the world.

Original release here.


Contacts

Christopher J. Kramer
Head of Media Relations
Argonne National Laboratory
Office: 630.252.5580
This email address is being protected from spambots. You need JavaScript enabled to view it.

CARNEGIE, Pa.--(BUSINESS WIRE)--Ampco-Pittsburgh Corporation (NYSE: AP) will hold a conference call on Tuesday, August 10, 2021, at 10:30 a.m. Eastern Time (ET) to discuss its financial results for the second quarter ended June 30, 2021.


If you would like to participate in the conference call, please register using the link below or by dialing 1-844-308-3408 at least five minutes before the 10:30 a.m. ET start time.

We encourage participants to pre-register for the conference call using the following link. Callers who pre-register will be given a conference passcode and unique PIN to gain immediate access to the call and bypass the live operator. Participants may pre-register at any time, including up to and after the call start time. To pre-register, please go to: https://dpregister.com/sreg/10158831/eb5ea651ea

Those without internet access or unable to pre-register may dial in by calling:

  • Participant Dial-in (Toll Free): 1-844-308-3408
  • Participant International Dial-in: 1-412-317-5408

For those unable to listen to the live broadcast, a replay will become available one hour after the event concludes on our website under the Investors menu at www.ampcopgh.com.

About Ampco-Pittsburgh Corporation

Ampco-Pittsburgh Corporation manufactures and sells highly engineered, high-performance specialty metal products and customized equipment utilized by industry throughout the world. Through its operating subsidiary, Union Electric Steel Corporation, it is a leading producer of forged and cast rolls for the global steel and aluminum industry. It also manufactures open-die forged products that principally are sold to customers in the steel distribution market, oil and gas industry, and the aluminum and plastic extrusion industries. The Corporation is also a producer of air and liquid processing equipment, primarily custom-engineered finned tube heat exchange coils, large custom air handling systems, and centrifugal pumps. It operates manufacturing facilities in the United States, England, Sweden, Slovenia, and participates in three operating joint ventures located in China. It has sales offices in North and South America, Asia, Europe, and the Middle East. Corporate headquarters is located in Carnegie, Pennsylvania.


Contacts

Melanie L. Sprowson
Director, Investor Relations
412-429-2454
This email address is being protected from spambots. You need JavaScript enabled to view it.

Offshore Source Logo

Offshore Source keeps you updated with relevant information concerning the Offshore Energy Sector.

Any views or opinions represented on this website belong solely to the author and do not represent those of the people, institutions or organizations that Offshore Source or collaborators may or may not have been associated with in a professional or personal capacity, unless explicitly stated.

Corporate Offices

Technology Systems Corporation
8502 SW Kansas Ave
Stuart, FL 34997

info@tscpublishing.com