Business Wire News

New Global Renewable Markets Attractiveness Rankings for period ending December 2020 place United States in the top spot among markets


WASHINGTON--(BUSINESS WIRE)--As the Biden Administration aims to significantly increase federal investment in renewable energy under the American Jobs Plan, the United States already ranks as the most attractive market for renewables investment, according to results from a new ranking by IHS Markit (NYSE: INFO), a world leader in critical information, analytics and solutions.

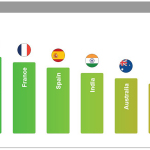
The IHS Markit Global Renewables Markets Attractiveness Rankings, which tracks attractiveness for investment for non-hydro renewables (offshore wind, onshore wind and solar PV), placed the United States in the number one spot for the period ending December 2020. The United States claimed the top spot on account of sound market fundamentals and the availability of an attractive—though phasing down—support scheme.

Mainland China, which accounted for over half of the world’s total non-hydro renewables additions last year, ranked third on the attractiveness ranking—just behind number two Germany—as difficulties in accessing the market weighed down its overall score.

The IHS Markit Global Renewable Markets Attractiveness Rankings utilize an integrated proprietary methodology to provide comparable views of 35 markets that are expected to account for 90% of non-hydro renewables capacity additions to 2030.

The ranking evaluates each country on the basis of seven subcategories that include the current policy framework, market fundamentals, investor friendliness, infrastructure readiness, revenue risks and return expectations, easiness to compete and the overall opportunity size for each market. Each market is scored in individual categories for solar PV, onshore wind, offshore wind and an overall renewables score is calculated.

The overall country rankings are based on a combined score for offshore wind, onshore wind and solar PV that weights the different technologies based on their expected levels of installations over the next decade.

“Onshore wind, offshore wind and solar PV are set to account for over 80% of all new power generation capacity additions globally to 2030,” said Eduard Sala de Vedruna, executive director, global clean energy technology and renewables, IHS Markit. “While the lion’s share of 2020 capacity additions came from just two markets—China and the United States—close to 50 markets recorded double digit growth in the past year. The investment opportunity in renewables is significant and the new Global Renewable Markets Attractiveness Rankings is an important tool for investors to better understand the relative attributes of a given market.”

France and Spain secured the fourth and fifth spot, respectively, based on strong market fundamentals backed by stable procurement mechanisms and long-term clean energy targets. Similar factors also boosted the ranks of Japan (Rank 8) and the Netherlands (Rank 9), further supported by their strong impetus towards offshore wind—expected to be the fastest growing renewable energy technology in the next decade.

“The ongoing transition to competitive procurement and a growing need for grid-parity renewable power has forced investors to look beyond just financial incentives and focus on factors including economic stability, market liberalization and investor friendliness,” said Indra Mukherjee, senior analyst, global clean energy technology and renewables, IHS Markit.

Strong ambitions and stable procurement initiatives in India (rank 6), and availability of attractive subsidies and a high degree of investor friendliness in Australia (rank 7) propelled these markets to top spots on the list. However, these markets are beginning to encounter infrastructure constraints on their continued path towards decarbonization. In the case of India, onshore wind build has suffered from lack of grid and land access, while in Australia the disconnection between federal and state ambitions have increased investor uncertainty.

“While strong ambitions are perceived positively by investors and testify to a market’s commitment towards renewables, this needs to be backed by a well-conceived implementation framework, adequate infrastructure and durable policies,” said Mukherjee.

The Global Renewable Market Attractiveness Rankings is produced by the IHS Markit Global Power and Renewables service and will be updated biannually. The tool facilitates various levels of market comparison by providing flexibility to break down the final scores into their constituent subcategories and parameters. The scores are enriched by analyst rationale and justifications, which when viewed together provide a comprehensive high-level overview of each market.

In individual technology rankings, the United States also retained the top ranking in investment attractiveness for onshore wind and solar PV. The United Kingdom—which failed to crack the top ten in the combined rankings due to its relative lack of support for developing onshore wind and solar PV—ranked as the most attractive market for offshore wind investment.

For more product information about the Global Renewable Market Attractiveness Rankings contact Craig Urch at This email address is being protected from spambots. You need JavaScript enabled to view it..

For media inquiries or interview requests contact Jeff Marn at This email address is being protected from spambots. You need JavaScript enabled to view it. or This email address is being protected from spambots. You need JavaScript enabled to view it.

About IHS Markit (www.ihsmarkit.com)

IHS Markit (NYSE: INFO) is a world leader in critical information, analytics and solutions for the major industries and markets that drive economies worldwide. The company delivers next-generation information, analytics and solutions to customers in business, finance and government, improving their operational efficiency and providing deep insights that lead to well-informed, confident decisions. IHS Markit has more than 50,000 business and government customers, including 80 percent of the Fortune Global 500 and the world’s leading financial institutions. Headquartered in London, IHS Markit is committed to sustainable, profitable growth.

IHS Markit is a registered trademark of IHS Markit Ltd. and/or its affiliates. All other company and product names may be trademarks of their respective owners © 2021 IHS Markit Ltd. All rights reserved.


Contacts

Jeff Marn
IHS Markit
+1 202 463 8213
This email address is being protected from spambots. You need JavaScript enabled to view it.

Press Team
+1 303 858 6417
This email address is being protected from spambots. You need JavaScript enabled to view it.

NEW YORK--(BUSINESS WIRE)--Hess Corporation (NYSE: HES) announced today that John Hess, Chief Executive Officer, will participate in a Fireside Chat at the Citi 2021 Global Energy & Utilities Virtual Conference on May 11, 2021 at 12:50 p.m. Eastern Time.


A live audio webcast and a replay of the discussion will be accessible via Hess Corporation’s website.

Hess Corporation is a leading global independent energy company engaged in the exploration and production of crude oil and natural gas. More information on Hess Corporation is available at https://www.hess.com/.

Cautionary Statements

This presentation will contain projections and other forward-looking statements within the meaning of Section 27A of the Securities Act of 1933 and Section 21E of the Securities Exchange Act of 1934. These projections and statements reflect the company’s current views with respect to future events and financial performance. No assurances can be given, however, that these events will occur or that these projections will be achieved, and actual results could differ materially from those projected as a result of certain risk factors. A discussion of these risk factors is included in the company’s periodic reports filed with the Securities and Exchange Commission.


Contacts

Investor contact:
Jay Wilson
(212) 536-8940
This email address is being protected from spambots. You need JavaScript enabled to view it.

Media contact:
Lorrie Hecker
(212) 536-8250
This email address is being protected from spambots. You need JavaScript enabled to view it.

With the first actionable investment vehicle and real estate strategy of its kind, TeraWatt Infrastructure is building a new charging infrastructure asset class and enabling the transformative shift to all-electric transportation


SAN FRANCISCO--(BUSINESS WIRE)--#CyrusCapital--TeraWatt Infrastructure, a company founded to develop, own, and finance electric vehicle charging infrastructure in the U.S., today announced the appointment of Google’s former head of energy strategy, Neha Palmer, as CEO. Palmer brings her deep expertise in building out rapidly growing fleets of large-scale, energy intensive infrastructure from the data center world to the emerging electric vehicle charging infrastructure asset class.

As automotive OEMs of all types of electric vehicles increase availability and bring the total cost of ownership down, fleet operators are beginning to prepare for the monumental shift to electric transport. Massive investment in the country’s aging electric infrastructure is required to meet the increased demand from electric vehicles. Given this, and the hyper local power demand of fleets of medium and heavy duty vehicles charging simultaneously, on-site generation, energy storage, and energy management will be required to power these vast charging depots. Building reliable, large scale charging infrastructure requires more capital and energy expertise than most organizations want to take on alone.

TeraWatt Infrastructure brings this capability to its partners to enable America’s fleets to electrify with confidence, providing a path to cost effective electric charging infrastructure. With a purpose-built platform that combines a robust property portfolio, capital, asset financing capabilities, energy management and project development expertise, TeraWatt is filling the multi-trillion dollar investment and infrastructure gap in electric vehicle charging, and providing organizations with a credible, long-term partner in the all-electric transition.

TeraWatt leverages its proprietary database to acquire properties in strategic transportation locations, such as major highway exits between metropolitan areas and logistics hubs, to be developed into energy and charging infrastructure to serve electric vehicle fleets. In addition to this, it provides fleet operators and the companies that sell to them a suite of solutions and asset financing as an enabling capability at their own sites. Keyframe and Cyrus Capital have committed more than $100 million to the platform to date, which today has a portfolio of properties covering several key U.S. logistics routes across 18 states.

“Neha tackled Google’s unparalleled data center energy consumption through a decade of massive growth, while also bending the will of the world to achieve net zero emissions,” said Ben Birnbaum, a co-founder of TeraWatt Infrastructure and Partner at Keyframe Capital, an investment firm backing TeraWatt. “It’s very difficult to find someone with the kind of infrastructure development experience that the world is going to require to make it successfully through the transition to electrified transport, given the complexities of the energy requirements and the sheer volume of watts and capital required. But Neha has this, and the TeraWatt team is incredibly humbled and grateful to have had her join.”

As Google’s first hire focused on data center energy, Palmer built out and led the team developing electric infrastructure and electricity procurement for its global fleet, covering dozens of sites over four continents. When she joined Google, they had eight data centers with under 3 TWh of annual electric consumption; by the time she left, they were operating dozens of data centers on four continents with over 13 TWh of annual electric consumption. She was instrumental in making Google the largest corporate buyer of renewable energy in the world, and the first company of its size to achieve 100 percent renewable energy for operations, which it has done every year since 2017.

“TeraWatt was purpose built to be the crucial intermediary between capital markets, utilities, and organizations of all types looking to electrify their fleets,” said John Rapaport, co-founder of TeraWatt Infrastructure and chief investment officer at Keyframe Capital. “Leveraging over $20 billion of collective energy and transportation project development and investing experience across the founding team, we have been building the underlying infrastructure portfolio and business in stealth for years while we’ve waited for the automotive industry to fully commit to electrification. Now that they have, and customers have come calling for turn-key infrastructure solutions, it was time to put the leader in place who can deliver the permanent transportation infrastructure of tomorrow, just the way she knows how.”

“Backed by investors with extensive sector expertise, including over $1 billion invested into the automotive, transportation and energy industries over their histories, TeraWatt is creating a new infrastructure asset class as we build the permanent charging infrastructure of America and beyond,” said Neha Palmer, CEO of TeraWatt Infrastructure. “I am honored to apply my experience in transforming energy markets to meet customers’ needs to my new role as TeraWatt’s CEO, and I’m inspired by our mission to build out infrastructure to usher in a historical transformation to decarbonize transportation.”

ABOUT TERAWATT INFRASTRUCTURE

TeraWatt Infrastructure is building the permanent electric vehicle charging infrastructure of tomorrow through a robust combination of property assets, financing capabilities and infrastructure and energy management solutions. The company designs, operates and owns and finances charging solutions that take the cost and complexity out of electrifying fleets. With a business model based on well-established economics of renewable energy project development and a proven real estate strategy, TeraWatt was founded, in the absence of anything like it, to be the nation’s reliable, long-term partner in the inevitable transition to all-electric transportation. TeraWatt is backed by Keyframe and Cyrus Capital, which jointly manage portfolios of over $3 billion. The company was founded in 2018 and has been operating in stealth mode until today. For more information: Please visit www.terawattinfrastructure.com.

ABOUT KEYFRAME

Keyframe Capital Partners, L.P. is a New York based SEC registered investment advisor. The firm’s generalist, cross-asset mandate allows it to invest across a diverse range of business models and capital structures. Keyframe looks to build long term partnerships with companies, and to leverage its flexibility to help solve their most complex asset and corporate financing requirements. Please visit www.keyframecapital.com for additional information.

ABOUT CYRUS

Cyrus Capital Partners, L.P. is an SEC registered advisor with offices in New York and London. Cyrus invests on a global basis across the entire capital structure of companies, directly structures capital solutions for companies, and leads capital raises. Cyrus is an active investor that is deep value-focused and experienced in legal and process oriented opportunities. Cyrus was founded by Stephen C. Freidheim in 1999 and became independently-owned in 2005. Please visit www.cyruscapital.com for additional information.


Contacts

Annika Harper, Director at Antenna Group
This email address is being protected from spambots. You need JavaScript enabled to view it.

DUBLIN--(BUSINESS WIRE)--The "Upstream Oil & Gas Start-Up Tracker - Issue 20" report has been added to ResearchAndMarkets.com's offering.


The upstream oil and gas (O&G) industry is increasingly focused on cutting costs and improving recovery rates through radical innovation and digital transformation. The Start-up Tracker is a resource to help the upstream industry identify providers with specific solutions to industry challenges.

The tracker provides a rich database of start-up companies offering innovative solutions for upstream O&G applications. Each issue contains detailed company profiles, an analyst viewpoint, and an overall score for every start-up included. In addition, the analyst provides guidance on potential acquisitions, investments, partnerships, and implementation.

Key Topics Covered:

  • Executive Summary
    • Companies to Action
    • Innovation Target
    • Validere - Company Profile
    • Validere - Analyst Viewpoint
    • Tri-D Dynamics - Company Profile
    • Tri-D Dynamics - Analyst Viewpoint
    • Beyond Limits Inc. - Company Profile
    • Beyond Limits Inc. - Analyst Viewpoint
    • The Last Word
  • Scoring Methodology

Companies Mentioned

  • Beyond Limits Inc.
  • Tri-D Dynamics
  • Validere

For more information about this report visit https://www.researchandmarkets.com/r/t1ib9x.


Contacts

ResearchAndMarkets.com
Laura Wood, Senior Press Manager
This email address is being protected from spambots. You need JavaScript enabled to view it.

For E.S.T. Office Hours Call 1-917-300-0470
For U.S./CAN Toll Free Call 1-800-526-8630
For GMT Office Hours Call +353-1-416-8900

PITTSBURGH--(BUSINESS WIRE)--Alcoa Corporation (NYSE: AA) has released its 2020 Sustainability Report, which provides a comprehensive overview of the Company’s progress against key environmental, social and governance (ESG) objectives.


“Our latest sustainability report highlights the important work we accomplished in 2020 in the midst of one of the most challenging years for our Company and the world,” said Roy Harvey, Alcoa President and CEO. “Our firmly rooted commitment to our values and our strategic priority to Advance Sustainably helped our employees, their families, and our host communities navigate the pandemic while delivering results that reflect our sustainability leadership.”

The report is available on a dedicated portion of Alcoa’s web site (www.alcoa.com/sustainability) and has been prepared in accordance with Global Reporting Initiative (GRI) Standards. The report’s methodology also aligns with Sustainability Accounting Standards Board (SASB) Standards, the United Nations Sustainable Development Goals, and the International Council for Mining and Metals’ 10 Principles.

Among highlights from the report:

  • Alcoa acted quickly and comprehensively to protect its employees and communities from the impacts of the COVID-19 pandemic while ensuring the continuity of its operations, which were deemed essential. Through the Alcoa Foundation and Instituto Alcoa, more than $2.1 million in grants were made to support Alcoa communities.
  • A strong Climate Change Policy includes new, long-term goals to align emission reduction targets with the “well below 2º C” decarbonization path defined in the Paris Climate Accord. Alcoa also published new policies on water stewardship and biodiversity.
  • A formal social performance management system to manage and address social risk, which will be deployed throughout 2021 and 2022, places particular emphasis on improving engagement with indigenous and land-connected people. As one example, in February of 2020, Alcoa launched a Reconciliation Action Plan (RAP) in Australia, which guides proactive engagement with Aboriginal and Torres Strait Islander people.
  • The Company reinforced its commitment to inclusion and diversity, forming the Alcoa Global Inclusion & Diversity Council to lead efforts to create trusting workplaces that are safe, respectful, and inclusive of all individuals and that reflect the diversity of Alcoa’s communities.
  • Through the Alcoa Foundation and engagement with organizations such as the International Aluminium Institute, Alcoa continued to support initiatives to preserve biodiversity, prevent climate change, and advance new ways to re-use operational byproducts such as bauxite residue.
  • Alcoa continued to build on its leading Sustana™ portfolio of sustainable aluminum products with the introduction of EcoSource™, the industry’s first low-carbon, smelter-grade alumina brand. The Company also continued to grow sales of low-carbon aluminum EcoLumTM, a member of the Sustana product family.
  • By the end of 2020, the Aluminium Stewardship Initiative (ASI) had certified 13 Alcoa operating locations to its Performance Standard and Alcoa also earned the ASI Chain of Custody Standard, enabling Alcoa to market and sell ASI-certified bauxite, alumina, and aluminum to global customers.

About Alcoa

Alcoa (NYSE: AA) is a global industry leader in bauxite, alumina and aluminum products, with a strong portfolio of value-added cast and rolled products and substantial energy assets. Alcoa is built on a foundation of strong values and operating excellence dating back 135 years to the world-changing discovery that made aluminum an affordable and vital part of modern life. Since inventing the aluminum industry, and throughout our history, our talented Alcoans have followed on with breakthrough innovations and best practices that have led to efficiency, safety, sustainability and stronger communities wherever we operate. Visit us online on www.alcoa.com, follow @Alcoa on Twitter and on Facebook at www.facebook.com/Alcoa.

Dissemination of Company Information

Alcoa Corporation intends to make future announcements regarding company developments and financial performance through its website at www.alcoa.com, as well as through press releases, filings with the Securities and Exchange Commission, conference calls and webcasts.


Contacts

Investor Contacts
James Dwyer
412-992-5450
This email address is being protected from spambots. You need JavaScript enabled to view it.

Media Contacts
Jim Beck
412-315-2909
This email address is being protected from spambots. You need JavaScript enabled to view it.

One of North America’s leading providers of advanced additive manufacturing for aerospace and energy to operate the first VELO3D manufacturing solution in Indianapolis area

CAMPBELL, Calif.--(BUSINESS WIRE)--$SPFR--VELO3D Inc., a leader in additive manufacturing (AM) for high-value metal parts, today announced that ADDMAN Engineering (ADDMAN), one of North America's premier providers of advanced AM solutions, has selected VELO3D to meet growing demand from energy and aerospace customers.


With an AI-powered full-stack solution including integrated Flow™ design software and Assure™ quality assurance, VELO3D allows for simplification of parts, previously impossible geometries, and shorter print times, without the constraints that come with traditional manufacturing or other AM providers.

“The full-stack laser powder bed fusion 3D printing solution from VELO3D gives our customers the freedom they need to design the next generation of spacecraft and turbomachinery without compromising their designs for the sake of manufacturability,” said Mark Saberton, CTO and founder, ADDMAN. “The VELO3D process saves time and avoids waste by removing unnecessary steps, and reduces time to test or go to market, while also ensuring production-ready quality in every build.”

In addition to owning and operating the first VELO3D metal AM solution in the Indianapolis area, ADDMAN holds two reservations for the highly anticipated VELO3D Sapphire XC large format metal AM solution. Each Sapphire XC system will provide up to four times the productivity of ADDMAN’s new Sapphire system, positioning the company to keep up with increasing demand for complex, high-performance parts spurred by the booming commercial space industry.

“We have a vision and are looking toward the future not just for our company, but for the entire aerospace industry, where demand for intricate, high-value parts is growing fast,” said Saberton. “While the Sapphire system brought net-new capabilities to ADDMAN, we’re excited about the Sapphire XCs because they open up a new category of parts, while making impressive increases to capacity and efficiency.”

ADDMAN delivers large capacity 3D metal printing for aerospace, defense, energy and manufacturing. The company is ITAR registered and compliant with ISO9001:2015 and AS9100D, meeting FAA, DoD and NASA quality requirements for aviation, defense and space organizations.

ADDMAN closed on the purchase of 3rd Dimension Industrial 3D Printing in March 2021. In a little over a month since the acquisition, additional highly skilled staff have been hired to support the growing relationships with existing aerospace clients. Additional machining, quality, and capacity expansions are also being realized. Already AS9100 certified, the quality department is being bolstered through the addition of a Creaform EXAscan Black and a high end CMM. Planning for NADCAP accreditation is also in progress.

With the Indianapolis facility focused on production, the Bonita Springs HQ and Innovation Center offers clients a wide variety of composites and polymer options. With multiple Titan FDM machines, large format FDM parts can be produced for end use tooling. A fleet of SLA and FDM machines keep lead times to a minimum and value-add high.

Also in March, VELO3D announced plans to merge with JAWS Spitfire Acquisition Corporation (NYSE: SPFR) and become a public company. Earlier this year, VELO3D was named to Fast Company’s 2021 list of the world’s most innovative companies, among the top ranked in the manufacturing category for its profound impact on the 3D printing industry.

To learn more about how VELO3D empowers engineers and designers to imagine more, and additively manufacture nearly anything, follow VELO3D on LinkedIn or visit velo3d.com.

About ADDMAN Engineering
ADDMAN Engineering is an Additive Manufacturing (“AM”) solution provider backed by American Industrial Partners (“AIP”). Combining the expertise and knowledge of AIPs 20 mid-size manufacturing companies, ADDMAN uses AM and advanced technologies to enable our customers to have breakthroughs in product development and manufacturing. ADDMAN is a vertically integrated company, and its capabilities span the design, manufacture, post-processing, and quality equipment needed to take an Additive Manufacturing part from concept to production and final quality inspection. For more information, visit: www.addmangroup.com

About VELO3D
VELO3D empowers companies to imagine more and additively manufacture nearly anything. Bringing together an integrated, end-to-end solution of software, hardware, and process-control innovation, VELO3D’s technology for 3D metal printing delivers unparalleled quality control for serial production and enhanced part performance. With VELO3D Flow™ print preparation software, Sapphire® laser powder bed AM system and Assure™ quality assurance software, manufacturers can accelerate product innovation, become more agile and responsive to market needs and reduce costs. First in the industry to introduce SupportFree™ metal 3D printing, which allows for the manufacture of previously impossible geometries, the company is based in Silicon Valley and is privately funded. VELO3D has been named to Fast Company’s prestigious annual list of the World’s Most Innovative Companies for 2021. For more information, follow VELO3D on LinkedIn or visit https://www.velo3d.com/


Contacts

Andrew Flick, VELO3D
This email address is being protected from spambots. You need JavaScript enabled to view it.

WASHINGTON--(BUSINESS WIRE)--Nodal Exchange announced today that it achieved several records in monthly power and environmental futures in the United States in April 2021. Nodal Exchange achieved record power futures open interest with 1,076 million MWh per side (equivalent to the electricity consumption of 101 million homes for a year in the USA) at the end of April representing 51.5% market share which is also a new record. Nodal also achieved record open interest in environmental futures open interest with 135,946 lots representing 12.4% market share as of end of April.


In April 2021, Nodal achieved record calendar month power futures trading with 215.1 million MWh of traded volume for a 46.5% market share. This represents Nodal Exchange’s third highest volume month ever and a growth rate of 20% over April 2020. Trading on Nodal was especially strong this month in the PJM region with a record 57.5% market share.

Nodal Exchange's North American environmental markets posted monthly futures volume in April of 21,359 contracts traded representing Nodal’s second highest volume month ever.

Nodal, in collaboration with IncubEx, continues to expand its environmental offering and posted a couple daily records in April. Texas Compliance RECs from CRS Eligible Listed Facilities futures posted a record daily volume day of 3,200 contracts (equal to 3.2 million MWh) on April 22. Open interest on the contract topped 15,000 contracts, ending the day at 16,587 contracts. Further, Maryland Solar REC futures posted a record volume day of futures trading with 4,050 lots on April 14.

“We are excited to see strong growth in the Nodal Exchange power and environmental markets and very much appreciate the trust and support of our trading and clearing community which has enabled us to achieve these record results,” said Paul Cusenza, Chairman and CEO of Nodal Exchange.

About Nodal
Nodal Exchange is a derivatives exchange providing price, credit and liquidity risk management solutions to participants in the North American commodities markets. Nodal Exchange is a leader in innovation, having introduced the world’s largest set of electric power locational (nodal) futures contracts. As part of EEX Group, a group of companies serving international commodity markets, Nodal Exchange currently offers over 1,000 contracts on hundreds of unique locations, providing the most effective basis risk management available to market participants. In addition, Nodal Exchange offers the world’s largest set of environmental futures and options as well as natural gas contracts. All Nodal Exchange contracts are cleared by Nodal Clear which is a CFTC registered derivatives clearing organization. Nodal Exchange is a designated contract market regulated by the CFTC.


Contacts

Nodal Exchange Public Relations
Nicole Ricard
Phone : 703-962-9816
E-mail : This email address is being protected from spambots. You need JavaScript enabled to view it.

The awards accelerate New York's progress towards Governor Cuomo's goal to obtain 70 percent of the state's electricity from renewable sources by 2030

SAN DIEGO--(BUSINESS WIRE)--EDF Renewables North America today announced three solar projects were awarded long-term contracts by New York State Energy Research and Development Authority (NYSERDA) as part of the 2020 Renewable Energy Standard Solicitation. Combined, the projects total 303 megawatts (MWac) of clean energy for the state.


The projects, all expecting to deliver clean electricity by the end of 2023, are as follows:

  • Tracy Solar: 119 MWac sited on approximately 1,000 acres in the towns of Orleans and Clayton in Jefferson County, New York.
  • Moraine Solar: 94 MWac sited on approximately 650 acres in the Towns of Burns, Allegany County and Town of Dansville, Steuben County, New York.
  • Homer Solar: 90 MWac sited on approximately 600 acres in the Towns of Homer, Cortlandville, and Solon, Cortland County, New York.

Cory Basil, VP Development, Northeast Region for EDF Renewables said, “Our team is thrilled to be awarded 303 MWac with the Tracy, Moraine, and Homer Solar Projects to help achieve New York State’s target to achieve 70% of the state’s electricity from renewable energy by 2030. The region will benefit from procurement and employment opportunities throughout the development, construction and operational phases. Combined the projects will bring approximately 500 jobs during peak construction and contribute millions of dollars to the Counties, Towns and School Districts during the operational life of the projects.”

Doreen M. Harris, President and CEO, NYSERDA said, “We are pleased to be working with EDF Renewables through our large-scale renewables program, and their renewable energy projects reflect another concrete step toward meeting New York’s nation-leading clean energy goals. NYSERDA continues to work closely with the developers of these renewable projects, including EDF Renewables, to ensure the communities hosting these projects are engaged in the process and the responsible siting of these projects will not only help protect our environment and valuable agricultural lands, but benefit the state and local economy and its workers.”

The expected electricity generated at full capacity is enough to meet the consumption of over 77,000 average New York homes1. This is equivalent to avoiding over 387,000 metric tons of carbon (CO₂) emissions annually which represents the greenhouse gas emissions from over 84,000 passenger vehicles driven over the course of one year2.

EDF Renewables is one of the largest renewable energy developers in North America with 20 gigawatts of wind, solar, and storage projects developed throughout the U.S., Canada, and Mexico. The Company has placed into service over 1.6 GW of grid-scale and distributed solar since 2008; and by the end of 2022 will have over 3 GW of solar in service or under construction.

1 According to U.S. Energy Information Administration (EIA) 2019 Residential Electricity Sales and U.S. Census Data and typical transmission assumptions.

2 According to U.S. EPA Greenhouse Gas Equivalencies calculations and typical transmission assumptions.

About EDF Renewables North America:

EDF Renewables North America is a market leading independent power producer and service provider with 35 years of expertise in renewable energy. The Company delivers grid-scale power: wind (onshore and offshore), solar photovoltaic, and storage projects; distributed solutions: solar, solar+storage, EV charging and energy management; and asset optimization: technical, operational, and commercial skills to maximize performance of generating projects. EDF Renewables’ North American portfolio consists of 20 GW of developed projects and 13 GW under service contracts. EDF Renewables North America is a subsidiary of EDF Renouvelables, the dedicated renewable energy affiliate of the EDF Group. For more information visit: www.edf-re.com. Connect with us on LinkedIn, Facebook and Twitter.


Contacts

Sandi Briner, +1 858-521-3525
This email address is being protected from spambots. You need JavaScript enabled to view it.

  • Quarterly results in line with company’s expectations
  • Customer growth at 2.1% for quarter as Arizona growth remains robust
  • Company well prepared to deliver reliable service through Arizona’s extreme summer temperatures

PHOENIX--(BUSINESS WIRE)--Pinnacle West Capital Corp. (NYSE: PNW) today reported consolidated net income attributable to common shareholders of $35.6 million, or $0.32 per diluted share of common stock, for the quarter ended March 31, 2021. This result compares with $30.0 million, or $0.27 per diluted share, for the same period in 2020.


First-quarter 2021 results were positively impacted by weather, higher transmission revenues, and higher pension and other postretirement non-service credits. These factors offset a moderate increase in operations and maintenance expenses, due largely to higher planned plant outages to perform seasonal maintenance ahead of summer demand.

We began 2021 on solid footing with first-quarter results in line with expectations and strong customer growth of 2.1% as families and businesses continue to choose to put down roots in Arizona,” said Pinnacle West Chairman, President and Chief Executive Officer Jeff Guldner. “With temperatures already heating up here, our employees are focused on critical preparations to deliver reliable, affordable power over our peak summer season – when customers need it most to cool their homes and businesses.”

Employees work year-round to prepare for summer demand

Key elements of the company’s summer readiness include resource planning, sufficient reserve margins, customer partnerships to manage peak demand, fire mitigation, and operational preparedness.

The company is projecting peak demand of 7,521 megawatts this year – lower than last summer’s record-breaking 7,660 megawatts, but 406 megawatts higher than 2019. This summer, the company’s diverse resource mix includes innovative demand response programs – including Peak Solutions for commercial and industrial customers and Cool Rewards for residential customers – that it can call upon to reduce load by up to about 127 megawatts, if needed. Customer demand response proved to be an effective tool for reducing system demand during 2020’s historic heat wave. Additionally, the company is in the process of procuring 450 megawatts of seasonal peaking capacity, including hydro power, to support summer preparedness.

Seasonal readiness procedures at the company’s power plants include walkdowns to ensure good material conditions and critical control system surveys – all while continuing to adhere to COVID-19 safety protocols. On the transmission and distribution side, preventative maintenance, fire mitigation patrols and summer-specific substation maintenance help support customer reliability through even the hottest days. The company also plans for the unexpected – conducting emergency operations drills and coordinating on fire and emergency management with federal, state and local agencies.

The company’s focus on summer readiness extends to its work to deliver an industry-leading customer experience. Customer touchpoints – including an interactive outage map and email and text alerts – are being enhanced ahead of Arizona’s monsoon season, which starts in mid-June. In conjunction with a shift to a 24/7 call center in August 2020, these upgrades will help keep customers better informed during any outages.

Conference Call and Webcast

Pinnacle West invites interested parties to listen to the live webcast of management’s conference call to discuss the company’s 2021 first-quarter results, as well as recent developments, at noon ET (9 a.m. Arizona time) today, May 5. A replay of the webcast can be accessed at pinnaclewest.com/presentations for 30 days. To access the live conference call by telephone, dial (877) 407-8035 or (201) 689-8035 for international callers. A replay of the call also will be available until 11:59 p.m. ET, Wednesday, May 12, 2021, by calling (877) 481-4010 in the U.S. and Canada or (919) 882-2331 internationally and entering passcode 40595.

General Information

Pinnacle West Capital Corp., an energy holding company based in Phoenix, has consolidated assets of approximately $20 billion, about 6,300 megawatts of generating capacity and slightly more than 6,000 employees in Arizona and New Mexico. Through its principal subsidiary, Arizona Public Service, the company provides retail electricity service to more than 1.3 million Arizona homes and businesses. For more information about Pinnacle West, visit the company’s website at pinnaclewest.com.

Dollar amounts in this news release are after income taxes. Earnings per share amounts are based on average diluted common shares outstanding. For more information on Pinnacle West’s operating statistics and earnings, please visit pinnaclewest.com/investors.

FORWARD-LOOKING STATEMENTS

This press release contains forward-looking statements based on current expectations. These forward-looking statements are often identified by words such as "estimate," "predict," "may," "believe," "plan," "expect," "require," "intend," "assume," "project," "anticipate," "goal," "seek," "strategy," "likely," "should," "will," "could," and similar words. Because actual results may differ materially from expectations, we caution readers not to place undue reliance on these statements. A number of factors could cause future results to differ materially from historical results, or from outcomes currently expected or sought by Pinnacle West or APS. These factors include, but are not limited to:

  • the potential effects of the continued Coronavirus ("COVID-19") pandemic, including, but not limited to, demand for energy, economic growth, our employees and contractors, supply chain, expenses, capital markets, capital projects, operations and maintenance activities, uncollectable accounts, liquidity, cash flows or other unpredictable events;
  • our ability to manage capital expenditures and operations and maintenance costs while maintaining reliability and customer service levels;
  • variations in demand for electricity, including those due to weather, seasonality, the general economy or social conditions, customer and sales growth (or decline), the effects of energy conservation measures and distributed generation, and technological advancements;
  • power plant and transmission system performance and outages;
  • competition in retail and wholesale power markets;
  • regulatory and judicial decisions, developments and proceedings;
  • new legislation, ballot initiatives and regulation, including those relating to environmental requirements, regulatory and energy policy, nuclear plant operations and potential deregulation of retail electric markets;
  • fuel and water supply availability;
  • our ability to achieve timely and adequate rate recovery of our costs through our rates and adjustor recovery mechanisms, including returns on and of debt and equity capital investment;
  • our ability to meet renewable energy and energy efficiency mandates and recover related costs;
  • the ability of APS to achieve its clean energy goals (including a goal by 2050 of 100% clean, carbon-free electricity) and, if these goals are achieved, the impact of such achievement on APS, its customers, and its business, financial condition and results of operations;
  • risks inherent in the operation of nuclear facilities, including spent fuel disposal uncertainty;
  • current and future economic conditions in Arizona, including in real estate markets;
  • the direct or indirect effect on our facilities or business from cybersecurity threats or intrusions, data security breaches, terrorist attack, physical attack, severe storms, droughts, or other catastrophic events, such as fires, explosions, pandemic health events, or similar occurrences;
  • the development of new technologies which may affect electric sales or delivery;
  • the cost of debt and equity capital and the ability to access capital markets when required;
  • environmental, economic and other concerns surrounding coal-fired generation, including regulation of greenhouse gas emissions;
  • volatile fuel and purchased power costs;
  • the investment performance of the assets of our nuclear decommissioning trust, pension, and other postretirement benefit plans and the resulting impact on future funding requirements;
  • the liquidity of wholesale power markets and the use of derivative contracts in our business;
  • potential shortfalls in insurance coverage;
  • new accounting requirements or new interpretations of existing requirements;
  • generation, transmission and distribution facility and system conditions and operating costs;
  • the ability to meet the anticipated future need for additional generation and associated transmission facilities in our region;
  • the willingness or ability of our counterparties, power plant participants and power plant landowners to meet contractual or other obligations or extend the rights for continued power plant operations; and
  • restrictions on dividends or other provisions in our credit agreements and Arizona Corporation Commission ("ACC") orders.

These and other factors are discussed in Risk Factors described in Part 1, Item 1A of the Pinnacle West/APS Annual Report on Form 10-K for the fiscal year ended December 31, 2020, which readers should review carefully before placing any reliance on our financial statements or disclosures. Neither Pinnacle West nor APS assumes any obligation to update these statements, even if our internal estimates change, except as required by law.

PINNACLE WEST CAPITAL CORPORATION
CONSOLIDATED STATEMENTS OF INCOME
(unaudited)
(dollars and shares in thousands, except per share amounts)


THREE MONTHS ENDED


MARCH 31,


2021


2020

   
Operating Revenues  

$

696,475


$

661,930


Operating Expenses  
Fuel and purchased power  


198,227


188,521


Operations and maintenance  


230,055


221,318


Depreciation and amortization  


157,820


154,079


Taxes other than income taxes  


59,483


56,768


Other expenses  


3,356


822


Total  


648,941


621,508


Operating Income  


47,534


40,422


Other Income (Deductions)  
Allowance for equity funds used during construction  


9,207


7,697


Pension and other postretirement non-service credits - net  


27,791


13,911


Other income  


12,429


12,569


Other expense  


(3,853

)


(4,784

)

Total  


45,574


29,393


Interest Expense  
Interest charges  


61,938


59,234


Allowance for borrowed funds used during construction  


(4,994

)


(4,076

)

Total  


56,944


55,158


Income Before Income Taxes  


36,164


14,657


Income Taxes  


(4,350

)


(20,209

)

   
Net Income  


40,514


34,866


Less: Net income attributable to noncontrolling interests  


4,873


4,873


Net Income Attributable To Common Shareholders  

$

35,641


$

29,993


Weighted-Average Common Shares Outstanding - Basic  


112,829


112,594


Weighted-Average Common Shares Outstanding - Diluted  


113,093


112,862


Earnings Per Weighted-Average Common Share Outstanding  
Net income attributable to common shareholders - basic  

$

0.32


$

0.27


Net income attributable to common shareholders - diluted  

$

0.32


$

0.27


Contacts

Media Contact: Alan Bunnell (602) 250-3376
Analyst Contact: Stefanie Layton (602) 250-4541
Website: pinnaclewest.com

BRYN MAWR, Pa.--(BUSINESS WIRE)--Essential Utilities (NYSE: WTRG) today announced the appointment of Edwina Kelly to the Essential Board of Directors. Kelly will serve as a member of the audit committee and the risk mitigation and investment policy committee of the board.


Kelly is a senior principal at Canada Pension Plan Investment Board (CPP Investments) where she is responsible for originating new investments, transaction management and asset management for investments in the organization’s global Sustainable Energy Group. CPP Investments invested $750 million in Essential Utilities as part of the equity raised for the purchase of Peoples Natural Gas in 2020. Kelly is replacing former director Wendy Franks as a board representative for CPP Investments.

“I look forward to working with Edwina on Essential’s Board of Directors. Her expertise and experience with renewable energy will be valuable as we strive to meet the emissions reduction targets announced earlier this year,” said Essential Chairman and CEO Christopher Franklin.

In January 2021, less than one year since the closing of the Peoples Gas acquisition, Essential announced a commitment to substantially reduce Scope 1 and 2 greenhouse gas emissions. By 2035, Essential will reduce its emissions by 60% from its 2019 baseline. This reduction is roughly equivalent to the emissions from 76,000 cars on the road over the course of the year. This will be achieved by extensive gas pipeline replacement, renewable energy purchasing, accelerated methane leak detection and repair, and various other currently planned initiatives that are highly feasible with proven technology. This science-based commitment is consistent with the rate of reduction necessary over the next 15 years to keep on track with the Paris Agreement, which aims to limit the global temperature increase to well below 2 degrees Celsius.

Prior to joining CPP Investments, Kelly was a director at EFG Hermes UAE where she helped manage the renewable energy platform and led solar portfolio acquisitions and equity restructurings of wind farm investments. She holds a bachelor’s degree in philosophy, politics and economics from the University of Oxford and is an associated chartered accountant member of the Institute of Chartered Accountants in England and Wales.

About Essential

Essential is one of the largest publicly traded water, wastewater and natural gas providers in the U.S., serving approximately 5 million people across 10 states under the Aqua and Peoples brands. Essential is committed to excellence in proactive infrastructure investment, regulatory expertise, operational efficiency and environmental stewardship. The company recognizes the importance water and natural gas play in everyday life and is proud to deliver safe, reliable services that contribute to the quality of life in the communities it serves. For more information, visit http://www.essential.co.

Forward-looking statements

This release contains forward-looking statements within the meaning of the Private Securities Litigation Reform Act of 1995, including, among others: the company’s role in the United States’ infrastructure investments; its ability to be an industry leader in protecting the environment; the guidance range of adjusted income per diluted common share for the fiscal year ending in 2021; the 3-year earnings growth from 2021 to 2023; the projected total regulated water segment customer growth for 2021; the anticipated amount of capital investment in 2021; the anticipated amount of capital investment from 2021 through 2023; and the company’s anticipated rate base growth from 2021 through 2023. There are important factors that could cause actual results to differ materially from those expressed or implied by such forward-looking statements including: disruptions in the global economy; financial and workforce impacts from the COVID-19 pandemic; the continuation of the company's growth-through-acquisition program; the company’s continued ability to adapt itself for the future and build value by fully optimizing company assets; general economic business conditions; the company’s ability to fund needed infrastructure; housing and customer growth trends; unfavorable weather conditions; the success of certain cost-containment initiatives; changes in regulations or regulatory treatment; availability and access to capital; the cost of capital; disruptions in the credit markets; the success of growth initiatives; the company’s ability to successfully close municipally owned systems presently under agreement; the company’s ability to continue to deliver strong results; the company’s ability to continue to pay its dividend, add shareholder value and grow earnings; municipalities’ willingness to privatize their water and/or wastewater utilities; the company’s ability to control expenses and create and maintain efficiencies; the company’s ability to acquire municipally owned water and wastewater systems listed in its “pipeline”; and other factors discussed in our Annual Report on Form 10-K and our Quarterly Reports on Form 10-Q, which are filed with the Securities and Exchange Commission. For more information regarding risks and uncertainties associated with Essential's business, please refer to Essential's annual, quarterly and other SEC filings. Essential is not under any obligation - and expressly disclaims any such obligation - to update or alter its forward-looking statements whether as a result of new information, future events or otherwise.

WTRGG


Contacts

Brian Dingerdissen
Essential Utilities Inc.
Investor Relations
O: 610.645.1191
This email address is being protected from spambots. You need JavaScript enabled to view it.

Dan Lockwood
Communications and Marketing
856.981.5497
This email address is being protected from spambots. You need JavaScript enabled to view it.

Report analyzes 1.7 billion transactions and features insights into customer purchasing decisions

WASHINGTON--(BUSINESS WIRE)--GetUpside, a retail tech company that guarantees more profit for 25,000 brick-and-mortar businesses by generating and delivering personalized customer incentives that change buying behavior, released its fuel industry report: Outmatch Your Competition. The report explores how retailers can attract customers in a very competitive environment -- the typical U.S. fuel retailer has at least one competitive gas station only 0.16 miles away and fuel demand is still recovering from COVID-19 in many markets.


Competitive retailers today have become laser-focused on factors that drive customers to choose them. Those factors are different from what they once were, and insights show that competitive retailers are going beyond the "traditional" in oil and gas to outmatch their competition.

GetUpside surveyed 1,300 customers, spoke with retailers, and analyzed 1.7 billion transactions nationwide to go in depth on questions like:

  • What do customers think make for the most attractive stations & c-stores?
  • What do retailers think of their current pricing strategies?
  • How much more do customers spend after they join a loyalty program?

“Winning customers in today’s environment is only becoming more difficult,” said GetUpside President of Fuel and C-store Meredith Sadlowski. “Customers have a lot of choices when they need to fill up, so retailers need to think beyond sign price and loyalty programs to win more market share. Our report dissects the current marketplace and highlights key information that station owners need to keep in mind in order to outmatch their competition.”

Having signed three of the top 10 Fortune 50 fuel companies, GetUpside represents the largest fuel network in the country. More than 30 million users have access to GetUpside offers through the GetUpside app and partners like GasBuddy, Instacart, and more.

To download and view the full report, please click here.

About GetUpside

GetUpside is a retail technology company that delivers new customers and proven profit to more than 25,000 brick and mortar businesses. GetUpside’s platform generates personalized incentives that motivate 30 million users to choose participating businesses over the competition. The profit delivered is measurable, proven, and guaranteed. When businesses and customers do better, communities grow stronger.


Contacts

Alexcia Chambers
(512) 240-2581
This email address is being protected from spambots. You need JavaScript enabled to view it.

DUBLIN--(BUSINESS WIRE)--The "Oil and Gas Asset Integrity Management Services Market - Growth, Trends, COVID-19 Impact, and Forecasts (2021 - 2026)" report has been added to ResearchAndMarkets.com's offering.


The oil and gas asset integrity management services market is expected to register a CAGR of about 8.67% during the forecast period.

The demand for oil is expected to increase by of 1.2 mb/d per year during 2020-2025 (the demand is expected to reach 104.7 mb/d by 2023, increasing by 6.9 mb/d from 2018). India and China are expected to account for around 50% of the global demand for oil, by 2025. The assets of the oil and gas industry, such as the offshore platforms, rigs, and pipelines, have been used by the industry beyond their design life.

With the continued increase in the demand for production, a majority of the assets are expected to be further used during the forecast period. Moreover, the offshore oil and gas platforms are subjected to severe ocean currents, corrosive saltwater, and frequent hurricanes. Unlike drilling rigs, which are mobile, platforms cannot be brought to shore for repairs. Many of the platforms are very old and the maintenance records are either missing or unreliable.

With the aging infrastructure, the demand for asset integrity management services in the oil and gas sector is expected to increase, in order to prolong the life of these assets. However, the lower prices of oil and gas led to reduced expenditure on CAPEX and OPEX by several major operators globally. This factor is expected hinder the growth of the market.

The downstream sector is expected to dominate the oil and gas asset integrity management services market during forecast period.

The aging oil and gas infrastructure in the Asia-Pacific region is expected to create business opportunities for then companies involved in asset integrity management services in the region.

North America is expected to continue to be a dominant market, due to the aging infrastructure, mainly in the upstream and midstream sectors.

Key Market Trends

Downstream Sector to Dominate the Market

  • Asset integrity management (AIM) services are deployed in the oil and gas refinery sector and other process plants, in order to help track the performance of assets, carry out inspections, and improve the reliability of equipment, plant safety, and profitability.
  • The global refining sector is witnessing an increased demand for refined products from the chemical and petrochemical industry. The higher margins have propelled the crack spread, which is a crucial factor for the profitability of oil refiners. This factor also encouraged investments in new projects.
  • Capacity upgrades may lead the way, as industry players invest in infrastructure that can handle more crude oil. In addition, the structure and the design of plants are becoming complex day-by-day.
  • Furthermore, in the past two decades, many major accidents were witnessed in the process plants, worldwide, owing to the factors, like delay in handing equipment for inspection, overstretching equipment run, improper maintenance practices, not undertaking proper inspection upon repair, and others.
  • Due to the aforementioned factors, the refining businesses and companies are now actively investing in asset integrity management services, in order to increase their productivity and reduce costs. Hence, the downstream sector is expected to witness a significant growth during the forecast period.

Competitive Landscape

The global oil and gas asset integrity management services market is fragmented. Some of the major companies include Aker Solutions ASA, Bureau Veritas S A, Fluor Corporation, and Technip FMC.


Key Topics Covered:


1 INTRODUCTION

1.1 Scope of the Study

1.2 Market Definition

1.3 Study Assumptions


2 RESEARCH METHODOLOGY


3 EXECUTIVE SUMMARY


4 MARKET OVERVIEW

4.1 Introduction

4.2 Market Size and Demand Forecast in USD billion, till 2025

4.3 Recent Trends and Developments

4.4 Market Dynamics

4.4.1 Drivers

4.4.2 Restraints

4.5 Government Policies and Regulations

4.6 Supply Chain Analysis


5 MARKET SEGMENTATION

5.1 Location of Deployment

5.1.1 Onshore

5.1.2 Offshore

5.2 Sector

5.2.1 Upstream

5.2.2 Midstream

5.2.3 Downstream

5.3 Geography

5.3.1 North America

5.3.2 Asia-Pacific

5.3.3 Europe

5.3.4 South America

5.3.5 Middle-East and Africa


6 COMPETITIVE LANDSCAPE

6.1 Mergers and Acquisitions, Joint Ventures, Collaborations, and Agreements

6.2 Strategies Adopted by Leading Players

6.3 Company Profiles

6.3.1 Aker Solutions ASA

6.3.2 Bureau Veritas S A

6.3.3 Genesis Oil & Gas Consultants Limited

6.3.4 Intertek Group PLC

6.3.5 Oceaneering International Inc.

6.3.6 Fluor Corporation

6.3.7 Technip FMC

6.3.8 Applus RTD Group

6.3.9 ABS Consulting Inc.

6.3.10 EM&I Ltd

6.3.11 Meridium Inc.

6.3.12 Worley Parson Limited


7 MARKET OPPORTUNITIES AND FUTURE TRENDS


For more information about this report visit https://www.researchandmarkets.com/r/7v1rc5.


Contacts

ResearchAndMarkets.com
Laura Wood, Senior Press Manager
This email address is being protected from spambots. You need JavaScript enabled to view it.

For E.S.T. Office Hours Call 1-917-300-0470
For U.S./CAN Toll Free Call 1-800-526-8630
For GMT Office Hours Call +353-1-416-8900

ST. CATHARINES, Ontario--(BUSINESS WIRE)--Algoma Central Corporation (“Algoma” or “the Company”) (TSX: ALC), a leading provider of marine transportation services, today announced its results for the quarter ended March 31, 2021. (All amounts reported below are in thousands of Canadian dollars, except for per share data and where the context dictates otherwise.)


First quarter 2021 business highlights include:

  • A net loss for the quarter of $22,416, which is a reduction of 5% compared to a loss of $23,626 reported for the prior year.
  • Global Short Sea Shipping segment earnings of $1,444 compared to a loss of $2,187 in 2020. Freight rates and volumes continued to rebound significantly in the mini bulker sector, driving a major improvement in the results for the segment.
  • Domestic Dry-Bulk segment revenues increased 16% to $24,552 compared to $21,095 in the prior year as the business unit was able to take advantage of the extended navigation season and generally milder winter conditions. Despite the increased revenues, operating earnings for the segment were down 12% as winter maintenance and dry-docking costs increased this year compared to 2020, when maintenance activities were reduced and some costs were deferred to later in the year in response to uncertainty associated with the outbreak of COVID-19.
  • Segment earnings for Product Tankers improved to $224 compared to a loss in the prior year quarter of $1,546 due to lower dry-dock spending; however, revenues were lower by 25% as the impact of lower wholesale demand for gasoline products resulted in reduced fleet utilization compared to 2020.
  • The Ocean Self-Unloader segment completed its sole 2021 dry-docking at quarter-end, returning the vessel to on-hire status in April. The dry-docking was completed earlier in the year than originally planned in anticipation of continuing improvement in volumes for the Pool over the course of the year. Earnings for the segment were up modestly.
  • Payment of the previously authorized $2.65 Special Dividend on January 12, 2021 was followed by a 31% increase in the regularly dividend to 17¢ per common share beginning with the March 1st dividend.

EBITDA, which includes our share of joint venture EBITDA, for the quarter ended March 31, 2021 was $6,651 a decrease of 13% compared to the prior year. EBITDA deteriorated slightly compared to 2020 primarily because increased winter maintenance spending in Domestic Dry-Bulk offset modestly improved results in other businesses. EBITDA is determined as follows:

For the periods ended March 31

2021

2020

Net loss

$

(22,416

)

$

(23,626

)

Depreciation and amortization

21,270


22,843


Interest and taxes

(4,787

)

(3,540

)

Foreign exchange gain

(210

)

(1,283

)

Gain on disposal of assets

(508

)

(273

)

EBITDA

$

(6,651

)

$

(5,879

)

"We have posted a solid first quarter for 2021,” said Gregg Ruhl, President and CEO of Algoma Central Corporation, "despite continued uncertainty about the pace of economic recovery from the pandemic. It is especially heartening to see the solid recovery shown in our Global Short Sea segment, as it was hit hard in 2020 by the economic fallout of COVID-19. A special recognition goes out to our technical teams for their success completing significant maintenance and improvement works this winter that will yield immediate efficiencies and long-term sustainability for our fleet. We look forward to the arrival of our newest and most efficient Equinox class bulker, the Captain Henry Jackman, which left China last week and will begin trading in July.” Mr. Ruhl concluded.

Outlook

We expect continued modest normalization in our Great Lakes and Oceans dry-bulk business. While we do not expect to repeat the strong grain volumes we saw in Domestic Dry-Bulk in 2020 in the current year, we are expecting higher salt volumes and improvement in the iron ore and aggregate businesses. Our Ocean Self-Unloader fleet has completed its only scheduled dry-docking for 2021 and should therefore be on-hire to the Pool for the balance of the year and benefit from any improvement in Pool revenues. We do remain cautious, however, regarding the outlook for the Product Tanker business. A drop in utilization resulting from a general reduction in gasoline product volumes is expected to continue for the balance of the year. The extension of lock-downs in the key Ontario market this Spring is likely to result in a delay before the fleet can return to normal levels of utilization. Meanwhile, continuation of the current rate environment in international markets would be very positive for the Global Short Sea Shipping segment and we expect to be able to take advantage of improved conditions in the purchase and sale markets.

The cost environment will be more difficult in 2021 as the Company makes significant investments in training and developing its next generation of shipboard employees.

For the periods ended March 31

2021

2020


Revenue

$

77,599


$

85,097


Operating expenses

(80,989

)

(85,333

)

Selling, general and administrative

(8,510

)

(8,383

)

Depreciation and amortization

(17,493

)

(18,814

)

Operating loss

(29,393

)

(27,433

)


Interest expense

(5,317

)

(4,991

)

Interest income

27


186


Foreign currency gain (loss)

53


242


(34,630

)

(31,996

)


Income tax expense

10,742


9,633


Net loss from investments in joint ventures

1,472


(1,263

)


Net Earnings

$

(22,416

)

$

(23,626

)


Basic earnings per share

$

(0.59

)

$

(0.62

)

Diluted earnings per share

$

(0.59

)

$

(0.62

)

For the periods ended March 31

2021

2020

Domestic Dry-Bulk


Revenue

$

24,552


$

21,095


Operating earnings

(29,686

)

(26,408

)

Product Tankers


Revenue

18,217


24,425


Operating earnings

224


(1,546

)

Ocean Self-Unloaders


Revenue

32,496


36,377


Operating earnings

4,369


3,650


Corporate and Other


Revenue

2,334


3,200


Operating loss

(4,300

)

(3,129

)

The MD&A for the quarter ended March 31, 2021 includes further details. Full results for the quarter ended March 31, 2021 can be found on the Company’s website at www.algonet.com/investor-relations and on SEDAR at www.sedar.com.

Normal Course Issuer Bid

On March 19, 2021, the Company renewed its normal course issuer bid with the intention to purchase, through the facilities of the TSX, up to 1,890,457 of its Common Shares ("Shares") representing approximately 5% of the 37,800,943 Shares which were issued and outstanding as at the close of business on March 8, 2021 (the “NCIB”). No shares have been purchased to date under this NCIB.

Cash Dividends

The Company’s Board of Directors has authorized payment of a quarterly dividend to shareholders of $0.17 per common share to be paid on June 1, 2021 to shareholders of record on May 18, 2021.

2021 Annual General & Special Meeting of Shareholders

We would like to remind all shareholders that Algoma’s Annual General and Special Meeting of Shareholders will be held in a virtual-only format via a live webcast available at www.virtualshareholdermeeting.com/ALC2021, on Wednesday, May 5, 2021 at 11:30 a.m. (EDT). Registered shareholders and duly appointed proxyholders will have an equal opportunity to attend, participate and vote at this virtual Meeting from any location. Non-registered (beneficial) shareholders who have not duly appointed themselves as proxyholders may also attend the Meeting virtually and ask questions but will not be able to vote. Guests will be able to attend virtually and listen to the Meeting but will not be able to vote or ask questions during the Meeting. A summary of the information shareholders will need in order to attend, participate and vote at the Meeting is provided in the How to Vote section of our Management Information Circular.

Use of Non-GAAP Measures

There are measures included in this press release that do not have a standardized meaning under generally accepted accounting principles (GAAP). The Company includes these measures because it believes certain investors use these measures as a means of assessing financial performance. EBITDA is a non-GAAP measure that does not have any standardized meaning prescribed by IFRS and may not be comparable to similar measures presented by other companies. Please refer to the Management’s Discussions and Analysis for the quarter ended March 31, 2021 for further information regarding non-GAAP measures.

About Algoma Central

Algoma owns and operates the largest fleet of dry and liquid bulk carriers operating on the Great Lakes - St. Lawrence Waterway, including self-unloading dry-bulk carriers, gearless dry-bulk carriers, cement carriers, and product tankers. Algoma also owns ocean self-unloading dry-bulk vessels operating in international markets and a 50% interest in NovaAlgoma, which owns and operates a diversified portfolio of dry-bulk fleets serving customers internationally.


Contacts

Gregg A. Ruhl
President & CEO
905-687-7890

Peter D. Winkley
Chief Financial Officer
905-687-7897

Or visit
www.algonet.com or www.sedar.com

On the heels of a successful Series A funding round, Cousin joins as VP of Engineering and Sammes as Hydrogen Systems Fellow

LOS ANGELES--(BUSINESS WIRE)--#engineering--Universal Hydrogen Co., the company fueling carbon-free flight, today announced two important engineering hires that come following the closing of a $20.5 million Series A financing round two weeks ago.


Mark Cousin joins Universal Hydrogen as VP of Engineering, responsible for developing and delivering the company’s modular hydrogen capsule and fuel cell powertrain products. A 30-year veteran of Airbus, Mark brings to his new role a wealth of relevant experience. He was the Technical Director for the largest aircraft modification program in Airbus history, converting the A330 into the Beluga XL in less than two years. He led the tiger team responsible for bringing the A380 to initial service with Singapore Airlines. And he spent a decade doing flight and ground testing of the A340-600, A380, and the A350. Most recently, Mark was Senior Vice President of the Flight Demonstrators organization, where he initiated the E-Fan X two-megawatt hybrid-electric aircraft program, and subsequently the CEO of Acubed, Airbus’ Silicon Valley innovation center.

Lauren Sammes is appointed Hydrogen Systems Fellow. In this role, she will be the top subject matter expert on hydrogen technology and hydrogen safety. Lauren was previously the CTO of Low Emissions Research Corporation and Director of Fuel Cell Development at Acumentrics. She has also had a distinguished career in academia, including serving as Distinguished Professor of Ceramic Engineering at the Colorado School of Mines, UTC Chair Professor and Founding Director of the Global Fuel Cell Center at the University of Connecticut, and most recently on the faculty of the University of Maine and St. Joseph’s College.

“Mark and Lauren are the very best in the world at what they do,” said Paul Eremenko, co-founder and CEO of Universal Hydrogen. “They represent the caliber of talent that we aim to attract to the company and its important mission. I look forward to working hand-in-hand with the two of them and J.-P. to grow our world-class engineering team and build products that urgently help put aviation on a trajectory to meet Paris Agreement targets.” Mark and Lauren will report to the Universal Hydrogen co-founder and CTO, John-Paul (J.-P.) Clarke.

The Universal Hydrogen team continues to expand rapidly. To learn more and apply to open positions please visit: www.hydrogen.aero/careers

About Universal Hydrogen

Universal Hydrogen is making hydrogen-powered commercial flight a near-term reality. The company takes a flexible, scalable, and capital-light approach to hydrogen logistics by transporting it in modular capsules over the existing freight network from green production sites to airports around the world. To accelerate market adoption, Universal Hydrogen is also developing a conversion kit to retrofit existing regional airplanes with a hydrogen-electric powertrain compatible with its modular capsule technology.


Contacts

Media
Kate Gundry
This email address is being protected from spambots. You need JavaScript enabled to view it.
+1-617-797-5174

DUBLIN--(BUSINESS WIRE)--The "Octane Improver Fuel Additives Market - Growth, Trends, COVID-19 Impact, and Forecasts (2021 - 2026)" report has been added to ResearchAndMarkets.com's offering.


The market for octane improver fuel additives is expected to grow at a CAGR greater than 3% globally during the forecast period.

Growing demand for ethanol-blended fuels along with increasing demand for high-performance fuels are driving the market. On the flip side, stringent environmental regulations coupled with unfavorable conditions arising due to the COVID-19 outbreak are hindering the market growth.

Companies Mentioned

  • Afton Chemical
  • BITA Trading GmbH
  • Cestoil Chemical Inc.
  • Dorf Ketal
  • Energizer Auto
  • Innospec
  • KENNOL Performance Oil
  • LIQUI MOLY GmbH
  • LUBRITA Europe B.V
  • LyondellBasell Industries Holdings B.V.
  • Penrite Oil
  • Ravensberger Schmierstoffvertrieb GmbH
  • Rheochemie GmbH
  • Total

Key Market Trends

Growing Demand for Ethanol-Blended Fuels

  • Among all octane improver fuel additives, ethanol occupies a major share and is expected to grow rapidly during the forecast period.
  • Ethanol has an octane rating of about 108 and is added to fuel to increase the overall octane rating of the fuel. The use of ethanol-blended fuel reduces the emission of NOX, CO, and particulate matter. Due to the lower carbon to hydrogen ratio, the use of ethanol reduces carbon-dioxide emissions and increases fuel efficiency. The use of ethanol produced from bio-based instead of petroleum-based is expected to reduce pollution and drive the market during the forecast period.
  • It is found that there is a significant drop in the production of flexible fuel vehicles in 2019-20 in some parts of the United States which can run on E15, E40, and E85. However, there is a rise in demand for E15 vehicles and for the first time BMW models were approved for use of E15 and it is expecting to launch E25 by the end of 2020.
  • However, due to unprecedented conditions arisen due to the COVID-19 outbreak the consumption of oil & gas is down by at least 5 million barrels per day due to lockdown in various countries resulting in the complete shutdown of travel, tourism, and e-commerce are likely to affect the consumption in 2020 and is expected to reach to normal by early 2021.
  • The growing urbanization and increasing need for reducing greenhouse gas emissions are expected to drive the market for the octane improver fuel additives during the forecast period.

Asia-Pacific Region to Dominate the Market

  • The Asia-Pacific region is expected to dominate the market for octane improver fuel additive during the forecast period due to an increase in demand from countries like China, and India
  • To reduce the pollution and particulate matter (PM 2.5) emissions, the Chinese government proposed guideline for the mandate adaptation of 10% ethanol-blended gasoline by the end of 2020 and by encouraging corn production, China is expecting to reach it's ethanol demand through bio-based production thereby reducing the impact on the environment.
  • In early 2010, diesel was available at a discount price of about INR 25 to petrol, but now the difference is in single digits. As the price differential is reducing, the preference for petrol(gasoline)-based vehicles is expected to grow in the future.
  • The Indian diesel cars sales accounted for about 19% in FYI 2019 compared to more than 50% in the year 2012, and the mandate of BS-VI engine vehicles from April-2020 made it much more difficult. India's largest automaker announced that it will discontinue the majority of its diesel car models production. While other manufacturers are expected to follow a strategic approach and will produce only high-end and heavy model diesel cars. The growing demand for petrol-based vehicles is expected to drive the market for gasoline octane improvers during the forecast period.
  • The aforementioned factors, coupled with government support, are contributing to the increasing demand for octane improver fuel additives market in the Asia-Pacific during the forecast period.

Key Topics Covered:

1 INTRODUCTION

2 RESEARCH METHODOLOGY

3 EXECUTIVE SUMMARY

4 MARKET DYNAMICS

4.1 Drivers

4.1.1 Growing Demand For Ethanol-Blended Fuels

4.1.2 Increasing Demand for High-Performance Fuels

4.2 Restraints

4.2.1 Unfavourable Conditions Arising Due to the COVID-19 Outbreak

4.2.2 Stringent Environmental Regulations

4.3 Industry Value Chain Analysis

4.4 Porters Five Forces Analysis

5 MARKET SEGMENTATION

5.1 Improver Type

5.2 Application

5.3 Geography

5.3.1 Asia-Pacific

5.3.2 North America

5.3.3 Europe

5.3.4 South America

5.3.5 Middle-East and Africa

6 COMPETITIVE LANDSCAPE

6.1 Mergers & Acquisitions, Joint Ventures, Collaborations, and Agreements

6.2 Market Share Analysis/Ranking Analysis**

6.3 Strategies Adopted by Leading Players

6.4 Company Profiles

7 MARKET OPPORTUNITIES AND FUTURE TRENDS

7.1 Growing Demand for Efficient Fuels to Alleviate Impact on Environment

For more information about this report visit https://www.researchandmarkets.com/r/bzplr1


Contacts

ResearchAndMarkets.com
Laura Wood, Senior Press Manager
This email address is being protected from spambots. You need JavaScript enabled to view it.

For E.S.T Office Hours Call 1-917-300-0470
For U.S./CAN Toll Free Call 1-800-526-8630
For GMT Office Hours Call +353-1-416-8900

HOUSTON--(BUSINESS WIRE)--Magnolia Oil & Gas Corporation (“Magnolia,” “we,” “our,” or the “Company”) (NYSE: MGY) today announced its financial and operational results for the first quarter of 2021.


First Quarter 2021 Highlights:

(In millions, except per share data)

For the

Quarter Ended

March 31, 2021

Net income

$

91.5

Earnings per share - diluted

0.37

Adjusted net income(1)

93.8

Adjusted earnings per share(1)

0.38

Adjusted EBITDAX(1)

150.8

Capital expenditures - D&C

38.9

Cash balance as of March 31, 2021

$

178.2

Average daily production (Mboe/d)

62.3

Diluted weighted average total shares outstanding(2)

249.9

  • Magnolia reported first quarter 2021 net income attributable to Class A Common Stock of $63.2 million, or $0.37 per diluted share. First quarter 2021 total net income was $91.5 million and adjusted net income was $93.8 million, or $0.38 per diluted share.
  • Adjusted EBITDAX for the first quarter of 2021 was $150.8 million, a 54% sequential quarterly increase driven by both higher overall production and stronger product prices. Total capital allocated to drilling and completions (“D&C”) during the first quarter was $38.9 million, or 26% of adjusted EBITDAX.
  • Net cash provided by operating activities was $118.2 million and the Company generated free cash flow(1) of $100.0 million during the first quarter.
  • During the first quarter of 2021, we generated operating income as a percent of revenue of 48%, compared to 29% during fourth quarter 2020.
  • Total production in the first quarter of 2021 increased 3% sequentially to 62.3 thousand barrels of oil equivalent per day (“Mboe/d”). Production at Giddings achieved another record level in the first quarter with total volumes of 34.6 Mboe/d increasing 22% sequentially and 45% from prior year levels. Giddings oil production of 11.3 Mbbl/d increased by 32% sequentially and 73% over the same period last year.
  • Magnolia spent $88 million reducing its shares during the first quarter of 2021. As a result, the fully diluted share count is expected to decline by approximately 4% to 245 million diluted shares in the second quarter of 2021 from 255 million shares in the fourth quarter of 2020. Magnolia ended the first quarter with 12.6 million Class A Common shares remaining under the current share repurchase authorization.
  • Magnolia had approximately $178.2 million of cash on its balance sheet at the end of the first quarter of 2021 and remains undrawn on its $450.0 million revolving credit facility. The Company has no debt maturities until 2026 and has no plans to increase its debt levels.
  • As stated earlier this year, Magnolia expects to begin paying a semi-annual cash dividend during the third quarter of 2021.

(1)

Adjusted net income, adjusted earnings per share, adjusted EBITDAX, and free cash flow are non-GAAP financial measures. For reconciliations to the most comparable GAAP measures, please see “Non-GAAP Financial Measures” at the end of this press release.

(2)

Weighted average total shares outstanding include diluted weighted average shares of Class A Common Stock outstanding during the period and shares of Class B Common Stock, which are anti-dilutive in the calculation of weighted average number of common shares outstanding.

Magnolia had a very strong start to 2021, achieving record quarterly earnings. The characteristics of our strategy and business model should gain momentum through the year as our per share and unit metrics continue to improve,” said Chairman, President and CEO Steve Chazen. “Our disciplined approach toward allocating capital to our assets is expected to generate moderate growth and strong profit margins this year, while generating meaningful free cash flow.

Despite lower capital spending, total production continued to grow in the first quarter, demonstrating the quality of our assets. The growth in volumes was driven by record production from the Giddings area, which increased 22 percent sequentially and 45 percent compared to the prior-year quarter. Based on continued strong well results in Giddings and increased activity in Karnes, we now expect our full-year 2021 production to grow 6 to 9 percent compared to prior year levels, while spending somewhat less than $300 million.

Our ongoing free cash flow generation and strong financial position will allow us to allocate the excess cash toward accretive, small bolt-on property acquisitions, or repurchasing our shares. We used our free cash flow and some of our balance sheet cash to reduce our share count by roughly 4 percent compared to fourth quarter 2020 levels. We continue to target repurchasing around 1 percent of our outstanding shares each quarter. In addition, Magnolia plans to pay its first semi-annual dividend during the third quarter of this year. Magnolia’s oil production remains unhedged as part of our strategy, allowing us to fully capture the benefit of improved prices.”

Operational Update

First quarter total company production averaged 62.3 Mboe/d, representing a 3 percent increase from fourth quarter 2020 levels. The higher production outcome was a result of better-than-expected production at our Giddings asset and as several new wells were turned in-line. Giddings and Other production averaged 34.6 Mboe/d representing a 22 percent increase in sequential volumes and a 45 percent increase from the same prior-year quarter. Oil production at Giddings averaged 11.3 Mbbl/d, a 32 percent sequential increase and a 73 percent increase compared to last year’s first quarter. Production in the Karnes area averaged 27.7 Mboe/d during the first quarter of 2021.

We plan to add a second drilling rig this summer. One rig will continue drilling multi-well pads in our Giddings area. The second rig will operate in both the Karnes and Giddings areas, including some appraisal wells at Giddings. Total well costs associated with drilling, completion and facilities continue to average about $6 million per well at Giddings and we expect to drill about 2 wells per month.

Guidance

Inclusive of the additional rig for the back half of the year, we expect Magnolia’s capital spending for drilling and completing wells to be somewhat less than $300 million this year. Our D&C capital is expected to increase during the second quarter and during the second half of the year, which coincides with the added activity. Magnolia’s total production for 2021 is currently expected to grow 6 to 9 percent compared to full-year 2020 levels.

Looking at the second quarter of 2021, total production is forecast to be about 66 Mboe/d, a 6 percent increase from first quarter production levels. Oil price differentials are anticipated to be approximately a $3 per barrel discount to Magellan East Houston (“MEH”) during the second quarter. The fully diluted share count for the second quarter of 2021 is expected to be approximately 245 million shares which is 4 percent lower than fourth quarter 2020 levels.

Quarterly Report on Form 10-Q

Magnolia's financial statements and related footnotes will be available in its Quarterly Report on Form 10-Q for the three months ended March 31, 2021, which is expected to be filed with the U.S. Securities and Exchange Commission (“SEC”) on May 5, 2021.

Conference Call and Webcast

Magnolia will host an investor conference call on Wednesday, May 5, 2021 at 10:00 a.m. Central (11:00 a.m. Eastern) to discuss these operating and financial results. Interested parties may join the webcast by visiting Magnolia's website at www.magnoliaoilgas.com/investors/events-and-presentations and clicking on the webcast link or by dialing 1-844-701-1059. A replay of the webcast will be posted on Magnolia's website following completion of the call.

About Magnolia Oil & Gas Corporation

Magnolia (MGY) is a publicly traded oil and gas exploration and production company with operations primarily in South Texas in the core of the Eagle Ford Shale and Austin Chalk formations. Magnolia focuses on generating value for shareholders through steady production growth, strong pre-tax margins, and free cash flow. For more information, visit www.magnoliaoilgas.com.

Cautionary Note Regarding Forward-Looking Statements

The information in this press release includes forward-looking statements within the meaning of Section 27A of the Securities Act of 1933, as amended, and Section 21E of the Securities Exchange Act of 1934, as amended. All statements, other than statements of present or historical fact included in this press release, regarding Magnolia’s strategy, future operations, financial position, estimated revenues, and losses, projected costs, prospects, plans and objectives of management are forward looking statements. When used in this press release, the words could, should, will, may, believe, anticipate, intend, estimate, expect, project, the negative of such terms and other similar expressions are intended to identify forward-looking statements, although not all forward-looking statements contain such identifying words. These forward-looking statements are based on management’s current expectations and assumptions about future events and are based on currently available information as to the outcome and timing of future events. Except as otherwise required by applicable law, Magnolia disclaims any duty to update any forward-looking statements, all of which are expressly qualified by the statements in this section, to reflect events or circumstances after the date of this press release. Magnolia cautions you that these forward-looking statements are subject to all of the risks and uncertainties, most of which are difficult to predict and many of which are beyond the control of Magnolia, incident to the development, production, gathering and sale of oil, natural gas and natural gas liquids. In addition, Magnolia cautions you that the forward looking statements contained in this press release are subject to the following factors: (i) the length, scope and severity of the ongoing coronavirus disease 2019 (“COVID-19”) pandemic, including the effects of related public health concerns and the impact of continued actions taken by governmental authorities and other third parties in response to the pandemic and its impact on commodity prices as well as supply and demand considerations; (ii) the outcome of any legal proceedings that may be instituted against Magnolia; (iii) Magnolia’s ability to realize the anticipated benefits of its acquisitions, which may be affected by, among other things, competition and the ability of Magnolia to grow and manage growth profitably; (iv) changes in applicable laws or regulations; and (v) the possibility that Magnolia may be adversely affected by other economic, business, and/or competitive factors. Should one or more of the risks or uncertainties described in this press release occur, or should underlying assumptions prove incorrect, actual results and plans could differ materially from those expressed in any forward-looking statements. Additional information concerning these and other factors that may impact the operations and projections discussed herein can be found in Magnolia’s filings with the SEC, including its Annual Report on Form 10-K for the fiscal year ended December 31, 2020. Magnolia’s SEC filings are available publicly on the SEC’s website at www.sec.gov.

Magnolia Oil & Gas Corporation

Operating Highlights


For the Quarters Ended


March 31, 2021


March 31, 2020

Production:


Oil (MBbls)


2,593


3,391


Natural gas (MMcf)


10,240


10,053


Natural gas liquids (MBbls)


1,304


1,155


Total (Mboe)


5,604


6,222


Average daily production:


Oil (Bbls/d)


28,808


37,259


Natural gas (Mcf/d)


113,783


110,475


Natural gas liquids (Bbls/d)


14,490


12,688


Total (boe/d)


62,262


68,360


Revenues (in thousands):


Oil revenues


$

146,413


$

154,686


Natural gas revenues


34,764


16,175


Natural gas liquids revenues


26,486


10,504


Total Revenues


$

207,663


$

181,365


Average sales price:


Oil (per Bbl)


$

56.47


$

45.62


Natural gas (per Mcf)


3.39


1.61


Natural gas liquids (per Bbl)


20.31


9.09


Total (per boe)


$

37.06


$

29.15


NYMEX WTI (per Bbl)


$

57.80


$

46.08


NYMEX Henry Hub (per Mcf)


$

2.70


$

1.95


Realization to benchmark:


Oil (% of WTI)


98

%


99

%

Natural Gas (% of Henry Hub)


126

%


83

%


Operating expenses (in thousands):


Lease operating expenses


$

19,392


$

24,163


Gathering, transportation and processing


8,799


8,020


Taxes other than income


10,762


10,018


Depreciation, depletion and amortization


42,944


142,671


Operating costs per boe:


Lease operating expenses


$

3.46


$

3.88


Gathering, transportation and processing


1.57


1.29


Taxes other than income


1.92


1.61


Depreciation, depletion and amortization


7.66


22.93


Magnolia Oil & Gas Corporation

Consolidated Statements of Operations

(In thousands, except per share data)


For the Quarters Ended


March 31, 2021


March 31, 2020

REVENUES


Oil revenues


$

146,413


$

154,686


Natural gas revenues


34,764


16,175


Natural gas liquids revenues


26,486


10,504


Total revenues


207,663


181,365


OPERATING EXPENSES


Lease operating expenses


19,392


24,163


Gathering, transportation and processing


8,799


8,020


Taxes other than income


10,762


10,018


Exploration expense


2,062


556,427


Impairment of oil and natural gas properties


1,381,258


Asset retirement obligations accretion


1,331


1,438


Depreciation, depletion and amortization


42,944


142,671


Amortization of intangible assets


2,113


3,626


General and administrative expenses


20,364


18,080


Total operating expenses


107,767


2,145,701


OPERATING INCOME (LOSS)


99,896


(1,964,336

)


OTHER INCOME (EXPENSE)


Income from equity method investee


440


Interest expense, net


(7,294

)


(6,757

)

Loss on derivatives, net


(482

)


Other expense, net


(229

)


(472

)

Total other expense, net


(8,005

)


(6,789

)


INCOME (LOSS) BEFORE INCOME TAXES


91,891


(1,971,125

)

Income tax expense (benefit)


399


(75,826

)

NET INCOME (LOSS)


91,492


(1,895,299

)

LESS: Net income (loss) attributable to noncontrolling interest


28,248


(668,289

)

NET INCOME (LOSS) ATTRIBUTABLE TO CLASS A COMMON STOCK


63,244


(1,227,010

)


NET INCOME (LOSS) PER COMMON SHARE

Basic


$

0.38


$

(7.34

)

Diluted


$

0.37


$

(7.34

)

WEIGHTED AVERAGE NUMBER OF COMMON SHARES OUTSTANDING

Basic


166,952


167,149


Diluted


169,636


167,149


WEIGHTED AVERAGE NUMBER OF CLASS B SHARES OUTSTANDING(1)


80,253


85,790


(1)

Shares of Class B Common Stock, and corresponding Magnolia LLC Units, are anti-dilutive in the calculation of weighted average number of common shares outstanding.

Magnolia Oil & Gas Corporation

Summary Cash Flow Data

(In thousands)


For the Quarters Ended


March 31, 2021


March 31, 2020

CASH FLOWS FROM OPERATING ACTIVITIES

NET INCOME (LOSS)


$

91,492


$

(1,895,299

)

Adjustments to reconcile net income (loss) to net cash provided by operating activities:


Depreciation, depletion and amortization


42,944


142,671


Amortization of intangible assets


2,113


3,626


Exploration expense, non-cash


555,189


Impairment of oil and natural gas properties


1,381,258


Asset retirement obligations accretion


1,331


1,438


Amortization of deferred financing costs


910


896


Loss on derivatives, net


482


Deferred tax expense (benefit)


(74,654

)

Stock based compensation


2,705


2,879


Other


(84

)


(440

)

Net change in operating assets and liabilities


(23,740

)


17,314


Net cash provided by operating activities


118,153


134,878


CASH FLOWS FROM INVESTING ACTIVITIES


Acquisitions, other


(558

)


(69,390

)

Additions to oil and natural gas properties


(40,166

)


(101,391

)

Changes in working capital associated with additions to oil and natural gas properties


(1,744

)


7,181


Other investing


(416

)


(200

)

Net cash used in investing activities


(42,884

)


(163,800

)


CASH FLOW FROM FINANCING ACTIVITIES


Distributions to noncontrolling interest owners


(155

)


(284

)

Class A Common Stock repurchases


(20,281

)


(6,483

)

Class B Common Stock purchase and cancellation


(50,781

)


Non-compete settlement in lieu of Class A Common Stock issuance


(17,152

)


Other financing activities


(1,267

)


(452

)

Net cash used in financing activities


(89,636

)


(7,219

)


NET CHANGE IN CASH AND CASH EQUIVALENTS


(14,367

)


(36,141

)

Cash and cash equivalents – Beginning of period


192,561


182,633


Cash and cash equivalents – End of period


$

178,194


$

146,492


Magnolia Oil & Gas Corporation

Summary Balance Sheet Data

(In thousands)


March 31, 2021


December 31, 2020

Cash and cash equivalents


$

178,194


$

192,561


Other current assets


111,024


88,965


Property, plant and equipment, net


1,147,802


1,149,527


Other assets


18,828


22,367


Total assets


$

1,455,848


$

1,453,420


Current liabilities


$

125,935


$

128,949


Long-term debt, net


391,448


391,115


Other long-term liabilities


94,453


93,934


Common stock


25


26


Additional paid in capital


1,731,234


1,712,544


Treasury stock


(59,239

)


(38,958

)

Retained earnings (accumulated deficit)


(1,062,206

)


(1,125,450

)

Noncontrolling interest


234,198


291,260


Total liabilities and equity


$

1,455,848


$

1,453,420


Magnolia Oil & Gas Corporation
Non-GAAP Financial Measures

Reconciliation of net income (loss) to adjusted EBITDAX

In this press release, we refer to adjusted EBITDAX, a supplemental non-GAAP financial measure that is used by management and external users of our consolidated financial statements, such as industry analysts, investors, lenders, and rating agencies. We define adjusted EBITDAX as net income (loss) before interest expense, income taxes, depreciation, depletion and amortization, amortization of intangible assets, exploration costs, and accretion of asset retirement obligations, adjusted to exclude the effect of certain items included in net income (loss). Adjusted EBITDAX is not a measure of net income in accordance with GAAP.

Our management believes that adjusted EBITDAX is useful because it allows them to more effectively evaluate our operating performance and compare the results of our operations from period to period and against our peers without regard to our financing methods or capital structure. We also believe that securities analysts, investors, and other interested parties may use adjusted EBITDAX in the evaluation of our Company. We exclude the items listed above from net income (loss) in arriving at adjusted EBITDAX because these amounts can vary substantially from company to company within our industry depending upon accounting methods and book values of assets, capital structures and the method by which the assets were acquired. Adjusted EBITDAX should not be considered as an alternative to, or more meaningful than, net income (loss) as determined in accordance with GAAP or as an indicator of our operating performance or liquidity. Certain items excluded from adjusted EBITDAX are significant components in understanding and assessing a company’s financial performance, such as a company’s cost of capital and tax structure, as well as the historic costs of depreciable assets, none of which are components of adjusted EBITDAX. Our presentation of adjusted EBITDAX should not be construed as an inference that our results will be unaffected by unusual or non-recurring items. Our computations of adjusted EBITDAX may not be comparable to other similarly titled measures of other companies.

The following table presents a reconciliation of net income (loss) to adjusted EBITDAX, our most directly comparable financial measure, calculated and presented in accordance with GAAP:


For the Quarters Ended

(In thousands)


March 31, 2021


March 31, 2020

NET INCOME (LOSS)


$

91,492


$

(1,895,299

)

Exploration expense


2,062


556,427


Asset retirement obligations accretion


1,331


1,438


Depreciation, depletion and amortization


42,944


142,671


Amortization of intangible assets


2,113


3,626


Interest expense, net


7,294


6,757


Income tax expense (benefit)


399


(75,826

)

EBITDAX


147,635


(1,260,206

)

Impairment of oil and natural gas properties


1,381,258


Non-cash stock based compensation expense


2,705


2,879


Unrealized loss on derivatives, net


482


Adjusted EBITDAX


$

150,822


$

123,931


Magnolia Oil & Gas Corporation
Non-GAAP Financial Measures

Reconciliation of net income (loss) attributable to Class A Common Stock to adjusted earnings

Our presentation of adjusted earnings and adjusted earnings per share are non-GAAP measures because they exclude the effect of certain items included in net income (loss) attributable to Class A Common Stock. Management uses adjusted earnings and adjusted earnings per share to evaluate our operating and financial performance because it eliminates the impact of certain items that management does not consider to be representative of the Company’s on-going business operations. As a performance measure, adjusted earnings may be useful to investors in facilitating comparisons to others in the Company’s industry because certain items can vary substantially in the oil and gas industry from company to company depending upon accounting methods, book value of assets, and capital structure, among other factors. Management believes excluding these items facilitates investors and analysts in evaluating and comparing the underlying operating and financial performance of our business from period to period by eliminating differences caused by the existence and timing of certain expense and income items that would not otherwise be apparent on a GAAP basis. However, our presentation of adjusted earnings and adjusted earnings per share may not be comparable to similar measures of other companies in our industry.


For the
Quarter Ended
March 31, 2021


Per Share
Diluted
EPS


For the
Quarter Ended
March 31, 2020


Per Share
Diluted
EPS

(In thousands, except per share data)

NET INCOME (LOSS) ATTRIBUTABLE TO CLASS A COMMON STOCK

$

63,244


$

0.37


$

(1,227,010

)


$

(7.34

)

Adjustments:


Impairment of proved oil and natural gas properties


1,381,258


8.26


Impairment of unproved properties(1)


555,175


3.32


Unrealized loss on derivatives, net

482


Seismic purchases

1,860


0.01


Noncontrolling interest impact of adjustments

(723

)


(656,527

)


(3.93

)

Change in estimated income tax

(7

)


(71,362

)


(0.42

)

ADJUSTED NET INCOME (LOSS) ATTRIBUTABLE TO CLASS A COMMON STOCK

$

64,856


$

0.38


$

(18,466

)


$

(0.11

)

(1)

Impairment of unproved properties is included within Exploration expense on the consolidated statements of operations.

Magnolia Oil & Gas Corporation
Non-GAAP Financial Measures

Reconciliation of net income (loss) to adjusted net income (loss)

Our presentation of adjusted net income (loss) is a non-GAAP measures because it excludes the effect of certain items included in net income and adjusts for income taxes assuming the exchange of all outstanding Magnolia LLC Units and corresponding Class B Common Stock for shares of Class A Common Stock. Management uses adjusted net income (loss) to evaluate our operating and financial performance because it eliminates the impact of certain items that management does not consider to be representative of the Company’s on-going business operations.


Contacts

Contacts for Magnolia Oil & Gas Corporation

Investors
Brian Corales
(713) 842-9036
This email address is being protected from spambots. You need JavaScript enabled to view it.

Media
Art Pike
(713) 842-9057
This email address is being protected from spambots. You need JavaScript enabled to view it.


Read full story here

WALLINGFORD, Conn.--(BUSINESS WIRE)--#Containerized--Nel Hydrogen Electrolyser, a division of Nel ASA (Nel, OSE:NEL), received a purchase order for a 2 MW, fully containerized MC400 electrolyser from H2 Energy.


"This is a new milestone achieved in the development of a commercial green hydrogen infrastructure, clearly showing that hydrogen for heavy duty vehicles is a reality today. We are proud that our compact PEM containerized solution has been selected for this second site to supply the refueling stations network," says Raymond Schmid, VP Sales and Marketing EMEA, Nel Hydrogen Electrolyser.

The 2 MW PEM electrolyser is the second system to be delivered as part of the green hydrogen infrastructure network that is currently supplying hydrogen to the first 46 Hyundai trucks already operating in Switzerland and aiming to reach a fleet of 1,600 by 2025. The system will be filling 350 barg trailers directly at site to dispatch the hydrogen to the Hydrospider network in Switzerland.

H2 Energy is working together with various partners to establish a nation‐wide network of hydrogen stations and corresponding supply chain in Switzerland as well as abroad. H2 Energy is focusing on producing only renewable energy-based hydrogen to contribute to the decarbonization of various sectors.

About Nel ASA | www.nelhydrogen.com

Nel is a global, dedicated hydrogen company, delivering optimal solutions to produce, store, and distribute hydrogen from renewable energy. We serve industries, energy, and gas companies with leading hydrogen technology. Our roots date back to 1927, and since then, we have had a proud history of development and continuous improvement of hydrogen technologies. Today, our solutions cover the entire value chain: from hydrogen production technologies to hydrogen fueling stations, enabling industries to transition to green hydrogen, and providing fuel cell electric vehicles with the same fast fueling and long range as fossil-fueled vehicles - without the emissions.


Contacts

Jon André Løkke, CEO, +47 907 44 949
Kjell Christian Bjørnsen, CFO, +47 917 02 097
Or email This email address is being protected from spambots. You need JavaScript enabled to view it.

- Revenue and Profit Growth Exceeds Expectations -

- Meaningful Pickup in Project Award Activity -

- Recent Capital Raise Supports Accelerated Energy Asset Growth -

- Increases 2021 Guidance -

First Quarter 2021 Financial Highlights:

  • Revenues of $252.2 million, up 19% year-over-year
  • Net Income of $11.2 million, up 80%
  • GAAP EPS of $0.22, up 69%
  • Non-GAAP EPS of $0.25, up 67%
  • Adjusted EBITDA of $29.7 million, up 40%

FRAMINGHAM, Mass.--(BUSINESS WIRE)--#cleanenergy--Ameresco, Inc. (NYSE:AMRC), a leading cleantech integrator specializing in energy efficiency and renewable energy, today announced financial results for the fiscal quarter ended March 31, 2021. The Company has also furnished supplemental information in conjunction with this press release in a Current Report on Form 8-K. The supplemental information includes non-GAAP financial metrics and has been posted to the “Investor Relations” section of the Company’s website at www.ameresco.com.

“Our first quarter results were excellent and exceeded our expectations across all major metrics,” said George P. Sakellaris, President and Chief Executive Officer. “Business conditions improved progressively throughout the period and our employees rose to overcome the challenges presented during the quarter. This was another strong quarter for the Projects business, particularly within our Federal group. Our Energy Asset business also posted a meaningful pickup in revenue and profit. We were also pleased to see a considerable increase in project and asset proposals during the quarter, indicating a return to a more normalized activity level post-COVID-19 and leading to significant sequential and year-over-year growth in our awarded backlog.”

“In the first quarter, we completed our first public equity offering since Ameresco’s IPO in 2010, raising over $120 million for the company, positioning us to accelerate the growth of our recurring revenue Energy Asset business. Specifically, we will be taking advantage of strong demand and opportunity in the emerging RNG space, where we now plan to construct and commission three RNG facilities in 2022 and four additional sites in 2023. These developments will be in addition to our continued buildout of other energy technologies, including solar, energy storage, microgrids and EaaS.”

First Quarter Financial Results

(All financial result comparisons made are against the prior year period unless otherwise noted.)

Total revenue increased 19% to $252.2 million, compared to $212.4 million year-over-year. The projects business saw 25% growth led by another strong quarter in the Federal group which benefited from favorable timing of certain approvals and progress on customized equipment. Energy Assets revenue increased 18% as the company continues to grow its assets in operation, improved production from existing assets and realized favorable RIN prices during the quarter. Gross margin of 18.6% increased 10 basis points sequentially and 50 basis points year-over-year. Operating income increased 92% to $18.3 million and operating margin was 7.3%. Operating income growth significantly exceeded revenue growth as a result of continued expense controls, higher utilization and the leverage inherent in our scalable business model. Net income attributable to common shareholders increased 80% to $11.2 million and GAAP EPS increased 69% to $0.22 compared to $0.13. Adjusted EBITDA, a non-GAAP financial measure, increased 40% to $29.7 million.

(in millions)

1Q 2021

1Q 2020


Revenue

Net Income

Adj. EBITDA

Revenue

Net Income (Loss)

Adj. EBITDA

Projects

$180.7

$4.4

$8.3

$144.4

$(0.7)

$1.7

Energy Assets

$33.3

$5.9

$18.7

$28.2

$4.3

$15.5

O&M

$18.5

$0.6

$1.8

$18.1

$1.2

$2.4

Other

$19.7

$0.2

$0.9

$21.7

$1.3

$1.6

Total

$252.2

$11.2

$29.7

$212.4

$6.2

$21.2

(in millions)


At March 31, 2021

Awarded Project Backlog


$1,521

Contracted Project Backlog


$788

Total Project Backlog


$2,309


O&M Revenue Backlog


$1,127

Energy Asset Visibility *


$940

Operating Energy Assets


287 MWe

Assets in Development


386 MWe

* estimated contracted revenue and incentives throughout PPA term on our operating energy assets

Project Highlights

In the first quarter of 2021:

  • Our recently announced construction start of the Norfolk Naval Shipyard (NNSY) in Portsmouth, Virginia highlights our total solutions capabilities utilizing clean advanced technologies. The $173 million project includes a new 17.3 megawatt (MW) combined heat and power (CHP) plant, a 3 MW battery energy storage system, and a microgrid control system. These will provide the site with long-term energy security while reducing the electricity imported from the grid by 68 percent and mission critical steam. After construction is completed in 2022, Ameresco will operate and maintain the CHP plant, IWTP (industrial waste water treatment plant), and microgrid until January 2044 providing a long-term recurring O&M revenue stream.
  • We anticipate continued demand from the C&I market as more forward-looking companies look to save money while also lowering their carbon footprint. Our recently announced solar project with Wells Fargo to develop and install approximately 30 MW of new, onsite solar generation assets at corporate and retail locations in seven states is a great example of the growing opportunities in the C&I market. Construction of the nearly 100 solar arrays will go into 2022.

Asset Highlights

In the first quarter of 2021:

  • Ameresco brought 5 MWe into operation while adding 40 MWe to our development backlog, bringing our total to 386 MWe.
  • Asset additions in the quarter included the award of Energy as a Service for a C&I customer and awards of distributed solar installations in our East, Central and West regions.

Summary and Outlook

“The first quarter represented a strong start to the year and has laid the foundation for 2021 to be another year of strong growth for Ameresco. Additionally, we see substantial opportunities ahead as our customers prioritize cost savings and resiliency, combined with reducing their carbon footprints. Ameresco’s services are well aligned with the new Administration’s overarching goal of decarbonizing the U.S. economy and its mandate that climate change be considered in major decisions across all government agencies,” Mr. Sakellaris noted.

Based on visibility from our project backlog and our increased levels of recurring revenues, the Company is increasing its 2021 guidance ranges detailed in the table below, representing year-over-year revenue and adjusted EBITDA growth of 10% and 23%, respectively, at the midpoints, and Non-GAAP EPS growth of 20% at the midpoint, excluding the impact of approximately $0.13 of one-time tax benefits realized in 2020. The Company anticipates commissioning a further 55 to 75 MWe of energy assets and plans to invest approximately $165 million to $215 million in additional energy asset capital expenditures during the remainder of 2021, the majority of which will be funded with project finance debt.

FY 2021 Guidance Ranges

Revenue

$1.11 billion

$1.16 billion

Gross Margin

18.5%

19.5%

Adjusted EBITDA

$140 million

$150 million

Interest Expense & Other

$20 million

$22 million

Effective Tax Rate

12%

18%

Non-GAAP EPS

$1.22

$1.30

Conference Call/Webcast Information

The Company will host a conference call today at 4:30 p.m. ET to discuss results. The conference call will be available via the following dial in numbers:

  • U.S. Participants: Dial +1 (877) 359-9508 (Access Code: 5664848)
  • International Participants: Dial +1 (224) 357-2393 (Access Code: 5664848)

Participants are advised to dial into the call at least ten minutes prior to register. A live, listen-only webcast of the conference call will also be available over the Internet. Individuals wishing to listen can access the call through the “Investor Relations” section of the Company’s website at www.ameresco.com. An archived webcast will be available on the Company’s website for one year.

Use of Non-GAAP Financial Measures

This press release and the accompanying tables include references to adjusted EBITDA, Non- GAAP EPS, Non-GAAP net income and adjusted cash from operations, which are Non-GAAP financial measures. For a description of these Non-GAAP financial measures, including the reasons management uses these measures, please see the section following the accompanying tables titled “Exhibit A: Non-GAAP Financial Measures”. For a reconciliation of these Non-GAAP financial measures to the most directly comparable financial measures prepared in accordance with GAAP, please see Other Non-GAAP Disclosures and Non-GAAP Financial Guidance in the accompanying tables.

About Ameresco, Inc.

Founded in 2000, Ameresco, Inc. (NYSE:AMRC) is a leading cleantech integrator and renewable energy asset developer, owner and operator. Our comprehensive portfolio includes energy efficiency, infrastructure upgrades, asset sustainability and renewable energy solutions delivered to clients throughout North America and the United Kingdom. Ameresco’s sustainability services in support of clients’ pursuit of Net Zero include upgrades to a facility’s energy infrastructure and the development, construction, and operation of distributed energy resources. Ameresco has successfully completed energy saving, environmentally responsible projects with Federal, state and local governments, healthcare and educational institutions, housing authorities, and commercial and industrial customers. With its corporate headquarters in Framingham, MA, Ameresco has more than 1,000 employees providing local expertise in the United States, Canada, and the United Kingdom. For more information, visit www.ameresco.com.

Safe Harbor Statement

Any statements in this press release about future expectations, plans and prospects for Ameresco, Inc., including statements about market conditions, pipeline and backlog, as well as estimated future revenues and net income, and other statements containing the words “projects,” “believes,” “anticipates,” “plans,” “expects,” “will” and similar expressions, constitute forward-looking statements within the meaning of The Private Securities Litigation Reform Act of 1995. Actual results may differ materially from those indicated by such forward looking statements as a result of various important factors, including the timing of, and ability to, enter into contracts for awarded projects on the terms proposed; the timing of work we do on projects where we recognize revenue on a percentage of completion basis, including the ability to perform under recently signed contracts without unusual delay; demand for our energy efficiency and renewable energy solutions; our ability to arrange financing for our projects; changes in federal, state and local government policies and programs related to energy efficiency and renewable energy; the ability of customers to cancel or defer contracts included in our backlog; the effects of our recent acquisitions and restructuring activities; seasonality in construction and in demand for our products and services; a customer’s decision to delay our work on, or other risks involved with, a particular project; availability and costs of labor and equipment; the addition of new customers or the loss of existing customers; market price of the Company's stock prevailing from time to time; the nature of other investment opportunities presented to the Company from time to time; the Company's cash flows from operations; and other factors discussed in our Annual Report on Form 10-K for the year ended December 31, 2020, filed with the U.S. Securities and Exchange Commission (SEC) on March 2, 2021. Currently, one of the most significant factors, however, is the potential adverse effect of the current pandemic of the novel coronavirus, or COVID-19, on our financial condition, results of operations, cash flows and performance and the global economy and financial markets. The extent to which COVID-19 impacts us, suppliers, customers, employees and supply chains will depend on future developments, which are highly uncertain and cannot be predicted with confidence, including the scope, severity and duration of the pandemic, the actions taken to contain the pandemic or mitigate its impact, and the direct and indirect economic effects of the pandemic and containment measures, among others. Moreover, you should interpret many of the risks identified in our Annual Report and Quarterly Report as being heightened as a result of the ongoing and numerous adverse impacts of COVID-19. In addition, the forward-looking statements included in this press release represent our views as of the date of this press release. We anticipate that subsequent events and developments will cause our views to change. However, while we may elect to update these forward-looking statements at some point in the future, we specifically disclaim any obligation to do so. These forward-looking statements should not be relied upon as representing our views as of any date subsequent to the date of this press release.


AMERESCO, INC.

CONDENSED CONSOLIDATED BALANCE SHEETS

(In thousands, except share amounts)


March 31,


December 31,


2021


2020


(Unaudited)


ASSETS

Current assets:


Cash and cash equivalents

$

80,971


$

66,422


Restricted cash

24,869


22,063


Accounts receivable, net

113,095


125,010


Accounts receivable retainage, net

32,071


30,189


Costs and estimated earnings in excess of billings

179,474


185,960


Inventory, net

8,527


8,575


Prepaid expenses and other current assets

26,753


26,854


Income tax receivable

5,446


9,803


Project development costs

14,573


15,839


Total current assets

485,779


490,715


Federal ESPC receivable

459,347


396,725


Property and equipment, net

8,804


8,982


Energy assets, net

765,122


729,378


Goodwill

58,812


58,714


Intangible assets, net

847


927


Operating lease assets

41,484


39,151


Restricted cash, non-current portion

10,507


10,352


Other assets

18,047


15,307


Total assets

$

1,848,749


$

1,750,251


LIABILITIES, REDEEMABLE NON-CONTROLLING INTERESTS AND STOCKHOLDERS' EQUITY

Current liabilities:


Current portion of long-term debt and financing lease liabilities

$

71,770


$

69,362


Accounts payable

202,123


230,916


Accrued expenses and other current liabilities

40,297


41,748


Current portion of operating lease liabilities

5,680


6,106


Billings in excess of cost and estimated earnings

30,211


33,984


Income taxes payable

1,501


981


Total current liabilities

351,582


383,097


Long-term debt and financing lease liabilities, net of current portion and deferred financing fees

268,411


311,674


Federal ESPC liabilities

473,882


440,223


Deferred income taxes, net

4,474


2,363


Deferred grant income

8,167


8,271


Long-term portions of operating lease liabilities, net of current

37,718


35,300


Other liabilities

35,992


37,660


Redeemable non-controlling interests, net

39,668


38,850


Stockholders' equity:


Preferred stock, $0.0001 par value, 5,000,000 shares authorized, no shares issued and outstanding at March 31, 2021 and December 31, 2020

$


$


Class A common stock, $0.0001 par value, 500,000,000 shares authorized, 35,367,720 shares issued and 33,265,925 shares outstanding at March 31, 2021, 32,326,449 shares issued and 30,224,654 shares outstanding at December 31, 2020

3


3


Class B common stock, $0.0001 par value, 144,000,000 shares authorized, 18,000,000 shares issued and outstanding at March 31, 2021 and December 31, 2020

2


2


Additional paid-in capital

267,864


145,496


Retained earnings

379,533


368,390


Accumulated other comprehensive loss, net

(6,759

)


(9,290

)

Treasury stock, at cost, 2,101,795 shares at March 31, 2021 and December 31, 2020

(11,788

)


(11,788

)

Total stockholders’ equity

628,855


492,813


Total liabilities, redeemable non-controlling interests and stockholders' equity

$

1,848,749


$

1,750,251


AMERESCO, INC.

CONDENSED CONSOLIDATED STATEMENTS OF INCOME

(In thousands, except per share amounts) (Unaudited)


Three Months Ended March 31,


2021


2020

Revenues

$

252,202


$

212,413


Cost of revenues

205,293


173,967


Gross profit

46,909


38,446


Selling, general and administrative expenses

28,601


28,924


Operating income

18,308


9,522


Other expenses, net

3,672


5,389


Income before income taxes

14,636


4,133


Income tax provision (benefit)

2,205


(2,503

)

Net income

12,431


6,636


Net income attributable to redeemable non-controlling interests

(1,257

)


(435

)

Net income attributable to common shareholders

$

11,174


$

6,201


Net income per share attributable to common shareholders:


Basic

$

0.23


$

0.13


Diluted

$

0.22


$

0.13


Weighted average common shares outstanding:


Basic

48,975


47,384


Diluted

50,357


48,497


AMERESCO, INC.

CONDENSED CONSOLIDATED STATEMENTS OF CASH FLOWS

(In thousands) (Unaudited)


Three Months Ended March 31,


2021


2020

Cash flows from operating activities:


Net income

$

12,431


$

6,636


Adjustments to reconcile net income to cash flows from operating activities:


Depreciation of energy assets, net

9,686


9,299


Depreciation of property and equipment

833


833


Accretion of ARO liabilities

24


21


Amortization of debt discount and debt issuance costs

747


660


Amortization of intangible assets

80


179


Provision for bad debts

3


49


Net gain from derivatives

(377

)


(223

)

Stock-based compensation expense

766


429


Deferred income taxes

1,410


(1,217

)

Unrealized foreign exchange loss

19


212


Changes in operating assets and liabilities:


Accounts receivable

15,535


(14,161

)

Accounts receivable retainage

(1,844

)


(4,445

)

Federal ESPC receivable

(65,973

)


(39,946

)

Inventory, net

48


7


Costs and estimated earnings in excess of billings

6,544


12,181


Prepaid expenses and other current assets

(726

)


1,233


Project development costs

1,259


(3,224

)

Other assets

(538

)


8


Accounts payable, accrued expenses and other current liabilities

(19,333

)


(17,241

)

Billings in excess of cost and estimated earnings

(3,973

)


(956

)

Other liabilities

(226

)


(586

)

Income taxes payable

4,881


(1,388

)

Cash flows from operating activities

(38,724

)


(51,640

)

Cash flows from investing activities:


Purchases of property and equipment

(656

)


(724

)

Purchases of energy assets

(55,823

)


(28,497

)

Contributions to equity investment


(127

)

Cash flows from investing activities

(56,479

)


(29,348

)

Cash flows from financing activities:


Proceeds from equity offering, net of offering costs

120,216


Payments of financing fees

(850

)


(155

)

Proceeds from exercises of options and ESPP

1,386


2,473


Repurchase of common stock


(6

)

(Payments on) proceeds from senior secured credit facility, net

(53,073

)


31,000


Proceeds from long-term debt financings

30,811


Proceeds from Federal ESPC projects

33,520


61,198


Proceeds for energy assets from Federal ESPC

(59

)


1,541


Distributions to redeemable non-controlling interests, net

(495

)


(103

)

Payments on long-term debt

(19,073

)


(12,019

)

Cash flows from financing activities

112,383


83,929


Effect of exchange rate changes on cash

330


(509

)

Net increase in cash, cash equivalents, and restricted cash

17,510


2,432


Cash, cash equivalents, and restricted cash, beginning of period

98,837


77,264


Cash, cash equivalents, and restricted cash, end of period

$

116,347


$

79,696


Non-GAAP Financial Measures (In thousands) (Unaudited)


Three Months Ended March 31, 2021

Adjusted EBITDA:

Projects

Energy
Assets

O&M

Other

Consolidated

Net income attributable to common shareholders

$

4,426


$

5,910


$

617


$

221


$

11,174


Impact from redeemable non-controlling interests


1,257


1,257


Plus: Income tax provision

1,119


981


82


23


2,205


Plus: Other expenses, net

1,193


2,068


177


235


3,673


Plus: Depreciation and amortization

1,012


8,405


828


354


10,599


Plus: Stock-based compensation

554


98


57


58


767


Plus: Restructuring and other charges

20


5


22


2


49


Adjusted EBITDA

$

8,324


$

18,724


$

1,783


$

893


$

29,724


Adjusted EBITDA margin

4.6

%

56.3

%

9.6

%

4.5

%

11.8

%


Three Months Ended March 31, 2020

Adjusted EBITDA:

Projects

Energy
Assets

O&M

Other

Consolidated

Net (loss) income attributable to common shareholders

$

(669)


$

4,329


$

1,211


$

1,330


$

6,201


Impact from redeemable non-controlling interests


435


435


Less: Income tax benefit

(904)


(951)


(296)


(352)


(2,503)


Plus: Other expenses, net

1,430


3,283


663


13


5,389


Plus: Depreciation and amortization

842


8,344


753


372


10,311


Plus: Stock-based compensation

293


55


37


44


429


Plus: Restructuring and other charges

712


19


59


186


976


Adjusted EBITDA

$

1,704


$

15,514


$

2,427


$

1,593


$

21,238


Adjusted EBITDA margin

1.2

%

55.0

%

13.4

%

7.3

%

10.0

%


Three Months Ended March 31,


2021

2020

Non-GAAP net income and EPS:


Net income attributable to common shareholders

$

11,174


$

6,201


Adjustment for accretion of tax equity financing fees

(31

)


Impact from redeemable non-controlling interests

1,257


435


Plus: Restructuring and other charges

48


976


Less: Income tax effect of Non-GAAP adjustments

(12

)

(212

)

Non-GAAP net income

$

12,436


$

7,400


Diluted net income per common share

$

0.22


$

0.13


Effect of adjustments to net income

0.03


0.02


Non-GAAP EPS

$

0.25


$

0.15


Adjusted cash from operations:


Cash flows from operating activities

$

(38,724

)

$

(51,640

)

Plus: proceeds from Federal ESPC projects

33,520


61,198


Adjusted cash from operations

$

(5,204

)

$

9,558


Three Months Ended March 31,


2021

2020

New contracts and awards:


New contracts

$

73,000


$

86,000


New awards (1)

$

275,000


$

55,000


(1) Represents estimated future revenues from projects that have been awarded, though the contracts have not yet been signed

Non-GAAP Financial Guidance

Adjusted earnings before interest, taxes, depreciation and amortization (adjusted EBITDA):

Year Ended December 31, 2021


Low

High

Operating income(1)

$89 million

$97 million

Depreciation and amortization

$47 million

$48 million

Stock-based compensation

$4 million

$5 million

Adjusted EBITDA

$140 million

$150 million

(1) Although net income is the most directly comparable GAAP measure, this table reconciles adjusted EBITDA to operating income because we are not able to calculate forward-looking net income without unreasonable efforts due to significant uncertainties with respect to the impact of accounting for our redeemable non-controlling interests and taxes.

Exhibit A: Non-GAAP Financial Measures

We use the Non-GAAP financial measures defined and discussed below to provide investors and others with useful supplemental information to our financial results prepared in accordance with GAAP. These Non-GAAP financial measures should not be considered as an alternative to any measure of financial performance calculated and presented in accordance with GAAP. For a reconciliation of these Non-GAAP measures to the most directly comparable financial measures prepared in accordance with GAAP, please see Other Non-GAAP Disclosure and Non-GAAP Financial Guidance in the tables above.

We understand that, although measures similar to these Non-GAAP financial measures are frequently used by investors and securities analysts in their evaluation of companies, they have limitations as analytical tools, and investors should not consider them in isolation or as a substitute for the most directly comparable GAAP financial measures or an analysis of our results of operations as reported under GAAP.


Contacts

Media Relations
Leila Dillon, 508.661.2264, This email address is being protected from spambots. You need JavaScript enabled to view it.

Investor Relations
Eric Prouty, AdvisIRy Partners, 212.750.5800, This email address is being protected from spambots. You need JavaScript enabled to view it.

Lynn Morgen, AdvisIRy Partners, 212.750.5800, This email address is being protected from spambots. You need JavaScript enabled to view it.


Read full story here

CALGARY, Alberta--(BUSINESS WIRE)--Canadian clean energy company Proton Technologies Canada is announcing a crowdfunding campaign that accelerates the launch of its potentially revolutionary clean hydrogen business while providing a way for everyday people to invest early in its business.


The crowdfunding campaign, called “Clear Hydrogen; Clear Conscience,” sees Proton Technologies Canada partnering with environmentally focused crowdfunding platform, Wayblaze, to help raise $500,000 in two rounds. Funds will be used to obtain hydrogen tube-trailers for storage and transportation and to construct a loading terminal at Proton’s site near Kerrobert, Saskatchewan.

“People are hungry for solutions to serious problems like air pollution,” says Grant Strem, Chair and CEO of Proton Technologies Canada. “For years, our fans have told us they want to help us grow and proliferate our technology in any way possible, but fundraising regulations limit private investing opportunities to accredited investors. This crowdfunding exemption provides a path for non-accredited regular Canadians to buy private shares in a company they feel passionate about.”

Hydrogen is already a big industry but if created using carbon-negative methods, the resulting “clear hydrogen” is expected to be a popular product as its use helps companies accelerate down the path to net zero or lower. Proton Technologies Canada has use of patents and IP within Canada and 10 countries in the European North Sea region, and it plans to make clear hydrogen at low cost and large scale from many sites. Roughly twenty-five countries have created national hydrogen strategies as a means of decarbonizing their economies, and more still have made international commitments for net reductions in carbon emissions.

The main process of Proton Technologies Canada involves injecting large quantities of oxygen and CO2 into late stage or abandoned oil fields where chemical reactions liberate hydrogen. A downhole hydrogen filter can allow only hydrogen to come in, leaving carbon trapped underground.

The first campaign for $250,000 opened May 3rd and will stay open 45 days unless full earlier. The second campaign, also for $250,000, is expected to rapidly follow the first and stay open 45 days unless the target is reached earlier.

To learn more, visit Proton’s crowdfunding webpage at https://wayblaze.com/proton

Proton’s Chair & CEO Grant Strem is available for media interviews.


Contacts

Investment opportunities:
Clean Energy Finance Support
+1 403 464 0418
This email address is being protected from spambots. You need JavaScript enabled to view it.

Media Inquiries:
External Relations
+1 403 467 1220
This email address is being protected from spambots. You need JavaScript enabled to view it.

Julie Goulder
This email address is being protected from spambots. You need JavaScript enabled to view it.
+1 403 467 1220

DALLAS--(BUSINESS WIRE)--Pioneer Natural Resources Company (NYSE:PXD) (“Pioneer” or “The Company”) today announced that it has completed its previously announced acquisition of the leasehold interests and related assets of DoublePoint Energy in the Midland Basin, adding approximately 97,000 high-return, highly contiguous net acres in the core of the Midland Basin.


As previously announced, at the closing, the Company paid the seller total consideration of $6.2 billion, including $1.0 billion in cash, issuing 27.2 million shares of Pioneer common stock and assuming $890 million of debt.

Pioneer is a large independent oil and gas exploration and production company, headquartered in Dallas, Texas, with operations in the United States. For more information, visit Pioneer’s website at www.pxd.com.

Cautionary Statement Regarding Forward-Looking Information

Except for historical information contained herein, the statements in this news release are forward-looking statements that are made pursuant to the Safe Harbor Provisions of the Private Securities Litigation Reform Act of 1995. Forward-looking statements and the business prospects of Pioneer are subject to a number of risks and uncertainties that may cause Pioneer’s actual results in future periods to differ materially from the forward-looking statements. These risks and uncertainties include, among other things, volatility of commodity prices; product supply and demand; the impact of a widespread outbreak of an illness, such as the COVID-19 pandemic, on global and U.S. economic activity; competition; the ability to obtain environmental and other permits and the timing thereof; the effect of future regulatory or legislative actions on Pioneer or the industry in which it operates, including the risk of new restrictions with respect to development activities; the ability to obtain approvals from third parties and negotiate agreements with third parties on mutually acceptable terms; potential liability resulting from pending or future litigation; the costs and results of drilling and operations; availability of equipment, services, resources and personnel required to perform the Company's drilling and operating activities; access to and availability of transportation, processing, fractionation, refining, storage and export facilities; Pioneer's ability to replace reserves, implement its business plans or complete its development activities as scheduled; the risk that the Company will not be able to successfully integrate the business of Double Eagle III Midco 1 LLC or fully or timely realize the expected synergies and accretion metrics from the Parsley Energy, Inc. and Double Eagle III Midco 1 LLC acquisitions; access to and cost of capital; the financial strength of counterparties to Pioneer's credit facility, investment instruments and derivative contracts and purchasers of Pioneer's oil, natural gas liquids and gas production; uncertainties about estimates of reserves, identification of drilling locations and the ability to add proved reserves in the future; the assumptions underlying forecasts, including forecasts of production, cash flow, well costs, capital expenditures, rates of return, expenses and cash flow from purchases and sales of oil and gas, net of firm transportation commitments; sources of funding; tax rates; quality of technical data; environmental and weather risks, including the possible impacts of climate change; cybersecurity risks; the risks associated with the ownership and operation of the Company's water services business and acts of war or terrorism. These and other risks are described in Pioneer's Annual Report on Form 10-K for the year ended December 31, 2020, and other filings with the United States Securities and Exchange Commission. In addition, the Company may be subject to currently unforeseen risks that may have a materially adverse effect on it. Accordingly, no assurances can be given that the actual events and results will not be materially different than the anticipated results described in the forward-looking statements. Pioneer undertakes no duty to publicly update these statements except as required by law.


Contacts

Pioneer Natural Resources Company Contacts:

Investors
Neal Shah - 972-969-3900
Tom Fitter - 972-969-1821
Michael McNamara - 972-969-3592
Greg Wright – 972-969-1770

Media and Public Affairs
Tadd Owens - 972-969-5760

Offshore Source Logo

Offshore Source keeps you updated with relevant information concerning the Offshore Energy Sector.

Any views or opinions represented on this website belong solely to the author and do not represent those of the people, institutions or organizations that Offshore Source or collaborators may or may not have been associated with in a professional or personal capacity, unless explicitly stated.

Corporate Offices

Technology Systems Corporation
8502 SW Kansas Ave
Stuart, FL 34997

info@tscpublishing.com