Business Wire News

COLLIERVILLE, Tenn.--(BUSINESS WIRE)--Mueller Industries, Inc. (NYSE: MLI) announced today that its Board of Directors has declared a regular quarterly cash dividend on its common stock of 25 cents per share. The dividend will be payable September 16, 2022 to shareholders of record on September 2, 2022.


Mueller Industries, Inc. (NYSE: MLI) is an industrial corporation whose holdings manufacture vital goods for important markets such as air, water, oil and gas distribution; climate comfort; food preservation; energy transmission; medical; aerospace; and automotive. It includes a network of companies and brands throughout North America, Europe, Asia, and the Middle East.

Statements in this release that are not strictly historical may be "forward-looking" statements, which involve risks and uncertainties. These include economic and currency conditions, continued availability of raw materials and energy, market demand, pricing, competitive and technological factors, and the availability of financing, among others, as set forth in the Company's SEC filings. The words "outlook," "estimate," "project," "intend," "expect," "believe," "target," "encourage," "anticipate," "appear," and similar expressions are intended to identify forward-looking statements. The reader should not place undue reliance on forward-looking statements, which speak only as of the date of this report. The Company has no obligation to publicly update or revise any forward-looking statements to reflect events after the date of this report.


Contacts

Jeffrey A. Martin
(901)753-3226

PARIS--(BUSINESS WIRE)--Technip Energies N.V. ("Technip Energies") (Paris:TE) (ISIN: NL0014559478) announces that on 28 July 2022, it published its Half-Year Financial Report for the six months ended 30 June 2022.

The Half-Year Financial Report includes condensed consolidated financial statements (prepared in accordance with IAS 34), an interim management report and a statement of the persons responsible for the Half-Year Financial Report.

A copy of the Half-Year Financial Report can be found on Technip Energies’ website (https://investors.technipenergies.com/financial-information/results-center) and is, or will shortly be, available for inspection at https://www.info-financiere.fr and at https://www.afm.nl/en/professionals/registers.

About Technip Energies
Technip Energies is a leading Engineering & Technology company for the Energy Transition, with leadership positions in LNG, hydrogen and ethylene as well as growing market positions in blue and green hydrogen, sustainable chemistry and CO2 management. The Company benefits from its robust project delivery model supported by an extensive technology, products and services offering.

Operating in 34 countries, our 15,000 people are fully committed to bringing our clients’ innovative projects to life, breaking boundaries to accelerate the energy transition for a better tomorrow.

Technip Energies shares are listed on Euronext Paris. In addition, Technip Energies has a Level 1 sponsored American Depositary Receipts (“ADR”) program, with its ADRs trading over-the-counter.

For further information: www.technipenergies.com.


Contacts

Investor Relations
Phillip Lindsay
Vice President, Investor Relations
+44 20 3429 3929
This email address is being protected from spambots. You need JavaScript enabled to view it.

Media Relations
Stella Fumey
Director Press Relations & Digital Communications
+33 1 85 67 40 95
This email address is being protected from spambots. You need JavaScript enabled to view it.

ST. JOHN’S, Newfoundland and Labrador--(BUSINESS WIRE)--$ARR.TO #energystorage--Altius Renewable Royalties Corporation (“ARR”) (ARR:TSX, ATRWF: OTCQX) is pleased to announce that its jointly controlled subsidiary, Great Bay Renewables LLC (“Great Bay”), has entered into a transaction with U.S. renewable energy developer, Hodson Energy, LLC (“Hodson”), to gain future royalties related to Hodson’s portfolio of solar plus battery storage development projects. Great Bay is jointly controlled by ARR and certain funds managed by affiliates of Apollo Global Management, Inc.


New York-based Hodson is committing its entire portfolio of solar plus storage projects located primarily in the Mid-Atlantic region of the U.S. and any additional projects added in the future to this new royalty investment structure with Great Bay. Great Bay will receive a royalty on all projects developed and vended by Hodson until a minimum total return threshold is achieved. The targeted IRR threshold is consistent with the upper part of Great Bay’s previously disclosed 8-12% base hurdle rate range before factoring in potential longer-term option value realizations.

Transaction Terms

The US$40 million royalty investment into Hodson will be invested in tranches over approximately the next three years as Hodson achieves certain project advancement milestones, with an initial investment upon closing of US$14 million. Approximately US$9.8 million of the initial investment will be used to retire an existing development loan facility and acquire new projects, resulting in a 1.8 GWac total portfolio post-Great Bay investment.

As individual pipeline projects are developed, Great Bay will receive a 3% gross revenue royalty on each project. This will continue until a target minimum total royalty portfolio valuation threshold is achieved. Once created, individual royalties will apply during the full life of the respective projects. In addition to royalties, Great Bay has the option to receive a portion of the proceeds from project sales. Any cash Great Bay elects to receive under this option would count toward the target return. Great Bay also has the option to invest an additional $20 million as royalty financing in the future.

As part of the transaction, Great Bay also received warrants to purchase a minority interest in the common equity of Hodson.

Commenting on the new partnership with Hodson, Frank Getman, CEO of Great Bay, said “We are thrilled to add another high-quality developer to our developer royalty program. This is another example of Great Bay’s flexible, partner-like capital supporting a quality project developer as the broader renewables sector navigates the current challenges of interconnection delays, inflation, higher interest rates and supply chain issues. These challenges are creating a significant opportunity for our patient, long-term investment offering,” Getman added. “It’s ‘go-time’ right now for Great Bay.”

RS Gill, Founder and CEO of Hodson, added “We are excited to team up with Great Bay to help us build out our existing pipeline of high-quality projects and enter a new phase of growth. In addition to pursuing previously identified and new opportunities in the PJM and MISO territories, we now have the bandwidth and financial resources to explore new opportunities and relationships in Texas and the greater Southwest region. Great Bay’s financing structure makes us goal aligned and provides Hodson with the financial flexibility we need to pursue our strategic objectives.“

Great Bay was advised on this transaction by an advisory team from CCA Capital LLC led by Martin Pasqualini and a legal team at Pierce Atwood LLP led by Kris Eimicke. Hodson Energy was advised on this transaction by an advisory team from Verdonck Partners led by Patrick Verdonck and a legal team at Willcox Savage led by Brian Purcell and a legal team at Nelson Mullins led by Prem Malali.

About ARR

ARR is a recently formed renewable energy company whose business is to provide long-term, royalty level investment capital to renewable power developers, operators, and originators. ARR has 16 renewable energy royalties representing 3,510 MW of renewable power, diversified by wind, solar, stage of development or operations and regional power pool in the U.S. The Corporation combines industry expertise with innovative, partner-focused solutions to further the growth of the renewable energy sector as it fulfills its critical role in enabling the global energy transition.

Forward-looking information

This news release contains forward-looking information. The statements are based on reasonable assumptions and expectations of management and ARR provides no assurance that actual events will meet management's expectations. In certain cases, forward-looking information may be identified by such terms as "anticipates," "believes," "could," "estimates," "expects," "may," "shall," "will," or "would". Although ARR believes the expectations expressed in such forward-looking statements are based on reasonable assumptions, such statements are not guarantees of future performance and actual results or developments may differ materially from those projected. Readers should not place undue reliance on forward-looking information. ARR does not undertake to update any forward-looking information contained herein except in accordance with securities regulation.


Contacts

For further information:

Flora Wood, Corporate Secretary
Email: This email address is being protected from spambots. You need JavaScript enabled to view it.
Tel: 1.877.576.2209
Direct: +1(416)346.9020

Ben Lewis, CFO
Email: This email address is being protected from spambots. You need JavaScript enabled to view it.
Tel: 1.877.576.2209

MIAMI--(BUSINESS WIRE)--World Fuel Services Corporation (NYSE: INT)


Second-Quarter 2022 Highlights

  • Total gross profit of $253.4 million, up 38% year-over-year
  • GAAP net income of $24.4 million, or $0.39 per diluted share
  • Adjusted net income of $25.8 million, or $0.41 per diluted share
  • Adjusted EBITDA of $76.4 million

“We generated solid results in the second quarter, demonstrating the strength and diversification of our business model, despite significant volatility experienced in the global energy markets. While we were impacted by severe backwardation throughout most of the quarter in aviation, our marine segment delivered record gross profit driven by market volatility that led to exceptionally high bunker fuel prices and a constrained credit environment. Our land segment also performed very well, reflecting the success of our Flyers acquisition and overall strong performance across our entire land business, including World Kinect,” stated Michael J. Kasbar, chairman and chief executive officer. “Our highly-talented global team once again demonstrated our ability to navigate an exceedingly complex macro environment, while remaining a valued partner to our customers and suppliers with a growing suite of renewable and digital solutions in support of their decarbonization journey.”

For the second quarter, our aviation segment generated gross profit of $52.8 million, a decrease of 40% year-over-year. While aviation's financial results were significantly impacted by backwardation during the second quarter, volumes continued to rebound, reaching 85% of pre-pandemic levels. Our marine segment generated gross profit of $78.2 million, an increase of 244% year-over-year, principally related to the impact of market volatility and the related rise in global fuel prices. Our land segment generated gross profit of $122.4 million, an increase of 66% year-over-year, principally related to the recent acquisition of Flyers Energy.

“We generated our highest level of quarterly EBITDA since the pandemic began, despite the negative pricing impacts to our aviation business during the second quarter from extreme backwardation, again demonstrating the resiliency of our business and the value of our diversified portfolio of products and service offerings,” said Ira M. Birns, executive vice president and chief financial officer. “While fuel prices and volumes increased further during the second quarter, we generated positive operating cash flow and our liquidity position remains strong. This enables us to continue allocating capital to fund organic and value-creating investments which underpins our strategic vision to support our customers and suppliers in accelerating the energy transition, while we also continue to return capital to shareholders through buybacks and dividends.”

Non-GAAP Financial Measures

This press release contains non-GAAP financial measures (collectively, the “Non-GAAP Measures”), including adjusted net income attributable to World Fuel Services, adjusted diluted earnings per common share, and adjusted earnings before interest, taxes, depreciation and amortization (“EBITDA”). The Non-GAAP Measures exclude acquisition and divestiture related expenses, restructuring costs, impairments, gains or losses on the extinguishment of debt and gains or losses on business dispositions primarily because we do not believe they are reflective of our core operating results. In addition, beginning with the period ending March 31, 2022, the Non-GAAP Measures also exclude integration costs associated with our acquisitions. No changes to the comparable period were made as we did not incur integration costs in 2021.

We believe that the Non-GAAP Measures, when considered in conjunction with our financial information prepared in accordance with GAAP, are useful to investors to further aid in evaluating the ongoing financial performance of the Company and to provide greater transparency as supplemental information to our GAAP results.

Non-GAAP financial measures should not be considered in isolation from, or as a substitute for, financial information prepared in accordance with GAAP. In addition, our presentation of the Non-GAAP Measures may not be comparable to the presentation of such metrics by other companies. Adjusted diluted earnings per common share is computed by dividing adjusted net income attributable to World Fuel Services and available to common shareholders by the sum of the weighted average number of shares of common stock, stock units, restricted stock entitled to dividends not subject to forfeiture and vested restricted stock units outstanding during the period and the number of additional shares of common stock that would have been outstanding if our outstanding potentially dilutive securities had been issued. Investors are encouraged to review the reconciliation of these Non-GAAP Measures to their most directly comparable GAAP financial measures in this press release and on our website.

Information Relating to Forward-Looking Statements

This release includes forward-looking statements within the meaning of the Private Securities Litigation Reform Act of 1995, including statements regarding our beliefs and expectations about our ability to navigate a complex macro environment and capitalize on our suite of renewable and digital solutions to support our customers' decarbonization journey, as well as our view of our capital allocation strategy to fund organic and value-creating investments and return capital to shareholders. These forward-looking statements are qualified in their entirety by cautionary statements and risk factor disclosures contained in the Company’s Securities and Exchange Commission (“SEC”) filings, including the Company’s most recent Annual Report on Form 10-K filed with the SEC. Actual results may differ materially from any forward-looking statements due to risks and uncertainties, including, but not limited to: our ability to successfully implement our growth strategy and integrate acquired businesses and recognize the anticipated benefits, our ability to capitalize on new market opportunities, potential liabilities, limited indemnities and the extent of any insurance coverage, our ability to effectively manage the effects of the COVID-19 pandemic, the extent of the impact of the pandemic on ours and our customers' sales, profitability, operations and supply chains, customer and counterparty creditworthiness and our ability to collect accounts receivable and settle derivative contracts, sudden changes in the market price of fuel or extremely high or low fuel prices that continue for an extended period of time, the availability of cash and sufficient liquidity to fund our working capital and strategic investment needs, any global economic impacts or other significant volatility that may arise from geopolitical events, wars and other civil unrest, adverse conditions in the markets or industries in which we or our customers and suppliers operate, such as the current global economic environment, our ability to manage the changes in supply and other market dynamics in the regions where we operate, inflationary pressures and its impact on our customers or the global economy, a structural shift in the global economy and its demand for fuel and related products and services as a result of changes in the way people work, travel and interact, or in connection with a global recession, our failure to comply with restrictions and covenants in our senior revolving credit facility and our senior term loans, including our financial covenants, our ability to successfully execute and achieve efficiencies, our ability to achieve the expected level of benefit from any restructuring activities and cost reduction initiatives, unanticipated tax liabilities or adverse results of tax audits, assessments, or disputes, our ability to capitalize on new market opportunities, risks related to the complexity of the U.S. and foreign tax legislation and any subsequently issued regulations and our ability to accurately predict the impact on our effective tax rate and future earnings, our ability to effectively leverage technology and operating systems and realize the anticipated benefits, potential liabilities and the extent of any insurance coverage, actions that may be taken under the current administration in the U.S. that increase costs or otherwise negatively impact ours or our customers and suppliers businesses, the outcome of pending litigation and other proceedings, the impact of quarterly fluctuations in results, particularly as a result of seasonality, supply disruptions, border closures and other logistical difficulties that can arise when sourcing and delivering fuel in areas that are actively engaged in war or other military conflicts, our failure to effectively hedge certain financial risks associated with the use of derivatives, uninsured losses, the impact of climate change and natural disasters, adverse results in legal disputes, and other risks detailed from time to time in our SEC filings. New risks emerge from time to time and it is not possible for management to predict all such risk factors or to assess the impact of such risks on our business. Accordingly, we undertake no obligation to publicly update or revise any forward-looking statements, whether as a result of new information, changes in expectations, future events, or otherwise, except as required by law.

About World Fuel Services Corporation

Headquartered in Miami, Florida, World Fuel Services is a global energy management company involved in providing energy procurement and related services, as well as transaction and payment management solutions to commercial and industrial customers, principally in the aviation, marine and land transportation industries. World Fuel Services also offers natural gas and electricity, as well as energy advisory services, including programs for sustainability solutions and renewable energy alternatives. World Fuel Services sells fuel and delivers services to its clients at more than 8,000 locations in more than 200 countries and territories worldwide.

For more information, visit www.wfscorp.com.

-- Some amounts in this press release may not add due to rounding. All percentages have been calculated using unrounded amounts --


WORLD FUEL SERVICES CORPORATION
CONDENSED CONSOLIDATED BALANCE SHEETS
(Unaudited - In millions, except per share data)


June 30, 2022


December 31, 2021

Assets:


Current assets:


Cash and cash equivalents


$

385.8


$

652.2


Accounts receivable, net of allowance for credit losses of $19.1 million and $26.1 million as of June 30, 2022 and December 31, 2021, respectively


3,954.7


2,355.3


Inventories


903.8


477.9


Prepaid expenses


86.0


59.2


Short-term derivative assets, net


339.5


169.2


Other current assets


224.2


305.9


Total current assets


5,894.0


4,019.7


Property and equipment, net


476.0


348.9


Goodwill


1,233.3


861.9


Identifiable intangible assets, net


356.7


189.1


Other non-current assets


835.6


522.8


Total assets


$

8,795.7


$

5,942.4


Liabilities:


Current liabilities:


Current maturities of long-term debt


$

16.3


$

30.6


Accounts payable


3,936.7


2,399.6


Short-term derivative liabilities, net


431.5


168.4


Customer deposits


305.4


205.5


Accrued expenses and other current liabilities


404.7


292.7


Total current liabilities


5,094.7


3,096.7


Long-term debt


1,024.1


478.1


Non-current income tax liabilities, net


192.8


213.9


Other long-term liabilities


563.9


236.8


Total liabilities


6,875.4


4,025.6


Equity:


World Fuel shareholders' equity:


Preferred stock, $1.00 par value; 0.1 shares authorized, none issued


Common stock, $0.01 par value; 100.0 shares authorized, 61.9 and 61.7 issued and outstanding as of June 30, 2022 and December 31, 2021, respectively


0.6


0.6


Capital in excess of par value


172.8


168.1


Retained earnings


1,916.4


1,880.6


Accumulated other comprehensive income (loss)


(174.0

)


(136.7

)

Total World Fuel shareholders' equity


1,915.7


1,912.7


Noncontrolling interest


4.5


4.1


Total equity


1,920.2


1,916.8


Total liabilities and equity


$

8,795.7


$

5,942.4


WORLD FUEL SERVICES CORPORATION
CONDENSED CONSOLIDATED STATEMENTS OF INCOME AND COMPREHENSIVE INCOME
(Unaudited – In millions, except per share data)


For the Three Months

Ended June 30,


For the Six Months

Ended June 30,


2022


2021


2022


2021


Revenue


$

17,122.1


$

7,085.5


$

29,504.1


$

13,043.4


Cost of revenue


16,868.7


6,901.6


29,019.8


12,667.9


Gross profit


253.4


183.9


484.4


375.5


Operating expenses:


Compensation and employee benefits


118.3


87.9


233.2


180.3


General and administrative


82.3


57.4


157.1


116.8


Asset impairments


4.7


4.7


Restructuring charges


3.0


5.1


Total operating expenses


200.6


153.0


390.3


306.9


Income from operations


52.8


30.9


94.1


68.6


Non-operating income (expenses), net:


Interest expense and other financing costs, net


(26.5

)


(10.0

)


(40.9

)


(18.7

)

Other income (expense), net


(4.0

)


(1.4

)


1.7


(2.6

)

Total non-operating income (expense), net


(30.5

)


(11.4

)


(39.2

)


(21.3

)

Income (loss) before income taxes


22.3


19.6


54.9


47.2


Provision for income taxes


(2.5

)


2.0


3.8


10.8


Net income (loss) including noncontrolling interest


24.8


17.6


51.1


36.4


Net income (loss) attributable to noncontrolling interest


0.4


(0.1

)


0.4


(0.1

)

Net income (loss) attributable to World Fuel


$

24.4


$

17.6


$

50.7


$

36.5


Basic earnings (loss) per common share


$

0.39


$

0.28


$

0.81


$

0.58


Basic weighted average common shares


62.2


63.4


62.8


63.2


Diluted earnings (loss) per common share


$

0.39


$

0.28


$

0.80


$

0.57


Diluted weighted average common shares


62.4


63.8


63.2


63.6


Comprehensive income:


Net income (loss) including noncontrolling interest


$

24.8


$

17.6


$

51.1


$

36.4


Other comprehensive income (loss):


Foreign currency translation adjustments


(35.7

)


4.8


(45.1

)


0.8


Cash flow hedges, net of income tax expense (benefit) of $9.8 and ($2.9) for the three months ended June 30, 2022 and 2021, respectively, and net of income tax expense (benefit) of $2.8 and $2.7 for the six months ended June 30, 2022 and 2021, respectively


27.1


(8.6

)


7.8


7.8


Total other comprehensive income (loss)


(8.7

)


(3.8

)


(37.3

)


8.5


Comprehensive income (loss) including noncontrolling interest


16.1


13.7


13.7


44.9


Comprehensive income (loss) attributable to noncontrolling interest


0.4


(0.1

)


0.4


(0.1

)

Comprehensive income (loss) attributable to World Fuel


$

15.7


$

13.8


$

13.4


$

45.0


WORLD FUEL SERVICES CORPORATION
CONDENSED CONSOLIDATED STATEMENTS OF CASH FLOWS
(Unaudited - In millions)


For the Three Months

Ended June 30,


For the Six Months

Ended June 30,


2022


2021


2022


2021


Cash flows from operating activities:


Net income (loss) including noncontrolling interest


$

24.8


$

17.6


$

51.1


$

36.4


Adjustments to reconcile net income including noncontrolling interest to net cash provided by operating activities:


Depreciation and amortization


26.3


20.7


53.5


40.5


Provision for credit losses


2.6


(1.1

)


4.6


2.4


Share-based payment award compensation costs


3.1


3.3


6.7


12.0


Deferred income tax expense (benefit)


(11.6

)


(8.6

)


(15.6

)


(15.4

)

Foreign currency (gains) losses, net


(1.5

)


4.0


(5.2

)


(8.9

)

Other


(0.8

)


16.0


(17.6

)


10.5


Changes in assets and liabilities, net of acquisitions and divestitures:


Accounts receivable, net


(487.7

)


(161.9

)


(1,539.0

)


(600.7

)

Inventories


(242.4

)


(88.3

)


(383.0

)


(77.4

)

Prepaid expenses


(29.7

)


(21.3

)


(26.6

)


(24.3

)

Short-term derivative assets, net


(112.2

)


(37.7

)


(322.8

)


39.6


Other current assets


(23.6

)


(7.4

)


48.7


61.9


Cash collateral with counterparties


179.1


29.1


235.4


24.7


Other non-current assets


(55.0

)


(24.9

)


(163.9

)


(28.9

)

Accounts payable


506.9


211.6


1,503.5


605.9


Customer deposits


73.8


20.1


105.3


(2.7

)

Accrued expenses and other current liabilities


150.2


40.4


308.4


41.1


Non-current income tax, net and other long-term liabilities


40.7


25.6


127.3


23.8


Total adjustments


18.1


19.6


(80.2

)


104.2


Net cash provided by (used in) operating activities


42.8


37.2


(29.2

)


140.6


Cash flows from investing activities:


Acquisition of business, net of cash acquired


(639.4

)


Capital expenditures


(21.0

)


(12.2

)


(37.7

)


(14.2

)

Other investing activities, net


(0.1

)


(4.8

)


(1.4

)


(5.4

)

Net cash provided by (used in) investing activities


(21.2

)


(17.0

)


(678.5

)


(19.7

)

Cash flows from financing activities:


Borrowings of debt


2,027.1


0.1


3,772.9


0.3


Repayments of debt


(1,875.1

)


(4.4

)


(3,244.9

)


(8.9

)

Dividends paid on common stock


(7.6

)


(7.5

)


(15.0

)


(13.6

)

Repurchases of common stock


(35.0

)


(48.7

)


Other financing activities, net


(2.0

)


(3.1

)


(13.3

)


(13.5

)

Net cash provided by (used in) financing activities


107.3


(14.9

)


451.0


(35.7

)

Effect of exchange rate changes on cash and cash equivalents


(9.4

)


2.1


(9.7

)


(1.4

)

Net increase (decrease) in cash and cash equivalents


119.6


7.3


(266.4

)


83.9


Cash and cash equivalents, as of the beginning of the period


266.2


735.3


652.2


658.8


Cash and cash equivalents, as of the end of the period


$

385.8


$

742.7


$

385.8


$

742.7


WORLD FUEL SERVICES CORPORATION
RECONCILIATION OF GAAP TO NON-GAAP FINANCIAL MEASURES
(Unaudited - In millions, except per share data)


For the Three Months

Ended June 30,


For the Six Months

Ended June 30,

Non-GAAP financial measures and reconciliation:


2022


2021


2022


2021

Net income (loss) attributable to World Fuel


$

24.4


$

17.6


$

50.7


$

36.5


Acquisition and divestiture related expenses


0.1


0.5


0.6


2.9


Loss on debt extinguishment


0.7


0.7


Asset impairments


4.7


4.7


Integration costs


1.1


1.4


Restructuring charges


3.0


5.1


Income tax impacts


(0.5

)


(0.9

)


(0.7

)


(3.6

)

Adjusted net income (loss) attributable to World Fuel


$

25.8


$

25.0


$

52.6


$

45.7


Diluted earnings (loss) per common share


$

0.39


$

0.28


$

0.80


$

0.57


Acquisition and divestiture related expenses


0.01


0.01


0.05


Loss on debt extinguishment


0.01


0.01


Asset impairments


0.07


0.07


Integration costs


0.02


0.02


Restructuring charges


0.05


0.08


Income tax impacts


(0.01

)


(0.01

)


(0.01

)


(0.06

)

Adjusted diluted earnings (loss) per common share


$

0.41


$

0.39


$

0.83


$

0.72


For the Three Months

Ended June 30,


For the Six Months

Ended June 30,

Non-GAAP financial measures and reconciliation:


2022


2021


2022


2021

Net income (loss) including noncontrolling interest


$

24.8


$

17.6


$

51.1


$

36.4

Interest expense and other financing costs, net


26.5


10.0


40.9


18.7

Provision (benefit) for income taxes


(2.5

)


2.0


3.8


10.8

Depreciation and amortization


26.3


20.7


53.5


40.5

Acquisition and divestiture related expenses


0.1


0.5


0.6


2.9

Asset impairments


4.7


4.7

Integration costs


1.1


1.4


Restructuring charges


3.0


5.1

Adjusted EBITDA(1)


$

76.4


$

58.5


$

151.2


$

119.2

(1)

The Company defines adjusted EBITDA as net income (loss) excluding the impact of interest, tax and depreciation and amortization, in addition to items that are considered to be non-operational and not representative of our core business, including those associated with acquisition and divestiture related expenses, integration costs, asset impairments, and restructuring charges. As the GAAP measure most comparable to Adjusted EBITDA is net income, the reconciliation was updated in the first quarter of 2022 to start with net income.


WORLD FUEL SERVICES CORPORATION
BUSINESS SEGMENTS INFORMATION
(Unaudited - In millions)


For the Three Months

Ended June 30,


For the Six Month

Ended June 30,

Revenue:


2022


2021


2022


2021


Aviation segment


$

7,843.5


$

2,805.8


$

12,854.0


$

4,900.8


Land segment


5,431.8


2,457.2


9,812.6


4,645.4


Marine segment


3,846.8


1,822.4


6,837.5


3,497.1


Total revenue


$

17,122.1


$

7,085.5


$

29,504.1


$

13,043.4


Gross profit:


Aviation segment


$

52.8


$

87.4


$

117.0


$

164.1


Land segment


122.4


73.8


242.2


163.3


Marine segment


78.2


22.7


125.2


48.2


Total gross profit


$

253.4


$

183.9


$

484.4


$

375.5


Income from operations:


Aviation segment


$

(6.9

)


$

34.0


$

0.7


$

57.0


Land segment


33.0


8.1


66.3


40.9


Marine segment


52.7


4.8


75.9


11.1


Corporate overhead - unallocated


(26.0

)


(15.9

)


(48.8

)


(40.5

)

Total income from operations


$

52.8


$

30.9


$

94.1


$

68.6


SALES VOLUME SUPPLEMENTAL INFORMATION
(Unaudited - In millions)


For the Three Months

Ended June 30,


For the Six Months

Ended June 30,

Volume (Gallons):


2022


2021


2022


2021

Aviation Segment


1,831.2


1,373.8


3,486.6


2,517.1

Land Segment (1)


1,531.7


1,288.5


3,114.3


2,591.5

Marine Segment (2)


1,288.3


1,211.4


2,526.5


2,328.8

Consolidated Total


4,651.1


3,873.6


9,127.4


7,437.5

(1)

Includes gallons and gallon equivalents of British Thermal Units (BTU) for our natural gas sales and Kilowatt Hours (kWh) for our World Kinect power business.

(2)

Converted from metric tons to gallons at a rate of 264 gallons per metric ton. Marine segment metric tons were 4.9 and 4.6 for the three months ended June 30, 2022 and 2021, respectively; and 9.6 and 8.8 for the six months ended June 30, 2022 and 2021, respectively.


Contacts

World Fuel Services Corporation
Ira M Birns, 305-428-8000
Executive Vice President & Chief Financial Officer

Glenn Klevitz, 305-428-8000
Vice President, Treasurer & Investor Relations

CANONSBURG, Pa.--(BUSINESS WIRE)--Equitrans Midstream Corporation (NYSE: ETRN) released its annual corporate sustainability report, which utilizes the Global Reporting Initiative's (GRI) newest ‘Consolidated Set of the GRI Standards 2021’ and continues to follow the Sustainability Accounting Standards Board (SASB) Oil & Gas Midstream reporting standards. Reflected in the report's content are the results of our 2022 materiality assessment, which, for the first time, included engaging both internal and external stakeholders. The assessment also leveraged inputs from supplemental sources, including GRI, SASB, industry associations, agencies, and various sustainability frameworks to identify the Environmental, Social, and Governance (ESG) topics most significant to the Company’s business and stakeholders. The report can be viewed online: Equitrans' 2022 Corporate Sustainability Report.


With a vision to be one of North America’s premier midstream services companies, we recognize and appreciate that our stakeholders expect us to continue focusing on long-term sustainable performance by managing the relevant ESG factors that matter most,” said Diana M. Charletta, Equitrans’ president and chief operating officer. “We believe that our continued commitment to sustainability, including minimizing impacts to the environment and society, will serve to create long-term value for all stakeholders. Sustainability performance is about knowing we, as a Company, are doing the right thing for future generations – serving Americans’ current and increasing needs for reliable, clean-burning energy and supporting our national security and energy independence.”

Highlights of Equitrans Midstream’s 2022 Corporate Sustainability Report:

  • Expanding Sustainability Reporting: In addition to its 14 top-tier ESG material disclosures, Equitrans reports several ESG-related topics as parts of its sustainability framework, primarily due to their importance to the Company, including Diversity and Inclusion, Economic Impact, Energy Usage, Supply Chain Management and Human Rights, and Sustainability Governance.
  • Sustainability Governance: With oversight by the Chief Sustainability Officer, Equitrans has a management-level ESG committee and seven ESG working groups to help implement and manage the day-to-day efforts and actions related to the Company's most material ESG and sustainability topics. Equitrans’ Board of Directors and its relevant committees review key ESG policies and commitments.
  • Environmental Stewardship: As part of Equitrans' methane reduction initiative, a pneumatic controller conversion program was implemented in 2021. Using the Company's 2019 baseline emissions inventory, and once the new equipment is operational for one full year, the project is expected to result in an annualized reduction of approximately 1,200 metric tons of methane, which represents an estimated 12% decrease from the baseline year.
  • Strengthening Community Partnerships: In 2021, Equitrans invested more than $1,265,000 in roadway repairs/upgrades and, through its corporate giving program, donated $555,000 to support more than 65 community organizations. The Equitrans Midstream Foundation contributed $532,000 to 501(c)(3) organizations and an additional $382,000 in employee matching donations.
  • Supporting the Economy: In 2021, Equitrans contributed $913 million in value-added contributions to the U.S. Gross Domestic Product and, in addition to 766 regular, full-time employees, the Company's business activities supported 9,362 ancillary jobs during the year.
  • Safety and Environmental Leadership: Equitrans’ Zero Is Possible – Today platform is the manifestation of the Company's overriding belief that success is only realized when every contributor is safe and unharmed. The concept of Zero Is Possible also applies to Equitrans’ environmental efforts, such as minimizing methane releases, preventing spills, and ensuring regulatory compliance.
  • Workforce Culture: Equitrans encourages employee participation in community service initiatives and offers a 'Volunteer Paid-Time-Off' program to support engagement and volunteerism. The Company's formal recognition program, 'Spotlight,' provides an avenue for employees to recognize one another for going the extra mile and routinely demonstrating Equitrans' Core Values.
  • Diversity and Inclusion: During 2021, Equitrans' Inclusion Program offered several employee initiatives and learning opportunities designed to enhance the awareness, understanding, and importance of workplace inclusion. In addition, Equitrans’ Chairman and Chief Executive Officer, Thomas F. Karam, signed the Action for Diversity and Inclusion Coalition’s CEO Pledge, reiterating the organization's commitment to inclusiveness.

About Equitrans Midstream Corporation

Equitrans Midstream Corporation (ETRN) has a premier asset footprint in the Appalachian Basin and, as the parent company of EQM Midstream Partners, is one of the largest natural gas gatherers in the United States. Through its strategically located assets in the Marcellus and Utica regions, ETRN has an operational focus on gas transmission and storage systems, gas gathering systems, and water services that support natural gas development and production across the Basin. With a rich 135-year history in the energy industry, ETRN was launched as a standalone company in 2018 with the vision to be the premier midstream services provider in North America. ETRN is helping to meet America’s growing need for clean-burning energy, while also providing a rewarding workplace and enriching the communities where its employees live and work.

For more information on Equitrans Midstream Corporation, visit www.equitransmidstream.com; and to learn more about our environmental, social, and governance practices visit ETRN Sustainability Reporting.


Contacts

Analyst/Investor inquiries:
Nate Tetlow – Vice President, Corporate Development and Investor Relations
412-553-5834
This email address is being protected from spambots. You need JavaScript enabled to view it.

Media inquiries:
Natalie A. Cox – Communications and Corporate Affairs
412-395-3941
This email address is being protected from spambots. You need JavaScript enabled to view it.

HAMILTON, Bermuda--(BUSINESS WIRE)--Valaris Limited (NYSE: VAL) (“Valaris” or the “Company”) today issued a quarterly Fleet Status Report that provides the current status of the Company’s fleet of offshore drilling rigs along with certain contract information for these assets. The Fleet Status Report can be found on the “Investors” section of the Company’s website www.valaris.com.


About Valaris Limited

Valaris Limited (NYSE: VAL) is the industry leader in offshore drilling services across all water depths and geographies. Operating a high-quality rig fleet of ultra-deepwater drillships, versatile semisubmersibles and modern shallow-water jackups, Valaris has experience operating in nearly every major offshore basin. Valaris maintains an unwavering commitment to safety, operational excellence, and customer satisfaction, with a focus on technology and innovation. Valaris Limited is a Bermuda exempted company (Bermuda No. 56245). To learn more, visit our website at www.valaris.com.

Cautionary Statements

Statements contained in this press release that are not historical facts are forward-looking statements within the meaning of Section 27A of the Securities Act of 1933, as amended, and Section 21E of the Securities Exchange Act of 1934, as amended. Forward-looking statements include words or phrases such as "anticipate," "believe," "estimate," "expect," "intend," “likely,” "plan," "project," "could," "may," "might," “should,” “will” and similar words. The forward-looking statements contained in this press release are subject to numerous risks, uncertainties and assumptions that may cause actual results to vary materially from those indicated, including the COVID-19 outbreak and global pandemic and the related public health measures implemented by governments worldwide; the cancellation, suspension, renegotiation or termination of drilling contracts and programs, including drilling contracts which grant the customer termination rights if final investment decision (FID) is not received with respect to projects for which the drilling rig is contracted; oil and natural gas price volatility, customer demand for drilling rigs; downtime and other risks associated with offshore rig operations; severe weather or hurricanes; changes in worldwide rig supply, competition and technology; risks inherent to shipyard rig reactivation, upgrade, repair or maintenance; our ability to enter into, and the terms of, future drilling contracts; suitability of rigs for future contracts; governmental regulatory, legislative and permitting requirements affecting drilling operations; our ability to obtain financing, fund capital expenditures and pursue other business opportunities; the effects of our emergence from bankruptcy on the Company's business, relationships, comparability of our financial results and ability to access financing sources; actions taken by regulatory authorities or other third parties, including related to the COVID-19 global pandemic; increased scrutiny of Environmental, Social and Governance (“ESG”) practices and reporting responsibilities; changes in customer strategy; future levels of offshore drilling activity; governmental action, civil unrest and political and economic uncertainties; terrorism, piracy and military action; environmental or other liabilities, risks or losses; debt agreement restrictions that may limit our liquidity and flexibility; failure to satisfy our debt obligations; and cybersecurity risks and threats. In addition to the numerous factors described above, you should also carefully read and consider “Item 1A. Risk Factors” in Part I and “Item 7. Management’s Discussion and Analysis of Financial Condition and Results of Operations” in Part II of our most recent annual report on Form 10-K, which is available on the Securities and Exchange Commission’s website at www.sec.gov or on the Investor Relations section of our website at www.valaris.com. Each forward-looking statement speaks only as of the date of the particular statement and we undertake no obligation to update or revise any forward-looking statements, except as required by law.


Contacts

Investor & Media Contact:
Tim Richardson
Director - Investor Relations
+1-713-979-4619

Solar-and wind-powered streetlights help enhance public safety on school campuses

CHICAGO--(BUSINESS WIRE)--Washington Park and Bronzeville just got brighter as ComEd today announced that it has completed the installation of new renewable, off-grid streetlights at two Chicago Public Schools (CPS) on Chicago’s south side.

Our commitment to the communities we serve goes beyond delivering clean, reliable and affordable power to families and businesses. This partnership with Chicago Public Schools and local stakeholders is an example of our dedication to community collaboration to identify and execute solutions to local issues,” ComEd CEO Gil C. Quiniones. “In addition to public safety benefits, students will enjoy a new STEM curriculum designed around the new technology right outside their schools.”

Five streetlights were installed at Walter H. Dyett High School for the Arts in the Washington Park neighborhood, and two streetlights were installed at Perspectives Math and Science Academy Project in the Bronzeville neighborhood. Today, the off-grid lights were officially activated at Walter H. Dyett High School for the Arts in a ribbon-cutting ceremony with expected attendance by Quiniones, Dyett Principal Cortez McCoy, ARIS CEO Dan Connors and 4th Ward Alderman Sophia King.

Manufactured by ARIS Renewable Energy, these off-grid streetlights feature miniature power plants – called Remote Power Units or RPUs – that are not connected to the energy grid but draw energy from wind turbines, solar panels and battery storage, providing more dependable power to provide a safer passage to students and local residents alike. The renewable energy within the streetlights also creates battery storage that results in a self-powered internet connection, allowing students to connect to Wi-Fi as needed.

It has been gratifying to support this project. Public safety around Dyett High School will be improved by this project while providing a template for how we should use opportunities to increase environmental sustainability of our local communities,” said King. “This public/private partnership also provides an opportunity to enhance exposure of STEM-based learning opportunities to our local students. In essence, the project is lighting the way to future career opportunities for our children and providing sustainable infrastructure for our local community.”

Part of ComEd’s Community of the Future, ComEd worked in collaboration with Bronzeville community leaders to address the neighborhood’s needs for more sustainable and reliable smart-grid technology through renewable energy.

ComEd will work with the administrations at Dyett and Perspectives schools to develop a STEM curriculum based on the technology and operations of the streetlights. This will help teachers engage students on the subject of solar energy generation and demonstrate how off-grid solar and wind energy and battery systems can be used to power streetlights – with real-world examples accessible just outside the schools.

I am super excited to have the ARIS lights installed here at Dyett High School. All of our school stakeholders have wanted this for a very long time,” said McCoy. “This will make our campus grounds safe for all of our students, staff, parents and members of the community. This will also give our students the opportunity to explore careers in STEM. We are so appreciative of this opportunity. Thank you so much to everyone that made this possible.”

Through this new curriculum, students will learn about the auxiliary renewable power sources combining wind and solar energy that enables the streetlights to be operated and monitored remotely. With the streetlights right outside their classrooms, students will gain education and real-world examples of sustainable technology for their communities and their futures.

In 2019, ComEd partnered with CPS to pilot solar, wind and battery-powered lighting units at Beethoven Elementary School and Dunbar Vocational High School as part of its Bronzeville Community of the Future. Similar to the streetlights being installed at Dyett and Perspectives, these lighting units influence and inform STEM curricula at both schools, keep students and families safer, and contribute to the neighborhood's renewable energy goals.

Since 2016, ComEd has partnered with the Bronzeville neighborhood to create a greener, more connected and a more resilient community through innovative and renewable technologies. Through the STEM education programs for Bronzeville and Chicago-area high school students, students gain skillsets that prepare them for future careers in sustainable energy. ComEd announced in April that they are also expanding the Community of the Future to a second neighborhood in Rockford, Ill.

ComEd is a unit of Chicago-based Exelon Corporation (NASDAQ: EXC), a Fortune 200 energy company with approximately 10 million electricity and natural gas customers – the largest number of customers in the U.S. ComEd powers the lives of more than 4 million customers across northern Illinois, or 70 percent of the state’s population. For more information visit ComEd.com and connect with the company on Facebook, Twitter, Instagram and YouTube.


Contacts

ComEd Media Relations
312-394-3500

Complaint with U.S. International Trade Commission Seeks to Ban Import of Infringing SolarEdge Products

Similar Infringement Action in U.S. District Court Seeks Injunction and Substantial Monetary Damages

FORT COLLINS, Colo.--(BUSINESS WIRE)--Ampt LLC, the world’s leading provider of power optimizers for large-scale photovoltaic (“PV”) systems, today filed a complaint with the U.S. International Trade Commission (“ITC”) against SolarEdge Technologies, Inc. (NASDAQ: SEDG), requesting that the ITC ban the import of SolarEdge power systems and components that infringe Ampt’s patents. Ampt simultaneously filed a similar patent infringement action against SolarEdge in the U.S. District Court in Delaware that seeks a finding of patent infringement, substantial monetary damages and an injunction.


Colorado-based Ampt invented power optimizers that are used in large solar plants to lower the cost of energy production and improve performance in new systems; upgrade existing systems; enable low-cost solar energy storage systems; and improve operations and maintenance.

Ampt asserts that SolarEdge’s solar power systems unlawfully use Ampt’s optimizer technology and infringe one or more claims from eight of Ampt’s U.S. patents. These patents describe improved ways of converting electrical power from a solar energy source to make it available for use in a variety of applications.

Ampt’s complaint asks the ITC for an exclusion order banning from import into the United States those SolarEdge products that infringe Ampt’s patents. Ampt also seeks a ban on the sale of infringing products in the U.S. after they are imported. The infringing products include SolarEdge power optimizers for solar panels, inverters for solar power systems and solar power systems using both.

SolarEdge is based in Israel and its infringing products are manufactured in Israel, China, Vietnam and Hungary. If the ITC grants the relief sought by Ampt, it would not be possible for SolarEdge to continue selling those infringing products in the United States, however there are numerous other non-infringing companies selling alternative products that are currently available in the U.S. to meet both existing and future demand.

Ampt has dedicated tens of millions of dollars to the development of its power optimizers and related products at its facility in Fort Collins, Colorado, which is principally devoted to engineering and research and development activities. Its extensive investments in labor and capital have resulted in more than 60 issued patents, including 30 U.S. patents. Ampt has leveraged these innovative technologies to develop industry-leading products that are deployed around the world in mission-critical solar power plants.

“Ampt’s power optimizer technology is essential to the clean energy revolution and plays a fundamental role in lowering the costs of large-scale solar energy production,” said Levent Gun, Ampt’s Chief Executive Officer. “SolarEdge has sought to improve its own position in the PV market by unlawfully using our proprietary technology without asking our permission or compensating us. By bringing these actions to defend our intellectual property, we are standing up for our employees, customers and partners, as well as the principles of fair competition and rewarding innovation that are critical to the solar energy market as a whole.”

Mr. Gun continued, “This complaint seeks to block SolarEdge from continuing to profit wrongfully from Ampt’s patented inventions. We look forward to demonstrating to the ITC and the District Court that SolarEdge is violating our intellectual property and that the Commission should ban the import of the infringing SolarEdge products.”

In the ITC action, Ampt asserts that SolarEdge infringes one or more claims from U.S. Patents Nos. 9,673,630 and 11,289,917. In the U.S. District Court action, Ampt asserts that SolarEdge infringes one or more claims from the aforementioned U.S. Patents, as well as from U.S. Patents Nos. 7,605,498, 7,719,140, 10,608,437, 10,886,746, 11,070,062 and 11,070,063.

Ampt is represented by Scott Bornstein, Nick Brown, Vivian Kuo and Cyrus Frelinghuysen of Greenberg Traurig, LLP.

About Ampt

Ampt delivers innovative power conversion and communication technology that is used to lower the cost and improve performance of new PV systems, repower existing systems, and enable lower cost DC coupled storage. With installations and experience serving markets around the world, Ampt is the number-one power optimizer company for large-scale systems. The company is headquartered in Fort Collins, Colorado and has sales and support locations in North America, Europe, and Japan, as well as representation in Asia, Australia, and the Middle East. For more information, visit www.ampt.com and follow Ampt@LinkedIn.


Contacts

FGS Global
This email address is being protected from spambots. You need JavaScript enabled to view it.

From a $6.6 billion energy infrastructure investment to helping connect more than 650,000 customers to $450 million in energy assistance last year, highlights in the CSR cover hundreds of initiatives that have made a positive impact on the energy transmission and distribution company’s 10 million customers, the communities it serves and the environment.

CHICAGO--(BUSINESS WIRE)--$EXC--Exelon (Nasdaq: EXC) has released its 2021 Corporate Sustainability Report (CSR), a comprehensive overview of the company’s focus on clean, reliable, affordable and equitable energy delivery and energy solutions for its customers and communities. As the nation’s largest energy transmission and distribution company, Exelon continues to steward the clean energy transition and power the economic health and well-being of the large and diverse metropolitan areas that it serves.


“Exelon’s strategic investments in environmental, social and governance priorities are both the right thing to do and a clear competitive advantage for our company,” said Chris Crane, Exelon president and CEO. “Our unwavering commitment to safety, operational excellence, diversity, financial health, strong ethical standards and controls, and prudent, customer-focused investment in reliability continues to enhance the sustainable value Exelon delivers to all of its stakeholders. Exelon will continue to lead by example in the years ahead as the climate crisis, along with systemic inequity in our communities, further shape what is imperative to our business and challenge us to do even more in alignment with our core values.”

The 2021 Exelon CSR covers eight strategic focus areas:

Advancing clean energy and affordable energy choices

Exelon provides clean energy solutions and technologies to combat climate change, reduce local air pollution and power a healthy, sustainable, equitable future. In 2021, the company invested more than $6.6 billion in energy infrastructure, with an additional $29 billion planned for 2022–2025. These investments are critical to bringing more renewables online and enabling the electrification of the transportation sector.

Delivering world-class customer experiences

Exelon empowers customers by providing affordable services and by helping them take charge of their energy needs. Last year, customers at Exelon’s six local energy delivery companies saved 22.8 million MWh through energy efficiency programs – the equivalent energy use of more than one million homes for one year.

Safely powering reliability and resilience

Exelon is preparing the grid to adapt to changing conditions and withstand more extreme weather and disruptive events. In 2021, Exelon’s customers experienced strong electric service reliability as a result of the company's strategic investments in energy grid resiliency and modernization.

Supporting communities

Exelon helps power the economic health and well-being of the diverse communities it serves, and advocates for equity. Spending with diversity-certified suppliers reached $2.4 billion in 2021, accounting for 40 percent of Exelon’s sourced spending. Also last year, the company invested more than $14 million to support 65 workforce development programs across its six utilities, and more than 5,000 people in underserved communities participated in training for jobs in the energy industry.

Managing climate change risks and opportunities

Exelon is evolving energy systems to enable decarbonization and build resilience, while maintaining energy access and affordability. In August 2021, Exelon announced its Path to Clean commitment to reduce operations-driven emissions 50 percent by 2030 and achieve net-zero operations by 2050, while also supporting customers and communities in achieving their clean energy goals.

Environmental responsibility

Exelon works to reduce impacts to watersheds and biodiversity by improving processes to reduce company waste and emissions, and by being responsible stewards of the resources it uses. The company supports efforts to restore and maintain more than 13,000 acres of fragile ecosystems in rights-of-way and at company facilities across its service areas, and 60 Exelon locations or programs now have National Wildlife Federation habitat certifications.

A safe, innovative and rewarding workplace

Exelon’s culture – focused on safety, innovation and diversity – permeates all levels of the company and keeps employees engaged in meaningful and important work. Exelon was named among DiversityInc’s Top 50 Companies for Diversity in 2021.

Corporate governance

From the board of directors to the supply chain, Exelon drives sustainability through a careful understanding of risk and accountability, while providing resources to support employees and clear expectations for compliance with the company’s policies and values.

Progress continues

Additional highlights in each of these focus areas are included in the full report, and progress consistent with the company’s core values has continued into 2022. Exelon’s efforts to be a sustainability and ESG leader this year include:

  • In February, Exelon urged Congress to fund the Low-Income Home Energy Assistance Program (LIHEAP) at the highest level possible.
  • Exelon’s new $36 million Racial Equity Capital Fund began accepting applications from minority-owned businesses in May to help fuel growth and spur job opportunities in underserved and under-resourced communities.
  • In June, Exelon announced a new travel benefit to ensure employees and their dependents covered under Exelon’s medical plan have access to the health and well-being care they need, even if it’s not available near where they live.

The CSR presents information and data that reflects the current-day footprint of the Exelon transmission and distribution energy business in the 2021 calendar year, prior to Exelon’s February 2022 separation from its power generation business to an independent business, Constellation.

More information about Exelon's commitment to sustainability is available at exeloncorp.com/sustainability.

About Exelon

Exelon (Nasdaq: EXC) is a Fortune 200 company and the nation’s largest utility company, serving more than 10 million customers through six fully regulated transmission and distribution utilities — Atlantic City Electric (ACE), Baltimore Gas and Electric (BGE), Commonwealth Edison (ComEd), Delmarva Power & Light (DPL), PECO Energy Company (PECO), and Potomac Electric Power Company (Pepco). More than 18,000 Exelon employees dedicate their time and expertise to supporting our communities through reliable, affordable and efficient energy delivery, workforce development, equity, economic development and volunteerism. Follow Exelon on Twitter @Exelon.


Contacts

Nick Alexopulos
Corporate Communications
This email address is being protected from spambots. You need JavaScript enabled to view it.


The first facility in Japan to receive the highest level of BELS, CASBEE Wellness Office and WELL Building Standard certifications

TOKYO--(BUSINESS WIRE)--Mitsubishi Electric Corporation (TOKYO: 6503) announced today that its “SUSTIE®” Net Zero Energy Test Facility has obtained Platinum-level WELL Building StandardTM certification, an international certification that evaluates the extent to which a building environment supports the wellbeing of its occupants.


It is expected that improvements to office environments will become more and more important in the future not only as a means of improving the health and productivity of employees but also as a factor when recruiting new staff. The SUSTIE facility has already received a top-level BELS 5-star rating (☆☆☆☆☆) and Net Zero Energy Building (ZEB) certification from the Building-Housing Energy-Efficiency Labeling System in Japan, and the highest level “S” rating from the CASBEE Wellness Office. These confirm that SUSTIE has achieved a high level of energy-saving and offers a comfortable working environment.

For the full text, please visit: www.MitsubishiElectric.com/news/


Contacts

Customer Inquiries
Information Technology R&D Center
Mitsubishi Electric Corporation
www.MitsubishiElectric.com/ssl/contact/company/rd/form.html
www.MitsubishiElectric.com/

Media Inquiries
Takeyoshi Komatsu
Public Relations Division
Mitsubishi Electric Corporation
Tel: +81-3-3218-2346
This email address is being protected from spambots. You need JavaScript enabled to view it.
www.MitsubishiElectric.com/news/

Ameresco also ranked as a top solar and storage installer, a top commercial solar contractor, and a top solar contractor in several states including MA, NY, NJ, DC, IL, AZ, CA, RI and HI

FRAMINGHAM, Mass.--(BUSINESS WIRE)--#carbonreduction--Ameresco, Inc., (NYSE: AMRC), a leading cleantech integrator specializing in energy efficiency and renewable energy, today announced that Solar Power World has named it to its national list of 2022 Top Solar Contractors. Ameresco is also ranked as a top solar and storage installer, a top commercial solar contractor, and a top solar contractor in the District of Columbia and across several states, including Massachusetts, New York, New Jersey, Illinois, Arizona, California, Rhode Island and Hawaii.


The Top Solar Contractors list is developed each year by industry magazine Solar Power World to honor the work of solar installers in the United States. Solar firms in the utility, commercial and residential markets are ranked by the number of kilowatts installed in the previous year. Companies are grouped and listed by specific services, markets and states.

“It’s an honor to be recognized by one of our industry’s leading news outlets as a top solar contractor,” said George Sakellaris, CEO of Ameresco. “Solar solutions have played a key role in the energy transition thus far and will continue to make an even larger impact when paired with additional technologies such as battery energy storage systems (BESS). We are eager to continue our work in partnership with our customers to drive sustainability and resiliency in all of our energy projects.”

In addition to being ranked at the district and state level, as well as 59th overall on Solar Power World’s list of 411 leading solar companies, Ameresco was also named to the top commercial solar contractor list and the top solar and storage installers list.

“The utility-scale solar market, of course, puts up huge installation numbers each year, but the majority of workers in the industry are constructing projects in the commercial and residential markets, which continue to break records,” said Kelly Pickerel, editor-in-chief of Solar Power World. “Over 85% of the companies on the 2022 Top Solar Contractors List primarily work in the residential and commercial sectors, and they all reported closing out the last year in a positive light.”

To learn more about the company’s range of solar energy and solar thermal energy solutions, visit https://www.ameresco.com/solution/solar-power/.

About Ameresco, Inc.
Founded in 2000, Ameresco, Inc. (NYSE:AMRC) is a leading cleantech integrator and renewable energy asset developer, owner and operator. Our comprehensive portfolio includes energy efficiency, infrastructure upgrades, asset sustainability and renewable energy solutions delivered to clients throughout North America and the United Kingdom. Ameresco’s sustainability services in support of clients’ pursuit of Net Zero include upgrades to a facility’s energy infrastructure and the development, construction, and operation of distributed energy resources. Ameresco has successfully completed energy saving, environmentally responsible projects with Federal, state and local governments, healthcare and educational institutions, housing authorities, and commercial and industrial customers. With its corporate headquarters in Framingham, MA, Ameresco has more than 1,000 employees providing local expertise in the United States, Canada, and the United Kingdom. For more information, visit www.ameresco.com.

About Solar Power World
Solar Power World is the leading online and print resource for news and information regarding solar installation, development and technology. Since 2011, SPW has helped U.S. solar contractors — including installers, developers and EPCs in all markets — grow their businesses and do their jobs better.


Contacts

Ameresco: Leila Dillon, 508-661-2264, This email address is being protected from spambots. You need JavaScript enabled to view it.
Solar Power World: Kelly Pickerel, 216-860-5259, This email address is being protected from spambots. You need JavaScript enabled to view it.

WASHINGTON--(BUSINESS WIRE)--On July 20, 2022, The STEER Coalition was formed to drive the passage of the STEER Act, a bill that would modernize the trucking industry by incentivizing greater adoption of fuel-saving technologies for heavy-duty trucks. The STEER Coalition members include Aperia Technologies, CiBUS21, Covenant Transportation, DHL, Idle Smart, Link Manufacturing, Stoneridge, The International Council on Clean Transportation, TruckLabs, and Western Express.

The STEER Act is a sensible, bipartisan bill that was introduced by the House of Representatives which addresses our climate goals by encouraging innovation and private sector driven solutions. The STEER Act establishes a $500M voucher program to offset the up-front costs of fuel-saving technologies so fleets can choose the technologies which work best in their operations, rather than a one fits all model.

The STEER Act can provide immediate reductions in CO2 emissions and badly needed support for the trucking industry as it could improve efficiencies by up to 15%, reducing annual domestic fuel consumption by 4.5 billion gallons and decreasing carbon-dioxide emissions by 50 million tons. Trucking is the backbone of American industry and is currently facing many challenges, such as a shortage of drivers, rising fuel prices, and increased operating costs, which have been exacerbated by the Covid-19 pandemic and Russia’s invasion of Ukraine. The STEER Act can save trucking companies $24.8 billion dollars annually at today's fuel prices.

As the first order of business, the STEER Coalition recognizes that the Inflation Reduction Act of 2022 is an important bill to address both climate and combat rising inflation, but we believe it misses a key opportunity to make it far more effective at both goals. The coalition is calling on legislators who are looking for pragmatic, timely, and costed solutions to either get this important piece of legislation formally introduced as a stand-alone Bill in the Senate ASAP or to consider adding the STEER Act to the Inflation Reduction Act as the best bang for the buck to reduce the US’s carbon emissions.

To learn more about the STEER Act, please visit the website https://www.steeract.org/ or access the full text here.

The STEER Coalition is open to new members that are looking to support the passage of the STEER Act. Organizations interested in joining the STEER Act coalition can reach out to Bess Lauer at This email address is being protected from spambots. You need JavaScript enabled to view it. or Max Bocheff at This email address is being protected from spambots. You need JavaScript enabled to view it. for more information.


Contacts

Bess Lauer
This email address is being protected from spambots. You need JavaScript enabled to view it.

Max Bocheff
This email address is being protected from spambots. You need JavaScript enabled to view it.

AKRON, Ohio--(BUSINESS WIRE)--$BW #renewableenergy--Babcock & Wilcox Enterprises, Inc. (NYSE:BW) (B&W or the “Company”) expects to host a conference call and webcast on Monday, August 8, 2022 at 5 p.m. ET.

B&W Chairman and Chief Executive Officer, Kenneth Young, and B&W Chief Financial Officer, Louis Salamone, will discuss the Company’s second quarter 2022 results. A news release detailing the results is expected to be issued after the market closes on Monday, August 8, 2022.

The listen-only audio of the conference call will be broadcast live via the Internet on B&W’s Investor Relations site. The dial-in number for participants in the U.S. is (844) 200-6205; the dial-in number for participants in Canada is (833) 950-0062; the dial-in number for participants in all other locations is (929) 526-1599. The conference ID for all participants is 352537. A replay of this conference call will remain accessible in the investor relations section of the Company’s website for a limited time.

About Babcock & Wilcox

Headquartered in Akron, Ohio, B&W is a global leader in energy and environmental technologies and services for the power and industrial markets. Follow B&W on LinkedIn and learn more at babcock.com.


Contacts

Investor Contact:
B&W Investor Relations
704.625.4944
This email address is being protected from spambots. You need JavaScript enabled to view it.

Media Contact:
Ryan Cornell
B&W Public Relations
330.860.1345
This email address is being protected from spambots. You need JavaScript enabled to view it.

  • Fisker Inc. is making its Pebble Beach Concours debut featuring the Fisker Ocean
  • The public and media are invited to visit the show stand at Concours Village
  • Fisker is on track to start production of the Fisker Ocean in November 2022

LOS ANGELES--(BUSINESS WIRE)--#EVs--Fisker Inc. (NYSE: FSR) ("Fisker") — passionate creator of the world's most sustainable electric vehicles and advanced mobility solutions — will bring the all-electric Fisker Ocean to Pebble Beach Automotive Week at Pebble Beach Concours d’Elegance from August 18-21, 2022.


"We are excited to be at Pebble Beach Concours to showcase one of the world’s most sustainable and innovative electric vehicles,” said CEO Henrik Fisker. “It’s the first time we’re in northern California, and this setting offers our local stakeholders an opportunity to see, touch, and feel the Fisker Ocean.”

Pebble Beach Concours is the world’s premier celebration of the automobile. The Fisker Ocean will be at Concours Village, the ideal location to exhibit the latest technology and features of the five-passenger, emissions-free SUV, starting at $37,4991 for the Sport trim. The media and public are welcome to visit the Fisker show stand at Forest Lake Road and Stevenson Drive to see the production-intent version of the Fisker Ocean, previously exhibited at various locations in the U.S. and Europe.

The Fisker Ocean is on track to start production in November 2022 at a carbon-neutral factory in Austria. The first 5,000 vehicles will be a limited launch edition Fisker Ocean One.

The uncompromised luxury of the Fisker Ocean One builds on the premium trim Extreme, adding signature features such as 22” F3 SlipStream aluminum wheels with recycled carbon fiber inserts, a commemorative digital signature inside, and model-specific exterior badging. Closer to production, each reservation holder will finalize the details of their specific Fisker Ocean One. Reservation holders may finance their Fisker Ocean via Fisker Finance℠, announced earlier this month.

About Fisker Inc.

California-based Fisker Inc. is revolutionizing the automotive industry by developing the most emotionally desirable and eco-friendly electric vehicles on Earth. Passionately driven by the vision of a clean future for all, the company is on a mission to become the No. 1 e-mobility service provider with the world's most sustainable vehicles. To learn more, visit www.FiskerInc.com — and enjoy exclusive content across Fisker's social media channels: Facebook, Instagram, Twitter, YouTube, and LinkedIn.

Download the revolutionary new Fisker mobile app from the App Store or Google Play store.

Forward-Looking Statements

This press release includes forward-looking statements, which are subject to the "safe harbor" provisions of the US Private Securities Litigation Reform Act of 1995. These statements may be identified by words such as "feel," "believes," expects," "estimates," "projects," "intends," "should," "is to be," or the negative of such terms, or other comparable terminology and include, among other things, the quotation of our CEO, the statements regarding the planned launch timing, pricing and estimated range of the Fisker Ocean, the Company's future performance and other future events that involve risks and uncertainties. Such forward-looking statements are not guarantees of future performance and are subject to risks and uncertainties, which could cause actual results to differ materially from the forward-looking statements contained herein due to many factors, including, but not limited to: Fisker's limited operating history; Fisker's ability to enter into additional manufacturing and other contracts with Magna or tier-one suppliers in order to execute on its business plan; the risk that OEM and supply partners do not meet agreed-upon timelines or experience capacity constraints; Fisker may experience significant delays in the design, manufacture, regulatory approval, launch and financing of its vehicles; Fisker's ability to execute its business model, including market acceptance of its planned products and services; Fisker's inability to retain key personnel and to hire additional personnel; competition in the electric vehicle market; Fisker's inability to develop a sales distribution network; and the ability to protect its intellectual property rights; and those factors discussed in Fisker's Annual Report on Form 10-K, under the heading "Risk Factors", filed with the Securities and Exchange Commission (the "SEC"), as supplemented by Quarterly Reports on Form 10-Q, and other reports and documents Fisker files from time to time with the SEC. Any forward-looking statements speak only as of the date on which they are made, and Fisker undertakes no obligation to update any forward-looking statement to reflect events or circumstances after the date of this press release.

1Pricing shown is for the Continental US and excludes delivery, finance, and government charges. Maintenance is not included. Pricing is subject to change and will be calculated when you place your order and will further depend upon specifications and options chosen by you as you configure your actual vehicle closer to production. Various state and federal incentives and benefits which may be available to you are not included.


Contacts

US Media:
This email address is being protected from spambots. You need JavaScript enabled to view it.

European Media:
This email address is being protected from spambots. You need JavaScript enabled to view it.

Fisker Inc. Communications:

Matthew DeBord
Sr Director, Communications Strategy & Storytelling
This email address is being protected from spambots. You need JavaScript enabled to view it.

Rebecca Lindland
Director, Communications
This email address is being protected from spambots. You need JavaScript enabled to view it.

Investor Relations:

Frank Boroch, VP of Investor Relations
This email address is being protected from spambots. You need JavaScript enabled to view it.

SAN MATEO, Calif. & NEW YORK--(BUSINESS WIRE)--Mondee Holdings, Inc. (“Mondee” or “the Company”) (NASDAQ: MOND), the high-growth, travel technology company and marketplace, today announced that Orestes Fintiklis has been appointed to the role of Vice Chairman of the Board and Chief Corporate Strategy and Business Development Officer. In his new role, Mr. Fintiklis will provide assistance in overseeing various roles including business development, strategic advisory, mergers & acquisitions and investor relations, as well as facilitate the smooth transition of Mondee from a private to a public company.


Mr. Fintiklis served as the Chief Executive Officer and Chairman of ITHAX Acquisition Corp., the special purpose acquisition company that recently completed its business combination with Mondee. on July 19, 2022 and has served as a director of Mondee since the consummation of such business combination. Mr. Fintiklis also serves as the Founder and Managing Partner of Ithaca Capital, a private equity real estate management company with a focus on hospitality special situations investing and the owner of multiple iconic and award-winning hotels such as W Hotel Bogota and JW Marriott Panama. Prior to Ithaca Capital, Mr. Fintiklis has led a distinguished career in hospitality investing, development and asset management of over 15 years. Mr. Fintiklis started his career as an attorney at Clifford Chance in London and also has extraordinary academic credentials in law having graduated first in his class from Oxford University.

“We are pleased to welcome Orestes more directly into the Mondee team where his track record of delivering strong business results and operational management experience make him the right person at this important inflection point to continue to support Mondee’s future organic and inorganic growth and strategic priorities,” said Prasad Gundumogula Founder & CEO of Mondee.

“I’m thrilled to become a more integral part of the Mondee team as the company continues to capitalize on growth opportunities in the travel industry and to advance its travel technology platforms, next-generation solutions as well as implement an accretive M&A strategy,” said Mr. Fintiklis. “Mondee’s proven business model and EBITDA profitability coupled with remarkable growth and recent introduction to the public markets will uniquely drive both further consolidation and disruption in the distribution channels of the travel industry and deliver long-term value to shareholders.”

Mondee is a technology-driven, next-generation marketplace that is modernizing and disrupting the travel market. Mondee’s technology-led growth strategies have produced a strong financial and market track record, especially within the legacy-anchored, assisted/affiliated travel industry. The Company is a market leader in the North America private airfare market with significant penetration in the travel experts segment, through direct connectivity with more than 500 airlines and more than 1 million hotel and alternative accommodation properties and a unique distribution network of 50,000+ leisure travel affiliates and agents.

About Mondee Holdings, Inc.:

Mondee Holdings, Inc. is a group of leading travel technology, service, and content companies driving disruptive innovative change in the leisure and corporate travel markets. They deliver a revolutionary technology platform of SaaS, mobile, and cloud products and services to a global customer base, processing over 50 million daily searches and multi-billion dollars of transactional volume yearly. Founded in 2011, Mondee is headquartered in Austin, Texas, with 17 offices in the USA and Canada, and operations in India, Thailand, and Ireland. On July 19th, 2022, Mondee become a publicly listed company on Nasdaq under the ticker symbol “MOND”. For more information, please visit https://www.mondee.com.

Forward-Looking Statements:

This press release contains “forward-looking statements” within the meaning of federal securities law. Forward-looking statements can be identified by words such as: “believe,” “can”, “"may,” “expects,” “intends,” “potential,” “plans,” “will” and similar references to future periods. Examples of forward-looking statements include, among others, statements we make regarding future growth, performance, business prospects and opportunities, future plans and intentions or other future events are forward looking statements. Such forward-looking statements are subject to risks, uncertainties, and other factors, which could cause actual results to differ materially from those expressed or implied by such forward-looking statements.

These forward-looking statements are based upon estimates and assumptions that, while considered reasonable by the Company and its management, are inherently uncertain. The Company cautions you that these forward-looking statements are subject to risks and uncertainties, most of which are difficult to predict and many of which are beyond the control of the Company. Factors that may cause actual results to differ materially from current expectations include, but are not limited to, the ability to implement business plans, forecasts, and other expectations after the recently completed business combination between ITHAX Acquisition Corp. and Mondee Holdings II, Inc., the outcome of any legal proceedings that may be instituted against the Company or others and any definitive agreements with respect thereto, the ability to recognize the anticipated benefits of the business combination, which may be affected by, among other things, competition, the ability of the Company to grow and manage growth profitably, maintain relationships with customers and suppliers and retain its management and key employees, the ability to meet Nasdaq’s listing standards, and other risks and uncertainties set forth in the sections entitled “Risk Factors” and “Cautionary Note Regarding Forward-Looking Statements” in the Company’s registration statement on Form S-4 relating to the business combination declared effective by the SEC on June 27, 2022 and in the Company’s subsequent filings with the U.S. Securities and Exchange Commission (the “SEC”). There may be additional risks that the Company does not presently know of or that the Company currently believe are immaterial that could also cause actual results to differ from those contained in the forward-looking statements.

Nothing in this press release should be regarded as a representation by any person that the forward-looking statements set forth herein will be achieved or that any of the contemplated results of such forward-looking statements will be achieved. You should not place undue reliance on forward-looking statements, which speak only as of the date they are made, and the Company expressly disclaims any obligation or undertaking to disseminate any updates or revisions to any forward-looking statement to reflect events or circumstances after the date on which such statement is being made, or to reflect the occurrence of unanticipated events.


Contacts

Media:

For Mondee:

Media
This email address is being protected from spambots. You need JavaScript enabled to view it.

Investor Relations
This email address is being protected from spambots. You need JavaScript enabled to view it.

~Record June Quarter Revenue Grows to Over $688 Million~
~Gross Margins Continue to Expand~
~Record Third Quarter Earnings Per Share of $3.17~
~Raises Fiscal Year 2022 Guidance~

CLEARWATER, Fla.--(BUSINESS WIRE)--MarineMax, Inc. (NYSE: HZO), the world’s largest recreational boat and yacht retailer, today announced results for its third quarter ended June 30, 2022.


Revenue increased 3% to a record $688.5 million for the quarter ended June 30, 2022, from $666.3 million in the comparable period last year. Revenue growth benefitted from contributions of recent strategic acquisitions, as same-store sales declined 5% versus an increase of 6% a year ago and a 43% increase over the prior two-comparable periods. New unit sales grew year-over-year notwithstanding low inventory and supply chain challenges. The change in same store sales was primarily related to the on-going industry shortage of inventory, specifically larger product. The Company’s significant geographic and product diversification, in combination with accretive acquisitions, resulted in net income growing to $70.2 million and a 22% increase in earnings per diluted share to $3.17. This compares to earnings per diluted share of $2.59 in the comparable period last year.

For the nine-months ended June 30, 2022, revenue grew 11% to $1.77 billion compared with $1.60 billion for the same period last year. Same-store sales increased approximately 3%, on top of 21% growth for the same period last year. Net income for the nine months ended June 30, 2022, rose to $159.6 million, with earnings per diluted share rising over 33% to $7.11, compared with $122.2 million, or $5.33 per diluted share for the comparable period last year.

W. Brett McGill, Chief Executive Officer and President, stated, “I am extremely proud of our team for continuing to execute, as we extend our long record of accelerating profitability and operating leverage expansion. We are building on our previously communicated strategic vision that we began deploying in 2019, to transform MarineMax into a more diversified business model that would create greater resilience across ever changing economic cycles. This strategy produced another quarter of record gross margins and profits, driving sustained profitability by focusing on higher margin businesses.”

Mr. McGill continued, “Business accelerated as we moved through the quarter, supported by unit growth year-over-year as we effectively worked to overcome ongoing supply chain challenges and the weather-related delay to the start of the Midwest boating season. In fact, excluding our Midwest markets, we saw over 8% new unit growth on a same-store basis in the quarter. We continue to gain market share, as the industry did not experience that same level of growth. As the world’s preferred boating and yacht retailer, we remain well capitalized to continue to enhance shareholder value through our wide-ranging geographic presence, broad product diversification, digital platform, strong balance sheet and a cycle tested management team.”

Updated 2022 Guidance
Based on current business conditions, retail trends and other factors, as well as contributions from acquisitions closed in 2022, the Company is raising its fiscal year 2022 guidance for earnings per diluted share to a range of $8.05 to $8.45, which is increased from its previously provided guidance of $7.90 to $8.30 per diluted share. This compares to earnings per diluted share of $6.78 in fiscal 2021. These expectations do not consider, or give effect for, material acquisitions that may be completed by the Company during fiscal 2022, or other unforeseen events, including changes in global economic conditions.

About MarineMax
MarineMax is the world’s largest recreational boat and yacht retailer, selling new and used recreational boats, yachts and related marine products and services, as well as providing yacht brokerage and charter services. MarineMax has over 100 locations worldwide, including 79 retail dealership locations, which includes 33 marinas or storage operations. Through Fraser Yachts and Northrop and Johnson, the Company also is the largest superyacht services provider, operating locations across the globe. Cruisers Yachts, a MarineMax company, manufactures boats and yachts with sales through our select retail dealership locations and through independent dealers. Intrepid Powerboats, a MarineMax company, manufactures powerboats and sells through a direct-to-consumer model. MarineMax provides finance and insurance services through wholly owned subsidiaries and operates MarineMax Vacations in Tortola, British Virgin Islands. The Company also operates Boatyard, a pioneering digital platform that enhances the boating experience. MarineMax is a New York Stock Exchange-listed company (NYSE: HZO). For more information, please visit www.marinemax.com.

Forward Looking Statement

Certain statements in this press release are forward-looking as defined in the Private Securities Litigation Reform Act of 1995. Such forward-looking statements include the Company’s anticipated financial results for the second quarter ended June 30, 2022; our ability to make strategic long-term accretive acquisitions; our enhancement of shareholder value; and the Company's fiscal 2022 guidance. These statements are based on current expectations, forecasts, risks, uncertainties and assumptions that may cause actual results to differ materially from expectations as of the date of this release. These risks, assumptions and uncertainties include the Company’s abilities to obtain and manage inventory, manage expenses and accomplish its goals and strategies, the quality of the new product offerings from the Company’s manufacturing partners, the performance of the recently-acquired businesses, the impacts (direct and indirect) of COVID-19 on the Company’s business, the Company’s employees, the Company’s manufacturing partners, and the overall economy, general economic conditions, as well as those within the Company's industry, the level of consumer spending, potential supply chain constraints and numerous other factors identified in the Company’s Form 10-K for the fiscal year ended September 30, 2021 and other filings with the Securities and Exchange Commission. The Company disclaims any intention or obligation to update or revise any forward-looking statements, whether as a result of new information, future events or otherwise.

MarineMax, Inc. and Subsidiaries

Condensed Consolidated Statements of Operations

(Amounts in thousands, except share and per share data)

(Unaudited)


Three Months Ended
June 30,


Nine Months Ended
June 30,


2022


2021


2022


2021


Revenue

$

688,537


$

666,328


$

1,771,334


$

1,600,947

Cost of sales


452,064


461,654


1,162,347


1,116,066

Gross profit


236,473


204,674


608,987


484,881


Selling, general, and administrative expenses


141,173


123,766


394,702


319,120

Income from operations


95,300


80,908


214,285


165,761


Interest expense


1,008


639


2,299


2,999

Income before income tax provision


94,292


80,269


211,986


162,762


Income tax provision


24,113


20,651


52,357


40,609

Net income

$

70,179


$

59,618


$

159,629


$

122,153


Basic net income per common share

$

3.26


$

2.69


$

7.34


$

5.53


Diluted net income per common share

$

3.17


$

2.59


$

7.11


$

5.33


Weighted average number of common shares used in computing net income per common share:


Basic


21,524,315


22,132,915


21,761,811


22,100,190

Diluted


22,173,273


23,037,679


22,455,828


22,922,526

MarineMax, Inc. and Subsidiaries

Condensed Consolidated Balance Sheets

(Amounts in thousands)

(Unaudited)


June 30,

2022


June 30,

2021

ASSETS

CURRENT ASSETS:


Cash and cash equivalents

$

281,351


$

200,121


Accounts receivable, net


61,863


60,195


Inventories, net


374,217


209,418


Prepaid expenses and other current assets


18,566


18,316


Total current assets


735,997


488,050


Property and equipment, net


226,647


166,058


Operating lease right-of-use assets, net


100,127


104,641


Goodwill and other intangible assets, net


248,194


186,691


Other long-term assets


9,104


10,650


Total assets

$

1,320,069


$

956,090


LIABILITIES AND STOCKHOLDERS’ EQUITY

CURRENT LIABILITIES:


Accounts payable

$

56,533


$

28,741


Contract liabilities (customer deposits)


138,375


86,704


Accrued expenses


97,088


89,696


Short-term borrowings


107,222


2,861


Current maturities on long-term debt


3,028


3,293


Current operating lease liabilities


10,323


10,275


Total current liabilities


412,569


221,570


Long-term debt, net of current maturities


45,834


48,374


Noncurrent operating lease liabilities


92,774


96,830


Deferred tax liabilities, net


17,805


8,419


Other long-term liabilities


8,347


8,126


Total liabilities


577,329


383,319


STOCKHOLDERS' EQUITY:


Preferred stock


--


--


Common stock


29


28


Additional paid-in capital


300,411


288,923


Accumulated other comprehensive income (loss)


(1,351

)


1,264


Retained earnings


592,307


399,852


Treasury stock


(148,656

)


(117,296

)

Total stockholders’ equity


742,740


572,771


Total liabilities and stockholders’ equity

$

1,320,069


$

956,090


MarineMax, Inc. and Subsidiaries

Segment Financial Information

(Amounts in thousands)

(Unaudited)


Three Months Ended
June 30,


Nine Months Ended
June 30,


2022


2021


2022


2021


Revenue:


Retail Operations

$

657,930


$

656,826


$

1,690,172


$

1,591,445


Product Manufacturing


48,802


20,417


129,804


20,417


Elimination of intersegment revenue


(18,195

)


(10,915

)


(48,642

)


(10,915

)

Revenue

$

688,537


$

666,328


$

1,771,334


$

1,600,947


Income from operations:


Retail Operations

$

90,655


$

79,988


$

204,124


$

164,841


Product Manufacturing


5,903


3,521


13,733


3,521


Elimination of intersegment income


(1,258

)


(2,601

)


(3,572

)


(2,601

)

Income from operations

$

95,300


$

80,908


$

214,285


$

165,761


Contacts

Michael H. McLamb
Chief Financial Officer
Abbey Heimensen
Public Relations
MarineMax, Inc.
727.531.1700

Brad Cohen or Dawn Francfort
ICR, LLC.
This email address is being protected from spambots. You need JavaScript enabled to view it.

HARTFORD, Conn. & BOSTON--(BUSINESS WIRE)--Eversource Energy (NYSE: ES) today reported earnings of $291.9 million, or $0.84 per share, in the second quarter of 2022, compared with earnings of $264.5 million, or $0.77 per share, in the second quarter of 2021. In the first half of 2022, Eversource Energy reported earnings of $735.3 million, or $2.13 per share, compared with earnings of $630.7 million, or $1.83 per share, in the first half of 2021.


Results for both years include transaction and transition charges primarily related to the October 2020 acquisition of the assets of Columbia Gas of Massachusetts. Those after-tax charges totaled $5.5 million in the second quarter of 2022 and $10.8 million in the first half of 2022, compared with $6.8 million in the second quarter of 2021 and $13 million in the first half of 2021. Results in the first half of 2021 also included a pre-tax charge of $28.6 million related to Connecticut regulators’ assessment of the performance of The Connecticut Light and Power Company (CL&P) following the catastrophic damage from Tropical Storm Isaias in August 2020. Absent those charges, Eversource earned $297.4 million1 or $0.86 per share,1 in the second quarter of 2022 and $746.1 million1, or $2.16 per share1 in the first half of 2022, compared with earnings of $269.9 million1, or $0.79 per share1, in the second quarter of 2021 and $666.3 million1, or $1.94 per share1, in the first half of 2021.

Eversource Energy also today narrowed its 2022 earnings per share (EPS) projection to between $4.04 to $4.14 per share, excluding transaction and transition charges, compared with a previous range of $4.00 to $4.17 per share. Eversource Energy also today reaffirmed its long-term EPS growth rate from its existing core regulated businesses in the upper half of 5-7 percent, using the $3.86 per share1 earned in 2021 as a base.

We had a strong first half of 2022, both operationally and financially,” said Joe Nolan, Eversource president and chief executive officer. “We are delivering the safe, reliable and efficient electric, natural gas and water service our 4.4 million customers expect and advancing the clean energy strategies that support the long-term decarbonization goals of the states and communities we serve.”

Electric Transmission

Eversource Energy’s transmission segment earned $151.5 million in the second quarter of 2022 and $300 million in the first half of 2022, compared with earnings of $137.6 million in the second quarter of 2021 and $273 million in the first half of 2021. Transmission segment results improved due to a higher level of investment in Eversource’s electric transmission system.

Electric Distribution

Eversource Energy’s electric distribution segment earned $129 million in the second quarter of 2022 and $269.9 million in the first half of 2022, compared with earnings of $120.2 million1 in the second quarter of 2021 and $237.5 million1 in the first half of 2021, excluding the CL&P charge noted above. Improved second-quarter and first-half results were due to higher revenues and lower pension-related costs, partially offset by higher depreciation, property taxes, interest expense and other employee-related costs.

Natural Gas Distribution

Eversource Energy’s natural gas distribution segment earned $7.7 million in the second quarter of 2022 and $171.7 million in the first half of 2022, compared with earnings of $4.1 million in the second quarter of 2021 and $151.6 million in the first half of 2021. Improved second-quarter and first-half results were primarily the result of higher revenues, offset by higher operation and maintenance (O&M) costs and property tax, interest and depreciation expense.

Water Distribution

Eversource Energy’s water segment earned $9 million in the second quarter of 2022 and $12.7 million in the first half of 2022, approximately the same as earnings of $8.9 million in the second quarter of 2021 and $12.6 million in the first half of 2021.

Eversource Parent and Other Companies

Eversource Energy parent and other companies earned $0.2 million1 in the second quarter of 2022 and lost $8.2 million1 in the first half of 2022, excluding the charges noted earlier, compared with losses of $0.9 million1 in the second quarter of 2021 and $8.4 million1 in the first half of 2021. Improved second-quarter results primarily reflect gains on investments in a clean energy fund, partially offset by higher interest costs.

The following table reconciles 2022 and 2021 second quarter and first half earnings per share:


Second Quarter

First Six Months

2021

Reported EPS

$

0.77

$

1.83


Higher electric transmission earnings in 2022


0.04


0.08


Higher natural gas revenues in 2022, partially offset by higher
O&M, property tax expense, interest and depreciation


0.01


0.05


Higher electric distribution revenues in 2022, partially offset
by higher O&M, depreciation, property taxes and interest
expense


0.02


0.09


Absence of storm-related charge in 2022


--


0.07


Lower charges related to transactions in 2022


--


0.01


2022

Reported EPS

$

0.84


$

2.13


Financial results by segment for the second quarter and first six months of 2022 and 2021 are noted below:

Three months ended:


(in millions, except EPS)


June 30, 2022


June 30, 2021

Increase/
(Decrease)


2022 EPS1

Electric Transmission

$

151.5


$

137.6


$

13.9


$

0.44


Electric Distribution1


129.0


120.2


8.8


0.37


Natural Gas Distribution


7.7


4.1


3.6


0.02


Water Distribution


9.0


8.9


0.1


0.03


Eversource Parent and Other Companies1


0.2


(0.9

)


1.1


0.00


Transaction and transition costs


(5.5

)


(5.4

)


(0.1

)


(0.02

)

Reported Earnings

$

291.9


$

264.5


$

27.4


$

0.84


Six months ended:

(in millions, except EPS)

June 30, 2022

June 30, 2021

Increase

2022 EPS1

Electric Transmission

$

300.0


$

273.0


$

27.0

$

0.87


Electric Distribution1


269.9


237.5


32.4


0.78


Natural Gas Distribution


171.7


151.6


20.1


0.49


Water Distribution


12.7


12.6


0.1


0.04


Eversource Parent and Other Companies1


(8.2

)


(8.4

)


0.2


(0.02

)

Transaction and transition costs and CT

storm charge


(10.8


)


(35.6


)


24.8


(0.03


)

Reported Earnings

$

735.3


$

630.7


$

104.6


$

2.13


Eversource Energy has approximately 346.5 million common shares outstanding and operates New England’s largest energy delivery system. It serves approximately 4.4 million electric, natural gas and water customers in Connecticut, Massachusetts and New Hampshire.

Note: Eversource Energy will webcast a conference call with senior management on July 29, 2022, beginning at 9 a.m. Eastern Time. The webcast and associated slides can be accessed through Eversource Energy’s website at www.eversource.com.

1 All per-share amounts in this news release are reported on a diluted basis. The only common equity securities that are publicly traded are common shares of Eversource Energy. The earnings and EPS of each business do not represent a direct legal interest in the assets and liabilities of such business, but rather represent a direct interest in Eversource Energy's assets and liabilities as a whole. EPS by business is a financial measure not recognized under generally accepted accounting principles (non-GAAP) that is calculated by dividing the net income or loss attributable to common shareholders of each business by the weighted average diluted Eversource Energy common shares outstanding for the period. Earnings discussions also include non-GAAP financial measures referencing 2022 and 2021 earnings and EPS excluding certain transaction and transition costs, and our 2021 earnings and EPS excluding charges at CL&P related to an October 2021 settlement agreement that included credits to customers and funding of various customer assistance initiatives and a 2021 storm performance penalty imposed on CL&P by the PURA. Eversource Energy uses these non-GAAP financial measures to evaluate and provide details of earnings results by business and to more fully compare and explain 2022 and 2021 results without including these items. This information is among the primary indicators management uses as a basis for evaluating performance and planning and forecasting of future periods. Management believes the impacts of transaction and transition costs, the CL&P October 2021 settlement agreement, and the 2021 storm performance penalty imposed on CL&P by the PURA, are not indicative of Eversource Energy’s ongoing costs and performance. Due to the nature and significance of the effect of these items on net income attributable to common shareholders and EPS, management believes that the non-GAAP presentation is a more meaningful representation of Eversource Energy’s financial performance and provides additional and useful information to readers in analyzing historical and future performance of the business. These non-GAAP financial measures should not be considered as alternatives to Eversource Energy’s reported net income attributable to common shareholders or EPS determined in accordance with GAAP as indicators of Eversource Energy’s operating performance.

This document includes statements concerning Eversource Energy’s expectations, beliefs, plans, objectives, goals, strategies, assumptions of future events, future financial performance or growth and other statements that are not historical facts. These statements are “forward-looking statements” within the meaning of the Private Securities Litigation Reform Act of 1995. Generally, readers can identify these forward-looking statements through the use of words or phrases such as “estimate,” “expect,” “anticipate,” “intend,” “plan,” “project,” “believe,” “forecast,” “should,” “could” and other similar expressions. Forward-looking statements involve risks and uncertainties that may cause actual results or outcomes to differ materially from those included in the forward-looking statements. Forward-looking statements are based on the current expectations, estimates, assumptions or projections of management and are not guarantees of future performance. These expectations, estimates, assumptions or projections may vary materially from actual results. Accordingly, any such statements are qualified in their entirety by reference to, and are accompanied by, the following important factors that may cause our actual results or outcomes to differ materially from those contained in our forward-looking statements, including, but not limited to: cyberattacks or breaches, including those resulting in the compromise of the confidentiality of our proprietary information and the personal information of our customers; disruptions in the capital markets or other events that make our access to necessary capital more difficult or costly; the negative impacts of the novel coronavirus (COVID-19) pandemic, including any new or emerging variants, on our customers, vendors, employees, regulators, and operations; changes in economic conditions, including impact on interest rates, tax policies, and customer demand and payment ability; ability or inability to commence and complete our major strategic development projects and opportunities; acts of war or terrorism, physical attacks or grid disturbances that may damage and disrupt our electric transmission and electric, natural gas, and water distribution systems; actions or inaction of local, state and federal regulatory, public policy and taxing bodies; substandard performance of third-party suppliers and service providers; fluctuations in weather patterns, including extreme weather due to climate change; changes in business conditions, which could include disruptive technology or development of alternative energy sources related to our current or future business model; contamination of, or disruption in, our water supplies; changes in levels or timing of capital expenditures; changes in laws, regulations or regulatory policy, including compliance with environmental laws and regulations; changes in accounting standards and financial reporting regulations; actions of rating agencies; and other presently unknown or unforeseen factors.

Other risk factors are detailed in Eversource Energy’s reports filed with the Securities and Exchange Commission (SEC). They are updated as necessary and available on Eversource Energy’s website at www.eversource.com and on the SEC’s website at www.sec.gov. All such factors are difficult to predict and contain uncertainties that may materially affect Eversource Energy’s actual results, many of which are beyond our control. You should not place undue reliance on the forward-looking statements, as each speaks only as of the date on which such statement is made, and, except as required by federal securities laws, Eversource Energy undertakes no obligation to update any forward-looking statement or statements to reflect events or circumstances after the date on which such statement is made or to reflect the occurrence of unanticipated events.


For the Three Months Ended June 30,


For the Six Months Ended June 30,

(Thousands of Dollars, Except Share Information)

2022


2021


2022


2021


Operating Revenues

$

2,572,641


$

2,122,538


$

6,043,951


$

4,948,378


Operating Expenses:


Purchased Power, Fuel and Transmission


940,541


650,087


2,330,237


1,648,578


Operations and Maintenance


452,174


411,147


924,608


876,689


Depreciation


294,238


274,647


583,568


545,352


Amortization


70,409


5,611


307,357


113,624


Energy Efficiency Programs


136,679


128,955


336,163


317,018


Taxes Other Than Income Taxes


223,031


200,486


443,395


409,944


Total Operating Expenses


2,117,072


1,670,933


4,925,328


3,911,205


Operating Income


455,569


451,605


1,118,623


1,037,173


Interest Expense


160,090


145,435


313,334


283,201


Other Income, Net


93,861


46,619


165,422


80,820


Income Before Income Tax Expense


389,340


352,789


970,711


834,792


Income Tax Expense


95,598


86,389


231,643


200,370


Net Income


293,742


266,400


739,068


634,422


Net Income Attributable to Noncontrolling Interests


1,880


1,880


3,759


3,759


Net Income Attributable to Common Shareholders

$

291,862


$

264,520


$

735,309


$

630,663


Basic and Diluted Earnings Per Common Share

$

0.84


$

0.77


$

2.13


$

1.83


Weighted Average Common Shares Outstanding:


Basic


345,893,714


343,844,626


345,525,030


343,761,435


Diluted


346,295,478


344,435,696


345,978,306


344,385,193


The data contained in this report is preliminary and is unaudited. This report is being submitted for the sole purpose of providing information to shareholders about Eversource Energy and Subsidiaries and is not a representation, prospectus, or intended for use in connection with any purchase or sale of securities.


Contacts

Jeffrey R. Kotkin
(860) 665-5154

Upon completion, the deal would signify full consolidation of the ExxonMobil business card portfolio under WEX, allowing cardholders to control expenses and streamline fleet operations

PORTLAND, Maine--(BUSINESS WIRE)--WEX (NYSE: WEX), the global commerce platform that simplifies the business of running a business, is announcing today that it has plans to acquire the Exxon Mobil Business Card program. The acquisition will be contingent upon certain conditions and subject to closing. Upon completion of the acquisition, all of ExxonMobil’s commercial card portfolio will be consolidated and administered by WEX.


“The ExxonMobil Team at WEX is very excited by the prospect of welcoming these customers to our North American portfolio of business, completing the consolidation of all ExxonMobil’s commercial card business at WEX,” said Gene Currier, vice president and business manager at WEX. “Customers will enjoy the same benefits, purchasing controls, and savings opportunities as all other Exxon Mobil BusinessPro customers across the U.S. and Canada.”

The Exxon Mobil BusinessPro program provides convenience, security, and control for small businesses. The program supports a private label, revolving credit card offering which can be used at over 12,000 Exxon™ and Mobil™ locations within the United States, plus cross-border acceptance in Canada. Its simplistic interface is designed for small business customers who typically fuel at the same stations near their home base.

Cardholders can save with fuel rebates of up to 6 cents per gallon on all Synergy™ fuel grades*. In addition to savings with the rebate, cardholders enrolled in the Exxon Mobil Rewards+™ program continue to earn points on fuel purchases, such as 4 bonus points per gallon on fuel when qualified as a Frequent Filler™ member**.

“The consolidation of the Exxon Mobil Business Card into our Exxon Mobil BusinessPro program with WEX will provide a simplified commercial card offer for prospective customers,” said Austin Johansen, fleet marketing manager at ExxonMobil. “WEX has been a valued partner for ExxonMobil, delivering excellent service and offerings to fleets and small businesses.”

To learn more about Exxon Mobil BusinessPro™ account features, visit www.newwexfuelcard.com.

About WEX

WEX (NYSE: WEX) is the global commerce platform that simplifies the business of running a business. WEX has created a powerful ecosystem that offers seamlessly embedded, personalized solutions for its customers around the world. Through its rich data and specialized expertise in simplifying benefits, reimagining mobility and paying and getting paid, WEX aims to make it easy for companies to overcome complexity and reach their full potential. For more information, please visit www.wexinc.com.

Forward-Looking Statements made by WEX

This release contains forward-looking statements, including statements regarding: our expectations regarding completing the acquisition of the ExxonMobil Business Card portfolio, which is subject to certain closing conditions, and converting these portfolio customers to the WEX card program. Any statements that are not statements of historical facts may be deemed to be forward-looking statements. When used in this press release, the words “anticipate,” “believe,” “continue,” “could,” “estimate,” “expect,” “intend,” “may,” “plan,” “project”, “will”, “would”, and similar expressions are intended to identify forward-looking statements, although not all forward-looking statements contain such words. These forward-looking statements are subject to a number of risks and uncertainties that could cause actual results to differ materially, including: WEX’s ability to close on the agreement to acquire the portfolio and to convert the portfolio customers, as well as other risks and uncertainties identified in Item 1A of WEX’s annual report on Form 10-K for the year ended December 31, 2021, filed with the Securities and Exchange Commission on March 1, 2022. WEX's forward-looking statements do not reflect the potential future impact of any alliance, merger, acquisition, disposition or stock repurchases. The forward-looking statements speak only as of the date of this release and undue reliance should not be placed on these statements. WEX disclaims any obligation to update any forward-looking statements as a result of new information, future events or otherwise.

*Exxon Mobil BusinessPro is issued by WEX Bank. Based on monthly volume, refer to the standard rebate table. Rebates are not applied at time of purchase — they will appear as an account credit on the same billing statement as your monthly purchases. Rebates issued if payment is made in accordance with the terms of the ExxonMobil Fleet Charge Account Agreement. Rebates may not be allowed where prohibited by law and apply only to fuel purchases made with the ExxonMobil Fleet Card at participating Exxon and Mobil branded stations in the U.S. Please contact ExxonMobil Fleet Services for further information on available rebates. Rebates can be changed at any time at ExxonMobil's discretion.

Fuel economy improvement is based on Synergy-branded gasoline compared to gasoline meeting minimum U.S. government standards.

**Exxon Mobil Rewards+ Frequent Filler™ bonus points are received by purchasing at least 100 gallons of Synergy fuel in a calendar month (i.e., August). To qualify, you must make purchases at participating Exxon or Mobil station locations either using (1) your Exxon Mobil Rewards+ card, or (2) your alt-ID/telephone number or (3) within the Exxon Mobil Rewards+ app. Visit exxon.com/terms to learn more.


Contacts

Robert Gould
This email address is being protected from spambots. You need JavaScript enabled to view it.

VERNAL, Utah--(BUSINESS WIRE)--Superior Drilling Products, Inc. (NYSE American: SDPI) (“SDP” or “Company”), a designer and manufacturer of drilling tool technologies, today announced that it will release its second quarter 2022 financial results before the opening of financial markets on Friday, August 12, 2022.


The Company will host a conference call and webcast that day to review the financial and operating results for the quarter and discuss its corporate strategy and outlook. A question-and-answer session will follow.

Second Quarter 2022 Conference Call

Friday, August 12, 2022
10:00 a.m. Mountain Time (12:00 p.m. Eastern Time)
Phone: (201) 689-8470
Webcast and accompanying slide presentation: www.sdpi.com

A telephonic replay will be available from 1:00 p.m. MT (3:00 p.m. ET) the day of the teleconference until Friday, August 19, 2022. To listen to the archived call, dial (412) 317-6671 and enter conference ID number 13731267, or access the webcast replay via the Company’s website at www.sdpi.com, where a transcript will be posted once available.

About Superior Drilling Products, Inc.
Superior Drilling Products, Inc. is an innovative, cutting-edge drilling tool technology company providing cost saving solutions that drive production efficiencies for the oil and natural gas drilling industry. The Company designs, manufactures, repairs and sells drilling tools. SDP drilling solutions include the patented Drill-N-Ream® well bore conditioning tool and the patented Strider™ oscillation system technology. In addition, SDP is a manufacturer and refurbisher of PDC (polycrystalline diamond compact) drill bits for a leading oil field service company. SDP operates a state-of-the-art drill tool fabrication facility, where it manufactures its solutions for the drilling industry, as well as customers’ custom products. The Company’s strategy for growth is to leverage its expertise in drill tool technology and innovative, precision machining to broaden its product offerings and solutions for the oil and gas industry.

Additional information about the Company can be found at: www.sdpi.com.


Contacts

For more information, contact investor relations:
Deborah K. Pawlowski
Kei Advisors LLC
(716) 843-3908
This email address is being protected from spambots. You need JavaScript enabled to view it.

Provides Carbon Credit Stream Portfolio Summary and Signs Term Sheet for Canadian Reforestation Project


MarVivo Blue Carbon Project Achieves Next Funding Milestone

TORONTO--(BUSINESS WIRE)--Carbon Streaming Corporation (NEO: NETZ) (OTCQB: OFSTF) (FSE: M2Q) (“Carbon Streaming” or the “Company”) is pleased to provide a general corporate update.

Justin Cochrane, Founder and CEO stated: “This week marks the one-year anniversary of Carbon Streaming’s public listing on the NEO Exchange. I am proud of the company we are building as we continue to grow and diversify our stream investments, advance our project pipeline, and build internal capabilities. We are excited to see our partners advancing projects, with MarVivo Blue Carbon recently reaching another project milestone”.

Mr. Cochrane continued, “Near term, we are excited by the sustained organic growth potential as 10 or more projects for which we have stream investments are expecting credit issuance by the end of 2023. We look forward to continued collaboration with our project partners and forging productive new partnerships with operators and corporate clients as we advance the collective agenda to ensure a net-zero future.”

Carbon Credit Stream Portfolio Summary

Carbon Streaming continues to build a high quality, diversified portfolio of carbon credit streams and investments. The portfolio has now grown to comprise six streams, covering 13 carbon projects across four continents, with carbon credits expected to be issued from 10 or more carbon projects by the end of 2023. A summary of the portfolio is provided in the following table.

SUMMARY OF KEY STREAM TERMS

Stream

Project Description

Upfront Deposit(1)
(US$)

Initial Term(2)

Rimba Raya One of the world’s first and largest initiatives to protect tropical lowland peat swamp forests

$26.3 million(3)(4)

20 years

MarVivo Blue Carbon

Blue carbon mangrove forest and associated marine habitat conservation

$6.0 million(4)

30 years

Cerrado Biome

Scale up project to avoid the conversion of native forest and grasslands to commercial agriculture in the Cerrado Biome

$0.5 million

30 years

Biochar Carbon Removals

Reduction of GHG emissions through establishing and maintaining a thermal wood conversion facility where waste fines and sawdust will be converted into Biochar

$1.35 million

25 years

Cookstoves & Water Filtration Portfolio
(7 Projects)(5)

Portfolio of energy-saving projects, deploying cookstove and water filtration devices.
The cookstove projects are located in Mozambique, Uganda and Tanzania and the water filtration projects are located in Malawi, Mozambique, Uganda and Zambia.

$20.0 million

15 years

Sustainable Community
(2 Projects)

Grouped projects enroll and reward members for GHG emission reductions through waste diversion, conversion and energy efficiency initiatives, with plans to expand into transport.

$20.0 million

10 years(6)

Notes:
1 Upfront deposit amounts assume all milestones will be realized and all installments paid in full.
2 Term typically commences upon delivery of first credits and term can be extended should the project continue to issue credits.
3 Includes cash amounts attributable to Strategic Alliance Agreement (excluding value of share consideration granted thereafter).
4 Subject to the formal exercise by Osisko Gold Royalties (“Osisko”) of stream participation rights whereby Osisko would pay 20% of the upfront payment(s) and receive 20% of the applicable stream and carbon credits.
5 Stream agreement subject to closing.
6 Under stream, Company to receive up to 44.1 million credits, which is expected to occur within 10 years.

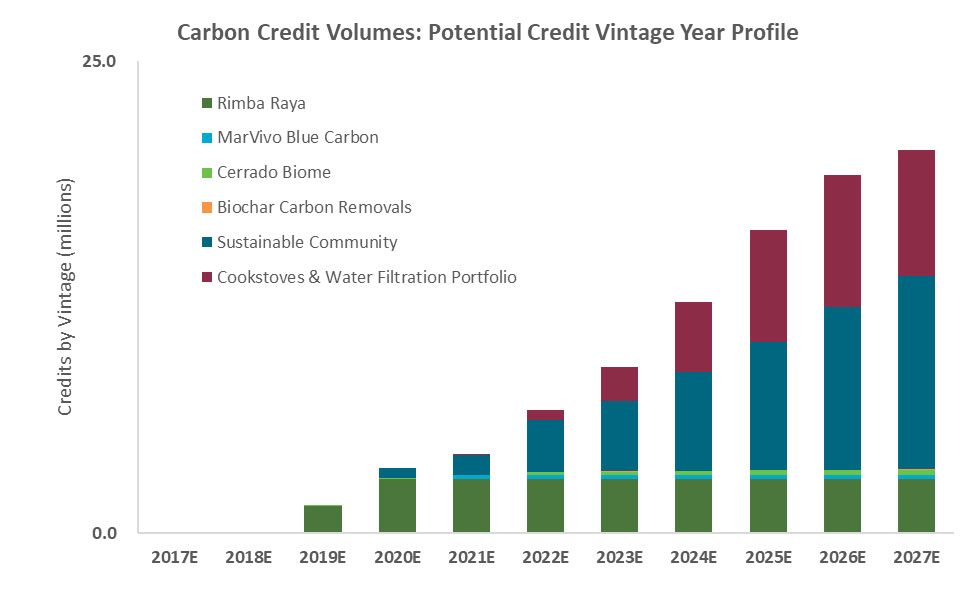
Carbon Streaming had a successful year applying the streaming model to voluntary carbon credit financing, which has enabled the Company to build a diversified portfolio of world class projects, with significant organic growth potential. The figure below illustrates the Company’s carbon credit volume profile by vintage year, with credit volumes from the current portfolio expected to surpass 20 million carbon credits by the 2027 vintage year and growing beyond.

On an ongoing basis, annual carbon credit issuances generally occur six to 12 months following the vintage year for which the credits are verified. The initial issuances of credits for projects generally incorporate multiple vintages due to the nature of the initial validation and verification processes. Once carbon credits are issued, the Company anticipates selling those credits over the following 12 month period, prior to the next annual credit issuance.

Sugar Maple Tree Reforestation Term Sheet Funding

In July, Carbon Streaming executed a term sheet to provide C$400,000 of upfront funding to the Citadelle Maple Syrup Producers’ Cooperative (“Citadelle”) for a grouped sugar maple Afforestation, Reforestation, Revegetation (ARR) and ecosystem restoration project in Quebec, Canada. Established in 1925, Citadelle is a dynamic agroforestry cooperative of over 1,500 members who tap sugar maple trees on their lands to produce maple syrup and is one of the largest suppliers of 100% pure maple syrup globally.

Citadelle is working with project operator Down to Earth Carbon Ltd. (“DTEC”), a full cycle climate forest project originator, to afforest members’ lands to provide structural biodiversity, enhanced watershed restoration values and sequestration of carbon from the atmosphere. Citadelle is also partnering with One Tree Planted (“OTP”), a non-profit organization focused on global reforestation, who will be contributing to the funding of each tree planted. The initial funding from Carbon Streaming is designed to enable Citadelle, DTEC and OTP to achieve the Fall 2022 and Spring 2023 planting windows and positions Carbon Streaming with a right of first refusal on future carbon credit-based financings.

MarVivo Achieves First Funding Milestone

In June, the MarVivo Blue Carbon Conservation Project (“MarVivo Project”) achieved its second development milestone. The Company has a stream over the MarVivo Project located in Magdalena Bay in Baja California Sur, Mexico. The MarVivo Project is focused on the conservation of mangrove forests and their associated marine habitat, and is anticipated to be one of the largest blue carbon conservation projects in the world.

The US$6 million stream consists of a US$2 million installment paid upon closing, followed by four separate US$1 million payments based on specific project milestones being met during development, implementation, validation, and verification by Verra of the project. Upon achieving the second development milestone in June 2022, the Company made the next installment payment of US$1 million to MarVivo Corporation.

About Carbon Streaming

Carbon Streaming is an ESG principled company offering investors exposure to carbon credits, a key instrument used by both governments and corporations to achieve their carbon neutral and net-zero climate goals. Our business model is focused on acquiring, managing and growing a high-quality and diversified portfolio of investments in projects and/or companies that generate or are actively involved, directly or indirectly, with voluntary and/or compliance carbon credits.

The Company invests capital through carbon credit streaming arrangements with project developers and owners to accelerate the creation of carbon offset projects by bringing capital to projects that might not otherwise be developed. Many of these projects have significant social and economic co-benefits in addition to their carbon reduction or removal potential.

The Company has executed carbon credit streaming agreements related to over 10 projects around the globe, including nature-based, biochar, methane avoidance, clean cookstove and water filtration projects.

To receive corporate updates via e-mail, please subscribe here.

Cautionary Statement Regarding Forward-Looking Information

This news release contains certain forward-looking statements and forward-looking information (collectively, “forward-looking information”) within the meaning of applicable securities laws. All statements, other than statements of historical fact, that address activities, events or developments that the Company believes, expects or anticipates will or may occur in the future, including, without limitation, statements and figures with respect to the amount of emission reductions or removals and expected number of carbon credits generated by the Company’s portfolio of projects; the timing and closing of the Cookstove & Water Filtration portfolio stream; the ability for the projects to be independently verified and registered; the timing of delivery of carbon credits under the various streams; expected timelines for the sale of carbon credits; and statements with respect to execution of the Company’s portfolio and partnership strategy.

When used in this news release, words such as “estimates”, “expects”, “plans”, “anticipates”, “will”, “believes”, “intends” “should”, “could”, “may” and other similar terminology are intended to identify such forward-looking statements. This forward-looking information is based on the current expectations or beliefs of the Company based on information currently available to the Company. Forward-looking information is subject to a number of risks and uncertainties that may cause the actual results of the Company to differ materially from those discussed in the forward-looking information, and even if such actual results are realized or substantially realized, there can be no assurance that they will have the expected consequences to, or effects on, the Company. They should not be read as a guarantee of future performance or results, and will not necessarily be an accurate indication of whether or not such results will be achieved. Factors that could cause actual results or events to differ materially from current expectations include, among other things: dependence on key management; limited operating history for the Company’s current strategy; concentration risk; inaccurate estimates of growth strategy, including the ability of the Company to source appropriate opportunities/investments; volatility in prices of carbon credits and demand for carbon credits; general economic, market and business conditions; failure or timing delays for projects to be validated and ultimately developed or greenhouse gases emissions reductions and removals to be verified and carbon credits issued; uncertainties and ongoing market developments surrounding the regulatory framework applied to the verification, and cancellation of carbon credits and the Company’s ability to be, and remain, in compliance; actions by governmental authorities, including changes in or to government regulation, taxation and carbon pricing initiatives; uncertainties surrounding the ongoing impact of the COVID-19 pandemic; foreign operations and political risks; risks arising from competition and future acquisition activities; due diligence risks, including failure of third parties’ reviews, reports and projections to be accurate; global financial conditions, including fluctuations in interest rates, foreign exchange rates and stock market volatility; dependence on project developers, operators and owners, including failure by such counterparties to make payments or perform their operational or other obligations to the Company in compliance with the terms of contractual arrangements between the Company and such counterparties; failure of projects to generate carbon credits, or natural disasters such as flood or fire which could have a material adverse effect on the ability of any project to generate carbon credits; change in social or political views towards climate change and subsequent changes in corporate or government policies or regulations; operating and capital costs; potential conflicts of interest; unforeseen title defects; the Company’s ability to complete proposed acquisitions and the impact of such acquisitions on the Company’s business; anticipated future sources of funds to meet working capital requirements; future capital expenditures and contractual commitments; expectations regarding the Company’s growth and results of operations; the Company’s dividend policy; volatility in the market price of the Company’s common shares or warrants; the effect that the issuance of additional securities by the Company could have on the market price of the Company’s common shares or warrants; and the other risks disclosed under the heading “Risk Factors” and elsewhere in the Company’s Annual Information Form dated as of September 27, 2021 filed on SEDAR at www.sedar.com. These risks, as well as others, could cause actual results and events to vary significantly. Accordingly, readers should exercise caution in relying upon forward-looking statements and the Company undertakes no obligation to publicly revise them to reflect subsequent events or circumstances, except as required by law.


Contacts

ON BEHALF OF THE COMPANY:
Justin Cochrane, Chief Executive Officer
Tel: 647.846.7765
This email address is being protected from spambots. You need JavaScript enabled to view it.
www.carbonstreaming.com

Investor Relations
Andrea Cheung, VP, Investor Relations
This email address is being protected from spambots. You need JavaScript enabled to view it.

Media
Amy Chambers, Director, Marketing, Communications & Sustainability
This email address is being protected from spambots. You need JavaScript enabled to view it.

Offshore Source Logo

Offshore Source keeps you updated with relevant information concerning the Offshore Energy Sector.

Any views or opinions represented on this website belong solely to the author and do not represent those of the people, institutions or organizations that Offshore Source or collaborators may or may not have been associated with in a professional or personal capacity, unless explicitly stated.

Corporate Offices

Technology Systems Corporation
8502 SW Kansas Ave
Stuart, FL 34997

info@tscpublishing.com