Business Wire News

ComEd continues to deliver new infrastructure needed to support the growing data center industry in northern Illinois

FRANKLIN PARK, Ill.--(BUSINESS WIRE)--ComEd today joined Digital Realty, the largest global provider of cloud- and carrier-neutral data center, colocation, and interconnection solutions, and community members to cut the ribbon on a new electrical substation that provides more power capacity to support future growth and operation of data centers in the region. The 4-acre substation is located on Digital Realty’s data center campus and delivers new transformer technology and electrical upgrades that are essential to meeting growing demand.

The new substation marks another milestone in ComEd’s work to support the growth of the data center industry in northern Illinois, which has seen meteoric growth in recent years. ComEd has supported the launch of 16 new data center projects in the past two years, including six projects in 2021 alone which are bringing more than $2 billion in local capital investment to the region.

"Through our continued investments to modernize grid infrastructure, ComEd is delivering reliable, clean and affordable power that 9 million people count on, while making our region more attractive for new investment and the jobs that come with it," said Gil Quiniones, CEO of ComEd. “We know that data centers have many location options, but companies like Digital Realty continue to choose northern Illinois thanks to the state’s incentives as well as the investments we’re making to deliver industry-leading reliability, with access to infrastructure and clean energy needed to meet the demands of today’s customers. We thank Digital Realty for their continued confidence in northern Illinois and look forward to supporting their continued growth in the area.”

Digital Realty has over 300 facilities in 27 countries across six continents. The Franklin Park facility is one of seven sites the company owns in northern Illinois, and plans are underway to expand an existing site in Chicago’s South Loop. The commissioning of the new substation in Franklin Park will help Digital Realty meet growing customer demand as the company expands its footprint to serve additional customers.

“Northern Illinois and Franklin Park, in particular, are critical to Digital Realty’s and our customer’s businesses,” said Bill Stein, CEO of Digital Realty. “We look forward to continued partnership with ComEd and others throughout the region to ensure our data center facilities deliver on the needs of our global customers while continuing to drive economic benefits for those in the region.”

Hundreds of ComEd employees and its contractors logged a total of over 60,000 hours designing and building the substation. Construction was led by general contractor, MJ Electric, with participation by several diverse-owned, local suppliers, including Heels and Hard Hats, Stevenson Energy and Sonoma Underground Services. New transmission system improvements, including delivery of new transformers, will support Digital Realty’s campus and customers through enhanced regional reliability.

“We are grateful that ComEd has provided our community with the infrastructure to power new growth industries in Franklin Park. Your support has allowed us to foster valuable partnerships with companies like Digital Realty,” said Franklin Park Mayor Barrett Pedersen. “Together, we have kickstarted the revitalization of the eastern stretch of Grand Avenue with the removal of dated utility poles and the introduction of a state-of-the-art, high technology campus that Digital Realty calls home. We look forward to continuing this partnership and creating new opportunities for quality employment, redevelopment, and beautification in Franklin Park.”

This project marks the latest in a series of new substations created to establish the infrastructure needed to accommodate rapid growth of data centers and other industries in northern Illinois. Investments in infrastructure are helping yield the highest levels of reliability in ComEd’s history – with ComEd delivering record-high reliability performance for first nine months of 2022, and customers today seeing fewer outages than ever before as a result. Overall, investments to strengthen the grid over the past decade have helped customers to avoid 18.8 million outages, contributing to $3 billion in savings due to avoided outages.

Data centers continue to thrive in the region, thanks to relatively few natural disasters, competitive costs that fall lower than other metropolitan areas, and a new state data center incentive enacted in 2019. ComEd currently powers over 70 data centers in the region, and thanks to trending growth, the Chicago metro area is ranked in the top five for global data center markets.

ComEd is a unit of Chicago-based Exelon Corporation (NASDAQ: EXC), a Fortune 200 energy company with approximately 10 million electricity and natural gas customers – the largest number of customers in the U.S. ComEd powers the lives of more than 4 million customers across northern Illinois, or 70 percent of the state’s population. For more information visit ComEd.com, and connect with the company on Facebook, Twitter, Instagram and YouTube.


Contacts

ComEd
Media Relations
312-394-3500

Companies will address technology challenges and train talent to apply Web3 to solve social issues

TOKYO--(BUSINESS WIRE)--NTT DOCOMO and Accenture (NYSE: ACN) are collaborating to accelerate the adoption and application of Web3 for addressing social issues.


Web3 is a new iteration of the web driven by blockchain technology. It has the potential to form a new digital economy with a greater social impact than conventional economies, providing clearly defined benefits and secure environments for success.

Together, NTT DOCOMO and Accenture will:

  • Promote ESG (Environmental, Social and Governance) Issues. Diverse and long-term stakeholder collaboration is necessary to help solve many societal issues, including those related to regional development. The two companies will create case studies for addressing ESG issues — including the United Nation’s Sustainable Development Goals.
  • Establish a secure technology platform for Web3. Web3 is a way of utilizing technologies to enable new products, services, and community building. The companies will work together to develop and grow a secure technology platform that creates an environment where people can use these new technologies easily and safely. The work together will identify and resolve the challenges facing these emerging technologies.
  • Develop talent. To address the growing demand for Web3 talent, the companies will provide training courses for those interested in working in the Web3 field, including engineers and business leaders. This approach will create a community for professionals and organizations alike to learn and gain practical experience in Web3.

NTT DOCOMO will bring its expertise in telecommunications networks and digital services, as well as its experience working on society-wide issues. Accenture will help build an operational foundation for the initiatives with a view to future global expansion, leveraging the knowledge gained through its work on regional development efforts, including that with Aizu Wakamatsu City in Fukushima.

Web3 is already being used in Japan to provide valuable solutions for society. For instance, it’s being used to help companies and government streamline the carbon credit markets as a way to address climate change.

The ultimate goal of the collaboration between NTT DOCOMO and Accenture is to facilitate the adoption of Web3 globally — enabling everyone to enjoy its advantages and benefits — while positioning Japan as a leading Web3 market.

Motoyuki Ii, president & CEO, NTT DOCOMO said, “Web3 is the most impactful technological development since the Internet. DOCOMO, in collaboration with Accenture, will revolutionize social infrastructure by utilizing blockchain and building a safe and secure Web3 environment. We will build an environment where the power of creators and developers can come together. We are glad to be promoting the Japan-developed Web3, and we welcome individuals and companies to join us in the global development of Web3 services.”

Atsushi Egawa, a senior managing director at Accenture who leads its business in Japan, said, “Our collaboration with NTT DOCOMO is designed to create an industry platform leveraging blockchain and other digital technologies. At Accenture, we use digital technologies to help our clients achieve 360° value — which includes issues related to sustainability, inclusion and diversity, and delivering exceptional experiences. We will help accelerate adoption of Web3 by leveraging the expertise we have gained in regional development through our collaborations with stakeholders from industry, government and academia.”

About NTT DOCOMO
NTT DOCOMO, Japan's leading mobile operator with over 84 million subscriptions, is one of the world's foremost contributors to 3G, 4G and 5G mobile network technologies. Beyond core communications services, DOCOMO is challenging new frontiers in collaboration with a growing number of entities ("+d" partners), creating exciting and convenient value-added services that change the way people live and work. Under a medium-term plan toward 2020 and beyond, DOCOMO is pioneering a leading-edge 5G network to facilitate innovative services that will amaze and inspire customers beyond their expectations. https://www.docomo.ne.jp/english/

About Accenture
Accenture is a global professional services company with leading capabilities in digital, cloud and security. Combining unmatched experience and specialized skills across more than 40 industries, we offer Strategy and Consulting, Technology and Operations services and Accenture Song — all powered by the world’s largest network of Advanced Technology and Intelligent Operations centers. Our 721,000 people deliver on the promise of technology and human ingenuity every day, serving clients in more than 120 countries. We embrace the power of change to create value and shared success for our clients, people, shareholders, partners and communities. Visit us at www.accenture.com.

Copyright © 2022 Accenture. All rights reserved. Accenture and its logo are trademarks of Accenture.


Contacts

Ryoichi Sakurai or Yasutaka Imai
NTT DOCOMO
+81 3 5156 1366
This email address is being protected from spambots. You need JavaScript enabled to view it.

Kentaro Kanda
Accenture Japan
+81 45 330 7157
This email address is being protected from spambots. You need JavaScript enabled to view it.

DALLAS--(BUSINESS WIRE)--Granite Ridge Resources, Inc. (“Granite Ridge”) (NYSE:GRNT) today announced its third quarter 2022 earnings news release is scheduled to be issued before the open of trading on the New York Stock Exchange on Monday, November 14, 2022.


A conference call is scheduled for Monday, November 14, 2022 at 11:00 a.m. Eastern Standard Time to discuss the third quarter combined pro forma results. Instructions on how to access the call and relevant accompanying disclosures are shown below.

Internet: We encourage participants to pre-register for the webcast using the following link https://events.q4inc.com/attendee/432451518. Alternatively, at www.graniteridge.com select “Investors” then “Earnings & Webcasts” to listen to the discussion and view the press release.

Telephone: Dial (888) 660-6093 (or (929) 203-0844 for international callers) and enter confirmation code 4127559 five minutes before the call. Additional disclosures are available via Granite Ridge’s internet address above.

A transcript of the conference call will be archived on Granite Ridge’s website. Alternatively, an audio replay will be available through November 28, 2022. To access the audio replay dial (800) 770-2030 and enter confirmation code 4127559.

About Granite Ridge

Granite Ridge is a scaled, non-operated oil & gas exploration and production company. We invest in a diversified portfolio of production and top-tier acreage across the Permian and four other prolific US basins in partnership with proven operators. We create value by generating sustainable full-cycle risk adjusted returns for investors, offering a rewarding experience for our team, and delivering reliable energy solutions to all – safely and responsibly. For more information, visit Granite Ridge’s website at www.graniteridge.com.


Contacts

Investor and Media Contact: This email address is being protected from spambots. You need JavaScript enabled to view it. – (214) 396-2850

DALLAS--(BUSINESS WIRE)--Kosmos Energy Ltd. (“Kosmos” or the “Company”) (NYSE/LSE: KOS) announced today its financial and operating results for the third quarter of 2022. For the quarter, the Company generated a net income of $222 million, or $0.47 per diluted share. When adjusted for certain items that impact the comparability of results, the Company generated an adjusted net income(1) of $90 million, or $0.19 per diluted share for the third quarter of 2022.


THIRD QUARTER 2022 HIGHLIGHTS

  • Net Production(2): ~60,900 barrels of oil equivalent per day (boepd), up ~20% over 3Q 2021, with sales of ~50,900 boepd resulting in an underlift position at the end of the quarter
  • Revenues: $456 million, or $97.34 per boe (excluding the impact of derivative cash settlements)
  • Production expense: $62 million, or $13.31 per boe
  • Capital expenditures: $203 million
  • Generated free cash flow(1) of approximately $32 million (~$320 million for the first nine months of the year)
  • Continued debt repayment with net leverage falling to ~1.5x
  • Phase One of the Greater Tortue Ahmeyim LNG project around 85% complete at quarter end

Commenting on the Company’s third quarter 2022 performance, Chairman and Chief Executive Officer Andrew G. Inglis said: “Kosmos posted another quarter of solid strategic and operational delivery, with the company reaching its year-end leverage target ahead of schedule.

Importantly, we continue to make good progress on our three core development projects -- Tortue Phase 1, Jubilee Southeast and Winterfell -- which we expect will collectively grow production approximately 50% by 2024. We are also advancing several other gas opportunities in West Africa, which we believe will drive growth beyond 2024 and continue to increase the gas weighting of the portfolio.

Demand for energy is growing, particularly in Africa, and Kosmos has the right strategy at the right time to help meet this growing demand while creating value for all of our stakeholders. Given the quality of our asset base and the wealth of opportunities within our differentiated portfolio, we believe Kosmos has an important role to play in delivering affordable, secure and cleaner energy to the world.”

FINANCIAL UPDATE

Net capital expenditure for the third quarter of 2022 was approximately $203 million. Full year capital expenditure guidance for 2022 remains around $700 million, excluding acquisitions and divestitures.

Kosmos exited the third quarter of 2022 with $2.1 billion of net debt(1) and available liquidity of approximately $1.0 billion. The Company generated $32 million of free cash flow in the third quarter, and around $320 million through the first nine months of the year. With EBITDAX(1) for the quarter almost four times higher than the same quarter last year and continued net debt reduction through 2022, the Company achieved its target net leverage ratio of 1.5x ahead of schedule with further progress expected in the next quarter at current prices.

OPERATIONAL UPDATE

Production

Total net production(2) in the third quarter of 2022 averaged approximately 60,900 boepd, in line with guidance. The Company exited the quarter in a net underlift position, which we expect to reverse in the fourth quarter.

Ghana

Production in Ghana averaged approximately 36,900 barrels of oil per day (bopd) net in the third quarter of 2022. Kosmos lifted three cargos from Ghana during the quarter, in line with guidance.

At Jubilee, production averaged approximately 88,900 bopd gross during the quarter. At TEN, production averaged approximately 22,200 bopd gross for the third quarter.

At the beginning of the third quarter, the handover of the Jubilee FPSO operations and maintenance from MODEC took place. Since the transition, operating performance has continued to be strong with no reportable safety incidents and facility uptime of over 98%. In addition, several potential future cost savings have been identified, primarily through direct contracting, optimizing work scope and competitive re-tendering.

The Jubilee Southeast development continues to progress and is now over 50% complete. Drilling of the first well has commenced ahead of schedule with all three wells expected to be drilled by early 2023. Completion of the wells is planned for the first half of 2023, with initial production expected around mid-2023. The partnership expects the new wells to increase gross production in the field to approximately 100,000 bopd.

At TEN, an Enyenra producer well (EN-21) was drilled and came online around the end of the quarter and has now been choked back, awaiting pressure support from the nearby water injection well.

Post quarter-end, the partnership drilled the second of the two riser base wells (NT-11) to define the extent of the Ntomme reservoir supporting further development of the TEN fields. The well encountered approximately 5 meters of net oil pay with poorer than expected reservoir quality. The partnership will continue to evaluate the full results of the two wells to high-grade and optimize the future drilling plans for TEN, with a focus on proven accumulations and areas with existing well control.

U.S. Gulf of Mexico

Production in the U.S. Gulf of Mexico averaged approximately 14,700 boepd net (~83% oil) during the third quarter.

The scheduled drydock of the Helix Producer-1 vessel resulted in around 45 days of downtime for the Tornado field in the third quarter as expected. Production from the Tornado field was also impacted late in the third quarter and early in the fourth quarter by loop currents in the Gulf of Mexico.

The planned Delta House turnaround took place at the beginning of the third quarter and was completed mid-October, partially extended due to the impact of Hurricane Ian. In late October, the facility saw approximately two weeks of unplanned downtime due to an issue with the gas compressors. The issue has now been resolved with the impact factored into fourth quarter and full year guidance.

The Kodiak sidetrack well was drilled during the second quarter and successfully brought online in early September. Well results and initial production were in line with expectations, however well productivity declined through the end of the third quarter and workover plans are being developed.

Following the planned and unplanned downtime, production in the Gulf of Mexico was restored to around 18,000 boepd in early November.

At the end of the second quarter, Kosmos, as the operator of the Odd Job field, executed a contract to fabricate and install a multi-phase subsea pump, which is planned to enhance recovery and boost production in the Odd Job field from mid-2024. Work began on the project early in the third quarter, which is an important step in sustaining the long-term performance of the field.

During the third quarter of 2022, Kosmos completed the acquisition of an additional 3.2% interest in the Winterfell area in Green Canyon Blocks 943, 944, 987 and 988 and an additional 1.4% interest in Green Canyon Blocks 899 and 900. The acquisition takes Kosmos' overall interest in Winterfell to 25% in total.

The Winterfell partners signed the field development plan in September and the operator has signed a rig commitment letter to drill and complete three wells starting mid-2023. The host facility production handling agreement and midstream export agreement are also expected to be completed within the next several months, supporting first oil targeted at the end of the first quarter in 2024.

Equatorial Guinea

Production in Equatorial Guinea averaged approximately 29,700 bopd gross and 9,300 bopd net in the third quarter of 2022. As forecasted, Kosmos lifted 0.5 cargo from Equatorial Guinea during the quarter.

In late-August, the partnership entered into a rig contract for the next drilling campaign, which is expected to begin in the second half of 2023, targeting 2-3 infill wells in Block G and an infrastructure led exploration (ILX) well.

At the beginning of the fourth quarter, the second 2022 electrical submersible pump ("ESP") installation began, which is expected to support current production levels through year-end into 2023.

In October, Panoro Energy ASA ("Panoro") agreed to farm-in to the Kosmos-operated Block S offshore Equatorial Guinea for a 12% non-operated participating interest. Panoro’s farm-in is conditional on the basis that it will acquire a 6% participating interest from each of Kosmos and Trident Energy, ahead of drilling an ILX well in early 2024.

Mauritania & Senegal

Phase 1 of the Greater Tortue Ahmeyim liquified natural gas (LNG) project continues to make good progress and was around 85% complete at quarter-end with the following updates across the key workstreams:

  • Hub Terminal: Largely complete with the living quarters platform installed and commissioning activities commenced
  • Drilling: Successfully drilled all four wells with expected production capacity estimated at ~700 million standard cubic feet of gas per day, significantly more than the ~400 million standard cubic feet per day needed for Phase 1 liquefaction volumes. One well was recently successfully completed and has flowed back to the rig for a short clean-up period.
  • FLNG: On track for sailaway in first half of 2023 as construction and mechanical completion activities continue and commissioning work has begun
  • Subsea: Shallow water gas export pipeline from the FPSO to the hub terminal has been installed. The deepwater pipelay vessel is in the region conducting final testing prior to mobilization which is expected in the coming weeks to lay the deepwater pipeline and in-field flowlines
  • FPSO: In September 2022, Typhoon Muifa passed through the COSCO shipyard in Qidong in China causing the mooring lines of the vessel to become compromised. As a result, the vessel drifted approximately 200 meters off the quayside. The FPSO has been returned to the quayside and inspections conducted to date have not identified any significant damage. The forward plan is to complete all inspections and incorporate any findings into mechanical completion activities along with commissioning work prior to sailaway, which is expected around the end of the year

The operator is working hard and making good progress to overcome the challenges from Covid, supply chain constraints and more recently Typhoon Muifa. We expect first gas around nine months from the FPSO sailaway and continue to target first LNG around year-end 2023.

To optimize the commercial value of sales for the gas production from the first phase of Greater Tortue Ahmeyim, Kosmos has commenced a process with prospective buyers to utilize existing contractual rights under our Phase 1 LNG sales agreement to potentially sell cargos in order to benefit from the robust forward gas price outlook. We are seeing significant interest in the opportunity and will provide further updates as the discussions mature.

The plans to develop Phase 2 of the Greater Tortue Ahmeyim LNG project continue to progress. Kosmos is in advanced discussions with partners, BP, Petrosen, SMH and the two governments on the right concept. In light of the rapidly evolving global LNG markets, the governments are rightly considering the importance of their gas resource and the opportunity to build new government-to-government relationships. The partnership's aim in the coming months is to agree the right low cost solution, which leverages the infrastructure from Phase 1 and allows the partnership to access attractive gas marketing opportunities.

In mid-October, Kosmos and BP (operator) signed a new Production Sharing Contract (“PSC”) with the Government of Mauritania covering the BirAllah and/or Orca discoveries. The new PSC provides up to 30 months to submit a development plan covering these discoveries with the terms of the new PSC substantially similar to the former PSC for Block C8.

At Yakaar-Teranga, the partnership continues to advance the first phase development concept with the Government of Senegal focused on a domestic gas solution.

(1) A Non-GAAP measure, see attached reconciliation of non-GAAP measure.
(2) Production means net entitlement volumes. In Ghana and Equatorial Guinea, this means those volumes net to Kosmos' working interest or participating interest and net of royalty or production sharing contract effect. In the Gulf of Mexico, this means those volumes net to Kosmos' working interest and net of royalty.

Conference Call and Webcast Information

Kosmos will host a conference call and webcast to discuss third quarter 2022 financial and operating results today at 10:00 a.m. Central time (11:00 a.m. Eastern time). The live webcast of the event can be accessed on the Investors page of Kosmos’ website at http://investors.kosmosenergy.com/investor-events. The dial-in telephone number for the call is +1-877-407-0784. Callers in the United Kingdom should call 0800 756 3429. Callers outside the United States should dial +1-201-689-8560. A replay of the webcast will be available on the Investors page of Kosmos’ website for approximately 90 days following the event.

About Kosmos Energy

Kosmos is a full-cycle deepwater independent oil and gas exploration and production company focused along the Atlantic Margins. Our key assets include production offshore Ghana, Equatorial Guinea and the U.S. Gulf of Mexico, as well as a world-class gas development offshore Mauritania and Senegal. We also maintain a sustainable proven basin exploration program in Equatorial Guinea, Ghana and the U.S. Gulf of Mexico. Kosmos is listed on the New York Stock Exchange and London Stock Exchange and is traded under the ticker symbol KOS. As an ethical and transparent company, Kosmos is committed to doing things the right way. The Company’s Business Principles articulate our commitment to transparency, ethics, human rights, safety and the environment. Read more about this commitment in the Kosmos Sustainability Report. For additional information, visit www.kosmosenergy.com.

Non-GAAP Financial Measures

EBITDAX, Adjusted net income (loss), Adjusted net income (loss) per share, free cash flow, and net debt are supplemental non-GAAP financial measures used by management and external users of the Company's consolidated financial statements, such as industry analysts, investors, lenders and rating agencies. The Company defines EBITDAX as Net income (loss) plus (i) exploration expense, (ii) depletion, depreciation and amortization expense, (iii) equity based compensation expense, (iv) unrealized (gain) loss on commodity derivatives (realized losses are deducted and realized gains are added back), (v) (gain) loss on sale of oil and gas properties, (vi) interest (income) expense, (vii) income taxes, (viii) loss on extinguishment of debt, (ix) doubtful accounts expense and (x) similar other material items which management believes affect the comparability of operating results. The Company defines Adjusted net income (loss) as Net income (loss) adjusted for certain items that impact the comparability of results. The Company defines free cash flow as net cash provided by operating activities less Oil and gas assets, Other property, and certain other items that may affect the comparability of results and excludes non-recurring activity such as acquisitions, divestitures and NOC financing. The Company defines net debt as the sum of notes outstanding issued at par and borrowings on the RBL Facility, Corporate revolver, and GoM Term Loan less cash and cash equivalents and restricted cash.

We believe that EBITDAX, Adjusted net income (loss), Adjusted net income (loss) per share, free cash flow, Net debt and other similar measures are useful to investors because they are frequently used by securities analysts, investors and other interested parties in the evaluation of companies in the oil and gas sector and will provide investors with a useful tool for assessing the comparability between periods, among securities analysts, as well as company by company. EBITDAX, Adjusted net income (loss), Adjusted net income (loss) per share, free cash flow, and net debt as presented by us may not be comparable to similarly titled measures of other companies.

Forward-Looking Statements

This press release contains forward-looking statements within the meaning of Section 27A of the Securities Act of 1933 and Section 21E of the Securities Exchange Act of 1934. All statements, other than statements of historical facts, included in this press release that address activities, events or developments that Kosmos expects, believes or anticipates will or may occur in the future are forward-looking statements. Kosmos’ estimates and forward-looking statements are mainly based on its current expectations and estimates of future events and trends, which affect or may affect its businesses and operations. Although Kosmos believes that these estimates and forward-looking statements are based upon reasonable assumptions, they are subject to several risks and uncertainties and are made in light of information currently available to Kosmos. When used in this press release, the words “anticipate,” “believe,” “intend,” “expect,” “plan,” “will” or other similar words are intended to identify forward-looking statements. Such statements are subject to a number of assumptions, risks and uncertainties, many of which are beyond the control of Kosmos (including, but not limited to, the impact of the COVID-19 pandemic), which may cause actual results to differ materially from those implied or expressed by the forward-looking statements. Further information on such assumptions, risks and uncertainties is available in Kosmos’ Securities and Exchange Commission (“SEC”) filings. Kosmos undertakes no obligation and does not intend to update or correct these forward-looking statements to reflect events or circumstances occurring after the date of this press release, except as required by applicable law. You are cautioned not to place undue reliance on these forward-looking statements, which speak only as of the date of this press release. All forward-looking statements are qualified in their entirety by this cautionary statement.

Kosmos Energy Ltd.

Consolidated Statements of Operations

(In thousands, except per share amounts, unaudited)


Three Months Ended


Nine Months Ended


September 30,


September 30,


2022


2021


2022


2021

Revenues and other income:


Oil and gas revenue


$

456,056


$

198,936


$

1,735,439


$

759,455


Gain on sale of assets


1,538


471


1,564


Other income, net


48


66


143


210


Total revenues and other income


456,104


200,540


1,736,053


761,229


Costs and expenses:


Oil and gas production


62,372


50,316


277,264


211,871


Facilities insurance modifications, net


494


1,554


7,246


3,495


Exploration expenses


17,215


23,982


118,656


41,452


General and administrative


24,007


22,459


74,424


66,628


Depletion, depreciation and amortization


106,313


64,914


386,961


292,616


Interest and other financing costs, net


29,796


26,873


92,317


90,727


Derivatives, net


(113,842

)


38,224


243,534


252,606


Other expenses, net


(218

)


194


(1,320

)


1,003


Total costs and expenses


126,137


228,516


1,199,082


960,398


Income (loss) before income taxes


329,967


(27,976

)


536,971


(199,169

)

Income tax expense (benefit)


107,713


621


196,144


(22,617

)

Net income (loss)


$

222,254


$

(28,597

)


$

340,827


$

(176,552

)


Net income (loss) per share:


Basic


$

0.49


$

(0.07

)


$

0.75


$

(0.43

)

Diluted


$

0.47


$

(0.07

)


$

0.72


$

(0.43

)


Weighted average number of shares used to compute net income (loss) per share:


Basic


455,840


408,520


455,158


408,009


Diluted


476,431


408,520


474,820


408,009


Kosmos Energy Ltd.

Condensed Consolidated Balance Sheets

(In thousands, unaudited)


September 30,


December 31,


2022


2021

Assets


Current assets:


Cash and cash equivalents


$

231,565


$

131,620

Receivables, net


130,632


177,526

Other current assets


185,592


232,806

Total current assets


547,789


541,952


Property and equipment, net


4,138,667


4,183,987

Other non-current assets


234,956


214,712

Total assets


$

4,921,412


$

4,940,651


Liabilities and stockholders’ equity


Current liabilities:


Accounts payable


$

272,767


$

184,403

Accrued liabilities


252,196


250,670

Current maturities of long-term debt


30,000


30,000

Other current liabilities


37,477


65,879

Total current liabilities


592,440


530,952


Long-term liabilities:


Long-term debt, net


2,275,769


2,590,495

Deferred tax liabilities


629,755


711,038

Other non-current liabilities


529,957


578,929

Total long-term liabilities


3,435,481


3,880,462


Total stockholders’ equity


893,491


529,237

Total liabilities and stockholders’ equity


$

4,921,412


$

4,940,651

Kosmos Energy Ltd.

Condensed Consolidated Statements of Cash Flow

(In thousands, unaudited)


Three Months Ended


Nine Months Ended


September 30,


September 30,


2022


2021


2022


2021

Operating activities:


Net income (loss)


$

222,254


$

(28,597

)


$

340,827


$

(176,552

)

Adjustments to reconcile net income (loss) to net cash provided by (used in) operating activities:


Depletion, depreciation and amortization (including deferred financing costs)


108,890


67,511


394,799


300,404


Deferred income taxes


45,987


1,119


(37,445

)


(68,366

)

Unsuccessful well costs and leasehold impairments


9,424


11,907


83,086


16,772


Change in fair value of derivatives


(110,262

)


36,130


257,112


259,289


Cash settlements on derivatives, net(1)


(80,710

)


(53,640

)


(304,328

)


(150,255

)

Equity-based compensation


8,767


8,122


25,896


24,011


Gain on sale of assets


(1,538

)


(471

)


(1,564

)

Loss on extinguishment of debt


192


15,223


Other


(2,198

)


(2,097

)


(5,940

)


(2,763

)

Changes in assets and liabilities:


Net changes in working capital


52,898


(137,331

)


109,508


(72,358

)

Net cash provided by (used in) operating activities


255,050


(98,414

)


863,236


143,841


Investing activities


Oil and gas assets


(222,562

)


(87,311

)


(543,349

)


(377,850

)

Acquisition of oil and gas properties


(21,205

)


Proceeds on sale of assets


10


3,395


118,703


5,327


Notes receivable from partners


(16,760

)


(5,531

)


(28,188

)


(41,712

)

Net cash used in investing activities


(239,312

)


(89,447

)


(474,039

)


(414,235

)


Financing activities:


Borrowings under long-term debt


150,000


250,000


Payments on long-term debt


(7,500

)


(322,500

)


(400,000

)

Net proceeds from issuance of senior notes


444,375


Tax withholdings on restricted stock units


(63

)


(2,753

)


(1,100

)

Dividends


(68

)


(655

)


(512

)

Deferred financing costs


(229

)


(6,288

)


(17,291

)

Net cash provided by (used in) financing activities


(7,500

)


149,640


(332,196

)


275,472


Net increase (decrease) in cash, cash equivalents and restricted cash


8,238


(38,221

)


57,001


5,078


Cash, cash equivalents and restricted cash at beginning of period


223,659


193,063


174,896


149,764


Cash, cash equivalents and restricted cash at end of period


$

231,897


$

154,842


$

231,897


$

154,842


____________________________________
(1)

Cash settlements on commodity hedges were $(77.0) million and $(55.4) million for the three months ended September 30, 2022 and 2021, respectively, and $(289.9) million and $(142.9) million for the nine months ended September 30, 2022 and 2021, respectively.


Contacts

Investor Relations
Jamie Buckland
+44 (0) 203 954 2831
This email address is being protected from spambots. You need JavaScript enabled to view it.

Media Relations
Thomas Golembeski
+1-214-445-9674
This email address is being protected from spambots. You need JavaScript enabled to view it.


Read full story here

MILPITAS, Calif.--(BUSINESS WIRE)--SolarEdge Technologies, Inc. (Nasdaq: SEDG), a global leader in smart energy technology, today announced its financial results for the third quarter ended September 30, 2022.

Third Quarter 2022 Highlights

  • Record revenues of $836.7 million
  • Record revenues from solar segment of $788.6 million
  • GAAP gross margin of 26.5%
  • Non-GAAP gross margin of 27.3%
  • Gross margin from solar segment of 28.3%
  • Record GAAP operating profit of $84.4 million
  • Record non-GAAP operating profit of $120.2 million
  • GAAP net income of $24.7 million
  • Non-GAAP net income of $54.1 million
  • GAAP net diluted earnings per share (“EPS”) of $0.43
  • Non-GAAP net diluted EPS of $0.91
  • 2.7 Gigawatts (AC) of inverters shipped
  • 320.7 MWh of batteries shipped

“We are pleased with our third quarter results, setting new revenue and operating profit records. The results reflect extremely strong momentum in Europe where our revenues grew 90% compared to the same quarter last year,” said Zvi Lando, Chief Executive Officer of SolarEdge. “This quarter we increased production and were able to ship more units while increasing our operational efficiency and returning to a growth trajectory for our gross margins. We believe that the continued increase in manufacturing capacity in our existing manufacturing lines combined with our plans to establish a manufacturing footprint in the U.S. will allow us to capitalize on the strong demand we are experiencing globally.”

Third Quarter 2022 Summary

The Company reported record revenues of $836.7 million, up 15% from $727.8 million in the prior quarter and up 59% from $526.4 million in the same quarter last year.

Revenues from the solar segment were record $788.6 million, up 15% from $687.6 million in the prior quarter and up 65% from $476.8 million in the same quarter last year.

GAAP gross margin was 26.5%, up from 25.1% in the prior quarter and down from 32.8% in the same quarter last year.

Non-GAAP gross margin was 27.3%, up from 26.7% in the prior quarter and down from 34.0% in the same quarter last year.

Gross margin from the solar segment was 28.3%, up from 28.1% in the prior quarter and down from 36.6% in the same quarter last year.

GAAP operating expenses were $137.6 million, down 6% from $146.6 million in the prior quarter and up 30% from $106.1 million in the same quarter last year.

Non-GAAP operating expenses were $108.3 million, down 1% from $109.6 million in the prior quarter and up 29% from $83.8 million in the same quarter last year.

GAAP operating income was $84.4 million, up 134% from $36.0 million in the prior quarter and up 27% from $66.4 million in the same quarter last year.

Non-GAAP operating income was $120.2 million, up 42% from $84.7 million in the prior quarter and up 26% from $95.2 million in the same quarter last year.

GAAP net income was $24.7 million, up 64% from $15.1 million in the prior quarter and down 53% from $53.0 million in the same quarter last year.

Non-GAAP net income was $54.1 million, down 5% from $56.7 million in the prior quarter and down 34% from $82.1 million in the same quarter last year.

GAAP net diluted EPS was $0.43, up from $0.26 in the prior quarter and down from $0.96 in the same quarter last year.

Non-GAAP net diluted EPS was $0.91, down from $0.95 in the prior quarter and down from $1.45 in the same quarter last year.

Cash flow from operating activities was $5.6 million, down from $77.4 million in the prior quarter and down from $61.8 million in the same quarter last year.

As of September 30, 2022, cash, cash equivalents, bank deposits, restricted bank deposits and marketable securities totaled $937.6 million, net of debt, compared to $973.3 million on June 30, 2022.

Outlook for the Fourth Quarter 2022

The Company also provides guidance for the fourth quarter ending December 31, 2022 as follows:

  • Revenues to be within the range of $855 million to $885 million
  • Non-GAAP gross margin expected to be within the range of 27% to 30%
  • Non-GAAP operating profit to be within the range of $115 million to $135 million
  • Revenues from the solar segment to be within the range of $810 million to $840 million
  • Gross margin from the solar segment expected to be within the range of 28% to 31%

Conference Call

The Company will host a conference call to discuss these results at 4:30 p.m. ET on Monday, November 7, 2022. The call will be available, live, to interested parties by dialing 866-952-8559. For international callers, please dial +1 785-424-1743. The Conference ID is SEDG. A live webcast will also be available in the Investors Relations section of the Company’s website at: http://investors.solaredge.com.

A replay of the webcast will be available in the Investor Relations section of the Company’s web site approximately two hours after the conclusion of the call and will remain available for approximately 30 calendar days.

About SolarEdge

SolarEdge is a global leader in smart energy technology. By leveraging world-class engineering capabilities and with a relentless focus on innovation, SolarEdge creates smart energy solutions that power our lives and drive future progress. SolarEdge developed an intelligent inverter solution that changed the way power is harvested and managed in photovoltaic (PV) systems. The SolarEdge DC optimized inverter seeks to maximize power generation while lowering the cost of energy produced by the PV system. Continuing to advance smart energy, SolarEdge addresses a broad range of energy market segments through its PV, storage, EV charging, batteries, electric vehicle powertrains, and grid services solutions. SolarEdge is online at www.solaredge.com.

Use of Non-GAAP Financial Measures

The Company has presented certain non-GAAP financial measures in this release, such as non-GAAP net income, non-GAAP net diluted EPS, non-GAAP gross margin, non-GAAP operating expenses, non-GAAP operating income and non-GAAP gross margin from sale of solar products. Generally, a non-GAAP financial measure is a numerical measure of a company's performance, financial position, or cash flows that either exclude or include amounts that are not normally excluded or included in the most directly comparable measure calculated and presented in accordance with generally accepted accounting principles in the United States, or GAAP. Reconciliation of each non-GAAP financial measure to the most directly comparable GAAP financial measure can be found in the accompanying tables to this release. These non-GAAP financial measures do not reflect a comprehensive system of accounting, differ from GAAP measures with the same captions and may differ from non-GAAP financial measures with the same or similar captions that are used by other companies. As such, these non-GAAP measures should be considered as a supplement to, and not as a substitute for, or superior to, financial measures calculated in accordance with GAAP.

The Company uses these non-GAAP financial measures to analyze its operating performance and future prospects, develop internal budgets and financial goals, and to facilitate period-to-period comparisons. The Company believes that these non-GAAP financial measures reflect an additional way of viewing aspects of its operations that, when viewed with its GAAP results, provide a more complete understanding of factors and trends affecting its business.

Safe Harbor Statement under the Private Securities Litigation Reform Act of 1995

This release contains forward-looking statements which are made pursuant to the safe harbor provisions of the Private Securities Litigation Reform Act of 1995. These forward-looking statements include information, among other things, concerning: our possible or assumed future results of operations; future demands for solar energy solutions; business strategies; technology developments; financing and investment plans; dividend policy; competitive position; industry and regulatory environment; general economic conditions; potential growth opportunities; and the effects of competition. These forward-looking statements are often characterized by the use of words such as “anticipate,” “believe,” “could,” “seek,” “estimate,” “expect,” “intend,” “may,” “plan,” “potential,” “predict,” “project,” “should,” “will,” “would” or similar expressions and the negative or plural of those terms and other like terminology.

Forward-looking statements are only predictions based on our current expectations and our projections about future events. These forward-looking statements involve known and unknown risks, uncertainties and other factors that may cause our actual results, levels of activity, performance or achievements to be materially different from those expressed or implied by the forward-looking statements. Given these factors, you should not place undue reliance on these forward-looking statements. These factors include, but are not limited to, the matters discussed in the section entitled “Risk Factors” of our Annual Report on Form 10-K for the year ended December 31, 2021, filed on February 22, 2022 and our quarterly reports filed on Form 10-Q, Current Reports on Form 8-K and other reports filed with the SEC. All information set forth in this release is as of November 7, 2022. The Company undertakes no duty or obligation to update any forward-looking statements contained in this release as a result of new information, future events or changes in its expectations.

SOLAREDGE TECHNOLOGIES INC.

CONDENSED CONSOLIDATED STATEMENTS OF INCOME (Unaudited)

(in thousands, except per share data)


Three Months Ended

September 30,


Nine Months Ended

September 30,


2022


2021


2022


2021

Revenues


$

836,723


$

526,404


$

2,219,577


$

1,411,950


Cost of revenues


614,722


353,843


1,635,976


943,123


Gross profit


222,001


172,561


583,601


468,827


Operating expenses:


Research and development


69,659


55,666


210,855


155,307


Sales and marketing


42,726


29,383


117,017


85,752


General and administrative


27,933


21,098


82,483


60,317


Other operating expenses (income), net


(2,724

)


1,963


1,350


Total operating expenses


137,594


106,147


412,318


302,726


Operating income


84,407


66,414


171,283


166,101


Financial expense, net


(33,025

)


(5,751

)


(52,785

)


(13,591

)

Other income


7,533


7,533


Income before income taxes


58,915


60,663


126,031


152,510


Income taxes


34,172


7,615


53,081


24,294


Net income


$

24,743


$

53,048


$

72,950


$

128,216


SOLAREDGE TECHNOLOGIES INC.

CONDENSED CONSOLIDATED BALANCE SHEETS (Unaudited)

(in thousands, except per share data)


September 30,

2022


December 31,

2021

ASSETS


CURRENT ASSETS:


Cash and cash equivalents


$

678,329


$

530,089


Marketable securities


202,598


167,728


Trade receivables, net of allowances of $4,283 and $2,626, respectively


785,325


456,339


Inventories, net


561,352


380,143


Prepaid expenses and other current assets


224,169


176,992


Total current assets


2,451,773


1,711,291


LONG-TERM ASSETS:


Marketable securities


688,753


482,228


Deferred tax assets, net


38,268


27,572


Property, plant and equipment, net


491,433


410,379


Operating lease right-of-use assets, net


62,535


47,137


Intangible assets, net


46,286


58,861


Goodwill


108,860


129,629


Other long-term assets


15,638


33,856


Total long-term assets


1,451,773


1,189,662


Total assets


3,903,546


2,900,953


LIABILITIES AND STOCKHOLDERS’ EQUITY


CURRENT LIABILITIES:


Trade payables, net


311,565


252,068


Employees and payroll accruals


71,905


74,465


Warranty obligations


97,222


71,480


Deferred revenues and customers advances


31,896


17,789


Accrued expenses and other current liabilities


181,892


109,379


Total current liabilities


694,480


525,181


LONG-TERM LIABILITIES:


Convertible senior notes, net


623,721


621,535


Warranty obligations


248,917


193,680


Deferred revenues


176,824


151,556


Finance lease liabilities


45,509


40,508


Operating lease liabilities


46,398


38,912


Other long-term liabilities


15,570


19,542


Total long-term liabilities


1,156,939


1,065,733


COMMITMENTS AND CONTINGENT LIABILITIES


STOCKHOLDERS’ EQUITY:


Common stock of $0.0001 par value - Authorized: 125,000,000 shares as of September 30, 2022 and December 31, 2021; issued and outstanding: 55,894,106 and 52,815,395 shares as of September 30, 2022 and December 31, 2021, respectively


6


5


Additional paid-in capital


1,457,379


687,295


Accumulated other comprehensive loss


(128,266

)


(27,319

)

Retained earnings


723,008


650,058


Total stockholders’ equity


2,052,127


1,310,039


Total liabilities and stockholders’ equity


$

3,903,546


$

2,900,953


SOLAREDGE TECHNOLOGIES INC.

CONDENSED CONSOLIDATED STATEMENTS OF CASH FLOWS (Unaudited)

(in thousands, except per share data)


Nine Months Ended

September 30,


2022


2021

Cash flows from operating activities:


Net income


$

72,950


$

128,216


Adjustments to reconcile net income to net cash provided by (used in) operating activities:


Depreciation of property, plant and equipment


29,571


21,492


Amortization of intangible assets


7,741


7,487


Amortization of debt discount and debt issuance costs


2,186


2,175


Amortization of premium and accretion of discount on available-for-sale marketable securities, net


7,864


6,301


Impairment of goodwill and intangible assets


4,008


Stock-based compensation expenses


106,932


73,390


Gain from sale of privately held company


(7,533

)


Deferred income taxes, net


(3,822

)


(6,686

)

Loss (gain) from sale and disposal of assets


(485

)


2,013


Exchange rate fluctuations and other items, net


64,662


13,086


Changes in assets and liabilities:


Inventories, net


(188,579

)


30,678


Prepaid expenses and other assets


(55,478

)


(14,977

)

Trade receivables, net


(377,089

)


(206,131

)

Trade payables, net


53,683


(22,959

)

Employees and payroll accruals


12,119


14,321


Warranty obligations


82,025


42,368


Deferred revenues and customers advances


41,440


13,723


Other liabilities, net


67,789


20,055


Net cash provided by (used in) operating activities


(80,016

)


124,552


Cash flows from investing activities:


Proceed from sales and maturities of available-for-sale marketable securities


178,415


174,817


Purchase of property, plant and equipment


(125,085

)


(94,135

)

Investment in available-for-sale marketable securities


(461,491

)


(511,615

)

Investment in a privately-held company


(16,643

)

Proceeds from sale of a privately-held company


24,175


Withdrawal from bank deposits, net


50,020


Payment for asset acquisition, net of cash acquired


(2,996

)

Other investing activities


3,472


2,593


Net cash used in investing activities


(380,514

)


(397,959

)

Cash flows from financing activities:


Proceeds from secondary public offering, net of issuance costs


650,526


Repayment of bank loans


(104

)


(16,219

)

Proceeds from exercise of stock-based awards


3,508


6,128


Tax withholding in connection with stock-based awards, net


(4,686

)


(8,402

)

Other financing activities


(2,109

)


(939

)

Net cash provided by (used in) financing activities


647,135


(19,432

)

Increase (decrease) in cash and cash equivalents


186,605


(292,839

)

Cash and cash equivalents at the beginning of the period


530,089


827,146


Effect of exchange rate differences on cash and cash equivalents


(38,365

)


(7,719

)

Cash and cash equivalents at the end of the period


$

678,329


$

526,588


SOLAREDGE TECHNOLOGIES INC.

RECONCILIATION OF NON-GAAP FINANCIAL MEASURES (Unaudited)

(in thousands, except per share data and percentages)


Reconciliation of GAAP to Non-GAAP


Three Months Ended


Nine Months Ended


September 30,

2022


June 30,

2022


September 30,

2021


September 30,

2022


September 30,

2021

Gross profit (GAAP)

$

222,001


$

182,642


$

172,561


$

583,601


$

468,827


Revenues from finance component


(159

)


(146

)


(111

)


(440

)


(296

)

Stock-based compensation


4,661


5,285


4,289


15,008


14,370


Disposal of assets related to Critical Power


4,314


4,314


Amortization and depreciation of acquired assets


2,064


2,185


2,341


6,468


7,054


Gross profit (Non-GAAP)

$

228,567


$

194,280


$

179,080


$

608,951


$

489,955


Gross margin (GAAP)


26.5

%


25.1

%


32.8

%


26.3

%


33.2

%

Revenues from finance component


0.0

%


0.0

%


0.0

%


0.0

%


0.0

%

Stock-based compensation


0.6

%


0.7

%


0.8

%


0.7

%


1.0

%

Disposal of assets related to Critical Power


%


0.6

%


%


0.2

%


%

Amortization and depreciation of acquired assets


0.2

%


0.3

%


0.4

%


0.3

%


0.5

%

Gross margin (Non-GAAP)


27.3

%


26.7

%


34.0

%


27.4

%


34.7

%


Operating expenses (GAAP)

$

137,594


$

146,630


$

106,147


$

412,318


$

302,726


Stock-based compensation


(31,090

)


(31,789

)


(21,896

)


(91,924

)


(59,020

)

Amortization and depreciation of acquired assets


(495

)


(531

)


(444

)


(1,571

)


(953

)

Assets impairment


19


(4,687

)


(4,668

)


Gain (loss) from assets sales and disposal


744


(8

)


37


1,146


99


Other items


1,559


1,559


(1,350

)

Operating expenses (Non-GAAP)

$

108,331


$

109,615


$

83,844


$

316,860


$

241,502


Operating income (GAAP)

$

84,407


$

36,012


$

66,414


$

171,283


$

166,101


Revenues from finance component


(159

)


(146

)


(111

)


(440

)


(296

)

Disposal of assets related to Critical Power


4,314


4,314


Stock-based compensation


35,751


37,074


26,185


106,932


73,390


Amortization and depreciation of acquired assets


2,559


2,716


2,785


8,039


8,007


Assets impairment


(19

)


4,687


4,668


Loss (gain) from assets sales and disposal


(744

)


8


(37

)


(1,146

)


(99

)

Other items


(1,559

)


(1,559

)


1,350


Operating income (Non-GAAP)

$

120,236


$

84,665


$

95,236


$

292,091


$

248,453


SOLAREDGE TECHNOLOGIES INC.

RECONCILIATION OF NON-GAAP FINANCIAL MEASURES (Unaudited)

(in thousands, except per share data and percentages)


Reconciliation of GAAP to Non-GAAP


Three Months Ended


Nine Months Ended


September 30,

2022


June 30,

2022


September 30,

2021


September 30,

2022


September 30,

2021

Financial income (expense), net (GAAP)

$

(33,025

)


$

(14,311

)


$

(5,751

)


$

(52,785

)


$

(13,591

)

Notes due 2025


730


728


726


2,186


2,175


Non cash interest


1,775


1,699


1,469


5,083


4,245


Currency fluctuation related to lease standard


(1,116

)


(9,028

)


574


(11,936

)


(415

)

Financial income (expense), net (Non-GAAP)

$

(31,636

)


$

(20,912

)


$

(2,982

)


$

(57,452

)


$

(7,586

)


Other income (GAAP)

$

7,533


$


$


$

7,533


$


Gain from sale of investment in privately-held company


(7,533

)


(7,533

)


Other income (Non-GAAP)

$


$


$


$


$


Income tax benefit (expense) (GAAP)

$

(34,172

)


$

(6,617

)


$

(7,615

)


$

(53,081

)


$

(24,294

)

Income tax adjustment


(291

)


(389

)


(2,528

)


(1,881

)


(6,458

)

Income tax benefit (expense) (Non-GAAP)

$

(34,463

)


$

(7,006

)


$

(10,143

)


$

(54,962

)


$

(30,752

)


Net income (GAAP)

$

24,743


$

15,084


$

53,048


$

72,950


$

128,216


Revenues from finance component


(159

)


(146

)


(111

)


(440

)


(296

)

Disposal of assets related to Critical Power


4,314


4,314


Stock-based compensation


35,751


37,074


26,185


106,932


73,390


Amortization and depreciation of acquired assets


2,559


2,716


2,785


8,039


8,007


Assets impairment


(19

)


4,687


4,668


Loss (gain) from assets sales and disposal


(744

)


8


(37

)


(1,146

)


(99

)

Other items


(1,559

)


(1,559

)


1,350


Notes due 2025


730


728


726


2,186


2,175


Non cash interest


1,775


1,699


1,469


5,083


4,245


Currency fluctuation related to lease standard


(1,116

)


(9,028

)


574


(11,936

)


(415

)

Gain from sale of investment in privately-held company


(7,533

)


(7,533

)


Income tax adjustment


(291

)


(389

)


(2,528

)


(1,881

)


(6,458

)

Net income (Non-GAAP)

$

54,137


$

56,747


$

82,111


$

179,677


$

210,115


SOLAREDGE TECHNOLOGIES INC.

RECONCILIATION OF NON-GAAP FINANCIAL MEASURES (Unaudited)

(in thousands, except per share data and percentages)


Reconciliation of GAAP to Non-GAAP


Three Months Ended


Nine Months Ended


September 30,

2022


June 30,

2022


September 30,

2021


September 30,

2022


September 30,

2021

Net basic earnings per share (GAAP)

$

0.44


$

0.27


$

1.01


$

1.33


$

2.46


Revenues from finance component


0.00


0.00


0.00


(0.01

)


0.00


Disposal of assets related to Critical Power


0.08


0.08


Stock-based compensation


0.64


0.67


0.50


1.95


1.41


Amortization and depreciation of acquired assets


0.05


0.04


0.05


0.15


0.15


Assets impairment


0.00


0.09


0.09


Loss (gain) from assets sales and disposal


(0.02

)


0.00


0.00


(0.03

)


0.00


Other items


(0.02

)


(0.02

)


0.03


Notes due 2025


0.01


0.01


0.02


0.04


0.04


Non cash interest


0.03


0.03


0.03


0.09


0.08


Currency fluctuation related to lease standard


(0.02

)


(0.16

)


0.01


(0.22

)


(0.01

)

Gain from sale of investment in privately-held company


(0.13

)


(0.14

)


Income tax adjustment


(0.01

)


(0.01

)


(0.05

)


(0.03

)


(0.12

)

Net basic earnings per share (Non-GAAP)

$

0.97


$

1.02


$

1.57


$

3.28


$

4.04


Net diluted earnings per share (GAAP)

$

0.43


$

0.26


$

0.96


$

1.29


$

2.32


Revenues from finance component


0.00


0.00


0.00


(0.01

)


(0.01

)

Disposal of assets related to Critical Power


0.08


0.08


Stock-based compensation


0.59


0.62


0.45


1.80


1.27


Amortization and depreciation of acquired assets


0.05


0.04


0.05


0.13


0.14


Assets impairment


0.00


0.08


0.08


Loss (gain) from assets sales and disposal


(0.02

)


0.00


0.00


(0.02

)


0.00


Other items


(0.02

)


(0.02

)


0.02


Notes due 2025


0.00


0.00


0.00


0.00


0.01


Non cash interest


0.03


0.03


0.03


0.09


0.08


Currency fluctuation related to lease standard


(0.02

)


(0.15

)


0.01


(0.20

)


(0.01

)

Gain from sale of investment in privately-held company


(0.13

)


(0.13

)


Income tax adjustment


0.00


(0.01

)


(0.05

)


(0.03

)


(0.11

)

Net diluted earnings per share (Non-GAAP)

$

0.91


$

0.95


$

1.45


$

3.06


$

3.71


Number of shares used in computing net diluted earnings per share (GAAP)


58,747,538


58,564,734


55,929,000


57,886,041


55,955,441


Stock-based compensation


784,228


904,781


653,967


872,076


733,488


Number of shares used in computing net diluted earnings per share (Non-GAAP)


59,531,766


59,469,515


56,582,967


58,758,117


56,688,929


Contacts

Investor Contacts
SolarEdge Technologies, Inc.
Ronen Faier, Chief Financial Officer
+1 510-498-3263
This email address is being protected from spambots. You need JavaScript enabled to view it.

Sapphire Investor Relations, LLC
Erica Mannion or Michael Funari
+1 617-542-6180
This email address is being protected from spambots. You need JavaScript enabled to view it.

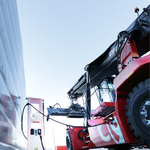
HOUSTON--(BUSINESS WIRE)--Microvast Holdings, Inc. (NASDAQ: MVST), a technology innovator that designs, develops and manufactures lithium-ion battery solutions, today announced the extension of its supply and purchase agreement with Kalmar.


Kalmar, part of Cargotec, offers a wide range of cargo handling solutions and services to ports, terminals, distribution centers and to heavy industry across the globe. Kalmar is the industry leader in terminal automation and energy efficient container handling, with one in four container movements around the globe being handled by a Kalmar solution.

Kalmar and Microvast have extended their supply and purchase agreement through 2026. “2021 marked a considerable milestone for Kalmar as its entire portfolio became available in electrically powered versions. As our strategic battery partner, Microvast’s battery technologies have been successfully integrated into four of our platforms to date. We value this strategic relationship, which gives us a performance edge and supports our position as a leader in our industry. Microvast’s European production footprint and strong focus on sustainability also align with our longstanding corporate goals,” says Alf-Gunnar Karlgren, VP Counter Balanced at Kalmar.

“We are proud to support Kalmar on their electrification journey. With our new Gen 4 MV-B and MV-C packs, offering approximately 20% more energy and power compared to the Gen 3 packs, we are positioned to continue delivering better performance and improved TCO in Kalmar’s future product lineup. With our technology roadmap and deep understanding of Kalmar’s business, we look forward to many more years of close cooperation,” says Sascha Kelterborn, President and CRO of Microvast Holdings, Inc. The MV-B and MV-C Gen 4 packs are powered by Microvast’s new MpCO-48Ah (high power) and HpCO-53.5Ah (high energy) cells. Microvast has been the first battery company conducting TÜV Süd’s sustainability assessment program.

About Microvast

Founded in Houston, Texas in 2006 as a research and technology driven company, Microvast has evolved into a global leader in the design, development and manufacture of battery solutions for mobile and stationary applications. Microvast provides a broad portfolio of fast-charging lithium-ion battery solutions, with different chemistries, performance characteristics and price points to meet the diverse requirements of its customer base. Microvast is renowned for its cutting-edge cell technology and its vertical integration capabilities which extend from core battery chemistry (cathode, anode, electrolyte, and separator) to battery cells, modules and packs.

Since placing its first battery systems into operation in electric buses more than a decade ago, Microvast has expanded its business to serve a broad range of commercial, passenger and specialty vehicles, including mining, material handling, and power vehicles and equipment, as well as grid-scale energy storage applications.

For more information, please visit www.microvast.com or follow us on LinkedIn or Twitter (@microvast).

Cautionary Statement Regarding Forward-Looking Statements

This communication contains “forward-looking statements” within the meaning of the Private Securities Litigation Reform Act of 1995. Such statements include, but are not limited to, statements about future financial and operating results, our plans, objectives, expectations and intentions with respect to future operations, products and services; and other statements identified by words such as “will likely result,” “are expected to,” “will continue,” “is anticipated,” “estimated,” “believe,” “intend,” “plan,” “projection,” “outlook” or words of similar meaning. These forward-looking statements include, but are not limited to, statements regarding Microvast’s industry and market sizes, future opportunities for Microvast and the combined company and Microvast’s estimated future results. Such forward-looking statements are based upon the current beliefs and expectations of our management and are inherently subject to significant business, economic and competitive uncertainties and contingencies, many of which are difficult to predict and generally beyond our control. Actual results and the timing of events may differ materially from the results anticipated in these forward-looking statements.


Contacts

Investor Relations
Monica Gould
This email address is being protected from spambots. You need JavaScript enabled to view it.
(212) 871-3927
cc: This email address is being protected from spambots. You need JavaScript enabled to view it.
(346) 309-2562

Media
This email address is being protected from spambots. You need JavaScript enabled to view it.
(281) 491-9505

DALLAS--(BUSINESS WIRE)--Primoris Services Corporation (NASDAQ GS: PRIM) (“Primoris” or the “Company”) today announced financial results for its third quarter ended September 30, 2022 and confirmed the Company’s outlook.


For the third quarter 2022, Primoris reported the following highlights(1):

  • Revenue of $1,284.1 million, up $370.9 million, or 40.6 percent, year-over-year driven by strong growth in the Utilities and Energy/Renewables segments, including $155.7 million from the PLH acquisition
  • Delivered net income of $43.0 million, or $0.80 per diluted share, and adjusted net income of $60.4 million, or $1.12 per diluted share
  • Generated adjusted earnings before interest, income taxes, depreciation and amortization (“Adjusted EBITDA”) of $109.0 million
  • Increased backlog to a record $5.5 billion, up 99.8 percent from the third quarter of 2021, including Master Service Agreements (“MSA”) backlog of $2.1 billion
  • Annual 2022 guidance range for earnings per share (“EPS”) updated to $2.31 to $2.51 to reflect incremental depreciation, amortization of intangibles, and transaction, integration and related costs associated with the PLH acquisition
  • Maintained Adjusted EPS guidance range of $2.39 to $2.59
(1)

Please refer to “Non-GAAP Measures” and Schedule 1, 2 and 3 for the definitions and reconciliations of our Non-GAAP financial measures, including “Adjusted Net Income,” “Adjusted EPS” and “Adjusted EBITDA.”

“Our third quarter results demonstrate another significant step in executing our long-term growth strategy. We saw record revenue and backlog for the second consecutive quarter, including significant organic revenue growth in our Utilities and Energy/Renewables segments and a near doubling of our backlog compared to the previous year,” said Tom McCormick, President and Chief Executive Officer of Primoris.

“The closing of the PLH acquisition in August also contributed meaningfully to our performance this quarter, including adding almost $600 million of backlog while expanding our geographic footprint and customer base. The Utilities segment saw the benefit of our teams’ efforts to work with our customers to mitigate the ongoing impacts of inflation, resulting in gross margins improving 4.3 percentage points compared to the second quarter. We also made further progress in unlocking the potential of our communications business by growing revenue and expanding margins from the prior year with new customers and in new service areas. In the Energy/Renewables segment, we continue to be one of the largest and fastest growing contractors for utility scale and distributed generation solar projects in the country and a leader in other energy related and civil projects.”

“As we advance through the fourth quarter and into 2023, we remain confident in the outlook for our business as we work to further grow our backlog of projects across our segments and provide quality service to our customers that will lead to reliable and profitable growth.”

2022 Third Quarter Results

Revenue was $1,284.1 million for the three months ended September 30, 2022, an increase of $370.9 million, or 40.6 percent, compared to the same period in 2021. The increase was primarily due to organic growth of $197.3 million, or 21.6%, in the Energy/Renewables and Utilities segments on higher solar construction, power delivery, and communications services, as well as approximately $173.6 million in revenue contribution from the PLH and B Comm acquisitions. Gross profit was $154.9 million for the three months ended September 30, 2022, an increase of $27.5 million, or 21.6 percent, compared to the same period in 2021. The increase was primarily due to higher revenue and a favorable mix of business in the Energy/Renewables and Utility segments and approximately $16.0 million from the acquisitions of PLH and B Comm, partially offset by gross profit declines in the Pipeline Services segment. Gross profit as a percentage of revenue decreased to 12.1 percent for the three months ended September 30, 2022, compared to 14.0 percent for the same period in 2021 driven primarily by lower Pipeline Services margins and inflation.

This press release includes Non-GAAP financial measures. The Company believes these measures enable investors, analysts and management to evaluate Primoris’ performance excluding the effects of certain items that management believes impact the comparability of operating results between reporting periods. In addition, management believes these measures are useful in comparing the Company’s operating results with those of its competitors. Please refer to “Non-GAAP Measures” and Schedules 1, 2 and 3 for the definitions and reconciliations of the Company’s Non-GAAP financial measures, including “Adjusted Net Income,” “Adjusted EPS” and “Adjusted EBITDA”.

During the third quarter of 2022, net income was $43.0 million compared to $44.1 million in the previous year. Adjusted Net Income was $60.4 million for the third quarter compared to $48.5 million for the same period in 2021. Diluted earnings per share (“EPS”) was $0.80 compared to $0.81 in the previous year. Adjusted EPS was $1.12 for the third quarter of 2022 compared to $0.89 for the third quarter of 2021. Adjusted EBITDA was $109.0 million for the third quarter of 2022, an increase of $14.2 million, or 15.1 percent, compared to $94.7 million for the same period in 2021.

The Company’s three segments are: Utilities, Energy/Renewables and Pipeline Services. Revenue and gross profit for the segments for the three and nine months ended September 30, 2022 and 2021 were as follows:

Segment Revenue

(in thousands, except %)

(unaudited)


For the three months ended September 30,


2022


2021


% of


% of


Total


Total

Segment


Revenue


Revenue


Revenue


Revenue

Utilities


$

613,008


47.7%


$

454,654


49.8%

Energy/Renewables


600,444


46.8%


351,026


38.4%

Pipeline Services


70,676


5.5%


107,565


11.8%

Total


$

1,284,128


100.0%


$

913,245


100.0%


For the nine months ended September 30,


2022


2021


% of


% of


Total


Total

Segment


Revenue


Revenue


Revenue


Revenue

Utilities


$

1,447,857


46.8%


$

1,215,087


46.5%

Energy/Renewables


1,445,843


46.8%


1,038,900


39.8%

Pipeline Services


197,761


6.4%


359,197


13.7%

Total


$

3,091,461


100.0%


$

2,613,184


100.0%

Segment Gross Profit

(in thousands, except %)

(unaudited)


For the three months ended September 30,


2022


2021


% of


% of


Segment


Segment

Segment


Gross Profit


Revenue


Gross Profit


Revenue

Utilities


$

78,046


12.7%


$

63,715


14.0%

Energy/Renewables


80,135


13.3%


35,926


10.2%

Pipeline Services


(3,274)


(4.6%)


27,795


25.8%

Total


$

154,907


12.1%


$

127,436


14.0%


For the nine months ended September 30,


2022


2021


% of


% of


Segment


Segment

Segment


Gross Profit


Revenue


Gross Profit


Revenue

Utilities


$

140,755


9.7%


$

134,280


11.1%

Energy/Renewables


173,209


12.0%


111,825


10.8%

Pipeline Services


(10,463)


(5.3%)


74,538


20.8%

Total


$

303,501


9.8%


$

320,643


12.3%

Utilities Segment (“Utilities”): Revenue increased by $158.4 million, or 34.8 percent, for the three months ended September 30, 2022, compared to the same period in 2021, primarily due to organic growth of 10.3 percent from increased activity across the power delivery and communications markets and a $111.3 million revenue contribution from the acquisitions of PLH and B Comm. Gross profit for the three months ended September 30, 2022, increased by $14.3 million, or 22.5 percent, compared to the same period in 2021, primarily due to a $10.0 million incremental impact from the PLH and B Comm acquisitions and $4.3 million from organic revenue growth in the segment. Gross profit as a percentage of revenue decreased slightly to 12.7 percent during the three months ended September 30, 2022, compared to 14.0 percent in the same period in 2021, primarily due to higher costs caused by supply chain disruptions and inflationary pressure on labor and fuel. Gross profit as a percentage of revenue in the Utilities segment improved from 8.5 percent for the second quarter of 2022 as a result of actions taken by the Company to mitigate the impacts of inflation it experienced in the second quarter. The Utilities segment represented 46.8 percent of total Company revenue and 12.7 percent of the total Company gross profit for the three months ended September 30, 2022.

Energy and Renewables Segment (“Energy/Renewables”): Revenue increased by $249.4 million, or 71.1 percent, for the three months ended September 30, 2022, compared to the same period in 2021, primarily due to organic growth of 56.7 percent driven by a 98.9 percent increase in solar construction related work, higher electric power activity and $50.5 million contribution from the PLH acquisition. Gross profit for the three months ended September 30, 2022, increased by $44.2 million, or 123.1 percent, compared to the same period in 2021, primarily due to improved mix of revenue from solar activity growth and $6.6 million in contribution from PLH. Gross profit as a percentage of revenue increased to 13.3 percent during the three months ended September 30, 2022, compared to 10.2 percent in the same period in 2021, primarily due to the previously noted higher margin solar projects and lower costs from the non-recurrence of project impacts associated with a liquified natural gas plant project in the Northeast in 2021. The Energy/Renewables segment represented 46.8 percent of total Company revenue and 13.3 percent of the total Company gross profit for the three months ended September 30, 2022.

Pipeline Services (“Pipeline”): Revenue decreased by $36.9 million, or 34.3 percent, for the three months ended September 30, 2022, compared to the same period in 2021. The decrease is primarily due to the substantial completion of pipeline projects in 2021 and a decline in midstream pipeline projects driven in part by decreased permitting for interstate pipelines, partially offset by a $11.8 million contribution from PLH. Gross profit for the three months ended September 30, 2022, was negative $3.3 million, a decrease of $31.1 million compared to the same period in 2021, primarily due to the lower revenue from the decrease in activity and under absorption of carrying costs related to equipment and personnel. Gross profit decreased to a negative 4.6 percent as a percentage of revenue during the three months ended September 30, 2022, compared to a gross profit of 25.8 percent as a percentage of revenue in the same period in 2021 due to the negative impacts to lower revenue and unabsorbed fixed costs previously noted. The Pipeline Services segment represented 5.5 percent of total Company revenue and negative 5.3 percent of the total Company gross profit for the three months ended September 30, 2022. The Company was awarded a pipeline project valued over $120 million in the third quarter of 2022 that is expected to drive revenue and gross profit improvement in the Pipeline Services segment in the fourth quarter of 2022.

Other Financial Information

Selling, general and administrative (“SG&A”) expenses were $75.7 million during the three months ended September 30, 2022, an increase of $14.0 million, or 22.7 percent compared to 2021, primarily due to $13.4 million of incremental expense from the acquisitions of PLH and B Comm. SG&A expense as a percentage of revenue decreased to 5.9 percent compared to 6.8 percent for the corresponding period in 2021, primarily due to growth in revenues outpacing incremental SG&A expenses.

Transaction and related costs were $12.7 million for the three months ended September 30, 2022, an increase of $12.3 million compared to 2021, primarily due to professional fees paid to advisors associated with the PLH acquisition in 2022.

Interest expense, net for the three months ended September 30, 2022, was $13.1 million, an increase of $8.4 million compared to the same period in 2021, primarily due to higher average debt balances from the borrowings incurred related to the PLH acquisition and a higher weighted average interest rate.

The Company recorded income tax expense for the three months ended September 30, 2022, of $9.8 million compared to $16.7 million for the three months ended September 30, 2021. The effective tax rate was 19.6 percent for the three months ended September 30, 2022. The decrease in income tax expense year-over-year was primarily driven by the release of a valuation allowance and a reduction in the Company’s effective tax rate.

During the three months ended September 30, 2022, the Company spent approximately $9.9 million for capital expenditures, which decreased in the third quarter as the Company moves to a more balanced leased versus owned equipment strategy.

Outlook

The Company estimates that its EPS for the year ending December 31, 2022, will range between $2.31 and $2.51, reflecting its current expectations for the increase in depreciation, amortization of intangibles, and transaction, integration costs from the PLH acquisition. The Company is maintaining its Adjusted EPS estimate for the year ending December 31, 2022, in the range of $2.39 to $2.59 per share. The Company’s targeted gross profit as a percentage of revenue for the fourth quarter of 2022 by segment is as follows: Utilities in the range of 9 to 11 percent; Energy/Renewables in the range of 10 to 12 percent; and Pipeline in the low to mid-single digit percent range.

The Company is targeting SG&A expense as a percentage of revenue in the low six percent range for the 2022 calendar year. The Company expects its effective tax rate on net income for the full year 2022 to be approximately 19.0 to 20.0 percent but may vary depending on the mix of states in which the Company operates. Capital expenditures for the fourth quarter are expected to total between $20.0 million and $30.0 million, which includes $15.0 million to $25.0 million for construction equipment.

The guidance provided above constitutes forward-looking statements, which are based on current economic conditions and estimates, and the Company does not include other potential impacts, such as changes in accounting, acquisitions or dispositions or unusual items. Supplemental information relating to the Company’s financial outlook is posted in the “Investors” section of the Company’s website at www.prim.com.

Backlog


Backlog at September 30, 2022 (in millions)

Segment


Fixed Backlog


MSA Backlog


Total Backlog

Utilities


$

76


$

1,813


$

1,889

Energy/Renewables


2,959


166


3,125

Pipeline Services


378


80


458

Total


$

3,413


$

2,059


$

5,472

As of September 30, 2022, Fixed Backlog was $3.4 billion and MSA Backlog was $2.1 billion, a year-over-year increase of 166.1 percent and 41.4 percent, respectively. Total Backlog at the end of the third quarter 2022 was $5.5 billion or an increase of 99.8 percent from the third quarter of 2021. MSA Backlog represents estimated MSA revenue for the next four quarters. The Company expects that during the next four quarters, the Company will recognize as revenue approximately 76 percent of the total backlog as of September 30, 2022, comprised of backlog of approximately: 100 percent of Utilities; 60 percent of Energy/Renewables; and 83 percent of Pipeline.

Backlog, including estimated MSA revenue, should not be considered a comprehensive indicator of future revenue. Revenues from certain projects, such as cost reimbursable and time-and-materials projects, do not flow through backlog. At any time, any project may be cancelled at the convenience of customers.

Liquidity and Capital Resources

At September 30, 2022, the Company had $111.9 million of unrestricted cash and cash equivalents. The Company had $150.0 million in outstanding borrowings under the revolving credit facility, commercial letters of credit outstanding were $48.4 million and the available borrowing capacity was $126.6 million.

Dividend

The Company also announced that on November 3, 2022, its Board of Directors declared a $0.06 per share cash dividend to stockholders of record on December 30, 2022, payable on January 13, 2023.

Share Purchase Program

In November 2021, the Company’s Board of Directors authorized a $25.0 million share purchase program. In February 2022, the Company’s Board of Directors replenished the limit to $25.0 million. During the three months ended September 30, 2022, the Company purchased and cancelled 129,200 shares of common stock, which in the aggregate equaled $2.6 million at an average share price of $20.28. As of September 30, 2022, we had $19.0 million remaining for purchase under the share purchase program. The share purchase plan expires on December 31, 2022.

Conference Call and Webcast

As previously announced, management will host a conference call and webcast on Tuesday, November 8, 2022, at 9:00 a.m. U.S. Central Time (10:00 a.m. U.S. Eastern Time). Tom McCormick, President and Chief Executive Officer, and Ken Dodgen, Executive Vice President and Chief Financial Officer, will discuss the Company’s results and business outlook.

Investors and analysts are invited to participate in the call by phone at 1-888-330-3428, or internationally at 1-646-960-0679 (access code: 7581464) or via the Internet at www.prim.com. A replay of the call will be available on the Company’s website or by phone at 1-800-770-2030, or internationally at 1-647-362-9199 (access code: 7581464), for a seven-day period following the call.

Presentation slides to accompany the conference call are available for download under “Events & Presentations” in the “Investors” section of the Company’s website at www.prim.com.

Non-GAAP Measures

This press release contains certain financial measures that are not recognized under generally accepted accounting principles in the United States (“GAAP”). Primoris uses earnings before interest, income taxes, depreciation and amortization (“EBITDA”), Adjusted EBITDA, Adjusted Net Income, and Adjusted EPS as important supplemental measures of the Company’s operating performance. The Company believes these measures enable investors, analysts, and management to evaluate Primoris’ performance excluding the effects of certain items that management believes impact the comparability of operating results between reporting periods. In addition, management believes these measures are useful in comparing the Company’s operating results with those of its competitors. The non-GAAP measures presented in this press release are not intended to be considered in isolation or as a substitute for, or superior to, the financial information prepared and presented in accordance with GAAP. In addition, Primoris’ method of calculating these measures may be different from methods used by other companies, and, accordingly, may not be comparable to similarly titled measures as calculated by other companies that do not use the same methodology as Primoris. Please see the accompanying tables to this press release for reconciliations of the following non‐GAAP financial measures for Primoris’ current and historical results: EBITDA, Adjusted EBITDA, Adjusted Net Income and Adjusted EPS.

About Primoris

Primoris Services Corporation is a leading specialty contractor providing critical infrastructure services to the utility, energy/renewables and pipeline services markets throughout the United States and Canada. The Company supports a diversified base of blue-chip customers with engineering, procurement, construction and maintenance services. A focus on multi-year master service agreements and an expanded presence in higher-margin, higher-growth markets such as utility-scale solar facility installations, renewable fuels, power delivery systems and communications infrastructure have also increased the Company’s potential for long-term growth. Additional information on Primoris is available at www.prim.com.

Forward Looking Statements

This press release contains certain forward-looking statements, including the Company’s outlook, that reflect, when made, the Company’s expectations or beliefs concerning future events that involve risks and uncertainties, including with regard to the Company’s future performance. Forward-looking statements include all statements that are not historical facts and can be identified by terms such as “anticipates”, “believes”, “could”, “estimates”, “expects”, “intends”, “may”, “plans”, “potential”, “predicts”, “projects”, “should”, “will”, “would” or similar expressions. Forward-looking statements include information concerning the possible or assumed future results of operations, business strategies, financing plans, competitive position, industry environment, potential growth opportunities, the effects of regulation and the economy, generally. Forward-looking statements involve known and unknown risks, uncertainties, and other factors, which may cause actual results, performance or achievements to be materially different from any future results, performance or achievements expressed or implied by the forward-looking statements. Actual results may differ materially as a result of a number of factors, including, among other things, customer timing, project duration, weather, and general economic conditions; changes in the mix of customers, projects, contracts and business; regional or national and/or general economic conditions and demand for the Company’s services; macroeconomic impacts arising from the long duration of the COVID-19 pandemic, including labor shortages and supply chain disruptions; price, volatility, and expectations of future prices of oil, natural gas, and natural gas liquids; variations and changes in the margins of projects performed during any particular quarter; increases in the costs to perform services caused by changing conditions; the termination, or expiration of existing agreements or contracts; the budgetary spending patterns of customers; inflation and other increases in construction costs that the Company may be unable to pass through to customers; cost or schedule overruns on fixed-price contracts; availability of qualified labor for specific projects; changes in bonding requirements and bonding availability for existing and new agreements; the need and availability of letters of credit; costs incurred to support growth, whether organic or through acquisitions; the timing and volume of work under contract; losses experienced in the Company’s operations; the results of the review of prior period accounting on certain projects and the impact of adjustments to accounting estimates; developments in governmental investigations and/or inquiries; intense competition in the industries in which the Company operates; failure to obtain favorable results in existing or future litigation or regulatory proceedings, dispute resolution proceedings or claims, including claims for additional costs; failure of partners, suppliers or subcontractors to perform their obligations; cyber-security breaches; failure to maintain safe worksites; risks or uncertainties associated with events outside of the Company’s control, including severe weather conditions, public health crises and pandemics (such as COVID-19), war or other armed conflict (including Russia’s invasion of Ukraine), political crises or other catastrophic events; client delays or defaults in making payments; the availability of credit and restrictions imposed by credit facilities; failure to implement strategic and operational initiatives; risks or uncertainties associated with acquisitions, dispositions and investments; possible information technology interruptions or inability to protect intellectual property; the Company’s failure, or the failure of the Company’s agents or partners, to comply with laws; the Company's ability to secure appropriate insurance; new or changing legal requirements, including those relating to environmental, health and safety matters; the loss of one or a few clients that account for a significant portion of the Company's revenues; asset impairments; and risks arising from the inability to successfully integrate acquired businesses.


Contacts

Ken Dodgen
Executive Vice President, Chief Financial Officer
(214) 740-5608
This email address is being protected from spambots. You need JavaScript enabled to view it.

Blake Holcomb
Vice President, Investor Relations
(214) 545-6773
This email address is being protected from spambots. You need JavaScript enabled to view it.


Read full story here

  • Reported net income attributable to HF Sinclair stockholders of $954.4 million, or $4.45 per diluted share, and adjusted net income of $982.9 million, or $4.58 per diluted share, for the third quarter
  • Reported EBITDA of $1,463.2 million and Adjusted EBITDA of $1,500.3 million for the third quarter
  • Returned $951.5 million to shareholders through dividends and share repurchases in the third quarter
  • Announced a regular quarterly dividend of $0.40 per share

DALLAS--(BUSINESS WIRE)--HF Sinclair Corporation (NYSE: DINO) (“HF Sinclair” or the “Company”) today reported third quarter net income attributable to HF Sinclair stockholders of $954.4 million, or $4.45 per diluted share, for the quarter ended September 30, 2022, compared to $280.8 million, or $1.71 per diluted share, for the quarter ended September 30, 2021.


The third quarter results reflect special items that collectively decreased net income by a total of $28.5 million. On a pre-tax basis, these items include a lower of cost or market inventory valuation adjustment of $16.8 million, HF Sinclair's pro-rata share of HEP's share of Osage environmental remediation costs of $9.6 million and acquisition integration costs of $10.7 million. Excluding these items, adjusted net income for the third quarter of 2022 was $982.9 million ($4.58 per diluted share) compared to $209.9 million ($1.28 per diluted share) for the third quarter of 2021, which excludes certain items that collectively increased net income by $70.8 million.

HF Sinclair’s CEO, Michael Jennings, commented, “HF Sinclair’s solid third quarter results were driven by robust product margins and record throughputs in our refining segment. We returned over $951 million in cash to shareholders through share repurchases and dividends during the quarter, and another $152 million in the month of October. Since the closing of the Sinclair acquisition on March 14, 2022, we have returned over $1.1 billion, which is well ahead of our initial target of returning $1 billion to our shareholders by the end of the first quarter of 2023. With the announcement of our new $1 billion share repurchase authorization in September, we remain fully committed to our cash return strategy and long-term payout ratio.”

Refining segment income before interest and income taxes was $1,344.1 million for the third quarter of 2022 compared to $217.4 million for the third quarter of 2021. The segment reported EBITDA of $1,446.7 million for the third quarter of 2022 compared to $295.3 million for the third quarter of 2021. This increase was primarily driven by higher refining margins in both the West and Mid-Continent regions, which resulted in higher refining segment earnings in the quarter. Consolidated refinery gross margin was $31.47 per produced barrel, a 112% increase compared to $14.87 for the third quarter of 2021, and crude oil charge averaged 645,780 barrels per day (“BPD”) for the third quarter of 2022 compared to 416,430 BPD for the third quarter of 2021.

Renewables segment loss before interest and income taxes was $(49.3) million for the third quarter of 2022 compared to $(13.4) million for the third quarter of 2021. The segment reported EBITDA of $(31.1) million for the third quarter of 2022 compared to $(13.1) million for the third quarter of 2021. Excluding the lower of cost or market inventory valuation charge of $16.8 million, Adjusted EBITDA in the third quarter of 2022 was $(14.2) million. Total sales volumes were 52 million gallons for the third quarter of 2022. The Cheyenne renewable diesel unit (“RDU”) was mechanically complete in the fourth quarter of 2021 and fully operational in the first quarter of 2022, the pre-treatment unit (“PTU”) at our Artesia, New Mexico facility was completed and fully operational in the first quarter of 2022 and the Artesia RDU was completed and fully operational in the second quarter of 2022. Also, effective with the Sinclair acquisition that closed on March 14, 2022, the Renewables segment includes the Sinclair RDU.

Marketing segment income before interest and income taxes was $3.9 million and reported EBITDA was $10.2 million for the third quarter of 2022. Total branded fuel sales volumes were 362 million gallons for the third quarter of 2022.

Lubricants and Specialty Products segment loss before interest and income taxes was $(5.0) million for the third quarter of 2022 compared to income of $148.5 million in the third quarter of 2021. The segment reported EBITDA of $15.2 million for the third quarter of 2022 compared to $167.7 million in the third quarter of 2021. Excluding a gain on sale of real property of $86.0 million, Adjusted EBITDA in the third quarter of 2021 was $81.7 million. This decrease was largely driven by FIFO impact from consumption of higher priced feedstock inventory, resulting in lower margins.

Holly Energy Partners, L.P. (“HEP”) reported EBITDA of $66.0 million for the third quarter of 2022 compared to $77.6 million for the third quarter of 2021 and Adjusted EBITDA of $110.1 million for the third quarter of 2022 compared to $83.3 million for the third quarter of 2021.

For the third quarter of 2022, net cash provided by operations totaled $872.8 million. At September 30, 2022, the Company's cash and cash equivalents totaled $1,447.4 million, a $254.9 million decrease over cash and cash equivalents of $1,702.3 million at June 30, 2022. During the third quarter of 2022, the Company announced and paid a regular dividend of $0.40 per share to shareholders totaling $85.3 million and spent $866.2 million on share repurchases. Additionally, the Company's consolidated debt was $3,334.2 million. The Company’s debt, exclusive of HEP debt, which is nonrecourse to HF Sinclair, was $1,740.4 million at September 30, 2022.

HF Sinclair also announced today that its Board of Directors declared a regular quarterly dividend in the amount of $0.40 per share, payable on December 5, 2022 to holders of record of common stock on November 21, 2022.

Through September 30, 2022, HF Sinclair has achieved annualized run rate targeted synergies of over $100 million related to the Sinclair acquisition and over $100 million of working capital synergies. The Company achieved annual run rate synergies through a combination of commercial improvements, operating expense reductions and optimization of selling, general and administrative expenses.

The Company has scheduled a webcast conference call for today, November 7, 2022, at 8:30 AM Eastern Time to discuss third quarter financial results. This webcast may be accessed at https://events.q4inc.com/attendee/908108663. An audio archive of this webcast will be available using the above noted link through November 21, 2022.

HF Sinclair Corporation, headquartered in Dallas, Texas, is an independent energy company that produces and markets high-value light products such as gasoline, diesel fuel, jet fuel, renewable diesel and other specialty products. HF Sinclair owns and operates refineries located in Kansas, Oklahoma, New Mexico, Wyoming, Washington and Utah and markets its refined products principally in the Southwest U.S., the Rocky Mountains extending into the Pacific Northwest and in other neighboring Plains states. HF Sinclair supplies high-quality fuels to more than 1,300 Sinclair branded stations and licenses the use of the Sinclair brand at more than 300 additional locations throughout the country. In addition, subsidiaries of HF Sinclair produce and market base oils and other specialized lubricants in the U.S., Canada and the Netherlands, and export products to more than 80 countries. Through its subsidiaries, HF Sinclair produces renewable diesel at two of its facilities in Wyoming and also at its facility in Artesia, New Mexico. HF Sinclair also owns a 47% limited partner interest and a non-economic general partner interest in Holly Energy Partners, L.P., a master limited partnership that provides petroleum product and crude oil transportation, terminalling, storage and throughput services to the petroleum industry, including HF Sinclair subsidiaries.

The following is a “safe harbor” statement under the Private Securities Litigation Reform Act of 1995: The statements in this press release relating to matters that are not historical facts are “forward-looking statements” based on management’s beliefs and assumptions using currently available information and expectations as of the date hereof, are not guarantees of future performance and involve certain risks and uncertainties, including those contained in our filings with the Securities and Exchange Commission (the “SEC”). Forward-looking statements use words such as “anticipate,” “project,” “will,” “expect,” “plan,” “goal,” “forecast,” “strategy,” “intend,” “should,” “would,” “could,” “believe,” “may,” and similar expressions and statements regarding our plans and objectives for future operations. Although we believe that the expectations reflected in these forward-looking statements are reasonable, we cannot assure you that our expectations will prove correct. Therefore, actual outcomes and results could materially differ from what is expressed, implied or forecast in such statements. Any differences could be caused by a number of factors, including, but not limited to, the Company’s and HEP’s ability to successfully integrate the Sinclair Oil Corporation (now known as Sinclair Oil LLC) and Sinclair Transportation Company LLC businesses acquired from The Sinclair Companies (now known as REH Company) (collectively, the “Sinclair Transactions”) with their existing operations and fully realize the expected synergies of the Sinclair Transactions or on the expected timeline; the Company's ability to successfully integrate the operation of the Puget Sound refinery with its existing operations; the demand for and supply of crude oil and refined products, including uncertainty regarding the effects of the continuing coronavirus (“COVID-19”) pandemic on future demand and increasing societal expectations that companies address climate change; risks and uncertainties with respect to the actions of actual or potential competitive suppliers and transporters of refined petroleum products or lubricant and specialty products in the Company’s markets; the spread between market prices for refined products and market prices for crude oil; the possibility of constraints on the transportation of refined products or lubricant and specialty products; the possibility of inefficiencies, curtailments or shutdowns in refinery operations or pipelines, whether due to infection in the workforce or in response to reductions in demand, accidents, unexpected leaks or spills, unscheduled shutdowns, weather events, civil unrest, expropriation of assets, and other economic, diplomatic, legislative, or political events or developments, terrorism, cyberattacks, or other catastrophes or disruptions affecting our operations, production facilities, machinery, pipelines and other logistics assets, equipment, or information systems, or any of the foregoing of our suppliers, customers, or third-party providers, and any potential asset impairments resulting from, or the failure to have adequate insurance coverage for or receive insurance recoveries from, such actions; the effects of current and/or future governmental and environmental regulations and policies, including the effects of current and/or future restrictions on various commercial and economic activities in response to the COVID-19 pandemic and increases in interest rates; the availability and cost of financing to the Company; the effectiveness of the Company’s capital investments and marketing strategies; the Company’s and HEP’s efficiency in carrying out and consummating construction projects, including the Company's ability to complete announced capital projects on time and within capital guidance; the Company's and HEP’s ability to timely obtain or maintain permits, including those necessary for operations or capital projects; the ability of the Company to acquire refined or lubricant product operations or pipeline and terminal operations on acceptable terms and to integrate any existing or future acquired operations; the possibility of terrorist or cyberattacks and the consequences of any such attacks; uncertainty regarding the effects and duration of global hostilities, including the Russia-Ukraine war, and any associated military campaigns which may disrupt crude oil supplies and markets for the Company's refined products and create instability in the financial markets that could restrict the Company's ability to raise capital; general economic conditions, including uncertainty regarding the timing, pace and extent of an economic recovery in the United States; a prolonged economic slowdown due to the COVID-19 pandemic, inflation and labor costs which could result in an impairment of goodwill and/or long-lived asset impairments; and other financial, operational and legal risks and uncertainties detailed from time to time in the Company’s and HEP’s SEC filings. The forward-looking statements speak only as of the date made and, other than as required by law, we undertake no obligation to publicly update or revise any forward-looking statements, whether as a result of new information, future events or otherwise.

RESULTS OF OPERATIONS

Financial Data (all information in this release is unaudited)


Three Months Ended
September 30,


Change from 2021


2022


2021


Change


Percent


(In thousands, except per share data)

Sales and other revenues

$

10,599,002


$

4,685,059


$

5,913,943


126

%

Operating costs and expenses:


Cost of products sold:


Cost of products sold (exclusive of lower of cost or market inventory valuation adjustment)


8,375,253


3,822,858


4,552,395


119


Lower of cost or market inventory valuation adjustment


16,847


16,847


8,392,100


3,822,858


4,569,242


120


Operating expenses (exclusive of depreciation and amortization)


604,591


352,520


252,071


72


Selling, general and administrative expenses (exclusive of depreciation and amortization)


102,677


91,056


11,621


13


Depreciation and amortization


171,973


121,220


50,753


42


Total operating costs and expenses


9,271,341


4,387,654


4,883,687


111


Income from operations


1,327,661


297,405


1,030,256


346


Other income (expense):


Earnings (loss) of equity method investments


(16,334

)


3,689


(20,023

)


(543

)

Interest income


9,821


1,018


8,803


865


Interest expense


(44,830

)


(26,892

)


(17,938

)


67


Gain (loss) on foreign currency transactions


1,544


(3,492

)


5,036


(144

)

Gain on sale of assets and other


2,130


85,779


(83,649

)


(98

)


(47,669

)


60,102


(107,771

)


(179

)

Income before income taxes


1,279,992


357,507


922,485


258


Income tax expense


301,853


54,766


247,087


451


Net income


978,139


302,741


675,398


223


Less net income attributable to noncontrolling interest


23,734


21,954


1,780


8


Net income attributable to HF Sinclair stockholders

$

954,405


$

280,787


$

673,618


240

%


Earnings per share attributable to HF Sinclair stockholders:


Basic

$

4.45


$

1.71


$

2.74


160

%

Diluted

$

4.45


$

1.71


$

2.74


160

%

Cash dividends declared per common share

$

0.40


$


$

0.40


100

%

Average number of common shares outstanding:


Basic


212,388


162,551


49,837


31

%

Diluted


212,388


162,551


49,837


31

%


EBITDA

$

1,463,240


$

482,647


$

980,593


203

%

Adjusted EBITDA

$

1,500,321


$

407,830


$

1,092,491


268

%


Nine Months Ended
September 30,


Change from 2021


2022


2021


Change


Percent


(In thousands, except per share data)

Sales and other revenues

$

29,219,912


$

12,766,475


$

16,453,437


129

%

Operating costs and expenses:


Cost of products sold:


Cost of products sold (exclusive of lower of cost or market inventory valuation adjustment)


23,457,180


10,608,892


12,848,288


121


Lower of cost or market inventory valuation adjustment


42,839


(318,862

)


361,701


(113

)


23,500,019


10,290,030


13,209,989


128


Operating expenses (exclusive of depreciation and amortization)


1,688,152


1,086,620


601,532


55


Selling, general and administrative expenses (exclusive of depreciation and amortization)


323,974


250,785


73,189


29


Depreciation and amortization


480,618


369,341


111,277


30


Total operating costs and expenses


25,992,763


11,996,776


13,995,987


117


Income from operations


3,227,149


769,699


2,457,450


319


Other income (expense):


Earnings (loss) of equity method investments


(7,261

)


8,875


(16,136

)


(182

)

Interest income


12,662


3,078


9,584


311


Interest expense


(118,650

)


(94,220

)


(24,430

)


26


Gain on tariff settlement


51,500


(51,500

)


(100

)

Gain (loss) on foreign currency transactions


778


(4,226

)


5,004


(118

)

Gain on sale of assets and other


8,345


95,596


(87,251

)


(91

)


(104,126

)


60,603


(164,729

)


(272

)

Income before income taxes


3,123,023


830,302


2,292,721


276


Income tax expense


706,675


149,944


556,731


371


Net income


2,416,348


680,358


1,735,990


255


Less net income attributable to noncontrolling interest


80,707


82,504


(1,797

)


(2

)

Net income attributable to HollyFrontier stockholders

$

2,335,641


$

597,854


$

1,737,787


291

%


Earnings per share attributable to HollyFrontier stockholders:


Basic

$

11.35


$

3.63


$

7.72


213

%

Diluted

$

11.35


$

3.63


$

7.72


213

%

Cash dividends declared per common share

$

0.80


$

0.35


$

0.45


129

%

Average number of common shares outstanding:


Basic


203,610


162,518


41,092


25

%

Diluted


203,610


162,518


41,092


25

%


EBITDA

$

3,628,922


$

1,208,281


$

2,420,641


200

%

Adjusted EBITDA

$

3,730,036


$

789,639


$

2,940,397


372

%

Balance Sheet Data


September 30,


December 31,


2022


2021


(In thousands)

Cash and cash equivalents

$

1,447,359


$

234,444

Working capital

$

3,585,175


$

1,696,990

Total assets

$

18,226,285


$

12,916,613

Long-term debt

$

3,334,200


$

3,072,737

Total equity

$

9,778,525


$

6,294,465

Segment Information

Effective the first quarter of 2022, we revised our reportable segments to align with certain changes in how our chief operating decision maker manages and allocates resources to our businesses. Accordingly, we created two new reportable segments, Renewables and Marketing. Our operations are now organized into five reportable segments, Refining, Renewables, Marketing, Lubricants and Specialty Products and HEP. Our operations that are not included in one of these five reportable segments are included in Corporate and Other. Intersegment transactions are eliminated in our consolidated financial statements and are included in Eliminations. Corporate and Other and Eliminations are aggregated and presented under the Corporate, Other and Eliminations column.

As a result of the Sinclair Transactions that closed on March 14, 2022, the operations of the acquired Sinclair businesses are reported in the Refining, Renewables, Marketing and HEP segments.

The Refining segment represents the operations of our El Dorado, Tulsa, Navajo and Woods Cross refineries and HF Sinclair Asphalt Company LLC (“Asphalt”). Also, effective with our acquisition that closed on November 1, 2021, the Refining segment includes our Puget Sound refinery, and effective with our acquisition that closed on March 14, 2022, includes our Sinclair (also referred to as Parco) and Casper refineries. Refining activities involve the purchase and refining of crude oil and wholesale marketing of refined products, such as gasoline, diesel fuel and jet fuel. These petroleum products are primarily marketed in the Mid-Continent, Southwest and Rocky Mountains extending into the Pacific Northwest geographic regions of the United States. Asphalt operates various asphalt terminals in Arizona, New Mexico and Oklahoma.

The Renewables segment represents the operations of the Cheyenne RDU, which was mechanically complete in the fourth quarter of 2021 and fully operational in the first quarter of 2022, the PTU at our Artesia, New Mexico facility, which was completed and fully operational in the first quarter of 2022 and the Artesia RDU, which was completed and fully operational in the second quarter of 2022. Also, effective with our acquisition that closed on March 14, 2022, the Renewables segment includes the Sinclair RDU. During the construction phase of our RDUs and PTU, operating expense and capital expenditures were reported in the Corporate and Other segment, and this financial information has been retrospectively adjusted to reflect our current segment presentation.

Effective with our acquisition that closed on March 14, 2022, the Marketing segment includes branded fuel sales through more than 300 distributors to more than 1,300 branded sites in the United States and licensing fees for the use of the Sinclair brand at more than 300 additional locations throughout the country.

The Lubricants and Specialty Products segment represents Petro-Canada Lubricants Inc.’s (“PCLI”) production operations, located in Mississauga, Ontario, that includes lubricant products such as base oils, white oils, specialty products and finished lubricants, and the operations of our Petro-Canada Lubricants business that includes the marketing of products to both retail and wholesale outlets through a global sales network with locations in Canada, the United States, Europe and China. Additionally, the Lubricants and Specialty Products segment includes specialty lubricant products produced at our Tulsa refineries that are marketed throughout North America and are distributed in Central and South America and the operations of Red Giant Oil Company LLC, one of the largest suppliers of locomotive engine oil in North America. Also, the Lubricants and Specialty Products segment includes Sonneborn, a producer of specialty hydrocarbon chemicals such as white oils, petrolatums and waxes with manufacturing facilities in the United States and Europe.

The HEP segment includes all of the operations of HEP, which owns and operates logistics and refinery assets consisting of petroleum product and crude oil pipelines, terminals, tankage, loading rack facilities and refinery processing units in the Mid-Continent, Southwest and Rocky Mountains geographic regions of the United States. The HEP segment also includes 50% ownership interests in each of the Osage Pipeline, the Cheyenne Pipeline and Cushing Connect, a 25.06% ownership interest in the Saddle Butte Pipeline and a 49.995% ownership interest in the Pioneer Pipeline. Revenues from the HEP segment are earned through transactions with unaffiliated parties for pipeline transportation, rental and terminalling operations as well as revenues relating to pipeline transportation services provided for our refining operations. Due to certain basis differences, our reported amounts for the HEP segment may not agree to amounts reported in HEP’s periodic public filings.


Refining


Renewables


Marketing


Lubricants
and Specialty
Products


HEP


Corporate,
Other and
Eliminations


Consolidated
Total


(In thousands)

Three Months Ended September 30, 2022

Sales and other revenues:


Revenues from external customers


$

8,230,606


$

254,952


$

1,266,681


$

820,630


$

26,133


$


$

10,599,002


Intersegment revenues


1,405,180


100,708


2,809


122,869


(1,631,566

)


$

9,635,786


$

355,660


$

1,266,681


$

823,439


$

149,002


$

(1,631,566

)


$

10,599,002


Cost of products sold (exclusive of lower of cost or market inventory)


$

7,680,153


$

345,588


$

1,255,119


$

696,864


$


$

(1,602,471

)


$

8,375,253


Lower of cost or market inventory valuation adjustment


$


$

16,847


$


$


$


$


$

16,847


Operating expenses


$

474,631


$

23,427


$


$

69,506


$

60,471


$

(23,444

)


$

604,591


Selling, general and administrative expenses


$

34,353


$

873


$

1,351


$

41,833


$

3,750


$

20,517


$

102,677


Depreciation and amortization


$

102,599


$

18,228


$

6,355


$

20,227


$

25,846


$

(1,282

)


$

171,973


Income (loss) from operations


$

1,344,050


$

(49,303

)


$

3,856


$

(4,991

)


$

58,935


$

(24,886

)


$

1,327,661


Income (loss) before interest and income taxes


$

1,344,103


$

(49,285

)


$

3,856


$

(4,978

)


$

43,096


$

(21,791

)


$

1,315,001


Net income attributable to noncontrolling interest


$


$


$


$


$

1,962


$

21,772


$

23,734


Loss of equity method investments


$


$


$


$


$

(16,334

)


$


$

(16,334

)

Capital expenditures


$

37,653


$

24,499


$

1,487


$

10,158


$

7,948


$

17,958


$

99,703


Contacts

Atanas H. Atanasov, Executive Vice President and
Chief Financial Officer
Craig Biery, Vice President,
Investor Relations
HF Sinclair Corporation
214-954-6510


Read full story here

ATHENS, Greece--(BUSINESS WIRE)--Danaos Corporation (“Danaos”) (NYSE: DAC), one of the world’s largest independent owners of containerships, today reported unaudited results for the period ended September 30, 2022.

Highlights for the Third Quarter and Nine Months Ended September 30, 2022:

  • Adjusted net income1 of $176.9 million, or $8.71 per share, for the three months ended September 30, 2022 compared to $109.5 million, or $5.32 per share, for the three months ended September 30, 2021, an increase of 61.6%. Adjusted net income1 of $569.3 million, or $27.67 per share, for the nine months ended September 30, 2022 compared to $236.4 million, or $11.49 per share, for the nine months ended September 30, 2021, an increase of 140.8%.
  • In September 2022, we sold all of our remaining 5,686,950 ZIM ordinary shares resulting in proceeds to us of $161.3 million.
  • Cash and cash equivalents amounted to $556.3 million as of September 30, 2022.
  • Operating revenues of $260.0 million for the three months ended September 30, 2022 compared to $195.9 million for the three months ended September 30, 2021, an increase of 32.7%. Operating revenues of $740.9 million for the nine months ended September 30, 2022 compared to $474.5 million for the nine months ended September 30, 2021, an increase of 56.1%.
  • Adjusted EBITDA1 of $213.1 million for the three months ended September 30, 2022 compared to $149.6 million for the three months ended September 30, 2021, an increase of 42.4%. Adjusted EBITDA1 of $674.7 million for the nine months ended September 30, 2022 compared to $349.6 million for the nine months ended September 30, 2021, an increase of 93.0%.
  • Total contracted cash operating revenues were $2.3 billion as of September 30, 2022 and remaining average contracted charter duration was 3.5 years, weighted by aggregate contracted charter hire.
  • Contracted operating days charter coverage currently stands at 100% for 2022 and 88.4% for 2023 while for the next 12 months, from September 30, 2022, charter coverage stands at 92.9%.
  • As of September 30, 2022, Net Debt2 was $398.9 million, Net Debt / LTM Adjusted EBITDA was 0.48x, while 15 of our vessels are debt-free currently.
  • As of the date of this release, we have repurchased 466,955 shares of our common stock in the open market for $28.6 million, under our share repurchase program of up to $100 million announced in June 2022.
  • The Company has reached an in-principle agreement with Citi and Alpha Bank to refinance the currently outstanding facility of $437.75 million and the transactions are expected to close within the 4th quarter of 2022. This refinancing, which remains subject to definitive documentation, is summarized as follows:
    • a $382.5 million Revolving Credit Facility with Citi reducing and repayable over 5 years in 20 quarterly reductions of $11.25 million each together with a final reduction of $157.5 million at maturity, in the 4th quarter of 2027.
    • a $55.25 million Term Loan with Alpha Bank repayable over 5 years with 20 consecutive quarterly installments of $1.875 million each together with a balloon payment of $17.75 million at maturity, in the 4th quarter of 2027.
  • Through this refinancing the Company will achieve the following:
    • Extension of maturity of the refinanced debt by 2.5 years and the creation of a 5-year runway without any of the Company’s bank debt maturing before 2027.
    • Given the Company’s strong liquidity position, the Revolving Credit Facility feature of Citi provides the Company with increased flexibility in managing debt capital and associated costs.
    • Improvement in pricing terms.
  • Pro-forma for the refinancing, the Company will triple the unencumbered and debt-free fleet to 45 vessels versus 15 vessels currently out of a total existing fleet of 71 vessels.
  • Danaos has declared a dividend of $0.75 per share of common stock for the third quarter of 2022, which is payable on November 30, 2022 to stockholders of record as of November 18, 2022.

Three and Nine Months Ended September 30, 2022

Financial Summary – Unaudited

(Expressed in thousands of United States dollars, except per share amounts)


Three months
ended


Three months
ended


Nine months
ended


Nine months
ended

September 30,

September 30,

September 30,

September 30,


2022


2021


2022


2021

Operating revenues

$260,037


$195,915


$740,861


$474,467

Net income

$66,800


$217,227


$406,489


$886,844

Adjusted net income1

$176,922


$109,547


$569,329


$236,418

Earnings per share, diluted

$3.29


$10.55


$19.75


$43.11

Adjusted earnings per share, diluted1

$8.71


$5.32


$27.67


$11.49

Diluted weighted average number of shares (in thousands)

20,318


20,598


20,579


20,571

Adjusted EBITDA1

$213,106


$149,621


$674,738


$349,639

1 Adjusted net income, adjusted earnings per share and adjusted EBITDA are non-GAAP measures. Refer to the reconciliation of net income to adjusted net income and net income to adjusted EBITDA provided below.

2 Net Debt is defined as total debt gross of the fair value of debt adjustment and deferred finance costs less cash and cash equivalents.

Danaos’ CEO Dr. John Coustas commented:

“This quarter marked the retreat of the container market from unsustainable stratospheric highs to more normalized levels, albeit still well above 2019 levels. The liner market has experienced a combination of supply chain normalization and demand destruction due to various factors. These include, but are not limited to, rampant inflation and declining GDP growth, the uncertainties created by the war in Ukraine and an energy crisis. This has been compounded by high inventories in warehouses and delayed collection of containers, both indirect impacts of easing of supply chain disruptions.

The drop in demand for containerized freight has also significantly reduced vessel demand from opportunistic market participants, who were aggressively contracting smaller vessels or extra loaders which were used during the peak of demand last year. This has led to a significant correction in the sub-3,000 TEU segment as charterers are on the sidelines waiting for the market to drop before they commit a vessel.

Charter periods have also been reduced to as little as six months for smaller vessels as charterers are waiting to see how the CII requirements will impact fleet scheduling and what additional slow steaming will be needed to meet the requirements.

Danaos is well-insulated from the current market environment and achieved record operating profit in the third quarter of 2022. Our commercial efforts earlier this year resulted in a number of new vessel fixtures for our vessels, and we ended the quarter with a multi-year backlog of $2.3 billion in contracted revenue. We have also continued to strengthen our balance sheet and we have now fully liquidated our shareholding in ZIM, as we stated we would. In addition, we have new commitments from our bank group to extend existing bank debt facilities until 2027. This means we have no significant capital requirements or refinancings until then, and we have the necessary flexibility to pursue our strategy of growth, share buybacks, and acquisitions. In fact, our net debt will be very close to zero by the end of this year, which protects Danaos from the recent dramatic increase in interest rates.

With a fortress balance sheet, we are looking at the future with great optimism and evaluating the steps that will keep Danaos at the forefront of the industry. Danaos’ management team is fully aligned with our shareholders, and we will continue working to enhance long term value of the company.”

Three months ended September 30, 2022 compared to the three months ended September 30, 2021

During the three months ended September 30, 2022, Danaos had an average of 71.0 containerships compared to 65.7 containerships during the three months ended September 30, 2021. Our fleet utilization for the three months ended September 30, 2022 was 97.1% compared to 97.7% for the three months ended September 30, 2021.

Our adjusted net income amounted to $176.9 million, or $8.71 per share, for the three months ended September 30, 2022 compared to $109.5 million, or $5.32 per share, for the three months ended September 30, 2021. We have adjusted our net income in the three months ended September 30, 2022 for the change in fair value of our investment in ZIM Integrated Shipping Services Ltd. (“ZIM”) of $107.3 million and a non-cash fees amortization of $2.8 million. Please refer to the Adjusted Net Income reconciliation table, which appears later in this earnings release.

The $67.4 million increase in adjusted net income for the three months ended September 30, 2022 compared to the three months ended September 30, 2021 is attributable mainly to a $64.1 million increase in operating revenues, a $11.0 million increase in dividends from ZIM (net of withholding taxes) and a $2.5 million decrease in net finance expenses, which were partially offset by a $10.2 million increase in total operating expenses.

On a non-adjusted basis, our net income amounted to $66.8 million, or $3.29 earnings per diluted share, for the three months ended September 30, 2022 compared to net income of $217.2 million, or $10.55 earnings per diluted share, for the three months ended September 30, 2021. Our net income for the three months ended September 30, 2022 includes a loss on our investment in ZIM of $84.0 million (net of withholding taxes on dividend).

Operating Revenues

Operating revenues increased by 32.7%, or $64.1 million, to $260.0 million in the three months ended September 30, 2022 from $195.9 million in the three months ended September 30, 2021.

Operating revenues for the three months ended September 30, 2022 reflect:

  • a $76.9 million increase in revenues in the three months ended September 30, 2022 compared to the three months ended September 30, 2021 mainly as a result of higher charter rates;
  • a $11.1 million increase in revenues in the three months ended September 30, 2022 compared to the three months ended September 30, 2021 due to the incremental revenue generated by newly acquired vessels;
  • a $4.5 million increase in revenues in the three months ended September 30, 2022 compared to the three months ended September 30, 2021 due to amortization of assumed time charters; and
  • a $28.4 million decrease in revenue in the three months ended September 30, 2022 compared to the three months ended September 30, 2021 due to lower non-cash revenue recognition in accordance with US GAAP.

Vessel Operating Expenses

Vessel operating expenses increased by $4.5 million to $39.2 million in the three months ended September 30, 2022 from $34.7 million in the three months ended September 30, 2021, primarily as a result of the increase in the average number of vessels in our fleet and an increase in the average daily operating cost for vessels on time charter to $6,173 per vessel per day for the three months ended September 30, 2022 compared to $5,918 per vessel per day for the three months ended September 30, 2021. The average daily operating cost increased mainly due to the COVID-19 and Ukraine war related increase in crew remuneration and increased insurance premiums in the three months ended September 30, 2022 compared to the three months ended September 30, 2021. Management believes that our daily operating costs remain among the most competitive in the industry.

Depreciation & Amortization

Depreciation & Amortization includes Depreciation and Amortization of Deferred Dry-docking and Special Survey Costs.

Depreciation

Depreciation expense increased by 10.0%, or $3.1 million, to $34.1 million in the three months ended September 30, 2022 from $31.0 million in the three months ended September 30, 2021 due to recent acquisitions of 6 vessels.

Amortization of Deferred Dry-docking and Special Survey Costs

Amortization of deferred dry-docking and special survey costs increased by $0.5 million to $3.1 million in the three months ended September 30, 2022 from $2.6 million in the three months ended September 30, 2021.

General and Administrative Expenses

General and administrative expenses decreased by $0.2 million, to $7.1 million in the three months ended September 30, 2022 from $7.3 million in the three months ended September 30, 2021.

Other Operating Expenses

Other Operating Expenses include Voyage Expenses.

Voyage Expenses

Voyage expenses increased by $2.3 million to $10.3 million in the three months ended September 30, 2022 from $8.0 million in the three months ended September 30, 2021 primarily as a result of the increase in commissions due to the increase in revenue per vessel and the increase in the average number of vessels in our fleet.

Interest Expense and Interest Income

Interest expense decreased by 11.6%, or $2.1 million, to $16.0 million in the three months ended September 30, 2022 from $18.1 million in the three months ended September 30, 2021. The decrease in interest expense is a combined result of:

  • a $1.5 million decrease in interest expense due to a decrease in our average indebtedness by $466.7 million between the two periods (average indebtedness of $971.3 million in the three months ended September 30, 2022 compared to average indebtedness of $1,438.0 million in the three months ended September 30, 2021), which was partially offset by an increase in our debt service cost by 1.46 percentage points, mainly as a result of increase in the reference rates;
  • a $0.8 million decrease in the amortization of deferred finance costs and debt discount;
  • a $1.3 million decrease in interest expense due to capitalized interest on our vessels under construction in the three months ended September 30, 2022 compared to none in the three months ended September 30, 2021; and
  • a $1.5 million reduction in the recognition through our income statement of accumulated accrued interest that had been accrued in 2018 in relation to two of our credit facilities that were refinanced on April 12, 2021 and subsequently fully repaid on May 15, 2022, at which point the remaining accumulated accrued interest of $26.9 million was recognized in gain on debt extinguishment.

As of September 30, 2022, our outstanding debt, gross of deferred finance costs, was $868.1 million, which includes $300 million aggregate principal amount of our Senior Notes, and our leaseback obligation was $79.6 million. These balances compare to debt of $1,165.5 million and a leaseback obligation of $242.9 million, gross of deferred finance costs, as of September 30, 2021.

Interest income increased by $1.2 million to $1.3 million in the three months ended September 30, 2022 compared to $0.1 million in the three months ended September 30, 2021 mainly as a result of increased interest income earned on time deposits in the three months ended September 30, 2022.

Gain/(loss) on investments

A loss on investments of $80.3 million in the three months ended September 30, 2022 consists of the change in fair value of our shareholding interest in ZIM of $107.3 million, which was offset in part by the dividends recognized on ZIM ordinary shares of $27.0 million. In the three months ended September 30, 2022, we sold all of our remaining 5,686,950 ZIM ordinary shares resulting in proceeds to us of $161.3 million.

Equity income on investments

Equity income on investments in Gemini Shipholdings Corporation (“Gemini”) decreased to nil in the three months ended September 30, 2022 compared to the non-cash gain of $64.1 million recognized upon our acquisition of the remaining 51% equity interest in Gemini on July 1, 2021.

Other finance expenses

Other finance expenses increased by $0.1 million to $0.2 million in the three months ended September 30, 2022 compared to $0.1 million in the three months ended September 30, 2021.

Loss on derivatives

Amortization of deferred realized losses on interest rate swaps remained stable at $0.9 million in each of the three months ended September 30, 2022 and September 30, 2021.

Other income, net

Other income, net was $0.4 million in the three months ended September 30, 2022 compared to $0.3 million in the three months ended September 30, 2021.

Income taxes

Income taxes were $3.8 million in the three months ended September 30, 2022, related to the taxes withheld on dividend income earned on ZIM ordinary shares compared to $4.1 million taxes withheld on dividend income in the three months ended September 30, 2021.

Adjusted EBITDA

Adjusted EBITDA increased by 42.4%, or $63.5 million, to $213.1 million in the three months ended September 30, 2022 from $149.6 million in the three months ended September 30, 2021. As outlined above, the increase is mainly attributable to a $59.6 million increase in operating revenues (net of $4.5 million increase in amortization of assumed time charters) and a $11.0 million increase in dividends from ZIM (net of withholding taxes) in the three months ended September 30, 2022, which were partially offset by a $7.1 million increase in total operating expenses. Adjusted EBITDA for the three months ended September 30, 2022 is adjusted for a $103.5 million change in fair value of the investment in ZIM and dividend withholding taxes and stock-based compensation of $0.1 million. Tables reconciling Adjusted EBITDA to Net Income can be found at the end of this earnings release.

Nine months ended September 30, 2022 compared to the nine months ended September 30, 2021

During the nine months ended September 30, 2022, Danaos had an average of 71.0 containerships compared to 61.9 containerships during the nine months ended September 30, 2021. Our fleet utilization for the nine months ended September 30, 2022 was 98.1% compared to 98.5% for the nine months ended September 30, 2021.

Our adjusted net income amounted to $569.3 million, or $27.67 per share, for the nine months ended September 30, 2022 compared to $236.4 million, or $11.49 per share, for the nine months ended September 30, 2021. We have adjusted our net income in the nine months ended September 30, 2022 for the change in fair value of our investment in ZIM of $176.4 million, gain on debt extinguishment of $22.9 million and a non-cash fees amortization of $9.4 million. Please refer to the Adjusted Net Income reconciliation table, which appears later in this earnings release.

The $332.9 million increase in adjusted net income for the nine months ended September 30, 2022 compared to the nine months ended September 30, 2021 is attributable mainly to a $266.4 million increase in operating revenues and a $134.9 million increase in dividends from ZIM (net of withholding taxes), which were partially offset by a $49.4 million increase in total operating expenses, a $11.1 million increase in net finance expenses, a $4.0 million decrease in our equity income from our investment in Gemini following our acquisition and full consolidation of Gemini since July 1, 2021 and a partial collection of common benefit claim of $3.9 million from Hanjin Shipping in the nine months ended September 30, 2021.

On a non-adjusted basis, our net income amounted to $406.5 million, or $19.75 earnings per diluted share, for the nine months ended September 30, 2022 compared to net income of $886.8 million, or $43.11 earnings per diluted share, for the nine months ended September 30, 2021. Our net income for the nine months ended September 30, 2022 includes a total loss on our investment in ZIM of $29.2 million (net of withholding taxes on dividend) and a gain on debt extinguishment of $22.9 million.

Operating Revenues

Operating revenues increased by 56.1%, or $266.4 million, to $740.9 million in the nine months ended September 30, 2022 from $474.5 million in the nine months ended September 30, 2021.

Operating revenues for the nine months ended September 30, 2022 reflect:

  • a $187.8 million increase in revenues in the nine months ended September 30, 2022 compared to the nine months ended September 30, 2021 mainly as a result of higher charter rates;
  • a $55.8 million increase in revenues in the nine months ended September 30, 2022 compared to the nine months ended September 30, 2021 due to the incremental revenue generated by newly acquired vessels;
  • a $36.9 million increase in revenues in the nine months ended September 30, 2022 compared to the nine months ended September 30, 2021 due to amortization of assumed time charters; and
  • a $14.1 million decrease in revenue in the nine months ended September 30, 2022 compared to the nine months ended September 30, 2021 due to lower non-cash revenue recognition in accordance with US GAAP.

Vessel Operating Expenses

Vessel operating expenses increased by $20.2 million to $118.9 million in the nine months ended September 30, 2022 from $98.7 million in the nine months ended September 30, 2021, primarily as a result of the increase in the average number of vessels in our fleet and an increase in the average daily operating cost for vessels on time charter to $6,314 per vessel per day for the nine months ended September 30, 2022 compared to $6,034 per vessel per day for the nine months ended September 30, 2021. The average daily operating cost increased mainly due to the COVID-19 and Ukraine war related increase in crew remuneration and increased insurance premiums in the nine months ended September 30, 2022 compared to the nine months ended September 30, 2021. Management believes that our daily operating costs remain among the most competitive in the industry.

Depreciation & Amortization

Depreciation & Amortization includes Depreciation and Amortization of Deferred Dry-docking and Special Survey Costs.

Depreciation

Depreciation expense increased by 22.1%, or $18.3 million, to $101.2 million in the nine months ended September 30, 2022 from $82.9 million in the nine months ended September 30, 2021 due to recent acquisitions of 11 vessels.

Amortization of Deferred Dry-docking and Special Survey Costs

Amortization of deferred dry-docking and special survey costs increased by $1.4 million to $9.0 million in the nine months ended September 30, 2022 from $7.6 million in the nine months ended September 30, 2021.

General and Administrative Expenses

General and administrative expenses decreased by $3.7 million to $21.7 million in the nine months ended September 30, 2022, from $25.4 million in the nine months ended September 30, 2021. The decrease was mainly attributable to decreased stock-based compensation.

Other Operating Expenses

Other Operating Expenses include Voyage Expenses.

Voyage Expenses

Voyage expenses increased by $9.7 million to $26.9 million in the nine months ended September 30, 2022 from $17.2 million in the nine months ended September 30, 2021 primarily as a result of the increase in commissions due to the increase in revenue per vessel and the increase in the average number of vessels in our fleet.

Interest Expense and Interest Income

Interest expense decreased by 4.3%, or $2.2 million, to $49.2 million in the nine months ended September 30, 2022 from $51.4 million in the nine months ended September 30, 2021. The decrease in interest expense is a combined result of:

  • a $5.8 million decrease in interest expense due to a decrease in our average indebtedness by $346.0 million between the two periods (average indebtedness of $1,159.3 million in the nine months ended September 30, 2022 compared to average indebtedness of $1,505.3 million in the nine months ended September 30, 2021), which was partially offset by an increase in our debt service cost by 0.63 percentage points, mainly as a result of increase in the reference rates;
  • a $3.0 million decrease in the amortization of deferred finance costs and debt discount;
  • a $2.0 million decrease in interest expense due to capitalized interest on our vessels under construction in the nine months ended September 30, 2022 compared to none in the nine months ended September 30, 2021; and
  • a $8.6 million reduction in the recognition through our income statement of accumulated accrued interest that had been accrued in 2018 in relation to two of our credit facilities that were refinanced on April 12, 2021 and subsequently fully repaid on May 15, 2022, at which point the remaining accumulated accrued interest of $26.

Contacts

Company Contact:
Evangelos Chatzis
Chief Financial Officer
Danaos Corporation
Athens, Greece
Tel.: +30 210 419 6480
E-Mail: This email address is being protected from spambots. You need JavaScript enabled to view it.

Iraklis Prokopakis
Senior Vice President and Chief Operating Officer
Danaos Corporation
Athens, Greece
Tel.: +30 210 419 6400
E-Mail: This email address is being protected from spambots. You need JavaScript enabled to view it.

Investor Relations and Financial Media
Rose & Company
New York
Tel. 212-359-2228
E-Mail: This email address is being protected from spambots. You need JavaScript enabled to view it.


Read full story here

  • Reported net income attributable to HEP of $42.0 million or $0.33 per unit
  • Announced quarterly distribution of $0.35 per unit
  • Reported EBITDA of $66.0 million and Adjusted EBITDA of $110.1 million

DALLAS--(BUSINESS WIRE)--Holly Energy Partners, L.P. ("HEP" or the "Partnership") (NYSE: HEP) today reported financial results for the third quarter of 2022. Net income attributable to HEP for the third quarter of 2022 was $42.0 million ($0.33 per basic and diluted limited partner unit), compared to $49.2 million ($0.46 per basic and diluted limited partner unit) for the third quarter of 2021.


Results for the third quarter of 2022 reflect the impact to our equity in earnings of equity method investments of HEP’s 50% share of incurred and estimated environmental remediation and recovery expenses, net of insurance proceeds received to date, associated with a release of crude oil on the Osage Pipe Line Company, LLC ("Osage") pipeline of $20.3 million. Excluding this impact, net income attributable to HEP for the third quarter of 2022 was $62.2 million ($0.49 per basic and diluted limited partner unit). The increase in net income attributable to HEP was mainly due to net income from Sinclair Transportation Company LLC ("Sinclair Transportation"), which was acquired on March 14, 2022, partially offset by higher interest expense and higher operating costs and expenses.

Distributable cash flow was $78.7 million for the third quarter of 2022, an increase of $11.9 million, or 17.8%, compared to the third quarter of 2021. The increase was mainly due to distributable cash flow related to Sinclair Transportation, partially offset by higher interest expense. HEP declared a quarterly cash distribution of $0.35 per unit on October 20, 2022.

Commenting on our 2022 third quarter results, Michael Jennings, Chief Executive Officer and President, stated, “HEP generated solid results during the quarter, supported by strong volumes in both our crude and refined product transportation and storage systems. We announced a quarterly distribution of $0.35 per unit and remain committed to our capital allocation strategy.”

“Looking forward, we expect strong performance across our portfolio, driven by seasonally high refinery utilization rates.”

Third Quarter 2022 Revenue Highlights

Revenues for the third quarter of 2022 were $149.0 million, an increase of $26.4 million compared to the third quarter of 2021. The increase was mainly due to revenues on our recently acquired Sinclair Transportation assets, higher revenues on our refinery processing units and rate increases that went into effect on July 1, 2022.

  • Revenues from our refined product pipelines were $31.4 million, an increase of $3.9 million compared to the third quarter of 2021. Shipments averaged 205.7 thousand barrels per day ("mbpd") compared to 162.3 mbpd for the third quarter of 2021. The revenue and volume increases were mainly due to higher volumes on our recently acquired Sinclair Transportation product pipelines, higher volumes on our UNEV pipeline and rate increases that went into effect on July 1, 2022. Revenues did not increase in proportion to volumes due to our recognition of a significant portion of the Sinclair Transportation refined product pipeline tariffs as interest income under sales-type lease accounting.
  • Revenues from our intermediate pipelines were $8.0 million, an increase of $0.5 million compared to the third quarter of 2021. Shipments averaged 137.0 mbpd for the third quarter of 2022 compared to 136.4 mbpd for the third quarter of 2021. The increase in revenue was mainly due to rate increases that went into effect on July 1, 2022.
  • Revenues from our crude pipelines were $37.7 million, an increase of $5.4 million compared to the third quarter of 2021. Shipments averaged 639.0 mbpd compared to 408.0 mbpd for the third quarter of 2021. The increase in volumes was mainly attributable to our Cushing Connect pipeline, which went into service in September 2021, volumes on our recently acquired Sinclair Transportation crude pipelines and higher volumes on our crude pipeline systems in New Mexico and Texas. The increase in revenues was mainly due to our recently acquired Sinclair Transportation crude pipelines, higher volumes on our crude pipeline systems in New Mexico and Texas and rate increases that went into effect on July 1, 2022. Revenues did not increase in proportion to volumes due to our recognition of most of the Cushing Connect pipeline tariffs and a significant portion of Sinclair Transportation crude pipeline tariffs as interest income under sales-type lease accounting.
  • Revenues from terminal, tankage and loading rack fees were $44.4 million, an increase of $11.1 million compared to the third quarter of 2021. Refined products and crude oil terminalled in the facilities averaged 620.9 mbpd compared to 472.2 mbpd for the third quarter of 2021. The increase in volumes was mainly due to our recently acquired Sinclair Transportation assets. Revenues increased mainly due to revenues on our recently acquired Sinclair Transportation assets and rate increases that went into effect on July 1, 2022.
  • Revenues from refinery processing units were $27.4 million, an increase of $5.5 million compared to the third quarter of 2021, and throughputs averaged 72.1 mbpd compared to 72.3 mbpd for the third quarter of 2021. Revenues increased mainly due to higher natural gas cost recoveries in revenues, higher throughput at our Woods Cross refinery processing units and rate increases that went into effect on July 1, 2022.

Nine Months Ended September 30, 2022 Revenue Highlights

Revenues for the nine months ended September 30, 2022, were $405.0 million, an increase of $29.0 million compared to the nine months ended September 30, 2021. The increase was mainly attributable to revenues on our recently acquired Sinclair Transportation assets and increased revenues from our UNEV assets, partially offset by lower revenues on our Cheyenne assets as a result of the conversion of HF Sinclair's Cheyenne refinery to renewable diesel production and lower revenues on our product pipelines servicing HF Sinclair's Navajo refinery. The nine months ended September 30, 2021 included the recognition of the $10 million termination fee related to the termination of HF Sinclair's minimum volume commitment on our Cheyenne assets.

  • Revenues from our refined product pipelines were $83.7 million, a decrease of $1.0 million compared to the nine months ended September 30, 2021. Shipments averaged 180.3 mbpd compared to 165.8 mbpd for the nine months ended September 30, 2021. The volume increase was mainly due to volumes on our recently acquired Sinclair Transportation assets and higher volumes on our UNEV pipeline, partially offset by lower volumes on our product pipelines servicing HF Sinclair's Navajo refinery due to lower throughput at the refinery. We recognized a significant portion of the Sinclair Transportation refined product pipeline tariffs as interest income under sales-type lease accounting.
  • Revenues from our intermediate pipelines were $23.0 million, an increase of $0.5 million compared to the nine months ended September 30, 2021. Shipments averaged 126.6 mbpd compared to 131.9 mbpd for the nine months ended September 30, 2021. The decrease in volumes was mainly due to lower throughputs on our intermediate pipelines servicing HF Sinclair's Navajo refinery while revenue increased due to contractual minimum volume guarantees and rate increases that went into effect on July 1, 2022.
  • Revenues from our crude pipelines were $103.6 million, an increase of $8.6 million compared to the nine months ended September 30, 2021. Shipments averaged 594.2 mbpd compared to 393.0 mbpd for the nine months ended September 30, 2021. The increase in volumes was mainly attributable to our Cushing Connect pipeline, which went into service in September 2021, volumes on our recently acquired Sinclair Transportation crude pipelines and higher volumes on our crude pipeline systems in New Mexico and Texas. The increase in revenues was mainly due to our recently acquired Sinclair Transportation crude pipelines and higher volumes on our crude pipelines in New Mexico and Texas. Revenues did not increase in proportion to volumes due to our recognition of most of the Cushing Connect pipeline tariffs and a significant portion of Sinclair Transportation crude pipeline tariffs as interest income under sales-type lease accounting.
  • Revenues from terminal, tankage and loading rack fees were $126.0 million, an increase of $17.6 million compared to the nine months ended September 30, 2021. Refined products and crude oil terminalled in the facilities averaged 575.2 mbpd compared to 436.9 mbpd for the nine months ended September 30, 2021. Volumes increased mainly due to volumes on our recently acquired Sinclair Transportation assets and higher throughputs at HF Sinclair's Tulsa refinery. Revenues increased mainly due to revenues on our recently acquired Sinclair Transportation assets, higher butane blending revenues, and higher revenues on our Tulsa assets. In addition, the nine months ended September 30, 2021 included the recognition of the $10 million termination fee related to the termination of HF Sinclair's minimum volume commitment on our Cheyenne assets as a result of the conversion of the HF Sinclair Cheyenne refinery to renewable diesel production.
  • Revenues from refinery processing units were $68.7 million, an increase of $3.3 million compared to the nine months ended September 30, 2021. Throughputs averaged 69.9 mbpd for both the nine months ended September 30, 2021 and 2022. Revenues increased mainly due to higher natural gas cost recoveries in revenues as well as rate increases that went into effect on July 1, 2022.

Operating Costs and Expenses Highlights

Operating costs and expenses were $89.5 million and $244.1 million for the three and nine months ended September 30, 2022, representing increases of $21.0 million and $25.3 million from the three and nine months ended September 30, 2021. The increases were mainly due to operating costs and expenses associated with our recently acquired Sinclair Transportation assets as well as higher employee costs, natural gas costs, maintenance costs and materials and supplies costs, partially offset by lower rentals and leases. In addition, the nine months ended September 30, 2021 included a goodwill impairment charge of $11.0 million related to our Cheyenne reporting unit.

Interest Expense and Interest Income Highlights

Interest expense was $23.0 million and $57.0 million for the three and nine months ended September 30, 2022, representing increases of $9.5 million and $16.4 million from the three and nine months ended September 30, 2021. The increases were mainly due to our April 2022 issuance of $400 million in aggregate principal amount of 6.375% senior unsecured notes maturing in April 2027 related to the funding of the cash portion of the Sinclair Transportation acquisition. In addition, market interest rates increased on our senior secured revolving credit facility.

Interest income for the three and nine months ended September 30, 2022, totaled $24.2 million and $61.2 million, representing increases of $17.4 million and $41.2 million compared to the three and nine months ended September 30, 2021. The increases were mainly due to higher sales-type lease interest income from our recently acquired Sinclair Transportation pipelines and terminals and our Cushing Connect pipeline, which was placed into service at the end of the third quarter of 2021.

Equity in Earnings of Equity Method Investments Highlights

Equity in earnings of equity method investments were losses of $16.3 million and $7.3 million for the three and nine months ended September 30, 2022, representing decreases of $20.0 million and $16.1 million compared to the three and nine months ended September 30, 2021. The decreases were mainly due to lower earnings from our equity method investment in Osage due to HEP’s 50% share of incurred and estimated environmental remediation and recovery expenses, net of insurance proceeds received to date, associated with a release of crude oil that occurred in the third quarter of 2022. Additional insurance recoveries will be recorded as they are received. Our share of the remaining insurance coverage is $12.5 million. The pipeline resumed operations in the third quarter of 2022 and remediation efforts are underway. The decrease in Osage was partially offset by equity in earnings from Pioneer Investments Corp., which was acquired as part of our Sinclair Transportation acquisition.

We have scheduled a conference call today at 8:30 AM Eastern Time to discuss financial results. This webcast may be accessed at:

https://events.q4inc.com/attendee/908108663

An audio archive of this webcast will be available using the above noted link through November 21, 2022.

About Holly Energy Partners, L.P.

Holly Energy Partners, L.P. ("HEP"), headquartered in Dallas, Texas, provides petroleum product and crude oil transportation, terminalling, storage and throughput services to the petroleum industry, including subsidiaries of HF Sinclair Corporation. HEP, through its subsidiaries and joint ventures, owns and/or operates petroleum product and crude pipelines, tankage and terminals in Colorado, Idaho, Iowa, Kansas, Missouri, Nevada, New Mexico, Oklahoma, Texas, Utah, Washington, and Wyoming, as well as refinery processing units in Kansas and Utah.

HF Sinclair Corporation, headquartered in Dallas, Texas, is an independent energy company that produces and markets high value light products such as gasoline, diesel fuel, jet fuel, renewable diesel and other specialty products. HF Sinclair owns and operates refineries located in Kansas, Oklahoma, New Mexico, Washington, Wyoming and Utah and markets its refined products principally in the Southwest U.S., the Rocky Mountains extending into the Pacific Northwest and in other neighboring Plains states. HF Sinclair supplies high-quality fuels to more than 1,300 Sinclair branded stations and licenses the use of the Sinclair brand at more than 300 additional locations throughout the country. In addition, subsidiaries of HF Sinclair produce and market base oils and other specialized lubricants in the U.S., Canada and the Netherlands, and exports products to more than 80 countries. Through its subsidiaries, HF Sinclair produces renewable diesel at two of its facilities in Wyoming and also at its facility in Artesia, New Mexico. HF Sinclair also owns a 47% limited partner interest and a non-economic general partner interest in Holly Energy Partners, L.P.

This press release contains various “forward-looking statements” within the meaning of the federal securities laws. These forward-looking statements are identified as any statement that does not relate strictly to historical or current facts. When used in this press release, words such as “anticipate,” “project,” “expect,” “will,” “plan,” “goal,” “forecast,” “strategy,” “intend,” “should,” “would,” “could,” “believe,” “may,” and similar expressions and statements regarding our plans and objectives for future operations are intended to identify forward-looking statements. These forward-looking statements are based on our beliefs and assumptions and those of our general partner using currently available information and expectations as of the date hereof, are not guarantees of future performance and involve certain risks and uncertainties, including those contained in our filings with the Securities and Exchange Commission (the “SEC”). Although we and our general partner believe that such expectations reflected in such forward-looking statements are reasonable, neither we nor our general partner can give assurance that our expectations will prove to be correct. All statements concerning our expectations for future results of operations are based on forecasts for our existing operations and do not include the potential impact of any future acquisitions. Our forward-looking statements are subject to a variety of risks, uncertainties and assumptions. If one or more of these risks or uncertainties materialize, or if underlying assumptions prove incorrect, our actual results may vary materially from those anticipated, estimated, projected or expected. Certain factors could cause actual results to differ materially from results anticipated in the forward-looking statements. These factors include, but are not limited to:

  • HF Sinclair’s and HEP’s ability to successfully integrate the Sinclair Oil Corporation (now known as Sinclair Oil LLC) and Sinclair Transportation businesses acquired from The Sinclair Companies (now known as REH Company) (collectively, the “Sinclair Transactions”), with its existing operations and fully realize the expected synergies of the Sinclair Transactions or on the expected timeline;
  • the demand for and supply of crude oil and refined products, including uncertainty regarding the effects of the continuing COVID-19 pandemic on future demand and increasing societal expectations that companies address climate change;
  • risks and uncertainties with respect to the actual quantities of petroleum products and crude oil shipped on our pipelines and/or terminalled, stored or throughput in our terminals and refinery processing units;
  • the economic viability of HF Sinclair, our other customers and our joint ventures’ other customers, including any refusal or inability of our or our joint ventures’ customers or counterparties to perform their obligations under their contracts;
  • the demand for refined petroleum products in the markets we serve;
  • our ability to purchase and integrate future acquired operations;
  • our ability to complete previously announced or contemplated acquisitions;
  • the availability and cost of additional debt and equity financing;
  • the possibility of temporary or permanent reductions in production or shutdowns at refineries utilizing our pipelines, terminal facilities and refinery processing units, due to reasons such as infection in the workforce, in response to reductions in demand, accidents, unexpected leaks or spills, unscheduled shutdowns, weather events, civil unrest, expropriation of assets, and other economic, diplomatic, legislative, or political events or developments, terrorism, cyberattacks, or other catastrophes or disruptions affecting our operations, terminal facilities, machinery, pipelines and other logistics assets, equipment, or information systems, or any of the foregoing of our suppliers, customers, or third-party providers or lower gross margins due to the economic impact of the COVID-19 pandemic, inflation and labor costs, and any potential asset impairments resulting from, or the failure to have adequate insurance coverage for or receive insurance recoveries from, such actions;
  • the effects of current and future government regulations and policies, including the effects of current and future restrictions on various commercial and economic activities in response to the COVID-19 pandemic and increases in interest rates;
  • delay by government authorities in issuing permits necessary for our business or our capital projects;
  • our and our joint venture partners' ability to complete and maintain operational efficiency in carrying out routine operations and capital construction projects;
  • the possibility of terrorist or cyberattacks and the consequences of any such attacks;
  • uncertainty regarding the effects and duration of global hostilities, including the Russia-Ukraine war, and any associated military campaigns which may disrupt crude oil supplies and markets for refined products and create instability in the financial markets that could restrict our ability to raise capital;
  • general economic conditions, including uncertainty regarding the timing, pace and extent of an economic recovery in the United States;
  • the impact of recent or proposed changes in the tax laws and regulations that affect master limited partnerships; and
  • other financial, operational and legal risks and uncertainties detailed from time to time in our SEC filings.

The forward-looking statements speak only as of the date made and, other than as required by law, we undertake no obligation to publicly update or revise any forward-looking statements, whether as a result of new information, future events or otherwise.

RESULTS OF OPERATIONS (Unaudited)

Income, Distributable Cash Flow and Volumes
The following tables present income, distributable cash flow and volume information for the three and nine months ended September 30, 2022 and 2021.


Three Months Ended September 30,


Change from


2022


2021


2021


(In thousands, except per unit data)

Revenues


Pipelines:


Affiliates – refined product pipelines

$

24,731


$

18,702


$

6,029


Affiliates – intermediate pipelines


7,988


7,537


451


Affiliates – crude pipelines


23,169


19,536


3,633


55,888


45,775


10,113


Third parties – refined product pipelines


6,694


8,799


(2,105

)

Third parties – crude pipelines


14,565


12,780


1,785


77,147


67,354


9,793


Terminals, tanks and loading racks:


Affiliates


39,557


29,436


10,121


Third parties


4,875


3,881


994


44,432


33,317


11,115


Refinery processing units - Affiliates


27,423


21,913


5,510


Total revenues


149,002


122,584


26,418


Operating costs and expenses


Operations


60,470


42,793


17,677


Depreciation and amortization


25,236


21,826


3,410


General and administrative


3,751


3,849


(98

)


89,457


68,468


20,989


Operating income


59,545


54,116


5,429


Equity in earnings of equity method investments


(16,334

)


3,689


(20,023

)

Interest expense, including amortization


(22,965

)


(13,417

)


(9,548

)

Interest income


24,234


6,835


17,399


Gain on sale of assets and other


494


77


417


(14,571

)


(2,816

)


(11,755

)

Income before income taxes


44,974


51,300


(6,326

)

State income tax expense


(38

)


4


(42

)

Net income


44,936


51,304


(6,368

)

Allocation of net income attributable to noncontrolling interests


(2,985

)


(2,144

)


(841

)

Net income attributable to Holly Energy Partners

$

41,951


$

49,160


$

(7,209

)

Limited partners’ earnings per unit – basic and diluted

$

0.33


$

0.46


$

(0.13

)

Weighted average limited partners’ units outstanding


126,440


105,440


21,000


EBITDA(1)

$

65,956


$

77,564


$

(11,608

)

Adjusted EBITDA(1)

$

110,092


$

83,270


$

26,822


Distributable cash flow(2)

$

78,731


$

66,810


$

11,921


Volumes (bpd)


Pipelines:


Affiliates – refined product pipelines


167,618


115,507


52,111


Affiliates – intermediate pipelines


137,049


136,398


651


Affiliates – crude pipelines


507,419


271,717


235,702


812,086


523,622


288,464


Third parties – refined product pipelines


38,040


46,834


(8,794

)

Third parties – crude pipelines


131,622


136,247


(4,625

)


981,748


706,703


275,045


Terminals and loading racks:


Affiliates


583,089


419,665


163,424


Third parties


37,782


52,541


(14,759

)


620,871


472,206


148,665


Refinery processing units - Affiliates


72,065


72,297


(232

)


Total for pipelines and terminal assets (bpd)


1,674,684


1,251,206


423,478


Nine Months Ended September 30,


Change from


2022


2021


2021


(In thousands, except per unit data)

Revenues


Pipelines:


Affiliates – refined product pipelines

$

62,511


$

56,520


$

5,991


Affiliates – intermediate pipelines


23,015


22,564


451


Affiliates – crude pipelines


62,417


58,241


4,176


147,943


137,325


10,618


Third parties – refined product pipelines


21,169


28,188


(7,019

)

Third parties – crude pipelines


41,134


36,667


4,467


210,246


202,180


8,066


Terminals, tanks and loading racks:


Affiliates


108,997


95,431


13,566


Third parties


17,008


12,955


4,053


126,005


108,386


17,619


Refinery processing units - Affiliates


68,719


65,436


3,283


Total revenues


404,970


376,002


28,968


Operating costs and expenses


Operations


156,994


126,226


30,768


Depreciation and amortization


74,397


71,894


2,503


General and administrative


12,745


9,664


3,081


Goodwill impairment


11,034


(11,034

)


244,136


218,818


25,318


Operating income


160,834


157,184


3,650


Equity in earnings of equity method investments


(7,261

)


8,875


(16,136

)

Interest expense, including amortization


(56,951

)


(40,595

)


(16,356

)

Interest income


61,212


19,997


41,215


Gain on sales-type leases


24,677


(24,677

)

Other income (loss)


640


5,994


(5,354

)


(2,360

)


18,948


(21,308

)

Income before income taxes


158,474


176,132


(17,658

)

State income tax expense


(83

)


(60

)


(23

)

Net income


158,391


176,072


(17,681

)

Allocation of net income attributable to noncontrolling interests


(10,089

)


(6,770

)


(3,319

)

Net income attributable to Holly Energy Partners

$

148,302


$

169,302


$

(21,000

)

Limited partners’ earnings per unit—basic and diluted

$

1.22


$

1.60


$

(0.38

)

Weighted average limited partners’ units outstanding


120,902


105,440


15,462


EBITDA(1)

$

218,521


$

261,854


$

(43,333

)

Adjusted EBITDA(1)

$

299,673


$

259,466


$

40,207


Distributable cash flow(2)

$

221,643


$

206,707


$

14,936


Volumes (bpd)


Pipelines:


Affiliates – refined product pipelines


138,608


118,033


20,575


Affiliates – intermediate pipelines


126,550


131,873


(5,323

)

Affiliates – crude pipelines


460,641


261,117


199,524


725,799


511,023


214,776


Third parties – refined product pipelines


41,646


47,805


(6,159

)

Third parties – crude pipelines


133,598


131,842


1,756


901,043


690,670


210,373


Terminals and loading racks:


Affiliates


534,305


386,400


147,905


Third parties


40,923


50,542


(9,619

)


575,228


436,942


138,286


Refinery processing units - Affiliates


69,903


69,904


(1

)


Total for pipelines and terminal assets (bpd)


1,546,174


1,197,516


348,658


Contacts

John Harrison, Senior Vice President,
Chief Financial Officer and Treasurer
Craig Biery, Vice President, Investor Relations
Holly Energy Partners, L.P.
214-954-6511


Read full story here

OAKLAND, Calif.--(BUSINESS WIRE)--As rain and snow move into California, emergency crews across the Pacific Gas & Electric Company (PG&E) service area are ready to safely respond to possible storm-related outages.

Stormy weather that entered the area beginning Sunday is expected to bring widespread rain showers to much of the state and snow to some areas, potentially as low as at 2,500 feet, in Sierra Nevada. Another wave of gusty winds is expected along with moderate rain and heavy snow Tuesday morning, followed by the potential for thunderstorms in the afternoon.

Safety Crews and Equipment

In anticipation of widespread winter storm conditions, PG&E activated its Emergency Operations Center on Sunday, Nov. 6 and has positioned personnel and equipment to safely and quickly respond to potential weather-related outages.

In advance of the storm, PG&E’s vegetation management crews will be working to keep trees away from powerlines during the forecasted wet and windy weather to reduce the risk of outages caused by downed trees and other vegetation.

Adverse weather conditions are expected to peak on Tuesday as unstable air and moisture remain throughout Northern California causing widespread showers at lower elevations and snow in colder, higher elevation locations.

Wet and hazardous weather could linger into Wednesday in some locations ahead of mostly fair and dry conditions on Thursday. Although another, weaker system could bring more wet weather on the weekend.

PG&E’s meteorology team has developed a Storm Outage Prediction Model that incorporates real-time weather forecasts, historical data and system knowledge to predict where and when storm impacts will be most severe. This model enables the company to pre-stage crews and equipment as storms approach to enable rapid response to outages.

PG&E is urging its customers to take the necessary steps to be prepared and stay safe throughout the winter.

Safety Tips

  • Never touch downed wires: If you see a downed power line, assume it is energized and extremely dangerous. Do not touch or try to move it—and keep children and animals away. Report downed power lines immediately by calling 911 and by calling PG&E at 1-800-743-5002.
  • Use flashlights, not candles: During a power outage, use battery-operated flashlights, and not candles, due to the risk of fire. If you must use candles, please keep them away from drapes, lampshades and small children. Do not leave candles unattended.
  • Have a backup phone: If you have a telephone system that requires electricity to work, such as a cordless phone or answering machine, plan to have a standard telephone or cellular phone ready as a backup.
  • Have fresh drinking water, ice: Freeze plastic containers filled with water to make blocks of ice that can be placed in your refrigerator/freezer during an outage to prevent foods from spoiling. Blue Ice from your picnic cooler also works well in the freezer.
  • Use generators safely: Customers with standby electric generators should make sure they are properly installed by a licensed electrician in a well-ventilated area. Improperly installed generators pose a significant danger to customers, as well as crews working on power lines. If using portable generators, be sure they are in a well-ventilated area.
  • Turn off appliances: If you experience an outage, unplug or turn off all electrical appliances to avoid overloading circuits and to prevent fire hazards when power is restored. Simply leave a single lamp on to alert you when power returns. Turn your appliances back on one at a time when conditions return to normal.
  • Safely clean up: After the inclement weather has passed, be sure to safely clean up. Never touch downed wires and always call 811 or visit 811express.com at least two full business days before digging to have all underground utilities safely marked.

Other tips can be found at pge.com/beprepared

About PG&E

Pacific Gas and Electric Company, a subsidiary of PG&E Corporation (NYSE:PCG), is a combined natural gas and electric utility serving more than 16 million people across 70,000 square miles in Northern and Central California. For more information, visit www.pge.com/ and http://www.pge.com/about/newsroom/.


Contacts

MEDIA RELATIONS:
415-973-5930

  • Revenue, net income and adjusted EBITDAA of $167.4 million, $14.3 million and $32.6 million, respectively, for the third quarter of 2022
  • Third quarter 2022 basic earnings per share of $0.46
  • For the third quarter of 2022 the Company generated ROICB of 28.8%
  • Total liquidity position of $88.2 million as of September 30, 2022
  • During Q3, repurchased additional bonds with a face value of $13.0 million for a total purchase price of $10.1 million, leaving $307.3 million of senior notes outstanding

HOUSTON--(BUSINESS WIRE)--Nine Energy Service, Inc. ("Nine" or the "Company") (NYSE: NINE) reported third quarter 2022 revenues of $167.4 million, net income of $14.3 million and adjusted EBITDA of $32.6 million. For the third quarter of 2022, adjusted net incomeC was $12.2 million, or $0.39 adjusted basic earnings per shareD.


The Company had provided original third quarter 2022 revenue guidance between $145.0 and $155.0 million, with actual results falling above the provided range and representing a sequential revenue increase of approximately 18% quarter over quarter.

Q3 was a very strong quarter for Nine,” said Ann Fox, President and Chief Executive Officer, Nine Energy Service, “driven mostly by price increases across our service lines, as well as increased volumes within completion tools, which enabled us to drive strong incremental margins again this quarter.”

De-levering the balance sheet continues to be a top priority for Nine. During Q3, we repurchased $13.0 million par value of bonds for $10.1 million of cash or 77.7% of par, leaving $307.3 million outstanding. I am extremely happy with our team’s ability to take over $90 million of debt off the balance sheet, while also maintaining strong liquidity throughout one of the most volatile environments we have faced. The Company is poised to generate free cash flow going forward and we plan to continue to reduce our financial leverage. Going forward, we believe that Nine can de-lever through a combination of growth in profitability, as well as reduction in net debt.”

All of our service lines performed well this quarter and cementing continues to outperform the market, increasing sequential revenue by approximately 16%, versus the average U.S. rig count, which increased by approximately 7%. We continue to grow our completion tool business through both new technology and market share gains. In Q3, we increased the total number of dissolvable plugs sold by approximately 34% quarter over quarter, despite EIA reported completions remaining flat. Today, we believe we have a leading market share position within the U.S. dissolvable plug market. Along with the U.S. market, the international markets could provide growth opportunities for Nine. Our R&D team in Norway recently completed and received API-Q1 certification for our multi-cycle barrier valve for a large Middle Eastern national oil company (“NOC”). We have received approximately $10 million in purchase orders pursuant to an NOC bid process, with opportunities to obtain additional purchase orders moving forward. I am extremely proud of Nine’s R&D capabilities, which have provided new opportunities in the international markets.”

The overall market has been volatile; however, we remain positive about Nine’s outlook into 2023 and beyond. There are and will continue to be numerous factors that will influence global supply and demand, but we believe North American shale production will be critical for global supply. We do think capital discipline for both operators and oilfield service providers will continue into 2023 keeping the market tight; however, we believe the constraints on oilfield service equipment will continue, and incremental rig activity moving forward should put upward pressure on pricing and drive net margin.”

We do expect to see some seasonality impacts into Q4, especially as our customers remain focused on staying within capital budgets. With what we know today, we anticipate revenue to be relatively flat sequentially for Q4, with growth returning as we enter Q1 of 2023.”

We have proven Nine’s ability to generate strong growth and earnings within the current rig environment. As we have strategically shifted more of our top line exposure to both completion tools and cementing, we are starting to see the positive impacts this will have on our free cash flow generation, which we expect to continue into 2023. While we do anticipate activity increases into 2023, we do not believe we need significant activity increases in 2023 to continue to grow both our revenue and expand our margin.”

Nine’s geographic and service line diversity positions us well for this next cycle. We believe we have differentiation in the service lines in which we operate with a strategy towards more profitability even within a more moderated growth environment in 2023.”

Operating Results

During the third quarter of 2022, the Company reported revenues of $167.4 million, gross profit of $35.0 million and adjusted gross profitE of $44.0 million. Gross profit increased by approximately 77% quarter over quarter, and adjusted gross profit increased by approximately 49% quarter over quarter. During the third quarter, the Company generated ROIC of 28.8%.

During the third quarter of 2022, the Company reported selling, general and administrative expense of $13.5 million. Depreciation and amortization expense in the third quarter of 2022 was $9.5 million.

The Company’s tax provision for the third quarter of 2022 was approximately $0.5 million and $0.08 million year to date. The provision for 2022 is the result of our tax position in state and non-U.S. tax jurisdictions.

Liquidity and Capital Expenditures

During the third quarter of 2022, the Company reported net cash provided by operating activities of $15.1 million. Capital expenditures totaled $4.6 million during the third quarter of 2022.

As of September 30, 2022, Nine’s cash and cash equivalents were $21.5 million, and the Company had $66.7 million of availability under the revolving credit facility, resulting in a total liquidity position of $88.2 million as of September 30, 2022. On September 30, 2022, the Company had $27.0 million of borrowings under the 2018 ABL Credit Facility. In the fourth quarter of 2022 to date, the Company borrowed an additional $5.0 million, net.

During the third quarter, the Company repurchased $13.0 million of the senior notes for a repurchase price of $10.1 million in cash. As a result, the Company recorded a $2.8 million gain on extinguishment of debt with no cash tax obligation. To date, the Company has repurchased $92.7 million of the senior notes for a repurchase price of $32.9 million in cash, leaving $307.3 million of bonds outstanding.

ABCDESee end of press release for definitions

Conference Call Information

The call is scheduled for Monday, November 7, 2022, at 9:00 am Central Time. Participants may join the live conference call by dialing U.S. (Toll Free): (877) 524-8416 or International: (412) 902-1028 and asking for the “Nine Energy Service Earnings Call”. Participants are encouraged to dial into the conference call ten to fifteen minutes before the scheduled start time to avoid any delays entering the earnings call.

For those who cannot listen to the live call, a telephonic replay of the call will be available through November 21, 2022, and may be accessed by dialing U.S. (Toll Free): (877) 660-6853 or International: (201) 612-7415 and entering the passcode of 13732302.

About Nine Energy Service

Nine Energy Service is an oilfield services company that offers completion solutions within North America and abroad. The Company brings years of experience with a deep commitment to serving clients with smarter, customized solutions and world-class resources that drive efficiencies. Serving the global oil and gas industry, Nine continues to differentiate itself through superior service quality, wellsite execution and cutting-edge technology. Nine is headquartered in Houston, Texas with operating facilities in the Permian, Eagle Ford, SCOOP/STACK, Niobrara, Barnett, Bakken, Marcellus, Utica and Canada.

For more information on the Company, please visit Nine’s website at nineenergyservice.com.

Forward Looking Statements

The foregoing contains forward-looking statements within the meaning of Section 27A of the Securities Act of 1933 and Section 21E of the Securities Exchange Act of 1934. Forward-looking statements are those that do not state historical facts and are, therefore, inherently subject to risks and uncertainties. Forward-looking statements also include statements that refer to or are based on projections, uncertain events or assumptions. The forward-looking statements included herein are based on current expectations and entail various risks and uncertainties that could cause actual results to differ materially from those forward-looking statements. Such risks and uncertainties include, among other things, the level of capital spending and well completions by the onshore oil and natural gas industry, which may be affected by geopolitical and economic developments in the U.S. and globally, including conflicts, instability, acts of war or terrorism in oil producing countries or regions, particularly Russia, the Middle East, South America and Africa, as well as actions by members of the Organization of the Petroleum Exporting Countries and other oil exporting nations, and which has been and may again be affected by the COVID-19 pandemic and related economic repercussions; general economic conditions and inflation, particularly, cost inflation with labor or materials; the adequacy of the Company’s capital resources and liquidity, including the ability to meet its debt obligations, which may including refinancing or restructuring its indebtedness by seeking additional sources of capital, selling assets, or a combination thereof; equipment and supply chain constraints; the Company’s ability to attract and retain key employees, technical personnel and other skilled and qualified workers; the Company’s ability to maintain existing prices or implement price increases on our products and services; pricing pressures, reduced sales, or reduced market share as a result of intense competition in the markets for the Company’s dissolvable plug products; conditions inherent in the oilfield services industry, such as equipment defects, liabilities arising from accidents or damage involving our fleet of trucks or other equipment, explosions and uncontrollable flows of gas or well fluids, and loss of well control; the Company’s ability to implement and commercialize new technologies, services and tools; the Company’s ability to grow its completion tool business; the Company’s ability to manage capital expenditures; the Company’s ability to accurately predict customer demand, including that of its international customers; the loss of, or interruption or delay in operations by, one or more significant customers, including certain of the Company’s customers outside of the United States; the loss of or interruption in operations of one or more key suppliers; the incurrence of significant costs and liabilities resulting from litigation; changes in laws or regulations regarding issues of health, safety and protection of the environment; and other factors described in the “Risk Factors” and “Business” sections of the Company’s most recently filed Annual Report on Form 10-K and subsequently filed Quarterly Reports on Form 10-Q and Current Reports on Form 8-K. Readers are cautioned not to place undue reliance on forward-looking statements, which speak only as of the date hereof, and, except as required by law, the Company undertakes no obligation to update those statements or to publicly announce the results of any revisions to any of those statements to reflect future events or developments.

NINE ENERGY SERVICE, INC.

CONDENSED CONSOLIDATED STATEMENTS OF INCOME AND COMPREHENSIVE INCOME (LOSS)

(In Thousands, Except Share and Per Share Amounts)

(Unaudited)


Three Months Ended

September 30,
2022

June 30,
2022


Revenues

$

167,432


$

142,346


Cost and expenses

Cost of revenues (exclusive of depreciation and

amortization shown separately below)


123,418


112,741


General and administrative expenses


13,475


12,455


Depreciation


6,593


6,511


Amortization of intangibles


2,896


3,768


Loss on revaluation of contingent liability


46


186


Loss on sale of property and equipment


1,242


267


Income from operations


19,762


6,418


Interest expense


8,125


8,133


Gain on extinguishment of debt


(2,843

)


-


Interest income


(134

)


(25

)

Other income


(161

)


(190

)

Income (loss) before income taxes


14,775


(1,500

)

Provision (benefit) for income taxes


489


(522

)

Net income (loss)

$

14,286


$

(978

)


Earnings (loss) per share

Basic

$

0.46


$

(0.03

)

Diluted

$

0.45


$

(0.03

)

Weighted average shares outstanding

Basic


31,100,712


30,832,566


Diluted


31,932,613


30,832,566


Other comprehensive income (loss), net of tax

Foreign currency translation adjustments, net of tax of $0 and $0

$

(225

)

$

(174

)

Total other comprehensive loss, net of tax


(225

)


(174

)

Total comprehensive income (loss)

$

14,061


$

(1,152

)

NINE ENERGY SERVICE, INC.

CONDENSED CONSOLIDATED BALANCE SHEETS

(In Thousands)

(Unaudited)


September 30,
2022

June 30,
2022


Assets

Current assets

Cash and cash equivalents

$

21,490


$

22,408


Accounts receivable, net


103,881


88,245


Income taxes receivable


1,184


1,726


Inventories, net


52,959


48,950


Prepaid expenses and other current assets


9,123


11,362


Total current assets


188,637


172,691


Property and equipment, net


75,658


77,993


Operating lease right-of-use assets, net


35,934


34,143


Finance lease right-of-use assets, net


598


1,398


Intangible assets, net


105,840


108,736


Other long-term assets


808


784


Total assets

$

407,475


$

395,745


Liabilities and Stockholders’ Equity (Deficit)

Current liabilities

Accounts payable

$

38,145


$

35,470


Accrued expenses


29,374


22,980


Current portion of long-term debt


27,281


27,805


Current portion of operating lease obligations


7,438


6,458


Current portion of finance lease obligations


420


644


Total current liabilities


102,658


93,357


Long-term liabilities

Long-term debt


305,631


318,147


Long-term operating lease obligations


29,612


28,974


Other long-term liabilities


1,659


1,586


Total liabilities


439,560


442,064


Stockholders’ equity (deficit)

Common stock (120,000,000 shares authorized at $.01 par value; 33,233,106 and 33,369,148 shares issued and outstanding at September 30, 2022 and June 30, 2022, respectively)


332


334


Additional paid-in capital


774,510


774,335


Accumulated other comprehensive loss


(4,926

)


(4,701

)

Accumulated deficit


(802,001

)


(816,287

)

Total stockholders’ equity (deficit)


(32,085

)


(46,319

)

Total liabilities and stockholders’ equity (deficit)

$

407,475


$

395,745


NINE ENERGY SERVICE, INC.

CONDENSED CONSOLIDATED STATEMENTS OF CASH FLOWS

(In Thousands)

(Unaudited)

Three Months Ended

September 30,
2022

June 30,
2022


Cash flows from operating activities

Net income (loss)

$

14,286


$

(978

)

Adjustments to reconcile net income (loss) to net cash provided by (used in) operating activities

Depreciation


6,593


6,511


Amortization of intangibles


2,896


3,768


Amortization of deferred financing costs


634


642


Amortization of operating leases


2,242


2,035


Gain on extinguishment of debt


(2,843

)


-


Provision (recovery) of doubtful accounts


4


(4

)

Provision for inventory obsolescence


603


886


Stock-based compensation expense


521


495


Loss on sale of property and equipment


1,242


267


Loss on revaluation of contingent liability


46


186


Changes in operating assets and liabilities, net of effects from acquisitions

Accounts receivable, net


(15,696

)


(8,514

)

Inventories, net


(4,733

)


(3,972

)

Prepaid expenses and other current assets


1,277


2,788


Accounts payable and accrued expenses


9,709


(1,835

)

Income taxes receivable/payable


542


(615

)

Other assets and liabilities


(2,203

)


(2,090

)

Net cash provided by (used in) operating activities


15,120


(430

)

Cash flows from investing activities

Proceeds from sales of property and equipment


797


101


Purchases of property and equipment


(5,417

)


(3,068

)

Net cash used in investing activities


(4,620

)


(2,967

)

Cash flows from financing activities

Payments on Magnum Promissory Notes


(282

)


-


Proceeds from 2018 ABL Credit Facility


-


7,000


Purchases of Senior Notes


(10,081

)


-


Payments of short-term debt


(242

)


(363

)

Payments on finance leases


(331

)


(339

)

Payments of contingent liability


(43

)


(48

)

Vesting of restricted stock and stock units


(348

)


(296

)

Net cash provided by (used in) financing activities


(11,327

)


5,954


Impact of foreign currency exchange on cash


(91

)


(90

)

Net increase (decrease) in cash and cash equivalents


(918

)


2,467


Cash and cash equivalents

Beginning of period


22,408


19,941


End of period

$

21,490


$

22,408


NINE ENERGY SERVICE, INC.

RECONCILIATION OF ADJUSTED EBITDA

(In Thousands)

(Unaudited)


Three Months Ended

September 30,
2022

June 30,
2022

EBITDA reconciliation:

Net income (loss)

$

14,286


$

(978

)

Interest expense


8,125


8,133


Interest income


(134

)


(25

)

Provision (benefit) for income taxes


489


(522

)

Depreciation


6,593


6,511


Amortization of intangibles


2,896


3,768


EBITDA

$

32,255


$

16,887


Loss on revaluation of contingent liability (1)


46


186


Gain on extinguishment of debt


(2,843

)


-


Restructuring charges


729


805


Stock-based compensation and cash award expense


1,113


758


Loss on sale of property and equipment


1,242


267


Legal fees and settlements (2)


10


11


Adjusted EBITDA

$

32,552


$

18,914


(1) Amounts relate to the revaluation of contingent liability associated with a 2018 acquisition.


(2) Amounts represent fees, legal settlements and/or accruals associated with legal proceedings brought pursuant to the Fair Labor Standards Act and/or similar state laws.


NINE ENERGY SERVICE, INC.

RECONCILIATION OF ROIC CALCULATION

(In Thousands)

(Unaudited)


Three Months Ended

September 30,
2022

June 30,
2022


Net income (loss)

$

14,286


$

(978

)

Add back:

Interest expense


8,125


8,133


Interest income


(134

)


(25

)

Gain on extinguishment of debt


(2,843

)


-


Restructuring charges


729


805


After-tax net operating income

$

20,163


$

7,935


Total capital as of prior period-end:

Total stockholders' deficit

$

(46,319

)

$

(45,366

)

Total debt


348,148


341,511


Less: cash and cash equivalents


(22,408

)


(19,941

)

Total capital as of prior period-end:

$

279,421


$

276,204


Total capital as of period-end:

Total stockholders' deficit

$

(32,085

)

$

(46,319

)

Total debt


334,620


348,148


Less: cash and cash equivalents


(21,490

)


(22,408

)

Total capital as of period-end:

$

281,045


$

279,421


Average total capital

$

280,233


$

277,813


ROIC


28.8

%


11.4

%

NINE ENERGY SERVICE, INC.

RECONCILIATION OF ADJUSTED GROSS PROFIT (LOSS)

(In Thousands)

(Unaudited)


Three Months Ended

September 30,
2022

June 30,
2022

Calculation of gross profit

Revenues

$

167,432

$

142,346

Cost of revenues (exclusive of depreciation and

amortization shown separately below)


123,418


112,741

Depreciation (related to cost of revenues)


6,131


6,055

Amortization of intangibles


2,896


3,768

Gross profit

$

34,987


$

19,782


Adjusted gross profit reconciliation

Gross profit

$

34,987

$

19,782

Depreciation (related to cost of revenues)


6,131


6,055

Amortization of intangibles


2,896


3,768

Adjusted gross profit

$

44,014


$

29,605

NINE ENERGY SERVICE, INC.

RECONCILIATION OF ADJUSTED NET INCOME (LOSS) AND ADJUSTED BASIC EARNINGS (LOSS) PER SHARE CALCULATION

(In Thousands)

(Unaudited)


Three Months Ended

September 30,
2022


June 30,
2022

Reconciliation of adjusted net income (loss):

Net income (loss)

$

14,286


$

(978

)

Add back:

Gain on extinguishment of debt (a)


(2,843

)


-


Restructuring charges


729


805


Adjusted net income (loss)

$

12,172


$

(173

)


Weighted average shares

Weighted average shares outstanding for basic


31,100,712


30,832,566


and adjusted basic earnings (loss) per share


Earnings (loss) per share:

Basic earnings (loss) per share

$

0.46


$

(0.03

)

Adjusted basic earnings (loss) per share

$

0.39


$

(0.01

)


(a) Amount represents the difference between the repurchase price and the carrying amount of Senior Notes repurchased during the respective period.


AAdjusted EBITDA is defined as net income (loss) before interest, taxes, and depreciation and amortization, further adjusted for (i) goodwill, intangible asset, and/or property and equipment impairment charges, (ii) transaction and integration costs related to acquisitions, (iii) loss or gain on revaluation of contingent liabilities, (iv) loss or gain on the extinguishment of debt, (v) loss or gain on the sale of subsidiaries, (vi) restructuring charges, (vii) stock-based compensation and cash award expense, (viii) loss or gain on sale of property and equipment, and (ix) other expenses or charges to exclude certain items which we believe are not reflective of ongoing performance of our business, such as legal expenses and settlement costs related to litigation outside the ordinary course of business. Management believes Adjusted EBITDA is useful because it allows us to more effectively evaluate our operating performance and compare the results of our operations from period to period without regard to our financing methods or capital structure and helps identify underlying trends in our operations that could otherwise be distorted by the effect of the impairments, acquisitions and dispositions and costs that are not reflective of the ongoing performance of our business.

BReturn on Invested Capital (“ROIC”) is defined as after-tax net operating profit (loss), divided by average total capital. We define after-tax net operating profit (loss) as net income (loss) plus (i) goodwill, intangible asset, and/or property and equipment impairment charges, (ii) transaction and integration costs related to acquisitions, (iii) interest expense (income), (iv) restructuring charges, (v) loss (gain) on the sale of subsidiaries, (vi) loss (gain) on extinguishment of debt, and (vii) the provision (benefit) for deferred income taxes. We define total capital as book value of equity (deficit) plus the book value of debt less balance sheet cash and cash equivalents. We compute the average of the current and prior period-end total capital for use in this analysis. Management believes ROIC provides useful information because it quantifies how well we generate operating income relative to the capital we have invested in our business and illustrates the profitability of a business or project taking into account the capital invested.

CAdjusted Net Income (Loss) is defined as net income (loss) adjusted for (i) goodwill, intangible asset, and/or property and equipment impairment charges, (ii) transaction and integration costs related to acquisitions, (iii) restructuring charges, (iv) loss or gain on the sale of subsidiaries, (v) loss or gain on the extinguishment of debt and (vi) the tax impact of such adjustments. Management believes Adjusted Net Income (Loss) is useful because it allows us to more effectively evaluate our operating performance and compare the results of our operations from period to period and helps identify underlying trends in our operations that could otherwise be distorted by the effect of the impairments and acquisitions.


Contacts

Nine Energy Service Investor Contact:
Heather Schmidt
Vice President, Strategic Development, Investor Relations and Marketing
(281) 730-5113
This email address is being protected from spambots. You need JavaScript enabled to view it.


Read full story here

HOUSTON--(BUSINESS WIRE)--Aris Water Solutions, Inc. (NYSE: ARIS) (“Aris,” “Aris Water,” or the “Company”) announced today that it has entered into a strategic agreement (the “Agreement”) with Chevron U.S.A. Inc. (“Chevron”) and ConocoPhillips Company (“ConocoPhillips”) to develop and pilot technologies and processes to treat produced water for potential beneficial reuse opportunities. Aris, Chevron, and ConocoPhillips’ goal is to develop cost effective and scalable methods of treating produced water to create a potential water source for industrial, commercial, and non-consumptive agricultural purposes.


This Agreement demonstrates Chevron, ConocoPhillips, and Aris’ continued commitment to responsible water management and leadership in working towards beneficial reuse of treated produced water in a water scarce region.

We are very pleased to reaffirm our commitment to water stewardship and join our customers, Chevron and ConocoPhillips, in the creation of this Agreement focused on the development of sustainable beneficial reuse solutions,” said Aris President and CEO Amanda Brock. “Aris is excited to collaborate with our customers and lead the commercialization of produced water treatment in new and innovative applications.”

Aris will lead the engineering, construction, and execution of the testing protocols and pilot projects while leveraging the combined technical expertise of Chevron and ConocoPhillips. The treated water will then be reused in a variety of ongoing research projects, including non-consumptive agriculture, low emission hydrogen production, and the direct air capture of atmospheric carbon dioxide.

By joining forces with Chevron and Aris on this project, we bring together our collective knowledge to accelerate technology, conversation and regulation around beneficial reuse of produced water,” said ConocoPhillips Senior Vice President of Lower 48 Assets and Operations Kirk Johnson.

At Chevron, using water responsibly is integral to our values and we are continuing to strengthen our water management practices to ensure safe, reliable, and sustainable operations in the Permian Basin,” said Brent Gros, Chevron’s Mid-Continent Business Unit General Manager of Operations. “We believe innovative solutions for produced water reuse will come from collaboration among a variety of stakeholders, which is why we’re pleased to participate in this agreement with Aris and ConocoPhillips.”

Aris, Chevron, and ConocoPhillips will work with appropriate regulators, with a goal to complete testing and performance evaluation of pilot technologies by the end of 2023.

Forward Looking Statements

Certain matters contained in this press release include “forward-looking statements.” All statements, other than statements of historical fact, included in this press release may constitute forward-looking statements. Although we believe that the expectations reflected in these forward-looking statements are reasonable, we cannot assure you that these expectations will prove to be correct. These forward-looking statements are subject to certain known and unknown risks and uncertainties, as well as assumptions that could cause actual results to differ materially from those reflected in these forward-looking statements. Factors that might cause actual results to differ include, but are not limited to, the risk factors discussed from time to time in each of our documents and reports filed with the Securities and Exchange Commission.

Readers are cautioned not to place undue reliance on any forward-looking statements contained in this press release, which reflect management’s opinions only as of the date hereof. Except as required by law, we undertake no obligation to revise or publicly release the results of any revision to any forward-looking statements.

About Aris Water Solutions, Inc.

Aris Water Solutions, Inc. (NYSE: ARIS) is a leading, growth-oriented environmental infrastructure and solutions company that directly helps its customers reduce their water and carbon footprints. Aris Water delivers full-cycle water handling and recycling solutions that increase the sustainability of energy company operations. Its integrated pipelines and related infrastructure create long-term value by delivering high-capacity, comprehensive produced water management, recycling and supply solutions to operators in the core areas of the Permian Basin. Additional information is available on our website, www.ariswater.com.


Contacts

David Tuerff
Senior Vice President, Finance, and Investor Relations
(281) 501-3070
This email address is being protected from spambots. You need JavaScript enabled to view it.

DUBLIN--(BUSINESS WIRE)--The "Turkey Market for Marine Coatings - 2022 Edition" report has been added to ResearchAndMarkets.com's offering.


The in-depth report focuses on the Turkish market for marine coatings and includes detailed key data points including market shares, product segments and prices/values.

The report provides consumption estimates in both volume and value for marine coatings, with 2021 as the base year and forecasts for 2026.

The information in the report is based on a comprehensive programme of interviews with key players in each country, backed up by thorough secondary research and an in-house database of global paints and coatings market data.

Market Volumes in Metric Tonnes (2011-2025) by:

  • Market volumes in metric tonnes (2011-2026)
  • Prices and market values in EUR, USD and local currency (2020 and 2021)
  • Market shares by company in volume (2020 and 2021)
  • Water-Based Technologies (Pure Acrylic, Epoxy, Polyurethane, Others)
  • Solvent-Based Technologies (Pure Acrylic, Alkyds, Epoxy, Polyesters, Polyurethane, Vinyls, Others)
  • Functional Layer (Primer, Topcoat, Antifouling)
  • End Use (DIY/Leisure, New Build, Professional Maintenance/Shipyards)
  • Value breakdown by: Chemistry, end use and Functional Layer (2020 and 2021)
  • Distribution: 2021 Share by Channel (Wholesalers/Merchants, Specialist Retailers, Internet Stores, DIY Retailers, Direct Sales)

Key Topics Covered:

1. TR Coatings Background

1.1 TR - Background - Overview

1.2 Key Figures

1.3 Macroeconomic Trends and Forecasts

1.3.1 Imp/Exp: SB Polyesters

1.3.2 Imp/Exp: SB Acrylics & Vinyls

1.3.3 Imp/Exp: SB Polymers

1.3.4 Imp/Exp: WB Acrylics & Vinyls

1.3.5 Imp/Exp: WB Polymers

1.3.6 Imp/Exp: Other Paints & Varnishes

2 Foreword - Marine Coatings

3. TR Marine Coatings Overview & Distribution

4. TR Marine Coatings Product Section

4.1 TR - Market Overview

4.2 Historical Trends and Forecasts: Marine Coatings

4.3 Prices and Market Values

4.3.1 Prices and Market Values by Application System

4.3.2 Prices and Market Values by Resin Type

4.3.3 Detailed Prices: Water Based

4.3.4 Detailed Prices: Solvent Based

4.3.5 Prices and Market Values by End Use

4.3.6 Prices and Market Values by Functional Layer

4.4 End Use: Historical and Forecasts

4.4.1 Application System: Historical and Forecasts

4.4.2 Resin Type: Historical and Forecasts

4.4.3 Water Based: Historical and Forecasts

4.4.4 Solvent Based: Historical and Forecasts

4.4.5 Functional Layer: Historical and Forecasts

4.5 Market Shares: Marine Coatings

4.6 Distribution: Marine Coatings

For more information about this report visit https://www.researchandmarkets.com/r/xz3jk0

About ResearchAndMarkets.com

ResearchAndMarkets.com is the world's leading source for international market research reports and market data. We provide you with the latest data on international and regional markets, key industries, the top companies, new products and the latest trends.


Contacts

ResearchAndMarkets.com
Laura Wood, Senior Press Manager
This email address is being protected from spambots. You need JavaScript enabled to view it.
For E.S.T Office Hours Call 1-917-300-0470
For U.S./ CAN Toll Free Call 1-800-526-8630
For GMT Office Hours Call +353-1-416-8900

HOUSTON & TOKYO--(BUSINESS WIRE)--Chevron Corporation (NYSE: CVX), through its Chevron New Energies business, and JERA are collaborating on multiple lower carbon opportunities – including production; carbon capture, utilization, and storage; and new technology commercialization – focused on the U.S. and Asia Pacific region.


The companies have signed a Joint Study Agreement to explore the potential co-development of lower carbon fuel in Australia and will conduct a feasibility study expected to be completed in 2023. Lower carbon fuel supplies to be produced in the region would seek to leverage Chevron’s LNG and CCS knowledge and experience.

As part of their focus across the hydrogen value chain – including production, export, and transportation – Chevron and JERA will also study liquid organic hydrogen carriers (LOHC) in the U.S. LOHC has the potential to enable efficient hydrogen transport and long duration energy storage applications, essentially using hydrogen as a battery to deliver lower carbon energy on demand. As part of their focus on LOHC, Chevron and JERA have both invested in Hydrogenious LOHC Technologies.

“Chevron and JERA have worked together to bring affordable and reliable energy to our customers in the form of LNG, and we are excited about the opportunity to further build upon this relationship as we identify opportunities to provide ever-cleaner energy,” said Jeff Gustavson, president of Chevron New Energies. “Partnership is critical to achieving lower carbon goals, and we believe Chevron has the people, assets, and customers to help drive solutions across the globe.”

JERA Corporate Vice President Yukio Kani said, “We believe that strengthening our cooperation with Chevron will not only expand business opportunities for both companies but also contribute to the stable supply of energy in Asia Pacific and the U.S. to transition to a decarbonized society.”

About Chevron

Chevron is one of the world’s leading integrated energy companies. We believe affordable, reliable, and ever-cleaner energy is essential to achieving a more prosperous and sustainable world. Chevron produces crude oil and natural gas; manufactures transportation fuels, lubricants, petrochemicals and additives; and develops technologies that enhance our business and the industry. We are focused on lowering the carbon intensity in our operations and growing lower carbon businesses along with our traditional business lines. For more information, please visit www.chevron.com.

About JERA

Established in 2015, JERA is an equal joint venture of two major Japanese electric power companies, TEPCO Fuel & Power Incorporated and Chubu Electric Power Company and produces about 30% of all electricity in Japan. JERA is an energy company with global reach that has strength in the entire energy supply chain, from participation in LNG upstream projects and fuel procurement, through fuel transportation to power generation. JERA, which stands for Japan’s Energy for a New Era, will take on the challenge of achieving net zero CO2 emissions from its domestic and overseas businesses by 2050 and is supporting an energy transition in an environmentally and socially responsible manner. For more details: https://www.jera.co.jp/english/

CAUTIONARY STATEMENTS RELEVANT TO FORWARD-LOOKING INFORMATION FOR THE PURPOSE OF “SAFE HARBOR” PROVISIONS OF THE PRIVATE SECURITIES LITIGATION REFORM ACT OF 1995

This news release contains forward-looking statements relating to Chevron’s operations and energy transition plans that are based on management's current expectations, estimates and projections about the petroleum, chemicals and other energy-related industries. Words or phrases such as “anticipates,” “expects,” “intends,” “plans,” “targets,” “advances,” “commits,” “drives,” “aims,” “forecasts,” “projects,” “believes,” “approaches,” “seeks,” “schedules,” “estimates,” “positions,” “pursues,” “may,” “can,” “could,” “should,” “will,” “budgets,” “outlook,” “trends,” “guidance,” “focus,” “on track,” “goals,” “objectives,” “strategies,” “opportunities,” “poised,” “potential,” “ambitions,” “aspires” and similar expressions are intended to identify such forward-looking statements. These statements are not guarantees of future performance and are subject to certain risks, uncertainties and other factors, many of which are beyond the company’s control and are difficult to predict. Therefore, actual outcomes and results may differ materially from what is expressed or forecasted in such forward-looking statements. The reader should not place undue reliance on these forward-looking statements, which speak only as of the date of this news release. Unless legally required, Chevron undertakes no obligation to update publicly any forward-looking statements, whether as a result of new information, future events or otherwise.

Among the important factors that could cause actual results to differ materially from those in the forward-looking statements are: changing crude oil and natural gas prices and demand for the company’s products, and production curtailments due to market conditions; crude oil production quotas or other actions that might be imposed by the Organization of Petroleum Exporting Countries and other producing countries; technological advancements; changes to government policies in the countries in which the company operates; public health crises, such as pandemics (including coronavirus (COVID-19)) and epidemics, and any related government policies and actions; disruptions in the company’s global supply chain, including supply chain constraints and escalation of the cost of goods and services; changing economic, regulatory and political environments in the various countries in which the company operates; general domestic and international economic and political conditions, including the military conflict between Russia and Ukraine and the global response to such conflict; changing refining, marketing and chemicals margins; actions of competitors or regulators; timing of exploration expenses; timing of crude oil liftings; the competitiveness of alternate-energy sources or product substitutes; development of large carbon capture and offset markets; the results of operations and financial condition of the company’s suppliers, vendors, partners and equity affiliates, particularly during the COVID-19 pandemic; the inability or failure of the company’s joint-venture partners to fund their share of operations and development activities; the potential failure to achieve expected net production from existing and future crude oil and natural gas development projects; potential delays in the development, construction or start-up of planned projects; the potential disruption or interruption of the company’s operations due to war, accidents, political events, civil unrest, severe weather, cyber threats, terrorist acts, or other natural or human causes beyond the company’s control; the potential liability for remedial actions or assessments under existing or future environmental regulations and litigation; significant operational, investment or product changes undertaken or required by existing or future environmental statutes and regulations, including international agreements and national or regional legislation and regulatory measures to limit or reduce greenhouse gas emissions; the potential liability resulting from pending or future litigation; the company’s future acquisitions or dispositions of assets or shares or the delay or failure of such transactions to close based on required closing conditions; the potential for gains and losses from asset dispositions or impairments; government mandated sales, divestitures, recapitalizations, taxes and tax audits, tariffs, sanctions, changes in fiscal terms or restrictions on scope of company operations; foreign currency movements compared with the U.S. dollar; higher inflation and related impacts; material reductions in corporate liquidity and access to debt markets; the receipt of required Board authorizations to implement capital allocation strategies, including future stock repurchase programs and dividend payments; the effects of changed accounting rules under generally accepted accounting principles promulgated by rule-setting bodies; the company’s ability to identify and mitigate the risks and hazards inherent in operating in the global energy industry; and the factors set forth under the heading “Risk Factors” on pages 20 through 25 of the company’s 2021 Annual Report on Form 10-K and in subsequent filings with the U.S. Securities and Exchange Commission. Other unpredictable or unknown factors not discussed in this news release could also have material adverse effects on forward-looking statements.


Contacts

Chevron
Creighton Welch
This email address is being protected from spambots. You need JavaScript enabled to view it.

JERA
Hirotaka Iwase
This email address is being protected from spambots. You need JavaScript enabled to view it.

  • Narrowing 2022 Adjusted EBITDA guidance and initiating 2023 financial guidance
  • Executing current $1 billion share repurchase program; $397 million remaining to be completed
  • Announcing 2023 capital allocation: $600 million incremental share repurchase program; 8% increase in annual dividend; $331 million growth/other

HOUSTON--(BUSINESS WIRE)--NRG Energy, Inc. (NYSE: NRG) today reported a third quarter 2022 Net Income of $67 million, or $0.29 per diluted common share, and Adjusted EBITDA for the third quarter of $452 million.

We made significant progress on our key strategic priorities in the third quarter, and our platform performed well during extreme Summer conditions," said Mauricio Gutierrez, NRG President, and Chief Executive Officer. “We remain on track to achieve our long-term goals, and I am excited about the opportunities ahead to provide even more value for stakeholders.”

Consolidated Financial Results


Three Months Ended


Nine Months Ended

($ in millions)


9/30/2022


9/30/2021


9/30/2022


9/30/2021

Net Income


$

67


$

1,618


$

2,316


$

2,614

Cash provided by Operating Activities


$

(1,431

)


$

1,478


$

1,758


$

1,855

Adjusted EBITDAa


$

452


$

767


$

1,319


$

1,990

Free Cash Flow Before Growth Investments (FCFbG)


$

(42

)


$

395


$

294


$

1,163

a. Three and nine months ended 9/30/21 excludes the loss due to Winter Storm Uri of $21 million and $1,070 million, respectively

Segments Results

Table 1: Net Income

($ in millions)


Three Months Ended


Nine Months Ended

Segment


9/30/2022


9/30/2021


9/30/2022


9/30/2021

Texas


$

(475

)


$

251


$

1,064


$

600


East


555


1,980


2,086


3,119


West/Services/Othera


(13

)


(613

)


(834

)


(1,105

)

Net Income


$

67


$

1,618


$

2,316


$

2,614


a. Includes Corporate segment

Third quarter net income was $67 million, $1,551 million lower than third quarter 2021, primarily driven by mark-to-market gains on economic hedge positions in 2021, which were due to large movements in natural gas and power prices.

Table 2: Adjusted EBITDA

($ in millions)


Three Months Ended


Nine Months Ended

Segment


9/30/2022


9/30/2021


9/30/2022


9/30/2021

Texas


$

183


$

446


$

632


$

1,004

East


175


219


561


760

West/Services/Other a


94


102


126


226

Adjusted EBITDAb


$

452


$

767


$

1,319


$

1,990

a. Includes Corporate segment

b. Three and nine months ended 9/30/21 excludes the loss due to Winter Storm Uri of $21 million and $1,070 million, respectively

Texas: Third quarter Adjusted EBITDA was $183 million, $263 million lower than the third quarter of 2021. This decrease was primarily driven by higher supply costs as a result of the previously announced unplanned outage at W.A. Parish Unit 8 and higher ancillary charges, partially offset by higher revenue rates and increased load driven by weather.

East: Third quarter Adjusted EBITDA was $175 million, $44 million lower than the third quarter of 2021. This decrease was primarily driven by the 4.8 GW asset sale which was completed in December 2021, PJM asset retirements, and supply chain constraints, partially offset by higher revenue rates and the realization of Direct Energy synergies.

West/Services/Other: Third quarter Adjusted EBITDA was $94 million, $8 million lower than the third quarter of 2021. This decrease was primarily driven by the 4.8 GW asset sale and the sale of the equity interest in the Watson generating facility, partially offset by higher gross margin from Cottonwood.

Liquidity and Capital Resources

Table 3: Corporate Liquidity

($ in millions)


9/30/22


12/31/21

Cash and Cash Equivalents


$

333


$

250

Restricted Cash


46


15

Total


379


265

Total Revolving Credit Facility and collective collateral facilities


2,395


2,421

Total Liquidity, excluding collateral received


$

2,774


$

2,686

As of September 30, 2022, NRG's cash was at $333 million, and $2.4 billion was available under the Company’s credit facilities. Total liquidity was $2.8 billion, which was approximately $88 million higher than at the end of 2021.

NRG Strategic Developments

Astoria

On September 9, 2022, the Company entered into a definitive purchase agreement to sell land and related assets from the Astoria site, within the East region of operations, for initial proceeds of $212 million, subject to purchase price adjustments and certain other indemnifications. As part of the transaction, NRG will enter into an agreement to lease the land back for the purpose of operating the Astoria facility through the planned April 30, 2023 retirement date. The operating lease agreement is expected to end six months after the facility's actual retirement date. The transaction is expected to close in the fourth quarter of 2022 and is subject to various closing conditions.

As a result of the agreement for the Astoria sale mentioned above, and the planned withdrawal and cancellation of the proposed Astoria redevelopment project, the Company recorded an impairment of $43 million in the third quarter of 2022.

W.A. Parish Unit 8 Extended Outage

In May 2022, W.A. Parish Unit 8 came offline as a result of damage to certain components of the steam turbine/generator. Based on management's current assessment of necessary restoration efforts, the Company continues to target the return to service of the unit by the end of the second quarter of 2023.

Growth Plan

At its June 2021 Investor Day, NRG provided its five-year roadmap to grow through its integrated home strategy. In 2021 and 2022, the Company focused on ‘optimizing its core’ and staging for growth through its test and learn pilot programs. During this time, the Company enhanced its business model and go-to-market strategies. In 2023, the Company expects to enter its next phase of growth, ‘grow from core,’ through executing identified investment and strategic partnerships, while evaluating incremental vertical integration and partnership opportunities. Consistent with its strategic and capital allocation priorities, the Company expects to allocate approximately $220 million for growth-related projects in 2023.

Narrowing 2022 Guidance and Initiating 2023 Guidance

NRG is narrowing its 2022 Adjusted EBITDA as well as narrowing and adjusting down the 2022 FCFbG guidance, and is initiating guidance for the 2023 fiscal year. 2022 FCFbG guidance has been reduced as a result of increasing natural gas and coal inventories, which is expected to be partially reversed in 2023, and the impact of higher commodities prices on working capital.

Table 4: Adjusted EBITDA and FCFbG Guidance


2022


2023

(In millions)


Revised Guidance


Guidance

Adjusted EBITDAa


$1,950 - $2,050


$2,270 - $2,470

Cash provided by Operating Activities


$1,230 - $1,330


$1,925 - $2,125

FCFbG


$950 - $1,050


$1,520 - $1,720

a. Non-GAAP financial measure; see Appendix Table A-8 for GAAP Reconciliation to Net Income that excludes fair value adjustments related to derivatives. The Company is unable to provide guidance for Net Income due to the impact of such fair value adjustments related to derivatives in a given year.

2022 Capital Allocation Update

As announced on December 6, 2021, the Company's Board of Directors authorized $1 billion for share repurchases. The program began in 2021 with $39 million in share repurchases completed in December of that year, an incremental $564 million was completed through October 31, 2022, resulting in a balance of $397 million under the current program expected to be completed by the end of 2022.

On October 21, 2022, NRG announced that its Board of Directors declared a quarterly dividend on the Company's common stock of $0.35 per share, or $1.40 per share on an annualized basis. The dividend is payable on November 15, 2022, to stockholders of record as of November 1, 2022.

2023 Capital Allocation

The Company is announcing its expected 2023 capital allocation plan, consistent with its capital allocation priorities and 2021 Investor Day roadmap. The Board of Directors approved $600 million incremental share repurchases program, to be completed in 2023; an 8% increase in its annual dividend to $1.51 per share beginning in the first quarter of 2023; $331 million in growth and other spend; and $628 million to be allocated at a future date.

The Company remains committed to maintaining a strong balance sheet, continues to work to achieve investment-grade credit metrics, and expects to grow into its target investment grade metrics, primarily through the realization of Direct Energy run-rate earnings and other growth initiatives.

The Company's share repurchase program and common stock dividend are subject to maintaining satisfactory credit metrics, available capital, market conditions, and compliance with associated laws and regulations. The timing and amount of any shares of NRG’s common stock that are repurchased under the share repurchase authorization will be determined by NRG’s management based on market conditions and other factors. NRG will only repurchase shares when management believes it would not jeopardize the company’s ability to maintain satisfactory credit ratings.

Earnings Conference Call

On November 7, 2022, NRG will host a conference call at 9:00 a.m. Eastern (8:00 a.m. Central) to discuss these results. Investors, the news media and others may access the live webcast of the conference call and accompanying presentation materials by logging on to NRG’s website at http://www.nrg.com and clicking on “Investors” then "Presentations & Webcasts." The webcast will be archived on the site for those unable to listen in real time.

About NRG

At NRG, we’re bringing the power of energy to people and organizations by putting customers at the center of everything we do. We generate electricity and provide energy solutions and natural gas to millions of customers through our diverse portfolio of retail brands. A Fortune 500 company, operating in the United States and Canada, NRG delivers innovative solutions while advocating for competitive energy markets and customer choice, working towards a sustainable energy future. More information is available at www.nrg.com. Connect with NRG on Facebook, LinkedIn and follow us on Twitter @nrgenergy.

Forward-Looking Statements

In addition to historical information, the information presented in this press release includes forward-looking statements within the meaning of Section 27A of the Securities Act of 1933 and Section 21E of the Exchange Act. These statements involve estimates, expectations, projections, goals, assumptions, known and unknown risks and uncertainties and can typically be identified by terminology such as “may,” “should,” “could,” “objective,” “projection,” “forecast,” “goal,” “guidance,” “outlook,” “expect,” “intend,” “seek,” “plan,” “think,” “anticipate,” “estimate,” “predict,” “target,” “potential” or “continue” or the negative of these terms or other comparable terminology. Such forward-looking statements include, but are not limited to, statements about the Company’s future revenues, income, indebtedness, capital structure, plans, expectations, objectives, projected financial performance and/or business results and other future events, and views of economic and market conditions.

Although NRG believes that its expectations are reasonable, it can give no assurance that these expectations will prove to be correct, and actual results may vary materially. Factors that could cause actual results to differ materially from those contemplated herein include, among others, general economic conditions, hazards customary in the power industry, weather conditions and extreme weather events, competition in wholesale power and gas markets, the volatility of energy and fuel prices, failure of customers or counterparties to perform under contracts, changes in the wholesale power and gas markets, changes in government or market regulations, the condition of capital markets generally, our ability to access capital markets, the potential impact of COVID-19 or any other pandemic on the Company’s operations, financial position, risk exposure and liquidity, data privacy, cyberterrorism and inadequate cybersecurity, unanticipated outages at our generation facilities, adverse results in current and future litigation, failure to identify, execute or successfully implement acquisitions or asset sales, our ability to implement value enhancing improvements to plant operations and companywide processes, our ability to achieve our net debt targets, our ability to achieve or maintain investment grade credit metrics, our ability to proceed with projects under development or the inability to complete the construction of such projects on schedule or within budget, the inability to maintain or create successful partnering relationships, our ability to operate our business efficiently, our ability to retain retail customers, our ability to execute our market operations strategy, the ability to successfully integrate businesses of acquired companies, including Direct Energy, our ability to realize anticipated benefits of transactions (including expected cost savings and other synergies) or the risk that anticipated benefits may take longer to realize than expected, and our ability to execute our Capital Allocation Plan. Achieving investment grade credit metrics is not an indication of or guarantee that the Company will receive investment grade credit ratings. Debt and share repurchases may be made from time to time subject to market conditions and other factors, including as permitted by United States securities laws. Furthermore, any common stock dividend is subject to available capital and market conditions.

NRG undertakes no obligation to update or revise any forward-looking statements, whether as a result of new information, future events or otherwise, except as required by law. The adjusted EBITDA, adjusted cash flow from operations and free cash flow guidance are estimates as of November 7, 2022. These estimates are based on assumptions the company believed to be reasonable as of that date. NRG disclaims any current intention to update such guidance, except as required by law. The foregoing review of factors that could cause NRG’s actual results to differ materially from those contemplated in the forward-looking statements included in this press release should be considered in connection with information regarding risks and uncertainties that may affect NRG's future results included in NRG's filings with the Securities and Exchange Commission at www.sec.gov.

NRG ENERGY, INC. AND SUBSIDIARIES

CONDENSED CONSOLIDATED STATEMENTS OF OPERATIONS

(Unaudited)


Three months ended September 30,


Nine months ended September 30,

(In millions, except for per share amounts)


2022


2021


2022


2021


Revenue


Revenue

$

8,510


$

6,609


$

23,688


$

19,943


Operating Costs and Expenses


Cost of operations (excluding depreciation and amortization shown below)


7,802


3,692


18,619


13,496


Depreciation and amortization


145


199


485


569


Impairment losses


43


198


306


Selling, general and administrative costs


326


318


973


973


Provision for credit losses


52


64


103


715


Acquisition-related transaction and integration costs


8


17


26


81


Total operating costs and expenses


8,376


4,290


20,404


16,140


Gain on sale of assets


22


51


17


Operating Income


156


2,319


3,335


3,820


Other Income/(Expense)


Equity in earnings of unconsolidated affiliates


11


15


23


Other income, net


21


8


33


42


Loss on debt extinguishment


(57

)


(57

)

Interest expense


(105

)


(122

)


(313

)


(374

)

Total other expense


(73

)


(156

)


(280

)


(366

)

Income Before Income Taxes


83


2,163


3,055


3,454


Income tax expense


16


545


739


840


Net Income

$

67


$

1,618


$

2,316


$

2,614


Income per Share


Weighted average number of common shares outstanding — basic and diluted


235


245


238


245


Income per Weighted Average Common Share —Basic and Diluted

$

0.29


$

6.60


$

9.73


$

10.67


NRG ENERGY, INC. AND SUBSIDIARIES

CONDENSED CONSOLIDATED STATEMENTS OF COMPREHENSIVE INCOME

(Unaudited)


Three months ended September 30,


Nine months ended September 30,

(In millions)


2022


2021


2022


2021


Net Income

$

67


$

1,618


$

2,316


$

2,614


Other Comprehensive (Loss)/Income


Foreign currency translation adjustments


(32

)


(11

)


(45

)


(6

)

Defined benefit plans


(2

)


1


17


20


Other comprehensive (loss)/income


(34

)


(10

)


(28

)


14


Comprehensive Income

$

33


$

1,608


$

2,288


$

2,628


NRG ENERGY, INC. AND SUBSIDIARIES

CONDENSED CONSOLIDATED BALANCE SHEETS


September 30, 2022


December 31, 2021

(In millions, except share data)

(Unaudited)


(Audited)

ASSETS


Current Assets


Cash and cash equivalents

$

333


$

250


Funds deposited by counterparties


3,134


845


Restricted cash


46


15


Accounts receivable, net


4,061


3,245


Uplift securitization proceeds receivable from ERCOT


689


Inventory


772


498


Derivative instruments


9,938


4,613


Cash collateral paid in support of energy risk management activities


262


291


Prepayments and other current assets


417


395


Total current assets


18,963


10,841


Property, plant and equipment, net


1,598


1,688


Other Assets


Equity investments in affiliates


126


157


Operating lease right-of-use assets, net


236


271


Goodwill


1,650


1,795


Intangible assets, net


2,227


2,511


Nuclear decommissioning trust fund


789


1,008


Derivative instruments


4,914


2,527


Deferred income taxes


1,516


2,155


Other non-current assets


224


229


Total other assets


11,682


10,653


Total Assets

$

32,243


$

23,182


LIABILITIES AND STOCKHOLDERS' EQUITY


Current Liabilities


Current portion of long-term debt and finance leases

$

62


$

4


Current portion of operating lease liabilities


82


81


Accounts payable


2,871


2,274


Derivative instruments


6,841


3,387


Cash collateral received in support of energy risk management activities


3,134


845


Accrued expenses and other current liabilities


1,376


1,324


Total current liabilities


14,366


7,915


Other Liabilities


Long-term debt and finance leases


7,974


7,966


Non-current operating lease liabilities


197


236


Nuclear decommissioning reserve


335


321


Nuclear decommissioning trust liability


433


666


Derivative instruments


2,802


1,412


Deferred income taxes


84


73


Other non-current liabilities


922


993


Total other liabilities


12,747


11,667


Total Liabilities


27,113


19,582


Commitments and Contingencies


Stockholders' Equity


Common stock; $0.01 par value; 500,000,000 shares authorized; 423,894,539 and 423,547,174 shares issued and 232,125,137, and 243,753,899 shares outstanding at September 30, 2022 and December 31, 2021, respectively


4


4


Additional paid-in-capital


8,450


8,531


Retained earnings


2,584


464


Treasury stock, at cost 191,769,402, and 179,793,275 shares at September 30, 2022 and December 31, 2021, respectively


(5,754

)


(5,273

)

Accumulated other comprehensive loss


(154

)


(126

)

Total Stockholders' Equity


5,130


3,600


Total Liabilities and Stockholders' Equity

$

32,243


$

23,182


NRG ENERGY, INC. AND SUBSIDIARIES

CONDENSED CONSOLIDATED STATEMENTS OF CASH FLOWS

(Unaudited)


Nine months ended September 30,

(In millions)


2022


2021


Cash Flows from Operating Activities


Net Income

$

2,316


$

2,614


Adjustments to reconcile net income to cash provided by operating activities:


Distributions from and equity in earnings of unconsolidated affiliates


7


8


Depreciation and amortization


485


569


Accretion of asset retirement obligations


20


21


Provision for credit losses


103


715


Amortization of nuclear fuel


42


39


Amortization of financing costs and debt discounts


17


30


Loss on debt extinguishment


57


Amortization of in-the-money contracts and emissions allowances


122


111


Amortization of unearned equity compensation


21


16


Net gain on sale and disposal of assets


(82

)


(29

)

Impairment losses


198


306


Changes in derivative instruments


(4,480

)


(4,419

)

Changes in deferred income taxes and liability for uncertain tax benefits


688


782


Changes in collateral deposits in support of energy risk management activities


2,321


1,970


Changes in nuclear decommissioning trust liability


2


38


Uplift securitization proceeds received from ERCOT


689


Changes in other working capital


(711

)


(973

)

Cash provided by operating activities


1,758


1,855


Cash Flows from Investing Activities


Payments for acquisitions of businesses and assets, net of cash acquired


(60

)


(3,534

)

Capital expenditures


(250

)


(219

)

Net (purchases)/sales of emission allowances


(4

)


6


Investments in nuclear decommissioning trust fund securities


(361

)


(460

)

Proceeds from the sale of nuclear decommissioning trust fund securities


363


424


Proceeds from sales of assets, net of cash disposed


107


198


Cash used by investing activities


(205

)


(3,585

)

Cash Flows from Financing Activities


Payments of dividends to common stockholders


(252

)


(239

)

Payments for share repurchase activity


(484

)


(9

)

Net receipts from settlement of acquired derivatives that include financing elements


1,596


396


Repayments of long-term debt and finance leases


(4

)


(1,360

)

Proceeds from issuance of long-term debt


1,100


Payments for debt extinguishment costs


(48

)

Payments of debt issuance costs


(1

)


(18

)

Proceeds from issuance of common stock


1


Cash provided/(used) by financing activities


855


(177

)

Effect of exchange rate changes on cash and cash equivalents


(5

)


(2

)

Net Increase/(Decrease) in Cash and Cash Equivalents, Funds Deposited by Counterparties and Restricted Cash


2,403


(1,909

)

Cash and Cash Equivalents, Funds Deposited by Counterparties and Restricted Cash at Beginning of Period


1,110


3,930


Cash and Cash Equivalents, Funds Deposited by Counterparties and Restricted Cash at End of Period

$

3,513


$

2,021


Appendix Table A-1: Third Quarter 2022 Adjusted EBITDA Reconciliation by Operating Segment

The following table summarizes the calculation of Adjusted EBITDA and provides a reconciliation to Net Income/(Loss):

($ in millions)

Texas

East

West/Services/ Other

Corp/Elim

Total

Net (Loss)/Income

$

(475

)

$

555


$

88


$

(101

)

$

67


Plus:


Interest expense, net


(1

)


7


79


85


Income tax


18


(2

)


16


Depreciation and amortization


77


39


22


7


145


ARO Expense


2


2


4


Contract amortization


4


(19

)


5


(10

)

EBITDA


(392

)


576


140


(17

)


307


Adjustment to reflect NRG share of adjusted EBITDA in unconsolidated affiliates


13


13


Acquisition and divestiture integration and transaction costs


8


8


Deactivation costs


7


1


8


(Gain)/loss on sale of assets


(22

)


(22

)

Other non-recurring charges


1


4


1


6


Impairments


43


43


Mark to market (MtM) losses/(gains) on economic hedges


596


(455

)


(52

)


89


Adjusted EBITDA

$

183


$

175


$

102


$

(8

)

$

452


Third Quarter 2022 condensed financial information by Operating Segment:

($ in millions)

Texas

East

West/Services/ Other

Corp/Elim

Total

Revenue1

$

3,145

$

4,158

$

1,172


$

8


$

8,483


Cost of fuel, purchased power and other cost of sales2


2,501


3,749


978


8


7,236


Economic gross margin


644


409


194


1,247


Operations & maintenance and other cost of operations3


269


117


55


(1

)


440


Selling, marketing, general and administrative


149


108


60


9


326


Provision for credit losses


41


7


4


52


Other


2


2


(27

)


(23

)

Adjusted EBITDA

$

183

$

175

$

102


$

(8

)

$

452


1 Excludes MtM gain of $33 million and contract amortization of $6 million

2 Includes TDSP expense, capacity and emission credits

3 Excludes other non-recurring charges of $8 million, deactivation costs of $8 million and ARO expense of $4 million


Contacts

Media:
Laura Avant
713.537.5437

Investors:
Kevin L. Cole, CFA
609.524.4526


Read full story here

PASADENA, Calif.--(BUSINESS WIRE)--Heliogen, Inc. (“Heliogen”) (NYSE: HLGN), a leading provider of AI-enabled concentrating solar energy technology, today provided its third quarter 2022 financial results.


Third Quarter 2022 Highlights

  • Selected to receive a $4.1 million award from the U.S. Department of Energy to accelerate the large-scale development and deployment of a solar thermal calciner to decarbonize cement production
  • Entered into a letter of intent with Dimensional Energy for the production of sustainable aviation fuel
  • Successfully completed initial field testing of ChariotAV, Heliogen’s autonomous heliostat cleaning vehicle
  • Began final qualification for main production lines at Heliogen’s automated, high-volume manufacturing facility
  • Appointed industrial energy transition veteran Barbara Burger to Heliogen’s Board of Directors

Recent Highlights

  • Entered into a memorandum of understanding (“MOU”) with the City of Lancaster, California to build a new green hydrogen production facility deploying Heliogen’s technology

Executive Commentary

“During the third quarter, Heliogen continued to make progress towards its goal of deploying its groundbreaking, AI-enabled concentrating solar thermal energy technology,” said Bill Gross, Founder and Chief Executive Officer of Heliogen. “The successful completion of the initial field testing of our ChariotAV autonomous heliostat cleaning vehicle and the start of final qualification for our automated, high-volume heliostat production lines, moves us that much closer to achieving these goals.”

“By signing the MOU with the City of Lancaster, California for the production of green hydrogen, Heliogen continues to grow its portfolio of hydrogen-focused customers. Between our Brenda Solar Energy Zone project for large-scale hydrogen production in an area ideally located for both long-haul transportation and for shipping to other end markets, our agreement with Dimensional Energy for the production of sustainable aviation fuel and now this agreement with the City of Lancaster, Heliogen is building a diverse portfolio of hydrogen customers and end-use markets.”

“With the passage of the Inflation Reduction Act and its $3.00 per kilogram hydrogen production tax credit, we seem to be witnessing a tipping point that is greatly elevating hydrogen’s role in the transition from a petroleum economy to a low-carbon society.”

Memorandum of Understanding with the City of Lancaster, California

Heliogen and the City of Lancaster, California recently entered into a non-binding MOU to work together to create a green hydrogen production facility, with a capacity of up to 1500 metric tons of green hydrogen fuel per year, intended to help the City of Lancaster achieve its goal to become one of the first net zero cities in the United States. The facility is expected to produce green hydrogen that can be sold to industrial customers in Lancaster and the greater Los Angeles area. The MOU is subject to negotiation and execution of a definitive agreement.

This agreement contemplates Heliogen as the technology provider, project developer, builder, operator and equity partner in the project. Heliogen intends to bring on an equity provider to fund construction and own the asset. The City of Lancaster will assist in site identification, review by its City Council and the community, support for the permitting process and evaluation of economic development potential.

2022 Guidance Revision

Heliogen is working to finalize its second commercial-scale contract by year end, which would be within its guidance range of two to three modules contracted. Heliogen believes the number of modules contracted is the most useful indicator of demand for its products and technology at this stage in its lifecycle. Over time, Heliogen expects these contracts to be converted to revenue as the projects are installed, although there is no assurance as to the time period for such conversion.

Due to delays in project timing, Heliogen now expects 2022 revenues of $12 - $14 million, revised from its prior guidance of $20 - $25 million. This change reflects a shift in timing of earned revenue, but the associated total project revenue on its first commercial-scale contract remains unchanged.

Third Quarter 2022 Financial Results

For the third quarter 2022, Heliogen reported total revenue of $3.1 million, total operating expenses of $29.4 million and net loss of $27.8 million. Heliogen’s net loss was driven primarily by growth of Heliogen’s operations to support its first commercial-scale projects, including personnel costs such as a non-cash stock-based compensation expense of $10.0 million. Heliogen’s Adjusted EBITDA, which excludes the non-cash stock-based compensation expense and other impacts, was negative $19.2 million for the third quarter 2022.

Conference Call Information

The Heliogen management team will host a conference call to discuss its third quarter 2022 financial results on Tuesday, November 8, 2022, at 10:00 a.m. EST. The call can be accessed via a live webcast accessible on the Events & Presentations page in the Investor Relations section of Heliogen’s website at www.heliogen.com. The call can also be accessed live via telephone by dialing 1-877-407-0789 (1-201-689-8562 for international callers) and referencing Heliogen.

An archive of the webcast will also be available shortly after the call on the Investor Relations section of Heliogen’s website.

About Heliogen

Heliogen is a renewable energy technology company focused on decarbonizing industry and empowering a sustainable civilization. The company’s concentrating solar energy and thermal storage systems aim to deliver carbon-free heat, steam, power, or green hydrogen at scale to support round-the-clock industrial operations. Powered by AI, computer vision and robotics, Heliogen is focused on providing robust clean energy solutions that accelerate the transition to renewable energy, without compromising reliability, availability, or cost. For more information about Heliogen, please visit heliogen.com.

Use of Non-GAAP Financial Information

Management uses certain financial measures, including EBITDA and Adjusted EBITDA, to evaluate our financial and operating performance that are calculated and presented on the basis of methodologies other than in accordance with GAAP. We believe these non-GAAP financial measures are useful to investors and analysts to assess our ongoing financial performance because they provide improved comparability between periods through the exclusion of certain items that we believe are not indicative of our core operating performance, enhance the overall understanding of our past financial performance and future prospects, and remove items that may obscure our underlying business results and trends. These measures should not be considered a substitute for, or superior to, measures of financial performance prepared in accordance with GAAP, and our calculations thereof may not be comparable to similarly titled measures reported by other companies. Please see the accompanying tables for reconciliations of the following non-GAAP financial measures for Heliogen’s current and historical results: EBITDA and Adjusted EBITDA.

Forward-Looking Statements

This press release contains certain forward-looking statements within the meaning of Section 27A of the Securities Act of 1933, as amended, and Section 21E of the Securities Exchange Act of 1934, as amended. Statements that are not historical in nature, including the words “anticipate,” “expect,” “suggests,” “plan,” “believe,” “intend,” “estimates,” “targets,” “projects,” “should,” “could,” “would,” “may,” “will,” “forecast” and other similar expressions are intended to identify forward-looking statements. These forward-looking statements include, but are not limited to, statements regarding our guidance for full-year 2022, the development of our manufacturing and production facilities, achieving our financial and operational goals, progress with potential customers, expected impacts of recent legislation and future growth opportunities. Forward-looking statements are predictions, projections and other statements about future events that are based on current expectations and assumptions and, as a result, are subject to risks and uncertainties. Many factors could cause actual future events to differ materially from the forward-looking statements in this press release, including but not limited to: (i) our financial and business performance, including risk of uncertainty in our financial projections and business metrics and any underlying assumptions thereunder; (ii) our ability to execute our business model, including market acceptance of our planned products and services and achieving sufficient production volumes at acceptable quality levels and prices; (iii) our ability to access sources of capital to finance operations, growth and future capital requirements; (iv) our ability to maintain and enhance our products and brand, and to attract and retain customers; (v) our ability to scale in a cost effective manner; (vi) changes in applicable laws or regulations; (vii) the ongoing impacts of the COVID-19 pandemic and the potential impacts of Russia’s invasion of Ukraine on our business; (viii) developments and projections relating to our competitors and industry; (ix) our ability to access sources of capital to finance operations, growth and future capital requirements; and (x) our ability to protect our intellectual property. You should carefully consider the foregoing factors and the other risks and uncertainties disclosed in the “Risk Factors” section in Part I, Item 1A in our Annual Report on Form 10-K/A for the annual period ended December 31, 2021 and other documents filed by Heliogen from time to time with the SEC. These filings identify and address other important risks and uncertainties that could cause actual events and results to differ materially from those contained in the forward-looking statements. Forward-looking statements speak only as of the date they are made. Readers are cautioned not to put undue reliance on forward-looking statements, and Heliogen assumes no obligation and does not intend to update or revise these forward-looking statements, whether as a result of new information, future events, or otherwise.


Heliogen, Inc.
Condensed Consolidated Statements of Operations and Comprehensive Loss
($ in thousands, except per share and share data)
(unaudited)


Three Months Ended September 30,


Nine Months Ended September 30,


2022


2021


2022


2021


Revenue

$

3,100


$

2,202


$

9,031


$

3,563


Cost of revenue


3,423


1,375


44,061


2,736


Gross profit (loss)


(323

)


827


(35,030

)


827


Operating expenses:


Selling, general, and administrative


18,268


8,687


60,733


15,099


Research and development


11,168


4,618


26,448


8,891


Total operating expenses


29,436


13,305


87,181


23,990


Operating loss


(29,759

)


(12,478

)


(122,211

)


(23,163

)


Interest income, net


259


197


666


407


SAFE instruments remeasurement


(15,533

)


(62,993

)

Gain (loss) on warrant remeasurement


369


(322

)


12,679


(2,604

)

Other income (expense), net


1,256


(140

)


1,071


(312

)

Net loss before taxes


(27,875

)


(28,276

)


(107,795

)


(88,665

)

Income tax benefit


46


781


Net loss


(27,829

)


(28,276

)


(107,014

)


(88,665

)

Other comprehensive loss, net of taxes


Unrealized losses (gains) on available-for-sale securities


(18

)


7


(524

)


(7

)

Cumulative translation adjustment


(173

)


(57

)


(497

)


(57

)

Total comprehensive loss

$

(28,020

)


$

(28,326

)


$

(108,035

)


$

(88,729

)


Loss per share


Loss per share – Basic and Diluted

$

(0.14

)


$

(2.45

)


$

(0.57

)


$

(8.32

)

Weighted average number of shares outstanding – Basic and Diluted


192,580,125


11,545,919


188,827,770


10,650,897


Heliogen, Inc.
Condensed Consolidated Balance Sheets
($ in thousands)
(unaudited)


September 30,


December 31,


2022


2021

ASSETS


Cash and cash equivalents

$

35,444


$

190,081

Investments, available-for-sale


124,034


32,332

Other current assets


13,361


4,770

Total current assets


172,839


227,183

Non-current assets


44,724


30,265

Total assets

$

217,563


$

257,448

LIABILITIES AND SHAREHOLDERS’ EQUITY


Trade payables

$

2,335


$

4,645

Contract liabilities


8,540


513

Contract loss provisions


30,526


397

Other current liabilities


7,410


6,974

Total current liabilities


48,811


12,529

Long-term liabilities


17,501


30,861

Total liabilities


66,312


43,390

Shareholders’ equity


151,251


214,058

Total liabilities and shareholders’ equity

$

217,563


$

257,448


Non-GAAP Financial Measures

EBITDA represents condensed consolidated net loss before (i) interest (income) expense, net, (ii) income tax expense (benefit) and (iii) depreciation and amortization expense.

Adjusted EBITDA represents EBITDA adjusted for certain significant non-cash items and items that management believes are not attributable to or indicative of our on-going operations or that may obscure our underlying results and trends.

The following reconciles net loss to EBITDA and Adjusted EBITDA for the periods as shown:


Three Months Ended September 30,


Nine Months Ended September 30,

$ in thousands


2022


2021


2022


2021


Net loss

$

(27,829

)


$

(28,276

)


$

(107,014

)


$

(88,665

)

Adjustments


Interest income, net


(259

)


(197

)


(666

)


(407

)

Income tax benefit


(46

)


(781

)


Depreciation and amortization


836


138


2,289


272


EBITDA

$

(27,298

)


$

(28,335

)


$

(106,172

)


$

(88,800

)

Adjustments


SAFE instruments remeasurement(1)


15,533


62,993


(Gain) loss on warrant remeasurement(2)


(369

)


322


(12,679

)


2,604


Share-based compensation


9,972


1,485


34,478


2,049


Provision for contract losses (3)


33,737


Contract losses incurred (3)


(342

)


(3,502

)


Change in fair value of contingent consideration (4)


(1,116

)


(1,063

)


Adjusted EBITDA

$

(19,153

)


$

(10,995

)


$

(55,201

)


$

(21,154

)

(1)

Represents the change in fair value on our SAFE instruments which were converted to common stock immediately prior to the closing of the business combination with Athena Technology Acquisition Corp.

(2)

Represents the change in fair value on our warrant liabilities for the outstanding warrants that we assumed in the business combination with Athena Technology Acquisition Corp.

(3)

Represents contract losses with customers for which estimated costs to satisfy performance obligations exceeded considerations expected to be realized. Contract loss is reduced and recognized in cost of revenue as expenditures are incurred and related revenue is recognized.

(4)

Represents the change in fair value of our contingent consideration related to an acquisition completed in 2021.


Contacts

Heliogen Investor Contact:
Louis Baltimore
Investor Relations
This email address is being protected from spambots. You need JavaScript enabled to view it.

Heliogen Media Contact:
Cory Ziskind
ICR, Inc.
This email address is being protected from spambots. You need JavaScript enabled to view it.

Dark ship detection solution is essential to identify and locate vessels suspected of unlawful activities, such as evading sanctions, illegal fishing and human trafficking

VIENNA, Va.--(BUSINESS WIRE)--Spire Global, Inc. (NYSE: SPIR) (“Spire” or “the Company”), a leading global provider of space-based data, analytics and space services, unveiled a dark shipping detection solution to track vessels that manipulate their reported position in order to conceal nefarious activities.


The Automatic Identification System (AIS) on a vessel helps avoid collisions at sea, track global shipping trends and monitor individual vessel activity; but crew members on board can manipulate the system by turning off the transponder to go dark or ‘spoofing’ the AIS to report false positions. Typically, this is done in order to hide activity that is illegal or could have negative consequences to the ship owner, such as illegal trading, loading or unloading sanctioned goods, or illegal, unreported and unregulated (IUU) fishing.

Spire’s near real-time, global geolocation position validation service can uncover suspicious activity and pinpoint a vessel without the need for an approximate location. The applications are critical to governments, intelligence and security agencies, and nonprofit organizations’ efforts to identify and locate vessels that are breaking international law.

“For a long time, having the tools to accurately identify and track ships that are attempting to hide their activities or location has been the missing key to preventing sanctions evasion, illegal fishing, human trafficking and many more pressing societal issues,” said Peter Mabson, CEO, Spire Maritime. “Dark shipping detection builds on our breadth of maritime tracking solutions and underscores Spire’s mission to use data that can only be collected from space to improve life on Earth.”

Spire operates the world’s largest multipurpose constellation with more than 100 satellites. The company plans to launch additional products in 2023 for geolocation and identification of dark targets, at sea, on land, and in the air. Learn more at https://insights.spire.com/maritime/dark-shipping-detection.

About Spire Global, Inc.

Spire (NYSE: SPIR) is a leading global provider of space-based data, analytics and space services, offering access to unique datasets and powerful insights about Earth from the ultimate vantage point so that organizations can make decisions with confidence, accuracy, and speed. Spire uses one of the world’s largest multipurpose satellite constellations to source hard to acquire, valuable data and enriches it with predictive solutions. Spire then provides this data as a subscription to organizations around the world so they can improve business operations, decrease their environmental footprint, deploy resources for growth and competitive advantage, and mitigate risk. Spire gives commercial and government organizations the competitive advantage they seek to innovate and solve some of the world’s toughest problems with insights from space. Spire has offices in San Francisco, Boulder, Washington DC, Ontario, Glasgow, Oxfordshire, Luxembourg, and Singapore. To learn more, visit www.spire.com.


Contacts

Kristina Spychalski
Senior Manager, Communications
This email address is being protected from spambots. You need JavaScript enabled to view it.

OKLAHOMA CITY--(BUSINESS WIRE)--LSB Industries, Inc. (NYSE:LXU) (“LSB” or the “Company”) today announced the pricing of the previously announced underwritten public offering (the “Offering”) by an affiliate of Eldridge Industries LLC (the “Selling Stockholder”) of an aggregate of 14,350,000 shares of the Company’s common stock at a price to the public of $13.50 per share, pursuant to the Company’s automatic shelf registration statement filed with the Securities and Exchange Commission (the “SEC”). The Offering is expected to close on November 10, 2022, subject to customary closing conditions. The Selling Stockholder has granted the underwriters a 30-day option to purchase up to an aggregate of 1,627,500 additional shares of the Company’s common stock at the public offering price less underwriting discounts and commissions.


The Selling Stockholder will receive all of the net proceeds from the Offering. No shares are being sold by the Company.

Subject to the completion of the Offering, the Company intends to repurchase from the underwriters 3,500,000 shares of the common stock being sold in the Offering (the “Share Repurchase”) at a price per share equal to the price per share paid by the underwriters to the Selling Stockholder in the Offering. The Company intends to fund the Share Repurchase with cash on hand. The closing of the Share Repurchase is conditioned on, and expected to occur simultaneously with, the closing of the Offering.

UBS Investment Bank and Goldman Sachs & Co. LLC are serving as joint lead book-running managers for the Offering. Deutsche Bank Securities, Jefferies, Piper Sandler, RBC Capital Markets and Stifel are also serving as book-running managers for the Offering.

The Company has filed an automatic shelf registration statement (including a prospectus) relating to the Offering with the SEC on March 28, 2022 which became effective upon filing. Before you invest, you should read the prospectus in that registration statement, the accompanying prospectus supplement and other documents the Company has filed with the SEC for more complete information about the Company and the Offering. You may obtain these documents for free by visiting EDGAR on the SEC website at www.sec.gov. Copies of the prospectus supplement and accompanying prospectus related to the Offering may also be obtained from UBS Securities LLC, Attn: Prospectus Department, 1285 Avenue of the Americas, New York, NY 10019 or email: This email address is being protected from spambots. You need JavaScript enabled to view it.; and Goldman Sachs & Co. LLC, Attention: Prospectus Department, 200 West Street, New York, NY 10282, telephone: 1-866-471-2526, facsimile: 212-902-9316 or email: This email address is being protected from spambots. You need JavaScript enabled to view it..

The Offering is being made only by means of a prospectus supplement and the accompanying prospectus. This press release shall not constitute an offer to sell or the solicitation of an offer to buy, nor shall there be any sale of these securities in any state or other jurisdiction in which such an offer, solicitation or sale would be unlawful prior to registration or qualification under the securities laws of any such state or other jurisdiction. Any offer to buy the securities may be withdrawn or revoked, without obligation or commitment of any kind, at any time prior to notice of its acceptance given after the effective date.

About LSB Industries, Inc.

LSB Industries, Inc., headquartered in Oklahoma City, Oklahoma, manufactures and sells chemical products for the agricultural, mining, and industrial markets. The Company owns and operates facilities in Cherokee, Alabama, El Dorado, Arkansas and Pryor, Oklahoma, and operates a facility for a global chemical company in Baytown, Texas. LSB’s products are sold through distributors and directly to end customers primarily throughout the United States. Committed to improving the world by setting goals that will reduce our environmental impact on the planet and improve the quality of life for all of its people, the Company is well positioned to play a key role in the reduction of global carbon emissions through its planned carbon capture and sequestration, and zero carbon ammonia strategies.

About Eldridge Industries LLC

Eldridge invests in businesses across the Insurance, Asset Management, Technology, Mobility, Sports & Gaming, Media, Real Estate, and Consumer landscapes. The firm seeks to build and grow businesses led by proven management teams that have demonstrated leadership and experience to scale an enterprise. Eldridge is headquartered in Greenwich, Connecticut, with additional offices across the United States and in London.

Forward-Looking Statements

This press release contains forward-looking statements. Investors are cautioned not to place undue reliance on these forward-looking statements, including statements about the completion and timing of the Offering. Each forward-looking statement is subject to the inherent uncertainties in predicting future results and conditions and no assurance can be given that the Offering and Share Repurchase discussed above will be completed on the terms described or at all. Completion of the Offering and Share Repurchase and the terms thereof are subject to numerous factors, many of which are beyond the control of LSB, including, without limitation, failure of customary closing conditions and the risk factors and other matters set forth in the prospectus included in the registration statement, in the form last filed with the SEC. These forward-looking statements speak only as of the date of this press release and LSB undertakes no obligation to publicly update or revise any forward-looking statements, whether as a result of new information, future events or otherwise.


Contacts

Investor Contacts:
Cheryl Maguire, Executive Vice President & CFO
(405) 510-3524

Fred Buonocore, CFA, Vice President of Investor Relations
(405) 510-3550
This email address is being protected from spambots. You need JavaScript enabled to view it.

HOUSTON--(BUSINESS WIRE)--Cactus, Inc. (NYSE: WHD) (“Cactus” or the “Company”) today announced financial and operating results for the third quarter of 2022.

Third Quarter Highlights

  • Revenue of $184.5 million and income from operations of $51.3 million;
  • Net income of $41.5 million(1) and diluted earnings per Class A share of $0.51(1);
  • Adjusted net income(2) of $39.3 million and diluted earnings per share, as adjusted(2) of $0.52;
  • Net income margin of 22.5% and adjusted net income margin(2) of 21.3%;
  • Adjusted EBITDA(3) and Adjusted EBITDA margin(3) of $62.7 million and 34.0%, respectively;
  • Cash flow from operations of $30.4 million; and
  • Cash balance of $320.6 million and no bank debt outstanding as of September 30, 2022.

Financial Summary


Three Months Ended


September 30,


June 30,


September 30,


2022


2022


2021


(in thousands)

Revenues

$

184,481


$

170,215


$

115,363


Income from operations

$

51,296


$

44,241


$

20,766


Net income(1)

$

41,520


$

35,780


$

17,177


Net income margin


22.5

%


21.0

%


14.9

%

Adjusted net income(2)

$

39,327


$

33,409


$

14,736


Adjusted net income margin(2)


21.3

%


19.6

%


12.8

%

Adjusted EBITDA(3)

$

62,713


$

55,506


$

32,002


Adjusted EBITDA margin(3)


34.0

%


32.6

%


27.7

%

(1)

Net income during the third quarter of 2022 is inclusive of $1.1 million in other income related to the revaluation of the tax receivable agreement (“TRA”) liability and $1.1 million of income tax expense related to the revaluation of our deferred tax asset. Net income during the third quarter of 2021 is inclusive of a $0.7 million income tax benefit associated with a partial release of a valuation allowance in connection with the redemption of units in Cactus Wellhead, LLC (“Cactus LLC”) by Cadent and other members during the period and a $0.5 million income tax benefit related to the finalization of our 2020 tax returns.

(2)

Adjusted net income, Adjusted net income margin and diluted earnings per share, as adjusted are non-GAAP financial measures. These figures assume Cactus, Inc. held all units in Cactus LLC, its operating subsidiary, at the beginning of the period. Additional information regarding non-GAAP measures and the reconciliation of GAAP to non-GAAP financial measures are in the Supplemental Information tables.

(3)

Adjusted EBITDA and Adjusted EBITDA margin are non-GAAP financial measures. See definition of these measures and the reconciliation of GAAP to non-GAAP financial measures in the Supplemental Information tables.

Scott Bender, President and CEO of Cactus, commented, “Industry fundamentals continued to improve during the third quarter, and Cactus delivered revenue growth above the change in the domestic rig count while further increasing margins. The Company set records for both total revenue and Adjusted EBITDA during the period. Product revenue generated per U.S. land rig followed(1) was also the highest in the Company’s history. Rental revenue growth outpaced that of the U.S. completions market, and Field Service margins experienced another sequential improvement.

Looking to the fourth quarter, we anticipate meaningful growth in rigs followed as we expect public operators to gain share within the domestic rig count. In Field Service, we expect the seasonal margin impact to be similar to levels witnessed in previous years.”

Mr. Bender concluded, “Margins and returns continued to improve during the third quarter and industry fundamentals remain supportive for our business. Global supply chain challenges continue to ease, and we are growing increasingly confident that such improvements will yield benefits including accelerating free cash flow into next year. Capital requirements for our business remain modest and management intends to remain prudent in its investment decisions, both domestically and abroad. We expect our full year 2022 net capital expenditures will be approximately $25 million.”

(1)

Additional information regarding rigs followed is located in the Supplemental Information tables.

Revenue Categories

Product


Three Months Ended


September 30,


June 30,


September 30,


2022


2022


2021


(in thousands)

Product revenue

$

121,782


$

112,232


$

74,835


Gross profit

$

48,035


$

43,060


$

25,127


Gross margin


39.4

%


38.4

%


33.6

%

Third quarter 2022 product revenue increased $9.6 million, or 8.5%, sequentially, as sales of wellhead and production related equipment increased due to higher drilling activity and cost recovery efforts. Gross profit increased $5.0 million, or 11.6%, sequentially, with margins increasing 100 basis points due to operating leverage and cost recovery.

Rental


Three Months Ended


September 30,


June 30,


September 30,


2022


2022


2021


(in thousands)

Rental revenue

$

27,105


$

23,695


$

15,271


Gross profit

$

10,782


$

8,367


$

2,021


Gross margin


39.8

%


35.3

%


13.2

%

Third quarter 2022 rental revenue increased $3.4 million, or 14.4%, sequentially, due to higher customer activity. Gross profit increased $2.4 million sequentially and margins increased 450 basis points due to lower depreciation expense during the period.

Field Service and Other


Three Months Ended


September 30,


June 30,


September 30,


2022


2022


2021


(in thousands)

Field service and other revenue

$

35,594


$

34,288


$

25,257


Gross profit

$

8,449


$

7,554


$

5,767


Gross margin


23.7

%


22.0

%


22.8

%

Third quarter 2022 field service and other revenue increased $1.3 million, or 3.8%, sequentially, as higher customer activity drove an increase in associated billable hours. Gross profit increased $0.9 million, or 11.8%, sequentially, with margins increasing by 170 basis points sequentially, in part due to reduced fuel costs associated with lower diesel prices.

Selling, General and Administrative Expenses (“SG&A”)

SG&A expense for the third quarter of 2022 was $16.0 million (8.7% of revenues), compared to $14.7 million (8.7% of revenues) for the second quarter of 2022 and $12.1 million (10.5% of revenues) for the third quarter of 2021. The sequential increase was primarily due to increased stock-based compensation tied to stronger than expected financial performance, increased salaries and wages and higher professional fees.

Liquidity, Capital Expenditures and Other

As of September 30, 2022, the Company had $320.6 million of cash and no bank debt outstanding. Operating cash flow was $30.4 million for the third quarter of 2022. During the third quarter, the Company made dividend payments and associated distributions of $8.5 million. The Company also made TRA payments and associated distributions of $14.6 million related to 2021 tax savings provided by the TRA.

Net cash used in investing activities was $6.6 million during the third quarter of 2022, driven largely by additions to the Company’s fleet of rental equipment. For the full year 2022, the Company expects net capital expenditures to be approximately $25 million.

As of September 30, 2022, Cactus had 60,718,869 shares of Class A common stock outstanding (representing 80.0% of the total voting power) and 15,159,253 shares of Class B common stock outstanding (representing 20.0% of the total voting power).

Quarterly Dividend

The Board of Directors has approved a quarterly cash dividend of $0.11 per share of Class A common stock with payment to occur on December 15, 2022 to holders of record of Class A common stock at the close of business on November 28, 2022. A corresponding distribution of up to $0.11 per CW Unit has also been approved for holders of CW Units of Cactus Wellhead, LLC.

Conference Call Details

The Company will host a conference call to discuss financial and operational results on November 7, 2022 at 9:00 a.m. Central Time (10:00 a.m. Eastern Time).

The call will be webcast on Cactus’ website at www.CactusWHD.com. Please access the webcast for the call at least 10 minutes ahead of the start time to ensure a proper connection. Analysts and institutional investors may click here to pre-register for the conference call and obtain a dial-in number and passcode. An archived webcast of the conference call will be available on the Company’s website shortly after the end of the call.

About Cactus, Inc.

Cactus designs, manufactures, sells and rents a range of highly engineered wellhead and pressure control equipment. Its products are sold and rented principally for onshore unconventional oil and gas wells and are utilized during the drilling, completion and production phases of its customers’ wells. In addition, it provides field services for all its products and rental items to assist with the installation, maintenance and handling of the wellhead and pressure control equipment. Cactus operates service centers throughout the United States and Australia, while also providing equipment and services in select international markets.

Cautionary Statement Concerning Forward-Looking Statements

Certain statements contained in this press release constitute “forward-looking statements” within the meaning of the Private Securities Litigation Reform Act of 1995. These forward-looking statements are subject to risks, uncertainties and other factors, many of which are outside of Cactus’ control, that could cause actual results to differ materially from the results discussed in the forward-looking statements.

Forward-looking statements can be identified by the use of forward-looking terminology including “may,” “believe,” “expect,” “intend,” “anticipate,” “estimate,” “continue,” “potential,” “will,” “hope” or other similar words and include the Company’s expectation of future performance contained herein. These statements discuss future expectations, contain projections of results of operations or of financial condition, or state other “forward-looking” information. You are cautioned not to place undue reliance on any forward-looking statements, which can be affected by assumptions used or by known risks or uncertainties. Consequently, no forward-looking statements can be guaranteed. When considering these forward-looking statements, you should keep in mind the risk factors and other factors noted in the Company’s Annual Report on Form 10-K, any Quarterly Reports on Form 10-Q and the other documents that the Company files with the Securities and Exchange Commission. The risk factors and other factors noted therein could cause actual results to differ materially from those contained in any forward-looking statement.

Cactus, Inc.

Condensed Consolidated Statements of Income

(unaudited)


Three Months Ended
September 30,


Nine Months Ended
September 30,


2022


2021


2022


2021


(in thousands, except per share data)

Revenues


Product revenue

$

121,782


$

74,835


$

328,054


$

197,136


Rental revenue


27,105


15,271


73,143


42,404


Field service and other revenue


35,594


25,257


99,398


69,133


Total revenues


184,481


115,363


500,595


308,673


Costs and expenses


Cost of product revenue


73,747


49,708


203,839


134,329


Cost of rental revenue


16,323


13,250


46,740


39,824


Cost of field service and other revenue


27,145


19,490


78,685


51,645


Selling, general and administrative expenses


15,970


12,149


44,804


33,160


Total costs and expenses


133,185


94,597


374,068


258,958


Income from operations


51,296


20,766


126,527


49,715


Interest income (expense), net


1,140


(299

)


1,344


(632

)

Other income (expense), net


1,125


10


(1,410

)

Income before income taxes


53,561


20,467


127,881


47,673


Income tax expense


12,041


3,290


23,498


586


Net income

$

41,520


$

17,177


$

104,383


$

47,087


Less: net income attributable to non-controlling interest


10,095


4,560


25,198


12,518


Net income attributable to Cactus, Inc.

$

31,425


$

12,617


$

79,185


$

34,569


Earnings per Class A share - basic

$

0.52


$

0.22


$

1.32


$

0.64


Earnings per Class A share - diluted (a)

$

0.51


$

0.21


$

1.30


$

0.58


Weighted average shares outstanding - basic


60,665


58,248


60,164


54,188


Weighted average shares outstanding - diluted (a)


61,106


76,082


76,296


76,045


(a)

Dilution for the three months ended September 30, 2022 excludes 15.2 million shares of Class B common stock as the effect would be anti-dilutive. Dilution for the nine months ended September 30, 2022 includes $26.2 million of additional pre-tax income attributable to non-controlling interest adjusted for a corporate effective tax rate of 25.0% and 15.7 million weighted average shares of Class B common stock outstanding, plus the effect of dilutive securities. Dilution for the three and nine months ended September 30, 2021 includes $4.7 million and $13.2 million, respectively, of additional pre-tax income attributable to non-controlling interest adjusted for a corporate effective tax rate of 28% and 17.5 million and 21.4 million weighted average shares of Class B common stock outstanding, respectively, plus the effect of dilutive securities.

Cactus, Inc.

Condensed Consolidated Balance Sheets

(unaudited)


September 30,


December 31,


2022


2021


(in thousands)

Assets


Current assets


Cash and cash equivalents

$

320,623


$

301,669

Accounts receivable, net


131,748


89,205

Inventories


162,730


119,817

Prepaid expenses and other current assets


11,849


7,794

Total current assets


626,950


518,485


Property and equipment, net


130,099


129,117

Operating lease right-of-use assets, net


22,232


22,538

Goodwill


7,824


7,824

Deferred tax asset, net


306,789


303,074

Other noncurrent assets


1,307


1,040

Total assets

$

1,095,201


$

982,078


Liabilities and Equity


Current liabilities


Accounts payable

$

62,398


$

42,818

Accrued expenses and other current liabilities


31,659


28,240

Current portion of liability related to tax receivable agreement


27,696


11,769

Finance lease obligations, current portion


5,757


4,867

Operating lease liabilities, current portion


4,677


4,880

Total current liabilities


132,187


92,574


Deferred tax liability, net


2,099


1,172

Liability related to tax receivable agreement, net of current portion


260,844


269,838

Finance lease obligations, net of current portion


6,837


5,811

Operating lease liabilities, net of current portion


17,584


17,650

Total liabilities


419,551


387,045


Equity


675,650


595,033

Total liabilities and equity

$

1,095,201


$

982,078

Cactus, Inc.

Condensed Consolidated Statements of Cash Flows

(unaudited)


Nine Months Ended
September 30,


2022


2021


(in thousands)

Cash flows from operating activities


Net income

$

104,383


$

47,087


Reconciliation of net income to net cash provided by operating activities


Depreciation and amortization


25,991


27,480


Deferred financing cost amortization


133


126


Stock-based compensation


8,034


6,546


Provision for expected credit losses


224


112


Inventory obsolescence


1,642


2,462


Gain on disposal of assets


(470

)


(1,136

)

Deferred income taxes


19,230


(1,404

)

(Gain) loss from revaluation of liability related to tax receivable agreement


(10

)


1,004


Changes in operating assets and liabilities:


Accounts receivable


(42,906

)


(35,634

)

Inventories


(45,545

)


(16,491

)

Prepaid expenses and other assets


(4,265

)


(4,239

)

Accounts payable


20,537


22,944


Accrued expenses and other liabilities


3,293


12,924


Payments pursuant to tax receivable agreement


(11,666

)


(9,697

)

Net cash provided by operating activities


78,605


52,084


Cash flows from investing activities


Capital expenditures and other


(21,197

)


(10,382

)

Proceeds from sale of assets


1,701


1,965


Net cash used in investing activities


(19,496

)


(8,417

)


Cash flows from financing activities


Payment of deferred financing costs


(165

)


Payments on finance leases


(4,505

)


(3,839

)

Dividends paid to Class A common stock shareholders


(20,015

)


(15,249

)

Distributions to members


(8,007

)


(8,074

)

Repurchase of shares


(4,495

)


(3,192

)

Net cash used in financing activities


(37,187

)


(30,354

)


Effect of exchange rate changes on cash and cash equivalents


(2,968

)


2


Net increase in cash and cash equivalents


18,954


13,315


Cash and cash equivalents


Beginning of period


301,669


288,659


End of period

$

320,623


$

301,974


Cactus, Inc. – Supplemental Information

Reconciliation of GAAP to non-GAAP Financial Measures

Adjusted net income, diluted earnings per share, as adjusted and adjusted net income margin

(unaudited)


Adjusted net income, diluted earnings per share, as adjusted and adjusted net income margin are not measures of net income as determined by GAAP but they are supplemental non-GAAP financial measures that are used by management and external users of the Company’s consolidated financial statements. Cactus defines adjusted net income as net income assuming Cactus, Inc. held all units in Cactus LLC, its operating subsidiary, at the beginning of the period, with the resulting additional income tax expense related to the incremental income attributable to Cactus, Inc. Adjusted net income also includes certain other adjustments described below. Cactus defines diluted earnings per share, as adjusted as Adjusted net income divided by weighted average shares outstanding, as adjusted. Cactus defines Adjusted net income margin as Adjusted net income divided by total revenue. The Company believes this supplemental information is useful for evaluating performance period over period.


Three Months Ended


September 30,


June 30,


September 30,


2022


2022


2021


(in thousands, except per share data)

Net income

$

41,520


$

35,780


$

17,177


Adjustments:


Other non-operating income, pre-tax(1)


(1,125

)


Income tax expense differential(2)


(1,068

)


(2,371

)


(2,441

)

Adjusted net income

$

39,327


$

33,409


$

14,736


Diluted earnings per share, as adjusted

$

0.52


$

0.44


$

0.19


Weighted average shares outstanding, as adjusted(3)


76,319


76,322


76,082


Revenue

$

184,481


$

170,215


$

115,363


Net income margin(4)


22.5

%


21.0

%


14.9

%

Adjusted net income margin


21.3

%


19.6

%


12.8

%

(1)

Represents non-cash adjustments for the revaluation of the liability related to the TRA.

(2)

Represents the increase or decrease in tax expense as though Cactus, Inc. owned 100% of Cactus LLC at the beginning of the period, calculated as the difference in tax expense recorded during each period and what would have been recorded, adjusted for pre-tax items listed above, based on a corporate effective tax rate of 25% on income before income taxes for the three months ended September 30, 2022 and June 30, 2022 and 28% for the three months ended September 30, 2021.

(3)

Reflects 60.7, 60.5, and 58.2 million weighted average shares of basic Class A common stock outstanding and 15.2, 15.4 and 17.5 million of additional shares for the three months ended September 30, 2022, June 30, 2022, and September 30, 2021, respectively, as if the weighted average shares of Class B common stock were exchanged and cancelled for Class A common stock at the beginning of the period, plus the effect of dilutive securities.

(4)

Net income margin represents net income divided by total revenue. 

Cactus, Inc. – Supplemental Information

Reconciliation of GAAP to non-GAAP Financial Measures

EBITDA, Adjusted EBITDA and Adjusted EBITDA margin

(unaudited)


EBITDA, Adjusted EBITDA and Adjusted EBITDA margin are not measures of net income as determined by GAAP but are supplemental non-GAAP financial measures that are used by management and external users of the Company’s consolidated financial statements, such as industry analysts, investors, lenders and rating agencies. Cactus defines EBITDA as net income excluding net interest, income tax and depreciation and amortization. Cactus defines Adjusted EBITDA as EBITDA excluding the other items outlined below.


Cactus management believes EBITDA and Adjusted EBITDA are useful because they allow management to more effectively evaluate the Company’s operating performance and compare the results of its operations from period to period without regard to financing methods or capital structure, or other items that impact comparability of financial results from period to period. EBITDA and Adjusted EBITDA should not be considered as alternatives to, or more meaningful than, net income or any other measure as determined in accordance with GAAP. The Company’s computations of EBITDA and Adjusted EBITDA may not be comparable to other similarly titled measures of other companies. Cactus defines Adjusted EBITDA margin as Adjusted EBITDA divided by total revenue. Cactus presents this supplemental information because it believes it provides useful information regarding the factors and trends affecting the Company’s business.


Three Months Ended


Nine Months Ended


September 30,


June 30,


September 30,


September 30,


2022


2022


2021


2022


2021


(in thousands)


(in thousands)

Net income

$

41,520


$

35,780


$

17,177


$

104,383


$

47,087


Interest (income) expense, net


(1,140

)


(304

)


299


(1,344

)


632


Income tax expense


12,041


8,765


3,290


23,498


586


Depreciation and amortization


8,399


8,915


9,128


25,991


27,480


EBITDA


60,820


53,156


29,894


152,528


75,785


Other non-operating (income) expense(1)


(1,125

)


(10

)


1,004


Secondary offering related expenses(2)


406


Stock-based compensation


3,018


2,350


2,108


8,034


6,546


Adjusted EBITDA

$

62,713


$

55,506


$

32,002


$

160,552


$

83,741


Revenue

$

184,481


$

170,215


$

115,363


$

500,595


$

308,673


Net income margin(3)


22.5

%


21.0

%


14.9

%


20.9

%


15.3

%

Adjusted EBITDA margin


34.0

%


32.6

%


27.7

%


32.1

%


27.1

%

(1)

Represents non-cash adjustments for the revaluation of the liability related to the TRA.

(2)

Reflects fees and expenses recorded in the first quarter of 2021 in connection with the offering of Class A common stock by certain selling stockholders, excluding underwriting discounts and selling commissions incurred by the selling stockholders.

(3)

Net income margin represents net income divided by total revenue.

Cactus, Inc. – Supplemental Information

Depreciation and Amortization by Category

(unaudited)


Three Months Ended


Nine Months Ended


September 30,


June 30,


September 30,


September 30,


2022


2022


2021


2022


2021


(in thousands)


(in thousands)

Cost of product revenue

$

740


$

751


$

798


$

2,239


$

2,418

Cost of rental revenue


5,802


6,252


6,424


18,221


19,540

Cost of field service and other revenue


1,738


1,802


1,750


5,213


5,158

Selling, general and administrative expenses


119


110


156


318


364

Total depreciation and amortization

$

8,399


$

8,915


$

9,128


$

25,991


$

27,480

Cactus, Inc. – Supplemental Information

Estimated Market Share

(unaudited)


Market share represents the average number of active U.S. onshore rigs Cactus followed (which Cactus defines as the number of active U.S. onshore drilling rigs to which it was the primary provider of wellhead products and corresponding services during drilling) as of mid-month for each of the three months in the applicable quarter divided by the Baker Hughes U.S. onshore rig count quarterly average. Cactus believes that comparing the total number of active U.S. onshore rigs to which it was providing its products and services at a given time to the number of active U.S. onshore rigs during the same period provides Cactus with a reasonable approximation of its market share with respect to wellhead products sold and the corresponding services it provides.


Three Months Ended


September 30,


June 30,


September 30,


2022


2022


2021

Cactus U.S. onshore rigs followed

285


275


203


Baker Hughes U.S. onshore rig count quarterly average

741


697


483


Market share

38.5

%


39.5

%


42.0

%


Contacts

John Fitzgerald, 713-904-4655
Director of Corporate Development and Investor Relations
This email address is being protected from spambots. You need JavaScript enabled to view it.


Read full story here
Offshore Source Logo

Offshore Source keeps you updated with relevant information concerning the Offshore Energy Sector.

Any views or opinions represented on this website belong solely to the author and do not represent those of the people, institutions or organizations that Offshore Source or collaborators may or may not have been associated with in a professional or personal capacity, unless explicitly stated.

Corporate Offices

Technology Systems Corporation
8502 SW Kansas Ave
Stuart, FL 34997

info@tscpublishing.com