Business Wire News

BOGOTA, Colombia--(BUSINESS WIRE)--GeoPark Limited (“GeoPark” or the “Company”) (NYSE: GPRK), a leading independent Latin American oil and gas explorer, operator and consolidator, today announced that its Board of Directors has declared a quarterly cash dividend of $0.127 per share, payable on December 7, 2022, and the renewal, until December 31, 2023, of the share repurchase program for up to 10% of its outstanding shares. All figures are expressed in US Dollars.


Quarterly Cash Dividend

  • The Board of Directors has declared a quarterly cash dividend of $0.127 per share ($7.5 million in the aggregate) payable on December 7, 2022, to the shareholders of record at the close of business on November 23, 2022

Renewal of Share Buyback Program

  • GeoPark concluded its 2021-2022 share repurchase program on November 9, 2022, with 2,176,468 shares acquired, and a total amount invested of $29,340,864 including transaction costs
  • The Board of Directors has approved the renewal, until December 31, 2023, of the repurchase program for up to 10% of its outstanding shares or approximately 5,854,285 shares
  • The share repurchases may be made from time to time through open market transactions, block trades, privately negotiated transactions or otherwise, and are subject to market and business conditions, levels of available liquidity, cash requirements for other purposes, regulatory considerations, and other relevant factors

As detailed in our 2023 Work Program and Investment Guidelines, GeoPark plans to deliver another year of strong operational and financial performance, and free cash flow generation. The Company is also targeting the return of 40-50% of its free cash flow1 to shareholders through a combination of base dividends and discretionary buybacks and/or variable dividends.

NOTICE

Additional information about GeoPark can be found in the “Invest with Us” section on the website at www.geo-park.com.

Certain amounts and percentages included in this press release have been rounded for ease of presentation.

CAUTIONARY STATEMENTS RELEVANT TO FORWARD-LOOKING INFORMATION

This press release contains statements that constitute forward-looking statements. Many of the forward-looking statements contained in this press release can be identified by the use of forward-looking words such as ‘‘anticipate,’’ ‘‘believe,’’ ‘‘could,’’ ‘‘expect,’’ ‘‘should,’’ ‘‘plan,’’ ‘‘intend,’’ ‘‘will,’’ ‘‘estimate’’ and ‘‘potential,’’ among others.

Forward-looking statements that appear in a number of places in this press release include, but are not limited to, statements regarding the intent, belief or current expectations, regarding various matters, including expected oil and gas production, operational and financial performance, including free cash flow generation and excess cash flow returns to shareholders, timing, method and amount of share repurchases, oil prices, commodity risk management contracts, and the Company’s capital expenditures plan. Forward-looking statements are based on management’s beliefs and assumptions, and on information currently available to the management. Such statements are subject to risks and uncertainties, and actual results may differ materially from those expressed or implied in the forward-looking statements due to various factors.

Forward-looking statements speak only as of the date they are made, and the Company does not undertake any obligation to update them in light of new information or future developments or to release publicly any revisions to these statements in order to reflect later events or circumstances, or to reflect the occurrence of unanticipated events. For a discussion of the risks facing the Company which could affect whether these forward-looking statements are realized, see filings with the U.S. Securities and Exchange Commission (SEC).

___________________
1 Free cash flow is used here as Adjusted EBITDA less capital expenditures and mandatory interest payments, after applicable income taxes being accrued in 2023 and to be paid between 2023 and early 2024.


Contacts

INVESTORS:

Stacy Steimel
Shareholder Value Director
T: +562 2242 9600
This email address is being protected from spambots. You need JavaScript enabled to view it.

Miguel Bello
Market Access Director
T: +562 2242 9600
This email address is being protected from spambots. You need JavaScript enabled to view it.

Diego Gully
Investor Relations Director
T: +55 21 9636 9658
This email address is being protected from spambots. You need JavaScript enabled to view it.

MEDIA:

Communications Department
This email address is being protected from spambots. You need JavaScript enabled to view it.

DUBLIN--(BUSINESS WIRE)--The "Yacht Charter Market Report Worldwide 2022 - Extended Expert Analysis of Yacht Charter Market and Agencies based on World's Largest Scientific Primary Research " report has been added to ResearchAndMarkets.com's offering.


This yacht charter market report is quite unique, and goes far beyond the usual market reports in this industry. First of all, it has been prepared by actual industry experts for yacht charters, meaning that deep insider know-how has been in-built.

Secondly, the report contents go much further than the usual standardized listing of plain numbers. Each section of the report is thoroughly explained within the context of the actual industry and its common practices. Therefore, the readers can gain a quantitative and qualitative understanding of the yacht charter industry, including the market structure, processes, specificities and dynamics.

As such, this report is a must-have for anyone who is considering entering the yacht charter industry and/or pursuing further developments in it. Indeed, both newcomers and existing players can benefit immensely from the findings of this unique research.

Thirdly, this market report contains actual primary data from a large international questionnaire survey of yacht charter agencies - it is the largest such survey ever performed on this market! In particular, the author conducted scientifically based research through a specially designed questionnaire that gathered responses from 166 active yacht charter companies in 43 countries from across the globe.

To complement this method, an extensive content analysis was also performed on a wider population of over 980 yacht charter agencies from more than 50 countries and 5 continents.

WHAT ARE THE KEY INSIGHTS OF THIS REPORT?

This report, after presenting the methodology, begins with an industry global overview section, which is particularly useful for readers who are not familiar with the details of the yacht charter industry. Namely, the yacht charter industry is very specific, and in many ways non-standard, so it can be quite useful to deepen the understanding of its main concepts before proceeding further.

The second section deals with the size and geographical structure of the yacht charter market, in terms of both volume and value. This market has a very peculiar geographical structure, which is fairly different from mainstream tourism or other related industries.

To understand such differences, the most popular yacht charter destinations have been explained and the number of charter yachts in each of them has been provided. In the latter part of this section, the global market value has been calculated and its regional breakdown presented. All calculations are clearly and transparently explained, so that the readers can understand where the actual market value comes from.

The third section explains the core characteristics of major participants in the yacht charter market - i.e. the three distinct kinds of companies which dynamically interact in order for the yacht charter market to function. After explaining the role and characteristics of each company type, some very specific industry processes have been outlined.

The fourth section deals with market concentration and market profitability in the yacht charter industry. Survey findings on both of these topics have been presented, along with the relevant conclusions.

The report then goes on to analyze the geographical distribution of yacht charter agencies, describing the specific developments in each major region. This is followed by relevant conclusions, as well as an explanation of the regional development scenarios, which are particularly useful for contemplating the possible development directions in the nascent markets. Two distinct possible modes of development have been explained

Next, the analysis goes deeper - towards understanding the very fabric of the yacht charter market. The actual differentiation criteria of the active yacht charter agencies have been identified, and for each of the 14 criteria, the relevant classification has been provided, including the explanation of the underlying business models.

This extensive section goes indeed deeply into the market structures and provides thorough information necessary for understanding its dynamics. It gives insights into characteristics of various business models, as well as various industry segments, among other details.

It also shows the prevalence of different services - both nautical and non-nautical - provided by yacht charter agencies. Last but not least, the section contains relevant examples of external financing obtained by several yacht charter agencies. In total, by analyzing this particular section one can dive deeply into the diverse and dynamic world of yacht charter agencies.

After summarizing all classification dimensions and their key variations, a yacht charter agency positioning framework has been provided, whereby one can visually analyze particular agencies and even compare them. This can be quite useful for decision-making about the particular investments and strategies in the market.

The section that follows deals with the pros and cons of various strategic choices in this market and enables easier comparison between relevant business models, as well as easier decision-making on the key topics.

The examples of the actual companies and their market approach are provided in the following chapter. Seven distinct business models have been presented (which are highly relevant in the context of the yacht charter industry), along with the names of actual leading companies that pursue those models. This is followed by a presentation of several emerging types of business models in the sector, which may be particularly indicative of expected future trends.

A special part of the report is dedicated to understanding the Covid-19 impacts, which have been dramatic in the charter season 2020 and will unquestionably be substantial in the season 2021 as well, but in a different way. This chapter includes, among other information, also the actual statements and opinions of the relevant market participants.

Finally, the report is finishing with an overview (and explanation) of possible future business trends and developments in the yacht charter industry.

ADVANTAGES OF THIS MARKET REPORT

  • Compiled by actual yacht charter experts
  • Based on the world's largest primary research in the yacht charter industry
  • Provides deep insights into the yacht charter business
  • Discovers actual market specifics and trends
  • Includes topics that go far beyond the common market reports
  • Findings from tables & graphs are contextually explained by industry experts
  • Contains useful tools for decision-making in the yacht charter business

Key Topics Covered:

1. Executive Summary

2. Introduction

3. Research Scope and Methods

4. Yacht Charter Market Overview

  • Yachts and Yacht Charter
  • Main Types of Charters
  • Main Types of Yachts
  • Sailing Yachts Charter
  • Motor Yachts Charter
  • Catamarans Charter
  • Gulets Charter

5. Yacht Charter Market Size

  • Major Yacht Charter Destinations
  • European Yacht Charter Destinations
  • American Yacht Charter Destinations
  • Asian and Other Yacht Charter Destinations
  • Worldwide Yacht Charter Destinations Map
  • Bareboat and Crewed Yacht Charter Market Size
  • Flexibly Crewed Yachts
  • Yacht Charter Market Value
  • Effects of Covid-19 on Yacht Charter Market Value
  • Yacht Charter Market Value Per Region
  • Yacht Charter Market Growth

6. Yacht Charter Market Participants

  • Charter Fleet Operators
  • Yacht Charter Agencies
  • Specialization of Yacht Charter Agencies
  • Central Booking Systems
  • Number of Booking Systems Used
  • Popularity of Major Booking Systems
  • Common Processes on Yacht Charter Market

7. Market Concentration and Profitability

  • Yacht Charter Market Concentration
  • Yacht Charter Market Profitability

8. Global Distribution of Yacht Charter Agencies

  • Number of Yacht Charter Agencies Per Region
  • Leading Region's Drivers
  • Yacht Charter Agencies in Europe
  • Top European Countries With Yacht Charter Agencies
  • Yacht Charter Agencies in the Americas
  • Regional Distribution of Yacht Charter Agencies in the Americas
  • Yacht Charter Agencies in Asia
  • Yacht Charter Agencies in the Pacific Region
  • More About Locations of Charter Agencies
  • Regional Development Scenarios

9. Types of Yacht Charter Agencies

  • Yacht Charter Agencies Differentiation Criteria
  • Major Types of Yacht Charter Agencies
  • Types by Primary Business
  • Share of Primary Yacht Charter Agencies Worldwide
  • Primary Yacht Charter Agencies by Region
  • Types by Clients Value
  • Share of Luxury Yacht Charter Agencies Worldwide
  • Luxury Yacht Charter Agencies by Region
  • Types by Clients Location
  • Types by Business Model Focus
  • Digital Business Models Prevalence
  • Business Model Focus in Relation to Client Segments
  • Types by Business Model Logic
  • Share of P2P Yacht Charter Agencies Worldwide
  • P2P Yacht Charter Agencies by Region
  • Types by Level of Specialization
  • Types by Charter Destinations
  • Types by Boats Offered
  • Types by Charter Duration
  • Types by Scope
  • Types by Special Products
  • Prevalence of Special Products
  • Types by Extra Services
  • Prevalence of Extra Nautical Services
  • Prevalence of Extra Non-Nautical Services
  • Types by Brand Approach
  • Prevalence of Multiple Yacht Charter Brands
  • Types by Mode of Financing
  • Yacht Charter Agencies With External Financing
  • Overview of Criteria and Types

10. Yacht Charter Agency Positioning Framework

11. Pros & Cons of Selected Business Models

  • Platform Models Pros & Cons
  • Specialization Pros & Cons
  • Multiple Brands Pros & Cons
  • Extra Services Pros & Cons

12. Interesting Profiles, Features and Examples

  • High Success With Flotilla Concept
  • Regatta Agency Concept
  • Personal Touch Agencies
  • P2P Hybrid Platforms
  • Pure P2P Models
  • Universal Digital Yacht Charter Agencies
  • Full Service Luxury Yachting Agencies

13. New Emerging Types of Agencies

14. Key Trends and Opportunities

  • Understanding Covid-19 Impacts
  • Impacts on Season 2020
  • Impacts on Season 2021 and Beyond
  • Specific Regional Impacts
  • Specific Market Adjustments
  • Expected Industry Trends

Companies Mentioned

  • 12Knots
  • 2Yachts
  • Barquo
  • BoatBureau
  • Boatflex
  • Boatsetter
  • Borrow a Boat
  • Burgess
  • Camper & Nicholsons
  • Click&Boat
  • Fraser Yachts
  • GetBoat
  • GetMyBoat
  • GlobeSailor
  • Nautal
  • Northrop & Johnson
  • Sailo
  • Sailogy
  • SamBoat
  • SkipperMyBoat
  • The Yacht Week
  • Yachtico
  • Zizooboats

For more information about this report visit https://www.researchandmarkets.com/r/y3f4o6


Contacts

ResearchAndMarkets.com
Laura Wood, Senior Press Manager
This email address is being protected from spambots. You need JavaScript enabled to view it.
For E.S.T Office Hours Call 1-917-300-0470
For U.S./ CAN Toll Free Call 1-800-526-8630
For GMT Office Hours Call +353-1-416-8900

HOUSTON--(BUSINESS WIRE)--Aris Water Solutions, Inc. (NYSE: ARIS) (“Aris”, “Aris Water” or the “Company”) today announced financial and operating results for the third quarter ended September 30, 2022.


THIRD QUARTER 2022 HIGHLIGHTS

  • Total water volumes of more than 1.4 million barrels per day for the third quarter of 2022, up 47% versus the third quarter of 2021 and up 14% sequentially from the second quarter of 2022.
  • Recycled produced water volumes of approximately 345 thousand barrels per day for the third quarter of 2022, up 165% versus the third quarter of 2021 and up 16% sequentially from the second quarter of 2022.
  • Net income of $2.0 million for the third quarter of 2022. Adjusted Net Income 1 of $13.2 million for the third quarter of 2022, up 98% versus the third quarter of 2021. Adjusted EBITDA 1 of $39.3 million for the third quarter of 2022, up 28% versus the third quarter of 2021.

RECENT EVENTS

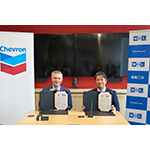
  • Announced strategic agreement with Chevron U.S.A Inc. (“Chevron”) and ConocoPhillips Corporation (“ConocoPhillips”) to develop and pilot technologies and processes to treat produced water for potential beneficial reuse opportunities.
  • Completed acquisition of intellectual property rights, treatment technologies and assets from Water Standard Management (US), Inc. (“Water Standard”) which are expected to support and advance the Company’s efforts related to the beneficial reuse of produced water.

In the third quarter, we continued to perform, growing our volumes and providing reliable, sustainable water solutions for our customers,” stated Amanda Brock, Chief Executive Officer of Aris. “We continue to benefit from our long-term contracts with leading operators who are committed to the Permian Basin. Our significant existing infrastructure overlays some of the lowest breakeven rock in the Permian Basin supporting our customers as they prioritize investments in our contracted acreage. Alongside our growth, we are focused on optimizing our operations while identifying additional efficiencies to improve our operating margins and offset the impact of recent extraordinary inflationary pressures. We are also very encouraged by our recent strategic agreement with ConocoPhillips and Chevron as well as the acquisition of technology and assets from Water Standard. These key transactions further demonstrate our leadership and commitment to beneficial reuse.”

OPERATIONS UPDATE

For the third quarter of 2022, the Company averaged approximately 1.4 million barrels of water per day of total volumes handled, up approximately 47% from 961 thousand barrels of water per day for the third quarter of 2021. The Company’s volume growth was primarily driven by increased activity levels from our long-term contracted customers and continued adoption of our recycled produced water solutions.

FINANCIAL UPDATE

Net income of $2.0 million for the third quarter of 2022, up from a net loss of $20.7 million in the third quarter of 2021. Adjusted Net Income 1 of $13.2 million for the third quarter of 2022, up 98% versus the third quarter of 2021.

The Company had Adjusted EBITDA 1 of $39.3 million for the third quarter of 2022 compared to $30.8 million in the third quarter of 2021, an increase of 28%. Aris continues to grow its Adjusted EBITDA alongside its long-term contracted customers and increased demand for its sustainable water recycling solutions.

The Company had gross margin per barrel of $0.23 per barrel for the third quarter of 2022 compared to $0.23 per barrel in the third quarter of 2021. The Company had Adjusted Operating Margin per barrel 2 of $0.36 per barrel for the third quarter of 2022, compared to $0.41 per barrel in the third quarter of 2021. Operating margins for the quarter were negatively impacted by ongoing inflationary pressure and non-recurring startup costs at new reuse facilities.

Third quarter 2022 property, plant, and equipment expenditures totaled $48.7 million compared to $20.4 million in the third quarter of 2021. Aris continues to invest in high-return capital projects that support its long-term contracted customers and leverage its existing infrastructure.

STRONG BALANCE SHEET AND LIQUIDITY

As of September 30, 2022, the Company had approximately $25.2 million in cash and an available revolving credit facility of approximately $199.9 million for a total available liquidity of approximately $225.1 million.

FOURTH QUARTER 2022 DIVIDEND

On November 4, 2022, Aris’s Board of Directors declared a dividend on its Class A common stock for the fourth quarter of 2022 of $0.09 per share. In conjunction with the dividend payment, a distribution of $0.09 per unit will be paid to unit holders of Solaris Midstream Holdings, LLC. The dividend will be paid on November 30, 2022, to holders of record of the Company’s Class A common stock as of the close of business on November 17, 2022. The distribution to unit holders of Solaris Midstream Holdings, LLC will be subject to the same payment and record dates.

FINANCIAL OUTLOOK

For the fourth quarter of 2022, Aris projects Adjusted EBITDA1 between $39.0 and $41.0 million, consistent with the lower end of our previously provided guidance of $150.0-$160.0 million for the full year of 2022. We expect our capital expenditures for the full year of 2022 to be between $140.0 and $150.0 million, consistent with previously provided guidance.

CONFERENCE CALL

Aris will host a conference call and webcast for investors and analysts to discuss its results for the third quarter of 2022 on Thursday, November 10, 2022, at 8:00 a.m. Central Time (9:00 a.m. Eastern Time). Participants should call (877) 407-5792 and should refer to Aris Water Solutions, Inc. when dialing in. An audio replay of the conference call will be available shortly after the conclusion of the call and will remain available for approximately 14 days. To access the replay, call (877) 660-6853 (United States/Canada) or (201) 612-7415 (International) and enter access code 13732938. A live broadcast of the earnings conference call and the related earnings presentation will also be available via the internet at www.ariswater.com under the “Investors” section of the website. A replay will also be available on the website following the call.

About Aris Water Solutions, Inc.

Aris Water Solutions, Inc. is a leading, growth-oriented environmental infrastructure and solutions company that directly helps its customers reduce their water and carbon footprints. Aris Water delivers full-cycle water handling and recycling solutions that increase the sustainability of energy company operations. Its integrated pipelines and related infrastructure create long-term value by delivering high-capacity, comprehensive produced water management, recycling and supply solutions to operators in the core areas of the Permian Basin.

Forward-Looking Statements

This press release contains “forward-looking statements” within the meaning of Section 27A of the Securities Act of 1933, as amended, and Section 21E of the Securities Exchange Act of 1934, as amended. Examples of forward-looking statements include, but are not limited to, those regarding the Company’s business strategy, its industry, its future profitability, the various risks and uncertainties associated with the extraordinary inflationary environment and impacts resulting from the volatility in global oil markets, expected capital expenditures and the impact of such expenditures on performance, management changes, current and potential future long-term contracts and the Company’s future business and financial performance and our ability to identify strategic acquisitions and realize benefits therefrom, such as the intellectual property recently acquired from Water Standard. In some cases, you can identify forward-looking statements by terminology such as “anticipate,” “guidance,” “preliminary,” “project,” “estimate,” “outlook,” “expect,” “continue,” “will,” “intend,” “plan,” “targets,” “believe,” “forecast,” “future,” “potential,” “may,” “possible,” “should,” “could” and variations of such words or similar expressions. Forward-looking statements are based on the Company’s current expectations and assumptions regarding its business, the economy and other future conditions. Because forward-looking statements relate to the future, by their nature, they are subject to inherent uncertainties, risks and changes in circumstances that are difficult to predict. As a result, the Company’s actual results may differ materially from those contemplated by the forward-looking statements. Factors that could cause the Company’s actual results to differ materially from the results contemplated by such forward-looking statements include, but are not limited to the risk factors discussed or referenced in its filings made from time to time with the U.S. Securities and Exchange Commission. Readers are cautioned not to place undue reliance on forward-looking statements, which speak only as of the date hereof. Factors or events that could cause the Company’s actual results to differ may emerge from time to time, and it is not possible for the Company to predict all of them. The Company undertakes no obligation to update or revise any forward-looking statement, whether as a result of new information, future developments or otherwise, except as may be required by law.

________________________

1 Adjusted EBITDA and Adjusted Net Income are non-GAAP financial measures. See the supplementary schedules in this press release for a discussion of how we define and calculate Adjusted EBITDA and Adjusted Net Income and a reconciliation thereof to net income, the most directly comparable GAAP measure.

2 Adjusted Operating Margin per Barrel is a non-GAAP financial measure. See the supplementary schedules in this press release for a discussion of how we define and calculate Adjusted Operating Margin per Barrel and a reconciliation thereof to gross margin, the most directly comparable GAAP measure.

Table 1

Aris Water Solutions, Inc.

Condensed Consolidated Statements of Operations

(Unaudited)


(in thousands, except for share and per share amounts)


Three Months Ended

September 30,


Nine Months Ended

September 30,


2022


2021


2022


2021

Revenue


Produced Water Handling


$

39,674


$

24,639


$

110,299


$

71,368


Produced Water Handling—Affiliates


24,796


23,135


69,084


62,216


Water Solutions


20,392


7,666


46,744


11,824


Water Solutions—Affiliates


5,668


4,059


11,640


16,864


Other Revenue


246


364


Total Revenue


90,776


59,499


238,131


162,272


Cost of Revenue


Direct Operating Costs


43,885


23,497


101,337


66,703


Depreciation, Amortization and Accretion


16,942


15,378


49,724


45,550


Total Cost of Revenue


60,827


38,875


151,061


112,253


Operating Costs and Expenses


Abandoned Well Costs


9,222


27,402


14,637


27,402


General and Administrative


11,482


5,228


33,860


15,240


Impairment of Long-Lived Assets


15,597


Loss on Asset Disposal and Other


239


940


1,816


2,590


Total Operating Expenses


20,943


33,570


65,910


45,232


Operating Income (Loss)


9,006


(12,946

)


21,160


4,787


Other Expense


Interest Expense, Net


6,763


7,880


21,863


17,855


Other


380


Total Other Expense


6,763


7,880


21,863


18,235


Income (Loss) Before Income Taxes


2,243


(20,826

)


(703

)


(13,448

)

Income Tax Expense (Benefit)


287


(83

)


(81

)


(81

)

Net Income (Loss)


1,956


(20,743

)


(622

)


(13,367

)

Equity Accretion and Dividend—Redeemable Preferred Units


21


Net Income (Loss) Attributable to Stockholders'/Members' Equity


1,956


$

(20,743

)


(622

)


$

(13,346

)

Net Income (Loss) Attributable to Noncontrolling Interest


1,257


(493

)


Net Income (Loss) Attributable to Aris Water Solutions, Inc.


$

699


$

(129

)


Net Income (Loss) Per Share of Class A Common Stock


Basic


$

0.02


$

(0.03

)


Diluted


$

0.02


$

(0.03

)


Weighted Average Shares of Class A Common Stock Outstanding


Basic


24,499,953


22,779,077


Diluted


24,546,632


22,779,077


Table 2

Aris Water Solutions, Inc.

Condensed Consolidated Balance Sheets

(Unaudited)


(in thousands, except for share and per share amounts)


September 30,


December 31,


2022


2021

Assets


Cash


$

25,180


$

60,055


Accounts Receivable, Net


76,273


41,973


Accounts Receivable from Affiliate


25,772


20,191


Other Receivables


6,287


4,126


Prepaids and Deposits


1,828


6,043


Total Current Assets


135,340


132,388


Fixed Assets


Property, Plant and Equipment


881,003


700,756


Accumulated Depreciation


(81,019

)


(67,749

)

Total Property, Plant and Equipment, Net


799,984


633,007


Intangible Assets, Net


277,379


304,930


Goodwill


34,585


34,585


Deferred Income Tax Assets, Net


24,377


19,933


Right-of-Use Assets


7,635


Other Assets


1,422


1,850


Total Assets


$

1,280,722


$

1,126,693


Liabilities and Stockholders' Equity


Accounts Payable


$

35,823


$

7,082


Payables to Affiliate


2,412


1,499


Accrued and Other Current Liabilities


85,089


40,464


Total Current Liabilities


123,324


49,045


Long-Term Debt, Net of Debt Issuance Costs


393,453


392,051


Asset Retirement Obligation


8,148


6,158


Tax Receivable Agreement Liability


80,009


75,564


Other Long-Term Liabilities


8,966


1,336


Total Liabilities


613,900


524,154


Commitments and Contingencies


Stockholders' Equity:


Preferred Stock $0.01 par value, 50,000,000 authorized. None issued or outstanding as of September 30, 2022 and December 31, 2021


Class A Common Stock $0.01 par value, 600,000,000 authorized, 26,166,400 issued and 26,156,209 outstanding as of September 30, 2022; 21,858,022 issued and 21,847,831 outstanding as of December 31, 2021


261


218


Class B Common Stock $0.01 par value, 180,000,000 authorized, 30,811,322 issued and outstanding as of September 30, 2022; 31,716,104 issued and outstanding as of December 31, 2021


308


317


Treasury Stock (at Cost), 10,191 shares as of September 30, 2022 and December 31, 2021


(135

)


(135

)

Additional Paid-in-Capital


282,917


212,926


Accumulated Deficit


(7,094

)


(457

)

Total Stockholders' Equity Attributable to Aris Water Solutions, Inc.


276,257


212,869


Noncontrolling Interests


390,565


389,670


Total Stockholders' Equity


666,822


602,539


Total Liabilities and Stockholders' Equity


$

1,280,722


$

1,126,693


Table 3

Aris Water Solutions, Inc.

Condensed Consolidated Statements of Cash Flows

(Unaudited)


(in thousands)


Nine Months Ended September 30,


2022


2021

Cash Flow from Operating Activities


Net Loss


$

(622

)


$

(13,367

)

Adjustments to reconcile Net Loss to Net Cash provided by Operating Activities:


Deferred Income Tax Benefit


(96

)


Depreciation, Amortization and Accretion


49,724


45,550


Stock-Based Compensation


9,134


Impairment of Long-Lived Assets


15,597


Abandoned Well Costs


14,637


27,402


Loss on Disposal of Asset, Net


481


225


Abandoned Projects


66


2,035


Amortization of Debt Issuance Costs


1,563


1,320


Loss on Debt Modification


380


Other


311


216


Changes in Operating Assets and Liabilities:


Accounts Receivable


(33,683

)


(11,231

)

Accounts Receivable from Affiliate


(5,581

)


(10,046

)

Other Receivables


(2,139

)


231


Prepaids, Deposits and Other Current Assets


4,215


2,516


Accounts Payable


3,233


(3,284

)

Payables to Affiliate


913


(715

)

Adjustment in Deferred Revenue


14


(46

)

Accrued Liabilities and Other


19,418


16,000


Net Cash Provided by Operating Activities


77,185


57,186


Cash Flow from Investing Activities


Property, Plant and Equipment Expenditures


(96,991

)


(62,728

)

Cash Paid for Acquisitions


(3,353

)


Proceeds from the Sale of Property, Plant and Equipment


7,441


Net Cash Used in Investing Activities


(92,903

)


(62,728

)


Cash Flow from Financing Activities


Dividends and Distributions Paid


(19,157

)


Proceeds from Senior-Sustainability Linked Notes


400,000


Payments for Initial Public Offering Costs


(855

)

Payments of Debt Issuance Costs Related to Issuance of Senior- Sustainability Linked Notes


(9,352

)

Repayment of Credit Facility


(297,000

)

Redemption of Redeemable Preferred Units


(74,357

)

Payments of Debt Issuance Costs related to Credit Facility


(1,442

)

Members' Contributions


5


Net Cash (Used In) Provided by Financing Activities


(19,157

)


16,999


Net (Decrease) Increase in Cash


(34,875

)


11,457


Cash, Beginning of Period


60,055


24,932


Cash, End of Period


$

25,180


$

36,389


Use of Non-GAAP Financial Information

The Company uses financial measures that are not calculated in accordance with U.S. generally accepted accounting principles (“GAAP”), including Adjusted EBITDA, Adjusted Operating Margin, Adjusted Operating Margin per Barrel, and Adjusted Net Income. Although these Non-GAAP financial measures are important factors in assessing the Company’s operating results and cash flows, they should not be considered in isolation or as a substitute for net income or gross margin or any other measures prepared under GAAP.

The Company calculates Adjusted EBITDA as net income (loss) plus: interest expense; income taxes; depreciation, amortization and accretion expense; abandoned well costs; asset impairments and abandoned project charges; losses on the sale and/or exchange of assets; loss on debt modification; and non-recurring or unusual expenses or charges (including temporary power costs), less any gains on sale and/or exchange of assets.

The Company calculates Adjusted Operating Margin as Gross Margin plus depreciation, amortization and accretion and temporary power costs. The Company defines Adjusted Operating Margin per Barrel as Adjusted Operating Margin divided by total volumes.

The Company calculates Adjusted Net Income as Net Income (Loss) Attributable to Stockholders’/Members’ Equity plus the after-tax impacts of stock-based compensation and plus or minus the after-tax impacts of certain items affecting comparability, which are typically noncash and/or nonrecurring items. The Company calculated Diluted Adjusted Net Income Per Share as (i) Adjusted Net Income (Loss) Attributable to Stockholder’s Equity plus the after-tax impacts of stock-based compensation and plus or minus the after-tax impacts of certain items affecting comparability, which are typically noncash and/or nonrecurring items, divided by (ii) the diluted weighted-average shares of Class A common stock outstanding, assuming the full exchange of all outstanding LLC interests, adjusted for the dilutive effect of outstanding equity-based awards.

For the quarter ended September 30, 2022, the Company calculates its leverage ratio as net debt as of September 30, 2022, divided by annualized 3Q 2022 Adjusted EBITDA. Net debt is calculated as the principal amount of total debt outstanding as of September 30, 2022, less cash and cash equivalents as of September 30, 2022.

The Company believes these presentations are used by investors and professional research analysts for the valuation, comparison, rating, and investment recommendations of companies within its industry. Similarly, the Company’s management uses this information for comparative purposes as well. Adjusted EBITDA, Adjusted Operating Margin, Adjusted Operating Margin per Barrel, and Adjusted Net Income are not measures of financial performance under GAAP and should not be considered as measures of liquidity or as alternatives to net income (loss) or gross margin. Additionally, these presentations as defined by the Company may not be comparable to similarly titled measures used by other companies and should be considered in conjunction with net income (loss) and other measures prepared in accordance with GAAP, such as gross margin, operating income, net income or cash flows from operating activities.

Although we provide forecasts for the non-GAAP measure Adjusted EBITDA, we are not able to forecast the most directly comparable measure net income calculated and presented in accordance with GAAP without unreasonable effort. Certain elements of the composition of the GAAP net income are not predictable, making it impractical for us to forecast. Such elements include but are not limited to non-recurring gains or losses, unusual or non-recurring items, income tax benefit or expense, or one-time transaction costs, which could have a significant impact on the GAAP measure. As a result, no reconciliation of forecasted Adjusted EBITDA to forecasted GAAP net income is provided.

Table 4

Aris Water Solutions, Inc.

Operating Metrics

(Unaudited)


Three Months Ended


Nine Months Ended


September 30,


September 30,


2022


2021


2022


2021

Thousand barrels water per day


Produced Water Handling Volumes


905


708


850


692

Water Solutions Volumes:


Recycled Produced Water Volumes Sold


345


130


306


102

Groundwater Volumes Sold


166


82


112


61

Groundwater Volumes Transferred


41


8


42

Total Water Solutions Volumes


511


253


426


205

Total Volumes


1,416


961


1,276


897


Per Barrel Operating Metrics (1)


Produced Water Handling Revenue/Barrel


$

0.77


$

0.73


$

0.77


$

0.71

Water Solutions Revenue/Barrel


$

0.55


$

0.50


$

0.50


$

0.51

Revenue/Barrel of Total Volumes


$

0.69


$

0.67


$

0.68


$

0.66

Direct Operating Costs/Barrel


$

0.34


$

0.27


$

0.29


$

0.27

Adjusted Operating Margin/Barrel


$

0.36


$

0.41


$

0.39


$

0.41

(1) Per barrel operating metrics are calculated independently. Therefore, the sum of individual amounts may not equal the total presented.

Table 5

Aris Water Solutions, Inc.

Reconciliation of Net Income (Loss) to Non-GAAP Adjusted EBITDA

(Unaudited)


Three Months Ended


Nine Months Ended

(in thousands)


September 30,


September 30,


2022


2021


2022


2021


Net Income (Loss)


$

1,956


$

(20,743

)


$

(622

)


$

(13,367

)

Interest Expense, Net


6,763


7,880


21,863


17,855


Income Tax Expense (Benefit)


287


(83

)


(81

)


(81

)

Depreciation, Amortization and Accretion


16,942


15,378


49,724


45,550


Abandoned Well Costs


9,222


27,402


14,637


27,402


Impairment of Long-Lived Assets


15,597


Stock-Based Compensation


3,595


9,134


Abandoned Projects


679


66


2,035


Temporary Power Costs


4,253


(Gain) Loss on Disposal of Asset, Net


(97

)


8


481


225


Loss on Debt Modification


380


Transaction Costs


336


253


1,269


330


Other


325


325


221


Adjusted EBITDA


$

39,329


$

30,774


$

112,393


$

84,803


Table 6

Aris Water Solutions, Inc.

Reconciliation of Gross Margin to Adjusted Operating Margin and

Adjusted Operating Margin per Barrel

(Unaudited)


Three Months Ended


Nine Months Ended

(in thousands)


September 30,


September 30,


2022


2021


2022


2021


Total Revenue


$

90,776


$

59,499


$

238,131


$

162,272


Cost of Revenue


(60,827

)


(38,875

)


(151,061

)


(112,253

)

Gross Margin


29,949


20,624


87,070


50,019


Depreciation, Amortization and Accretion


16,942


15,378


49,724


45,550


Temporary Power Costs


4,253


Adjusted Operating Margin


$

46,891


$

36,002


$

136,794


$

99,822


Total Volumes (Thousands of BBLs)


130,267


88,357


348,315


245,048


Adjusted Operating Margin/BBL


$

0.36


$

0.41


$

0.39


$

0.41


Contacts

David Tuerff
Senior Vice President, Finance, and Investor Relations
(281) 501-3070
This email address is being protected from spambots. You need JavaScript enabled to view it.


Read full story here

DULUTH, Minn.--(BUSINESS WIRE)--ALLETE, Inc. (NYSE: ALE) today reported third quarter 2022 earnings of 59 cents per share on net income of $33.7 million. Last year’s results were 53 cents per share on net income of $27.6 million. Quarter over quarter results reflect higher net income for the Regulated Operations segment primarily due to interim rate revenue at Minnesota Power. Also impacting the quarter were ongoing inflation, supply chain challenges and transmission congestion resulting in lower earnings at ALLETE Clean Energy. Overall, results for the quarter were in line with expectations.


“ALLETE’s Sustainability in Action strategy continues to present significant opportunities for our company, and we are confident in our ability to execute while we navigate the current macro environment,” said ALLETE President and CEO Bethany Owen. “In fact, we are excited that, just this week, Minnesota Power reached an agreement on its Integrated Resource Plan with various stakeholders that, if approved by the Minnesota Public Utilities Commission later this month, would significantly increase the amount of renewable energy and storage the Company provides over the next 15 years. We are also pleased that Minnesota Power and Superior Water, Light and Power rate cases are progressing as expected; New Energy integration is nearing completion and we are confident in their strong pipeline of projects; and the recently passed Inflation Reduction Act is positive for all of our ALLETE companies.”

ALLETE’s Regulated Operations segment, which includes Minnesota Power, Superior Water, Light and Power and the Company’s investment in the American Transmission Co. recorded net income of $38.3 million, compared to $32.9 million in the third quarter of 2021. Third quarter 2022 earnings reflect higher income at Minnesota Power primarily due to the implementation of interim rates on January 1, 2022. This increase was partially offset by lower kWh sales to retail customers and higher costs under a 250 MW power purchase agreement. ALLETE’s earnings in ATC were lower than in 2021 primarily due to period-over-period changes in ATC’s estimate of a refund liability related to MISO return on equity complaints.

ALLETE Clean Energy recorded a third quarter 2022 net loss of $7.3 million compared to a net loss of $0.8 million in 2021. The net loss in 2022 reflected a reserve of $2.9 million after-tax for an anticipated loss on the sale of ALLETE Clean Energy’s Northern Wind project primarily due to ongoing inflation and supply chain challenges, losses under the Caddo wind energy facility’s power sales agreements resulting from market volatility and transmission congestion in the Southwest Power Pool, and lower wind resources at other wind facilities as compared to 2021.

Corporate and Other businesses, which include New Energy, BNI Energy, the Company’s investment in the Nobles 2 wind energy facility, and ALLETE Properties, recorded net income of $2.7 million in 2022 compared to a net loss of $4.5 million in 2021. Results in 2022 reflect higher earnings from our investment in Nobles 2 due to stronger wind resources in 2022, net income from New Energy of $1.3 million, which includes purchase price accounting of $1.7 million after-tax, and a benefit from the timing of income taxes.

Earnings per share dilution in 2022 was approximately 5 cents due to additional shares of common stock outstanding as of September 30, 2022.

“We expect our 2022 earnings to be near the mid-point of our guidance range of $3.60 - $3.90 per share,” said ALLETE Senior Vice President and Chief Financial Officer Steven Morris. “The results for the quarter did meet our expectations notwithstanding the previously mentioned impacts of ongoing inflation, supply chain challenges and transmission congestion in Southwest Power Pool, as well as the refund reserve impacting our equity earnings in ATC. This updated guidance reflects year to date results and the timing of a Minnesota Power solar project originally expected to close this year, and now expected to be completed in the first quarter of 2023. We expect a strong fourth quarter of earnings from New Energy, with growing momentum in the project pipeline and significant projects closing in October and into the end of the year.”

Live Webcast on November 9, 2022; 2022 third quarter slides posted on company website

ALLETE’s earnings conference call will be at 10:00 a.m. (EST), November 9, 2022, at which time management will discuss the third quarter of 2022 financial results. Interested parties may participate live by registering for the call at allete.com/earningscall or may listen to the live audio-only webcast accompanied by supporting slides, which will be available on ALLETE’s Investor Relations website investor.allete.com/events-presentations. The webcast will be accessible for one year at allete.com.

ALLETE is an energy company headquartered in Duluth, Minn. In addition to its electric utilities, Minnesota Power and Superior Water, Light and Power of Wisconsin, ALLETE owns ALLETE Clean Energy, based in Duluth, BNI Energy in Bismarck, N.D., New Energy Equity headquartered in Annapolis, MD, and has an eight percent equity interest in the American Transmission Co. More information about ALLETE is available at www.allete.com. ALE-CORP

The statements contained in this release and statements that ALLETE may make orally in connection with this release that are not historical facts, are forward-looking statements. Actual results may differ materially from those projected in the forward-looking statements. These forward-looking statements involve risks and uncertainties and investors are directed to the risks discussed in documents filed by ALLETE with the Securities and Exchange Commission.

ALLETE's press releases and other communications may include certain non-Generally Accepted Accounting Principles (GAAP) financial measures. A "non-GAAP financial measure" is defined as a numerical measure of a company's financial performance, financial position or cash flows that excludes (or includes) amounts that are included in (or excluded from) the most directly comparable measure calculated and presented in accordance with GAAP in the company's financial statements.

Non-GAAP financial measures utilized by the Company include presentations of earnings (loss) per share. ALLETE's management believes that these non-GAAP financial measures provide useful information to investors by removing the effect of variances in GAAP reported results of operations that are not indicative of changes in the fundamental earnings power of the Company's operations. Management believes that the presentation of the non-GAAP financial measures is appropriate and enables investors and analysts to more accurately compare the company's ongoing financial performance over the periods presented.

ALLETE, Inc.

Consolidated Statement of Income

Millions Except Per Share Amounts - Unaudited


Quarter Ended

Nine Months Ended


September 30,

September 30,


2022

2021

2022

2021

Operating Revenue


Contracts with Customers – Utility

$322.6


$304.8


$960.3


$888.2


Contracts with Customers – Non-utility

64.5


37.7


178.3


123.4


Other – Non-utility

1.2


2.9


6.3


8.6


Total Operating Revenue

388.3


345.4


1,144.9


1,020.2


Operating Expenses


Fuel, Purchased Power and Gas – Utility

136.8


140.1


417.4


389.4


Transmission Services – Utility

19.3


19.2


57.5


56.1


Cost of Sales – Non-utility

38.4


15.2


96.9


47.8


Operating and Maintenance

83.2


66.7


238.1


200.1


Depreciation and Amortization

58.7


57.5


181.4


173.4


Taxes Other than Income Taxes

18.5


15.6


53.1


52.1


Total Operating Expenses

354.9


314.3


1,044.4


918.9


Operating Income

33.4


31.1


100.5


101.3


Other Income (Expense)


Interest Expense

(18.4

)

(17.3

)

(55.3

)

(51.8

)

Equity Earnings

2.3


4.4


13.1


14.3


Other

2.3


1.0


16.4


6.1


Total Other Expense

(13.8

)

(11.9

)

(25.8

)

(31.4

)

Income Before Income Taxes

19.6


19.2


74.7


69.9


Income Tax Benefit

(7.2

)

(4.9

)

(19.4

)

(19.3

)

Net Income

26.8


24.1


94.1


89.2


Net Loss Attributable to Non-Controlling Interest

(6.9

)

(3.5

)

(43.5

)

(18.1

)

Net Income Attributable to ALLETE

$33.7


$27.6


$137.6


$107.3


Average Shares of Common Stock


Basic

57.1


52.4


55.5


52.3


Diluted

57.2


52.5


55.6


52.3


Basic Earnings Per Share of Common Stock

$0.59


$0.53


$2.48


$2.05


Diluted Earnings Per Share of Common Stock

$0.59


$0.53


$2.48


$2.05


Dividends Per Share of Common Stock

$0.65


$0.63


$1.95


$1.89


Consolidated Balance Sheet

Millions - Unaudited


Sep. 30

Dec. 31,


Sep. 30

Dec. 31,


2022

2021


2022

2021

Assets


Liabilities and Equity


Cash and Cash Equivalents

$42.1

$45.1


Current Liabilities

$706.0

$543.4

Other Current Assets

680.1

246.2


Long-Term Debt

1,653.0

1,763.2

Property, Plant and Equipment – Net

5,011.0

5,100.2


Deferred Income Taxes

177.0

185.7

Regulatory Assets

447.1

511.8


Regulatory Liabilities

527.4

536.1

Equity Investments

320.3

318.0


Defined Benefit Pension and Other Postretirement Benefit Plans

171.9

179.5

Goodwill and Intangibles – Net

155.8

0.8


Other Non-Current Liabilities

268.8

280.8

Other Non-Current Assets

201.6

212.9


Equity

3,353.9

2,946.3

Total Assets

$6,858.0

$6,435.0


Total Liabilities and Equity

$6,858.0

$6,435.0


Quarter Ended

Nine Months Ended

ALLETE, Inc.

September 30,

September 30,

Income (Loss)

2022

2021

2022

2021

Millions


Regulated Operations

$38.3


$32.9


$119.4

$99.4


ALLETE Clean Energy

(7.3

)

(0.8

)

15.0

11.7


Corporate and Other

2.7


(4.5

)

3.2

(3.8

)

Net Income Attributable to ALLETE

$33.7


$27.6


$137.6

$107.3


Diluted Earnings Per Share

$0.59


$0.53


$2.48

$2.05


Statistical Data


Corporate


Common Stock


High

$63.81

$73.10

$68.61

$73.10

Low

$49.89

$58.89

$49.89

$58.89

Close

$50.05

$59.52

$50.05

$59.52

Book Value

$46.93

$44.51

$46.93

$44.51

Kilowatt-hours Sold


Millions


Regulated Utility


Retail and Municipal


Residential

251

268

851

846

Commercial

353

360

1,027

1,018

Industrial

1,665

1,778

5,047

5,351

Municipal

130

147

419

445

Total Retail and Municipal

2,399

2,553

7,344

7,660

Other Power Suppliers

769

1,253

2,544

3,695

Total Regulated Utility Kilowatt-hours Sold

3,168

3,806

9,888

11,355

Regulated Utility Revenue


Millions


Regulated Utility Revenue


Retail and Municipal Electric Revenue


Residential

$37.7

$34.8

$123.3

$107.3

Commercial

47.8

43.2

135.8

119.6

Industrial

146.8

139.2

443.5

405.7

Municipal

9.8

14.4

31.9

38.5

Total Retail and Municipal Electric Revenue

242.1

231.6

734.5

671.1

Other Power Suppliers

46.7

41.2

124.6

116.9

Other (Includes Water and Gas Revenue)

33.8

32.0

101.2

100.2

Total Regulated Utility Revenue

$322.6

$304.8

$960.3

$888.2

This exhibit has been furnished and shall not be deemed “filed” for purposes of Section 18 of the Securities Exchange Act of 1934, nor shall it be deemed incorporated by reference in any filing under the Securities Act of 1933, except as shall be expressly set forth by specific reference in such filing.


Contacts

Vince Meyer
218-723-3952
This email address is being protected from spambots. You need JavaScript enabled to view it.

THE WOODLANDS, Texas--(BUSINESS WIRE)--Excelerate Energy, Inc. (NYSE: EE) (the “Company” or “Excelerate”) today reported its financial results for the third quarter ended September 30, 2022.

RECENT HIGHLIGHTS

  • Reported Net Income of $37.3 million for the third quarter
  • Reported Adjusted Net income of $38.6 million for the third quarter
  • Reported Adjusted EBITDAR of $86.4 million for the third quarter
  • Finland charter hire commenced October 1st; winterization upgrades for the FSRU Exemplar are ongoing
  • Signed definitive agreement to deploy FSRU Excelsior to Germany for 5 years
  • Executed shipbuilding contract with Hyundai Heavy Industries
  • The Excelerate Board declared a quarterly dividend of $0.025 per share on November 8th
  • Full year 2022 EBITDA and EBITDAR guidance range increased

CEO COMMENT

“Excelerate Energy delivered another great quarter, demonstrating the strength of our flexible business model against the backdrop of the most significant energy market disruption in decades,” said President and Chief Executive Officer Steven Kobos. “We are successfully executing our strategy to deploy our flexible LNG infrastructure and pursue downstream opportunities to expand our reach in both new and existing markets. As a result, we remain positioned well for growth and to deliver sustained value creation for shareholders over the long-term.

“Flexible access to LNG continues to play a critical role in providing cleaner and more reliable energy to countries across the globe,” continued Kobos. “Our portfolio approach to managing our FSRU fleet provides us with a unique ability to deliver the best solutions that scale with our customers’ needs in both developed and emerging markets. We look forward to continuing to help countries bolster their energy security and achieve their decarbonization goals.”

THIRD QUARTER 2022 FINANCIAL RESULTS


For the three months ended


September 30,


June 30,


September 30,

(in millions)

2022


2022


2021

Revenues

$

803.3


$

622.9


$

192.1

Operating Income

$

49.9


$

39.3


$

25.7

Net Income/(Loss)

$

37.3


$

(4.0

)


$

1.4

Adjusted Net Income (1)

$

38.6


$

20.4


$

6.9

Adjusted EBITDA (1)

$

77.5


$

66.1


$

58.2

Adjusted EBITDAR (1)

$

86.4


$

75.2


$

65.3

Earnings (Loss) Per Share (diluted)

$

0.34


$

(0.08

)


(1) See the reconciliation of non-GAAP financial measures to the most comparable GAAP financial measure in the section titled "Non-GAAP Reconciliation" below.

Net income increased over the second quarter of 2022, primarily due to the one-time charge in second quarter related to the early extinguishment of the Excellence lease as part of the IPO-related FSRU acquisition, in addition to the Adjusted EBITDA variance drivers below.

Adjusted EBITDA and Adjusted EBITDAR for the third quarter of 2022 increased over the prior quarter due to lower idle fuel costs, lower repair and maintenance expenses, and higher margins from the Bahia Blanca seasonal charter in Argentina. This was partially offset by an increase in selling, general, and administrative expenses, primarily driven by higher consulting costs to support the Company’s transition to a public company structure, along with higher expenses related to business development and marketing activities.

KEY PROJECT UPDATES

Finland

The Finland charter hire commenced on October 1, 2022, and the FSRU Exemplar is currently undergoing customer requested winterization upgrades during a technical stop at the Navantia shipyard in Ferrol, Spain. Excelerate and Gasgrid Finland previously announced an executed 10-year, time charter party agreement for Excelerate to provide LNG regasification services, which are expected to commence in the fourth quarter of 2022.

Germany

In October 2022, Excelerate signed a five-year charter contract with the German government for the FSRU Excelsior. The Excelsior is expected to provide regasification services at Germany’s planned LNG import terminal which is being developed at the port of Wilhelmshaven by Tree Energy Solutions, E.ON, and ENGIE. Excelerate previously announced that the Company and ENGIE signed a term sheet for the deployment of an FSRU to provide flexible and secure LNG regasification capacity for Germany as it continues to seek alternatives to Russian pipeline gas supply.

HHI Newbuild FSRU

In October 2022, Excelerate signed a binding Shipbuilding Contract with Hyundai Heavy Industries Co., Ltd. (“HHI”) for a new FSRU to be delivered in June 2026. The state-of-the-art FSRU will be equipped with HHI’s proprietary LNG regasification system, dual fuel engines, selective catalytic reduction system, best-in-class containment system and boil-off gas management, and other innovative technologies which will drive improved performance and efficiency while lowering emissions. With this newbuild order, Excelerate now has eleven FSRUs in operation or under construction.

Bahia Blanca

The FSRU Exemplar completed its seasonal regasification charter at the Bahia Blanca GasPort in Argentina on August 31, 2022. During this period, the Exemplar provided critical security of supply for Argentina by receiving and re-gasifying twelve LNG cargos.

LIQUIDITY AND CAPITAL RESOURCES

As of September 30, 2022, Excelerate had $345.7 million in cash and cash equivalents. As of September 30, 2022, the Company had letters of credit issued of $40 million and no outstanding borrowings under its $350 million senior secured revolving credit facility.

On November 8, 2022, Excelerate’s Board of Directors (the “Board”) approved a quarterly dividend equal to $0.025 per share of Class A common stock, which will be paid on December 14, 2022, to shareholders of record at the close of business on November 22, 2022.

2022 FINANCIAL OUTLOOK

Excelerate is increasing its full year 2022 guidance range. Adjusted EBITDA is now expected to range between $264 million and $274 million. The previous range was between $249 million and $269 million. In addition, the Company now expects full year 2022 Adjusted EBITDAR to range between $300 million and $310 million. The previous range was between $285 million and $305 million.

Actual results may differ materially from the Company’s outlook as a result of, among other things, the factors described under “Forward-Looking Statements” below.

INVESTOR CONFERENCE CALL AND WEBCAST

The Excelerate management team will host a conference call for investors and analysts at 8:30 am Eastern Time (7:30 a.m. Central Time) on Thursday, November 10, 2022. Investors are invited to access a live webcast of the conference call via the Investor Relations page on the Company’s website at www.excelerateenergy.com. An archived replay of the call and a copy of the presentation will be on the website following the call.

ABOUT EXCELERATE ENERGY

Excelerate Energy, Inc. is a U.S.-based LNG company located in The Woodlands, Texas. Excelerate is changing the way the world accesses cleaner forms of energy by providing integrated services along the LNG value chain with an objective of delivering rapid-to-market and reliable LNG solutions to customers. The Company offers a full range of flexible regasification services from FSRUs to infrastructure development to LNG supply. Excelerate has offices in Abu Dhabi, Antwerp, Boston, Buenos Aires, Chattogram, Dhaka, Doha, Dubai, Helsinki, Ho Chi Minh City, Manila, Rio de Janeiro, Singapore, and Washington, DC. For more information, please visit www.excelerateenergy.com.

USE OF NON-GAAP FINANCIAL MEASURES

The Company reports financial results in accordance with accounting principles generally accepted in the United States (“GAAP”). Included in this press release are certain financial measures that are not calculated in accordance with GAAP. They are designed to supplement, and not substitute, Excelerate’s financial information presented in accordance with U.S. GAAP. The non-GAAP measures as defined by Excelerate may not be comparable to similar non-GAAP measures presented by other companies. The presentation of such measures, which may include adjustments to exclude non-recurring items, should not be construed as an inference that Excelerate’s future results, cash flows or leverage will be unaffected by other nonrecurring items. Management believes that the following non-GAAP financial measures provide investors with additional useful information in evaluating the Company's performance and valuation. See the reconciliation of non-GAAP financial measures to the most comparable GAAP financial measure, including those measures presented as part of the Company’s 2022 Financial Outlook, in the section titled “Non-GAAP Reconciliation” below.

Adjusted Gross Margin

The Company uses Adjusted Gross Margin, a non-GAAP financial measure, which it defines as revenues less direct cost of sales and operating expenses, excluding depreciation and amortization, to measure its operational financial performance. Management believes Adjusted Gross Margin is useful because it provides insight on profitability and true operating performance excluding the implications of the historical cost basis of its assets. The Company's computation of Adjusted Gross Margin may not be comparable to other similarly titled measures of other companies, and you are cautioned not to place undue reliance on this information.

Adjusted EBITDA and Adjusted EBITDAR

Adjusted EBITDA is a non-GAAP financial measure included as a supplemental disclosure because the Company believes it is a useful indicator of its operating performance. The Company defines Adjusted EBITDA, a non-GAAP measure, as net income before interest, income taxes, depreciation and amortization, long-term incentive compensation expense and items such as charges and non-recurring expenses that management does not consider as part of assessing ongoing operating performance. In the second quarter of 2022, the Company revised the definition of Adjusted EBITDA to adjust for the impact of long-term incentive compensation expense, which the Company did not have prior to becoming a public company, and the early extinguishment of lease liability related to the acquisition of the Excellence vessel, as management believes such items do not directly reflect the Company’s ongoing operating performance.

Adjusted EBITDAR is a non-GAAP financial measure included as a supplemental disclosure because the Company believes it is a valuation measure commonly used by financial statement users to more effectively compare the results of its operations from period to period and against other companies without regard to its financing methods or capital structure. The Company defines Adjusted EBITDAR, a non-GAAP measure, as Adjusted EBITDA adjusted to eliminate the effects of rental expenses for vessels and other infrastructure, which are normal, recurring cash operating expenses necessary to operate its business.

Adjusted Net Income

The Company uses Adjusted Net Income, a non-GAAP financial measure, which it defines as net income (loss) plus the early extinguishment of lease liability related to the acquisition of the Excellence vessel and restructuring, transition and transaction expenses. Management believes Adjusted Net Income is useful because it provides insight on profitability excluding the impact of non-recurring charges related to our IPO. The Company's computation of Adjusted Net Income may not be comparable to other similarly titled measures of other companies, and you are cautioned not to place undue reliance on this information.

The Company adjusts net income for the items listed above to arrive at Adjusted EBITDA, Adjusted EBITDAR, and Adjusted Net Income because these amounts can vary substantially from company to company within its industry depending upon accounting methods and book values of assets, capital structures and the method by which the assets were acquired. Adjusted EBITDA, Adjusted EBITDAR, and Adjusted Net Income should not be considered as an alternative to, or more meaningful than, net income as determined in accordance with GAAP or as an indicator of the Company's operating performance or liquidity. These measures have limitations as certain excluded items are significant components in understanding and assessing a company’s financial performance, such as a company’s cost of capital and tax structure, as well as the historic costs of depreciable assets, none of which are components of Adjusted EBITDA and Adjusted EBITDAR. Adjusted EBITDAR should not be viewed as a measure of overall performance or considered in isolation or as an alternative to net income because it excludes rental expenses for vessels and other infrastructure, which is a normal, recurring cash operating expense that is necessary to operate the Company's business. The Company's presentation of Adjusted EBITDA, Adjusted EBITDAR, and Adjusted Net Income should not be construed as an inference that its results will be unaffected by unusual or non-recurring items. The Company's computations of Adjusted EBITDA, Adjusted EBITDAR, and Adjusted Net Income may not be comparable to other similarly titled measures of other companies. For the foregoing reasons, each of Adjusted EBITDA, Adjusted EBITDAR, and Adjusted Net Income has significant limitations which affect its use as an indicator of its profitability and valuation, and you are cautioned not to place undue reliance on this information.

FORWARD-LOOKING STATEMENTS

This press release contains forward-looking statements about Excelerate and its industry that involve substantial risks and uncertainties. All statements other than statements of historical fact contained in this press release, including, without limitation, statements regarding Excelerate’s future results of operations or financial condition, business strategy and plans, expansion plans and strategy, economic conditions, both generally and in particular in the regions in which Excelerate operates, and objectives of management for future operations, are forward-looking statements. In some cases, you can identify forward-looking statements by terminology such as “believe,” “consider,” “contemplate,” “continue,” “could,” “estimate,” “expect,” “may,” “intend,” “plan,” “potential,” “predict,” “project,” “should,” “target,” “will,” “would,” “shall,” “should,” “anticipate,” “opportunity” or the negative thereof or other variations thereon or comparable terminology. These statements appear throughout this press release and include, but are not limited to, statements regarding Excelerate’s plans, objectives, expectations and intentions.

You should not rely on forward-looking statements as predictions of future events. Excelerate has based the forward-looking statements contained in this press release primarily on its current expectations and projections about future events and trends that it believes may affect its business, financial condition and operating results. The outcome of the events described in these forward-looking statements is subject to risks, uncertainties and other factors. All forward-looking statements are based on assumptions or judgments about future events that may or may not be correct or necessarily take place and that are by their nature subject to significant uncertainties and contingencies, many of which are outside the control of Excelerate. The occurrence of any such factors, events or circumstances would significantly alter the results set forth in these statements.

Moreover, Excelerate operates in a very competitive and rapidly changing environment. New risks and uncertainties emerge from time to time, for example the invasion of Ukraine by Russia, and it is not possible for Excelerate to predict all risks and uncertainties that could have an impact on the forward-looking statements contained in this press release. The unprecedented nature of the Covid-19 pandemic may give rise to risks that are currently unknown or amplify the risks associated with many of the foregoing events or factors. The results, events and circumstances reflected in the forward-looking statements may not be achieved or occur, and actual results, events or circumstances could differ materially from those described in the forward-looking statements.

In addition, statements that “Excelerate believes” and similar statements reflect Excelerate’s beliefs and opinions on the relevant subject. These statements are based on information available to Excelerate as of the date of this press release. And while Excelerate believes that information provides a reasonable basis for these statements, that information may be limited or incomplete. Excelerate’s statements should not be read to indicate that it has conducted an exhaustive inquiry into, or review of, all relevant information. These statements are inherently uncertain, and investors are cautioned not to unduly rely on these statements.

The forward-looking statements made in this press release relate only to events as of the date on which the statements are made. Excelerate undertakes no obligation to update any forward-looking statements made in this press release to reflect events or circumstances after the date of this press release or to reflect new information or the occurrence of unanticipated events, except as required by law. Excelerate may not actually achieve the plans, intentions or expectations disclosed in its forward-looking statements, and you should not place undue reliance on its forward-looking statements. Excelerate’s forward-looking statements do not reflect the potential impact of any future acquisitions, mergers, dispositions, joint ventures or investments.

Excelerate Energy, Inc.

Consolidated Statements of Income (Unaudited)


For the three months ended


September 30,


June 30,


September 30,


2022


2022


2021


(In thousands, except share and per share amounts)


Revenues


FSRU and terminal services


$

115,346


$

110,072


$

116,578


Gas sales


687,915


512,857


75,563


Total revenues


803,261


622,929


192,141


Operating expenses


Cost of revenue and vessel operating expenses


50,258


58,673


44,785


Direct cost of gas sales


658,320


485,023


78,536


Depreciation and amortization


24,648


24,296


26,074


Selling, general and administrative expenses


18,778


13,064


11,518


Restructuring, transition and transaction expenses


1,345


2,582


5,548


Total operating expenses


753,349


583,638


166,461


Operating income


49,912


39,291


25,680


Other income (expense)


Interest expense


(9,454

)


(7,800

)


(7,595

)

Interest expense – related party


(4,235

)


(5,493

)


(12,390

)

Earnings from equity method investment


625


732


817


Early extinguishment of lease liability on vessel acquisition


(21,834

)


Other income (expense), net


657


(1,086

)


93


Income before income taxes


37,505


3,810


6,605


Provision for income taxes


(233

)


(7,800

)


(5,228

)

Net income (loss)


37,272


(3,990

)


1,377


Less net income (loss) attributable to non-controlling interest


28,571


(831

)


891


Less net income (loss) attributable to non-controlling interest – ENE Onshore


(127

)


(181

)


(1,412

)

Less pre-IPO net income (loss) attributable to EELP


(947

)


1,898


Net income (loss) attributable to shareholders


$

8,828


$

(2,031

)


$


Net income (loss) per common share – basic


$

0.34


$

(0.08

)


$


Net income (loss) per common share – diluted


$

0.34


$

(0.08

)


$


Weighted average shares outstanding – basic


26,254,167


26,254,167


Weighted average shares outstanding – diluted


26,260,861


26,254,167


Excelerate Energy, Inc.

Consolidated Balance Sheets


September 30, 2022


December 31, 2021


(Unaudited)


ASSETS


(In thousands)


Current assets


Cash and cash equivalents


$

345,682


$

72,786


Current portion of restricted cash


3,458


2,495


Accounts receivable, net


326,260


260,535


Accounts receivable, net – related party


2,496


11,140


Inventories


244,869


105,020


Current portion of net investments in sales-type leases


12,759


12,225


Other current assets


20,499


26,194


Total current assets


956,023


490,395


Restricted cash


17,907


15,683


Property and equipment, net


1,417,570


1,433,169


Operating lease right-of-use assets


84,786


106,225


Net investments in sales-type leases


403,438


412,908


Investment in equity method investee


21,267


22,051


Deferred tax assets


51,155


939


Other assets


29,320


19,366


Total assets


$

2,981,466


$

2,500,736


LIABILITIES AND EQUITY


Current liabilities


Accounts payable


$

367,713


$

303,651


Accounts payable to related party


345


7,937


Accrued liabilities and other liabilities


74,262


105,034


Current portion of deferred revenue


14,279


9,653


Current portion of long-term debt


20,670


19,046


Current portion of long-term debt – related party


7,514


7,096


Current portion of operating lease liabilities


32,110


30,215


Current portion of finance lease liabilities


19,999


21,903


Current portion of finance lease liabilities – related party


15,627


Total current liabilities


536,892


520,162


Derivative liabilities


2,999


Long-term debt, net


199,295


214,369


Long-term debt, net – related party


192,836


191,217


Operating lease liabilities


55,692


77,936


Finance lease liabilities


215,332


229,755


Finance lease liabilities – related party


210,992


TRA liability


76,654


Asset retirement obligations


36,043


34,929


Other long-term liabilities


18,951


14,451


Total liabilities


$

1,331,695


$

1,496,810


Commitments and contingencies


Class A Common Stock ($0.001 par value, 300,000,000 shares authorized and 26,254,167 shares issued and outstanding as of September 30, 2022; no shares authorized, issued or outstanding as of December 31, 2021)


$

26


$


Class B Common Stock ($0.001 par value, 150,000,000 shares authorized and 82,021,389 shares issued and outstanding as of September 30, 2022; no shares authorized, issued or outstanding as of December 31, 2021)


82


Additional paid-in capital


583,997


Equity interest


1,135,769


Retained earnings


4,090


Related party note receivable


(6,759

)

Accumulated other comprehensive loss


135


(9,178

)

Non-controlling interest


1,192,268


14,376


Non-controlling interest – ENE Onshore


(130,827

)


(130,282

)

Total equity


$

1,649,771


$

1,003,926


Total liabilities and equity


$

2,981,466


$

2,500,736


Excelerate Energy, Inc.

Consolidated Statements of Cash Flows (Unaudited)


For the nine months ended


September 30, 2022


September 30, 2021


Cash flows from operating activities


(In thousands)


Net income


$

46,126


$

42,977


Adjustments to reconcile net income to net cash from operating activities


Depreciation and amortization


72,687


78,320


Amortization of operating lease right-of-use assets


23,376


17,123


ARO accretion expense


1,114


1,067


Amortization of debt issuance costs


1,826


1,096


Deferred income taxes


(10,584

)


Share of net earnings in equity method investee


(2,135

)


(2,431

)

Distributions from equity method investee


4,950


Long-term incentive compensation expense


598


Early extinguishment of lease liability on vessel acquisition


21,834


Non-cash restructuring expense


1,574


(Gain)/loss on non-cash items


158


Changes in operating assets and liabilities:


Accounts receivable


(56,155

)


(10,255

)

Inventories


(139,849

)


15,528


Other current assets and other assets


(5,003

)


(7,256

)

Accounts payable and accrued liabilities


25,096


9,202


Derivative liabilities


3,649


322


Current portion of deferred revenue


4,626


(61

)

Net investments in sales-type leases


8,935


7,477


Operating lease assets and liabilities


(22,286

)


(16,316

)

Other long-term liabilities


3,687


(6,217

)

Net cash provided by (used in) operating activities


$

(15,776

)


$

130,576


Cash flows from investing activities


Purchases of property and equipment


(63,874

)


(30,837

)

Net cash used in investing activities


$

(63,874

)


$

(30,837

)

Cash flows from financing activities


Proceeds from issuance of common stock, net


412,183


Proceeds from long-term debt – related party


652,800


39,500


Repayments of long-term debt – related party


(651,393

)


(5,298

)

Repayments of long-term debt


(14,326

)


(21,118

)

Proceeds from revolving credit facility


140,000


Repayments of revolving credit facility


(140,000

)


Payment of debt issuance costs


(5,951

)


Related party note receivables


(88,500

)

Collections of related party note receivables


6,600


Settlement of finance lease liability – related party


(25,000

)


Principal payments under finance lease liabilities


(16,326

)


(26,993

)

Principal payments under finance lease liabilities – related party


(2,912

)


(11,611

)

Dividends paid


(656

)


Contribution


2,765


Distributions


(2,051

)


(113

)

Net cash provided by (used in) financing activities


$

355,733


$

(114,133

)

Net increase (decrease) in cash, cash equivalents and restricted cash


276,083


(14,394

)


Cash, cash equivalents and restricted cash


Beginning of period


$

90,964


$

109,539


End of period


$

367,047


$

95,145


Contacts

Investors
Craig Hicks
Excelerate Energy
This email address is being protected from spambots. You need JavaScript enabled to view it.

Media
Stephen Pettibone / Frances Jeter
FGS Global
This email address is being protected from spambots. You need JavaScript enabled to view it.
or
This email address is being protected from spambots. You need JavaScript enabled to view it.


Read full story here

The Mobility House expected to save country’s largest transit agency more than $420,000 in operating expenses in one year

BELMONT, Calif.--(BUSINESS WIRE)--The Mobility House has been selected by the Metropolitan Transportation Authority to deploy its smart charging and energy management solution ChargePilot® for New York City Transit (NYCT), the largest public bus fleet operator in the U.S. During the year-long pilot program, The Mobility House will manage charging for 27 charge ports across two bus depots in Staten Island and Queens. Coordinating local utility rate structures with bus schedules and travel routes, ChargePilot® will optimize charging to maximize vehicle uptime, reduce electricity costs and streamline the transition to electric vehicles. The Mobility House’s proof-of-concept modeling with the Transit Tech Lab demonstrated that ChargePilot® can reduce operating expenses by more than $35,000 per month in operating expenses at one of the two depots alone.


The partnership with NYCT is a continuation of The Mobility House’s participation in the Transit Tech Lab program – a public-private initiative between the Partnership for New York City and four New York metro area transit agencies – and follows The Mobility House’s successful proof-of-concept study on how NYCT could maximize electric bus availability and save operating costs. The simulation study demonstrated that 64 percent of scheduled trips on local routes from the Charleston depot could be operated with the selected electric bus model, and when using ChargePilot®, the charging infrastructure planned for 12 electric buses at the Charleston depot can operate 96 percent of the viable trips while generating operational savings, compared to unmanaged charging.

“We are thrilled to partner with the MTA as they embark on a journey toward zero-emission,” said The Mobility House U.S. Managing Director Gregor Hintler. “As the largest public fleet operator in the country, ensuring reliable operations is essential to the success of their electrification goals, especially when some buses require two to four charging sessions a day. We are proud that The Mobility House's technology and electrification expertise will contribute to that critical mission.”

To learn more about The Mobility House’s charging and energy management solutions, visit mobilityhouse.com/usa_en.

About The Mobility House

The Mobility House’s mission is to create an emissions-free energy and mobility future. Since 2009, the company has developed an expansive partner ecosystem to intelligently integrate electric vehicles into the power grid, including electric vehicle charger manufacturers, 1,000+ installation partners, 80+ energy suppliers, and automotive manufacturers ranging from Audi to Tesla. The intelligent Charging and Energy Management system ChargePilot® and underlying EV Aggregation Platform enable customers and partners to integrate electric vehicles into the grid for optimized and future proof operations. The Mobility House’s unique vendor-neutral and interoperable technology approach to smart charging and energy management has been successful at over 800 commercial installations around the world. The Mobility House has more than 250 employees across its operations in Munich, Zurich and Belmont, Calif. For more information visit mobilityhouse.com.


Contacts

Christine Bennett for The Mobility House
This email address is being protected from spambots. You need JavaScript enabled to view it. | +1 925.330.4783

  • Generated third quarter net income of $49.4 million and Adjusted EBITDA1 of $212.4 million
  • Company record for quarterly natural gas processed volumes of 1.2 Bcf/d
  • Reiterating 2022 Guidance for Pro Forma Adjusted EBITDA1,2,3 of $820 million to $840 million and Capital Expenditures of $280 million to $300 million
  • Achieved $25 million full year 2022 EBITDA synergy target within the first three quarters of 2022
  • Closed acquisition of Brandywine NGL pipeline, expanding Kinetik’s intrabasin NGL system, known as Kinetik NGL

HOUSTON & MIDLAND, Texas--(BUSINESS WIRE)--Kinetik Holdings Inc. (NYSE: KNTK) (“Kinetik” or the “Company”) today reported financial results for the quarter ended September 30, 2022.


Our third quarter results are a testament to successful execution across all aspects of our business,” said Jamie Welch, Kinetik’s Chief Executive Officer and President. “We have continued to identify strategic opportunities while optimizing our super system and realizing efficiencies. We delivered another strong quarter of Adjusted EBITDA and are tracking well to meet our 2022 EBITDA and Capital Expenditures Guidance provided in August. We also achieved our full year synergy goal within the first nine months, and therefore, have increased our 2022 full year target to over $30 million.”

“During the third quarter, several projects were completed to support previously announced new Midstream Logistics contracts commencing in the fourth quarter. As a result, we achieved record gas gathered and processed volumes during the month of October. In September, we closed the Brandywine NGL acquisition further expanding our intrabasin NGL gathering system and Pipeline Transportation segment,” continued Welch.

“We remain focused on executing on our capital allocation priorities outlined earlier this year, identifying accretive and strategic opportunities, and maximizing shareholder value. We also believe the natural gas price dislocation at Waha will persist and is a unique opportunity for us relative to many of our peers given our Gulf Coast transport capacity.”

Kinetik has presented certain financial results herein on a “pro forma basis”2 as the Company believes it provides more meaningful information to its investors and helps to reconcile to its previously provided 2022 full year guidance.

For US GAAP purposes, Kinetik’s financial results reflect BCP Raptor Holdco, LP, Kinetik’s predecessor for accounting purposes (“BCP”), from January 1, 2022 to February 22, 2022 and the combined Company, which includes Altus Midstream LP (“Altus”), from the closing date, February 22, 2022, onwards. The results for Altus are specifically excluded for the period from January 1, 2022 to February 22, 2022. See “Notes Regarding Presentation of Financial Information.”

For the three and nine months ended September 30, 2022, Kinetik processed natural gas volumes of 1.19 Bcf/d and 1.15 Bcf/d, respectively, and reported net income including noncontrolling interest of $49.4 million and $202.3 million for the three and nine months ended September 30, 2022, respectively. Net income including noncontrolling interest includes a non-cash gain on the change in the valuation of the embedded derivative of $0.5 million and $89.1 million for the three and nine months ended September 30, 2022, respectively. Kinetik generated Pro Forma Adjusted EBITDA1,2,3 of $212.4 million and $611.1 million for the three and nine months ended September 30, 2022, respectively, Pro Forma Distributable Cash Flow (“DCF”)1,2,3 of $157.7 million and $474.0 million for the three and nine months ended September 30, 2022, respectively, and Pro Forma Free Cash Flow (“FCF”)1,2,3 of $34.0 million and $280.0 million for the three and nine months ended September 30, 2022, respectively. The results were primarily driven by increased volumes across both the Midstream Logistics and Pipeline Transportation segments.

Financial

  1. Achieved quarterly Adjusted EBITDA1 of $212.4 million.
  2. Declared a dividend of $0.75 per share on October 19, 2022 for the quarter ended September 30, 2022, or $3.00 per share on an annualized basis. 117 million shares have elected to reinvest the third quarter dividend into newly issued shares of Class A common stock of the Company. As a result, $15.3 million of third quarter dividends will be paid in cash.4
  3. Exited the third quarter with a Leverage Ratio1,2,3,5 of 4.0x.
  4. Redeemed the full remaining balance of Series A Preferred Units in early July 2022. The accelerated redemption completes Kinetik’s capital structure simplification.
  5. Fixed Kinetik’s floating SOFR rate for $2.0 billion of its Term Loan A bank facility through April 2023 and $1.0 billion from May 2023 through May 2025, reducing Kinetik’s floating rate exposure to less than 15% and approximately 40%, respectively, of total current debt outstanding.
  6. Transferred Kinetik’s Class A Common Stock listing to the New York Stock Exchange on October 24, 2022.


Key Metrics:


Three Months Ended September 30,


Nine Months Ended September 30,


2022


2022


(In thousands, except ratios)

Net income including noncontrolling interest6


$

49,422


$

202,259

Adjusted EBITDA1


$

212,370


$

561,079

Pro Forma Adjusted EBITDA1,2,3


$

212,370


$

611,105

Pro Forma DCF1,2,3


$

157,738


$

473,966

Pro Forma Dividend Coverage Ratio1,2,3,7


1.5x


1.6x

Pro Forma FCF1,2,3


$

34,008


$

280,029

Leverage Ratio1,2,3,5


4.0x


September 30, 2022


June 30, 2022


March 31, 2022


(In thousands)

Net Debt1,8


$

3,463,272


$

2,994,681


$

2,966,103

1.

A non-GAAP financial measure. See “Non-GAAP Financial Measures” and “Reconciliation of GAAP to Non-GAAP Measures” for further details.

2.

Pro forma information has been prepared for informational purposes only. See “Notes Regarding Presentation of Financial Information” and “Reconciliation of Pro Forma Non-GAAP Measures.”

3.

Pro Forma Adjusted EBITDA, DCF, Dividend Coverage Ratio, FCF and Leverage Ratio are calculated as if the Transaction occurred on January 1, 2022. See “Notes Regarding Presentation of Financial Information.”

4.

Dividends reinvested and dividends paid in cash as of November 9, 2022.

5.

Leverage Ratio is total debt less cash and cash equivalents divided by last twelve months Adjusted EBITDA, calculated in the Company’s credit agreement. The calculation includes Qualified Project EBITDA Adjustments that pertain to the funding of the Permian Highway Pipeline expansion project, Brandywine NGL acquisition, and other qualified growth capital projects at the Midstream Logistics segment.

6.

Net income including noncontrolling interest for the three and nine months ended September 30, 2021 was $4.6 million and $7.4 million, respectively.

7.

Pro Forma Dividend Coverage Ratio is Pro Forma DCF divided by total declared dividends.

8.

Net Debt is defined as total long-term debt, excluding deferred financing costs, less cash and cash equivalents.

Strategic

  1. Acquired Brandywine NGL, an intrabasin NGL pipeline, affording Kinetik greater control over system NGLs and providing interconnectivity to downstream outlets. Kinetik NGL, the Company’s intrabasin NGL pipeline system, is comprised of the Dew Point and Brandywine assets and is wholly owned and operated by Kinetik.
  2. Progress continues on the PHP expansion of 550 MMcf/d of incremental capacity, increasing natural gas deliveries from the Permian to the U.S. Gulf Coast markets. The required compression equipment has been secured and activities are underway to secure construction contractors, land and materials. The pipeline expansion should be in-service by November 1, 2023. Based on capital funding of the expansion, Kinetik’s ownership of PHP will increase to almost 56% after the in-service date.

Operational

  1. On October 1, 2022, commenced the two previously announced gathering and processing agreements with large cap investment grade counterparties.
  2. Added six new customers since January 1, 2022 (including three since July 1, 2022), a 20% increase in total customer count.
  3. Procured long-lead equipment for the Diamond Cryo processing complex expansion. The expansion adds an incremental 120 MMcf/d of incremental processing capacity and should be in-service in first quarter 2023.

Upcoming Tour Dates

Kinetik plans to participate at the following upcoming conferences and events:

  1. RBC Midstream and Energy Infrastructure Conference in Dallas on November 16 - 17
  2. Bank of America Global Energy Conference in Miami on November 16 - 17
  3. Wells Fargo Midstream, Utilities and Renewable Power Symposium in New York City on December 7 - 8
  4. Goldman Sachs Global Energy and Clean Technology Conference in Miami on January 5 - 6
  5. UBS Infrastructure & Energy Conference in Park City on January 9 - 11
  6. US Capital Advisors Corporate Access Day in Houston on January 24

Investor Presentation

An updated investor presentation will be available under Events and Presentations in the Investors section of the Company’s website at www.kinetik.com.

Conference Call and Webcast

Kinetik will host its third quarter 2022 results conference call on Thursday, November 10, 2022 at 8:00 am Central Standard Time (9:00 am Eastern Standard Time) to discuss third quarter results. To access a live webcast of the conference call, please visit the Investor Relations section of Kinetik’s website at www.ir.kinetik.com. A replay of the conference call also will be available on the website following the call.

About Kinetik Holdings Inc.

Kinetik is a fully integrated, pure-play, Permian-to-Gulf Coast midstream C-corporation operating in the Delaware Basin. Kinetik is headquartered in Midland, Texas and has a significant presence in Houston, Texas. Kinetik provides comprehensive gathering, transportation, compression, processing and treating services for companies that produce natural gas, natural gas liquids, crude oil and water. Kinetik posts announcements, operational updates, investor information and press releases on its website, www.kinetik.com.

Additional information

Additional information follows, including a reconciliation of Adjusted EBITDA, Pro Forma Adjusted EBITDA, Distributable Cash Flow, Pro Forma Distributable Cash Flow, Free Cash Flow, Pro Forma Free Cash Flow, and Net Debt (non-GAAP financial measures) to the GAAP measures.

Non-GAAP financial measures

Kinetik’s financial information includes information prepared in conformity with generally accepted accounting principles (GAAP) as well as non-GAAP financial information. It is management’s intent to provide non-GAAP financial information to enhance understanding of our consolidated financial information as prepared in according with GAAP. Adjusted EBITDA, Pro Forma Adjusted EBITDA, Distributable Cash Flow, Pro Forma Distributable Cash Flow, Free Cash Flow, Pro Forma Free Cash Flow, Pro Forma Dividend Coverage Ratio, Net Debt and Leverage Ratio are non-GAAP measures. This non-GAAP information should be considered by the reader in addition to, but not instead of, the financial statements prepared in accordance with GAAP and reconciliations from these results should be carefully evaluated. See “Reconciliation of GAAP to Non-GAAP Measures” and “Reconciliation of Pro Forma Non-GAAP Financial Measures” elsewhere in this news release.

Forward-looking statements

This news release includes certain statements that may constitute “forward-looking statements” for purposes of the federal securities laws. Forward-looking statements include, but are not limited to, statements that refer to projections, forecasts or other characterizations of future events or circumstances, including any underlying assumptions. The words “anticipate,” “believe,” “continue,” “could,” “estimate,” “expect,” “intends,” “may,” “might,” “plan,” “seeks,” “possible,” “potential,” “predict,” “project,” “prospects,” “guidance,” “outlook,” “should,” “would,” “will,” and similar expressions may identify forward-looking statements, but the absence of these words does not mean that a statement is not forward-looking. These statements include, but are not limited to, statements about the Company’s future plans, expectations, and objectives for the Company’s operations, including statements about strategy, synergies, expansion projects and future operations and 2022 financial guidance. While forward-looking statements are based on assumptions and analyses made by us that we believe to be reasonable under the circumstances, whether actual results and developments will meet our expectations and predictions depend on a number of risks and uncertainties which could cause our actual results, performance, and financial condition to differ materially from our expectations. See Part II, Item 1A. Risk Factors in our Quarterly Report on Form 10-Q for the period ended March 31, 2022. Any forward-looking statement made by us in this news release speaks only as of the date on which it is made. Factors or events that could cause our actual results to differ may emerge from time to time, and it is not possible for us to predict all of them. We undertake no obligation to publicly update any forward-looking statement, whether as a result of new information, future development, or otherwise, except as may be required by law.

Notes Regarding Presentation of Financial Information

The following addresses the results of our operations for the three and nine months ended September 30, 2022, as compared to our results of operations for the three and nine months ended September 30, 2021. As the Transaction was determined to be a reverse merger, BCP was considered the accounting acquirer and Altus was considered the legal acquirer. Therefore, BCP’s net assets, carrying at historical value, were presented as the predecessor to the Company’s historical financial statements and the comparable period presented herein reflects the results of operations of BCP for the three and nine months ended September 30, 2021. The results of operations of Altus are reflected within the Company’s Condensed Consolidated Financial Statements from February 22, 2022, the closing date, through September 30, 2022.

Unless otherwise noted or the context requires otherwise, references herein to Kinetik Holdings Inc. or “the Company” with respect to time periods prior to February 22, 2022 include BCP and its consolidated subsidiaries and do not include Altus and its consolidated subsidiaries, while references herein to Kinetik Holdings Inc. with respect to time periods from and after February 22, 2022 include Altus and its consolidated subsidiaries.

KINETIK HOLDINGS INC.

CONDENSED CONSOLIDATED STATEMENTS OF OPERATIONS

(Unaudited)


Three Months Ended

September 30,(1)


Nine Months Ended

September 30,(1)


2022


2021


2022


2021


(In thousands, except per share data)

Operating revenues:


Service revenue


$

107,597


$

72,578


$

290,122


$

202,482


Product revenue


213,803


93,266


618,382


244,358


Other revenue


3,776


742


9,493


3,615


Total operating revenues


325,176


166,586


917,997


450,455


Operating costs and expenses:


Costs of sales (exclusive of depreciation and amortization

shown separately below)


145,208


60,503


418,197


141,011


Operating expenses


35,845


22,731


100,996


63,575


Ad valorem taxes


5,903


3,238


15,936


9,003


General and administrative expenses


23,468


6,957


72,180


17,920


Depreciation and amortization


65,005


57,154


192,609


170,291


Loss (gain) on disposal of assets


3,946


(37

)


12,602


417


Total operating costs and expenses


279,375


150,546


812,520


402,217


Operating income


45,801


16,040


105,477


48,238


Other income (expense):


Interest and other income


3,578


250


4,141


Gain on redemption of mandatorily redeemable Preferred Units


9,580


Gain (loss) on debt extinguishment


(56

)


(27,975

)


4


Gain on embedded derivative


488


89,050


Interest expense


(40,464

)


(30,541

)


(92,585

)


(88,458

)

Equity in earnings of unconsolidated affiliates


45,003


16,826


120,706


44,692


Total other income (expense), net


5,027


(10,193

)


99,026


(39,621

)

Income before income taxes


50,828


5,847


204,503


8,617


Income tax expense


1,406


1,207


2,244


1,207


Net income including noncontrolling interest


49,422


4,640


202,259


7,410


Net income attributable to Preferred Unit limited partners


708


115,203


Net Income attributable to common shareholders


48,714


4,640


87,056


7,410


Net income attributable to Common Unit limited partners


33,778


4,640


61,817


7,410


Net income attributable to Class A Common Shareholders


$

14,936


$


$

25,239


$


Net income attributable to Class A Common Shareholders, per

share


Basic


$

1.04


$


$

1.24


$


Diluted


$

1.04


$


$

1.24


$


Weighted average shares(2)


Basic


41,816


40,042


Diluted


41,855


40,075


(1)


The results of the legacy Altus business are not included in the Company’s consolidated financials prior to February 22, 2022. Refer to Note 10 – Equity and Warrants in the Notes to the Condensed Consolidated Financial Statements of the Company’s Form 10-Q filed on November 9, 2022 for further information.

(2)


Share amounts have been retroactively restated to reflect the Company’s two-for-one stock split, which was effected on June 8, 2022. Refer to Note 10 – Equity and Warrants in the Notes to the Condensed Consolidated Financial Statements of the Company’s Form 10-Q filed on November 9, 2022 for further information.

KINETIK HOLDINGS INC.

RECONCILIATION OF GAAP TO NON-GAAP MEASURES


Three Months Ended

September 30,(1)


Nine Months Ended

September 30,(1)


2022


2021


2022


2021


Net Income Including Noncontrolling Interests to Adjusted

EBITDA

(In thousands)

Net income including noncontrolling interests (GAAP)

$

49,422


$

4,640


$

202,259


$

7,410


Add back:


Interest expense


40,464


30,541


92,585


88,458


Income tax expense


1,406


1,207


2,244


1,207


Depreciation and amortization


65,005


57,154


192,609


170,291


Amortization of contract costs


448


448


1,344


1,815


Proportionate EBITDA from unconsolidated affiliates


78,357


21,704


190,438


59,677


Share-based compensation


12,661


30,966


Loss (gain) on sale of assets


3,946


(37

)


12,602


417


Loss (gain) on debt extinguishment


56


27,975


(4

)

Derivative loss due to Winter Storm Uri


13,456


Integration Costs


2,338


10,012


Acquisition transaction Costs


62


6,412


Other one-time cost or amortization


3,752


1,167


10,969


2,010


Producer Settlement


6,827


Deduct:


Interest and other income


74


115


Gain on redemption of mandatorily redeemable Preferred Units


9,580


Gain on embedded derivative


488


89,050


Equity income from unconsolidated affiliates


45,003


16,826


120,706


44,692


Adjusted EBITDA(2) (non-GAAP)

$

212,370


$

99,980


$

561,079


$

306,757


Distributable Cash Flow (3)


Adjusted EBITDA (non-GAAP)

$

212,370


$

99,980


$

561,079


$

306,757


Proportionate EBITDA from unconsolidated affiliates


(78,357

)


(21,704

)


(190,438

)


(59,677

)

Cash distributions received from unconsolidated affiliates


68,242


19,135


185,786


47,017


Interest expense


(40,464

)


(30,541

)


(92,585

)


(88,458

)

Maintenance capital expenditures


(4,053

)


(485

)


(7,492

)


(4,279

)

Distributions paid to preferred unit limited partners


(8,787

)


Distributable cash flow (non-GAAP)

$

157,738


$

66,385


$

447,563


$

201,360


Free Cash Flow (4)


Distributable cash flow (non-GAAP)

$

157,738


$

66,385


$

447,563


$

201,360


Cash interest adjustment


16,854


3,328


15,993


6,937


Growth capital expenditures


(89,812

)


(21,804

)


(166,318

)


(60,063

)

Investments in unconsolidated affiliates


(53,524

)


(56,199

)


(20,522

)

Contributions in aid of construction


2,752


2,496


14,344


5,987


Free cash flow (non-GAAP)

$

34,008


$

46,864


$

255,383


$

130,158


KINETIK HOLDINGS INC.

RECONCILIATION OF GAAP TO NON-GAAP MEASURES (Continued)


September 30, 2022


June 30, 2022


March 31, 2022


December 31, 2021


Net Debt(5)

(In thousands)

Current portion of long-term debt, net

$


$


$

54,324


$

54,280

Long-term debt, net


3,447,513


2,971,270


2,894,025


2,253,422

Plus: Deferred financing costs


27,487


28,730


35,400


38,485

Total long-term debt


3,475,000


3,000,000


2,983,749


2,346,187

Less: Cash and cash equivalents


11,728


5,319


17,646


18,729

Net debt (non-GAAP)

$

3,463,272


$

2,994,681


$

2,966,103


$

2,327,458

(1)


The results of the legacy Altus business are not included in the Company’s consolidated financials prior to February 22, 2022.


(2)


Adjusted EBITDA is defined as net income including noncontrolling interests adjusted for interest, taxes, depreciation and amortization, impairment charges, asset write-offs, the proportionate EBITDA from our equity method investments, equity in earnings from investments recorded using the equity method, stock-based compensation expense, extraordinary losses and unusual or non-recurring charges. Adjusted EBITDA provides a basis for comparison of our business operations between current, past and future periods by excluding items that we do not believe are indicative of our core operating performance. Adjusted EBITDA should not be considered as an alternative to the GAAP measure of net income including noncontrolling interests or any other measure of financial performance presented in accordance with GAAP.


(3)


Distributable Cash Flow is defined as Adjusted EBITDA, adjusted for the proportionate EBITDA from our equity method investments, cash distributions received from our equity method investments, interest expense, net of amounts capitalized, distributions to preferred unitholders and maintenance capital expenditures. Distributable Cash Flow should not be considered as an alternative to the GAAP measure of net income including noncontrolling interests or any other measure of financial performance presented in accordance with GAAP. We believe that Distributable Cash Flow is a useful measure to compare cash generation performance from period to period and to compare the cash generation performance for specific periods to the amount of cash dividends we make.


(4)


Free Cash Flow is defined as Distributable Cash Flow adjusted for growth capital expenditures, investments in unconsolidated affiliates, cash interest and contributions in aid of construction. Free Cash flow should not be considered as an alternative to the GAAP measure of net income including noncontrolling interests or any other measure of financial performance presented in accordance with GAAP. We believe that Free Cash Flow is a useful performance measure to compare cash generation performance from period to period and to compare the cash generation performance for specific periods to the amount of cash dividends that we make.


(5)


Net Debt is defined as total long-term debt, excluding deferred financing costs, less cash and cash equivalents. Net Debt illustrates our total debt position less cash on hand that could be utilized to pay down debt at the balance sheet date. Net Debt should not be considered as an alternative to the GAAP measure of total long-term debt, or any other measure of financial performance presented in accordance with GAAP.


Contacts

Kinetik Investors
Maddie Wagner, 713-487-4832

Website
www.kinetik.com


Read full story here
BARCELONA, Spain--(BUSINESS WIRE)--Wallbox (NYSE:WBX), a leading provider of electric vehicle (EV) charging and energy management solutions worldwide, today announced its financial results for the third quarter ended September 30, 2022, and provided a business update.


Third Quarter 2022 Highlights:
● Generated record revenues of €44.1 million, an increase of 140% compared to the third quarter of 2021, and achieved gross margins of 41.4%

● Delivered exceptional revenue growth of 535% in North America and received first orders of Hypernova, a 400kW DC fast charging station that is designed to satisfy current U.S. government subsidy requirements.

● Sold approximately 67,000 chargers, a 93% increase compared to the third quarter of 2021

● Began production at its first U.S. factory in Arlington, Texas

● Announced global strategic partnership with Fisker to provide charger and installation services to buyers of its upcoming vehicle lineup, and expanded Uber partnership into key European markets

Executive Commentary
Enric Asuncion, CEO of Wallbox, said, “Our team executed well again this quarter, meeting expectations in a market that has proven to be somewhat mixed. Revenue grew in the third quarter by 140% on a year-over-year basis, and we continued to exceed targets with gross margin of 41.4%. We’ve finalized several meaningful new partnerships, including Fisker, and expanding with Uber into Europe. We formally opened our first factory in the U.S., supporting our position as a leading U.S. manufacturer of EV charging solutions and qualifying us for recent government subsidies. And we showcased Hypernova, our new 400kW DC public charger, an innovative and reliable solution that we believe is a generation ahead of the competition. We’re navigating the challenges well, and are focused on what we can control, as seen by massive growth and meaningful market share gains in multiple geographies.”

Mr. Asuncion continued, “The automotive capacity constraints are delaying EV deliveries, which in-turn has a near-term effect on our European and home charging businesses. However, I’m encouraged by the improved revenue balance we see from both North America and our fast charging portfolio, offsetting much of that impact. I remain optimistic the industry will resolve these issues in the coming quarters and look forward to our new products contributing materially to our growth. Our portfolio has never been more complete, and we look forward to aggressively continuing our market share gains. While the economic outlook for many industries looks uncertain, we continue to see numerous opportunities to improve our competitive position and execute our strategy, all while aiming to double the size of the company each year.”

Financial Outlook - Fourth Quarter and Full Year 2022
The following reflects the company’s expectations for select key financial metrics for the fourth quarter and full year 2022.

● Expects fourth quarter 2022 revenue to be in the range of €42 million and €52 million, representing an approximate quarterly year-over-year growth rate of between 60% and 100%

● Expects gross margin of approximately 40%

Full year 2022
● Expects full-year 2022 revenue in the range of €154 million and €164 million, representing an approximate annual year-over-year growth rate of between 115% and 130%

Conference Call Information
Wallbox NV will host a conference call to discuss the results and provide a business update at 8:00 AM Eastern Time today, November 9, 2022. The live audio webcast and presentation, along with supplemental information, will be accessible on Wallbox’s Investor Relations website at https://investors.wallbox.com/overview/default.aspx. A recording of the webcast will also be available following the conference call.

Wallbox Forward Looking Statements
This press release contains forward-looking statements within the meaning of the Private Securities Litigation Reform Act of 1995. We intend such forward-looking statements to be covered by the safe harbor provisions for forward-looking statements contained in Section 27A of the Securities Act of 1933, as amended (the “Securities Act”) and Section 21E of the Securities Exchange Act of 1934, as amended (the “Exchange Act”). All statements contained in this press release other than statements of historical fact should be considered forward-looking statements, including, without limitation, statements regarding Wallbox’s future operating results and financial position, business strategy and plans, market growth and objectives for future operations. The words “anticipate,” “believe,” “can,” “continue,” “could,” “estimate,” “expect,” “forecast,” “intend,” “may,” “might,” “plan,” “possible,” “potential,” “predict,” “project,” “should,” “”target,” will,” “would” and similar expressions are intended to identify forward-looking statements, though not all forward-looking statements use these words or expressions. These statements are neither promises nor guarantees, but involve known and unknown risks, uncertainties and other important factors that may cause our actual results, performance or achievements to be materially different from any future results, performance or achievements expressed or implied by the forward-looking statements, including, but not limited to: Wallbox’s history of operating losses as an early stage company; the adoption and demand for electric vehicles including the success of alternative fuels, changes to rebates, tax credits and the impact of government incentives; Wallbox’s ability to successfully manage its growth; the accuracy of Wallbox’s forecasts and projections including those regarding its market opportunity; competition; risks related to health pandemics including those of COVID-19; losses or disruptions in Wallbox’s supply or manufacturing partners; impacts resulting from the conflict between Russia and Ukraine; risks related to macro-economic conditions and inflation; Wallbox’s reliance on the third-parties outside of its control; risks related to Wallbox’s technology, intellectual property and infrastructure; as well as the other important factors discussed under the caption “Risk Factors” in Wallbox’s Post-Effective Amendment No. 3 to Wallbox’s Registration Statement on Form F-1 (File No. 333-260652) filed on September 28, 2022, as such factors may be updated from time to time in its other filings with the Securities and Exchange Commission (the “SEC”), accessible on the SEC’s website at www.sec.gov and the Investors Relations section of Wallbox’s website at investors.wallbox.com. Any such forward-looking statements represent management’s estimates as of the date of this press release. Any forward-looking statement that Wallbox makes in this press release speaks only as of the date of such statement. Except as required by law, Wallbox disclaims any obligation to update or revise, or to publicly announce any update or revision to, any of the forward-looking statements, whether as a result of new information, future events or otherwise.

About Wallbox
Wallbox is a global technology company, dedicated to changing the way the world uses energy. Wallbox creates advanced electric vehicle charging and energy management systems that redefine users' relationship to the grid. Wallbox goes beyond electric vehicle charging to give users the power to control their consumption, save money, and live more sustainably. Wallbox offers a complete portfolio of charging and energy management solutions for residential, semi-public and public use in more than 113 countries around the world. Founded in 2015 and headquartered in Barcelona, the company now employs more than 1,200 people in its offices in Europe, Asia, and the Americas. For additional information, please visit www.wallbox.com.


Contacts

Wallbox Public Relations Contact:
Carme Orra
Public Relations
This email address is being protected from spambots. You need JavaScript enabled to view it.
+34 617.87.13.68

Wallbox Investor Contact:
Matt Tractenberg
VP, Investor Relations
This email address is being protected from spambots. You need JavaScript enabled to view it.
+1 404-574-1504

TORONTO--(BUSINESS WIRE)--$ELBM--Electra Battery Materials Corporation (NASDAQ: ELBM; TSX-V: ELBM) (“Electra” or the “Company”) today announced the filing of its financial results for the third quarter ended September 30, 2022, and provided an update on the commissioning of its cobalt refinery and launch of its black mass recycling demonstration plant. All amounts are in Canadian currency unless stated.


“Our performance in the third quarter was marked by considerable progress against our strategy and each of our primary objectives,” said Trent Mell, Electra’s CEO. “Most notably, we signed a definitive supply agreement with LG Energy Solution, the world’s second-largest EV battery manufacturer, completed more than 85% of the recommissioning of existing brownfield equipment at our battery materials refinery complex, confirmed cobalt mineralization at a second zone located in close proximity to our flagship deposit in the Idaho Cobalt Belt, and completed a scoping study on the production of nickel sulfate at our battery materials refinery complex that suggested compelling economics. This progress is considerable for a company of our size and is indicative of the level of commitment by our employees to sustain the first mover advantage Electra has established.”

Mr. Mell added, “The adoption of the U.S. Inflation Reduction Act provides strong incentives for the onshoring of the EV battery supply chain, which is already proving to be an important tailwind for our near-term prospects.

“In the coming weeks, we expect to launch our black mass recycling demonstration plant where we will apply our lab-tested hydrometallurgical process to separate up to 75 tonnes of high-value material contained in recycled lithium-ion batteries into discrete metals, including nickel, cobalt, copper, graphite and lithium, for resale and new cashflow opportunities. This demonstration plant will run in parallel with the ongoing commissioning of our cobalt sulfate refinery, the first of its kind in North America, which is expected to be completed in the spring of 2023.”

Mr. Mell concluded, “Over the longer term, we are encouraged by the opportunities to expand into nickel sulfate production at our refinery in Ontario giving the findings of our scoping study and expand into cobalt sulfate production in Bécancour, Quebec based on preliminary work completed to date.”

ELECTRA Q3 2022 HIGHLIGHTS AND DEVELOPMENTS

  • Held cash and marketable securities of $19.7 million as at September 30, 2022, down from $41.8 million as at June, 2022. Electra’s cash balance at the end of Q3 does not include the remaining $6.7 million of government investments expected to be received or $16.8 million of available funding from the Company’s At-the-Market (“ATM Program”) program.
  • Total incurred costs for the refinery construction project for the quarter were $18.8 million.
  • Net loss for the period was $7.6 million or $0.24 per basic share. These compare to a loss of $10.5 million or $0.37 per basic share for Q3 2021.
  • Signed a three-year agreement to supply 7,000 tonnes of battery grade cobalt to LG Energy Solution, a leading global manufacturer of lithium-ion batteries for electric vehicles, beginning in 2023.
  • Made progress towards the launch of a black mass recycling demonstration plant at the Company’s Ontario refinery complex. Under the parameters of the demonstration, which is expected to be launched in the coming weeks, Electra plans to process up to 75 tonnes of material in a batch mode and anticipates the recovery of high-value elements found in lithium-ion batteries, including nickel, cobalt, lithium, copper, and graphite.
  • Confirmed cobalt mineralization at its Ruby prospect, which is located 1.5 kilometres from Electra’s primary Iron Creek deposit, following receipt of assay results from the summer exploration program in the Idaho Cobalt Belt. Assay results and exploration work completed to date support the launch of a more extensive drill campaign to determine the full extent of Ruby’s mineralization.
  • Released highlights of a scoping study prepared by a global engineering firm that supports the creation of an integrated electric vehicle battery materials park in Ontario consisting of nickel, cobalt, manganese refining, recycling of battery black mass material, and precursor cathode active material (pCAM) manufacturing. The scoping study assessed the economics and carbon footprint of various nickel feed options to develop an integrated facility producing 10,000 tonnes per annum of battery grade nickel sulfate and pCAM components essential to the production of EV batteries.
  • Signed a benefits agreement with the Métis Nation of Ontario that will provide employment, training, procurement, and business opportunities related to the construction and expansion of Electra’s battery materials refinery north of Toronto.
  • Issued a total of 78,100 shares on the TSX Venture Exchange at an average price of $4.2438 per share and 100,800 shares on the Nasdaq Capital Markets at an average price of USD$3.3121 per share during Q3 2022 under its ATM Program launched in January 2022, providing gross proceeds of $330,950.68 and USD$333,861.63, respectively. Commissions of $8,273.75 and USD$8,346.56 were paid to CIBC World Markets Inc. and CIBC World Markets Corp., respectively, in relation to these distributions.

Highlights Subsequent to Quarter End

  • Successfully completed the recommissioning of material handling and lime delivery systems, two key circuits that will be part of Electra’s hydrometallurgical process to be used in the pending black mass demonstration plant.
  • Issued a request for a proposal for the purposes of identifying an engineering firm to complete a prefeasibility study on the development of cobalt sulfate refinery in Bécancour, Quebec. Selection of the engineering firm is expected before end of year with completion of the study expected in the second half of 2023.
  • Launched a marketed offering of units for total gross proceeds of up to US$5.5 million (~CAD$7.4 million) to be used to fund the commissioning of Electra’s cobalt sulfate refinery.

For complete details of the consolidated financial statements and the associated management’s discussion and analysis, please refer to the Company’s filing on SEDAR (www.sedar.com) or the Company’s website (www.ElectraBMC.com).

Electra will host a conference call on November 10, 2022 at 9:00 am ET to review its third quarter performance and discuss near-term outlook.

Dial-in and Webcast Details:

- North American dial-in number: 1-800-319-4610
- International dial-in number: 1-604-638-5340
- Webcast and slide presentation: https://ElectraBMC.com/category/events/

About Electra Battery Materials

Electra is a processor of low-carbon, ethically-sourced battery materials. Currently commissioning North America’s only cobalt sulfate refinery, Electra is executing a multipronged strategy focused on onshoring the electric vehicle supply chain. Keys to its strategy are integrating black mass recycling and nickel sulfate production at Electra’s refinery located north of Toronto, advancing Iron Creek, its cobalt-copper exploration-stage project in the Idaho Cobalt Belt, and expanding cobalt sulfate processing into Bécancour, Quebec. For more information visit www.ElectraBMC.com.

Neither the TSX Venture Exchange nor its Regulation Services Provider (as that term is defined in policies of the TSX Venture Exchange) accepts responsibility for the adequacy or accuracy of this release.

Cautionary Note Regarding Forward-Looking Statements

This news release may contain forward-looking statements and forward-looking information (together, “forward-looking statements”) within the meaning of applicable securities laws and the United States Private Securities Litigation Reform Act of 1995. All statements, other than statements of historical facts, are forward-looking statements. Generally, forward-looking statements can be identified by the use of terminology such as “plans”, “expects', “estimates”, “intends”, “anticipates”, “believes” or variations of such words, or statements that certain actions, events or results “may”, “could”, “would”, “might”, “occur” or “be achieved”. Forward-looking statements involve risks, uncertainties and other factors that could cause actual results, performance, and opportunities to differ materially from those implied by such forward-looking statements. Factors that could cause actual results to differ materially from these forward-looking statements are set forth in the management discussion and analysis and other disclosures of risk factors for Electra Battery Materials Corporation, filed on SEDAR at www.sedar.com. Although Electra Battery Materials Corporation believes that the information and assumptions used in preparing the forward-looking statements are reasonable, undue reliance should not be placed on these statements, which only apply as of the date of this news release, and no assurance can be given that such events will occur in the disclosed times frames or at all. Except where required by applicable law, Electra Battery Materials Corporation disclaims any intention or obligation to update or revise any forward-looking statement, whether as a result of new information, future events or otherwise.


Contacts

Joe Racanelli
Vice President, Investor Relations
This email address is being protected from spambots. You need JavaScript enabled to view it.
1.416.900.3891

  • Return $10 billion - $12 billion to shareholders by end of 2024
  • Increase share repurchase authorization by $5 billion
  • Improve Refining performance
  • Integrate DCP Midstream; anticipate greater than $1 billion of adjusted EBITDA accretion
  • Sustainable cost reductions of $1 billion through Business Transformation

HOUSTON--(BUSINESS WIRE)--$PSX--Phillips 66 (NYSE: PSX) will provide a plan to deliver higher shareholder distributions and increase shareholder value at its investor day meeting in New York today.


“We are announcing a number of priorities designed to reward shareholders,” said Mark Lashier, President and CEO of Phillips 66. “Thanks to our clear vision, core values and dedicated employees, we’ve enjoyed tremendous success since our inception 10 years ago. We will continue our track record of strong returns and growing distributions in a competitive and sustainable way. We have returned more than $30 billion to shareholders since the company’s formation in 2012, in large part from our uniquely integrated and diversified assets in Midstream, Chemicals, Refining and Marketing.”

Lashier said that the company plans to return an additional $10 billion to $12 billion to shareholders between mid-year 2022 and the end of 2024 through a combination of dividends and share repurchases. The company’s Board of Directors approved a $5 billion increase to its authorization to repurchase its common stock, which brings the total amount of share repurchases authorized by the Board since 2012 to an aggregate of $20 billion.

Phillips 66 is enhancing Refining performance by taking necessary actions to increase reliability, improve market capture and reduce costs.

Phillips 66 plans to increase adjusted EBITDA by $3 billion over the next three years. The company expects to achieve this growth through its proposed 87% interest in DCP Midstream, execution of Rodeo Renewed and other projects, as well as sustainable cost reductions from its Business Transformation.

These actions will enable the company to increase distributions to shareholders, Lashier said, adding that the company is committed to disciplined growth and financial flexibility to drive returns and reward shareholders, now and in the future.

Webcast of Investor Day Available

To access the webcast, go to the Events and Presentations section of the Phillips 66 Investors site, phillips66.com/investors. A replay will be archived on the Events and Presentations page the day after the event, and a transcript will be available at a later date.

CAUTIONARY STATEMENT FOR THE PURPOSES OF THE “SAFE HARBOR” PROVISIONS
OF THE PRIVATE SECURITIES LITIGATION REFORM ACT OF 1995

This news release contains projections of future results, savings and other forward-looking statements within the meaning of the federal securities laws. Words such as “anticipated,” “estimated,” “expected,” “planned,” “scheduled,” “targeted,” “believe,” “continue,” “intend,” “will,” “would,” “objective,” “goal,” “project,” “efforts,” “strategies” and similar expressions that convey the prospective nature of events or outcomes generally indicate forward-looking statements. However, the absence of these words does not mean that a statement is not forward-looking. Forward-looking statements included in this news release are based on management’s expectations, estimates and projections as of the date they are made. These statements are not guarantees of future performance and you should not unduly rely on them as they involve certain risks, uncertainties and assumptions that are difficult to predict. Therefore, actual outcomes and results may differ materially from what is expressed or forecast in such forward-looking statements. Factors that could cause actual results or events to differ materially from those described in the forward-looking statements include: the effects of any widespread public health crisis and its negative impact on commercial activity and demand for refined petroleum products; the inability to timely obtain or maintain permits necessary for capital projects; changes to worldwide government policies relating to renewable fuels and greenhouse gas emissions that adversely affect programs like the renewable fuel standards program, low carbon fuel standards and tax credits for biofuels; fluctuations in NGL, crude oil, and natural gas prices, and petrochemical and refining margins; our ability to consummate the proposed transaction to acquire all of the publicly held common units of DCP Midstream, LP (DCP Midstream) and the timing and cost associated therewith; our ability to achieve the expected benefits of the integration of DCP Midstream and from the proposed transaction, if consummated; the diversion of management’s time on transaction- and integration-related matters; the success of the company’s Business Transformation initiatives and the realization of savings from actions taken in connection therewith; unexpected changes in costs for constructing, modifying or operating our facilities; unexpected difficulties in manufacturing, refining or transporting our products; the level and success of drilling and production volumes around our Midstream assets; risks and uncertainties with respect to the actions of actual or potential competitive suppliers and transporters of refined petroleum products, renewable fuels or specialty products; lack of, or disruptions in, adequate and reliable transportation for our NGL, crude oil, natural gas, and refined products; potential liability from litigation or for remedial actions, including removal and reclamation obligations under environmental regulations; failure to complete construction of capital projects on time and within budget; the inability to comply with governmental regulations or make capital expenditures to maintain compliance; limited access to capital or significantly higher cost of capital related to illiquidity or uncertainty in the domestic or international financial markets, which may also impact our ability to repurchase shares and declare and pay dividends; potential disruption of our operations due to accidents, weather events, including as a result of climate change, acts of terrorism or cyberattacks; general domestic and international economic and political developments including armed hostilities (including the Russia-Ukraine war), expropriation of assets, and other political, economic or diplomatic developments; international monetary conditions and exchange controls; changes in governmental policies relating to NGL, crude oil, natural gas, refined petroleum products, or renewable fuels pricing, regulation or taxation, including exports; changes in estimates or projections used to assess fair value of intangible assets, goodwill and property and equipment and/or strategic decisions with respect to our asset portfolio that cause impairment charges; investments required, or reduced demand for products, as a result of environmental rules and regulations; changes in tax, environmental and other laws and regulations (including alternative energy mandates); political and societal concerns about climate change that could result in changes to our business or increase expenditures, including litigation-related expenses; the operation, financing and distribution decisions of equity affiliates we do not control; and other economic, business, competitive and/or regulatory factors affecting Phillips 66’s businesses generally as set forth in our filings with the Securities and Exchange Commission. Phillips 66 is under no obligation (and expressly disclaims any such obligation) to update or alter its forward-looking statements, whether as a result of new information, future events or otherwise.

Use of Non-GAAP Financial Information This news release includes the term “adjusted EBITDA” which is a non-GAAP financial measure that we define as net income plus net interest expense, income taxes, and depreciation and amortization. Adjusted EBITDA estimates depend on future levels of revenues and expenses which are not reasonably estimable at this time. Accordingly, we cannot provide a reconciliation between projected adjusted EBITDA to net income without unreasonable effort.

About Phillips 66

Phillips 66 (NYSE: PSX) manufactures, transports and markets products that drive the global economy. The diversified energy company’s portfolio includes Midstream, Chemicals, Refining, and Marketing and Specialties businesses. Headquartered in Houston, Phillips 66 has employees around the globe who are committed to safely and reliably providing energy and improving lives while pursuing a lower-carbon future. For more information, visit phillips66.com or follow @Phillips66Co on LinkedIn or Twitter.


Contacts

Jeff Dietert (investors)
832-765-2297
This email address is being protected from spambots. You need JavaScript enabled to view it.

Shannon Holy (investors)
832-765-2297
This email address is being protected from spambots. You need JavaScript enabled to view it.

Thaddeus Herrick (media)
855-841-2368
This email address is being protected from spambots. You need JavaScript enabled to view it.

SINGAPORE & SAN RAMON, Calif.--(BUSINESS WIRE)--Chevron Corporation (NYSE: CVX), through its Chevron New Energies International Pte. Ltd. (Chevron) subsidiary, and Mitsui O.S.K. Lines, Ltd. (MOL) today announced the signing of a Joint Study Agreement (JSA) on the feasibility of transporting liquified carbon dioxide (CO2) from Singapore to permanent storage locations offshore Australia.


Under the JSA, Chevron and MOL will explore the technical and commercial feasibility of initially transporting up to 2.5 million tonnes per annum (Mtpa) of liquified CO2 by 2030.

The JSA will complement work to be advanced by a recently announced consortium to explore solutions for large-scale carbon capture, transport and permanent storage of CO2 from Singapore. Through its part in three joint ventures, Chevron was also recently granted an interest in three greenhouse gas assessment permits offshore Australia.

“Developing safe and reliable CO2 transportation services is a crucial step in developing large scale Carbon Capture, Utilization, and Storage (CCUS) solutions. We are pleased to partner with MOL to explore commercially-ready solutions to focus on realizing this goal,” said Mark Ross, president of Chevron Shipping Company.

“We expect this agreement with MOL to advance the technical and commercial foundations for a regional approach to CCUS, which could provide progress toward the region’s net-zero ambitions. No single entity has all the solutions, but genuine collaboration can help us unlock opportunities as we advance our shared goal of a lower carbon future,” said Chris Powers, vice president, CCUS, Chevron New Energies.

“As a developer and a provider of social infrastructure service in addition to traditional shipping, MOL is honored and excited to have an opportunity to collaborate with Chevron for opening up CCUS solutions in the Asia Pacific region. We hope to expand our collaboration to wider areas of solutions for decarbonization including CCUS and renewable energies globally,” said Yasuchika Noma, Executive Officer of MOL.

About Chevron

Chevron (NYSE: CVX) is one of the world’s leading integrated energy companies. We believe affordable, reliable, and ever-cleaner energy is essential to achieving a more prosperous and sustainable world. Chevron produces crude oil and natural gas; manufactures transportation fuels, lubricants, petrochemicals and additives; and develops technologies that enhance our business and the industry. We are focused on lowering the carbon intensity in our operations and growing lower carbon businesses along with our traditional business lines. More information about Chevron is available at www.chevron.com.

About MOL

Mitsui O.S.K. Lines is a global leading shipping company operating about 800 ships across the world, headquartered in Japan. MOL develops various social infrastructure businesses centering on ocean shipping, technologies and services to meet ever-changing social needs including environmental protection. MOL fleet includes dry cargo ships, liquefied natural gas carriers, Ro-Ro car carrier ships, oil tankers, etc. In addition to the traditional shipping businesses, MOL offers social infrastructure businesses such as real estate, terminal and logistics, offshore wind power, and associated businesses. With one of the largest merchant fleets, 130-plus years of history, experience, and technology, MOL group aims to be a strong and resilient corporate group that provides new value to all stakeholders. For more information about Mitsui O.S.K. Lines, Ltd, please visit https://www.mol.co.jp/en/index.html.

CAUTIONARY STATEMENTS RELEVANT TO FORWARD-LOOKING INFORMATION FOR THE PURPOSE OF “SAFE HARBOR” PROVISIONS OF THE PRIVATE SECURITIES LITIGATION REFORM ACT OF 1995

This news release contains forward-looking statements relating to Chevron’s operations and energy transition plans that are based on management's current expectations, estimates and projections about the petroleum, chemicals and other energy-related industries. Words or phrases such as “anticipates,” “expects,” “intends,” “plans,” “targets,” “advances,” “commits,” “drives,” “aims,” “forecasts,” “projects,” “believes,” “approaches,” “seeks,” “schedules,” “estimates,” “positions,” “pursues,” “may,” “can,” “could,” “should,” “will,” “budgets,” “outlook,” “trends,” “guidance,” “focus,” “on track,” “goals,” “objectives,” “strategies,” “opportunities,” “poised,” “potential,” “ambitions,” “aspires” and similar expressions are intended to identify such forward-looking statements. These statements are not guarantees of future performance and are subject to certain risks, uncertainties and other factors, many of which are beyond the company’s control and are difficult to predict. Therefore, actual outcomes and results may differ materially from what is expressed or forecasted in such forward-looking statements. The reader should not place undue reliance on these forward-looking statements, which speak only as of the date of this news release. Unless legally required, Chevron undertakes no obligation to update publicly any forward-looking statements, whether as a result of new information, future events or otherwise.

Among the important factors that could cause actual results to differ materially from those in the forward-looking statements are: changing crude oil and natural gas prices and demand for the company’s products, and production curtailments due to market conditions; crude oil production quotas or other actions that might be imposed by the Organization of Petroleum Exporting Countries and other producing countries; technological advancements; changes to government policies in the countries in which the company operates; public health crises, such as pandemics (including coronavirus (COVID-19)) and epidemics, and any related government policies and actions; disruptions in the company’s global supply chain, including supply chain constraints and escalation of the cost of goods and services; changing economic, regulatory and political environments in the various countries in which the company operates; general domestic and international economic, market and political conditions, including the military conflict between Russia and Ukraine and the global response to such conflict; changing refining, marketing and chemicals margins; actions of competitors or regulators; timing of exploration expenses; timing of crude oil liftings; the competitiveness of alternate-energy sources or product substitutes; development of large carbon capture and offset markets; the results of operations and financial condition of the company’s suppliers, vendors, partners and equity affiliates, particularly during the COVID-19 pandemic; the inability or failure of the company’s joint-venture partners to fund their share of operations and development activities; the potential failure to achieve expected net production from existing and future crude oil and natural gas development projects; potential delays in the development, construction or start-up of planned projects; the potential disruption or interruption of the company’s operations due to war, accidents, political events, civil unrest, severe weather, cyber threats, terrorist acts, or other natural or human causes beyond the company’s control; the potential liability for remedial actions or assessments under existing or future environmental regulations and litigation; significant operational, investment or product changes undertaken or required by existing or future environmental statutes and regulations, including international agreements and national or regional legislation and regulatory measures to limit or reduce greenhouse gas emissions; the potential liability resulting from pending or future litigation; the company’s future acquisitions or dispositions of assets or shares or the delay or failure of such transactions to close based on required closing conditions; the potential for gains and losses from asset dispositions or impairments; government mandated sales, divestitures, recapitalizations, taxes and tax audits, tariffs, sanctions, changes in fiscal terms or restrictions on scope of company operations; foreign currency movements compared with the U.S. dollar; higher inflation and related impacts; material reductions in corporate liquidity and access to debt markets; the receipt of required Board authorizations to implement capital allocation strategies, including future stock repurchase programs and dividend payments; the effects of changed accounting rules under generally accepted accounting principles promulgated by rule-setting bodies; the company’s ability to identify and mitigate the risks and hazards inherent in operating in the global energy industry; and the factors set forth under the heading “Risk Factors” on pages 20 through 25 of the company’s 2021 Annual Report on Form 10-K and in subsequent filings with the U.S. Securities and Exchange Commission. Other unpredictable or unknown factors not discussed in this news release could also have material adverse effects on forward-looking statements.


Contacts

Chevron:
Cam Van Ast
This email address is being protected from spambots. You need JavaScript enabled to view it.

MOL:
Media Relations Team, Corporate Communication Division
TEL: +81-3-3587-7015
E-mail: This email address is being protected from spambots. You need JavaScript enabled to view it.

DURHAM, N.C. & LOS ANGELES--(BUSINESS WIRE)--AMP, a global leader in connected battery management and charging technologies for electric mobility, today announced the integration of Wolfspeed’s E-Series Silicon Carbide MOSFETs into AMP’s e-mobility Energy Management Unit. Using Wolfspeed’s innovative Silicon Carbide technology allows AMP to optimize battery performance, charging, and costs.


“At AMP, we understand the power that Silicon Carbide brings to vehicle electrification. We are proud to collaborate with another U.S.-based company on technologies that make a greener and smarter tomorrow,” said Jiaqi Liang, VP of hardware engineering at AMP. “The use of Wolfspeed’s Silicon Carbide in AMP’s Energy Management Unit (EMU) unlocks higher power density and efficiency, better platform scalability, and precise charging control. All are acutely observed by consumers through improvements in cabin space, charging time, and lower cost.”

AMP’s market-ready energy management solution integrates ultra-fast DC charging, DC-DC, and bi-directional on-board AC charging into a single platform, providing optimal charging experience, monitoring, care, and performance of batteries.

“AMP’s integration of our technology signals continued growth for Silicon Carbide in the automotive industry,” said Jay Cameron, SVP and general manager, Power at Wolfspeed. “The expansion of our automotive-qualified 650V and 1200V E-Series Silicon Carbide MOSFET portfolio allows AMP to easily deploy their products for either 400V or 800V systems.”

Wolfspeed’s E-Series MOSFETs are optimized for use in automotive applications, such as traction inverters, electric vehicle (EV) onboard battery charging, and high voltage DC-DC converters.

About Wolfspeed:

Wolfspeed (NYSE: WOLF) leads the market in the worldwide adoption of Silicon Carbide and GaN technologies. We provide industry-leading solutions for efficient energy consumption and a sustainable future. Wolfspeed’s product families include Silicon Carbide materials, power devices and RF devices targeted for various applications such as electric vehicles, fast charging, 5G, renewable energy and storage, and aerospace and defense. We unleash the power of possibilities through hard work, collaboration, and a passion for innovation. Learn more at www.wolfspeed.com.

Wolfspeed® is a registered trademark of Wolfspeed, Inc.

About AMP:

Headquartered in Los Angeles, with offices in Detroit, Bengaluru, London, Stuttgart and Shanghai, AMP is a global leader in energy management solutions for electric mobility applications. Since 2017, AMP has advanced charging and battery management technologies through industry-leading software, hardware and cloud intelligence.

To learn more, visit AMP at www.amp.tech and follow on LinkedIn @amp-energy-management.

Forward Looking Statements:

This press release contains forward-looking statements by Wolfspeed involving risks and uncertainties, both known and unknown, that may cause Wolfspeed’s actual results to differ materially from those indicated. Actual results may differ materially due to a number of factors, including the risk we may be unable to manufacture these new products with sufficiently low cost to offer them at competitive prices or with acceptable margins; the risk we may encounter delays or other difficulties in ramping up production of our new products; customer acceptance of our new products; the rapid development of new technology and competing products that may impair demand or render Wolfspeed’s products obsolete; and other factors discussed in Wolfspeed’s filings with the Securities and Exchange Commission, including its report on Form 10-K for the year ended June 26, 2022, and subsequent filings. For additional product and company information, please refer to www.wolfspeed.com.


Contacts

Wolfspeed Media Relations Contact:
Melinda Walker
Director, Corporate Communications
818-261-4585
This email address is being protected from spambots. You need JavaScript enabled to view it.

Wolfspeed Investor Relations Contact:
Tyler Gronbach
VP, Investor Relations
919-407-4820
This email address is being protected from spambots. You need JavaScript enabled to view it.

AMP Media Relations Contact:
Michael Rice
Chief Marketing Officer
310-994-9987
This email address is being protected from spambots. You need JavaScript enabled to view it.

AMP Investor Relations Contact:
Lionel Selwood
Chief Operating Officer
340-626-1655
This email address is being protected from spambots. You need JavaScript enabled to view it.

Industry leaders collaborate to better serve customers through unmatched global, multimodal network coverage and market-leading ETAs

AMSTERDAM--(BUSINESS WIRE)--Today, leading supply chain visibility company FourKites announced a partnership with Sony Network Communications Europe. The partnership will integrate data from Visilion — Sony’s real-time cargo and asset tracking solution — with FourKites’ real-time, end-to-end supply chain visibility platform. This collaboration will help enterprise customers solve their most complex use cases. Now, customers will be able to view FourKites’ real-time data for shipments in transit and in the yard, together with Visilion’s granular real-time data on cargo location and condition to provide best-in-class estimated times of arrival (ETAs) and enhanced end-customer experiences.


Faced with ongoing global supply chain disruptions — including port congestion, port and rail strikes, global conflicts and more — businesses need more meaningful insights to mitigate preventable delays and damage, and to keep goods moving to their final destinations. Real-time visibility and actionable analytics regarding the location, temperature and status of shipments is critical, particularly for those in the Consumer Packaged Goods, Food & Beverage and Pharmaceutical industries, who ship products that require specific in-transit conditions to maintain quality.

“Businesses today require more high-quality, real-time supply chain data,” said Nimesh Patel, vice president of global alliances and partnerships at FourKites. “The Visilion solution from Sony provides an extra layer of granular data about the contents of containers and status of sensitive and/or temperature-controlled shipments. Our partnership will ensure that this data becomes more accessible than ever to businesses around the world.”

Visilion, Sony’s real-time cargo and asset tracking solution, offers industry-leading shock, tilt and temperature detection capabilities, among others, to ensure that goods are handled properly and maintained at the right temperature and humidity during transit, thereby mitigating losses. This functionality, combined with FourKites’ market-leading Dynamic ETA® across all modes, provides shippers with complete visibility into potential disruptions and product loss for goods in transit. In addition, FourKites’ international tracking capabilities, together with Visilion sensor data, provide an added dimension of granular visibility into ocean containers that often move through complicated, multi-stop journeys.

“FourKites’ shared commitment to industry-leading innovation, product quality and industry collaboration made them the obvious partner for us,” said Erik Lund, Head of Tracking Division, Sony Network Communications Europe. “We look forward to working together to provide our mutual customers with integrated supply chain data to fuel better decision-making and, ultimately, more efficient supply chain operations — in Europe and around the world.”

Over the last year, FourKites has experienced record growth in the European, Middle Eastern and African (EMEA) markets, achieving 97% growth in shipments YoY as of October 2022. The number of customers tracking loads with FourKites in EMEA grew 40% in the same time period, while the number of carriers tracking shipments grew by 50% in the same period.

About FourKites

Leading supply chain visibility platform FourKites® extends visibility beyond transportation into yards, warehouses, stores and beyond. Tracking more than 3 million shipments daily across road, rail, ocean, air, parcel and last mile, and reaching over 210 countries and territories, FourKites combines real-time data and powerful machine learning to help companies digitise their end-to-end supply chains. More than 1,200 of the world’s most recognised brands — including 9 of the top-10 CPG and 18 of the top-20 food and beverage companies — trust FourKites to transform their business and create more agile, efficient and sustainable supply chains. To learn more, visit https://www.fourkites.com/.


Contacts

Scott Johnston
European PR Director for FourKites
+31 62 147 8442
This email address is being protected from spambots. You need JavaScript enabled to view it.

  • $387.3 million in sales, a 5.3 sequential and 33.8 percent year-over-year increase
  • Net income of $13.2 million versus $7.1 million compared to Q3 2021
  • GAAP diluted EPS of $0.67
  • Non-GAAP diluted EPS of $0.75
  • $34.3 million in earnings before interest, taxes, depreciation & amortization and other non-cash charges ("Adjusted EBITDA")
  • Closed the acquisition of Sullivan Environmental Technologies, Inc.

HOUSTON--(BUSINESS WIRE)--DXP Enterprises, Inc. (NASDAQ: DXPE) today announced financial results for the third quarter ended September 30, 2022. The following are results for the three and nine months ended September 30, 2022, compared to the three and nine months ended September 30, 2021 and sequentially for the three months ended June 30, 2022, where appropriate. A reconciliation of the non-GAAP financial measures can be found in the back of this press release.


Third Quarter 2022 financial highlights:

  • Sales increased 33.8 percent to $387.3 million, compared to $289.5 million for the third quarter of 2021 and 5.3 percent compared to the second quarter of 2022.
  • Earnings per diluted share for the third quarter were $0.67 based upon 19.7 million diluted shares, compared to earnings of $0.36 per share in the third quarter of September 30, 2021, based on 19.6 million diluted shares. Excluding one-time non-cash charges of $1.2 million, earnings per diluted share was $0.75, assuming a 25.1 percent tax rate.
  • Net income for the third quarter was $13.3 million, compared to $7.1 million for the corresponding prior-year period.
  • Adjusted earnings before interest, taxes, depreciation and amortization and other non-cash charges (Adjusted EBITDA) for the third quarter of 2022 was $34.3 million compared to $18.8 million for the third quarter of 2021.

David R. Little, Chairman and CEO remarked, “Thanks to solid execution by our employees, DXP posted strong record sales results for our third quarter of 2022. Our sales growth is being fueled by diversifying into new markets, selling innovative products in new and existing markets, and helping our customers with environmental projects. Our acquisition strategy is focused on stable essential markets that are environmentally friendly. Our results are improving with 33.8 percent year-over-year and 5.3 percent sequential sales growth and 9 percent Adjusted EBITDA margins. During the third quarter, we continued to have strong organic growth within Supply Chain Services, solid organic growth in Service Centers and a meaningful increase in Innovative Pumping Solutions. For the third quarter, sales were $260.1 million for Service Centers, $68.2 million for Supply Chain Services and $59.0 million for Innovative Pumping Solutions. Thank you to all our customers and congratulations to our DXPeople for our record results."

Kent Yee, CFO, remarked, “Our third quarter sales established a new high watermark for DXP. Our third quarter year-over-year and sequential financial results continue to reflect the growth we have been experiencing and reflect our financial goals to grow organically and through acquisition. We are diversifying our end markets and business model exposure. While we face uncertainties going into next year, we remain very confident in our team, our balanced business, a strong balance sheet, and our ability to continue building and strengthening DXP through key initiatives and acquisitions. We expect to deliver exceptional performance and growth in the years ahead. Total debt outstanding as of September 30, 2022 was $364.8 million. DXP's secured leverage ratio or net debt to EBITDA ratio was 2.86:1.0 with a covenant EBITDA of $121.8 million for the last twelve months ending September 30, 2022. We expect to finish 2022 with strong momentum.”

Non-GAAP Financial Measures

DXP supplements reporting of net income with non-GAAP measurements, including EBITDA, Adjusted EBITDA, free cash flow, non-GAAP net income and net debt. This supplemental information should not be considered in isolation or as a substitute for the unaudited GAAP measurements. Additional information regarding EBITDA, Adjusted EBITDA, free cash flow and non-GAAP net income referred to in this press release are included below under "Unaudited Reconciliation of Non-GAAP Financial Information".

The Company believes EBITDA provides additional information about: (i) operating performance, because it assists in comparing the operating performance of the business, as it removes the impact of non-cash depreciation and amortization expense as well as items not directly resulting from core operations such as interest expense and income taxes and (ii) the performance and the effectiveness of operational strategies. Additionally, EBITDA performance is a component of a measure of the Company’s financial covenants under its credit facility. Furthermore, some investors use EBITDA as a supplemental measure to evaluate the overall operating performance of companies in the industry. Management believes that some investors’ understanding of performance is enhanced by including this non-GAAP financial measure as a reasonable basis for comparing ongoing results of operations. By providing this non-GAAP financial measure, together with a reconciliation from net income, the Company believes it is enhancing investors’ understanding of the business and results of operations, as well as assisting investors in evaluating how well the Company is executing strategic initiatives. Free Cash Flow reconciles to the most directly comparable GAAP financial measure of cash flows from operations as provided below. We believe Free Cash Flow is an important liquidity metric because it measures, during a given period, the amount of cash generated that is available to fund acquisitions, make investments, repay debt obligations, repurchase company shares, and for certain other activities.

About DXP Enterprises, Inc.

DXP Enterprises, Inc. is a leading products and service distributor that adds value and total cost savings solutions to industrial customers throughout the United States, Canada and Dubai. DXP provides innovative pumping solutions, supply chain services and maintenance, repair, operating and production ("MROP") services that emphasize and utilize DXP’s vast product knowledge and technical expertise in rotating equipment, bearings, power transmission, metal working, industrial supplies and safety products and services. DXP's breadth of MROP products and service solutions allows DXP to be flexible and customer-driven, creating competitive advantages for our customers. DXP’s business segments include Service Centers, Innovative Pumping Solutions and Supply Chain Services. For more information, go to www.dxpe.com.

The Private Securities Litigation Reform Act of 1995 provides a “safe-harbor” for forward-looking statements. Certain information included in this press release (as well as information included in oral statements or other written statements made by or to be made by the Company) contains statements that are forward-looking. These forward-looking statements include without limitation those about the Company’s expectations regarding the impact of the COVID-19 pandemic and the impact of low commodity prices of oil and gas; the Company's expectations regarding the filing of the Form 10-Q; the description of the anticipated changes in the Company's consolidated balance sheet and the results of operations and the Company's assessment of the impact of such anticipated changes; the Company’s business, the Company’s future profitability, cash flow, liquidity, and growth. Such forward-looking information involves important risks and uncertainties that could significantly affect anticipated results in the future; and accordingly, such results may differ from those expressed in any forward-looking statement made by or on behalf of the Company. These risks and uncertainties include, but are not limited to; decreases in oil and natural gas prices; decreases in oil and natural gas industry expenditure levels, which may result from decreased oil and natural gas prices or other factors; inability of the Company or its independent auditors to complete the work necessary in order to file the Form 10-Q, in the expected time frame; unanticipated changes to the Company's operating results in the Form 10-Q as filed or in relation to prior periods, including as compared to the anticipated changes stated here; unanticipated impact of such changes and its materiality; ability to obtain needed capital, dependence on existing management, leverage and debt service, domestic or global economic conditions, economic risks related to the impact of COVID-19, ability to manage changes and the continued health or availability of management personnel and changes in customer preferences and attitudes. In some cases, you can identify forward-looking statements by terminology such as, but not limited to, “may,” “will,” “should,” “intend,” “expect,” “plan,” “anticipate,” “believe,” “estimate,” “predict,” “potential,” “goal,” or “continue” or the negative of such terms or other comparable terminology. For more information, review the Company’s filings with the Securities and Exchange Commission. More information on these risks and other potential factors that could affect the Company’s business and financial results is included in the Company’s filings with the SEC, including in the “Risk Factors” and “Management’s Discussion and Analysis of Financial Condition and Results of Operations” sections of the Company’s most recently filed periodic reports on Form 10-K and Form 10-Q and subsequent filings. The Company assumes no obligation to update any forward-looking statements or information, which speak as of their respective dates.

DXP ENTERPRISES, INC. AND SUBSIDIARIES

UNAUDITED CONDENSED CONSOLIDATED STATEMENTS OF OPERATIONS

($ thousands, except for share and per share amounts)


Three Months Ended
September 30,


Nine Months Ended
September 30,


2022


2021


2022


2021


Sales


$

387,314


$

289,494


$

1,074,537


$

820,772


Cost of sales


275,681


202,551


763,758


576,921


Gross profit


111,633


86,943


310,779


243,851


Selling, general and administrative expenses


85,094


75,758


236,761


211,587


Operating income


26,539


11,185


74,018


32,264


Other (income) loss


1,566


(450

)


2,942


(985

)

Interest expense


6,833


5,264


17,610


15,844


Income before income taxes


18,140


6,371


53,466


17,405


Provision for income taxes


5,097


(565

)


13,402


2,380


Net income


13,043


6,936


40,064


15,025


Net income (loss) attributable to NCI*


(212

)


(189

)


(265

)


(590

)

Net income attributable to DXP Enterprises, Inc.


13,255


7,125


40,329


15,615


Preferred stock dividend


22


23


67


68


Net income attributable to common shareholders


$

13,233


$

7,102


$

40,262


$

15,547


Diluted earnings per share attributable to DXP Enterprises, Inc.


$

0.67


$

0.36


$

2.06


$

0.78


Weighted average common shares and common equivalent shares outstanding


19,660


19,550


19,552


19,900


*NCI represents non-controlling interest


Business segment financial highlights:

  • Service Centers’ revenue for the third quarter was $260.1 million, a 3.6 percent sequential increase and an increase of 22.4 percent year-over-year with a 13.7 percent operating income margin.
  • Innovative Pumping Solutions’ revenue for the third quarter was $59.0 million, a sequential increase of 2.2 percent and an increase of 62.0 percent year-over-year with a 12.4 percent operating income margin.
  • Supply Chain Services’ revenue for the third quarter was $68.2 million, a 15.7 percent sequential increase and an increase of 68.3 percent year-over-year with a 7.8 percent operating income margin.
 

SEGMENT DATA

($ thousands, unaudited)


Three Months Ended
September 30,


Nine Months Ended
September 30,

Sales

2022


2021


2022


2021

Service Centers

$

260,083


$

212,539


$

729,977


$

608,542

Innovative Pumping Solutions


59,044


36,440


169,890


96,411

Supply Chain Services


68,187


40,515


174,670


115,819

Total DXP Sales

$

387,314


$

289,494


$

1,074,537


$

820,772


Three Months Ended
September 30,


Nine Months Ended
September 30,

Operating Income


2022


2021


2022


2021

Service Centers

$

35,718


$

29,381


$

95,437


$

77,819

Innovative Pumping Solutions


7,327


277


23,122


6,027

Supply Chain Services


5,332


3,181


14,311


8,991

Total segments operating income

$

48,377


$

32,839


$

132,870


$

92,837


Reconciliation of Operating Income for Reportable Segments

($ thousands, unaudited)


Three Months Ended
September 30,


Nine Months Ended
September 30,


2022


2021


2022


2021

Operating income for reportable segments

$

48,377


$

32,839


$

132,870


$

92,837


Adjustment for:


Amortization of intangibles


5,132


4,238


13,958


12,690


Corporate expenses


16,706


17,416


44,894


47,883


Total operating income

$

26,539


$

11,185


$

74,018


$

32,264


Interest expense


6,833


5,264


17,610


15,844


Other (income) loss


1,566


(450

)


2,942


(985

)

Income before income taxes

$

18,140


$

6,371


$

53,466


$

17,405


Unaudited Reconciliation of Non-GAAP Financial Information

($ thousands)


The following table is a reconciliation of EBITDA and Adjusted EBITDA, non-GAAP financial measures, to income before taxes, calculated and reported in accordance with U.S. GAAP.


Three Months Ended
September 30,


Nine Months Ended
September 30,


2022


2021


2022


2021

Income before income taxes

$

18,140


$

6,371


$

53,466


$

17,405

Plus: interest expense


6,833


5,264


17,610


15,844

Plus: depreciation and amortization


7,493


6,486


21,325


20,070

EBITDA

$

32,466


$

18,121


$

92,401


$

53,319


Plus: NCI income (loss) before tax*

$

159


$

190


$

433


$

787

Plus: One-time non-cash loss


1,193


1,193


Plus: stock compensation expense


505


514


1,368


1,354

Adjusted EBITDA

$

34,323


$

18,825


$

95,395


$

55,460

* NCI represents non-controlling interest


DXP ENTERPRISES, INC. AND SUBSIDIARIES

UNAUDITED CONDENSED CONSOLIDATED BALANCE SHEETS

($ thousands)


September 30, 2022


December 31, 2021

ASSETS


Current assets:


Cash


$

16,972


$

48,989

Restricted cash


91


91

Accounts receivable, net of allowances for doubtful accounts


283,522


218,137

Inventories


131,290


100,894

Costs and estimated profits in excess of billings


30,122


17,193

Prepaid expenses and other current assets


11,652


9,522

Income taxes receivable


652


9,748

Total current assets


$

474,301


$

404,574

Property and equipment, net


46,657


51,880

Goodwill


332,988


296,541

Other intangible assets, net of accumulated amortization


84,516


79,205

Operating lease right-of-use assets


54,054


57,221

Other long-term assets


3,559


4,806

Total assets


$

996,075


$

894,227


LIABILITIES AND EQUITY


Current liabilities:


Current maturities of debt


$

43,906


$

3,300

Trade accounts payable


97,948


77,842

Accrued wages and benefits


27,455


23,006

Customer advances


25,496


12,924

Billings in excess of costs and estimated profits


4,265


3,581

Federal income taxes payable


587


0

Current-portion operating lease liabilities


17,526


18,203

Other current liabilities


28,679


42,206

Total current liabilities


$

245,862


$

181,062

Long-term debt, less unamortized debt issuance costs


313,739


315,397

Long-term operating lease liabilities


37,279


39,922

Other long-term liabilities


4,637


3,603

Deferred income taxes


8,947


7,516

Total long-term liabilities


$

364,602


$

366,438

Total Liabilities


$

610,464


$

547,500

Equity:


Total DXP Enterprises, Inc. equity


385,823


346,674

Non-controlling interest


(212

)


53

Total Equity


$

385,611


$

346,727

Total liabilities and equity


$

996,075


$

894,227

Unaudited Reconciliation of Non-GAAP Financial Information

($ thousands)


The following table is a reconciliation of free cash flow, a non-GAAP financial measure, to cash flow from operating activities, calculated and reported in accordance with U.S. GAAP.


Three Months Ended
September 30,


Nine Months Ended
September 30,


2022


2021


2022


2021


Net cash from operating activities


$

(3,432

)


$

6,625


$

2,256


$

22,831


Less: purchases of property and equipment


(1,578

)


(1,458

)


(3,426

)


(2,984

)

Plus: proceeds from sales of property & equipment


1,297


Free cash flow


$

(5,010

)


$

5,167


$

(1,170

)


$

21,144


Note: Supplemental non-cash items include share repurchases which have been excluded.


The following table is a reconciliation of adjusted net income, a non-GAAP financial measure, to net income, calculated and reported in accordance with U.S. GAAP.


Three Months Ended
September 30,


Nine Months Ended
September 30,


2022


2021


2022


2021


GAAP Net Income:

$

13,233


$

7,102


$

40,262


$

15,547

One-time non-cash loss


1,193


1,193


Adjustment for taxes*


299


299


Non-GAAP net income

$

14,725


$

7,102


$

41,754


$

15,547


Diluted earnings per share:


GAAP

$

0.67


$

0.36


$

2.06


$

0.78

Non-GAAP

$

0.75


$

0.36


$

2.14


$

0.78


* Adjustment for taxes relates to the tax effects of the adjustments that we incorporate into non-GAAP measures in order to provide a more meaningful measure on non-GAAP net income. For tax purposes the year-to-date effective tax rate of 25.1 percent was applied to the one-time non-cash loss for conservative purposes.


Contacts

Kent Yee
Senior Vice President, CFO
Phone: (713) 996-4700
www.dxpe.com

DUBLIN--(BUSINESS WIRE)--The "Global Naval Combat Systems Market 2022-2026" report has been added to ResearchAndMarkets.com's offering.


The naval combat systems market is poised to grow by $9.53 bn during 2022-2026, accelerating at a CAGR of 3.79% during the forecast period. The report on the naval combat systems market provides a holistic analysis, market size and forecast, trends, growth drivers, and challenges, as well as vendor analysis covering around 25 vendors.

The report offers an up-to-date analysis of the current global market scenario, the latest trends and drivers, and the overall market environment. The market is driven by a greater focus on ISR operations, increasing demand for unmanned underwater vehicles, and smart weapons gaining traction among armed forces.

The naval combat systems market analysis includes product segment and geographic landscape.

The naval combat systems market is segmented as below:

By Product

  • Weapon systems
  • C4ISR systems
  • Electronic warfare systems

By Geographical Landscape

  • North America
  • APAC
  • Europe
  • Middle East and Africa
  • South America

This study identifies the open architecture combat management systems as one of the prime reasons driving the naval combat systems market growth during the next few years. Also, the integration of naval combat systems into unmanned aerial vehicles and the adoption of an innovative approach to naval procurement will lead to sizable demand in the market.

The report on the naval combat systems market covers the following areas:

  • Naval combat systems market sizing
  • Naval combat systems market forecast
  • Naval combat systems market industry analysis

Key Topics Covered:

1 Executive Summary

2 Market Landscape

3 Market Sizing

4 Five Forces Analysis

5 Market Segmentation by Product

6 Customer Landscape

7 Geographic Landscape

8 Drivers, Challenges, and Trends

9 Vendor Landscape

10 Vendor Analysis

11 Appendix

Companies Mentioned

  • ASELSAN AS
  • ATLAS ELEKTRONIK GmbH
  • BAE Systems Plc
  • Elbit Systems Ltd.
  • General Dynamics Mission Systems Inc.
  • HAVELSAN AS
  • L3Harris Technologies Inc.
  • Leonardo Spa
  • Lockheed Martin Corp.
  • Naval Group
  • Northrop Grumman Corp.
  • QinetiQ Group Plc
  • Raytheon Technologies Corp.
  • Saab AB
  • Safran SA
  • Terma AS
  • Thales Group
  • Ultra Electronics Holdings Plc

For more information about this report visit https://www.researchandmarkets.com/r/n70w3


Contacts

ResearchAndMarkets.com
Laura Wood, Senior Press Manager
This email address is being protected from spambots. You need JavaScript enabled to view it.

For E.S.T Office Hours Call 1-917-300-0470
For U.S./ CAN Toll Free Call 1-800-526-8630
For GMT Office Hours Call +353-1-416-8900

Live Virtual Presentation on Thursday, November 10 at 1:00 P.M. ET

LOS ANGELES--(BUSINESS WIRE)--$CGRN #Biogas--Capstone Green Energy Corporation (NASDAQ: CGRN), a global leader in carbon reduction and on-site resilient green Energy as a Service (EaaS) solutions, will be presenting virtually at the upcoming Sidoti November Micro Cap Virtual Investor Conference on Thursday, November 10, 2022, at 1:00 P.M. ET (10:00 A.M. PT). Darren Jamison, Capstone Green Energy’s President and Chief Executive Officer, will be presenting to a live virtual audience and answering questions from investors.


Presentation Details

One-on-One Meetings

Darren Jamison, Capstone’s President and Chief Executive Officer, and Scott Robinson, Capstone Green Energy Interim Chief Financial Officer, will be conducting one-on-one virtual meetings with qualified professional investors throughout the day of the conference on November 10, 2022. To register and schedule a time with management, please follow this link: Sidoti November Micro Cap Virtual Investor Conference Registration.

Supporting presentation materials will be available on the conference day by visiting the Investor Relations section of the company’s website at www.capstonegreenenergy.com.

About Sidoti & Company

For more than two decades, Sidoti & Company (http://www.sidoti.com) has been a premier provider of independent securities research focused specifically on small and microcap companies and the institutions that invest in their securities. The firm serves nearly 500 institutional clients in the U.S., Canada, and the U.K., including many leading portfolio managers with $200 million to $2 billion of assets.

About Capstone Green Energy

Capstone Green Energy (www.CapstoneGreenEnergy.com) (NASDAQ: CGRN) is a leading provider of customized microgrid solutions and on-site energy technology systems focused on helping customers around the globe meet their environmental, energy savings and resiliency goals. Capstone Green Energy focuses on four key business lines. Through its Energy as a Service (EaaS) business, it offers rental solutions utilizing its microturbine energy systems and battery storage systems, comprehensive Factory Protection Plan (FPP) service contracts that guarantee life-cycle costs, as well as aftermarket parts. Energy Generation Technologies (EGT) is driven by the Company's industry-leading, highly efficient, low-emission, resilient microturbine energy systems offering scalable solutions in addition to a broad range of customer-tailored solutions, including hybrid energy systems and larger frame industrial turbines. The Energy Storage Solutions (ESS) business line designs and installs microgrid storage systems creating customized solutions using a combination of battery technologies and monitoring software. Through Hydrogen & Sustainable Products (H2S), Capstone Green Energy offers customers a variety of hydrogen products, including the Company's microturbine energy systems.

To date, Capstone has shipped over 10,000 units to 83 countries and estimates that in FY22, it saved customers over $213 million in annual energy costs and approximately 388,000 tons of carbon. Total savings over the last four years are estimated to be approximately $911 million in energy savings and approximately 1,503,100 tons of carbon savings.

For more information about the Company, please visit: www.CapstoneGreenEnergy.com. Follow Capstone Green Energy on Twitter, LinkedIn, Instagram, Facebook, and YouTube.

Cautionary Note Regarding Forward-Looking Statements

This release contains forward-looking statements as defined in the Private Securities Litigation Reform Act of 1995, including statements regarding expectations for green initiatives and execution on the Company's growth strategy and other statements regarding the Company's expectations, beliefs, plans, intentions, and strategies. The Company has tried to identify these forward-looking statements by using words such as "expect," "anticipate," "believe," "could," "should," "estimate," "intend," "may," "will," "plan," "goal" and similar terms and phrases, but such words, terms and phrases are not the exclusive means of identifying such statements. Actual results, performance and achievements could differ materially from those expressed in, or implied by, these forward-looking statements due to a variety of risks, uncertainties and other factors, including, but not limited to, the following: the ongoing effects of the COVID-19 pandemic; the availability of credit and compliance with the agreements governing the Company's indebtedness; the Company's ability to develop new products and enhance existing products; product quality issues, including the adequacy of reserves therefor and warranty cost exposure; intense competition; financial performance of the oil and natural gas industry and other general business, industry and economic conditions; the Company's ability to adequately protect its intellectual property rights; and the impact of pending or threatened litigation. For a detailed discussion of factors that could affect the Company's future operating results, please see the Company's filings with the Securities and Exchange Commission, including the disclosures under "Risk Factors" in those filings. Except as expressly required by the federal securities laws, the Company undertakes no obligation to update or revise any forward-looking statements, whether as a result of new information, changed circumstances or future events or for any other reason.


Contacts

Capstone Green Energy
Investor and investment media inquiries:
818-407-3628
This email address is being protected from spambots. You need JavaScript enabled to view it.

Company Issues Shareholder Letter

LONDON & NEW YORK--(BUSINESS WIRE)--Vertical Aerospace Ltd. (“Vertical” or the "Company") (NYSE: EVTL; EVTLW), a global aerospace and technology company that is pioneering zero emission aviation, announces its financial results for the third quarter ended September 30, 2022. The Company has also issued a shareholder letter discussing its operating results and management commentary, which is posted to its investor relations website at investor.vertical-aerospace.com.


Stephen Fitzpatrick, Vertical Founder and CEO, said: “We recently celebrated ‘wheels up’ with our VX4 aircraft a few weeks ago which was an incredibly proud moment for the whole team. As we ramp up our flight test programme, with a close eye on capital spend, we are moving onwards and upwards. I look forward to sharing more news about our flight test programme in the coming months.”

Third Quarter 2022 and Recent Operational Highlights

  • On September 22, 2022, the UK’s Civil Aviation Authority (CAA) issued a Permit to Fly for the VX4, and on September 24, 2022, the full-scale VX4 Prototype successfully lifted from the ground under tethered conditions with pilot Justin ‘Jif’ Paines on board.
  • To date, under its CAA Permit to Fly, Vertical has undertaken 14 piloted flight tests and 5.5 hours of continuous propeller turning test operations.
  • Vertical welcomed Amy Round as Chief People Officer, who joined on October 17, 2022, from OVO Energy where she was Director of Talent, having previously spent nine years at Google running its EMEA people division.
  • We have continued to progress our joint working group with American Airlines. A joint Vertical and American team has been regularly engaging during the third quarter, collaborating on a framework for exploration of the future of advanced air mobility and potential markets for eVTOL operations in the United States. As a result of this workstream, and the increased depth of our joint operational planning, we have agreed with American to extend the timeline for entering into a master purchase agreement that will contain the final terms for the purchase of our aircraft for up to one year from the date of this release, to ensure it reflects the final corporate framework and outputs of the detailed operational planning.

Third Quarter 2022 Financial Highlights

  • Vertical reported a net operating loss of £19m for the three months ended September 30, 2022, compared to a net operating loss of £8m for the three months ended September 30, 2021.
  • As of September 30, 2022, Vertical had cash at bank and short-term deposits totalling £145m, which will be invested in the development of the company’s test and certification activities and in the people, systems and processes that support the company.
  • In August 2022, to support ongoing capital requirements, Vertical established an equity subscription line with Nomura, which will allow Vertical to issue up to $100 million in new ordinary shares. This facility is intended to provide flexibility around the timing of issuing new stock to minimise dilution.
  • As of September 30, 2022, Vertical had issued 1,103,863 ordinary shares using the equity subscription line for an aggregate gross purchase price of $8.9m, and up to $91.1m in aggregate gross purchase price of ordinary shares remained available for sale under the equity subscription line.

Financial Outlook

  • The 2022 capital plan continues to remain on track, with net cash outflows to be used in operating activities in the fourth quarter of the year expected to be between £20m and £25m.

The above forward-looking statements reflect our expectations for the three months ending December 31, 2022 as of November 9, 2022, and are subject to substantial uncertainty. Our results are based on assumptions that we believe to be reasonable as of this date, but may be materially affected by many factors, as discussed below in “Forward-Looking Statements.”

About Vertical Aerospace

Vertical Aerospace is pioneering electric aviation. The company was founded in 2016 by Stephen Fitzpatrick, an established entrepreneur best known as the founder of the OVO Group, a leading energy and technology group and Europe’s largest independent energy retailer. Over the past six years, Vertical has focused on building the most experienced and senior team in the eVTOL industry, who have over 1,700 combined years of engineering experience, and have certified and supported over 30 different civil and military aircraft and propulsion systems. Vertical has forged strong relationships with industry-leading players to develop the various components of its aircraft and build a sophisticated eVTOL ecosystem, creating efficiencies across the manufacturing processes, aircraft operations and maintenance.

Vertical’s ordinary shares and warrants commenced trading on the NYSE in December 2021 under the tickers “EVTL” and “EVTLW,” respectively.

About the VX4 eVTOL Aircraft

The piloted zero operating emissions four-passenger VX4, is projected to be capable of travelling distances over 100 miles, achieving top speeds of up to 200mph, while producing minimal noise and has a low cost per passenger mile. The VX4 is expected to open up advanced air mobility to a whole new range of passengers and transform how we travel. Find out more: vertical-aerospace.com

Forward-Looking Statements

This press release contains forward-looking statements within the meaning of the Private Securities Litigation Reform Act of 1995. Any express or implied statements contained in this press release that are not statements of historical fact may be deemed to be forward-looking statements, including, without limitation, statements regarding the certification and the commercialization of the VX4 and related timelines, including with respect to the US market and expectations surrounding pre-orders and commitments, Vertical’s differential strategy compared to its peer group, the features and capabilities of the VX4, the transition towards a net-zero emissions economy, the sufficiency of Vertical’s cash and cash equivalents to fund operations, the plans and objectives of management for future operations and capital expenditures, expected financial performance and operational performance for the quarter and fiscal year ending December 31, 2022, as well as statements that include the words “expect,” “intend,” “plan,” “believe,” “project,” “forecast,” “estimate,” “may,” “should,” “anticipate,” “will,” “aim,” “potential,” “continue,” “are likely to” and similar statements of a future or forward-looking nature. Forward-looking statements are neither promises nor guarantees, but involve known and unknown risks and uncertainties that could cause actual results to differ materially from those projected, including, without limitation: Vertical’s limited operating history without manufactured non-prototype aircraft or completed eVTOL aircraft customer order; Vertical’s history of losses and the expectation to incur significant expenses and continuing losses for the foreseeable future; the market for eVTOL aircraft being in a relatively early stage; the potential inability of Vertical to produce or launch aircraft in the volumes and on timelines projected; the potential inability of Vertical to obtain the necessary certifications on the timelines projected; any accidents or incidents involving eVTOL aircraft could harm Vertical’s business; Vertical’s dependence on partners and suppliers for the components in its aircraft and for operational needs; the potential that certain of Vertical’s strategic partnerships may not materialize into long-term partnership arrangements; all of the pre-orders Vertical has received for its aircraft are not legally binding, conditional and may be terminated without penalty at any time by either party, and if these orders are cancelled, modified, delayed or not placed in accordance with the terms agreed with each party, Vertical’s business, results of operations, liquidity and cash flow will be materially adversely affected; any potential failure by Vertical to effectively manage its growth; the impact of COVID-19 on Vertical’s business; Vertical has identified material weaknesses in its internal controls over financial reporting and may be unable to remediate the material weaknesses; Vertical's dependence on our senior management team and other highly skilled personnel; as a foreign private issuer Vertical follows certain home country corporate governance rules, is not subject to U.S. proxy rules and is subject to Exchange Act reporting obligations that, to some extent, are more lenient and less frequent than those of a U.S. domestic public company; and the other important factors discussed under the caption “Risk Factors” in our Annual Report on Form 20-F filed with the U.S. Securities and Exchange Commission (“SEC”) on April 29, 2022, as such factors may be updated from time to time in Vertical’s other filings with the SEC. Any forward-looking statements contained in this press release speak only as of the date hereof and accordingly undue reliance should not be placed on such statements. Vertical disclaims any obligation or undertaking to update or revise any forward-looking statements contained in this press release, whether as a result of new information, future events or otherwise, other than to the extent required by applicable law.

Unaudited Condensed Consolidated Interim Statements of Operations and Comprehensive Loss

(in pounds thousands, except share and per share data)


3 months ended September 30,

9 months ended September 30,


2022

2021

2022

2021

Revenue

-

66

-

132

Cost of sales

-

(40)

-

(65)

Gross profit

-

26

-

67

Research and development expenses

(9,747)

(5,120)

(29,143)

(11,627)

Administrative expenses

(9,783)

(5,247)

(33,249)

(30,377)

Related party administrative expenses

(15)

12

(15)

(115)

Other operating income

916

1,920

4,323

11,606

Operating loss

(18,629)

(8,409)

(58,084)

(30,446)

Finance income

238

14

238

14

Finance costs

(99,504)

(109)

(77,070)

(146)

Related party finance costs

-

-

-

(483)

Net finance income/(costs)

(99,266)

(95)

(76,832)

(615)

Loss before tax

(117,895)

(8,504)

(134,916)

(31,061)

Income tax expense

-

-

-

-

Net loss for the period

(117,895)

(8,504)

(134,916)

(31,061)

Foreign exchange translation differences

8,947

-

18,429

-

Total comprehensive loss for the period

(108,948)

(8,504)

(116,487)

(31,061)


Basic and diluted loss per share

£(0.66)

£(0.07)

£(0.76)

£(0.26)

Number of shares

178,427,999

129,727,235

178,376,519

120,003,967


Unaudited Condensed Consolidated Interim Statements of Financial Position

(in pounds thousands)


September 30,
2022

December 31,
2021

Non-current assets


Property, plant and equipment


1,712

1,834

Right of use assets


2,007

1,969

Intangible assets


3,776

4,208


7,495

8,011

Current assets


Trade and other receivables


18,397

12,658

Short term deposits


61,076

-

Cash at bank


83,686

212,660


163,159

225,318

Total assets


170,654

233,329


Equity


Share capital


16

16

Other reserve


90,047

63,314

Share premium


256,837

248,354

Accumulated deficit


(384,980)

(250,123)

Total equity


(38,080)

61,561


Non-current liabilities


Long term lease liabilities


1,588

1,580

Provisions


99

95

Derivative financial liabilities


179,459

112,799

Trade and other payables


7,210

5,975


188,356

120,449

Current liabilities


Short term lease liabilities


430

362

Warrant liabilities


12,764

10,730

Trade and other payables


7,184

40,227


20,378

51,319

Total liabilities


208,734

171,768

Total equity and liabilities


170,654

233,329


Unaudited Condensed Consolidated Interim Statements of Cash Flows

(in pounds thousands)


9 months ended September 30,


2022

2021

Cash flows from operating activities

Net loss for the period


(134,916)

(31,061)

Adjustments to cash flows from non-cash items


Depreciation and amortization


1,320

565

Depreciation on right of use assets


294

105

Finance (income)/costs


76,832

56

Related party finance costs


-

483

Share based payment transactions


8,025

16,815

Income tax expense/(benefit)


-

-


(48,445)

(13,037)

Working capital adjustments


Decrease/(Increase) in trade and other receivables


1,652

(9,778)

(Decrease)/increase in trade and other payables


(31,808)

5,972

Net cash flows used in operating activities


(78,601)

(16,843)

Cash flows from investing activities


Increase in short term deposits


(60,835)

-

Acquisitions of property plant and equipment


(256)

(620)

Acquisition of intangible assets


(464)

(1,001)

Net cash flows used in investing activities


(61,555)

(1,621)


Cash flows from financing activities


Proceeds from secured convertible notes


-

25,000

Proceeds from the issuance of share capital


215

-

Proceeds from related party borrowings


-

2,208

Payments to lease creditors


(358)

(132)

Net cash flows (used)/generated from financing activities


(143)

27,076

Net (decrease)/increase in cash at bank


(140,299)

8,612

Cash at bank, beginning of the period


212,660

839

Effect of foreign exchange rate changes


11,325

52

Cash at bank, end of the period

83,686

9,503


Selected Notes and Supplemental Disclosures

(in pounds thousands)


Other operating income


3 months ended September 30,

9 months ended September 30,


2022

2021

2022

2021

Government grants

187

891

1,401

9,890

R&D tax credit

729

1,029

2,922

1,716


916

1,920

4,323

11,606

Expenses by nature


3 months ended September 30,

9 months ended September 30,


2022

2021

2022

2021

Research and development staff costs

3,589

2,241

10,278

5,268

Research and development consultancy

3,608

692

11,544

1,744

Research and development components, parts and tooling

2,550

2,187

7,321

4,615

Total research and development

9,747

5,120

29,143

11,627

Staff costs excluding share-based payment expenses

2,556

1,871

8,284

4,390

Share based payment expenses

732

-

8,025

16,815

Consultancy costs

1,144

355

2,135

1,195

Legal and financial advisory costs

746

676

2,221

3,339

HR advisory and recruitment costs

538

837

1,682

1,422

IT Hardware and software costs

1,145

496

2,810

1,008

Related party administrative expenses

15

(12)

15

115

Insurance expenses

916

20

2,646

28

Marketing costs

621

529

1,376

1,019

Other administrative expenses

206

102

1,471

238

Premises expenses

587

91

985

208

Depreciation expense

163

96

423

258

Amortization expense

324

139

897

307

Depreciation on right of use property assets

105

35

294

105

Total administrative costs

9,798

5,235

33,264

30,492


Total administrative and research and development expenses

19,545

10,355

62,407

42,119

Share based payments
In March 2022 the extant Vertical Aerospace Group Ltd Enterprise Management Incentive (“EMI”) was modified whereby all option holders exchanged their existing options for newly issued options in the Company resulting in 23,213,933 replacement options being granted. A total credit of £7,276 thousand has been recognised within other reserves during the nine months ending September 30, 2022 relating to equity settled share-based payment transactions in relation to employees (September 30, 2021: £117 thousand). An additional £749 thousand was recognised with respect to third parties (September 30, 2021: £16,815 thousand).

Finance income/(costs)


3 months ended September 30,

9 months ended September 30,


2022

2021

2022

2021

In-kind interest on convertible loan notes

(4,522)

-

(11,527)

-

Interest on loans from related parties

-

-

-

(483)

Foreign exchange loss

(17,861)

-

(30,842)

-

Fair value movements

-

(2)

-

(5)

Interest expense on leases

(35)

(17)

(102)

(51)

Fair value movements on convertible loan notes

(71,260)

-

(33,167)

-

Fair value movements on warrant liabilities

(5,795)

-

(1,422)

-

Other

(31)

(90)

(4)

(90)

Total finance costs

(99,504)

(109)

(77,070)

(629)


3 months ended September 30,

9 months ended September 30,


2022

2021

2022

2021

Interest on loans to related parties

238

-

238

-

Foreign exchange gain

-

14

-

14

Fair value movements on convertible loan notes

-

-

-

-

Fair value movements on warrant liabilities

-

-


-

Total finance income

238

14

238

14


Share capital and reserves

Allotted, called up and fully paid shares

September 30,
2022

December 31,
2021


No.

£

No.

£

Ordinary of $0.0001 each

210,389,355

15,915

209,135,382

15,804


210,389,355

15,915

209,135,382

15,804

In addition, 101,350,465 shares had been authorised for allotment at September 30, 2022.

Other reserves
During the nine months ended September 30, 2022 other reserves increased by £1,010 thousand as a result of the reclassification of warrants; £7,276 thousand in respect of share based payments as a result of the modification of the EMI scheme; and £18,429 thousand reflecting cumulative translation differences.

Share Premium
On June 5, 2022, a total of 150,000 shares were issued to third parties resulting in increase in share premium of £749 thousand. Following the establishment of an equity subscription line, during the three months ended September 30, 2022 a total of 1,103,863 shares were issued resulting in an increase in share premium of £7,734 thousand.

Warrant Liability
As at September 30, 2022 and December 31, 2021, the following warrants were issued but not exercised and therefore recorded as a liability:

September 30,

December 31,

2022

2021


Public Warrants

15,265,146

15,265,146

Mudrick Warrants

4,000,000

4,000,000

Outstanding, end of period

19,265,146

19,265,146


The following table shows the change in fair value of the warrants during the period ended September 30, 2022:


£ 000

December 31, 2021

10,730

Addition/(Disposal) of private placement warrants

-

Reclassification of options to equity

(1,010)

Change in fair value

1,422

Exchange differences on translation

1,622

As at September 30, 2022

12,764

Each public warrant entitles the registered holder to purchase one share of common stock at a price of $11.50 per share. Once exercisable, the Company may redeem public warrants at a price of $0.01 per warrant if the closing price of common stock equals or exceeds $18.00 per share for any 20 trading days within a 30 trading day period.

Derivative financial liabilities
Convertible Senior Secured Notes consists of the following:


Mudrick

£ 000

As at December 31, 2021

112,799

Fair value movements

33,167

In-kind interest accrued

11,527

Exchange differences on translation

21,996

As at September 30, 2022

179,459

On December 16, 2021, Mudrick Capital Management purchased Convertible Senior Secured Notes of an aggregate principal amount of £151,000 thousand ($200,000 thousand) for an aggregate purchase price of £145,000 thousand ($192,000 thousand). The Convertible Senior Secured Notes are initially convertible into up to 18,181,820 ordinary shares at an initial conversion rate of 90.9091 ordinary shares per £824 ($1,000).

In accordance with International Financial Reporting Standards 9: Financial Instruments, this is treated as a hybrid instrument and is designated in its entirety as fair value through profit or loss.

The Company has elected to pay interest in-kind at 9% per annum. Interest is paid semi-annually in arrears and on June 15, 2022 the Company authorised the payment of interest by increasing the nominal amount of the outstanding Convertible Senior Secured Notes by £7,005 thousand ($8,950 thousand).

Several covenants exist including retention of $10 million cash. Accordingly, cash at bank includes £8,953 thousand deemed to be restricted as at September 30, 2022.


Contacts

For more information:

Vertical Media
Victoria Madden (Head of Communications)
This email address is being protected from spambots. You need JavaScript enabled to view it.
+44 7885 571989

Ambika Sharma
This email address is being protected from spambots. You need JavaScript enabled to view it.
+44 7596 474 020

Vertical Investors
Eduardo Royes
This email address is being protected from spambots. You need JavaScript enabled to view it.
+1 (646) 200-8871

People interested in buying an EV are most concentrated in urban areas, regardless of state’s political leaning, highlighting the criticality of solving community charging for continued EV adoption

NEW YORK--(BUSINESS WIRE)--Volta Inc. (NYSE: VLTA) ("Volta"), an industry-leading electric vehicle ("EV") charging and media company, today announced the findings of its second annual Climate Conscious Consumer study, which tracks how our climate influences consumer spending, what environmentally-conscious consumers desire from advertisers, and how drivers are thinking about EVs. The study is based on responses from 997 Americans representative of the U.S. adult population gathered in September 2022 by F’inn, a leading independent research firm.


This year’s findings reveal that the adoption curve around climate consciousness has officially crossed into the late majority, with 55% of Americans identifying with this attitude — a 15% increase from 2021. This consumer cohort is also increasingly diverse and inclusive as it expands. Being a Climate Conscious Consumer is no longer associated with only coastal states — this mindset is prevalent across the U.S. with notable year-over-year increases in Texas, Kentucky, and Michigan.

Understanding this rapidly growing and evolving consumer group is imperative for brands seeking to remain relevant and sell products and services. Volta’s study revealed Climate Conscious Consumers’ key commerce preferences, providing advertisers with important insights that should be used to shape future marketing strategies, including:

  • Climate Conscious Consumers are more tech-savvy: Over 70% subscribe to a streaming TV service compared to 60% of Non-Climate Conscious Consumers; more than 30% use QR codes compared to 25% of Non-Climate Conscious Consumers;
  • This cohort expects targeted, personalized campaigns: Nearly two-thirds prefer ads that are relevant to their needs compared to less than half of Non-Climate Conscious Consumers; and
  • Value and price remain important to purchase decisions: Nearly 60% of Climate Conscious Consumers are looking for more sales and deals.

Volta provides advertisers the optimal media platform for authentically reaching the 55% of the U.S. adult population that identify as Climate Conscious Consumers. The company’s EV chargers feature large digital displays — known as the Volta Media™ Network — and combine performance-driving advertising capabilities with true environmental impact. Volta’s chargers and media screens are located directly in front of popular retailers and commercial centers that millions of consumers visit daily, allowing marketers to reach audiences as they finalize their shopping lists before entering a store. To further personalize campaigns, the Volta Media Network offers a robust suite of advertising capabilities, including digital-direct offerings like audience targeting, mobile retargeting, and QR code activations, and dynamic creative options, including real-time weather triggers, countdown clocks, and 3D creative.

To date, Volta has provided more than 150 million emission-free miles and avoided over 35,000 tons of CO2 emissions that would have otherwise been created by gas-powered vehicles — and Volta’s U.S. charging network is backed by renewable energy. Volta purchases verified Renewable Energy Certificates (RECs) equivalent to the amount of electricity used to power its charging network, giving partners and consumers confidence they are supporting a clean transportation and energy future for all.

The continued expansion of the Climate Conscious Consumer cohort demands that brands intentionally design campaigns geared toward this audience — from the messaging advertisers craft to the media they buy,” said Brandt Hastings, Chief Commercial Officer at Volta. “By fusing high-impact digital screens with EV charging, the Volta Media Network offers our advertising partners the ability to authentically reach Climate Conscious Consumers while they shop on a media platform that equally drives measurable outcomes and a more sustainable planet. We invite brands to grow with us as we continue building the future of advertising and transportation.”

Volta’s 2022 Climate Conscious Consumer study also examined EV adoption trends, revealing critical insights about where EV charging infrastructure must be deployed to facilitate the next wave of EV ownership. Notably, EV intenders — those who stated they plan to buy an EV in the next 12 months — are:

  • Urban residents in both blue and red states: 20% of people who live in urban areas within Democratic-leaning states are EV intenders, compared to only 9% in non-urban areas in these states; 12% of people who reside in urban areas in Republican-leaning states are EV intenders, compared to 7% in non-urban areas in these states;
  • Limited access to at-home charging: More than half of EV intenders are renters or live in something other than a single family home, compared to only 43% of current EV owners; and
  • Lower incomes than early EV adopters: Close to 60% of EV intenders have household incomes less than $75,000, compared to just 31% of current EV owners in this earnings bracket.

These findings point to the importance of public, accessible EV charging infrastructure in more densely populated communities. Recently, Volta partnered with the City of Hoboken to integrate critical EV charging infrastructure directly onto city streets in a way that maximizes economic, health, and climate benefits. The digital screens featured on Volta’s EV chargers can generate media revenue immediately upon installation, allowing the company to install EV infrastructure at little to no cost to a city, ensure the most efficient use of taxpayer funds, and build in areas ahead of high EV adoption. Further, it unlocks the ability for Volta and partners like Hoboken to subsidize the cost of charging sessions for drivers where suitable, delivering safe and affordable charging near the front doors of commercial properties and retail locations.

In support of the federal government's Justice40 goal — which seeks to ensure that 40 percent of the overall benefits of certain federal investments flow to disadvantaged communities — Volta launched its Charging For All initiative, the company's commitment to delivering affordable, reliable, and equitable charging across the United States. Most recently, the company announced its latest extension of Charging For All — Volta’s infrastructure planning platform, PredictEV®, now offers an upgraded capability to provide state and local governments with critical, data-driven insight to effectively deploy EV charging at optimal locations within disadvantaged communities, in direct alignment with Justice40 goals.

The Climate Conscious Consumer study further highlights the strength of Volta’s dual EV charging and media model. Volta’s conveniently located public charging makes EV ownership a reality for urbanites, while our media network enables EV charging build-out in areas ahead of mainstream adoption,” said Vince Cubbage, Interim Chief Executive Officer at Volta. “The health and safety of our planet demands that every community has access to the benefits of equitable EV adoption, and we look forward to continuing forming multiple private and public partnerships to supercharge the next phrase of electric mobility.”

To learn more about advertising on the Volta Media Network, click here. To learn more about the benefits of Volta’s model for cities and municipalities, click here.

About Volta

Volta Inc. (NYSE: VLTA) is an industry-leading electric vehicle ("EV") charging and media company. Volta's unique network of charging stations powers vehicles and drives business growth while accelerating a clean energy future. Volta delivers value to site partners, brands, and consumers by installing charging stations that feature large-format digital advertising screens located steps away from the entrances of popular commercial locations. Retailers can attract and influence foot traffic, advertisers can precisely target audiences, and EV drivers can charge their vehicles seamlessly as they go about their daily routines. Volta's extensive network leverages its proprietary PredictEV® platform, which uses sophisticated behavioral science and machine learning technology to help commercial property owners, cities, and electric utilities plan EV infrastructure intelligently, efficiently, and equitably. To learn more, visit www.voltacharging.com.

Forward-Looking Statements

This press release contains certain forward-looking statements within the meaning of federal securities laws. These forward-looking statements generally are identified by words such as “anticipate,” “believe,” “estimate,” “expect,” “future,” “intend,” “may,” “opportunity,” “plan,” “potential,” “project,” “should,” “strategy,” “will,” “would,” and similar expressions. Forward-looking statements are predictions, projections and other statements about future events that are based on current expectations and assumptions and, as a result, are subject to risks and uncertainties. Many factors could cause actual future events to differ materially from the forward-looking statements in this press release, including but not limited to the factors, risks and uncertainties included in our Annual Report on Form 10-K for the fiscal year ended December 31, 2021 and our subsequent Quarterly Reports on Form 10-Q, as such factors may be updated from time to time in our other filings with the Securities and Exchange Commission (the "SEC"), accessible on the SEC’s website at www.sec.gov and the Investor Relations section of our website at www.voltacharging.com. These filings identify and address other important risks and uncertainties that could cause actual events and results to differ materially from those contained in the forward-looking statements. Forward-looking statements speak only as of the date they are made. Readers are cautioned not to put undue reliance on forward-looking statements, and, except as required by law, we assume no obligation and do not intend to update or revise these forward-looking statements, whether as a result of new information, future events, or otherwise.


Contacts

Lucas Piazza
This email address is being protected from spambots. You need JavaScript enabled to view it.

  •  Joint Acquisition of Biomethan Green 1 by Andion Italy S.p.A. and EGEA New Energy S.p.A. Ignites Formal Partnership between the Two Companies to Develop Renewable Energy Projects in Italy

MILAN--(BUSINESS WIRE)--ANDION ITALY S.p.A. (“Andion”), the Italian subsidiary of Andion Global, a global leader in delivering proven and comprehensive waste-to-energy solutions, and EGEA NEW ENERGY S.p.A. (“EGEA”), the EGEA Group company focused on developing, building and managing renewable energy plants, announced today the joint acquisition of BIOMETHAN GREEN 1 - SOCIETÀ AGRICOLA S.R.L. , a fully permitted greenfield agricultural project in Mirandola, located in the province of Modena. BIO-LNG will be produced by processing organic waste, specifically agricultural production waste, using Andion’s proprietary anaerobic digestion technology. BIO-LNG - liquefied biomethane - is a biofuel made by processing organic waste.


Engineering, procurement and construction of the new facility is expected to commence in early 2023. Both EGEA and Andion have started collaboration with the surrounding communities to secure agricultural feedstock – processed to produce renewable natural gas - to be delivered to the new anaerobic digestion facility.

“We are really proud to provide a step forward in this energy transition. Every year, the Andion and EGEA plant will avoid the emission of 8,000 tons of CO2; and will assure the treatment of over 65,000 tons of pig and cow slurry and poultry litter, providing a solution to the abundance of animal waste being produced in the area. The facility will produce enough liquid biomethane to fuel a fleet of trucks more than 10 million kilometres,” says Roberto Zocchi, CEO of Andion Italy and President of Biomethan Green 1.

"The partnership with Andion represents for EGEA a great driver of development in the Biomethane sector," says Massimo Cellino, CEO of EGEA New Energy. "We are happy to collaborate with a cutting-edge international company capable of pooling the best expertise and most innovative technologies available. The new plant in Mirandola is currently in the design phase and construction will start in early 2023. This plant will produce biomethane from livestock manure. The objective of the EGEA Group, a multiservice utility serving the territories, is to increase the share of energy produced from renewable sources by means of new photovoltaic, hydroelectric, biogas and biomethane plants. In the context of today's uncertain markets, the availability of autonomous production sources of natural gas creates greater independence and limits the risk in supply."

“We are extremely excited to partner with EGEA, an established Italian multi-utility that shares the same passion for responsibly developing renewable energy projects throughout Italy. Our first joint project in Mirandola will demonstrate the synergy of our two companies. EGEA’s knowledge and operation experience is ideally paired to Andion’s project development and technological expertise,” says Phillip Abrary, CEO of Andion Global.

EGEA and Andion also announced today the two companies have signed a framework agreement to jointly develop other projects throughout Italy; a natural partnership as the two companies are world class leaders in the development of anaerobic digestion facilities and production of renewable energy, using a variety of organic feedstocks. EGEA has built and manages five biogas cogeneration plants, for a total installed power of almost 3 MW of electricity, having recently commissioned a plant nearby in Cella Dati, which will provide operational synergy to the facility in Mirandola. Andion’s team has successfully delivered more than 50 complete anaerobic digestion facilities.

Not only does Andion’s technology makes organic waste handling and conversion to biogas efficient, sustainable and economically viable, but Andion’s waste-to-energy facilities also provide environmental and socio-economic benefits for communities facing waste challenges. Anaerobic digestion reduces greenhouse gas emissions, eliminates odours, does not require a large footprint, and as well, supports the circular economy as the waste is recycled into biogas, compost and fertilizer.

Andion’s facilities have the ability to process hundreds of thousands of tons of a variety of organic waste, harnessing vital energy and in addition, avoiding the production of harmful greenhouse gases that could otherwise arise from such waste.

ABOUT ANDION ITALY S.p.A.

ANDION ITALY S.p.A. specializes in the development, deployment and operation of renewable energy facilities. The company has operations in Milan and Stockholm, with global headquarters (Andion Global Inc.) in Vancouver, Canada. Andion has a portfolio of technologies and proven processes for converting complex and variable organic wastes to renewable energy, having successfully delivered more than 50 complete anaerobic digestion facilities as well as over 130 complex wastewater treatment plants. With more than two decades of expertise and a portfolio of patents pertaining to the processing of organic waste, Andion’s integrated solutions cover every aspect of the waste-to-energy and wastewater treatment value chain.

ABOUT EGEA NEW ENERGY S.p.A.

EGEA NEW ENERGY S.p.A. is a company of the EGEA Group, based in Alba, that deals with the development, construction and management of plants for the production of energy from renewable sources. As part of the energy transition and decarbonization process, EGEA plays an important role in the circular economy of the Territory in which it operates, contributing to the strengthening of a pattern of sustainable development: in fact, its various assets of development include Biomethane, Biogas and Hydroelectric, which are all forms of renewable energy capable of reducing the release of CO₂ into the atmosphere. As of today, the Group operates five plants in the production of Biogas and Biomethane utilizing two distinct sources: livestock manure and by-products from the processing of the Organic Material from Municipal Solid Waste (FORSU plants).


Contacts

ANDION GLOBAL Inc.
Carlo Valente, CFO, Andion Global
email: This email address is being protected from spambots. You need JavaScript enabled to view it.
mobile: +1 778.239.0546

EGEA New Energy S.p.A.
Massimo Cellino, CEO, EGEA New Energy S.p.A.
email: This email address is being protected from spambots. You need JavaScript enabled to view it.
mobile: +39 3405332009

Company Leaders Articulate Visionary Future of Transportation Management with Integrated Visibility and Execution in a Unified Platform

SCOTTSDALE, Ariz.--(BUSINESS WIRE)--The message was clear. At its Velocity 2022 user conference, MercuryGate, the largest, dedicated transportation management system (TMS) provider, set a new standard for the future of TMS: a unified system that combines end-to-end shipment lifecycle visibility with actionable execution layers to speed reaction to exceptions and build true logistics intelligence.


MercuryGate will be the first platform that creates full transparency to the shipment journey by bringing together real-time, predictive data and the ability to take preemptive action in one place,” said MercuryGate President & CEO Joe Juliano. “No longer will customers face a lack of transparency which has always plagued supply chains because most software exists as stand-alone, disparate systems.”

MercuryGate Co-founder and Chief Innovation Officer Steve Blough added: “Smart is where we are today. Intelligent is where we are going. Using continuous data inputs and automating responses based on those inputs enables the platform to not only react to what is happening now, but also use self-learning algorithms to predict what is coming to generate logistics intelligence.”

Over the past year, MercuryGate has delivered to the market several new product development features in support of this larger, intelligent vision – laying the groundwork for a holistic strategy aimed at streamlining complexity, enabling efficiency and enhancing sustainability in supply chains, including:

  • A map view Control Tower which enables users to visualize and drill down to shipment-level details by physical location;
  • A single, modernized user interface that simplifies the user experience across all device types; and
  • Order-centric grid view and shipping cart that collects, filters and allows mass action on multiple orders and automates shipping release when each order is ready.

Juliano also announced significant steps toward achieving this holistic vision with the expansion of ocean freight procurement, product sourcing compliance and real-time shipment visibility capabilities from first-to-final mile with the acquisition of ClearTrack Information Network.

This broadened solution set available through a single provider will help MercuryGate customers simplify their transportation management, manage costs, prevent risk and increase sustainability.

There is increasing demand for accountability to Environmental, Social and Governance (ESG) goals in supply chains,” said Blough. “The supplier sourcing documentation management capabilities gained with ClearTrack provide a well-defined process and accounting for product standards ranging from quality and safety to regulatory and social compliance of suppliers.”

Learn more about MercuryGate’s product vision by watching the keynote address from Velocity 2022.

About MercuryGate

MercuryGate provides powerful transportation management solutions proven to be a competitive advantage for today’s most successful shippers, 3PLs, brokers and carriers. The comprehensive Software-as-a-Service (SaaS) product suite natively supports all transportation modes and segments, generating value for its users through improved cost, productivity and efficiency using artificial intelligence (AI), machine learning (ML) and connected technologies to adapt and automate transportation management functions. Learn how MercuryGate makes shipping intelligent, simple, sustainable and transformative for customers at: www.mercurygate.com.


Contacts

This email address is being protected from spambots. You need JavaScript enabled to view it.

Offshore Source Logo

Offshore Source keeps you updated with relevant information concerning the Offshore Energy Sector.

Any views or opinions represented on this website belong solely to the author and do not represent those of the people, institutions or organizations that Offshore Source or collaborators may or may not have been associated with in a professional or personal capacity, unless explicitly stated.

Corporate Offices

Technology Systems Corporation
8502 SW Kansas Ave
Stuart, FL 34997

info@tscpublishing.com