Business Wire News

CENTRAL ISLIP, N.Y.--(BUSINESS WIRE)--CVD Equipment Corporation (NASDAQ: CVV), a leading provider of chemical vapor deposition systems and materials, today announced it closed on the sale of its facility located at 555 North Research Place, Central Islip, New York (“555 Building”) for the purchase price of $24,360,000. The Company previously announced it had entered into a contract of sale in March 2021.


Thomas McNeill, Executive Vice President & Chief Financial Officer, said “We are pleased to announce the closing of the sale of the 555 Building on July 26, 2021. Simultaneous with the sale, we satisfied our outstanding mortgage debt, including interest and fees, on the 555 Building in the amount of $9,352,719, as well as costs related to the closing of the transaction, which resulted in net proceeds to the Company of approximately $14.0 million. Further, we have entered into a new IDA agreement with the Town of Islip concerning our remaining facility at 355 South Technology Drive in Central Islip (“355 Building”), which includes, among other things, real estate and sales tax abatements incentives.”

Emmanuel Lakios, President and Chief Executive Officer said, “In January 2021 we determined that the 555 Building was not required for present and any foreseen business operations. The sale was a key step in our business strategy by converting brick and mortar to working capital. The working capital will be used for the Company’s sustainability, and future growth. The business operations previously located in the 555 Building have been consolidated into the 355 Building and for the Tantaline group into our Denmark facility during the first half of 2021.”

About CVD Equipment Corporation

CVD Equipment Corporation (NASDAQ: CVV) designs, develops, and manufactures a broad range of chemical vapor deposition, gas control, and other state-of-the-art equipment and process solutions used to develop and manufacture materials and coatings for research and industrial applications. This equipment is used by its customers to research, design, and manufacture these materials or coatings for aerospace engine components, medical implants, semiconductors, solar cells, smart glass, carbon nanotubes, nanowires, LEDs, MEMS, and other applications. Through its application laboratory, the Company provides process development support and process startup assistance with the focus on enabling tomorrow’s technologies™. It’s wholly owned subsidiary CVD Materials Corporation provides advanced materials and metal surface treatments and coatings to serve demanding applications in the electronic, biomedical, petroleum, pharmaceutical, and many other industrial markets.

The Private Securities Litigation Reform Act of 1995 provides a “safe harbor” for forward-looking statements. Certain information included in this press release (as well as information included in oral statements or other written statements made or to be made by CVD Equipment Corporation) contains statements that are forward-looking. All statements other than statements of historical fact are hereby identified as “forward-looking statements, “as such term is defined in Section 27A of the Securities Exchange Act of 1933, as amended, and Section 21E of the Securities Exchange Act of 1934, as amended. Such forward looking information involves a number of known and unknown risks and uncertainties that could cause actual results to differ materially from those discussed or anticipated by management. Potential risks and uncertainties include, among other factors, market and business conditions, the COVID-19 pandemic, the success of CVD Equipment Corporation’s growth and sales strategies, the possibility of customer changes in delivery schedules, cancellation of, or failure to receive orders, potential delays in product shipments, delays in obtaining inventory parts from suppliers and failure to satisfy customer acceptance requirements. Past performance in not a guaranty of future results.


Contacts

Thomas McNeill
Phone: (631) 981-7081
Fax: (631) 981-7095
Email: This email address is being protected from spambots. You need JavaScript enabled to view it.

 Pre-tax NPV of C$314M with 28.3% IRR at US$916/t Cg; after-tax NPV of 186M with 21.5% IRR

MONTREAL--(BUSINESS WIRE)--$ALB #BEV--Lomiko Metals Inc. (Lomiko) ((TSX-V: LMR, OTC: LMRMF, FSE: DH8C)) ("Lomiko Metals Inc or “Lomiko" or the "Corporation") is pleased to announce positive results from the Preliminary Economic Assessment (“PEA”) on its 100 percent-owned La Loutre Project in south-eastern Quebec. The PEA was completed by Ausenco Engineering Canada Inc. (“Ausenco”) in accordance with National Instrument 43-101 (“NI 43-101”). Lomiko now aims to initiate a Preliminary Feasibility Study (PFS) to advance its La Loutre Project towards production as part of a staged development strategy while continuing its aggressive drilling programs to maximize value creation.


Highlights of the PEA (all figures are stated in Canadian dollars unless otherwise stated):

  • Long-term Weighted-Average1 Graphite Price US$916/t Cg conc. (graphitic carbon concentrate)
  • Exchange rate: C$1.00 = US$0.75
  • Pre-tax NPV (8%) of C$313.6M
  • After-tax NPV (8%) of C$185.6M
  • Pre-tax IRR of 28.3%
  • After-tax IRR of 21.5%
  • Pre-tax payback period of 3.3 years
  • After-tax payback period 4.2 years
  • Initial capital of (“CAPEX”) of C$236.1M including mine pre-production, processing, infrastructure (roads, power line construction, co-disposal tailings facility, ancillary buildings, and water management)
  • Life of mine processing period (“LOM”) of 14.7 years
  • Average LOM strip ratio (Waste:Mineralization) of 4.04:1
  • LOM plant production of 21,874 Kilotons (kt=1,000 metric tonnes) of mill feed yielding 1,436 kt of graphite concentrate grading 95.0% Cg.
  • Average annual graphite concentrate production of 108 kt for the first eight years; LOM average annual production of 97.4 kt.
  • Average graphite mill head grade of 7.44% Cg for the first eight years; LOM average graphite mill head grade of 6.67% Cg.
  • Average LOM recovery of 93.5% Cg.
  • Measured + Indicated resource at the base case cut-off grade of 1.5% Cg of 23,165 kt at a 4.51% Cg grade for 1.04 Mt of graphite.
  • Inferred resource at the base case cut-off grade of 1.5% Cg of 46,821 kt at a 4.01% Cg grade for 1.9Mt of graphite.
  • Cash Cost of US$386 per tonne of graphite concentrate
  • All-in Sustaining Cost (“AISC”) of US$406 per tonne of graphite concentrate

The Lomiko team is pleased to present the results of a PEA on its La Loutre Project, clearly demonstrating its potential for the Corporation to become a major North American graphite producer, with a positive after-tax Internal Rate of Return (“IRR”) of 21.5% and after-tax Net Present Value (“NPV”) of C$186M. The PEA supports an open pit project with production spanning 14.7 years with robust economics at a US$916/tonne Cg sale price, with very attractive cash costs and AISC, low CAPEX and low capital intensity. The first eight years will target production averaging 108 kt/a payable graphite concentrate peaking at 112 kt/a in year 4.

“La Loutre has shown it has the potential to become a highly profitable graphite mine in one of the most prolific producing regions in Canada. The La Loutre PEA was produced by the Ausenco team, one of the most experienced and reputable engineering firms working on mining projects in Canada. With further drill programs, we will continue to add to and upgrade resources as we seek to move the project forward towards production,” said A Paul Gill, President, CEO and director, Lomiko.

The La Loutre Project PEA indicates the property has the geological potential to extend the mine life beyond the initial 14.7 years presented in the PEA as well as the opportunity to expand the scale of production by increasing the mineral resource through ongoing exploration and drilling. The Company’s goal is for La Loutre to be a cornerstone mine for its future growth in a mining friendly jurisdiction. With a strong treasury to support their next steps, the Company plans to commence a Preliminary Feasibility Study (PFS) and Environmental Impact Studies while continuing to explore the geological potential of its La Loutre property.

“The development of Canada-USA and Canada-EU critical minerals collaboration agreements gives access for graphite products in these markets. There is a focus on projects with environmental, social and governance (ESG) acceptability which Lomiko has also adopted. The strict criteria for the report should result in competitively-priced graphite for customers in the North America and European markets. These recent agreements between Canada and the USA and Canada and Europe have identified graphite as a critical element that will be part of a new supply chain. Lomiko is ready to maximize La Loutre’s value by advancing the studies to further refine and de-risk the project,” added Gill.

Lomiko looks forward to working with its partners in the MRC of Papineau region including the Lac-des-Plages and the Duhamel municipalities, as well as the surrounding First Nations communities. We will also continue to work closely with the Quebec and Federal governments to advance the La Loutre Project.

Overview

Ausenco was appointed as lead PEA consultant on February 22, 2021, in accordance with National Instrument 43-101 – Standards of Disclosure for Mineral Projects ("NI 43-101"). Ausenco is the lead consultant responsible for the overall development of the PEA, including the processing, major infrastructure, hydrogeology, hydrology, environmental, co-disposal of mine waste rock and mill tailings, mining and economic assessment. Ausenco’s specialist ESG group Hemmera Envirochem Inc., provided environmental support and Moose Mountain Technical Services was responsible for the resource estimate and mine design. Metpro Management Inc. (Metpro) was responsible for metallurgy.

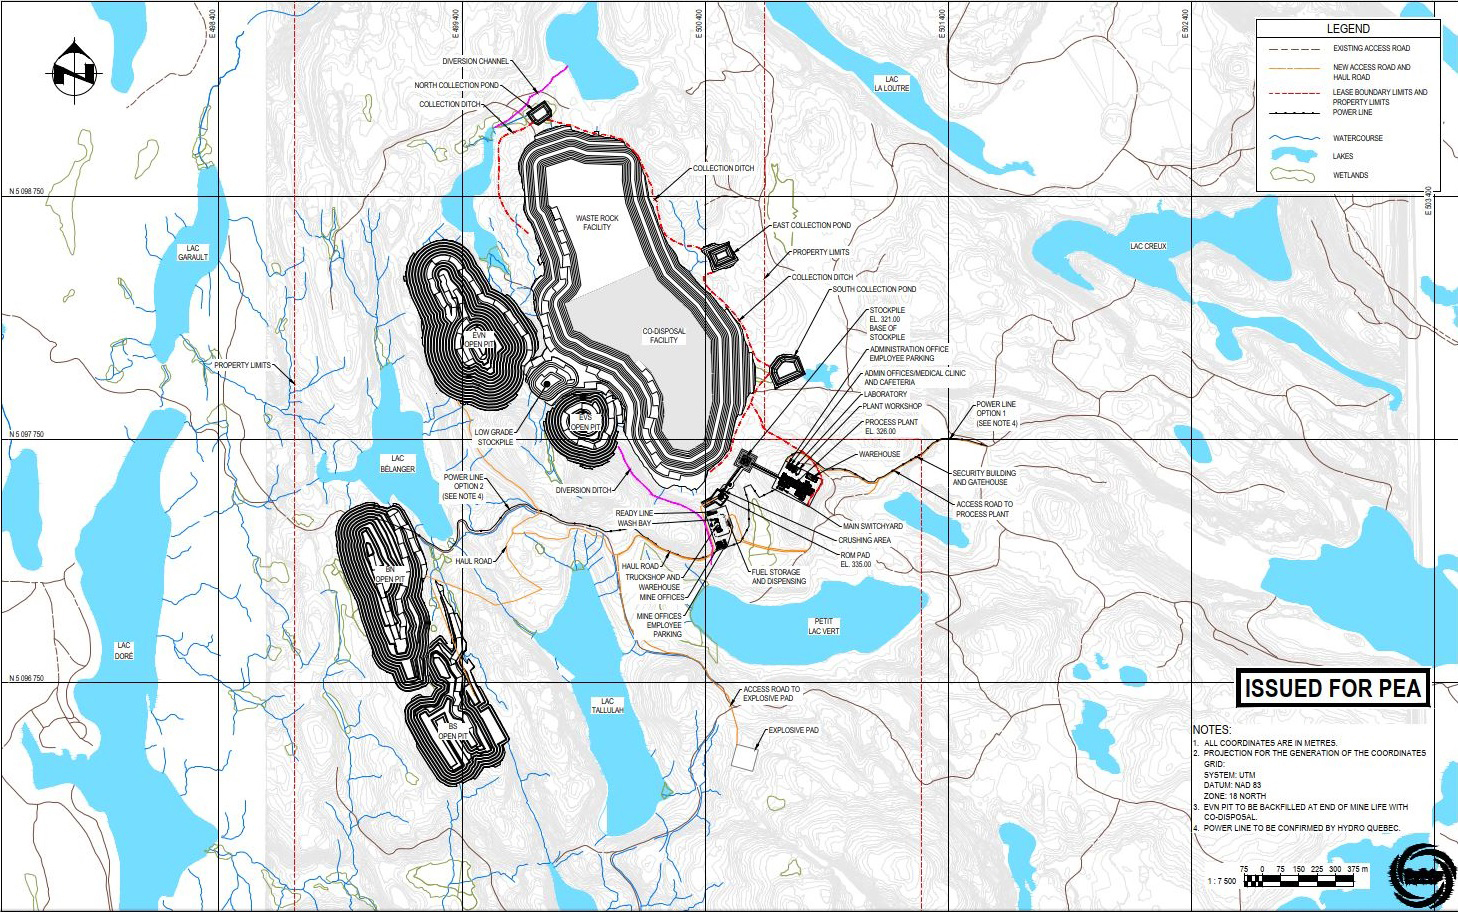
The La Loutre Project is located in the Nominingue-Chénéville Deformation Zone in Quebec. The Property consists of one large contiguous block of 42 mineral claims totaling 2,508.97 hectares (25.09 km2) and is located approximately 117 km northwest of Montréal in southern Québec, 230 km southwest of the Nouveau Monde Matawinie Project and 100 km southeast of the Imerys Graphite & Carbon Lac-des-îles mine.

Financial Analysis

The economic analysis was performed assuming an 8% discount rate. This analysis shows a projected pre-tax NPV 8% of $313.6M, internal rate of return IRR is 28.3% and payback period of 3.3 years. On an after-tax basis, an NPV 8% of $186M, IRR of 21.5% and payback period of 4.2 years is expected. A summary of the project economics is listed in (Table 1).

The size distribution as noted in Table 1 was derived from the lock cycle testing (LCT) on the Master composite by SGS Canada Inc. Benchmark Mineral Intelligence (Benchmark) provided pricing information based on Mesh Size only. The prices were derived based on Benchmark forecasted graphite prices and is noted in Table 1.

Table 1: Graphite Price Forecast

Mesh Size

Average 10-year Price

($US/tonne)

% Distribution

Weighted Average Price

($US/t)

+50

1,211

10.8

130.79

+80

987

21.6

213.19

+100

893

10.8

96.44

-100

837

56.8

475.42

Average:


100

915.84

Description of Economic Valuation

Table 2: Summary of Project Economics

General

LOM Total / Avg.

Graphite Price (US$/tonne)

$915.84

Exchange Rate ($US:$C)

0.75

Mine Life (years)

14.7

Total Waste Tonnes Mined (kt) (including pre-stripping)

88,396

Total Mill Feed Tonnes (kt)

21,874

LOM Operating Strip Ratio (W:O)

4.04

Production

LOM Total / Avg.

Mill Head Grade (% Cg)

6.67

Mill Recovery Rate (%)

93.5%

Concentrate Grade (% Cg)

95.0%

Total Graphite Concentrate Recovered (kt)

1,436

Total LOM Average Annual Concentrate Production (kt)

97.4

Operating Costs

LOM Total / Avg.

Mining Cost (C$ /t Milled)

$16.20

Processing Cost (CAD$/t Milled)

$11.85

G&A Cost (C$/t Milled)

$2.37

Total Operating Costs (C$/t Milled)

$30.43

Transport Cost (C$/t Cg conc.)

$37.42

Royalty NSR *

1.0 %

Cash Costs (US$/t Cg conc.) **

$386

AISC (US$/t Cg conc.) ***

$406

Capital Costs

LOM Total / Avg.

Initial Capital (C$M)

$236.1

Sustaining Capital (C$M)

$37.7

Closure Costs (C$M)

$5.6

Salvage Costs (C$M)

$4.0

Financials - Pre Tax

LOM Total / Avg.

NPV (8%) (C$M)

$313.6

IRR (%)

28.3%

Payback (years)

3.3

Financials - Post Tax

LOM Total / Avg.

NPV (8%) (C$M)

$185.6

IRR (%)

21.5%

Payback (years)

4.2

* La Loutre property is subject to a 1.5% NSR of which the company is buying back at 0.5% NSR for $0.5M.

** Cash costs consist of mining costs, processing costs, mine-level G&A, transportation costs and royalties.

*** AISC includes cash costs plus sustaining capital, closure cost and salvage value.

Sensitivity

A sensitivity analysis was conducted on the base case pre-tax and after-tax NPV and IRR of the project, using the following variables: metal price, total capex (initial + sustaining), total operating costs and exchange rate. The tables below provide a summary of the sensitivity analysis.

Table 3: Post-Tax NPV (8%) Sensitivity

Graphite
Price
(US$/t)

Post-Tax
NPV (8%)
(CDN$)

Initial CAPEX

OPEX


FX


Base
Case

(-20%)

(+20%)

(-20%)

(+20%)

(-20%)

(+20%)

$750

$76

$115

$37

$123

$28

($32)

$176

$850

$143

$180

$104

$188

$96

$28

$251

$916

$186

$222

$148

$230

$140

$65

$301

$1,150

$332

$364

$297

$371

$289

$188

$461

$1,300

$419

$445

$388

$449

$382

$264

$547

Table 4: Post-Tax IRR Sensitivity

Graphite
Price
(US$/t)

IRR

Initial CAPEX

OPEX


FX


Base
Case

(-20%)

(+20%)

(-20%)

(+20%)

(-20%)

(+20%)

$750

13.8%

18.6%

10.4%

17.1%

10.2%

5.4%

20.8%

$850

18.6%

24.1%

14.6%

21.6%

15.3%

10.2%

25.8%

$916

21.5%

27.5%

17.2%

24.4%

18.4%

13.0%

29.0%

$1,150

31.0%

38.8%

25.6%

33.5%

28.3%

21.6%

39.5%

$1,300

36.7%

45.4%

30.5%

38.8%

34.2%

26.6%

45.2%

Mineral Resource

The mineral resource is estimated from a drill hole database containing 117 drill holes consisting of 15,160 metres of drilling and 8,850 assay intervals.

The total Mineral Resource Estimate (MRE) is summarized in Table 5, with the base case cut-off of 1.5% Graphite highlighted. A Lerchs-Grossman resource pit has been constructed using the 150% pit case based on the prices, offsite costs, metallurgical recovery and graphite prices used for the economic analysis thus confining the resource to a “reasonable prospects of eventual economic extraction” pit shape. The cut-off grade is based on a processing cost of CDN$11.85/tonne, and General and Administrative Costs of CDN$2.37/tonne and a C$1.00 = US$0.75 as summarized in the notes below. A cut-off grade of 1.5% Cg has been used for the base case of the resource estimate, which more than covers the Process and G&A costs.

These mineral resource estimates include inferred mineral resources that are considered too speculative geologically to have economic considerations applied to them that would enable them to be categorized as mineral reserves. Mineral Resources that are not Mineral Reserves do not have demonstrated economic viability.

Table 5: Mineral Resource Estimate (effective date May 14, 2021)

Class

Cut-off
Grade
Cg (%)

EV Deposit

Battery Deposit

Total

ROM

In Situ
Grade

ROM

In Situ
Grade

ROM

In Situ
Grade

Graphite
(kt)

Tonnage
(kt)

Graphite
(%)

Tonnage
(kt)

Graphite
(%)

Tonnage
(kt)

Graphite
(%)

Indicated

1

8,321

6.38

15,889

3.32

24,210

4.37

1,057.9

1.5

8,158

6.48

15,007

3.44

23,165

4.51

1,044.3

2

7,792

6.70

12,622

3.75

20,414

4.88

995.5

3

6,768

7.33

4,529

6.16

11,297

6.86

774.6

5

4,443

9.17

2,394

8.27

6,837

8.85

605.4

Inferred

1

13,114

5.71

38,273

3.10

51,387

3.77

1,936.4

1.5

12,829

5.81

33,992

3.33

46,821

4.01

1,877.9

2

12,273

5.99

27,775

3.69

40,048

4.39

1,759.5

3

9,645

6.92

10,311

5.92

19,956

6.40

1,277.6

5

5,833

8.99

5,687

7.58

11,520

8.29

955.2

Notes to Table 5:

  1. Resources are reported using the 2014 CIM Definition Standards and were estimated using the 2019 CIM Best Practices Guidelines.
  2. Mineral Resources are reported inclusive of Mineral Reserves.
  3. Mineral Resources that are not Mineral Reserves do not have demonstrated economic viability.
  4. The Mineral Resource has been confined by a “reasonable prospects of eventual economic extraction” pit using the following assumptions: Exchange Rate C$1.00 = US$0.75; Weighted average price of graphite of US$ 916/tonne; 100% payable; Offsite costs including transportation and insurance of CDN$37.42/tonne; a 1.5% NSR royalty; Metallurgical recoveries of 95%.
  5. Pit slope angles are 45º below overburden, 20o in overburden.
  6. The specific gravity of the deposit is 2.86 in unmineralized and low-grade zones and 2.78 in high-grade zones (within solids above a 4% Graphite grade).
  7. Numbers may not add due to rounding.

The following factors, among others, could affect the Mineral Resource estimate: commodity price and exchange rate assumptions; pit slope angles; assumptions used in generating the Lerchs–Grossmann (LG) pit shell, including metal recoveries, and mining and process cost assumptions. The QP is not aware of any environmental, permitting, legal, title, taxation, socioeconomic, marketing, political, or other relevant factors that could materially affect the Mineral Resource Estimate.

Mining

The mine plan includes 21.9 Mt of mill feed and 88.4 Mt of waste over the 14.7-year project life. Mine planning is based on conventional open pit methods suited for the project location and local site requirements. Owner-operated and managed open pit operations are anticipated to begin prior to mill start up, running for 14.7 years to pit exhaustion, with feed from the low-grade stockpile supplementing plant feed over the last two years.

The subset of Mineral Resources contained within the designed open pits, summarized in Table 6 with a 2.5% Cg cut-off, forms the basis of the mine plan and production schedule.

Table 6: PEA Mine Plan Production Summary

Mine Plan Production Description

Mine Plan Production Summary Values

PEA Mill Feed

21,874 kt

Average Graphite Mill Head Grade

6.67% Cg

Waste Overburden and Rock

88,396 kt

LOM Strip Ratio (W:O)

4.04

Mill Feed Graphite Grade (Years 1-8)

7.44 % Cg

Strip Ratio (Year 1-8)

4.4

Notes:

  1. The PEA Mine Plan and Mill Feed estimates are a subset of the May 14, 2021, Mineral Resource estimates and are based on open pit mine engineering and technical information developed at a Scoping level for the La Loutre deposits.
  2. The Mineral Resources provided in this table were estimated using current Canadian Institute of Mining, Metallurgy and Petroleum (“CIM”) Standards on Mineral Resources and Reserves, Definitions and Guidelines
  3. Mineral resources that are not mineral reserves have not demonstrated economic viability. Additional trenching and/or drilling will be required to convert Inferred and Indicated Mineral Resources to Measured Mineral Resources. There is no certainty that any part of a mineral resource will ever be converted into reserves
  4. Waste:mineralization contact edge dilution of 0.5m at contact block grades is applied to the in situ Mineral Resources. Partial blocks are diluted to whole blocks grades prior to applying cut-off grade. Mining Recovery of 100% of diluted tonnages is assumed.
  5. Mineral Resources are stated at a cut-off grade of 2.5 % C(g). Estimates have been rounded and may result in summation differences.

The economic pit limits are determined using Minesight™ Pseudoflow algorithm. La Loutre deposit comprises the Battery (B) zone and the Electric Vehicle (EV) zone. The B zone is planned as two pits, and the EV zone is split into two pits EV North (EVN) and EV South (EVS) with the EVN pit split into two phases. Pit designs are based on 45 degree overall configured on 6 metre bench heights, with 7.8-metre-wide berms placed every two benches with 70 degree face angles. The pit delineated resource for mine scheduling are listed in Table 7 below:

Table 7: PEA Mine Plan Pit Sequencing

Pit

ROM Tonnage (kt)

Insitu Grade (%)

Diluted Grade (%)

Waste (Mt)

EVN1

6,267

7.90

7.65

20.5

EVN2

4,596

7.41

7.22

20.3

EVS

3,058

5.81

5.77

5.6

GRN

3,598

6.93

6.36

27.3

GRS

4,355

5.74

5.56

15.4

Total

21,874

6.90

6.67

89.1

Mine development is within the EVN pit for the first four years with development of the BN and BS zones beginning in Year 5. The EVN pit is mined out in Year 8 with backfill from the EVS, BN and BS pits beginning in Year 9 and final reclamation of the waste and co-disposal site.

The mill will be fed with material from the pits at an average rate of 1.5 Mtpa (4.1ktpd). Cut-off grade optimization is employed during the first 8 years, in a low-grade stockpile adjacent to the EVS pit entrances and is planned for reclamation to the mill in the last two years of the mine life. Overburden will be placed in a stockpile directly north of the EVS pit. A single waste rock and co-disposal site is located adjacent to the EV pits and will be reclaimed during the LOM. The majority of the Battery pit waste will be backfilled into the EVN pit as a co-disposal site.

Mining operations will be based on 365 operating days per year with two 12-hour shifts per day.

The mining fleet is based on diesel-powered drills with 140mm bit size for production drilling and grade control drilling, 4.5 m3 bucket size diesel hydraulic excavators and 7 m3 bucket sized wheel loaders for production loading, and 60 t payload rigid-frame haul trucks production hauling, plus ancillary and service equipment to support the mining operations. In-pit dewatering systems will be established for each pit. All surface water and precipitation in the pits will be handled by submersible pumps.

Maintenance on mine equipment will be performed in the field with major repairs to mobile equipment in the shops located near the plant facilities.

Milling and Processing

The La Loutre Process Plant employs standard flotation technology to produce a graphite concentrate. The plant includes crushing, grinding, classification, flotation, tailings thickening and filtration, graphite concentrate filtration, drying and screening and separation into the product sizes. Graphite concentrate is loaded into 1 tonne bags for shipment and sale.

The plant is expected to treat 1.5 Mt of feed per year at an average throughput of 4,100 t/d. The mill design availability is 8,147 hours per year or 93%, with an operating throughput of 184 t/h.

The plant has been designed to realize an average recovery of 93.5% of the graphite at a concentrate grade of 95% Cg over the life of the project based on metallurgical test work completed by SGS Lakefield in 2021. Graphite product split is estimated to be 32% plus 80 mesh (177 microns) and 68% less than 80 mesh (177 microns).

Mill tailings storage capacity has been identified to safely accommodate the life of mine production as described in this PEA. Mill tailings produced will be comingled or co-disposed with 50% of the mine waste rock in the central and southern portion and the balance of the waste rock will be stored predominantly in the northern section until after Year 9 of the operation in a co-disposal facility constructed northwest of the process plant.

The Co-Disposal Storage Facility perimeter containment berms will be constructed with waste rock from open pit mine development and will utilize downstream construction method to ensure safe tailings storage over the long-term. Run-off water and seepage from the Co-Disposal Storage Facility will be collected in an adjacent Water Management Ponds. Tailings production after Year 9 will be placed in the mined out EVN pit.

Capital and Operating Costs

The total pre-production capital cost for the La Loutre Project is estimated to be $236.1M including allowances for indirect costs and contingency of $41.4M and $36.1M respectively. Sustaining capital costs are estimated at $37.7M as shown in Table 8. Operating costs are estimated at $30.43 per tonne milled as per Table 9.

Table 8: Total Capital Costs

Cost Area Description

Initial Capital
Cost
(C$M)

Sustaining Capital
Cost (C$M)

Cost Area Description
(C$M)

Mining

$29.4

$24.1

$53.5

Processing

$79.1

-

$79.1

Infrastructure (and Co-Disposal)

$28.9

$13.7

$42.5

Off-site Infrastructure

$6.8


$6.80

Indirect Costs

$41.4

-

$41.4

Owner's Project Costs

$14.4

-

$14.4

Contingency

$36.1

-

$36.1

Closure Cost

-

-

$5.60

Total

$236.1

$37.7

$279.5

Table 9: Total Operating Costs

Cost Area

LOM
(C$M)

Annual Avg.
Cost (C$M)

Avg. LOM
(C$/t milled)

Avg. LOM
(US$/t Cg
conc.)

OPEX (%)

Total Mine Operating Costs
Including Reclaiming Costs

$354.5

$24.0

$16.20

$185.61

53%

Total Mill Processing Including
Water Treatment Costs

$259.2

$17.6

$11.85

$135.74

39%

Total G&A Costs

$51.8

$3.5

$2.37

$27.15

8 %

Total

$665.5

$45.1

$30.43

$348.50

100%

Graphite Production

Projected graphite concentrate production averages 97.4 kt/a per year over the 14.7 year LOM, peaking at 112kt in year 4.

Next Steps

The results of the PEA indicate that the proposed Project has technical and financial merit using the base case assumptions. It has also identified additional field work, metallurgical test work, trade-off studies and analysis required to support more advanced mining studies. The QPs consider the PEA results sufficiently reliable and recommend that the La Loutre Project be advanced to the next stage of development through the initiation of a PFS and working towards completion of an Environmental Impact Study for the Project while continuing to explore the geological potential of the La Loutre property.

PEA Details

The independent PEA was prepared by Ausenco and MMTS. These firms provided mineral resource estimates, design parameter and cost estimates for mine operations, process facilities, major equipment selection, waste and tailings storage, reclamation, permitting, and operating and capital expenditures. Table 10 summarizes the contributors and their area of responsibility.

Table 10: Consulting Firm and Area of Responsibility

Consulting Firm

Area of Responsibility

Ausenco Engineering
Canada Inc.

  • Process plant design.
  • Surface infrastructure design: including terracing, electrical and IT infrastructure design, buildings, utilities roads, and site water management.
  • Co-disposal facility design.
  • Surface infrastructure and process plant capital costs
  • Process plant operating costs.
  • Financial analysis and overall NI 43-101 integration.

Hemmera Envirochem Inc.
(An Ausenco Company)

  • Hydrogeology
  • Hydrology
  • Waste rock, tailings, and feed geochemical characterization.
  • Site wide water balance.
  • Groundwater quality input to environmental studies.
  • Environmental studies, permitting and closure costs.
  • Regulatory context, social considerations, and anticipated environmental
    regulatory compliance.

Metpro Management Inc.

  • Metallurgical test work development and analysis.

Moose Mountain Technical
Services

  • Historical data review.
  • Current and historical geology, exploration, drilling.
  • Sample preparation and QA/QC, and data verification.
  • Geological modelling and mineral resource estimate.
  • Mine and mine infrastructure design.
  • Mine production scheduling.
  • Mine capital costs and operating costs.

Qualified Person

All technical information, not pertaining to the PEA, in this news release has been reviewed and approved by Mike Petrina, P.Eng., who is a "qualified person" as defined by National Instrument 43-101 – Standards of Disclosure for Mineral Projects ("NI 43-101").

The PEA has been prepared by Ausenco. The contributors to the report are Qualified Persons (“QP”) under National Instrument 43-101 and are independent of Lomiko for the purposes of the NI 43-101. The technical content of the PEA and this press release has been reviewed and approved by:

Tommaso Roberto Raponi, P.Eng (PEO), Process and Infrastructure
Mohammed (Ali) A. Hooshiar Fard, P.Eng (EGBC), Tailings and Water Management
Greg Trout, P.Eng (APEGA), Mining
Sue Bird, P.Eng (EGBC), Resource Estimate
Scott Weston, P.Geo (EGBC), Environment
Oliver Peters, P.Eng (PEO), Metallurgical Testwork

Non-IFRS Financial Measures

The Company has included certain non-IFRS financial measures in this news release, such as Initial Capital Cost, Cash Operating Costs, Total Cash Cost, All-In Sustaining Cost, Expansion Capital and Capital Intensity, which are not measures recognized under IFRS and do not have a standardized meaning prescribed by IFRS.


Contacts

A. Paul Gill
604-729-5312
This email address is being protected from spambots. You need JavaScript enabled to view it.


Read full story here

KANSAS CITY, Mo.--(BUSINESS WIRE)--CorEnergy Infrastructure Trust, Inc. (NYSE: CORR, CORRPrA) ("CorEnergy" or the "Company") announced today that its Board of Directors declared a second quarter 2021 dividend of $0.05 per share for its common stock, consistent with the preceding quarter. The dividend is payable on August 31, 2021, to shareholders of record on August 17, 2021.


The Board of Directors also declared a cash dividend of $0.4609375 per depositary share for the Company’s 7.375% Series A Cumulative Redeemable Preferred Stock. The preferred stock dividend, which equates to an annual dividend payment of $1.84375 per depositary share, is payable on August 31, 2021, to shareholders of record on August 17, 2021.

Additionally, the Company's Board of Directors authorized the declaration of dividends on the Company's 4.00% Series B Redeemable Convertible Preferred Securities ("Series B Preferred") and shares of the Company's 9.00% Series C Exchangeable Preferred Securities ("Series C Preferred") as if they had been outstanding, in accordance with the terms of the Crimson Midstream Holdings, LLC Agreement.

About CorEnergy Infrastructure Trust, Inc.

CorEnergy Infrastructure Trust, Inc. (NYSE: CORR, CORRPrA) is a real estate investment trust that owns and operates or leases regulated natural gas transmission and distribution and crude oil gathering, storage and transmission pipelines and associated rights-of-way. For more information, please visit corenergy.reit.

Forward-Looking Statements

This press release contains certain statements that may include "forward-looking statements" within the meaning of Section 27A of the Securities Act of 1933 and Section 21E of the Securities Exchange Act of 1934. All statements, other than statements of historical fact, included herein are "forward-looking statements." Although CorEnergy believes that the expectations reflected in these forward-looking statements are reasonable, they do involve assumptions, risks and uncertainties, and these expectations may prove to be incorrect. Actual results could differ materially from those anticipated in these forward-looking statements as a result of a variety of factors, including those discussed in CorEnergy's reports that are filed with the Securities and Exchange Commission. You should not place undue reliance on these forward-looking statements, which speak only as of the date of this press release. Other than as required by law, CorEnergy does not assume a duty to update any forward-looking statement. In particular, any distribution paid in the future to our stockholders will depend on the actual performance of CorEnergy, its costs of leverage and other operating expenses and will be subject to the approval of CorEnergy's Board of Directors and compliance with leverage covenants.

Source: CorEnergy Infrastructure Trust, Inc.


Contacts

CorEnergy Infrastructure Trust, Inc.
Investor Relations
Debbie Hagen or Matt Kreps
877-699-CORR (2677)
This email address is being protected from spambots. You need JavaScript enabled to view it.

  • Sale of 16 million Technip Energies N.V. (“Technip Energies”) shares representing ca. 9% of Technip Energies’ issued and outstanding share capital through an accelerated bookbuild offering
  • Upon completion of the Placement, TechnipFMC plc (“TechnipFMC”) would retain a stake of ca. 22% of the issued and outstanding share capital of Technip Energies

LONDON & HOUSTON--(BUSINESS WIRE)--TechnipFMC plc (NYSE: FTI) (PARIS: FTI):


This press release is not an offer of securities for sale into the United States. The securities referred to herein have not been and will not be registered under the U.S. Securities Act of 1933, as amended, and may not be offered or sold in the United States, except pursuant to an applicable exemption from registration. No public offering of securities is being made in the United States.

This press release is for information purposes only and does not constitute an offer to sell or a solicitation of an offer to buy any securities and the offer of Technip Energies shares does not constitute a public offering other than to qualified investors in any jurisdiction, including in France.

TechnipFMC announces the sale of 16 million Technip Energies shares (the “Shares”), representing ca. 9% of Technip Energies’ issued and outstanding share capital, through a private placement by way of an accelerated bookbuild offering (the “Placement”). The sale price of the Shares in the Placement is set at €11.20 per Share, yielding total gross proceeds of €179.2 million.

Upon completion of the Placement, TechnipFMC retains a direct stake of ca. 22% of Technip Energies’ issued and outstanding share capital.

TechnipFMC has agreed to a 60-day lock-up for its remaining shares in Technip Energies, subject to waiver from the Joint Global Coordinators involved in the Placement and certain other customary exceptions, including transfer of shares to a subsidiary, granting and enforcement of security interests in connection with financing and derivative transactions and tender into any public tender offer for all or part of the shares.

The Placement was conducted without a public offering in any country and was open to eligible institutional investors.

Settlement for the Placement is expected to take place on or around August 3, 2021.

Important notices

This press release is for information purposes only and does not constitute an offer to sell or a solicitation of an offer to buy any securities and the offer of shares of Technip Energies (the “Shares”) by TechnipFMC does not constitute a public offering other than to qualified investors in any jurisdiction, including in France.

In member states of the European Economic Area, this communication and any offer if made subsequently is directed exclusively at persons who are “qualified investors” within the meaning of Article 2(e) of the Prospectus Regulation.

In the United Kingdom, any offer of the Shares will be made pursuant to an exemption under Regulation (EU) 2017/1129 as it forms part of domestic law by virtue of the European Union (Withdrawal) Act 2018 (the “UK Prospectus Regulation”) from a requirement to publish a prospectus for offers of Shares. This communication is for distribution in the United Kingdom only to (i) investment professionals falling within article 19(5) of the Financial Services and Markets Act 2000 (Financial Promotion) Order 2005 (the “Order”) or (ii) high net worth entities and other persons to whom it may lawfully be communicated, falling within article 49(2)(a) to (d) of the Order.

The Shares have not been and will not be registered under the U.S. Securities Act of 1933, as amended (the “Securities Act”), and may not be offered or sold, directly or indirectly, within the United States or to, or for the account or benefit of, US persons, absent registration or an exemption from, or in a transaction not subject to, the registration requirements of the Securities Act. There will be no public offer of the Shares in the United States or in any other jurisdiction. The Shares are being offered outside the United States in transactions that are not subject to the Securities Act pursuant to Regulation S under the Securities Act (“Regulation S”) to persons other than US persons (within the meaning of Regulation S) and in the United States to "qualified institutional buyers" (“QIBs”) pursuant to an exemption from, or in transactions not subject to, the registration requirements of the Securities Act.

In addition to the foregoing restrictions, the release, publication or distribution of this press release generally may be restricted by law in certain jurisdictions and persons into whose possession this document or other information referred to herein should inform themselves about and observe any such restriction. Any failure to comply with these restrictions may constitute a violation of the securities laws of any such jurisdiction.

The information contained in this announcement is for background purposes only and does not purport to be full or complete and no reliance may be placed by any person for any purpose on the information contained in this announcement or its accuracy, fairness or completeness. Any investment decision to buy Shares in the Placement must be made solely on the basis of publicly available information regarding Technip Energies. Such information is not the responsibility of TechnipFMC.

The Joint Global Coordinators are acting on behalf of TechnipFMC and no one else in connection with the Placement and will not be responsible to any other person for providing the protections afforded to any of its clients or for providing advice in relation to the Placement.

EACH PROSPECTIVE INVESTOR SHOULD PROCEED ON THE ASSUMPTION THAT IT MUST BEAR THE ECONOMIC RISK OF AN INVESTMENT IN THE SHARES. NEITHER TECHNIPFMC NOR THE JOINT GLOBAL COORDINATORS MAKES ANY REPRESENTATION AS TO (I) THE SUITABILITY OF THE SHARES FOR ANY PARTICULAR INVESTOR, (II) THE APPROPRIATE ACCOUNTING TREATMENT AND POTENTIAL TAX CONSEQUENCES OF INVESTING IN THE SHARES OR (III) THE FUTURE PERFORMANCE OF THE SHARES EITHER IN ABSOLUTE TERMS OR RELATIVE TO COMPETING INVESTMENTS.

The information contained in this press release is subject to change in its entirety without notice up to the settlement date. TechnipFMC, the Joint Global Coordinators and their respective affiliates expressly disclaim, to fullest extent permitted by applicable law, any obligation or undertaking to update, review or revise any statement contained in this press release whether as a result of new information, future developments or otherwise.

Important Information for Investors and Securityholders

Forward-Looking Statement

This release contains "forward-looking statements" as defined in Section 27A of the United States Securities Act of 1933, as amended, and Section 21E of the United States Securities Exchange Act of 1934, as amended. The words “believe”, “estimated” and other similar expressions are intended to identify forward-looking statements, which are generally not historical in nature. Such forward-looking statements involve significant risks, uncertainties and assumptions that could cause actual results to differ materially from our historical experience and our present expectations or projections. For information regarding known material factors that could cause actual results to differ from projected results, please see our risk factors set forth in our filings with the United States Securities and Exchange Commission, which include our Annual Reports on Form 10-K, Quarterly Reports on Form 10-Q, and Current Reports on Form 8-K. We caution you not to place undue reliance on any forward-looking statements, which speak only as of the date hereof. We undertake no obligation to publicly update or revise any of our forward-looking statements after the date they are made, whether as a result of new information, future events or otherwise, except to the extent required by law.

About TechnipFMC

TechnipFMC is a leading technology provider to the traditional and new energy industries, delivering fully integrated projects, products, and services.

With our proprietary technologies and comprehensive solutions, we are transforming our clients’ project economics, helping them unlock new possibilities to develop energy resources while reducing carbon intensity and supporting their energy transition ambitions.

Organized in two business segments — Subsea and Surface Technologies — we will continue to advance the industry with our pioneering integrated ecosystems (such as iEPCI™, iFEED™ and iComplete™), technology leadership and digital innovation.

Each of our approximately 20,000 employees is driven by a commitment to our clients’ success, and a culture of strong execution, purposeful innovation, and challenging industry conventions.

TechnipFMC uses its website as a channel of distribution of material company information. To learn more about how we are driving change in the industry, go to www.TechnipFMC.com and follow us on Twitter @TechnipFMC.

Category: UK regulatory


Contacts

Investor relations
Matt Seinsheimer
Vice President, Investor Relations
Tel: +1 281 260 3665
Email: This email address is being protected from spambots. You need JavaScript enabled to view it.

James Davis
Senior Manager, Investor Relations
Tel: +1 281 260 3665
Email: This email address is being protected from spambots. You need JavaScript enabled to view it.

Media relations
Nicola Cameron
Vice President, Corporate Communications
Tel: +44 1383 742297
Email: This email address is being protected from spambots. You need JavaScript enabled to view it.

Catie Tuley
Director, Public Relations
Tel: +1 281 591 5405
Email: This email address is being protected from spambots. You need JavaScript enabled to view it.

LIBERTY LAKE, Wash.--(BUSINESS WIRE)--Itron, Inc. (NASDAQ: ITRI), which is innovating the way utilities and cities manage energy and water, announced today that Tom Deitrich, Itron’s president and chief executive officer, and Joan Hooper, Itron’s senior vice president and chief financial officer, will present at Oppenheimer’s 24th Annual Technology, Internet and Communications conference on Tuesday, Aug. 10, 2021 at 1:15 p.m. EDT. In addition, Deitrich and Hooper will present at Canaccord Genuity’s 41st Annual Growth Conference on Wednesday, Aug. 11, 2021 at 1:30 p.m. EDT.


The investor presentation and live webcasts of both events will be accessible on Itron’s Investor Relations website. A replay of each webcast will be available for 30 days following the events.

About Itron

Itron enables utilities and cities to safely, securely and reliably deliver critical infrastructure solutions to communities in more than 100 countries. Our portfolio of smart networks, software, services, meters and sensors helps our customers better manage electricity, gas and water resources for the people they serve. By working with our customers to ensure their success, we help improve the quality of life, ensure the safety and promote the well-being of millions of people around the globe. Itron is dedicated to creating a more resourceful world. Join us: www.itron.com.

Itron® is a registered trademark of Itron, Inc. All third-party trademarks are property of their respective owners and any usage herein does not suggest or imply any relationship between Itron and the third party unless expressly stated.

Cautionary Note Regarding Forward Looking Statements

This release contains, and our officers and representatives may from time to time make, "forward-looking statements" within the meaning of the safe harbor provisions of the U.S. Private Securities Litigation Reform Act of 1995. Forward-looking statements are neither historical factors nor assurances of future performance. These statements are based on our expectations about, among others, revenues, operations, financial performance, earnings, liquidity, earnings per share, cash flows and restructuring activities including headcount reductions and other cost savings initiatives. This document reflects our current strategy, plans and expectations and is based on information currently available as of the date of this release. When we use words such as "expect", "intend", "anticipate", "believe", "plan", "goal", "seek", "project", "estimate", "future", "strategy", "objective", "may", "likely", "should", "will", "will continue", and similar expressions, including related to future periods, they are intended to identify forward-looking statements. Forward-looking statements rely on a number of assumptions and estimates. Although we believe the estimates and assumptions upon which these forward-looking statements are based are reasonable, any of these estimates or assumptions could prove to be inaccurate and the forward-looking statements based on these estimates and assumptions could be incorrect. Our operations involve risks and uncertainties, many of which are outside our control, and any one of which, or a combination of which, could materially affect our results of operations and whether the forward-looking statements ultimately prove to be correct. Actual results and trends in the future may differ materially from those suggested or implied by the forward-looking statements depending on a variety of factors. Therefore, you should not rely on any of these forward-looking statements. Some of the factors that we believe could affect our results include our ability to execute on our restructuring plan, our ability to achieve estimated cost savings, the rate and timing of customer demand for our products, rescheduling of current customer orders, changes in estimated liabilities for product warranties, adverse impacts of litigation, changes in laws and regulations, our dependence on new product development and intellectual property, future acquisitions, changes in estimates for stock-based and bonus compensation, increasing volatility in foreign exchange rates, international business risks, uncertainties caused by adverse economic conditions, including, without limitation those resulting from extraordinary events or circumstances such as the COVID-19 pandemic and other factors that are more fully described in Part I, Item 1A: Risk Factors included in our 2020 Annual Report and other reports on file with the SEC. We undertake no obligation to update or revise any forward-looking statement, whether written or oral.

The impact caused by the ongoing COVID-19 pandemic includes uncertainty as to the duration, spread, severity, and any resurgence of the COVID-19 pandemic including other factors contributing to infection rates, such as reinfection or mutation of the virus, the effectiveness or widespread availability and application of vaccines, the duration and scope of related government orders and restrictions, impact on overall demand, impact on our customers’ businesses and workforce levels, disruptions of our business and operations, including the impact on our employees, limitations on, or closures of, our facilities, or the business and operations of our customers or suppliers. Our estimates and statements regarding the impact of COVID-19 are made in good faith to provide insight to our current and future operating and financial environment and any of these may materially change due to factors outside our control. For more information on risks associated with the COVID-19 pandemic, please see our risk in Part I, Item 1A: Risk Factors in our 2020 Annual Report.


Contacts

Itron, Inc.
Kenneth P. Gianella
Vice President, Investor Relations
(669) 770-4643

David Means
Director, Investor Relations
(737) 242-8448

Rebecca Hussey
Manager, Investor Relations
(509) 891-3574

HOUSTON--(BUSINESS WIRE)--Ranger Energy Services, Inc. (NYSE: RNGR) (“Ranger” or the “Company”) announced today its results for its fiscal quarter ended June 30, 2021.


– Completed Patriot and PerfX (Q3) acquisitions; significantly expanding wireline scale and scope

– 31% sequential growth in revenue with increases across all segments

– High Spec Rig segment posted recent high levels of both revenue and margin

Consolidated Financial Highlights

Quarterly revenues of $50.0 million increased $11.7 million, or 31%, from $38.3 million in Q1. Revenue increases took place across all reporting segments.

Net loss of $9.1 million increased $0.8 million, from a net loss of $8.3 million in Q1. The increase in net loss was largely driven by decreased gross profits related to the Completions and Processing Solutions segments, coupled with increased general and administrative expenses driven by transaction related expenses and absence of Q1’s 401k match forfeiture.

Adjusted EBITDA(1) of $2.0 million increased $2.2 million from a loss of $0.2 million in Q1. The current quarter’s EBITDA of $2.0 million is inclusive of $1.0 million of make-ready expenses for rigs associated with deployments for our highest tier customers.

CEO Comments

Bill Austin, the Company’s interim CEO and chairman, stated “Strategically and operationally, the second quarter was pivotal for Ranger. Our High Spec Rig segment delivered strong sequential revenue growth along with margin performance which equaled historic peaks. Given the momentum build across Q2, we are expecting additional revenue and margin gains in the third and fourth quarters.

Our wireline business saw some modest revenue growth in Q2. However, margin performance continues to underperform in the face of industry-wide, low completion pricing levels. Strategically, we executed on two acquisitions, Patriot Well Solutions and more recently PerfX Wireline Services (Q3), expanding our wireline fleet with additional newer high-quality equipment broadening our geographic footprint and strengthening our service offerings. We are currently in the process of integrating these companies into our existing business and have already experienced cost synergies and early cross-selling successes.

Going forward, as our results begin to reflect the positive impacts of these first two acquisitions, we expect to gain further market acknowledgement that Ranger’s combination of efficient, low cost overhead structure, cash flow focused operations and a clean balance sheet is the right platform to pursue further industry consolidation.”

Business Segment Financial Results

High Specification Rigs

High Specification Rigs segment revenue increased by $7.3 million to $29.0 million in Q2 from $21.7 million Q1 2021. The rig hours increased to 50,100 hours in Q2 from 43,200 hours in Q1. The increase in rig hours was accompanied by an increase of $94, or 19%, in the hourly average rig rate to $587 in Q2 from $493 in Q1.

Operating income increased by $2.4 million to $0.3 million in Q2 from a loss of $2.1 million in Q1. Adjusted EBITDA increased 85%, or $2.3 million, to $5.0 million in Q2 from $2.7 million in Q1. The increase in operating income and Adjusted EBITDA was attributable to an increase in gross profit margins.

Completion and Other Services

Completion and Other Services segment revenue increased by $4.3 million to $19.8 million in Q2 from $15.5 million in Q1 2021. The increase was primarily attributable to the wireline business, which includes a partial quarter of Patriot revenue of $2.3 million.

Operating loss increased $0.6 million to a loss of $1.9 million in Q2 from a loss of $1.3 million in Q1. Adjusted EBITDA decreased 33%, or $0.3 million, to $0.6 million in Q2 from $0.9 million in Q1. The increase in operating loss and decrease in Adjusted EBITDA was driven by decreased profit margins primarily attributable to our wireline business, coupled with increased depreciation expense.

Processing Solutions

Processing Solutions segment revenue increased by $0.1 million to $1.2 million in Q2 and $1.1 million in Q1 2021. The increase in revenue was due to an increase in other rental services.

Operating loss increased $0.4 million to a loss of $0.4 million in Q2 from a breakeven point in Q1. Adjusted EBITDA decreased 50%, or $0.3 million, to $0.3 million in Q2 from $0.6 million in Q1. The increase in operating loss and decrease in Adjusted EBITDA was driven by decreased gross profit margins.

Liquidity

We ended the quarter with $16.2 million of liquidity, consisting of $12.8 million of capacity available on our revolving credit facility and $3.4 million of cash. The Q2 cash ending balance of $3.4 million compares to $1.5 million at the end of Q1 2021.

Debt

We ended Q2 with aggregate net debt of $39.9 million, an increase of $10.1 million, as compared to $29.8 million at the end of Q1. This increase is related to the sale and leaseback of operational support facilities.

We ended Q2 with aggregate adjusted net debt(1) of $27.0 million, a decrease of $2.8 million, as compared to $29.8 million at the end of Q1.

We had an outstanding balance on our revolving credit facility of $9.7 million at the end of Q2 compared to $8.6 million at the end of Q1. During the quarter, we borrowed $14.2 million under the credit facility, which was partially offset by aggregate payments of $13.1 million on the principal balance.

We had an outstanding balance on our term debt of $15.2 million at the end of Q1 and we made aggregate payments of $2.5 million during Q2, leaving a principal balance of $12.7 million at the end of Q2.

Conference Call

The Company will host a conference call to discuss its Q2 2021 results on July 30, 2021 at 9:00 a.m. Central Time (10:00 a.m. Eastern Time). To join the conference call from within the United States, participants may dial 1-833-255-2829. To join the conference call from outside of the United States, participants may dial 1-412-902-6710. When instructed, please ask the operator to join the Ranger Energy Services, Inc. call. Participants are encouraged to login to the webcast or dial in to the conference call approximately ten minutes prior to the start time. To listen via live webcast, please visit the Investor Relations section of the Company’s website, http://www.rangerenergy.com.

An audio replay of the conference call will be available shortly after the conclusion of the call and will remain available for approximately seven days. It can be accessed by dialing 1-877-344-7529 within the United States or 1-412-317-0088 outside of the United States. The conference call replay access code is 10157952. The replay will also be available in the Investor Resources section of the Company’s website shortly after the conclusion of the call and will remain available for approximately seven days.

About Ranger Energy Services, Inc.

Ranger is an independent provider of well service rigs and associated services in the United States, with a focus on unconventional horizontal well completion and production operations. Ranger also provides services necessary to bring and maintain a well on production. The Processing Solutions segment engages in the rental, installation, commissioning, start-up, operation and maintenance of MRUs, Natural Gas Liquid stabilizer and storage units and related equipment.

Cautionary Statement Concerning Forward-Looking Statements

Certain statements contained in this press release constitute “forward-looking statements” within the meaning of Section 27A of the Securities Act of 1933 and Section 21E of the Securities Exchange Act of 1934. These forward-looking statements represent Ranger’s expectations or beliefs concerning future events, and it is possible that the results described in this press release will not be achieved. These forward-looking statements are subject to risks, uncertainties and other factors, many of which are outside of Ranger’s control that could cause actual results to differ materially from the results discussed in the forward-looking statements.

Any forward-looking statement speaks only as of the date on which it is made, and, except as required by law, Ranger does not undertake any obligation to update or revise any forward-looking statement, whether as a result of new information, future events or otherwise. New factors emerge from time to time, and it is not possible for Ranger to predict all such factors. When considering these forward-looking statements, you should keep in mind the risk factors and other cautionary statements in our filings with the Securities and Exchange Commission. The risk factors and other factors noted in Ranger’s filings with the SEC could cause its actual results to differ materially from those contained in any forward-looking statement.

(1) Adjusted EBITDA” and “Adjusted Net Debt” are not presented in accordance with generally accepted accounting principles in the United States (“U.S. GAAP”). A Non-GAAP supporting schedule is included with the statements and schedules attached to this press release and can also be found on the Company's website at: www.rangerenergy.com.

RANGER ENERGY SERVICES, INC.

UNAUDITED CONDENSED CONSOLIDATED STATEMENTS OF OPERATIONS

(in millions, except share and per share amounts)


Three Months Ended


June 30, 2021


March 31, 2021

Revenues


High specification rigs


$

29.0


$

21.7


Completion and other services


19.8


15.5


Processing solutions


1.2


1.1


Total revenues


50.0


38.3


Operating expenses


Cost of services (exclusive of depreciation and amortization):


High specification rigs


24.0


19.0


Completion and other services


19.2


14.6


Processing solutions


0.9


0.5


Total cost of services


44.1


34.1


General and administrative


6.2


3.5


Depreciation and amortization


8.2


8.0


Total operating expenses


58.5


45.6


Operating loss


(8.5

)


(7.3

)


Other expenses


Interest expense, net


0.7


0.6


Total other expenses


0.7


0.6


Loss before income tax expense


(9.2

)


(7.9

)

Tax (benefit) expense


(0.1

)


0.4


Net loss


(9.1

)


(8.3

)

Less: Net loss attributable to non-controlling interests


(3.5

)


(3.7

)

Net loss attributable to Ranger Energy Services, Inc.


$

(5.6

)


$

(4.6

)


Loss per common share


Basic


$

(0.59

)


$

(0.54

)

Diluted


$

(0.59

)


$

(0.54

)

Weighted average common shares outstanding


Basic


9,523,127


8,581,642


Diluted


9,523,127


8,581,642


RANGER ENERGY SERVICES, INC.

UNAUDITED CONDENSED CONSOLIDATED BALANCE SHEETS

(in millions, except share and per share amounts)


June 30, 2021


December 31, 2020

Assets


Cash and cash equivalents


$

3.4


$

2.8


Accounts receivable, net


35.5


25.9


Contract assets


3.0


1.1


Inventory


2.7


2.3


Prepaid expenses


6.1


3.6


Total current assets


50.7


35.7


Property and equipment, net


182.6


189.4


Goodwill


1.8


Intangible assets, net


8.1


8.5


Operating leases, right-of-use assets


6.3


5.8


Other assets


1.0


1.2


Total assets


$

250.5


$

240.6


Liabilities and Stockholders' Equity


Accounts payable


13.5


10.5


Accrued expenses


9.9


9.3


Other financing liability, current portion


2.6


Long-term debt, current portion


10.4


10.0


Other current liabilities


3.9


3.2


Total current liabilities


40.3


33.0


Operating leases, right-of-use obligations


5.0


5.2


Other financing liability


13.4


Long-term debt, net


12.5


14.5


Other long-term liabilities


3.1


3.1


Total liabilities


$

74.3


$

55.8


Commitments and contingencies


Stockholders' equity


Preferred stock, $0.01 per share; 50,000,000 shares authorized; no shares issued or outstanding as of March 31, 2021 and December 31, 2020


Class A Common Stock, $0.01 par value, 100,000,000 shares authorized; 10,682,388 shares issued and 10,130,560 shares outstanding as of June 30, 2021; 9,093,743 shares issued and 8,541,915 shares outstanding as of December 31, 2020


0.1


0.1


Class B Common Stock, $0.01 par value, 100,000,000 shares authorized; 6,866,154 shares issued and outstanding as of June 30, 2021 and December 31, 2020


0.1


0.1


Less: Class A Common Stock held in treasury, at cost; 551,828 treasury shares as of June 30, 2021 and December 31, 2020


(3.8

)


(3.8

)

Accumulated deficit


(28.6

)


(18.4

)

Additional paid-in capital


139.5


123.9


Total controlling stockholders' equity


107.3


101.9


Noncontrolling interest


68.9


82.9


Total stockholders' equity


176.2


184.8


Total liabilities and stockholders' equity


$

250.5


$

240.6


RANGER ENERGY SERVICES, INC.

UNAUDITED CONDENSED CONSOLIDATED STATEMENT OF CASH FLOWS

(in millions)


Period Ended


June 30, 2021

Cash Flows from Operating Activities


Net loss


$

(17.4

)

Adjustments to reconcile net loss to net cash used in operating activities:


Depreciation and amortization


16.2


Equity based compensation


1.8


Gain on sale of property and equipment


Other costs, net


1.1


Changes in operating assets and liabilities


Accounts receivable


(6.8

)

Contract assets


(1.9

)

Inventory


0.4


Prepaid expenses


(1.0

)

Other assets


0.8


Accounts payable


2.4


Accrued expenses


0.7


Operating lease, right-of-use obligation


(0.5

)

Other long-term liabilities


0.1


Net cash used in operating activities


(4.1

)


Cash Flows from Investing Activities


Purchase of property and equipment


(1.8

)

Proceeds from disposal of property and equipment


0.4


Purchase of business, net of cash received


(3.5

)

Net cash used in investing activities


(4.9

)


Cash Flows from Financing Activities


Borrowings under Credit Facility


20.6


Principal payments on Credit Facility


(18.4

)

Principal payments on Encina Master Financing Agreement


(5.0

)

Principal payments on Installment Purchases


(0.3

)

Proceeds from financing of sale-leasebacks


15.6


Principal payments on financing lease obligations


(2.2

)

Shares withheld on equity transactions


(0.7

)

Net cash provided by financing activities


9.6


Decrease in Cash and Cash equivalents


0.6


Cash and Cash Equivalents, Beginning of Year


2.8


Cash and Cash Equivalents, End of Year


$

3.4


Supplemental Cash Flows Information


Interest paid


$

0.9


Supplemental Disclosure of Non-cash Investing and Financing Activity


Capital expenditures


$

(1.1

)

Additions to fixed assets through financing leases


$

(0.7

)

Issuance of Class A Common Stock for acquisition


$

(7.7

)

RANGER ENERGY SERVICES, INC.
SUPPLEMENTAL NON-GAAP FINANCIAL MEASURES
(UNAUDITED)

The Company utilizes certain non-GAAP financial measures that management believes to be insightful in understanding the Company’s financial results. These financial measures, which include Adjusted EBITDA and Adjusted Net Debt, should not be construed as being more important than, or as an alternative for, comparable U.S. GAAP financial measures. Detailed reconciliations of these Non-GAAP financial measures to comparable U.S. GAAP financial measures have been included below and are available in the Investor Relations sections of our website at www.rangerenergy.com. Our presentation of Adjusted EBITDA and Adjusted Net Debt should not be construed as an indication that our results will be unaffected by the items excluded from the reconciliations. Our computations of these Non-GAAP financial measures may not be identical to other similarly titled measures of other companies.

Adjusted EBITDA

We believe Adjusted EBITDA is a useful performance measure because it allows for an effective evaluation of our operating performance when compared to our peers, without regard to our financing methods or capital structure. We exclude the items listed above from net income or loss in arriving at Adjusted EBITDA because these amounts can vary substantially within our industry depending upon accounting methods, book values of assets, capital structures and the method by which the assets were acquired. Certain items excluded from Adjusted EBITDA are significant components in understanding and assessing a company’s financial performance, such as a company’s cost of capital and tax structure, as well as the historic costs of depreciable assets, none of which are reflected in Adjusted EBITDA.

We define Adjusted EBITDA as net income or loss before net interest expense, income tax provision or benefit, depreciation and amortization, equity-based compensation, acquisition-related, severance and reorganization costs, gain or loss on disposal of assets, and certain other non-cash and certain items that we do not view as indicative of our ongoing performance.

The following tables are a reconciliation of net income or loss to Adjusted EBITDA for the three months ended June 30, 2021 and March 31, 2021, in millions:


Three Months Ended June 30, 2021


High
Specification
Rigs


Completion
and Other
Services


Processing
Solutions


Other


Total


(in millions)

Net income (loss)


$

0.3


$

(1.9

)


$

(0.4

)


$

(7.1

)


$

(9.1

)

Interest expense, net


0.7


0.7


Tax expense


(0.1

)


(0.1

)

Depreciation and amortization


4.7


2.5


0.7


0.3


8.2


EBITDA


5.0


0.6


0.3


(6.2

)


(0.3

)

Equity based compensation


0.9


0.9


(Gain) loss on disposal of property and equipment


0.5


0.5


Severance and reorganization costs


0.3


0.3


Acquisition related costs


0.6


0.6


Adjusted EBITDA


$

5.0


$

0.6


$

0.3


$

(3.9

)


$

2.0


Three Months Ended March 31, 2021


High
Specification
Rigs


Completion
and Other
Services


Processing
Solutions


Other


Total


(in millions)

Net income (loss)


$

(2.1

)


$

(1.3

)


$


$

(4.9

)


$

(8.3

)

Interest expense, net


0.6


0.6


Tax expense


0.4


0.4


Depreciation and amortization


4.8


2.2


0.6


0.4


8.0


EBITDA


2.7


0.9


0.6


(3.5

)


0.7


Equity based compensation


0.9


0.9


(Gain) loss on disposal of property and equipment


(0.4

)


(0.4

)

Severance and reorganization costs


(1.4

)


(1.4

)

Acquisition related costs


Adjusted EBITDA


$

2.7


$

0.9


$

0.6


$

(4.4

)


$

(0.2

)


Net Debt and Adjusted Net Debt

We believe Net Debt and Adjusted Net Debt are useful performance measures of liquidity, financial health and provides an indication of our leverage. We define Net Debt as current and long-term debt, finance leases, other financing obligations, offset by cash and cash equivalents. We define Adjusted Net Debt as Net Debt, less a facility financing lease, to  be analogous to the calculation of  certain financial covenants. All debt and other obligations present the principal balances outstanding as of the respective periods.

The following tables are a reconciliation of consolidated debt and cash and cash equivalents to Net Debt and Adjusted Net Debt as of June 30, 2021 and March 31, 2021:


June 30,
2021


March 31,
2021


Change


(in millions)

Debt and Other Obligations


Credit facility


$

9.7


$

8.6


$

1.1


Encina Master Financing Agreement


12.7


15.2


(2.5)


Finance lease obligations


3.9


3.2


0.7


Other financing liabilities


16.0


3.5


12.5


Installment purchases


1.0


0.8


0.2


Less: Cash and cash equivalents


3.4


1.5


1.9


Net Debt


39.9


29.8


10.1


Less: Facility financing lease


12.9


12.9


Adjusted Net Debt


$

27.0


$

29.8


$

(2.8)


Contacts

J. Brandon Blossman
Chief Financial Officer
(713) 935-8900
This email address is being protected from spambots. You need JavaScript enabled to view it.

VERNAL, Utah--(BUSINESS WIRE)--Superior Drilling Products, Inc. (NYSE American: SDPI) (“SDP” or “Company”), a designer and manufacturer of drilling tool technologies, today announced that it will release its second quarter 2021 financial results before the opening of financial markets on Friday, August 13, 2021.


The Company will host a conference call and webcast that day to review the financial and operating results for the quarter and discuss its corporate strategy and outlook. A question-and-answer session will follow.

Second Quarter 2021 Conference Call

Friday, August 13, 2021
10:00 a.m. Mountain Time (12:00 p.m. Eastern Time)
Phone: (201) 689-8470
Internet Webcast and accompanying slide presentation: www.sdpi.com

A telephonic replay will be available from 1:00 p.m. MT (3:00 p.m. ET) the day of the teleconference until Friday, August 20, 2021. To listen to the archived call, dial (412) 317-6671 and enter conference ID number 13721241, or access the webcast replay via the Company’s website at www.sdpi.com, where a transcript will be posted once available.

About Superior Drilling Products, Inc.

Superior Drilling Products, Inc. is an innovative, cutting-edge drilling tool technology company providing cost saving solutions that drive production efficiencies for the oil and natural gas drilling industry. The Company designs, manufactures, repairs and sells drilling tools. SDP drilling solutions include the patented Drill-N-Ream® well bore conditioning tool and the patented Strider™ oscillation system technology. In addition, SDP is a manufacturer and refurbisher of PDC (polycrystalline diamond compact) drill bits for a leading oil field service company. SDP operates a state-of-the-art drill tool fabrication facility, where it manufactures its solutions for the drilling industry, as well as customers’ custom products. The Company’s strategy for growth is to leverage its expertise in drill tool technology and innovative, precision machining in order to broaden its product offerings and solutions for the oil and gas industry.

Additional information about the Company can be found at: www.sdpi.com.


Contacts

For more information, contact investor relations:
Deborah K. Pawlowski
Kei Advisors LLC
(716) 843-3908
This email address is being protected from spambots. You need JavaScript enabled to view it.

Proprietary Camelina Renewable Diesel Feedstock Continues to Outperform Expectations Even Under Montana’s Recent Severe Drought Conditions

TORRANCE, Calif.--(BUSINESS WIRE)--Global Clean Energy Holdings, Inc. (OTCQX: GCEH), a fully integrated renewable fuels company, provides a mid-year corporate update of the first half of 2021. Additional financial information will be provided in the June 30, 2021 Quarterly Report on Form 10-Q.


First half-year achievements, financial status and corporate updates include the following:

Financial – As of June 30, 2021

We are finalizing our results for the three months ended June 30, 2021. We present below certain preliminary results representing our estimates for this period, which are based only on currently available information and do not present all necessary information for an understanding of our financial condition as of June 30, 2021 or our results of operations for the three months ended June 30, 2021. We have provided ranges, rather than specific amounts, for the preliminary estimates for the unaudited financial data described below primarily because our financial closing procedures for the three months ended June 30, 2021 are not yet complete and, as a result, our final results upon completion of our closing procedures may vary from these preliminary estimates. Management prepared these estimates in good faith based upon the most recent information available to us from our internal reporting systems as of the date of this release.

  • As a pre-revenue company engaged in the construction of our biorefinery in Bakersfield, California and the development of its Camelina renewable diesel feedstock operations, net loss for the second quarter is in line with expectations between $12 and $15 million.
  • GCEH had approximately $65 million of cash and deposits (advances), of which approximately $46 million, when spent, will be recorded as long-term assets. These amounts are expected to be spent this year on the construction of the Bakersfield biorefinery.
  • GCEH has drawn approximately $245 million of the $385 million credit available under its Senior and Mezzanine Credit Facilities, of which approximately $205 million has been incurred as of June 30, 2021 for the purchase and retooling of the refinery, operational cost, general and administrative expenses, and interest payments.

Corporate

  • Effective July 23, 2021, GCEH appointed Phyllis Currie and Susan Anhalt to its Board of Directors. Ms. Currie has over three decades of experience as an executive in energy, including as General Manager of the Pasadena, California Water and Power Department (PWP) and as Chief Financial Officer of the Los Angeles Department of Water and Power (LADWP). Ms. Anhalt has significant experience as a corporate and securities lawyer with SmallCap public growth companies.
  • In April 2021, GCEH appointed Jerald Feitelson, Ph.D. as the company’s Vice President and Chief Scientific Officer.
  • In April 2021, GCEH acquired Agribody Technologies, Inc., an emerging agricultural biotechnology company that owns 15 issued U.S. patents related to increasing yield and sustainability traits of Camelina and other crops. Agribody Technologies was purchased in an all stock transaction valued at $5 million (830,526 shares of GCEH common stock were issued at $6.02 per share in an exempt transaction).
  • Also in April 2021, Agribody Technologies was issued a new key utility patent with broad claims for genome editing specific mutations in a critical gene present in all plants, including Camelina to confer higher yield, tolerance to stress and longer shelf life.
  • During the second quarter, all of the issued and outstanding shares of Series B Convertible Preferred Stock were converted into 1,181,819 shares of GCEH common stock. As of June 30, 2021, GCEH had outstanding a total of 40,061,714 shares of common stock, and no shares of preferred stock.
  • GCEH raised $3.1 million through the private sale of its common stock to three investors at a price of $6.25 per share.
  • GCEH has extended, to September 15, 2021, the date by which it agreed to fund an additional $35 million construction contingency reserve for the Bakersfield biorefinery.

Camelina Feedstock Development

As of June 30, 2021, GCEH, through its wholly owned subsidiary Sustainable Oils, Inc., has produced sufficient planting seed of its proprietary Camelina varieties to plant over 275,000 acres of Camelina for the production of Camelina oil as a feedstock for renewable diesel.

GCEH also announced that earlier this year its SO-50 patented Camelina seed variety was planted in commercial quantities with more than 50 large farmers in six states including Montana, Oregon, Washington, Idaho, Kansas and Colorado. In Montana, which has been experiencing a severe drought, those acres are now yielding a viable Camelina crop where many other staple crops in Montana (such as wheat, lentils, peas) have failed to survive under the higher-than-normal temperatures and severe drought conditions. Mike Karst, Vice President of Sustainable Oils, stated, “Our growers in Montana have had to deal with an extreme weather situation thus far this year. However, we have not lost any Camelina fields to the drought, and while the Camelina yields may average somewhat below normal year expectations, we are demonstrating to our growers and the agricultural community the highly drought-tolerance, sturdiness and overall economic viability of our Camelina varieties.”

On a recent farmer field day sponsored by Sustainable Oils and ExxonMobil, local growers were introduced to our six newest (patent pending) varieties, which produce higher yields and/or have enhanced agronomic flexibility. Local farmer Shawn Preputin (who planted over 600 acres of Camelina) commented, “If this still produces a decent crop on a struggle year, that makes it a viable crop going forward, because you just never know when you’re going to have a drought year.” Similarly, Wade Bitz (a first time Camelina farmer) told Mr. Karst, “Camelina seems to have held up a lot better than our other crops. It utilizes the moisture more efficiently.” Finally, Lance Lindbloom, Agronomy Coach at 406 Agronomy, said, “Not only have we had the low moisture, but we’ve had extreme heat. Where some of our lentil crops and other crops have really shut down, this Camelina has kept growing.”

Richard Palmer, CEO and founder of GCEH, remarked, “From inception, the goal of the company has been to develop sustainable, nonfood-based oil crops that do not compete for scarce water resources and can contribute to food security by relieving pressure on food-grade oil feedstocks for biofuels. Camelina meets that goal as it is a short cycle dryland crop grown on fallow land. Unlike primary crops, it requires comparatively fewer inputs, which significantly lowers the carbon intensity of the grain, oil and ultimately the biofuel. GCEH continues to devote resources to building a strong intellectual property position and our recent acquisition of Agribody Technologies adds numerous patents and technical knowledge to our expanding portfolio. Our years of investment in improving the crop is now being witnessed first-hand by our growers in several states, and we believe this positions the company for significant expansion of Camelina acreage over the next several years. Additionally, we expect to begin developing our midstream grain aggregation centers later this year, which will allow us to handle the expected increased volumes of grain in 2022 and beyond.”

About Global Clean Energy Holdings

Global Clean Energy Holdings, Inc. (“GCEH”) is a uniquely positioned vertically integrated renewable fuels company. Our strategy has been consistent from the inception of our business: control the full integration of our entire supply chain from the development, production and processing of feedstocks through to the refining and distribution of renewable fuels. GCEH’s wholly owned plant science subsidiary, Sustainable Oils, Inc., owns an industry leading portfolio of intellectual property rights, including patents and production know-how, to produce its proprietary varieties of Camelina sativa as a nonfood based ultra-low carbon biofuels feedstock. GCEH is retooling and constructing its renewable diesel refinery in Bakersfield, California, which when completed in early 2022 will be the largest renewable fuels facility in the western United States and the largest in the country that produces renewable fuels from nonfood based feedstocks. More information can be found online at www.gceholdings.com.

Forward-Looking Statements

Certain matters discussed in this press release are “forward-looking statements” of Global Clean Energy Holdings, Inc. (hereinafter referred to as “we,” “us,” or “our”) within the meaning of the Private Securities Litigation Reform Act of 1995 (the “PSLRA”). All such written or oral statements made in this press release, other than statements of historical fact, are forward-looking statements and are intended to be covered by the safe harbor for forward-looking statements provided by the PSLRA. Without limiting the foregoing, we may, in some cases, use terms such as “predicts,” “believes,” “potential,” “continue,” “estimates,” “anticipates,” “expects,” “plans,” “intends,” “forecast,” “guidance,” “outlook,” “may,” “could,” “might,” “will,” “should” or other words that convey uncertainty of future events or outcomes and are intended to identify forward-looking statements. Forward-looking statements are based on assumptions and assessments made in light of management’s experience and perception of historical trends, current conditions, expected future developments and other factors believed to be appropriate. Forward-looking statements in this press release are made as of the date of this press release, and we undertake no duty to update or revise any such statements, whether as a result of new information, future events or otherwise. Forward-looking statements are not guarantees of future performance and are subject to risks, uncertainties and other factors, many of which are outside of our control, that may cause actual results, levels of activity, performance, achievements and developments to be materially different from those expressed in or implied by these forward-looking statements. Important factors that could cause actual results, developments and business decisions to differ materially from forward-looking statements are described in the sections titled “Risk Factors” in our filings with the Securities and Exchange Commission, including our most recent Annual Report on Form 10-K and Quarterly Reports on Form 10-Q, and include, but are not limited to, the following substantial known and unknown risks and uncertainties inherent in our business: the effects of the COVID-19 pandemic; risks related to the timing of and our ability to successfully complete the retooling and development of our Bakersfield, California biorefinery; the risk that unanticipated construction and development expenses may increase our estimated capital requirements; the risk that the future cost of producing, aggregating, delivering and processing Camelina feedstock may differ from our expectations; the risk that we may not be able to cultivate Camelina in anticipated amounts; the risk that we will not achieve the anticipated low carbon intensity scores of our products; risk related to our ability to operate our Bakersfield, California biorefinery; risks related to the availability of the capital we will need to expand our refinery and our related Camelina operations; our dependence on certain contractual relationships, including our off-take agreement with ExxonMobil Corporation; and other factors, including general economic conditions and regulatory developments, not within our control.


Contacts

Communications Contact
Natalie Findlay
(424) 318-3518
This email address is being protected from spambots. You need JavaScript enabled to view it.

MIAMI--(BUSINESS WIRE)--World Fuel Services Corporation (NYSE: INT)


Second-Quarter 2021 Highlights

  • Total gross profit of $183.9 million, down 14% year-over-year
  • GAAP net income of $17.6 million, or $0.28 per diluted share
  • Adjusted net income of $25.0 million, or $0.39 per diluted share
  • Adjusted EBITDA of $59.8 million

“As travel and economic activity continue to recover, we have seen volumes improve across our businesses and are optimistic about increasing demand for the balance of the year,” stated Michael J. Kasbar, chairman and chief executive officer of World Fuel Services Corporation. “We have also been positioning ourselves to best serve the needs of our customers as they navigate the ongoing evolution of energy consumption.”

For the second quarter, our aviation segment generated gross profit of $87.4 million, a decrease of 5% year-over-year, principally driven by a reduction in our government-related activity in Afghanistan and lower average margins as a result of returning to a more normalized core business mix. Our marine segment generated gross profit of $22.7 million, a decrease of 39% year-over-year, principally attributable to lower profitability as compared to the second quarter of 2020, which benefited from volatility arising from the implementation of the IMO 2020 regulations, as well as competitive market conditions and limited price volatility. Our land segment generated gross profit of $73.8 million, a decrease of 13% year-over-year, principally related to the sale of the MultiService payment solutions business in September 2020, partially offset by increased demand in North America and World Kinect.

“Our disciplined focus on cost and working capital management has positioned us well for growth, which should enable us to drive increased returns to our shareholders,” said Ira M. Birns, executive vice president and chief financial officer. “The continued strength of our balance sheet and liquidity profile will enable us to capitalize on future organic and strategic investment opportunities.”

COVID-19 Update

Throughout 2020, the COVID-19 pandemic had a significant impact on the global economy as a whole, and the transportation industries in particular, which has continued into 2021. Many of our customers in these industries, especially commercial airlines, have experienced a substantial decline in business activity arising from the various measures enacted by governments around the world to contain the spread of the virus. While travel and economic activity has begun to improve in certain regions, activity in many parts of the world continues to be negatively impacted by travel restrictions and lockdowns. The ultimate global recovery from the pandemic will be dependent on, among other things, actions taken by governments and businesses to contain and combat the virus, including any variant strains, the speed and effectiveness of vaccine production and global distribution, as well as how quickly, and to what extent, normal economic and operating conditions can resume on a sustainable basis globally.

Non-GAAP Financial Measures

This press release contains non-GAAP financial measures (collectively, the “Non-GAAP Measures”), including adjusted net income, adjusted diluted earnings per share, and adjusted earnings before interest, taxes, depreciation and amortization (“EBITDA”). The Non-GAAP Measures exclude acquisition and divestiture related expenses, restructuring costs, impairments, gains or losses on the extinguishment of debt and gains or losses on business dispositions primarily because we do not believe they are reflective of our core operating results.

We believe that the Non-GAAP Measures, when considered in conjunction with our financial information prepared in accordance with GAAP, are useful to investors to further aid in evaluating the ongoing financial performance of the Company and to provide greater transparency as supplemental information to our GAAP results.

Non-GAAP financial measures should not be considered in isolation from, or as a substitute for, financial information prepared in accordance with GAAP. In addition, our presentation of the Non-GAAP Measures may not be comparable to the presentation of such metrics by other companies. Non-GAAP diluted earnings per common share is computed by dividing non-GAAP net income attributable to World Fuel Services and available to common shareholders by the sum of the weighted average number of shares of common stock, stock units, restricted stock entitled to dividends not subject to forfeiture and vested restricted stock units outstanding during the period and the number of additional shares of common stock that would have been outstanding if our outstanding potentially dilutive securities had been issued. Investors are encouraged to review the reconciliation of these Non-GAAP Measures to their most directly comparable GAAP financial measures in this press release and on our website.

Information Relating to Forward-Looking Statements

This release includes forward-looking statements within the meaning of the Private Securities Litigation Reform Act of 1995, including statements regarding our beliefs and expectations about increasing demand for the balance of the year, our competitive position and growth opportunities, our expectations about our ability to capitalize on future organic and strategic investment opportunities, our beliefs and expectations about our ability to increase returns to our shareholders, as well as the ultimate impact of the coronavirus pandemic on us. These forward-looking statements are qualified in their entirety by cautionary statements and risk factor disclosures contained in the Company’s Securities and Exchange Commission (“SEC”) filings, including the Company’s most recent Annual Report on Form 10-K filed with the SEC. Actual results may differ materially from any forward-looking statements due to risks and uncertainties, including, but not limited to: our ability to effectively manage the effects of the COVID-19 pandemic, the extent of the impact of the pandemic on ours and our customers' sales, profitability, operations and supply chains due to actions taken by governments and businesses to contain the virus, such as restrictions on travel, the speed and effectiveness of vaccine development and distribution, customer and counterparty creditworthiness and our ability to collect accounts receivable and settle derivative contracts, particularly for those customers most significantly impacted by the pandemic, sudden changes in the market price of fuel or extremely high or low fuel prices that continue for an extended period of time, the loss of, or reduced sales to a significant government customer, such as the North Atlantic Treaty Organization as a result of the ongoing troop withdrawal in Afghanistan, the availability of cash and sufficient liquidity to fund our working capital and strategic investment needs, adverse conditions in the markets or industries in which we or our customers and suppliers operate such as the current global economic environment as a result of the coronavirus pandemic, our failure to comply with restrictions and covenants in our senior revolving credit facility and our senior term loans, including our financial covenants, our ability to effectively utilize the proceeds from the sale of the Multi Service business and derive the expected benefits, our ability to manage the changes in supply and other market dynamics in the regions where we operate, our ability to successfully execute and achieve efficiencies, our ability to achieve the expected level of benefit from any restructuring activities and cost reduction initiatives, our ability to successfully implement our growth strategy and integrate acquired businesses and recognize the anticipated benefits, unanticipated tax liabilities or adverse results of tax audits, assessments, or disputes ,our ability to capitalize on new market opportunities, risks related to the complexity of U.S. Tax Cuts and Jobs Act and any subsequently issued regulations and our ability to accurately predict the impact on our effective tax rate and future earnings, our ability to effectively leverage technology and operating systems and realize the anticipated benefits, potential liabilities and the extent of any insurance coverage, actions that may be taken under the new administration in the U.S. that increase costs or otherwise negatively impact ours or our customers and suppliers businesses, the outcome of pending litigation and other proceedings, the impact of quarterly fluctuations in results, particularly as a result of seasonality, supply disruptions, border closures and other logistical difficulties that can arise when sourcing and delivering fuel in areas that are actively engaged in war or other military conflicts, our failure to effectively hedge certain financial risks associated with the use of derivatives, uninsured losses, the impact of climate change and natural disasters, adverse results in legal disputes, and other risks detailed from time to time in our SEC filings. In addition, other current or potential risks and uncertainties related to the coronavirus pandemic include, but are not limited to: disruptions resulting from office and facility closures, reductions in operating hours, and changes in operating procedures, including additional cleaning and disinfecting procedures, possible infections or quarantining of our employees which could impact our ability to service our customers or operate our business, notices from customers, suppliers and other third parties asserting force majeure or other bases for their non-performance, losses on hedging transactions with customers arising from the decline in fuel prices and their inability to benefit from the reduced cost of fuel due to substantial reductions in their operations, heightened risk of cybersecurity issues as digital technologies may become more vulnerable and experience a higher rate of cyber-attacks in a remote connectivity environment, reduction of our global workforce to adjust to market conditions, including increased costs associated with severance payments, retention issues, and an inability to hire employees when market conditions improve, the impact of asset impairments, including any impairment of the carrying value of our goodwill in our aviation and land segments, as well as other accounting charges if expected future demand for our products and services materially decreases, a structural shift in the global economy and its demand for fuel and related products and services as a result of changes in the way people work, travel and interact, or in connection with a global recession. New risks emerge from time to time and it is not possible for management to predict all such risk factors or to assess the impact of such risks on our business. Accordingly, we undertake no obligation to publicly update or revise any forward-looking statements, whether as a result of new information, changes in expectations, future events, or otherwise, except as required by law.

About World Fuel Services Corporation

Headquartered in Miami, Florida, World Fuel Services is a global energy management company involved in providing energy procurement advisory services, supply fulfillment and transaction and payment management solutions to commercial and industrial customers, principally in the aviation, marine and land transportation industries. World Fuel Services sells fuel and delivers services to its clients at more than 8,000 locations in more than 200 countries and territories worldwide.

For more information, call 305-428-8000 or visit www.wfscorp.com.

-- Some amounts in this press release may not add due to rounding. All percentages have been calculated using unrounded amounts --


WORLD FUEL SERVICES CORPORATION

CONDENSED CONSOLIDATED BALANCE SHEETS

(Unaudited - In millions, except per share data)


June 30, 2021


December 31, 2020

Assets:


Current assets:


Cash and cash equivalents


$

742.7


$

658.8


Accounts receivable, net of allowance for credit losses of $36.1 million and $53.8 million as of June 30, 2021 and December 31, 2020, respectively


1,835.0


1,238.4


Inventories


426.5


344.3


Prepaid expenses


74.4


51.1


Short-term derivative assets, net


81.1


66.4


Other current assets


199.0


280.4


Total current assets


3,358.6


2,639.3


Property and equipment, net


334.2


342.6


Goodwill


858.9


858.6


Identifiable intangible and other non-current assets


698.1


659.8


Total assets


$

5,249.8


$

4,500.3


Liabilities:


Current liabilities:


Current maturities of long-term debt


$

30.1


$

22.9


Accounts payable


1,844.8


1,214.7


Customer deposits


153.4


155.8


Accrued expenses and other current liabilities


364.2


290.6


Total current liabilities


2,392.6


1,684.0


Long-term debt


491.6


501.8


Non-current income tax liabilities, net


216.8


215.5


Other long-term liabilities


199.1


186.1


Total liabilities


3,300.1


2,587.4


Commitments and contingencies


Equity:


World Fuel shareholders' equity:


Preferred stock, $1.00 par value; 0.1 shares authorized, none issued


Common stock, $0.01 par value; 100.0 shares authorized, 63.3 and 62.9 issued and outstanding as of June 30, 2021 and December 31, 2020, respectively


0.6


0.6


Capital in excess of par value


211.3


204.6


Retained earnings


1,858.4


1,836.7


Accumulated other comprehensive loss


(124.1

)


(132.6

)

Total World Fuel shareholders' equity


1,946.2


1,909.3


Noncontrolling interest


3.5


3.6


Total equity


1,949.7


1,912.9


Total liabilities and equity


$

5,249.8


$

4,500.3


WORLD FUEL SERVICES CORPORATION

CONDENSED CONSOLIDATED STATEMENTS OF INCOME AND COMPREHENSIVE INCOME

(Unaudited – In millions, except per share data)


For the Three Months Ended
June 30,


For the Six Months Ended
June 30,


2021


2020


2021


2020

Revenue


$

7,085.5


$

3,158.3


$

13,043.4


$

11,173.5


Cost of revenue


6,901.6


2,944.5


12,667.9


10,700.9


Gross profit


183.9


213.9


375.5


472.6


Operating expenses:


Compensation and employee benefits


87.9


95.9


180.3


198.3


General and administrative


57.4


84.4


116.8


168.2


Asset impairments


4.7


18.6


4.7


18.6


Restructuring charges


3.0


3.1


5.1


4.8


Total operating expenses


153.0


202.0


306.9


389.9


Income from operations


30.9


11.9


68.6


82.7


Non-operating income (expenses), net:


Interest expense and other financing costs, net


(10.0

)


(10.0

)


(18.7

)


(25.3

)

Other income (expense), net


(1.4

)


(4.9

)


(2.6

)


(2.7

)

Total non-operating income (expenses), net


(11.4

)


(14.9

)


(21.3

)


(28.1

)

Income (loss) before income taxes


19.6


(3.0

)


47.2


54.6


Provision for income taxes


2.0


7.7


10.8


23.7


Net income (loss) including noncontrolling interest


17.6


(10.7

)


36.4


31.0


Net income (loss) attributable to noncontrolling interest


(0.1

)


(0.4

)


(0.1

)


(0.2

)

Net income (loss) attributable to World Fuel


$

17.6


$

(10.2

)


$

36.5


$

31.2


Basic earnings (loss) per common share


$

0.28


$

(0.16

)


$

0.58


$

0.49


Basic weighted average common shares


63.4


63.3


63.2


64.1


Diluted earnings (loss) per common share


$

0.28


$

(0.16

)


$

0.57


$

0.48


Diluted weighted average common shares


63.8


63.3


63.6


64.4


Comprehensive income:


Net income (loss) including noncontrolling interest


$

17.6


$

(10.7

)


$

36.4


$

31.0


Other comprehensive income (loss):


Foreign currency translation adjustments


4.8


5.1


0.8


(27.9

)

Cash flow hedges, net of income tax benefit of $2.9 and $7.2 for the three months ended June 30, 2021 and 2020, respectively, and net of income tax expense of $2.7 and $0.2 for the six months ended June 30, 2021 and 2020, respectively


(8.6

)


(21.0

)


7.8


0.7


Other comprehensive income (loss)


(3.8

)


(16.0

)


8.5


(27.2

)

Comprehensive income (loss) including noncontrolling interest


13.7


(26.7

)


44.9


3.7


Comprehensive income (loss) attributable to noncontrolling interest


(0.1

)


(0.1

)


Comprehensive income (loss) attributable to World Fuel


$

13.8


$

(26.7

)


$

45.0


$

3.7


WORLD FUEL SERVICES CORPORATION

CONDENSED CONSOLIDATED STATEMENTS OF CASH FLOWS

(Unaudited - In millions)


For the Three Months
Ended June 30,


For the Six Months
Ended June 30,


2021


2020


2021


2020

Cash flows from operating activities:


Net income (loss) including noncontrolling interest


$

17.6


$

(10.7

)


$

36.4


$

31.0


Adjustments to reconcile net income including noncontrolling interest to net cash provided by operating activities:


Depreciation and amortization


20.7


22.3


40.5


44.2


Provision for credit losses


(1.1

)


24.7


2.4


34.6


Share-based payment award compensation costs


3.3


2.3


12.0


0.6


Deferred income tax expense (benefit)


(8.6

)


6.4


(15.4

)


(5.3

)

Foreign currency (gains) losses, net


4.0


22.8


(8.9

)


3.0


Other


16.0


41.1


10.5


0.2


Changes in assets and liabilities, net of acquisitions and divestitures:


Accounts receivable, net


(161.9

)


562.3


(600.7

)


1,462.6


Inventories


(88.3

)


37.5


(77.4

)


282.8


Prepaid expenses


(21.3

)


(14.2

)


(24.3

)


6.4


Short-term derivative assets, net


(37.7

)


78.9


39.6


(110.4

)

Other current assets


(7.4

)


(0.5

)


61.9


17.2


Cash collateral with counterparties


29.1


54.5


24.7


17.6


Other non-current assets


(24.9

)


11.0


(28.9

)


(18.4

)

Accounts payable


211.6


(469.6

)


605.9


(1,527.1

)

Customer deposits


20.1


(6.0

)


(2.7

)


(2.3

)

Accrued expenses and other current liabilities


40.4


(126.7

)


41.1


(25.2

)

Non-current income tax, net and other long-term liabilities


25.6


(0.6

)


23.8


33.7


Total adjustments


19.6


246.3


104.2


214.1


Net cash provided by (used in) operating activities


37.2


235.6


140.6


245.1


Cash flows from investing activities:


Acquisition of business, net of cash acquired


(0.1

)


(130.6

)

Capital expenditures


(12.2

)


(15.5

)


(14.2

)


(32.9

)

Other investing activities, net


(4.8

)


(4.2

)


(5.4

)


(5.3

)

Net cash provided by (used in) investing activities


(17.0

)


(19.8

)


(19.7

)


(168.7

)

Cash flows from financing activities:


Borrowings of debt


0.1


348.0


0.3


2,080.0


Repayments of debt


(4.4

)


(452.4

)


(8.9

)


(1,613.7

)

Dividends paid on common stock


(7.5

)


(6.5

)


(13.6

)


(13.0

)

Repurchases of common stock


(55.6

)

Other financing activities, net


(3.1

)


(1.2

)


(13.5

)


(2.8

)

Net cash provided by (used in) financing activities


(14.9

)


(112.1

)


(35.7

)


394.9


Effect of exchange rate changes on cash and cash equivalents


2.1


4.9


(1.4

)


(11.6

)

Net increase (decrease) in cash and cash equivalents


7.3


108.6


83.9


459.6


Cash and cash equivalents, as of the beginning of the period


735.3


537.0


658.8


186.1


Cash and cash equivalents, as of the end of the period


$

742.7


$

645.7


$

742.7


$

645.7


WORLD FUEL SERVICES CORPORATION

RECONCILIATION OF GAAP TO NON-GAAP FINANCIAL MEASURES

(Unaudited - In millions, except per share data)


For the Three Months Ended
June 30,


For the Six Months Ended
June 30,

Non-GAAP financial measures and reconciliation:


2021


2020


2021


2020

Net income (loss) attributable to World Fuel


$

17.6


$

(10.2

)


$

36.5


$

31.2


Acquisition and divestiture related expenses


0.5


1.2


2.9


2.2


Asset impairments


4.7


18.6


4.7


18.6


Restructuring charges


3.0


3.1


5.1


4.8


Income tax impacts


(0.9

)


(4.5

)


(3.6

)


(5.1

)

Adjusted net income (loss) attributable to World Fuel


$

25.0


$

8.1


$

45.7


$

51.7


Diluted earnings (loss) per common share


$

0.28


$

(0.16

)


$

0.57


$

0.48


Acquisition and divestiture related expenses


0.01


0.02


0.05


0.03


Asset impairments


0.07


0.29


0.07


0.29


Restructuring charges


0.05


0.05


0.08


0.07


Income tax impacts


(0.01

)


(0.07

)


(0.06

)


(0.08

)

Adjusted diluted earnings (loss) per common share


$

0.39


$

0.13


$

0.72


$

0.80


For the Three Months Ended
June 30,


For the Six Months Ended
June 30,

Non-GAAP financial measures and reconciliation:


2021


2020


2021


2020

Income from operations


$

30.9


$

11.9


$

68.6


$

82.7


Depreciation and amortization


20.7


22.3


40.5


44.2


Acquisition and divestiture related expenses


0.5


1.2


2.9


2.2


Asset impairments


4.7


18.6


4.7


18.6


Restructuring charges


3.0


3.1


5.1


4.8


Adjusted EBITDA (1)


$

59.8


$

57.1


$

121.8


$

152.5


(1)

The Company defines adjusted EBITDA as income from operations, excluding the impact of depreciation and amortization, and items that are considered to be non-operational and not representative of our core business, including those associated with acquisition and divestiture related expenses, asset impairments, and restructuring charges.

WORLD FUEL SERVICES CORPORATION

BUSINESS SEGMENTS INFORMATION

(Unaudited - In millions)


For the Three Months Ended
June 30,


For the Six Months Ended
June 30,

Revenue:


2021


2020


2021


2020

Aviation segment


$

2,805.8


$

1,020.6


$

4,900.8


$

4,784.8


Land segment


2,457.2


1,197.6


4,645.4


3,303.6


Marine segment


1,822.4


940.2


3,497.1


3,085.2


Total revenue


$

7,085.5


$

3,158.3


$

13,043.4


$

11,173.5


Gross profit:


Aviation segment


$

87.4


$

91.9


$

164.1


$

185.0


Land segment


73.8


84.8


163.3


191.0


Marine segment


22.7


37.2


48.2


96.6


Total gross profit


$

183.9


$

213.9


$

375.5


$

472.6


Income from operations:


Aviation segment


$

34.0


$

9.0


$

57.0


$

38.1


Land segment


8.1


9.7


40.9


35.3


Marine segment


4.8


13.3


11.1


47.2


Total segment income from operations


46.9


32.0


109.0


120.6


Corporate overhead - unallocated


(15.9

)


(20.1

)


(40.5

)


(37.9

)

Total income from operations


$

30.9


$

11.9


$

68.6


$

82.7


SALES VOLUME SUPPLEMENTAL INFORMATION

(Unaudited - In millions)


For the Three Months Ended
June 30,


For the Six Months Ended
June 30,

Volume (Gallons):


2021


2020


2021


2020

Aviation Segment


1,373.8


688.1


2,517.1


2,532.8


Land Segment (1)


1,288.5


1,168.3


2,591.5


2,549.3


Marine Segment (2)


1,211.4


1,056.8


2,328.8


2,347.9


Consolidated Total


3,873.6


2,913.2


7,437.5


7,430.0


(1)

Includes gallons and gallon equivalents of British Thermal Units (BTU) for our natural gas sales and Kilowatt Hours (kWh) for our World Kinect power business.

(2)

Converted from metric tons to gallons at a rate of 264 gallons per metric ton. Marine segment metric tons were 4.6 and 8.8 for the three and six months ended June 30, 2021.


Contacts

World Fuel Services Corporation
Ira M Birns, 305-428-8000
Executive Vice President & Chief Financial Officer

Glenn Klevitz, 305-428-8000
Vice President, Treasurer & Investor Relations

First-ever Powering the Holidays Program to award approximately $25,000 in funding to foster understanding of culture, sense of belonging within local communities

CHICAGO--(BUSINESS WIRE)--To extend warm feelings into the colder fall and winter seasons, ComEd and the Metropolitan Mayors Caucus today announced the launch of the ComEd Powering the Holidays Program. This first-ever program will provide competitive grants of up to $2,500 each for community holiday lighting events across the northern Illinois areas ComEd serves.


“Powering the Holidays will support public lighting events during the holiday season that celebrate community identity and culture, providing residents with opportunities for interculture exchange and understanding,” said Melissa Washington, senior vice president of governmental and external affairs at ComEd. “ComEd is proud to be working with the Metropolitan Mayors Caucus to identify and support holiday lighting programs that provide pathways for people to gain a sense of belonging within their communities.”

Municipalities, townships, counties, and other local governments within ComEd’s service territory are eligible to apply. Not-for-profit organizations and cultural institutions also are eligible if they partner with at least one municipality. ComEd will provide the funding for the grants, and the Metropolitan Mayors Caucus will administer the grants to local communities. Grant recipients must use their funds for any holiday events between Nov. 1, 2021, and Feb. 13, 2022. Applications are being accepted until 11:59 p.m. Sept. 10, 2021.

“We are grateful to partner with ComEd to launch this first ever Powering the Holidays Program,” said Kevin Wallace, mayor of Bartlett and Mayors Caucus executive board chairman. “It will be rewarding to see these grants provide communities a sense of unity during the holiday season and help people develop a respect and understanding for different cultures.”

The Powering the Holidays Program builds on ComEd’s and the Metropolitan Mayors Caucus’s work on the Powering Safe Communities Program which, for the past five years, has provided nearly $850,000 in grants for 116 local public safety projects throughout northern Illinois. The grants support projects that address unmet public safety needs, advance sustainability, use technology to improve public safety and emergency response and provide safety for the greatest number of people and vulnerable populations. Applications for next year’s Powering Safe Communities grants will be accepted starting March 2022.

Powering the Holidays also is an extension of ComEd’s long-time sponsorship of and support for holiday lighting events at Lincoln Park Zoo, Brookfield Zoo, Morton Arboretum and Chicago Botanic Gardens.

For the Powering the Holidays Program, applications, guidelines and more information are available on the Metropolitan Mayors Caucus website.

ComEd is a unit of Chicago-based Exelon Corporation (NASDAQ: EXC), a Fortune 100 energy company with approximately 10 million electricity and natural gas customers – the largest number of customers in the U.S. ComEd powers the lives of more than 4 million customers across northern Illinois, or 70 percent of the state’s population. For more information visit ComEd.com and connect with the company on Facebook, Twitter, Instagram and YouTube.

The Metropolitan Mayors Caucus is a membership organization of the Chicago region's 275 cities, towns and villages. Founded in 1997 by then Chicago Mayor Richard M. Daley and leading mayors from nine suburban municipal groups, the Metropolitan Mayors Caucus pushes past geographical boundaries and local interests to work on public policy issues. The caucus provides a forum for metropolitan Chicago's chief elected officials to collaborate on common problems and work toward a common goal of improving the quality of life for the millions of people who call the region home. For more information visit http://mayorscaucus.org/.


Contacts

ComEd Media Relations
312-394-3500

LONDON & HOUSTON--(BUSINESS WIRE)--Regulatory News:


TechnipFMC (NYSE: FTI) (PARIS: FTI) intends to acquire the remaining 49% of shares in TIOS AS, a joint venture between TechnipFMC and Island Offshore Management AS (Island Offshore) formed in 2018. This will accelerate the development of TechnipFMC’s integrated service model focused on maximizing value to our clients.

TIOS provides fully integrated Riserless Light Well Intervention (RLWI) services, including project management and engineering for plug & abandonment, riserless coiled tubing, and well completion and intervention operations, and has serviced over 740 wells globally since 2005.

The company will continue to utilize Island Offshore as the vessel provider for RLWI services.

Jonathan Landes, President, Subsea at TechnipFMC, commented, “We are pleased to welcome TIOS wholly into TechnipFMC. This transaction brings into the company additional expertise that will maximize our capability to provide a complete range of well services globally to our clients in a rapid and economical manner.”

Important Information for Investors and Securityholders

Forward-Looking Statement

This release contains "forward-looking statements" as defined in Section 27A of the United States Securities Act of 1933, as amended, and Section 21E of the United States Securities Exchange Act of 1934, as amended. The words “believe”, “estimated” and other similar expressions are intended to identify forward-looking statements, which are generally not historical in nature. Such forward-looking statements involve significant risks, uncertainties and assumptions that could cause actual results to differ materially from our historical experience and our present expectations or projections. For information regarding known material factors that could cause actual results to differ from projected results, please see our risk factors set forth in our filings with the United States Securities and Exchange Commission, which include our Annual Reports on Form 10-K, Quarterly Reports on Form 10-Q, and Current Reports on Form 8-K. We caution you not to place undue reliance on any forward-looking statements, which speak only as of the date hereof. We undertake no obligation to publicly update or revise any of our forward-looking statements after the date they are made, whether as a result of new information, future events or otherwise, except to the extent required by law.

About TechnipFMC

TechnipFMC is a leading technology provider to the traditional and new energy industries, delivering fully integrated projects, products, and services.

With our proprietary technologies and comprehensive solutions, we are transforming our clients’ project economics, helping them unlock new possibilities to develop energy resources while reducing carbon intensity and supporting their energy transition ambitions.

Organized in two business segments — Subsea and Surface Technologies — we will continue to advance the industry with our pioneering integrated ecosystems (such as iEPCI™, iFEED™ and iComplete™), technology leadership and digital innovation.

Each of our approximately 20,000 employees is driven by a commitment to our clients’ success, and a culture of strong execution, purposeful innovation, and challenging industry conventions.

TechnipFMC uses its website as a channel of distribution of material company information. To learn more about how we are driving change in the industry, go to www.TechnipFMC.com and follow us on Twitter @TechnipFMC.

Category: UK regulatory


Contacts

Investor relations
Matt Seinsheimer
Vice President, Investor Relations
Tel: +1 281 260 3665
Email: This email address is being protected from spambots. You need JavaScript enabled to view it.

James Davis
Senior Manager, Investor Relations
Tel: +1 281 260 3665
Email: This email address is being protected from spambots. You need JavaScript enabled to view it.

Media relations
Nicola Cameron
Vice President, Corporate Communications
Tel: +44 1383 742297
Email: This email address is being protected from spambots. You need JavaScript enabled to view it.

Catie Tuley
Director, Public Relations
Tel: +1 713 876 7296
Email: This email address is being protected from spambots. You need JavaScript enabled to view it.

NOT FOR DISTRIBUTION TO U.S. NEWSWIRE SERVICES OR FOR DISSEMINATION IN THE U.S.


TORONTO--(BUSINESS WIRE)--Sherritt International Corporation (“Sherritt”, the “Corporation”, the “Company”) (TSX: S), a world leader in the mining and hydrometallurgical refining of nickel and cobalt from lateritic ores, today reported its financial results for the three and six months ended June 30, 2021. All amounts are in Canadian currency unless otherwise noted.

CEO COMMENTARY

“Our performance in Q2 was marked by strong nickel and cobalt production, receipt of US$28 million in distributions from the Moa Joint Venture, and measures taken to reduce corporate costs by approximately $1.3 million annually,” said Leon Binedell, President and CEO of Sherritt International. “Just as significant, we accelerated efforts to transition our Technologies Group from being a cost centre to becoming an incubator of industry solutions that can be commercialized externally or applied internally to improve operational performance, reduce carbon emissions, and support growth initiatives, such as efforts to de-bottleneck production, evaluate brownfield expansion opportunities, and increase mineral reserves.”

Mr. Binedell added, “Although our ability to collect overdue receivables may be subject to near-term volatility due to the continued impact of U.S. sanctions and Cuba’s reduced access to foreign currency on account of the global pandemic, we remain bullish on our prospects given the favourable outlook for nickel and cobalt with the mass adoption of electric vehicles anticipated in the coming years.”

SELECTED Q2 2021 HIGHLIGHTS

  • Leon Binedell, a 25-year mining industry veteran with a history of building shareholder value, was appointed President and CEO of Sherritt International effective June 1, 2021.
  • Adjusted EBITDA(1) was $18 million, up 114% from last year. The higher total was indicative of strong production totals at the Moa Joint Venture (Moa JV) and improved nickel and cobalt prices, but offset by increased input costs and $1.8 million of expenses relating to a 10% workforce reduction in Sherritt’s Corporate office, which will result in a reduction of corporate costs by approximately $1.3 million annually, and $5.5 million in other contract benefits expenses relating to the planned departure of senior executives.
  • Sherritt’s share of finished nickel production at the Moa JV was 4,230 tonnes, up 2% from last year while Sherritt’s share of finished cobalt production was 476 tonnes, up 12%. The growth was largely attributable to higher inventories of mixed sulphides available at the refinery in Fort Saskatchewan, Alberta and improved refinery reliability.
  • Net Direct Cash Cost (NDCC)(1) at the Moa JV was US$4.58/lb, up 17% from last year. Despite a 73% improvement in cobalt by-product credits, unit costs per pound of finished nickel sold were impacted by the 65% increase in sulphur prices, 160% increase in fuel oil prices, 46% increase in natural gas prices, and added costs stemming from the purchase of sulphuric acid necessary because of the acid plant shutdown at Moa due to scheduled maintenance repairs.
  • Upgraded a number of environmental, social, and governance (ESG) targets, including a target of achieving net zero greenhouse emissions by 2050 and obtaining 15% of overall energy from renewable sources by 2030. Sherritt’s list of long-term and interim ESG targets will be published in its upcoming Sustainability Report.
  • Received US$28 million in distributions from the Moa JV. The total consisted of Sherritt’s 50% share of distributions declared by the Moa JV, or US$14 million, and US$14 million re-directed by General Nickel Company S.A. (GNC), Sherritt’s joint venture partner, from its 50% share to be used to fund Energas operations.
  • Received US$24.5 million in Cuban energy payments, including the US$14 million noted above redirected to Sherritt by its Moa JV partner. Sherritt anticipates continued variability in the timing of collections through the remainder of 2021, and is working with its Cuban partners to ensure timely receipts.
  • Generated $1.5 million of cash from continuing operations for operating activities, representing a turnaround of $14.1 million from Q2 2020.
  • Purchased a total of $2 million principal amount of 8.5% second lien notes at an aggregate cost of $1.3 million. The $2 million debt reduction will also result in cash interest savings of $0.9 million through to the maturity in November 2026.
  • Excluding the non-cash impacts of share-based compensation and depreciation, administrative expenses declined by $2.7 million from Q2 2020.

DEVELOPMENTS SUBSEQUENT TO THE QUARTER END

  • Sherritt donated $250,000 to UNICEF to support immunization efforts and improve the capacity of approximately 90 vaccination centres throughout Cuba, including the municipality of Moa in Holguin. The donation, which will benefit almost 3 million people, including approximately 350,000 children, will help curb the spread of COVID-19 and support future vaccination needs.
 

(1) 

For additional information see the Non-GAAP measures section of this press release.

Q2 2021 FINANCIAL HIGHLIGHTS


For the three months ended


For the six months ended


2021


2020


2021


2020


$ millions, except per share amount

June 30


June 30


Change


June 30


June 30


Change


Revenue

31.0


40.4


(23%)

$

52.9


$

66.7


(21%)

Combined revenue(1)

152.3


133.5


14%


294.0


245.8


20%

Loss from operations and joint venture

(7.3

)

(19.7

)

63%


(1.2

)


(38.5

)

97%

Net loss from continuing operations

(10.4

)

(13.3

)

22%


(12.3

)


(47.8

)

74%

Net loss for the period

(10.7

)

(114.5

)

91%


(16.3

)


(156.7

)

90%

Adjusted EBITDA(1)

18.0


8.4


114%


48.2


12.7


280%

Cash provided (used) by continuing operations for operating activities

1.5


(12.6

)

112%


(1.5

)


10.0


(115%)

Combined free cash flow(1)

2.6


(0.6

)

nm(2)


21.6


2.4


nm(2)

Average exchange rate (CAD/US$)

1.228


1.385


(11%)


1.247


1.365


(9%)

Net loss from continuing operations ($ per share)

(0.03

)

(0.03

)

-


(0.03

)


(0.12

)

75%


(1) 

For additional information see the Non-GAAP measures section.


(2) 

Not meaningful (nm)


2021


2020


$ millions, as at


June 30


December 31


Change


Cash, cash equivalents and short term investments


$

153.8


$

167.4


(8%)

Loans and borrowings


439.6


441.4


-

Cash, cash equivalents, and short-term investments at June 30, 2021 were $153.8 million, down from $158.3 million at March 31, 2021. The decrease was due to a number of factors, including use of $1.3 million towards the repurchase of 8.5% second lien notes with a principal value of $2 million, payment of $15 million in interest on 8.5% second lien notes and $2.9 million in capital expenditures. The decrease was partially offset by the receipt of US$14 million in distributions from the Moa JV representing Sherritt’s 50% share and the receipt of US$24.5 million in Cuban energy payments, which included US$14 million re-directed by GNC, Sherritt’s joint venture partner, from its 50% share of distributions.

The US$28 million of distributions paid by the Moa JV in Q2 2021 was indicative of improved nickel and cobalt average-realized prices and strong production results. In Q2 2020, the Moa JV did not declare any distributions. Sherritt anticipates receipt of additional distributions from the Moa JV through to the end of 2021 based on prevailing nickel and cobalt prices, planned capital spend, and liquidity requirements for the Moa JV.

Collections against overdue amounts owed to Sherritt by its Cuban energy partners continue to be adversely impacted by a combination of factors, including the ongoing effects of U.S. sanctions against Cuba, Cuba’s reduced access to foreign currency on account of the global pandemic, and the country’s launch of a currency unification process. Sherritt received US$24.5 million of Cuban energy payments, which included US$14 million of redirections from GNC, in Q2 2021.

Total overdue scheduled receivables at June 30, 2021 were US$154.7 million, largely unchanged from US$154.2 million at March 31, 2021. Subsequent to quarter end, Sherritt received US$1.6 million in Cuban energy payments. Sherritt anticipates variability in the timing and the amount of energy payments, and continues to work with its Cuban partners to ensure timely receipt of energy payments.

As at June 30, 2021, Sherritt held cash, cash equivalents and short-term investment in Canada totaling $77.4 million, up from $75.6 million at March 31, 2021.

Adjusted net loss(1)


2021


2020

For the three months ended June 30


$ millions


$/share


$ millions


$/share


Net loss from continuing operations


(10.4

)


(0.03

)


(13.3

)


(0.03

)


Adjusting items:


Unrealized foreign exchange (gain) loss - continuing operations


(8.6

)


(0.02

)


7.4


0.02


Severance and other contractual benefits expense


2.4


0.01


-


-


Unrealized losses on commodity put options


3.7


0.01


-


-


Moa JV expansion loans receivable ACL revaluation


-


-


(23.6

)


(0.06

)

Other


(0.1

)


-


1.8


-


Adjusted net loss from continuing operations


(13.0

)


(0.03

)


(27.7

)


(0.07

)


2021


2020

For the six months ended June 30


$ millions


$/share


$ millions


$/share


Net loss from continuing operations


(12.3

)


(0.03

)


(47.8

)


(0.12

)


Adjusting items:


Unrealized foreign exchange gain - continuing operations


(11.2

)


(0.02

)


(5.1

)


(0.01

)

Severance and other contractual benefits expense


2.4


0.01


-


-


Unrealized losses on commodity put options


4.3


0.01


-


-


Moa JV expansion loans receivable ACL revaluation


-


-


(6.4

)


(0.02

)

Gain on repurchase of notes


(2.1

)


-


-


-


Other


3.6


(0.01

)


3.2


0.01


Adjusted net loss from continuing operations


(15.3

)


(0.04

)


(56.1

)


(0.14

)


(1) 

For additional information see the Non-GAAP measures section.

Net loss from continuing operations for Q2 2021 was $10.4 million, or $0.03 per share, compared to a net loss of $13.3 million, or $0.03 per share, for the same period last year. The improvement was driven largely by the strong contributions from the Moa JV as a result of higher sales volumes and higher realized prices compared to the same period of last year.

Adjusted net loss from continuing operations was $13.0 million, or $0.03 per share, for the quarter ended June 30, 2021. In Q2 2020, Sherritt incurred an adjusted net loss of $27.7 million or $0.07 per share. Sherritt’s adjusted net loss for Q2 2021 excluded an unrealized foreign exchange gain of $8.6 million, severance and other contract benefits expense of $2.4 million, and unrealized losses on commodity put options of $3.7 million.

METALS MARKET

Nickel

Following a price pullback triggered by Tsingshan’s announcement in early March that it plans to supply 100,000 tonnes of a nickel intermediate product amenable for use in electric vehicle batteries starting in October 2021, nickel prices enjoyed a sharp recovery in Q2, closing at US$8.37/lb on June 30, up 15% from the start of the quarter.

The price increase was driven by a number of market developments suggesting strong near-term demand for nickel and lower available supply by year end.

Chief among the factors that contributed to rising nickel prices in Q2 was news from Indonesia that it plans to put restrictions on the construction of new nickel pig iron and ferronickel smelters, effectively raising supply concerns, particularly about how China’s growing demand for stainless steel production would be met. Supply concerns were also exacerbated by a labour strike at a nickel operation in Ontario.

The impact of nickel supply disruptions and strong demand driven by global economic recovery since the start of the global pandemic and growing electric vehicle sales was made evident by the 12% decrease in nickel inventory levels on the London Metals Exchange (LME) to 232,476 tonnes by June 30. Similarly, inventory levels on the Shanghai Futures Exchange fell to 4,982 tonnes, down from 8,972 tonnes at the start of the quarter.

Continued strong demand and market tightness led a number of industry analysts, including Wood Mackenzie, to forecast a nickel supply deficit in 2021 in contrast to a forecast for nickel surplus at the start of the year. As at July 29, nickel inventories on the LME declined further to 215,412 tonnes.

Nickel inventory level uncertainty is, however, anticipated in 2022 and 2023, and some industry analysts have forecast an inventory surplus in the near term.

The long-term outlook for nickel remains bullish due to the strong demand expected from the electric vehicle battery market. Over the past year, in particular, multiple automakers and governments have announced plans for significant investments to expand electric vehicle production capacity to meet growing demand as well as more aggressive timelines to phase out the sale of internal combustion engines. In 2020, more than three million plug-in electric vehicles (PEV) were sold despite the global pandemic. Industry observers estimate that the number of PEVs sold in 2021 will double to 6.1 million units. CRU has forecast that electric vehicles sales will grow to 13.7 million units by 2025.

As a result of its unique properties, high-nickel cathode formulations remain the dominant choice for long-range vehicles manufactured by automakers with Class 1 nickel being an essential feedstock in the battery supply chain. Sherritt is particularly well positioned given our Class 1 production capabilities and the fact that Cuba possesses the world’s fourth largest nickel reserves.

Cobalt

While standard grade cobalt prices on June 30 closed at US$22.90/lb, essentially flat from the start of the second quarter according to data collected by Fastmarkets MB, cobalt prices in Q2 were, in fact, marked by considerable volatility. Prices ranged from a low of US$19.88/lb to a high of US$22.90/lb, a variance of more than 12%.

Prices in Q2 declined because of increased supply made available from the Democratic Republic of Congo. By quarter end, prices recovered largely as a result of increased buying from electric vehicle battery manufacturers in Europe and increased stockpiling from consumers. Cobalt is a key component of rechargeable batteries providing energy stability.

The recovery of cobalt prices by the end of Q2 2021 also reflected improved market conditions as demand grew from sectors particularly impacted at the start of the pandemic, such as the aerospace sector and consumer electronics, which experienced increased purchasing of home office equipment. In Q2 2020, when market conditions for cobalt were at their softest as a result of the pandemic, the average reference price was US$15.19/lb. The higher average cobalt reference price of US$21.06/lb in Q2 2021 demonstrates the strengthening of the cobalt market over the past year.

Industry observers, such as CRU, expect cobalt prices to continue to rise in the near term with prices forecast to peak at US$31/lb in 2024 as limited new sources of supply have been announced to fill expected demand over the next five years. Since the start of Q3, cobalt prices have risen to US$24.85/lb largely because of supply logistics disruptions in South Africa.

The outlook for cobalt over the long term remains bullish as demand is expected to grow to 270,000 tonnes by 2025, representing a compound annual growth rate of 13.5% according to CRU.

REVIEW OF OPERATIONS

Moa Joint Venture (50% interest) and Fort Site (100%)


For the three months ended


For the six months ended


2021


2020


2021


2020


$ millions (Sherritt's share), except as otherwise noted


June 30


June 30


Change


June 30


June 30


Change


FINANCIAL HIGHLIGHTS


Revenue


$

142.2


$

115.5


23%


$

268.5


$

209.0


28%

Earnings (loss) from operations


19.7


1.2


nm(1)


47.5


(3.5)


nm(1)

Adjusted EBITDA(2)


34.1


16.4


108%


75.8


26.5


186%


CASH FLOW


Cash provided by operations


$

21.6


$

12.7


70%


$

45.1


$

17.2


162%

Free cash flow(2)


13.8


6.2


123%


32.7


4.1


698%

Dividend distributions from the Moa Joint Venture(3)


16.9


-


-


23.2


13.3


74%


PRODUCTION VOLUMES (tonnes)


Mixed Sulphides


4,020


4,323


(7%)


7,951


8,337


(5%)

Finished Nickel


4,230


4,147


2%


8,418


7,983


5%

Finished Cobalt


476


425


12%


953


825


16%

Fertilizer


69,516


69,777


-


133,308


125,866


6%


NICKEL RECOVERY (%)


85%


86%


(1%)


84%


84%


-


SALES VOLUMES (tonnes)


Finished Nickel


4,268


4,169


2%


8,445


7,942


6%

Finished Cobalt


452


353


28%


929


734


27%

Fertilizer


64,722


72,071


(10%)


91,833


103,211


(11%)


AVERAGE-REFERENCE PRICE (US$ per pound)


Nickel


$

7.87


$

5.54


42%


$

7.92


$

5.66


40%

Cobalt(4)


21.06


15.19


39%


21.38


15.89


35%


AVERAGE-REALIZED PRICE(2)


Nickel ($ per pound)


$

9.46


$

7.51


26%


$

9.71


$

7.55


29%

Cobalt ($ per pound)


22.82


18.39


24%


22.35


18.79


19%

Fertilizer ($ per tonne)


409


399


3%


381


384


(1%)


UNIT OPERATING COST(2) (US$ per pound)


Nickel - net direct cash cost


$

4.58


$

3.92


17%


$

4.20


$

4.10


2%


SPENDING ON CAPITAL


Sustaining


$

7.7


$

9.5


(19%)


$

12.4


$

16.1


(23%)


$

7.7


$

9.5


(19%)


$

12.4


$

16.1


(23%)


(1) 

Not meaningful (nm)


(2) 

For additional information see the Non-GAAP measures section.


(3) 

Excludes redirections of dividends from Sherritt’s joint venture partner.


(4) 

Average standard grade cobalt published price per Fastmarkets MB.

Mixed sulphides production at the Moa JV in Q2 2021 was 4,020 tonnes, down 7% from 4,323 tonnes produced in Q2 2020. The decline was primarily due to reduced availability of sulphur on account of shipment delays to Moa. Lower mixed sulphides production was offset by the availability of high feed inventory levels at the refinery in Fort Saskatchewan, Alberta. Mixed sulphides production levels returned to normal in the latter part of Q2 with completion of acid plant repairs and improved suphur availability at Moa.

Finished nickel production in Q2 2021 totaled 4,230 tonnes, up 2% from the 4,147 tonnes produced in Q2 2020 while finished cobalt production for Q2 2021 was 476 tonnes, up 12% from the 425 tonnes produced in Q2 2020. The growth was largely attributable to the availability of higher inventory of mixed sulphides at the refinery and improved refinery reliability. Finished cobalt production also improved because of a higher cobalt to nickel ratio in ore feed.

Consistent since the start of the global pandemic in February 2020, production of mixed sulphides and finished nickel and cobalt were not affected by the spread of COVID-19 in Q2 2021 largely because of additional health and safety measures implemented to protect employees, suppliers and various stakeholders at operations at Moa and at the refinery in Fort Saskatchewan. Safety protocols to mitigate the impact of COVID-19, which are in accordance with or are more stringent than guidelines outlined by local governments, will continue.

As disclosed previously, the annual maintenance shutdown of the refinery in Fort Saskatchewan was deferred from Q2 to Q3, and finished nickel and cobalt production will be impacted accordingly. This year’s shutdown will be a full-facility shutdown, including all of the refinery and utility plants, that occurs once every six years. Full-facility shutdowns have previously occurred once every five years. The extended interval between full-facility shutdowns reflects ongoing commitments to asset management and operational excellence measures implemented over the past several years. This year’s shutdown is expected to last approximately 11 days compared to the typical five-day annual shutdowns. Sherritt’s guidance for 2021 production, unit cost and capital spend at the Moa JV is based on this full-facility shutdown. Based on performance through June 30, guidance for 2021 remains in effect.

Sales volume for finished nickel and cobalt in Q2 2021 were up 2% and 28%, respectively, from last year. The year-over-year increase was largely due to higher production and improved demand as a result of economic recovery since the onset of the global pandemic, particularly in China, which is a significant consumer of nickel and cobalt.

Total Moa JV revenue in Q2 2021 was $142.2 million, up 23% from $115.5 million last year. The revenue increase was attributable to a number of factors, including higher average-realized nickel and cobalt prices as well as higher nickel and cobalt sales volumes, but partially offset by lower fertilizer sales volumes. In Q2 2021, average-realized nickel and cobalt prices were up 26% and 24%, respectively, from last year. Average-realized prices are impacted by the timing of deliveries, settlement against contract terms, and fluctuations in the value of the Canadian currency.

Mining, processing and refining (MPR) costs per pound of nickel sold for Q2 2021 were US$5.86/lb, up 23% from last year. MPR costs in Q2 2021 increased due to a combination of factors, including higher input costs, higher maintenance costs and added costs stemming from the purchase of sulphuric acid necessary during the acid plant shutdown at Moa due to scheduled maintenance repairs. Input costs, in particular, were negatively impacted by the 65% increase in sulphur prices, 160% increase in fuel oil prices, and 46% increase in natural gas prices. Higher MPR costs were partially offset by the effect of Cuba’s unification of its currencies in lowering labour and other service expenses.

Net direct cash cost (NDCC) per pound of nickel sold in Q2 2021 was US$4.58/lb, up 17% from last year. The increase was primarily driven by MPR costs, but partially offset by the 73% improvement in cobalt by-product credits due to higher average-realized prices, and by the higher cobalt to nickel production ratio. Lower fertilizer and other by-product credits were driven by higher fertilizer and sulphuric-acid production costs due to higher sulphur and energy prices.

Sustaining capital spending in Q2 2021 was $7.7 million, down 19% from $9.5 million in Q2 2020 for the same period last year. The year-over-year decrease was due primarily to the timing of planned capital expenditures. Sherritt’s share of planned spending at the Moa JV and Fort Site in 2021 is unchanged at US$44 million, and primarily earmarked for the continued replacement of mine and plant equipment.

Sherritt has begun preliminary discussions with its Moa JV partner on brownfield expansion opportunities, including the launch of a slurry preparation plant initiative that would result in improved ore sorting and processing as well as reduced transportation expenses.

Power


For the three months ended


For the six months ended


2021


2020


2021


2020


$ millions (33 ⅓% basis), except as otherwise noted


June 30


June 30


Change


June 30


June 30


Change


FINANCIAL HIGHLIGHTS


Revenue


$

7.0


$

9.6


(27

%)


$

12.9


$

19.0


(32

%)

(Loss) earnings from operations


(0.2

)


1.6


(113

%)


(1.3

)


2.9


(145

%)

Adjusted EBITDA(1)


3.7


7.0


(47

%)


6.5


13.5


(52

%)


CASH FLOW


Cash provided by operations


$

11.5


$

8.3


39

%


$

14.3


$

26.7


(46

%)

Free cash flow(1)


11.5


8.3


39

%


14.3


26.7


(46

%)


PRODUCTION AND SALES


Electricity (GWh(2))


115


153


(25

%)


210


306


(31

%)


AVERAGE-REALIZED PRICE(1)


Electricity ($/MWh(2))


$

52.60


$

58.48


(10

%)


$

53.60


$

57.73


(7

%)


UNIT OPERATING COSTS(1)


Electricity ($/MWh)


21.03


14.12


49

%


23.23


14.34


62

%


NET CAPACITY FACTOR (%)


37


49


(24

%)


33


48


(31

%)


SPENDING ON CAPITAL


Sustaining


$

-


$

-


-


$

-


$

-


-


$

-


$

-


-


$

-


$

-


-


Contacts

For further investor information contact:
Joe Racanelli, Director of Investor Relations
Telephone: (416) 935-2457
Toll-free: 1 (800) 704-6698
E-mail: This email address is being protected from spambots. You need JavaScript enabled to view it.

Sherritt International Corporation
Bay Adelaide Centre, East Tower
22 Adelaide St. West, Suite 4220
Toronto, ON M5H 4E3
www.sherritt.com


Read full story here

HARTFORD, Conn. & BOSTON--(BUSINESS WIRE)--Eversource Energy (NYSE: ES) today reported earnings of $264.5 million, or $0.77 per share, in the second quarter of 2021, compared with earnings of $252.2 million, or $0.75 per share, in the second quarter of 2020. In the first half of 2021, Eversource Energy earnings totaled $630.7 million, or $1.83 per share, compared with earnings of $587 million, or $1.75 per share, in the first half of 2020.


Results for both years include charges primarily related to the October 2020 acquisition of the assets of Columbia Gas of Massachusetts. Those charges totaled $6.8 million in the second quarter of 2021 and $13 million in the first half of 2021, compared with charges of $3.9 million in the second quarter of 2020 and $7.4 million in the first half of 2020. Absent those charges, Eversource earned $271.3 million1, or $0.79 per share1, in the second quarter of 2021 and $643.7 million1, or $1.87 per share1, in the first half of 2021.

Eversource Energy also today reaffirmed its previously disclosed 2021 earnings per share (EPS) projection toward the lower end of a range of $3.81 to $3.93 per share. That guidance includes a charge of $0.07 per share in the first quarter of 2021 related to Connecticut regulators’ assessment of the company’s performance restoring power in August 2020 following the catastrophic damage from Tropical Storm Isaias. Eversource Energy also today reaffirmed its long-term EPS growth rate from its existing core regulated businesses in the upper half of 5-7 percent, using the $3.64 per share1 earned in 2020 as a base.

We remain a steadfast partner in our region’s efforts to enhance its infrastructure and reduce its carbon footprint,” said Joe Nolan, Eversource president and chief executive officer. “We continue to advance a large number of innovative clean energy initiatives, and despite the challenges posed by Tropical Storm Elsa and a large number of damaging thunderstorms earlier this month, our employees worked around the clock to support our customers and repair tree-caused damage as promptly and safely as possible. We are pleased that this work by our employees is being recognized by customers and our policymakers.”

Electric Transmission

Eversource Energy’s transmission segment earned $137.6 million in the second quarter of 2021 and $273 million in the first half of 2021, compared with earnings of $129.5 million in the second quarter of 2020 and $256.2 million in the first half of 2020. Transmission segment results improved due to a higher level of investment in Eversource’s electric transmission system.

Electric Distribution

Eversource Energy’s electric distribution segment earned $121.6 million in the second quarter of 2021 and $214.9 million in the first half of 2021, compared with earnings of $115 million in the second quarter of 2020 and $245.1 million in the first half of 2020. Improved second-quarter results were due primarily to higher revenues, offset by higher operation and maintenance expense, depreciation and property taxes. Lower first half results in 2021 are primarily the result of the aforementioned first-quarter storm performance charge.

Natural Gas Distribution

Eversource Energy’s natural gas distribution segment earned $4.1 million in the second quarter of 2021 and $151.6 million in the first half of 2021, compared with earnings of $2.6 million in the second quarter of 2020 and $88.6 million in the first half of 2020. Improved second-quarter results were primarily the result of higher revenues. Higher first-half results in 2021 were due primarily to the addition of the former Columbia Gas of Massachusetts assets, most of which are now held by Eversource Gas Company of Massachusetts.

Water Distribution

Eversource’s water segment earned $8.9 million in the second quarter of 2021 and $12.6 million in the first half of 2021, compared with earnings of $10.4 million in the second quarter of 2020 and $12.5 million in the first half of 2020. Lower second-quarter results were primarily due to lower revenues due to the sale of the water system around Hingham, Massachusetts in mid-2020.

Eversource Parent and Other Companies

Eversource Energy parent and other companies had losses of $7.7 million in the second quarter of 2021 and $21.4 million in the first half of 2021, compared with losses of $5.3 million in the second quarter of 2020 and $15.4 million in the first half of 2020. Higher losses primarily reflect the impact of acquisition-related costs related to the Columbia Gas assets and Aquarion Company’s pending acquisition of New England Service Company.

The following table reconciles 2021 and 2020 second quarter and first half earnings per share:


Second Quarter

First Six Months


2020


Reported EPS

$0.75

$1.75


Higher electric transmission earnings in 2021, offset by dilution

0.01

 0.03


Addition of Eversource Gas Co. of MA results and higher natural gas revenues in 2021, offset by higher depreciation, O&M, property tax expense and dilution at the natural gas segment

0.00

0.18


Higher electric distribution revenues in 2021, offset by higher O&M, depreciation, property taxes and interest expense at the electric distribution segment

0.02

 0.00


Higher storm expense in 2021

(0.01)

(0.04)


First-quarter 2021 storm-related charge

0.00

(0.07)


Other

0.01

0.00


Incremental charges related to acquisitions in 2021

(0.01)

(0.02)


2021


Reported EPS

$0.77

$1.83

Financial results by segment for the second quarter and first six months of 2021 and 2020 are noted below:

Three months ended:


(in millions, except EPS)


June 30, 2021


June 30, 2020


Increase/
(Decrease)


 2021 EPS1


Electric Transmission


$137.6


$129.5


$8.1


$0.40


Electric Distribution


121.6


115.0


6.6


0.35


Natural Gas Distribution


4.1


2.6


1.5


0.01


Water Distribution


8.9


10.4


(1.5)


0.03


Eversource Parent and Other Companies1


(0.9)


(1.4)


0.5


0.00


Charges related to acquisitions


(6.8)


(3.9)


(2.9)


(0.02)


Reported Earnings


$264.5


$252.2


$12.3


$0.77


Six months ended:


(in millions, except EPS)


 June 30, 2021


 June 30, 2020


Increase/
(Decrease)


 2021 EPS1


Electric Transmission


$273.0


$256.2


$16.8


$0.79


Electric Distribution


214.9


245.1


(30.2)


0.62


Natural Gas Distribution


151.6


88.6


63.0


0.44


Water Distribution


12.6


12.5


0.1


0.04


Eversource Parent and Other Companies1


(8.4)


(8.0)


(0.4)


(0.02)


Charges related to acquisitions


(13.0)


(7.4)


(5.6)


(0.04)


Reported Earnings


$630.7


$587.0


$43.7


$1.83


Eversource Energy has approximately 344 million common shares outstanding and operates New England’s largest energy delivery system. It serves approximately 4.3 million electric, natural gas and water customers in Connecticut, Massachusetts and New Hampshire.


Note: Eversource Energy will webcast a conference call with senior management on July 30, 2021, beginning at 9 a.m. Eastern Time. The webcast and associated slides can be accessed through Eversource Energy’s website at www.eversource.com.


1 All per-share amounts in this news release are reported on a diluted basis. The only common equity securities that are publicly traded are common shares of Eversource Energy. The earnings and EPS of each business do not represent a direct legal interest in the assets and liabilities of such business, but rather represent a direct interest in Eversource Energy's assets and liabilities as a whole. EPS by business is a financial measure not recognized under generally accepted accounting principles (non-GAAP) that is calculated by dividing the net income or loss attributable to common shareholders of each business by the weighted average diluted Eversource Energy common shares outstanding for the period. Earnings discussions also include a non-GAAP financial measure referencing 2021 and 2020 earnings and EPS excluding certain acquisition and transition costs. Eversource Energy uses these non-GAAP financial measures to evaluate and provide details of earnings results by business and to more fully compare and explain 2021 and 2020 results without including these items. Management believes the acquisition and transition costs are not indicative of Eversource Energy’s ongoing costs and performance. Due to the nature and significance of the effect of these items on net income attributable to common shareholders and EPS, management believes that the non-GAAP presentation is a more meaningful representation of Eversource Energy’s financial performance and provides additional and useful information to readers in analyzing historical and future performance of the business. These non-GAAP financial measures should not be considered as alternatives to Eversource Energy’s consolidated net income attributable to common shareholders or EPS determined in accordance with GAAP as indicators of Eversource Energy’s operating performance.

This document includes statements concerning Eversource Energy’s expectations, beliefs, plans, objectives, goals, strategies, assumptions of future events, future financial performance or growth and other statements that are not historical facts. These statements are “forward-looking statements” within the meaning of the Private Securities Litigation Reform Act of 1995. Generally, readers can identify these forward-looking statements through the use of words or phrases such as “estimate,” “expect,” “anticipate,” “intend,” “plan,” “project,” “believe,” “forecast,” “should,” “could” and other similar expressions. Forward-looking statements involve risks and uncertainties that may cause actual results or outcomes to differ materially from those included in the forward-looking statements. Factors that may cause actual results to differ materially from those included in the forward-looking statements include, but are not limited to: cyberattacks or breaches, including those resulting in the compromise of the confidentiality of our proprietary information and the personal information of our customers; disruptions in the capital markets or other events that make our access to necessary capital more difficult or costly; the negative impacts of the novel coronavirus (COVID-19) pandemic, including any new or emerging variants, on our customers, vendors, employees, regulators, and operations; changes in economic conditions, including impact on interest rates, tax policies, and customer demand and payment ability; ability or inability to commence and complete our major strategic development projects and opportunities; acts of war or terrorism, physical attacks or grid disturbances that may damage and disrupt our electric transmission and electric, natural gas, and water distribution systems; actions or inaction of local, state and federal regulatory, public policy and taxing bodies; substandard performance of third-party suppliers and service providers; fluctuations in weather patterns, including extreme weather due to climate change; changes in business conditions, which could include disruptive technology or development of alternative energy sources related to our current or future business model; contamination of, or disruption in, our water supplies; changes in levels or timing of capital expenditures; changes in laws, regulations or regulatory policy, including compliance with environmental laws and regulations; changes in accounting standards and financial reporting regulations; actions of rating agencies; and other presently unknown or unforeseen factors.

Other risk factors are detailed in Eversource Energy’s reports filed with the Securities and Exchange Commission (SEC). They are updated as necessary and available on Eversource Energy’s website at www.eversource.com and on the SEC’s website at www.sec.gov. All such factors are difficult to predict and contain uncertainties that may materially affect Eversource Energy’s actual results, many of which are beyond our control. You should not place undue reliance on the forward-looking statements, as each speaks only as of the date on which such statement is made, and, except as required by federal securities laws, Eversource Energy undertakes no obligation to update any forward-looking statement or statements to reflect events or circumstances after the date on which such statement is made or to reflect the occurrence of unanticipated events.

EVERSOURCE ENERGY AND SUBSIDIARIES
CONDENSED CONSOLIDATED STATEMENTS OF INCOME
(Unaudited)


For the Three Months Ended June 30,


For the Six Months Ended June 30,

(Thousands of Dollars, Except Share Information)

2021


2020


2021


2020


Operating Revenues

$

2,122,538


$

1,953,128


$

4,948,378


$

4,326,854


Operating Expenses:


Purchased Power, Fuel and Transmission

650,087


630,132


1,648,578


1,506,703


Operations and Maintenance

411,147


332,055


876,689


674,117


Depreciation

274,647


240,516


545,352


476,727


Amortization

5,611


23,397


113,624


73,172


Energy Efficiency Programs

128,955


115,354


317,018


263,747


Taxes Other Than Income Taxes

200,486


178,019


409,944


359,613


Total Operating Expenses

1,670,933


1,519,473


3,911,205


3,354,079


Operating Income

451,605


433,655


1,037,173


972,775


Interest Expense

145,435


134,285


283,201


269,000


Other Income, Net

46,619


30,243


80,820


54,347


Income Before Income Tax Expense

352,789


329,613


834,792


758,122


Income Tax Expense

86,389


75,501


200,370


167,379


Net Income

266,400


254,112


634,422


590,743


Net Income Attributable to Noncontrolling Interests

1,880


1,880


3,759


3,759


Net Income Attributable to Common Shareholders

$

264,520


$

252,232


$

630,663


$

586,984


Basic and Diluted Earnings Per Common Share

$

0.77


$

0.75


$

1.83


$

1.75


Weighted Average Common Shares Outstanding:


Basic

343,844,626


337,946,663


343,761,435


334,524,452


Diluted

344,435,696


338,561,649


344,385,193


335,749,404


The data contained in this report is preliminary and is unaudited. This report is being submitted for the sole purpose of providing information to shareholders about Eversource Energy and Subsidiaries and is not a representation, prospectus, or intended for use in connection with any purchase or sale of securities.


Contacts

Jeffrey R. Kotkin
(860) 665-5154

Hardware Matter is Resolved

BAYPORT TERMINAL PERMIT IS RENEWED AS IMPORTS CONTINUE TO POUR IN

AND JUNETEENTH HOLIDAY RECOGNIZED

HOUSTON--(BUSINESS WIRE)--Truck gate operations have resumed Thursday afternoon at Barbours Cut and Bayport Terminals, following resolution of computer hardware issues that closed both terminals to truck traffic for two and a half days. “Extended gate times are planned through the weekend - or as long as needed – until business is caught up,” Port Houston Executive Director Roger Guenther said.


Guenther expressed regret to customers and partners, including truckers, and appreciation for their patience while resolving the issue. Guenther said, “We will take a strong look to find what caused the problem, and measures will be put in place to help prevent it from happening again.”

In more Port Houston news, the U.S. Army Corps of Engineers renewed the federal permit for Port Houston’s Bayport Terminal. This significant milestone was officially announced and applauded during the July meeting of the Port Commission of the Port of Houston Authority held last week.

This crucial permit allows Port Houston to continue its master plan for construction to build out the Bayport Terminal, which includes its current $200 million expansion program to complete Wharf 6, Container Yard 2, and other projects – part of Port Houston continuing efforts to remain ahead of accelerating demand.

Port Chairman Ric Campo also announced Port Houston was on track in the coming weeks to enter into a Project Partnership Agreement or PPA with the Army Corps, a key step in Project 11 widening construction program of the Houston Ship Channel. Signatures and other final actions began processing this week, and a formal announcement is planned.

Container volume recorded a 39% increase over last June, Executive Director Roger Guenther told the commission in his staff report. Port Houston has handled containers totaling more than 1.6 million twenty-foot-equivalent units (TEU) at the midpoint of 2021, reflecting a 13% increase. Underscoring the constant increase in business, he notes “imports continue to pour into Houston as we continue to reach new record highs for gate moves and single vessel moves.”

Further highlighting the escalating momentum of the container business, Guenther shared that for the first time ever, Barbours Cut Terminal outpaced Bayport in loaded container gate moves (15,000 vs. 14,000) during the month of July, as a new record was also set at Barbours Cut with 5,687 single vessel moves working The ONE Matrix.

Emphasizing Port Houston’s sustainable operations efforts, Guenther noted that Bayport had just received five new hybrid-electric rubber-tired gantry cranes (RTGs), with the next delivery of an additional four RTGs expected in August. He added that the beginning construction stages for Wharf 6 at Bayport can now be seen. The project began last month and will take nearly two years to complete.

The Port Commission and the Port Commission Citizens Advisory Council were also briefed on Port Houston’s draft Sustainability Action Plan, which includes twenty seven opportunities for it to lead, partner or support these initiatives in the region.

Making history, the Port Commission unanimously endorsed the observance of Juneteenth as an annual holiday for Port Houston employees. Chairman Campo praised U.S. Senator John Cornyn and U.S. Representative Sheila Jackson Lee for providing leadership in Congress as the primary sponsors of legislation making Juneteenth a federal holiday. Congresswoman Jackson Lee personally expressed her appreciation for this support of the Juneteenth holiday and underscored her continued support of the channel expansion project as well.

Chairman Campo emphasized that Juneteenth, “is not only important to Texans but is important to all Americans…we are grateful for it becoming law and receiving the recognition it has long deserved.”

The next regular Port Commission meeting will be held on September 28th in person at the Port Houston Executive Office Building located at 111 East Loop North, Houston, TX 77029.

About Port Houston

For more than 100 years, Port Houston has owned and operated the public wharves and terminals along the Houston Ship Channel, including the area’s largest breakbulk facility and two of the most efficient and fastest-growing container terminals in the country. Port Houston is the advocate and a strategic leader for the Channel. The Houston Ship Channel complex and its more than 200 public and private terminals, collectively known as the Port of Houston, is the nation’s largest port for waterborne tonnage and an essential economic engine for the Houston region, the state of Texas, and the U.S. The Port of Houston supports the creation of nearly 1.35 million jobs in Texas and 3.2 million jobs nationwide, and economic activity totaling $339 billion in Texas – 20.6 percent of Texas’ total gross domestic product (GDP) – and $801.9 billion in economic impact across the nation. For more information, visit the website at www.PortHouston.com.


Contacts

Lisa Ashley, Director, Media Relations
Office: 713-670-2644; Mobile: 832-247-8179
E-mail: This email address is being protected from spambots. You need JavaScript enabled to view it.

LONDON & HOUSTON--(BUSINESS WIRE)--TechnipFMC (NYSE: FTI) (PARIS: FTI) intends to acquire the remaining 49% of shares in TIOS AS, a joint venture between TechnipFMC and Island Offshore Management AS (Island Offshore) formed in 2018. This will accelerate the development of TechnipFMC’s integrated service model focused on maximizing value to our clients.


TIOS provides fully integrated Riserless Light Well Intervention (RLWI) services, including project management and engineering for plug & abandonment, riserless coiled tubing, and well completion and intervention operations, and has serviced over 740 wells globally since 2005.

The company will continue to utilize Island Offshore as the vessel provider for RLWI services.

Jonathan Landes, President, Subsea at TechnipFMC, commented, “We are pleased to welcome TIOS wholly into TechnipFMC. This transaction brings into the company additional expertise that will maximize our capability to provide a complete range of well services globally to our clients in a rapid and economical manner.”

Important Information for Investors and Securityholders

Forward-Looking Statement

This release contains "forward-looking statements" as defined in Section 27A of the United States Securities Act of 1933, as amended, and Section 21E of the United States Securities Exchange Act of 1934, as amended. The words “believe”, “estimated” and other similar expressions are intended to identify forward-looking statements, which are generally not historical in nature. Such forward-looking statements involve significant risks, uncertainties and assumptions that could cause actual results to differ materially from our historical experience and our present expectations or projections. For information regarding known material factors that could cause actual results to differ from projected results, please see our risk factors set forth in our filings with the United States Securities and Exchange Commission, which include our Annual Reports on Form 10-K, Quarterly Reports on Form 10-Q, and Current Reports on Form 8-K. We caution you not to place undue reliance on any forward-looking statements, which speak only as of the date hereof. We undertake no obligation to publicly update or revise any of our forward-looking statements after the date they are made, whether as a result of new information, future events or otherwise, except to the extent required by law.

About TechnipFMC

TechnipFMC is a leading technology provider to the traditional and new energy industries, delivering fully integrated projects, products, and services.

With our proprietary technologies and comprehensive solutions, we are transforming our clients’ project economics, helping them unlock new possibilities to develop energy resources while reducing carbon intensity and supporting their energy transition ambitions.

Organized in two business segments — Subsea and Surface Technologies — we will continue to advance the industry with our pioneering integrated ecosystems (such as iEPCI™, iFEED™ and iComplete™), technology leadership and digital innovation.

Each of our approximately 20,000 employees is driven by a commitment to our clients’ success, and a culture of strong execution, purposeful innovation, and challenging industry conventions.

TechnipFMC uses its website as a channel of distribution of material company information. To learn more about how we are driving change in the industry, go to www.TechnipFMC.com and follow us on Twitter @TechnipFMC.


Contacts

Investor relations
Matt Seinsheimer
Vice President, Investor Relations
Tel: +1 281 260 3665
Email: This email address is being protected from spambots. You need JavaScript enabled to view it.

James Davis
Senior Manager, Investor Relations
Tel: +1 281 260 3665
Email: This email address is being protected from spambots. You need JavaScript enabled to view it.

Media relations
Nicola Cameron
Vice President, Corporate Communications
Tel: +44 1383 742297
Email: This email address is being protected from spambots. You need JavaScript enabled to view it.

Catie Tuley
Director, Public Relations
Tel: +1 713 876 7296
Email: This email address is being protected from spambots. You need JavaScript enabled to view it.

HOUSTON--(BUSINESS WIRE)--Safe Marine Transfer, LLC. (SMT) announced that LiquidPower Specialty Products Inc. (LSPI) has taken an equity interest in SMT and has entered a strategic alliance to deliver LSPI’s market leading drag reducing agents (DRA) subsea via SMT’s patented all electric dual barrier subsea storage and delivery technologies. Drag reducing agents (DRA), also known as flow improvers, are long-chain hydrocarbon polymers that act as turbulence inhibitors along the pipe wall to decrease the amount of energy lost in turbulent activity.


The introduction of DRA at the subsea well/drill center has the potential to significantly increase production in a cost-effective manner, by increasing flow rates in existing subsea production lines, subsea gathering lines, and subsea trunk lines. Marina Kaplan, LSPI’s Vice President of Strategy and Corporate Development, “SMT presents LSPI with a unique opportunity to leverage over four decades of pioneering technology, product development and global delivery to a completely new market where we have the potential to significantly increase subsea well tieback production.”

Additionally, SMT announced that Subsea 7 has taken minority equity interest in SMT and entered a Cooperation Agreement to assist in the delivery of SMT’s services and LSPI DRA on a global basis. Mr. Graeme Kinnell, Subsea 7 Board Observer, “Subsea 7 is pleased to be positioned to offer new and unique services to our subsea oil company clients via our relationship with SMT and LSPI. This investment helps support our vision to lead the way in the delivery of offshore projects and services for the energy industry.”

SMT’s CEO and co-founder Art J. Schroeder, Jr., “We are very pleased that these two world-class companies have chosen SMT as a partner to expand their range of products and services. LSPI, as a global leader in drag reduction technology, brings a proven value-add product. Subsea 7, with its global fleet of marine equipment, marine support, manufacturing, and assembly sites offers an established global delivery team. We look forward to jointly working with our subsea oil company customers to deliver additional value in their subsea tiebacks.”

About LiquidPower Specialty Products Inc. (LSPI)

LiquidPower Specialty Products Inc. (LSPI), a Berkshire Hathaway Company, is the global leader in the science and application of drag reduction, with over 40 years of experience. LSPI specializes in DRA technology by maximizing the flow potential of pipelines, increasing operational flexibility and throughput capacity. Through its partnership with SMT, LSPI will provide DRA for subsea application to significantly increase production by creating higher flow rates in existing subsea production lines, subsea gathering lines, and subsea trunk lines. For more information, visit www.liquidpower.com

About Subsea 7

Subsea 7 is a global leader in the delivery of offshore projects and services for the evolving energy industry. Subsea 7 creates sustainable value by being the industry’s partner and employer of choice in delivering the efficient offshore solutions the world needs. For more information, visit www.Subsea7.com

About SMT

Founded in Houston, Texas, in 2012 by Jim Chitwood and Art Schroeder, SMT grew out of a need identified by the oil company driven DeepStar® consortium. Initial partial funding was provided by the National Energy Technology Laboratory (NETL), United States Department of Energy through the Research Partnership to Secure Energy for America (RPSEA), DeepStar® in-kind contributions, and generous industry support. SMT is now focused exclusively on DRA delivery with partners LSPI and Subsea 7. For more information, please visit www.SafeMarineTransfer.com


Contacts

Fernanda Soares
Marketing Communications Manager, LiquidPower Specialty Products Inc. (LSPI)
281-948-4981 | This email address is being protected from spambots. You need JavaScript enabled to view it.

Strategically positioned to capture sustainable value from increasing scale and responsible development

SPRING, Texas--(BUSINESS WIRE)--Southwestern Energy Company (NYSE: SWN) today announced financial and operating results for the second quarter ended June 30, 2021.


  • Integration planning for scale-enhancing acquisition and Haynesville entry ahead of schedule; shareholder vote set for August 27th;
  • Implemented basin-wide project to certify and continuously monitor potential emissions from all Appalachia unconventional wells;
  • Further reduced leverage ratio by 0.4x to 2.6x; sustainable 2x leverage expected in late 2021;
  • Generated $270 million net cash provided by operating activities; invested $259 million consistent with our maintenance capital plan; expect free cash flow to ramp in second half 2021;
  • Captured promised $100 per foot well costs savings on first three Ohio Utica wells;
  • Reported total production of 276 Bcfe, or 3.0 Bcfe per day, including 2.4 Bcf per day of gas and 104 MBbls per day of liquids;
  • Received weighted average realized price (excluding impact of transportation and hedges) of $2.92 per Mcfe; and
  • Approximately 90% of remaining 2021 Appalachia natural gas basis protected; annual differential guidance range remains unchanged.

“Southwestern Energy meaningfully advanced its strategic value-creation objectives during the quarter. The Company announced a significant acquisition that we believe is highly accretive across both equity and credit metrics. The addition of Indigo further positions SWN as a leading natural gas company; it expands our investment opportunities across the nation’s top two natural gas basins and enhances our margins while reducing basis volatility. Additionally, in alignment with our ESG strategy, we initiated the certification and continuous monitoring of all Appalachia unconventional wells. These two strategic actions enhance sustainable and responsible value creation for all stakeholders,” said Bill Way, Southwestern Energy President and Chief Executive Officer.

Financial Results


For the three months ended


For the six months ended


June 30,


June 30,

(in millions)


2021


2020


2021


2020

Net income (loss)


$

(609

)


$

(880

)


$

(529

)


$

(2,427

)

Adjusted net income (loss) (non-GAAP)


$

129


$

(1

)


$

325


$

55


Diluted earnings (loss) per share


$

(0.90

)


$

(1.63

)


$

(0.78

)


$

(4.49

)

Adjusted diluted earnings (loss) per share (non-GAAP)


$

0.19


$

(0.00

)


$

0.48


$

0.10


Adjusted EBITDA (non-GAAP)


$

300


$

106


$

682


$

312


Net cash provided by operating activities


$

270


$

94


$

617


$

254


Net cash flow (non-GAAP)


$

272


$

87


$

626


$

278


Total capital investments (1)


$

259


$

245


$

525


$

482


(1)


Capital investments include a decrease of $9 million for the three months ended June 30, 2021, and increases of $29 million and $8 million for the six months ended June 30, 2021 and 2020, respectively, relating to the change in accrued expenditures between periods. There was no change in the capital accrual for the three months ended June 30, 2020.


For the quarter ended June 30, 2021, Southwestern Energy recorded net loss of $609 million, or ($0.90) per diluted share, compared to a net loss in 2020 of $880 million, or ($1.63) per diluted share. The quarter ended June 30, 2021 included a $772 million loss on unsettled derivatives and the same period for 2020 included a $655 million non-cash impairment and a $229 million loss on unsettled derivatives.

Adjusted net income was $129 million, or $0.19 per diluted share, in the second quarter of 2021, compared to a loss of $1 million, or ($0.00) per diluted share, for the prior year period. The increase was primarily related to a 33% increase in the weighted average realized price including derivatives and a 37% increase in production volumes, largely due to the Montage acquisition. Adjusted EBITDA (non-GAAP) was $300 million, net cash provided by operating activities was $270 million and net cash flow (non-GAAP) was $272 million.

As indicated in the table below, second quarter 2021 weighted average realized price, including $0.37 per Mcfe of transportation expenses, was $2.55 per Mcfe excluding the impact of derivatives. Including derivatives, weighted average realized price (including transportation) for the quarter was up 33% from $1.65 per Mcfe in 2020 to $2.20 per Mcfe in 2021 primarily due to higher commodity prices including a 65% increase in NYMEX Henry Hub and a 137% increase in WTI. Second quarter 2021 weighted average realized price before transportation expense and excluding the impact of derivatives was $2.92 per Mcfe.

At quarter end, the Company had hedges in place for 88% of its remaining 2021 expected natural gas production, 71% of its 2021 expected natural gas liquids (NGLs) production and 89% of its 2021 expected oil production. The Company also has approximately 90% of its remaining 2021 expected natural gas production protected from the impact of widening basis differentials through transportation capacity and basis hedges.

As of June 30, 2021, Southwestern Energy had total debt of $3.0 billion and a leverage ratio of 2.6x, an improvement of 0.4x compared to last quarter. At quarter end, the Company had $568 million of borrowings under its revolving credit facility with $233 million in letters of credit and ample liquidity of $1.2 billion.

Realized Prices


For the three months ended


For the six months ended

(includes transportation costs)


June 30,


June 30,


2021


2020


2021


2020

Natural Gas Price:


NYMEX Henry Hub price ($/MMBtu) (1)


$

2.83


$

1.72


$

2.76


$

1.83


Discount to NYMEX (2)


(0.91

)


(0.74

)


(0.74

)


(0.57

)

Realized gas price per Mcf, excluding derivatives


$

1.92


$

0.98


$

2.02


$

1.26


Gain (loss) on settled financial basis derivatives ($/Mcf)


0.03


(0.05

)


0.11


0.03


Gain (loss) on settled commodity derivatives ($/Mcf)


(0.06

)


0.57


(0.02

)


0.43


Realized gas price, including derivatives ($/Mcf)


$

1.89


$

1.50


$

2.11


$

1.72


Oil Price:


WTI oil price ($/Bbl) (3)


$

66.07


$

27.85


$

61.96


$

37.01


Discount to WTI


(8.57

)


(12.16

)


(8.92

)


(9.46

)

Realized oil price, excluding derivatives ($/Bbl)


$

57.50


$

15.69


$

53.04


$

27.55


Realized oil price, including derivatives ($/Bbl)


$

38.37


$

41.64


$

37.70


$

44.08


NGL Price:


Realized NGL price, excluding derivatives ($/Bbl)


$

23.24


$

6.43


$

23.05


$

7.29


Realized NGL price, including derivatives ($/Bbl)


$

15.87


$

8.22


$

15.99


$

9.50


Percentage of WTI, excluding derivatives


35

%


23

%


37

%


20

%

Total Weighted Average Realized Price:


Excluding derivatives ($/Mcfe)


$

2.55


$

1.05


$

2.58


$

1.37


Including derivatives ($/Mcfe)


$

2.20


$

1.65


$

2.36


$

1.90


(1)


Based on last day monthly futures settlement prices.

(2)

This discount includes a basis differential, a heating content adjustment, physical basis sales, third-party transportation charges and fuel charges, and excludes financial basis derivatives.

(3)

Based on the average daily settlement price of the nearby month futures contract over the period.


Operational Results
Total production for the quarter ended June 30, 2021 was 276 Bcfe, of which 79% was natural gas, 17% NGLs and 4% oil. Capital investments totaled $259 million for the second quarter, with 23 wells drilled, 19 wells completed and 31 wells placed to sales.


For the three months ended


For the six months ended


June 30,


June 30,


2021


2020


2021


2020

Production


Gas production (Bcf)


219


158


433


314


Oil production (MBbls)


1,831


1,083


3,493


2,482


NGL production (MBbls)


7,666


6,111


15,244


12,239


Total production (Bcfe)


276


201


545


402


Total production (Bcfe/day)


3.0


2.2


3.0


2.2


Average unit costs per Mcfe


Lease operating expenses (1)


$

0.94


$

0.91


$

0.94


$

0.94


General & administrative expenses (2,3)


$

0.11


$

0.14


$

0.12


$

0.13


Taxes, other than income taxes


$

0.10


$

0.05


$

0.09


$

0.06


Full cost pool amortization


$

0.34


$

0.38


$

0.34


$

0.46


(1)


Includes post-production costs such as gathering, processing, fractionation and compression.

(2)

Excludes $3 million and $4 million in merger-related expenses for the three and six months ended June 30, 2021, respectively, and $1 million and $7 million in restructuring charges for the three and six months ended June 30, 2021, respectively.

(3)

Excludes $2 million and $12 million in restructuring charges for the three and six months ended June 30, 2020, respectively.


Southwest Appalachia – In the second quarter, total production was 153 Bcfe, with NGL production of 84 MBbls per day and oil production of 20 MBbls per day. The Company drilled 15 wells, completed 12 wells and placed 20 wells to sales with an average lateral length of 15,067 feet.

Nine of the wells to sales were located in the rich acreage with an average 30-day rate of 19 MMcfe per day, including 44% liquids, and eight of the wells to sales were located in the super rich acreage with an average 30-day rate of 13 MMcfe per day, including 67% liquids. The remaining three wells placed to sales this quarter were the Company’s first dry gas Ohio Utica wells. These wells had an average lateral length of 13,781 feet and each had an average 30-day rate of 25 MMcf per day.

Northeast Appalachia – Second quarter 2021 production was 123 Bcf. The Company drilled eight wells, completed seven wells and placed 11 wells to sales with an average lateral length of 11,568 feet and an average 30-day rate of 14 MMcf per day.

E&P Division Results

For the three months ended

June 30, 2021


For the six months ended

June 30, 2021


Northeast


Southwest


Northeast


Southwest

Gas production (Bcf)


123


96


241


192


Liquids production


Oil (MBbls)


1,826


3,484


NGL (MBbls)


7,665


15,242


Production (Bcfe)


123


153


241


304


Gross operated production June 2021 (MMcfe/d)


1,645


2,486


Net operated production June 2021 (MMcfe/d)


1,346


1,691


Capital investments ($ in millions)


Drilling and completions, including workovers

$

75


$

127


$

146


$

269


Land acquisition and other


3


11


7


20


Capitalized interest and expense


7


31


12


63


Total capital investments

$

85


$

169


$

165


$

352


Gross operated well activity summary


Drilled


8


15


19


27


Completed


7


12


19


29


Wells to sales


11


20


19


29


Average well cost on wells to sales (millions)

$

6.1


$

10.0


$

7.2


$

9.4


Average lateral length (ft)


11,568


15,067


12,369


14,311


Total weighted average realized price per Mcfe, excluding derivatives

$

1.87


$

3.10


$

2.05


$

3.01


Third Quarter 2021 Price Guidance
Based on current market conditions, Southwestern expects third quarter price differentials to be within the following ranges before the impact of the Indigo acquisition. The Company maintains its full year 2021 price differential guidance before the impact of the Indigo acquisition.

Natural gas discount to NYMEX including transportation (1)

$0.90 – $1.00 per Mcf

Natural gas liquids realization as a % of WTI including transportation

38% – 44%

(1)


Includes the impact of basis hedges.


Conference Call
Southwestern Energy will host a conference call on Friday, July 30, 2021 at 9:30 a.m. Central to discuss second quarter 2021 results. To participate, dial US toll-free 877-883-0383, or international 412-902-6506 and enter access code 3889842. A live webcast will be available at ir.swn.com.

About Southwestern Energy
Southwestern Energy Company (NYSE: SWN) is a leading U.S. producer of natural gas and natural gas liquids focused on responsibly developing large-scale energy assets in the nation’s most prolific shale gas basins. SWN’s returns-driven strategy strives to create sustainable value for its stakeholders by leveraging its scale, financial strength and operational execution. For additional information, please visit www.swn.com and www.swn.com/responsibility.

Forward Looking Statement
Certain statements and information in this news release may constitute “forward-looking statements” within the meaning of Section 27A of the Securities Act of 1933, as amended, and Section 21E of the Exchange Act, as amended. The words “believe,” “expect,” “anticipate,” “plan,” "predict," “intend,” "seek," “foresee,” “should,” “would,” “could,” “attempt,” “appears,” “forecast,” “outlook,” “estimate,” “project,” “potential,” “may,” “will,” “likely,” “guidance,” “goal,” “model,” “target,” “budget” and other similar expressions are intended to identify forward-looking statements, which are generally not historical in nature. Statements may be forward looking even in the absence of these particular words. Examples of forward-looking statements include, but are not limited to, statements regarding the proposed acquisition of Indigo Natural Resources LLC (the “Proposed Transaction”), expected synergies and other benefits from and costs in connection with the Proposed Transaction, estimated financial metrics giving effect to the Proposed Transaction, our financial position, business strategy, production, reserve growth and other plans and objectives for our future operations, and generation of free cash flow. These forward-looking statements are based on our current expectations and beliefs concerning future developments and their potential effect on us. The forward-looking statements contained in this document are largely based on our expectations for the future, which reflect certain estimates and assumptions made by our management. These estimates and assumptions reflect our best judgment based on currently known market conditions, operating trends, and other factors. Although we believe such estimates and assumptions to be reasonable, they are inherently uncertain and involve a number of risks and uncertainties that are beyond our control. As such, management’s assumptions about future events may prove to be inaccurate. For a more detailed description of the risks and uncertainties involved, see “Risk Factors” in our most recently filed Annual Report on Form 10-K, subsequent Quarterly Reports on Form 10-Q, Current Reports on Form 8-K, and other SEC filings. We do not intend to publicly update or revise any forward-looking statements as a result of new information, future events, changes in circumstances, or otherwise. These cautionary statements qualify all forward-looking statements attributable to us, or persons acting on our behalf. Management cautions you that the forward-looking statements contained herein are not guarantees of future performance, and we cannot assure you that such statements will be realized or that the events and circumstances they describe will occur. Factors that could cause actual results to differ materially from those anticipated or implied in the forward-looking statements herein include, but are not limited to: the timing and extent of changes in market conditions and prices for natural gas, oil and natural gas liquids (“NGLs”), including regional basis differentials and the impact of reduced demand for our production and products in which our production is a component due to governmental and societal actions taken in response to COVID-19 or other public health crises and any related company or governmental policies and actions to protect the health and safety of individuals or governmental policies or actions to maintain the functioning of national or global economies and markets; our ability to fund our planned capital investments; a change in our credit rating, an increase in interest rates and any adverse impacts from the discontinuation of the London Interbank Offered Rate; the extent to which lower commodity prices impact our ability to service or refinance our existing debt; the impact of volatility in the financial markets or other global economic factors; difficulties in appropriately allocating capital and resources among our strategic opportunities; the timing and extent of our success in discovering, developing, producing and estimating reserves; our ability to maintain leases that may expire if production is not established or profitably maintained; our ability to realize the expected benefits from recent acquisitions or the Proposed Transaction; costs in connection with the Proposed Transaction; the consummation of or failure to consummate the Proposed Transaction and the timing thereof; costs in connection with the Proposed Transaction; integration of operations and results subsequent to the Proposed Transaction; our ability to transport our production to the most favorable markets or at all; the impact of government regulation, including changes in law, the ability to obtain and maintain permits, any increase in severance or similar taxes, and legislation or regulation relating to hydraulic fracturing, climate and over-the-counter derivatives; the impact of the adverse outcome of any material litigation against us or judicial decisions that affect us or our industry generally; the effects of weather; increased competition; the financial impact of accounting regulations and critical accounting policies; the comparative cost of alternative fuels; credit risk relating to the risk of loss as a result of non-performance by our counterparties; and any other factors listed in the reports we have filed and may file with the SEC that are incorporated by reference herein. All written and oral forward-looking statements attributable to us are expressly qualified in their entirety by this cautionary statement.


SOUTHWESTERN ENERGY COMPANY AND SUBSIDIARIES

CONSOLIDATED STATEMENTS OF OPERATIONS

(Unaudited)


For the three months ended


For the six months ended


June 30,


June 30,

(in millions, except share/per share amounts)


2021


2020


2021


2020

Operating Revenues:


Gas sales


$

433


$

164


$

897


$

412


Oil sales


106


19


187


71


NGL sales


179


40


352


90


Marketing


332


187


684


426


Other


2


3


1,050


410


2,122


1,002


Operating Costs and Expenses:


Marketing purchases


333


201


689


449


Operating expenses


259


182


509


375


General and administrative expenses


34


32


72


58


Merger-related expenses


3


4


Restructuring charges


1


2


7


12


Depreciation, depletion and amortization


100


84


196


197


Impairments


655


2,134


Taxes, other than income taxes


27


10


51


23


757


1,166


1,528


3,248


Operating Income (Loss)


293


(756

)


594


(2,246

)

Interest Expense:


Interest on debt


48


40


98


80


Other interest charges


3


3


6


5


Interest capitalized


(21

)


(21

)


(43

)


(44

)


30


22


61


41


Gain (Loss) on Derivatives


(871

)


(109

)


(1,062

)


230


Gain on Early Extinguishment of Debt


7


35


Other Income (Loss), Net


(1

)


1


Income (Loss) Before Income Taxes


(609

)


(880

)


(529

)


(2,021

)

Provision (Benefit) for Income Taxes:


Current


(2

)

Deferred


408


406


Net Income (Loss)


$

(609

)


$

(880

)


$

(529

)


$

(2,427

)


Earnings (Loss) Per Common Share:


Basic


$

(0.90

)


$

(1.63

)


$

(0.78

)


$

(4.49

)

Diluted


$

(0.90

)


$

(1.63

)


$

(0.78

)


$

(4.49

)


Weighted Average Common Shares Outstanding:


Basic


676,722,999


541,079,192


676,057,534


540,693,841


Diluted


676,722,999


541,079,192


676,057,534


540,693,841


SOUTHWESTERN ENERGY COMPANY AND SUBSIDIARIES

CONSOLIDATED BALANCE SHEETS

(Unaudited)


June 30,

2021


December 31,

2020

ASSETS


(in millions)

Current assets:


Cash and cash equivalents


$

2


$

13


Accounts receivable, net


408


368


Derivative assets


132


241


Other current assets


51


49


Total current assets


593


671


Natural gas and oil properties, using the full cost method


27,796


27,261


Other


496


523


Less: Accumulated depreciation, depletion and amortization


(23,846

)


(23,673

)

Total property and equipment, net


4,446


4,111


Operating lease assets


147


163


Deferred tax assets


Other long-term assets


208


215


Total long-term assets


355


378


TOTAL ASSETS


$

5,394


$

5,160


LIABILITIES AND EQUITY


Current liabilities:


Current portion of long-term debt


$

207


$


Accounts payable


653


573


Taxes payable


62


74


Interest payable


57


58


Derivative liabilities


901


245


Current operating lease liabilities


41


42


Other current liabilities


23


20


Total current liabilities


1,944


1,012


Long-term debt


2,814


3,150


Long-term operating lease liabilities


104


117


Long-term derivative liabilities


355


183


Pension and other postretirement liabilities


33


45


Other long-term liabilities


162


156


Total long-term liabilities


3,468


3,651


Commitments and contingencies


Equity:


Common stock, $0.01 par value; 1,250,000,000 shares authorized; issued 721,372,443 shares as of June 30, 2021 and 718,795,700 shares as of December 31, 2020


7


7


Additional paid-in capital


5,104


5,093


Accumulated deficit


(4,892

)


(4,363

)

Accumulated other comprehensive loss


(35

)


(38

)

Common stock in treasury, 44,353,224 shares as of June 30, 2021 and December 31, 2020


(202

)


(202

)

Total equity


(18

)


497


TOTAL LIABILITIES AND EQUITY


$

5,394


$

5,160


SOUTHWESTERN ENERGY COMPANY AND SUBSIDIARIES

CONDENSED CONSOLIDATED STATEMENTS OF CASH FLOWS

(Unaudited)


For the six months ended


June 30,

(in millions)


2021


2020

Cash Flows From Operating Activities:


Net loss


$

(529

)


$

(2,427

)

Adjustments to reconcile net loss to net cash provided by operating activities:


Depreciation, depletion and amortization


196


197


Amortization of debt issuance costs


4


4


Impairments


2,134


Deferred income taxes


408


(Gain) loss on derivatives, unsettled


941


(17

)

Stock-based compensation


2


2


Gain on early extinguishment of debt


(35

)

Other


1


Change in assets and liabilities


Accounts receivable


(40

)


94


Accounts payable


75


(121

)

Taxes payable


(12

)


(11

)

Interest payable


(1

)

Inventories


3


6


Other assets and liabilities


(24

)


21


Net cash provided by operating activities


617


254


Cash Flows From Investing Activities:


Capital investments


(493

)


(472

)

Proceeds from sale of property and equipment


2


2


Other


(1

)


Net cash used in investing activities


(492

)


(470

)


Cash Flows From Financing Activities:


Payments on long-term debt


(72

)

Payments on revolving credit facility


(1,782

)


(919

)

Borrowings under revolving credit facility


1,650


1,221


Change in bank drafts outstanding


(8

)

Debt issuance/amendment costs


(1

)


Cash paid for tax withholding


(3

)


(1

)

Net cash provided by (used in) financing activities


(136

)


221


Increase (decrease) in cash and cash equivalents


(11

)


5


Cash and cash equivalents at beginning of year


13


5


Cash and cash equivalents at end of period

$

2

$

10


Hedging Summary
A detailed breakdown of derivative financial instruments and financial basis positions as of June 30, 2021, including the remainder of 2021 and excluding those positions that settled in the first and second quarter, is shown below. Please refer to the Company’s quarterly report on Form 10-Q to be filed with the Securities and Exchange Commission for complete information on the Company’s commodity, basis and interest rate protection.


Contacts

Investor Contact
Brittany Raiford
Director, Investor Relations
(832) 796-7906
This email address is being protected from spambots. You need JavaScript enabled to view it.

Bernadette Butler
Investor Relations Advisor
(832) 796-6079
This email address is being protected from spambots. You need JavaScript enabled to view it.


Read full story here

  • GAAP 2021 second quarter earnings per share were $0.58 compared with $0.54 in 2020.
  • Xcel Energy reaffirms 2021 EPS earnings guidance of $2.90 to $3.00.

MINNEAPOLIS--(BUSINESS WIRE)--Xcel Energy Inc. (NASDAQ: XEL) today reported 2021 second quarter GAAP and ongoing earnings of $311 million, or $0.58 per share, compared with $287 million, or $0.54 per share in the same period in 2020.


Earnings reflect higher electric and natural gas margins, which more than offset additional depreciation, operating and maintenance (O&M) expenses, interest charges and less allowance for funds used during construction (AFUDC).

Xcel Energy had a strong second quarter, and we reaffirm our 2021 guidance range. We reached constructive rate case settlements in New Mexico, North Dakota and Wisconsin, and continue to make important strides toward our interim goal of 80% carbon-free electricity by 2030 and our ultimate goal of delivering 100% carbon-free electricity to our customers by 2050,” said Ben Fowke, chairman and CEO.

We recently submitted an updated resource plan in Minnesota, which will allow us to reach our carbon reduction goals faster and at a lower cost to our customers. We also received commission approval on two renewable projects, including the largest solar facility in western Wisconsin and a 120-megawatt wind repowering project in Minnesota.”

At 9:00 a.m. CDT today, Xcel Energy will host a conference call to review financial results. To participate in the call, please dial in 5 to 10 minutes prior to the start and follow the operator’s instructions.

US Dial-In:

(888) 204-4368

International Dial-In:

(400) 120-9101

Conference ID:

9915304

The conference call also will be simultaneously broadcast and archived on Xcel Energy’s website at www.xcelenergy.com. To access the presentation, click on Investor Relations. If you are unable to participate in the live event, the call will be available for replay from 12:00 p.m. CDT on July 29 through 12:00 p.m. CDT on August 1.

Replay Numbers


US Dial-In:

(888) 203-1112

International Dial-In:

(719) 457-0820

Access Code:

9915304

Except for the historical statements contained in this report, the matters discussed herein are forward-looking statements that are subject to certain risks, uncertainties and assumptions. Such forward-looking statements, including the 2021 EPS guidance, long-term EPS and dividend growth rate objectives, future sales, future expenses, future tax rates, future operating performance, estimated base capital expenditures and financing plans, projected capital additions and forecasted annual revenue requirements with respect to rider filings, expected rate increases to customers, expectations and intentions regarding regulatory proceedings, and expected impact on our results of operations, financial condition and cash flows of resettlement calculations and credit losses relating to certain energy transactions, as well as assumptions and other statements are intended to be identified in this document by the words “anticipate,” “believe,” “could,” “estimate,” “expect,” “intend,” “may,” “objective,” “outlook,” “plan,” “project,” “possible,” “potential,” “should,” “will,” “would” and similar expressions. Actual results may vary materially. Forward-looking statements speak only as of the date they are made, and we expressly disclaim any obligation to update any forward-looking information. The following factors, in addition to those discussed in Xcel Energy’s Annual Report on Form 10-K for the fiscal year ended Dec. 31, 2020 and subsequent filings with the Securities and Exchange Commission, could cause actual results to differ materially from management expectations as suggested by such forward-looking information: uncertainty around the impacts and duration of the COVID-19 pandemic; operational safety, including our nuclear generation facilities; successful long-term operational planning; commodity risks associated with energy markets and production; rising energy prices and fuel costs; qualified employee work force and third-party contractor factors; ability to recover costs, changes in regulation and subsidiaries’ ability to recover costs from customers; reductions in our credit ratings and the cost of maintaining certain contractual relationships; general economic conditions, including inflation rates, monetary fluctuations and their impact on capital expenditures and the ability of Xcel Energy Inc. and its subsidiaries to obtain financing on favorable terms; availability or cost of capital; our customers’ and counterparties’ ability to pay their debts to us; assumptions and costs relating to funding our employee benefit plans and health care benefits; our subsidiaries’ ability to make dividend payments; tax laws; effects of geopolitical events, including war and acts of terrorism; cyber security threats and data security breaches; seasonal weather patterns; changes in environmental laws and regulations; climate change and other weather; natural disaster and resource depletion, including compliance with any accompanying legislative and regulatory changes; and costs of potential regulatory penalties.

This information is not given in connection with any sale, offer for sale or offer to buy any security.

XCEL ENERGY INC. AND SUBSIDIARIES

CONSOLIDATED STATEMENTS OF INCOME (UNAUDITED)

(amounts in millions, except per share data)


Three Months Ended June 30


Six Months Ended June 30


2021


2020


2021


2020

Operating revenues


Electric


$

2,597


$

2,286


$

5,467


$

4,489


Natural gas


449


280


1,096


863


Other


22


20


46


45


Total operating revenues


3,068


2,586


6,609


5,397


Operating expenses


Electric fuel and purchased power


1,047


833


2,433


1,630


Cost of natural gas sold and transported


218


86


517


371


Cost of sales — other


9


8


17


17


Operating and maintenance expenses


600


550


1,184


1,129


Conservation and demand side management expenses


71


68


144


142


Depreciation and amortization


528


473


1,049


936


Taxes (other than income taxes)


157


146


320


295


Total operating expenses


2,630


2,164


5,664


4,520


Operating income


438


422


945


877


Other income (expense), net


3


5


8


(7

)

Earnings from equity method investments


20


6


34


17


Allowance for funds used during construction — equity


18


37


32


61


Interest charges and financing costs


Interest charges — includes other financing costs of $7, $7, $14 and $14, respectively


212


208


417


407


Allowance for funds used during construction — debt


(6

)


(12

)


(11

)


(22

)

Total interest charges and financing costs


206


196


406


385


Income before income taxes


273


274


613


563


Income tax benefit


(38

)


(13

)


(60

)


(19

)

Net income


$

311


$

287


$

673


$

582


Weighted average common shares outstanding:


Basic


539


527


539


526


Diluted


539


527


539


527


Earnings per average common share:


Basic


$

0.58


$

0.54


$

1.25


$

1.10


Diluted


0.58


0.54


1.25


1.10


XCEL ENERGY INC. AND SUBSIDIARIES
Notes to Investor Relations Earnings Release (Unaudited)

Due to the seasonality of Xcel Energy’s operating results, quarterly financial results are not an appropriate base from which to project annual results.

Non-GAAP Financial Measures

The following discussion includes financial information prepared in accordance with generally accepted accounting principles (GAAP), as well as certain non-GAAP financial measures such as ongoing return on equity (ROE), electric margin, natural gas margin, ongoing earnings and ongoing diluted EPS. Generally, a non-GAAP financial measure is a measure of a company’s financial performance, financial position or cash flows that adjusts measures calculated and presented in accordance with GAAP. Xcel Energy’s management uses non-GAAP measures for financial planning and analysis, for reporting of results to the Board of Directors, in determining performance-based compensation and communicating its earnings outlook to analysts and investors. Non-GAAP financial measures are intended to supplement investors’ understanding of our performance and should not be considered alternatives for financial measures presented in accordance with GAAP. These measures are discussed in more detail below and may not be comparable to other companies’ similarly titled non-GAAP financial measures.

Ongoing ROE

Ongoing ROE is calculated by dividing the net income or loss of Xcel Energy or each subsidiary, adjusted for certain nonrecurring items, by each entity’s average stockholder’s equity. We use these non-GAAP financial measures to evaluate and provide details of earnings results.

Electric and Natural Gas Margins

Electric margin is presented as electric revenues less electric fuel and purchased power expenses. Natural gas margin is presented as natural gas revenues less the cost of natural gas sold and transported. Expenses incurred for electric fuel and purchased power and the cost of natural gas are generally recovered through various regulatory recovery mechanisms. As a result, changes in these expenses are generally offset in operating revenues. Management believes electric and natural gas margins provide the most meaningful basis for evaluating our operations because they exclude the revenue impact of fluctuations in these expenses. These margins can be reconciled to operating income, a GAAP measure, by including other operating revenues, cost of sales - other, O&M expenses, conservation and demand side management (DSM) expenses, depreciation and amortization and taxes (other than income taxes).

Earnings Adjusted for Certain Items (Ongoing Earnings and Ongoing Diluted EPS)

GAAP diluted EPS reflects the potential dilution that could occur if securities or other agreements to issue common stock (i.e., common stock equivalents) were settled. The weighted average number of potentially dilutive shares outstanding used to calculate Xcel Energy Inc.’s diluted EPS is calculated using the treasury stock method. Ongoing earnings reflect adjustments to GAAP earnings (net income) for certain items. Ongoing diluted EPS for Xcel Energy is calculated by dividing net income or loss, adjusted for certain items, by the weighted average fully diluted Xcel Energy Inc. common shares outstanding for the period. Ongoing diluted EPS for each subsidiary is calculated by dividing the net income or loss for such subsidiary, adjusted for certain items, by the weighted average fully diluted Xcel Energy Inc. common shares outstanding for the period.

We use these non-GAAP financial measures to evaluate and provide details of Xcel Energy’s core earnings and underlying performance. We believe these measurements are useful to investors to evaluate the actual and projected financial performance and contribution of our subsidiaries. For the three and six months ended June 30, 2021 and 2020, there were no such adjustments to GAAP earnings and therefore GAAP earnings equal ongoing earnings for these periods.

Note 1. Earnings Per Share Summary

Xcel Energy’s 2021 second quarter earnings were $0.58 per share compared to $0.54 per share in 2020, primarily reflecting higher electric and natural gas margins (driven by capital investment recovery, regulatory outcomes and weather-normalized sales growth as compared to 2020, which was more adversely impacted by COVID-19). These drivers were partially offset by higher depreciation, O&M expenses, interest charges and lower AFUDC.

Summarized diluted EPS for Xcel Energy:


Three Months Ended June 30


Six Months Ended June 30

Diluted Earnings (Loss) Per Share


2021


2020


2021


2020

PSCo


$

0.25


$

0.21


$

0.56


$

0.45


NSP-Minnesota


0.21


0.22


0.45


0.43


SPS


0.13


0.14


0.23


0.22


NSP-Wisconsin


0.03


0.02


0.09


0.09


Earnings from equity method investments - WYCO


0.01


0.01


0.02


0.02


Regulated utility (a)


0.62


0.60


1.35


1.20


Xcel Energy Inc. and Other


(0.04

)


(0.07

)


(0.10

)


(0.10

)

Total (a)


$

0.58


$

0.54


$

1.25


$

1.10


(a) Amounts may not add due to rounding.

PSCo — Earnings increased $0.04 per share for the second quarter of 2021 and $0.11 per share year-to-date. The increase in year-to-date earnings reflects higher natural gas and electric margins (primarily capital investment recovery and regulatory outcomes), partially offset by additional depreciation and other taxes (other than income taxes).

NSP-Minnesota — Earnings decreased $0.01 per share for the second quarter of 2021 and increased $0.02 per share year-to-date. The increase in year-to-date earnings reflects higher electric margin (primarily capital investment recovery), partially offset by increased depreciation and O&M expenses.

SPS — Earnings decreased $0.01 per share for the second quarter of 2021 and increased $0.01 per share year-to-date. The increase in year-to-date earnings reflects higher electric margin (capital investment recovery and regulatory outcomes), partially offset by increased depreciation and O&M expenses.

NSP-Wisconsin — Earnings increased $0.01 per share for the second quarter of 2021 and were flat year-to-date.

Xcel Energy Inc. and Other — Primarily includes financing costs at the holding company and earnings from Energy Impact Partners (EIP) funds equity method investments.

Components significantly contributing to changes in 2021 EPS compared to 2020:

Diluted Earnings (Loss) Per Share


Three Months
Ended June 30


Six Months
Ended June 30

GAAP and ongoing diluted EPS — 2020


$

0.54


$

1.10


Components of change - 2021 vs. 2020


Higher electric margin


0.14


0.25


Higher natural gas margins


0.05


0.12


Lower Effective Tax Rate (ETR) (a)


0.06


0.12


Higher other income (expense), net


0.02


Higher depreciation and amortization


(0.08

)


(0.16

)

Higher O&M expenses


(0.07

)


(0.08

)

Lower AFUDC


(0.05

)


(0.07

)

Higher interest charges


(0.01

)


(0.01

)

Other, net


(0.04

)

GAAP and ongoing diluted EPS — 2021


$

0.58


$

1.25


(a) Includes production tax credits (PTCs) and plant regulatory amounts, which are primarily offset in electric margin.

Note 2. Regulated Utility Results

Estimated Impact of Temperature Changes on Regulated Earnings — Unusually hot summers or cold winters increase electric and natural gas sales, while mild weather reduces electric and natural gas sales. The estimated impact of weather on earnings is based on the number of customers, temperature variances, the amount of natural gas or electricity historically used per degree of temperature and excludes any incremental related operating expenses that could result due to storm activity or vegetation management requirements. As a result, weather deviations from normal levels can affect Xcel Energy’s financial performance. However, sales true-up and decoupling mechanisms in Minnesota and Colorado predominately mitigate the positive and adverse impacts of weather.

Normal weather conditions are defined as either the 10, 20 or 30-year average of actual historical weather conditions. The historical period of time used in the calculation of normal weather differs by jurisdiction, based on regulatory practice. To calculate the impact of weather on demand, a demand factor is applied to the weather impact on sales. Extreme weather variations, windchill and cloud cover may not be reflected in weather-normalized estimates.

Weather — Estimated impact of temperature variations on EPS compared with normal weather conditions:


Three Months Ended June 30


Six Months Ended June 30


2021 vs.
Normal


2020 vs.
Normal


2021 vs. 2020


2021 vs.
Normal


2020 vs.
Normal


2021 vs. 2020

Retail electric

$

0.056


$

0.028


$

0.028


$

0.055


$

0.017


$

0.038


Decoupling and sales true-up

(0.044

)


(0.014

)


(0.030

)


(0.041

)


(0.009

)


(0.032

)

Electric total

$

0.012


$

0.014


$

(0.002

)


$

0.014


$

0.008


$

0.006


Firm natural gas

0.002


0.001


0.001


0.005


(0.006

)


0.011


Total

$

0.014


$

0.015


$

(0.001

)


$

0.019


$

0.002


$

0.017


Sales — Sales growth (decline) for actual and weather-normalized sales in 2021 compared to 2020:


Three Months Ended June 30


PSCo


NSP-Minnesota


SPS


NSP-Wisconsin


Xcel Energy

Actual


Electric residential


%


6.1

%


(5.6

)%


2.7

%


1.9

%

Electric C&I


6.2


10.1


7.5


11.6


8.3


Total retail electric sales


3.9


8.7


5.2


8.9


6.3


Firm natural gas sales


18.8


(9.5

)


N/A


(2.5

)


8.3


Three Months Ended June 30


PSCo


NSP-Minnesota


SPS


NSP-Wisconsin


Xcel Energy

Weather-Normalized


Electric residential


0.7

%


(1.6

)%


(1.3

)%


(2.3

)%


(0.7

)%

Electric C&I


6.5


8.3


8.4


10.2


7.9


Total retail electric sales


4.4


5.0


6.8


6.5


5.3


Firm natural gas sales


12.7


(2.6

)


N/A


6.8


7.6


Six Months Ended June 30


PSCo


NSP-Minnesota


SPS


NSP-Wisconsin


Xcel Energy

Actual


Electric residential


3.2

%


5.6

%


1.8

%


3.8

%


4.0

%

Electric C&I


0.4


1.3


4.5


0.9


Total retail electric sales


1.4


2.7


0.3


4.3


1.8


Firm natural gas sales


8.0


(1.9

)


N/A


4.4


Six Months Ended June 30


PSCo


NSP-Minnesota


SPS


NSP-Wisconsin


Xcel Energy

Weather-Normalized


Electric residential


2.9

%


1.6

%


1.4

%


0.5

%


2.0

%

Electric C&I


0.4


0.4


0.2


3.8


0.6


Total retail electric sales


1.2


0.7


0.5


2.8


1.0


Firm natural gas sales


2.4


(1.6

)


N/A


(0.6

)


0.9


Six Months Ended June 30 (2020 Leap Year Adjusted)


PSCo


NSP-Minnesota


SPS


NSP-Wisconsin


Xcel Energy

Weather-Normalized


Electric residential


3.4

%


2.2

%


2.0

%


1.1

%


2.5

%

Electric C&I


1.0


1.0


0.8


4.4


1.2


Total retail electric sales


1.8


1.3


1.0


3.4


1.6


Firm natural gas sales


3.3


(0.7

)


N/A


0.3


1.8


Weather-normalized and leap-year adjusted electric sales growth (decline) — year-to-date (excluding leap day)

Weather-adjusted sales results for each of our utility subsidiaries in 2021 reflect improving economies as the adverse effects of COVID-19 lessen. The recovery reflects increased sales in the C&I sector as businesses return to a more normal level. Residential sales remain elevated on a year-to-date basis as individuals working from home have just begun returning to the office.

  • PSCo — Residential sales rose based on an increase in the number of customers combined with higher use per customer. The growth in large C&I sales was primarily led by the service, agriculture, food and energy sectors, partially offset by a decrease in the manufacturing sector.
  • NSP-Minnesota — Residential sales growth reflects an increase in the number of customers combined with higher use per customer. The growth in C&I sales was due to customer growth and slightly higher use per customer, primarily in the manufacturing sector.
  • SPS — Residential sales rose based on an increase in the number of customers combined with higher use per customer. C&I sales increased due to higher use per customer and growth attributable to the food sector, partially offset by losses within the energy sector.
  • NSP-Wisconsin — Residential sales growth was attributable to customer additions and higher use per customer. The growth in C&I sales was primarily led by increases in the services, agriculture, food and energy sectors, partially offset by a decrease in the manufacturing sector.

Weather-normalized and leap-year adjusted natural gas sales growth (decline) — year-to-date (excluding leap day)

  • Natural gas sales primarily reflect an increase in the number of customers combined with slightly higher customer use.

Electric Margin — Electric revenues and fuel and purchased power expenses are impacted by fluctuations in the price of natural gas, coal and uranium. However, these price fluctuations have minimal impact on electric margin due to fuel recovery mechanisms that recover fuel expenses. In addition, electric customers receive a credit for PTCs generated, which reduce electric revenue and margin. See Note 5 for discussion of Winter Storm Uri.

Electric revenues and margin:


Three Months Ended June 30


Six Months Ended June 30

(Millions of Dollars)


2021


2020


2021


2020

Electric revenues


$

2,597


$

2,286


$

5,467


$

4,489


Electric fuel and purchased power


(1,047

)


(833

)


(2,433

)


(1,630

)

Electric margin


$

1,550


$

1,453


$

3,034


$

2,859


Changes in electric margin:

(Millions of Dollars)


Three Months
Ended June 30,
2021 vs. 2020


Six Months
Ended June 30,
2021 vs. 2020

Non-fuel riders


$

89


$

133


Regulatory rate outcomes (Texas, New Mexico, Colorado, Wisconsin and North Dakota)


34


78


Proprietary commodity trading, net of sharing - Winter Storm Uri (see Note 5)


27


Sales and demand (a)


24


10


Estimated impact of weather (net of decoupling/sales true-up)


(1

)


5


Wholesale transmission revenue (net)


(8

)


3


PTCs flowed back to customers (offset by lower ETR)


(42

)


(79

)

Other (net)


1


(2

)

Total increase in electric margin


$

97


$

175


(a) Sales excludes weather impact, net of decoupling/sales true-up, and demand is net of sales true-up.

Natural Gas Margin — Natural gas expense varies with changing sales and the cost of natural gas. However, fluctuations in the cost of natural gas has minimal impact on natural gas margin due to cost recovery mechanisms. See Note 5 for discussion of Winter Storm Uri.

Natural gas revenues and margin:


Three Months Ended June 30


Six Months Ended June 30

(Millions of Dollars)


2021


2020


2021


2020

Natural gas revenues


$

449


$

280


$

1,096


$

863


Cost of natural gas sold and transported


(218

)


(86

)


(517

)


(371

)

Natural gas margin


$

231


$

194


$

579


$

492


Changes in natural gas margin:

(Millions of Dollars)


Three Months Ended June 30, 2021 vs. 2020


Six Months Ended June 30, 2021 vs. 2020

Regulatory rate outcomes (Colorado)


$

31


$

71


Estimated impact of weather


1


8


Other (net)


5


8


Total increase in natural gas margin


$

37


$

87


O&M Expenses — O&M expenses increased $50 million, or 9.1%, for the second quarter and $55 million, or 4.9% year-to-date. Significant changes are summarized as follows:

(Millions of Dollars)


Three Months Ended June 30, 2021 vs. 2020


Six Months
Ended June 30,
2021 vs. 2020

Wind


$

14


$

22


Information technology and security


13


17


Natural gas systems


6


9


Distribution


9


8


Other


8


(1

)

Total increase in O&M expenses


$

50


$

55


The increase was primarily due to expenses associated with new wind farms, software infrastructure and security costs, natural gas damage prevention, and timing of distribution expenses, partially offset by continuous improvement initiatives. Quarterly timing impacts also occurred throughout 2020 due to cost control initiatives to mitigate the adverse impact of COVID-19 on sales.

Depreciation and Amortization — Depreciation and amortization increased $55 million, or 11.6%, for the second quarter and $113 million, or 12.1% year-to-date. The increase was primarily driven by several wind farms going into service, as well as normal system expansion. In addition, 2021 depreciation expense increased as a result of implementation of new depreciation rates in various states.

Other Income (Expense) Other income (expense) decreased $2 million for the second quarter and increased $15 million year-to-date, which was largely related to rabbi trust performance primarily offset in O&M expenses (compensation).

AFUDC, Equity and Debt — AFUDC decreased $25 million for the second quarter of 2021 and $40 million year-to-date. The decrease was primarily driven by completion of various wind projects.


Contacts

Paul Johnson, Vice President - Treasurer & Investor Relations, (612) 215-4535

For news media inquiries only, please call Xcel Energy Media Relations, (612) 215-5300

Xcel Energy website address: www.xcelenergy.com


Read full story here

  • Total proved reserves as of June 30, 2021, increased 106% from year-end 2020 to 252.3 million barrels of oil equivalent (“MMBoe”), with an associated PV-10 value of $1.69 billion at SEC Pricing, 87% of which is proved developed
  • Using Strip Pricing as of June 30, 2021, total PV-10 value was approximately $2.4 billion
  • The midyear reserves exclude Northern's recently announced Permian acquisition expected to close in August
  • SEC Pricing as of June 30, 2021, was $49.78 per barrel of oil and $2.428 per MMbtu of natural gas
  • PDP PV-10 value alone exceeds Q1 2021 total debt by 1.5x and 2.0x at SEC Pricing and Strip Pricing, respectively
  • Proved undeveloped reserves included 61.4 net drilling locations, reflecting an average of only 12.3 net organic wells per year over the five-year drill schedule limitation, compared to current guidance of 35.5-37.8 net wells that Northern expects to add to production during 2021

MINNEAPOLIS--(BUSINESS WIRE)--Northern Oil and Gas, Inc. (NYSE American: NOG) today announced its total proved reserves at June 30, 2021, increased 106% from year-end 2020 to 252.3 million barrels of oil equivalent with an associated PV-10 value of $1.69 billion at SEC Pricing. These amounts are calculated under SEC guidelines relating to both commodity price assumptions and a maximum five year drill schedule.


“This reserve report highlights the strength of Northern’s assets, as proved reserves grew 106% before any contribution from our Permian acquisition that is expected to close in August,” commented Northern’s EVP and Chief Engineer, Jim Evans. “As a non-operator, we book limited future PUD locations, and our reserve report does not take into account our active management and anticipated ground game activity. We believe this makes our reserve report significantly conservative relative to our development plan over the coming years. Despite this, at Strip Pricing, Northern’s proved PV-10 value alone exceeds our current enterprise value in the market.”

Table 1: Proved Reserves and PV-10 at SEC Pricing (as of June 30, 2021)


June 30, 2021 - SEC Pricing(1)


Reserve Volumes


PV-10(3)

Reserve Category


Oil
(MBbls)


Natural
Gas
(MMcf)


Total
(MBoe)(2)


%


Amount
(In
thousands)


%

PDP Properties


72,484


412,918


141,303


56

%


$

1,244,088


74

%

PDNP Properties


9,934


380,418


73,338


29


229,876


13


PUD Properties(4)


30,039


45,703


37,656


15


217,683


13


Total Proved


112,457


839,039


252,297


100

%


$

1,691,647


100

%

_____ ___________

(1)

Based on average prices of $49.78 per barrel of oil and $2.428 per MMbtu of natural gas. Under SEC guidelines, these prices represent the average prices at the beginning of each month in the 12-month period prior to the end of the reporting period. The average resulting price used as of June 30, 2021, after adjustment to reflect applicable transportation and quality differentials, was $45.31 per barrel of oil and $1.78 per Mcf of natural gas.

(2)

Boe are computed based on a conversion ratio of one Boe for each barrel of oil and one Boe for every 6,000 cubic feet (i.e., 6 Mcf) of natural gas.

(3)

The pre-tax present value discounted at 10%, or "PV-10," may be considered a non-GAAP financial measure. See “PV-10 Values” below for additional information.

(4)

SEC guidelines only allow for five years of total future drilling inventory.

Table 2: Proved Reserves and PV-10 at Strip Pricing (as of June 30, 2021)

To illustrate the effects of commodity price fluctuations on estimated reserve quantities and present values, Northern is also providing an alternative summary of proved reserves, calculated in accordance with SEC rules, with the exception of using Strip Pricing as of June 30, 2021.


June 30, 2021 - Strip Pricing(1)


Reserve Volumes


PV-10(3)

Reserve Category


Oil
(MBbls)


Natural
Gas
(MMcf)


Total
(MBoe)(2)


%


Amount
(In
thousands)


%

PDP Properties


74,796


418,756


144,589


56

%


$

1,703,267


71

%

PDNP Properties


10,077


380,757


76,536


28


350,825


15


PUD Properties(4)


33,831


49,499


42,081


16


343,478


14


Total Proved


118,704


849,012


260,206


100

%


$

2,397,570


100

%

________________

(1)

Based on current and forward prices as of June 30, 2021. The average resulting price used as of June 30, 2021, after adjustment to reflect applicable transportation and quality differentials, was $52.89 per barrel of oil and $2.13 per Mcf of natural gas.

(2)

Boe are computed based on a conversion ratio of one Boe for each barrel of oil and one Boe for every 6,000 cubic feet (i.e., 6 Mcf) of natural gas.

(3)

The pre-tax present value discounted at 10%, or "PV-10," may be considered a non-GAAP financial measure. See “PV-10 Values” below for additional information.

(4)

SEC guidelines only allow for five years of total future drilling inventory.

Oil & Gas Reserves

Reserve engineering is a process of estimating underground accumulations of oil and natural gas that cannot be measured in an exact way. The accuracy of any reserve estimate depends on the quality of available data, the interpretation of such data and price and cost assumptions made by reservoir engineers. In addition, the results of drilling, testing and production activities may justify revisions of estimates that were made previously. If significant, such revisions would change the schedule of any further production and development drilling. The reserves and PV-10 estimates shown herein are based on an internal reserves report prepared by Northern as of June 30, 2021, based on either “SEC Pricing” (the unweighted first day of the month arithmetic average price of oil and natural gas over the 12 months prior to the determination date) or “Strip Pricing” (commodity prices based on NYMEX, Henry Hub and WTI futures prices) as of June 30, 2021. These estimates do not take into account any derivatives contracts we have entered into to hedge future commodity prices. We believe that the use of Strip Pricing provides useful information about our reserves, as the forward prices are based on the market’s forward looking expectations of oil and natural gas prices as of a certain date. Strip prices are not necessarily a projection of future oil and natural gas prices, and should be carefully considered in addition to, and not as a substitute for, SEC Pricing, when considering Northern’s reserves estimates.

PV-10 Values

The pre-tax present value discounted at 10%, or "PV-10," may be considered a non-GAAP financial measure. The GAAP financial measure most directly comparable to PV-10 is the standardized measure of discounted future net cash flows ("Standardized Measure"). PV-10 is a computation of the Standardized Measure on a pre-tax basis. PV-10 is equal to the Standardized Measure of discounted future net cash flows at the applicable date, before deducting future income taxes, discounted at 10 percent. We believe that the presentation of PV-10 is relevant and useful to investors because it presents the discounted future net cash flows attributable to our estimated net proved reserves prior to taking into account future corporate income taxes, and it is a useful measure for evaluating the relative monetary significance of our oil and natural gas properties. Further, investors may utilize the measure as a basis for comparison of the relative size and value of our reserves to other companies. We use this measure when assessing the potential return on investment related to our oil and natural gas properties. PV-10, however, is not a substitute for the Standardized Measure of discounted future net cash flows. Neither PV-10 nor the Standardized Measure purport to represent the fair value of our oil and natural gas reserves.

With respect to PV-10 calculated as of an interim date (i.e. other than year-end), it is not practical to calculate the taxes for the related interim period because GAAP does not provide for disclosure of Standardized Measure on an interim basis. As a result, it is not practicable for us to reconcile the PV-10 of our SEC Pricing proved reserves as of June 30, 2021. In addition, GAAP does not provide a measure of estimated future net cash flows for reserves calculated using prices other than SEC Pricing. As a result, it is not practicable for us to reconcile the PV-10 of our Strip Pricing proved reserves as of June 30, 2021.

ABOUT NORTHERN OIL AND GAS

Northern Oil and Gas, Inc. is a company with a primary strategy of investing in non-operated minority working and mineral interests in oil & gas properties, with a core area of focus in the premier basins within the United States. More information about Northern Oil and Gas, Inc. can be found at www.northernoil.com.

SAFE HARBOR

This press release contains forward-looking statements regarding future events and future results that are subject to the safe harbors created under the Securities Act of 1933 (the “Securities Act”) and the Securities Exchange Act of 1934 (the “Exchange Act”). All statements other than statements of historical facts included in this release regarding Northern’s financial position, operating and financial performance, business strategy, plans and objectives of management for future operations, industry conditions, and indebtedness covenant compliance are forward-looking statements. When used in this release, forward-looking statements are generally accompanied by terms or phrases such as “estimate,” “project,” “predict,” “believe,” “expect,” “continue,” “anticipate,” “target,” “could,” “plan,” “intend,” “seek,” “goal,” “will,” “should,” “may” or other words and similar expressions that convey the uncertainty of future events or outcomes. Items contemplating or making assumptions about actual or potential future production and sales, market size, collaborations, and trends or operating results also constitute such forward-looking statements.

Forward-looking statements involve inherent risks and uncertainties, and important factors (many of which are beyond Northern’s control) that could cause actual results to differ materially from those set forth in the forward-looking statements, including the following: changes in crude oil and natural gas prices; the pace of drilling and completions activity on Northern’s properties and properties pending acquisition; Northern’s ability to acquire additional development opportunities; potential or pending acquisition transactions; Northern’s ability to consummate pending acquisitions, and the anticipated timing of such consummation; changes in Northern’s reserves estimates or the value thereof; disruptions to Northern’s business due to acquisitions and other significant transactions; infrastructure constraints and related factors affecting Northern’s properties; ongoing legal disputes over and potential shutdown of the Dakota Access Pipeline; the COVID-19 pandemic and its related economic repercussions and effect on the oil and natural gas industry; general economic or industry conditions, nationally and/or in the communities in which Northern conducts business; changes in the interest rate environment, legislation or regulatory requirements; conditions of the securities markets; Northern’s ability to raise or access capital; changes in accounting principles, policies or guidelines; and financial or political instability, health-related epidemics, acts of war or terrorism, and other economic, competitive, governmental, regulatory and technical factors affecting Northern’s operations, products and prices.

Northern has based these forward-looking statements on its current expectations and assumptions about future events. While management considers these expectations and assumptions to be reasonable, they are inherently subject to significant business, economic, competitive, regulatory and other risks, contingencies and uncertainties, most of which are difficult to predict and many of which are beyond Northern’s control. Northern does not undertake any duty to update or revise any forward-looking statements, except as may be required by the federal securities laws.


Contacts

Mike Kelly, CFA
Chief Strategy Officer
952-476-9800
This email address is being protected from spambots. You need JavaScript enabled to view it.

  • Strong market traction with strong interest from the maritime sector
  • Enabling connectivity operators to enhance their service portfolios

PARIS--(BUSINESS WIRE)--Regulatory News:


Eutelsat Communications (Paris:ETL) (Euronext Paris: ETL) today announced that the first agreements have been signed with maritime connectivity operators for Eutelsat ADVANCE, its new end-to-end managed connectivity solution.

Several operators have selected Eutelsat ADVANCE to enhance their portfolios of connectivity services. Leveraging Eutelsat's powerful Ku-band in-orbit resources, Eutelsat ADVANCE will be integrated into the offerings, amongst others, of Telenor Maritime, SRH, Axess Networks, and Nearshore Networks to serve a wide spectrum of maritime market segments including cargo shipping, passenger ferries, cruises and offshore.

With global coverage and the potential to scale to specific geographic zones when required, Eutelsat ADVANCE is an end-to-end managed connectivity service including network interconnection, a management portal and APIs for service providers and their clients, terrestrial connectivity as well as satellite capacity and terminals.

Philippe Oliva, Eutelsat's Chief Commercial Officer, commented: “I am delighted that our new satellite network-as-a-service offer has already gained traction among a diverse range of new maritime clients. The selection of Eutelsat ADVANCE by these customers clearly demonstrates the strong benefits of this end-to-end solution for maritime connectivity operators who wish to enhance their offerings with our wide array of solutions tailored to specific markets. EUTELSAT Advance is yet another valuable resource that will enable us to build on our market share gains in the maritime industry.”

About Eutelsat Communications

Founded in 1977, Eutelsat Communications is one of the world's leading satellite operators. With a global fleet of satellites and associated ground infrastructure, Eutelsat enables clients across Video, Data, Government, Fixed and Mobile Broadband markets to communicate effectively to their customers, irrespective of their location. Over 6,800 television channels operated by leading media groups are broadcast by Eutelsat to one billion viewers equipped for DTH reception or connected to terrestrial networks. Headquartered in Paris, with offices and teleports around the globe, Eutelsat assembles 1,200 men and women from 50 countries who are dedicated to delivering the highest quality of service.

For more about Eutelsat go to www.eutelsat.com

www.eutelsat.com – Follow us on Twitter @Eutelsat_SA


Contacts

Media
Joanna Darlington
Tel.: +33 1 53 98 31 07
This email address is being protected from spambots. You need JavaScript enabled to view it.

Marie Sophie Ecuer
Tel.: +33 1 53 98 32 45
This email address is being protected from spambots. You need JavaScript enabled to view it.

Jessica Whyte
Tel.: +33 1 53 98 46 21
This email address is being protected from spambots. You need JavaScript enabled to view it.

Investors
Joanna Darlington
Tel.: +33 1 53 98 31 07
This email address is being protected from spambots. You need JavaScript enabled to view it.

Cédric Pugni
Tel.: +33 1 53 98 31 54
This email address is being protected from spambots. You need JavaScript enabled to view it.

Alexandre Illouz
Tel.: +33 1 53 98 46 81
This email address is being protected from spambots. You need JavaScript enabled to view it.

Offshore Source Logo

Offshore Source keeps you updated with relevant information concerning the Offshore Energy Sector.

Any views or opinions represented on this website belong solely to the author and do not represent those of the people, institutions or organizations that Offshore Source or collaborators may or may not have been associated with in a professional or personal capacity, unless explicitly stated.

Corporate Offices

Technology Systems Corporation
8502 SW Kansas Ave
Stuart, FL 34997

info@tscpublishing.com