Business Wire News

SAN DIEGO--(BUSINESS WIRE)--EDF Renewables North America today announced the signing of a storage contract with CleanPowerSF as an expansion to the previously announced 20-year solar Power Purchase Agreement (PPA). The 100 megawatt (MWac) Maverick 6 Solar Project will now be coupled with a 200 megawatt hour (MWh) battery storage system. The project expects to come online by the end of 2021 and deliver enough clean electricity annually to power 49,000 average California homes.


The project is located in Riverside County, California on federal lands within a Solar Energy Zone (SEZ) and Development Focus Area, managed by the U.S. Bureau of Land Management (BLM). The BLM completed the federal permitting process, issuing the project a Record of Decision (ROD) in October 2018.

“EDF Renewables is pleased to partner again with CleanPowerSF to expand upon our solar PPA to include battery storage at Maverick 6,” said Dai Owen, Vice President, Origination and Power Marketing at EDF Renewables. “Battery storage is increasingly becoming essential to enable further deployment of renewables as well as to provide grid stability. This 200 MWh contract increases EDF Renewables’ battery storage portfolio to 1.5 gigawatt hours (GWh) to be constructed by 2023 in the US.”

By coupling the solar facility with an energy storage solution, electricity produced during peak solar hours can be dispatched later in the day, thereby creating a balance between electricity generation and demand. Energy storage can further smooth electricity prices, manage evening energy ramps, mitigate curtailment and provide grid stability.

CleanPowerSF is a not-for-profit program operated by San Francisco Public Utilities Commission (SFPUC). The program launched in 2016 with a mission to provide San Francisco residents and businesses with the choice of having their electricity supplied from clean, renewable sources at competitive rates. CleanPowerSF now serves about 380,000 customer accounts in San Francisco. With a 96 percent participation rate, the program is popular among businesses and residents.

“At a time when the state is experiencing rolling blackouts and other power uncertainties, ensuring grid reliability for our customers is paramount for the agency,” said SFPUC General Manager Harlan L. Kelly Jr. “Through the approval of this new storage contract, we are taking an important step to ensure we continue providing clean, safe, and affordable energy to our customers no matter the time of day.”

EDF Renewables is committed to providing solutions to meet California’s carbon-reduction goals. With 35 years of experience and 16 gigawatts (GW) of renewable projects developed throughout North America, EDF Renewables provides a fully integrated bundle of energy solutions from grid-scale wind, solar, and solar plus storage projects to electric vehicle charging and energy storage management.

About EDF Renewables:

EDF Renewables North America is a market leading independent power producer and service provider with 35 years of expertise in renewable energy. The Company delivers grid-scale power: wind (onshore and offshore), solar photovoltaic, and storage projects; distributed solutions: solar, solar+storage, EV charging and energy management; and asset optimization: technical, operational, and commercial skills to maximize performance of generating projects. EDF Renewables’ North American portfolio consists of 16 GW of developed projects and 11 GW under service contracts. EDF Renewables is a subsidiary of EDF Renouvelables, the dedicated renewable energy affiliate of the EDF Group. For more information visit: www.edf-re.com.

About San Francisco Public Utilities Commission:

The San Francisco Public Utilities Commission (SFPUC) is a department of the City and County of San Francisco. It delivers drinking water to 2.7 million people in the San Francisco Bay Area, collects and treats wastewater for the City and County of San Francisco, and generates clean power for municipal buildings, residents, and businesses through its Hetch Hetchy Power and CleanPowerSF programs. The SFPUC’s mission is to provide customers with high quality, efficient and reliable water, power, and sewer services in a manner that values environmental and community interests and sustains the resources entrusted to our care. Learn more at www.sfwater.org.


Contacts

Sandi Briner, +1 858-521-3525
This email address is being protected from spambots. You need JavaScript enabled to view it.

METAIRIE, La.--(BUSINESS WIRE)--Biloxi Marsh Lands Corporation (PINK SHEETS: BLMC) today announces its unaudited results for the second quarter of 2020 and first six months of 2020. The Company’s revenue for the three months ended June 30, 2020 from oil and gas production for its fee lands was $2,728 compared to revenue of $1,715 for the second quarter of 2019. Dividend and interest income for the second quarter of 2020 was $11,174 compared to $26,314 for 2019. The Company realized a cumulative loss from the sale of investment securities of $124,199 compared to a cumulative gain of $120,761 for the same period of 2019. The flow-through losses from the Company’s membership interests in limited liability companies was $357,524 for the second quarter of 2020 compared to $378,753 for 2019. Expenses for the second quarter were $132,228 compared to $201,422 for the same period of 2019. The Company had a net loss of $600,049 or $0.24 per share for the second quarter of 2020 compared to a net loss of $380,249 or $0.15 per share in 2019. For the first half of 2020, there was a net loss of $1,025,774 or $0.41 per share compared to a net loss of $1,352,752 or $0.54 per share for the same period of 2019.

The Company’s claim (Biloxi Marsh Lands Corp., et al. v. United States; Case No. 12-382L) in the U.S. Court of Federal Claims against the U.S. Army Corps of Engineers seeking monetary damages for property damage and losses caused by the Mississippi River Gulf Outlet is in the process of moving forward. The U.S. Department of Justice filed a motion for summary judgment on the issue of statute of limitations concerning the portion for the Company’s claim related to a taking of real property. Oral arguments in front of Judge Ryan T. Holte were held on June 29, 2020. Post-hearing briefs and responses have been filed, and the parties are awaiting the Court’s decision. At this time, the Company cannot predict the timing of resolution or the outcome of this litigation process, but it is anticipated that this litigation process will take time.

B&L Exploration, LLC (“BLX”) is contractually entitled to a 1.5% of 8/8ths overriding royalty interest (ORRI) in the mineral leases comprising the 9,000 acre - EOC-TUSC BL UDS SUA production unit from which the Highlander well is producing. This production unit is located in St. Martin Parish, Louisiana. A series of public hearings have taken place with respect to the production unit. One of the interested mineral owners has made an application for public hearing concerning a request that the unit be modified and reduced in size. The operator has filed a counterplan to the application for reduction, and the next public hearing is scheduled for October 6, 2020. Information reported by the Highlander well’s operator to the Louisiana Department of Natural Resources (LDNR) is available on LDNR’s Strategic Online Natural Resources Information System (SONRIS – www.sonris.com).

BLX continues its operations with producing wells in South Texas. As previously reported, B&L Resources, LLC (“BLR”) continues its efforts to assemble additional prospective acreage in South Texas.

Biloxi Marsh Lands Corporation is a Delaware corporation whose principal assets are surface and mineral rights to approximately 90,000 acres of marsh land in St. Bernard Parish, Louisiana, which from time to time generates revenues from mineral activities including lease bonuses, delay rentals, royalties on oil and natural gas production, and fee land income unrelated to oil and gas activities. Through investment in limited liability companies the Company also has separate interests in various oil and gas properties in Louisiana and Texas outside of its fee lands.

We encourage you to visit our website to obtain general information about the Company, its efforts in the coastal restoration arena, as well as historical annual reports and press releases. We strongly recommend that all interested parties become familiar with the information available on the Company’s website: www.biloximarshlandscorp.com.

This news release contains forward-looking statements regarding all of the Company’s business activities including without limitation oil and gas discoveries, oil and gas exploration, and development and production activities and reserves. Accuracy of the forward-looking statements depends on assumptions about events that change over time and is thus susceptible to periodic change based on actual experience and new developments. The Company cautions readers that it assumes no obligation to update or publicly release any revisions to the forward-looking statements in this report. Important factors that might cause future results to differ from these forward-looking statements include: variations in the market prices of oil and natural gas; drilling results; unanticipated fluctuations in flow rates of producing wells; oil and natural gas reserves expectations; the ability to satisfy future cash obligations and environmental costs; and general exploration and development risks and hazards. Readers are cautioned not to place undue reliance on forward-looking statements made by or on behalf of the Company. Each such statement speaks only as of the day it was made. The factors described above cannot be controlled by the Company. When used in this report, the words “believes”, “estimates”, “plans”, “expects”, “could”, “should”, “outlook”, and “anticipates” and similar expressions as they relate to the Company or its management are intended to identify forward-looking statements.

The following “Statements of Assets, Liabilities and Stockholders’ Equity” and “Statements of Revenues and Expenses” have been derived from interim unaudited financial statements which do not include the information and footnotes that are an integral part of a complete financial statement.

Inquiries should be made through the Contact Mailbox on the Company’s website: http://www.biloximarshlandscorp.com/contact/.

 
BILOXI MARSH LANDS CORPORATION
Statements of Assets, Liabilities, and Stockholders' Equity
June 30, 2020 and 2019
 
Assets

2020

2019

 
Current assets:
Cash and cash equivalents $

729,537

1,465,993

Accounts receivable

4,828

2,832

Prepaid expenses

49,306

72,659

Deferred tax asset

10,579

21,159

Income taxes receivable

11,652

28,817

Other assets

3,830

3,830

Total current assets

809,732

1,595,290

Other assets:
Membership interest in limited liability companies

145,140

205,615

Marketable debt and equity securities - at cost

3,976,455

5,384,551

Land

234,939

234,939

Total other assets

4,356,534

5,825,105

 
Total assets $

5,166,266

7,420,395

Liabilities and Stockholders' Equity
Current liabilities:
Accrued expenses $

44,299

13,020

Membership interest in limited liability companies

669,005

Total current liabilities

713,304

13,020

Stockholders' equity:
Common stock, $.001 par value. Authorized, 20,000,000 shares;
issued, 2,851,196 shares; outstanding, 2,505,028 shares

47,520

47,520

Retained earnings

7,482,467

10,436,880

Treasury stock - 346,168 shares, at cost

(3,077,025)

(3,077,025)

Total liabilities and stockholders' equity $

5,166,266

7,420,395

BILOXI MARSH LANDS CORPORATION

Statements of Revenues and Expenses
June 30, 2020 and 2019
 
3 Months Ended 6 Months Ended
June 30 June 30

2020

2019

2020

2019

 
Revenues:
Oil and gas royalties

$ 2,728

1,715

$ 4,955

$ 4,454

Total oil and gas revenues

2,728

1,715

4,955

4,454

 
Other income (loss):
Dividends and interest income

11,174

26,314

31,808

58,855

Gain (loss) on sale of securities

(124,199)

120,761

(112,715)

(237,502)

Gain on settlement

-

-

153,794

-

Fee land income

-

51,136

-

53,636

Loss from membership interest in
limited liability companies

(375,524)

(378,753)

(811,521)

(848,041)

Total other income

(470,549)

(180,542)

(738,634)

(973,052)

Total revenues and other income

(467,821)

(178,827)

(733,679)

(968,598)

 
Expenses:
Total expenses

132,228

201,422

292,095

384,154

Net income before income taxes

(600,049)

(380,249)

(1,025,774)

(1,352,752)

Income tax expense (benefit)

-

-

-

-

Net income

$ (600,049)

(380,249)

$ (1,025,774)

(1,352,752)

 
Net income per share

$ (0.24)

$ (0.15)

$ (0.41)

$ (0.54)


Contacts

Biloxi Marsh Lands Corporation
Belle Bellard: 504-837-4337

Ranks Highest in the East Among Large Gas Utilities, Scoring Best in All Study Factors

WALL, N.J.--(BUSINESS WIRE)--For the sixth consecutive year, New Jersey Natural Gas (NJNG) delivered the highest customer satisfaction with residential natural gas service in the East among large utilities according to the J.D. Power 2020 Gas Utility Residential Customer Satisfaction Study℠. With an overall score of 784 — more than 30 points above the segment average— NJNG ranks the best among large gas utilities in the East Region, which includes New Jersey.


“As a company that provides a lifeline service, we understand the importance of being there to deliver for our customers when they need us most,” said Steve Westhoven, president and chief executive officer of New Jersey Natural Gas. “The global pandemic has put a spotlight on what it means to deliver essential service safely and reliably — now more than ever, we are committed to meeting those expectations. To be recognized by J.D. Power during this unprecedented time is a testament to the dedication of our team and a powerful statement that our efforts are recognized by our customers.”

This year’s study results are based on responses from over 60,000 online interviews conducted from September 2019 through July 2020 with residential customers of the 83 largest natural gas utility brands, representing nearly 63,000 households across the United States. J.D. Power began measuring the customer satisfaction of natural gas utilities in 2002. Over the past 19 years, NJNG has been recognized for its commitment to residential and business customer satisfaction 15 times.*

NJNG’s efforts to understand and address the needs of its customers are measured across six key factors that encompass the customer experience — billing and payment, corporate citizenship, price, communications, customer service and safety and reliability. In every category, NJNG outperformed its East large utility peers, scoring highest in all six study factors, demonstrating the confidence customers place on NJNG to deliver service excellence.

*NJNG consecutively received the highest score among large utility providers in the East in the J.D. Power 2015-2020 Gas Utility Residential Customer Satisfaction Studies, and the East Region of the J.D. Power 2017 Gas Utility Business Customer Satisfaction Study.

About New Jersey Resources
New Jersey Resources (NYSE: NJR) is a Fortune 1000 company that, through its subsidiaries, provides safe and reliable natural gas and clean energy services, including transportation, distribution, asset management and home services. NJR is composed of five primary businesses:

  • New Jersey Natural Gas, NJR’s principal subsidiary, operates and maintains over 7,500 miles of natural gas transportation and distribution infrastructure to serve over half a million customers in New Jersey’s Monmouth, Ocean, Morris, Middlesex and Burlington counties.
  • NJR Clean Energy Ventures invests in, owns and operates solar projects with a total capacity of more than 350 megawatts, providing residential and commercial customers with low-carbon solutions.
  • NJR Energy Services manages a diversified portfolio of natural gas transportation and storage assets and provides physical natural gas services and customized energy solutions to its customers across North America.
  • NJR Midstream serves customers from local distributors and producers to electric generators and wholesale marketers through its ownership of Leaf River Energy Center and the Adelphia Gateway Pipeline Project, as well as our 50 percent equity ownership in the Steckman Ridge natural gas storage facility, and our 20 percent equity interest in the PennEast Pipeline Project.
  • NJR Home Services provides service contracts as well as heating, central air conditioning, water heaters, standby generators, solar and other indoor and outdoor comfort products to residential homes throughout New Jersey.

NJR and its more than 1,100 employees are committed to helping customers save energy and money by promoting conservation and encouraging efficiency through Conserve to Preserve® and initiatives such as The SAVEGREEN Project® and The Sunlight Advantage®. For more information about NJR: www.njresources.com.

Follow us on Twitter @NJNaturalGas.
“Like” us on facebook.com/NewJerseyNaturalGas.


Contacts

Media:
Michael Kinney
732-938-1031
This email address is being protected from spambots. You need JavaScript enabled to view it.

Investor:
Dennis Puma
732-938-1229
This email address is being protected from spambots. You need JavaScript enabled to view it.

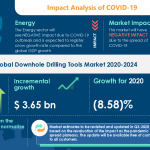
LONDON--(BUSINESS WIRE)--#DownholeDrillingToolsMarket--Technavio has been monitoring the downhole drilling tools market and it is poised to grow by $ 3.65 bn during 2020-2024, progressing at a CAGR of almost 3% during the forecast period. The report offers an up-to-date analysis regarding the current market scenario, latest trends and drivers, and the overall market environment.


Although the COVID-19 pandemic continues to transform the growth of various industries, the immediate impact of the outbreak is varied. While a few industries will register a drop in demand, numerous others will continue to remain unscathed and show promising growth opportunities. Technavio’s in-depth research has all your needs covered as our research reports include all foreseeable market scenarios, including pre- & post-COVID-19 analysis. Download a Free Sample Report on COVID-19 Impacts

Frequently Asked Questions:

  • What are the major trends in the market?
    Implementation of new exploration policies is a major trend driving the growth of the market.
  • At what rate is the market projected to grow?
    The year-over-year growth for 2020 is estimated at -8.58% and the incremental growth of the market is anticipated to be $ 3.65 bn.
  • Who are the top players in the market?
    Baker Hughes Co., Halliburton Co., National Oilwell Varco Inc., Nine Energy Service Inc., RUBICON OILFIELD PRODUCTS LTD., Schlumberger Ltd., Schoeller-Bleckmann Oilfield Equipment AG, Tasman Oil Tools Ltd., Weatherford International Plc, and Wenzel Downhole Tools, are some of the major market participants.
  • What is the key market driver?
    The increase in oil and gas E&P activities is one of the major factors driving the market.
  • How big is the North America market?
    The North America region will contribute 39% of the market share.


The market is fragmented, and the degree of fragmentation will accelerate during the forecast period. Baker Hughes Co., Halliburton Co., National Oilwell Varco Inc., Nine Energy Service Inc., RUBICON OILFIELD PRODUCTS LTD., Schlumberger Ltd., Schoeller-Bleckmann Oilfield Equipment AG, Tasman Oil Tools Ltd., Weatherford International Plc, and Wenzel Downhole Tools are some of the major market participants. The increase in oil and gas E&P activities will offer immense growth opportunities. To make most of the opportunities, market vendors should focus more on the growth prospects in the fast-growing segments, while maintaining their positions in the slow-growing segments.

Buy 1 Technavio report and get the second for 50% off. Buy 2 Technavio reports and get the third for free.

View market snapshot before purchasing

Technavio's custom research reports offer detailed insights on the impact of COVID-19 at an industry level, a regional level, and subsequent supply chain operations. This customized report will also help clients keep up with new product launches in direct & indirect COVID-19 related markets, upcoming vaccines and pipeline analysis, and significant developments in vendor operations and government regulations.

Downhole Drilling Tools Market 2020-2024: Segmentation

Downhole Drilling Tools Market is segmented as below:

  • Product
    • Tubulars
    • Deflection And Downhole Motors
    • Casing And Cementing Tools
    • Drill Bits
    • Others
  • Geography
    • North America
    • MEA
    • APAC
    • Europe
    • South America

To learn more about the global trends impacting the future of market research, download a free sample: https://www.technavio.com/talk-to-us?report=IRTNTR44267

Downhole Drilling Tools Market 2020-2024: Scope

Technavio presents a detailed picture of the market by the way of study, synthesis, and summation of data from multiple sources. The downhole drilling tools market report covers the following areas:

  • Downhole Drilling Tools Market Size
  • Downhole Drilling Tools Market Trends
  • Downhole Drilling Tools Market Industry Analysis

This study identifies the new exploration policies as one of the prime reasons driving the downhole drilling tools market growth during the next few years.

Technavio suggests three forecast scenarios (optimistic, probable, and pessimistic) considering the impact of COVID-19. Technavio’s in-depth research has direct and indirect COVID-19 impacted market research reports.

Register for a free trial today and gain instant access to 17,000+ market research reports. Technavio's SUBSCRIPTION platform

Downhole Drilling Tools Market 2020-2024: Key Highlights

  • CAGR of the market during the forecast period 2020-2024
  • Detailed information on factors that will assist downhole drilling tools market growth during the next five years
  • Estimation of the downhole drilling tools market size and its contribution to the parent market
  • Predictions on upcoming trends and changes in consumer behavior
  • The growth of the downhole drilling tools market
  • Analysis of the market’s competitive landscape and detailed information on vendors
  • Comprehensive details of factors that will challenge the growth of downhole drilling tools market vendors

Table of Contents:

Executive Summary

Market Landscape

  • Market ecosystem
  • Value chain analysis

Market Sizing

  • Market definition
  • Market segment analysis
  • Market size 2019
  • Market outlook: Forecast for 2019 - 2024

Five Forces Analysis

  • Five forces summary
  • Bargaining power of buyers
  • Bargaining power of suppliers
  • Threat of new entrants
  • Threat of substitutes
  • Threat of rivalry
  • Market condition

Market Segmentation by Product

  • Market segments
  • Comparison by Product
  • Tubulars - Market size and forecast 2019-2024
  • Deflection and downhole motors - Market size and forecast 2019-2024
  • Casing and cementing tools - Market size and forecast 2019-2024
  • Drill bits - Market size and forecast 2019-2024
  • Others - Market size and forecast 2019-2024
  • Market opportunity by Product

Market Segmentation by Application

  • Market segments
  • Comparison by Application
  • Onshore - Market size and forecast 2019-2024
  • Offshore - Market size and forecast 2019-2024
  • Market opportunity by Application

Customer landscape

Geographic Landscape

  • Geographic segmentation
  • Geographic comparison
  • North America - Market size and forecast 2019-2024
  • MEA - Market size and forecast 2019-2024
  • APAC - Market size and forecast 2019-2024
  • Europe - Market size and forecast 2019-2024
  • South America - Market size and forecast 2019-2024
  • Key leading countries
  • Market opportunity by geography
  • Market drivers
  • Market challenges
  • Market trends

Vendor Landscape

  • Overview
  • Vendor landscape
  • Landscape disruption

Vendor Analysis

  • Vendors covered
  • Market positioning of vendors
  • Baker Hughes Co.
  • Halliburton Co.
  • National Oilwell Varco Inc.
  • Nine Energy Service Inc.
  • RUBICON OILFIELD PRODUCTS LTD.
  • Schlumberger Ltd.
  • Schoeller-Bleckmann Oilfield Equipment AG
  • Tasman Oil Tools Ltd.
  • Weatherford International Plc
  • Wenzel Downhole Tools

Appendix

  • Scope of the report
  • Currency conversion rates for US$
  • Research methodology
  • List of abbreviations


About Us

Technavio is a leading global technology research and advisory company. Their research and analysis focuses on emerging market trends and provides actionable insights to help businesses identify market opportunities and develop effective strategies to optimize their market positions. With over 500 specialized analysts, Technavio’s report library consists of more than 17,000 reports and counting, covering 800 technologies, spanning across 50 countries. Their client base consists of enterprises of all sizes, including more than 100 Fortune 500 companies. This growing client base relies on Technavio’s comprehensive coverage, extensive research, and actionable market insights to identify opportunities in existing and potential markets and assess their competitive positions within changing market scenarios.


Contacts

Technavio Research
Jesse Maida
Media & Marketing Executive
US: +1 844 364 1100
UK: +44 203 893 3200
Email: This email address is being protected from spambots. You need JavaScript enabled to view it.
Website: www.technavio.com/

NEW YORK--(BUSINESS WIRE)--#Pollution--Pure Earth, a nonprofit leader in cleaning up toxic pollution in low and middle-income countries, has named Mark Schnellbaecher as President and Chief Operating Officer to lead a growing team focused on reducing pollution, saving lives, and protecting the planet.


Following a 30-year career leading humanitarian and refugee assistance programs, Schnellbaecher will leverage his years of international expertise to guide Pure Earth as it expands to address the global pollution crisis and work with governments and partners to solve the largest environmental cause of death in the world today.

Schnellbaecher was selected after an extensive search to fill this critical position at Pure Earth. Richard Fuller, who founded the nonprofit, will remain as Chief Executive Officer, but will hand over day-to-day operations to Schnellbaecher.

Before joining Pure Earth, Schnellbaecher served as Regional Vice President for the Middle East and North Africa for the International Rescue Committee, in Amman, Jordan. From 2002-2012, he worked in Beirut, Lebanon, as the Regional Director for the Middle East and Europe for Catholic Relief Services. Earlier in his career, Schnellbaecher served in Serbia, Kosovo, Bosnia, Cambodia, Pakistan and Thailand. He was raised in upstate New York, graduated from Georgetown University’s School of Foreign Service, and has recently relocated to New York City with his spouse.

About Pure Earth

Pure Earth saves and improves lives, particularly the lives of children in poor communities, by reducing disease-causing pollution. We identify toxic hotspots and teach communities how to improve soil, water and air quality with cost effective solutions. This field work, combined with our groundbreaking research and advocacy, elevates solving pollution to a global priority.


Contacts

Magdalene Sim, This email address is being protected from spambots. You need JavaScript enabled to view it.

  • Files annual report on Form 10-K for 2019
  • Announces decision to exit competitive EPC lump-sum bidding for Energy & Chemicals segment
  • Company expects to be current in financial reporting by year end
  • In-depth business evaluation underway, working with ad-hoc Board committee

IRVING, Texas--(BUSINESS WIRE)--Fluor Corporation (NYSE: FLR) today announced financial results for its year ended December 31, 2019. Results for 2019 were a net loss from continuing operations of $1.7 billion, or $11.97 per diluted share, compared to earnings from continuing operations of $9 million, or $0.07 per share for 2018. The net loss attributable to Fluor includes impairment, restructuring and other exit costs of $533 million, expenses of $138 million related to the settlement of the U.K. pension plan and $731 million related to establishing valuation allowances to reduce net deferred tax assets. Consolidated segment loss for the year was $386 million compared to a profit of $323 million in 2018. Revenue of $14.3 billion in 2019 from continuing operations compares to $15.2 billion in the prior year.


Full year new awards from continuing operations and government were $12.6 billion, and ending consolidated backlog was $31.9 billion. Corporate G&A expenses for 2019 were $159 million, up from $118 million a year ago primarily due to the effects of foreign transactional gains and losses. Fluor’s cash and marketable securities at the end of 2019 was $2.0 billion. During 2019, Fluor paid $118 million in dividends.

Results of Board Investigation

As the company previously announced, a special committee of independent members of the Board of Directors led a review of its previously issued financial information and determined there were material project-related errors resulting from the absence of timely recognition of changes in forecasted project costs, and from other errors in estimating the amount of variable consideration to be included in revenue for the Radford project. Accordingly, Fluor has restated annual financial results for 2016, 2017, and 2018, and for each of the interim previously issued quarterly periods for 2018 and 2019. In addition, the restated financial statements include other quantitatively immaterial adjustments to these annual periods. These adjustments reduced cumulative pretax earnings reported through September 30, 2019, by $3.8 million.

The special committee, along with its independent external advisors and financial experts, had full access to the company’s personnel and documentation and determined the scope of its review. The investigation included document collection and interviews across all Fluor EPC segments including both domestic and international. The quantity of projects reviewed represents a majority of the company’s lump-sum portfolio.

In addition, the company determined that its disclosure controls and procedures were not effective due to the existence of material weaknesses. To address these weaknesses, Fluor’s remediation plan includes personnel actions, additional project monitoring procedures, improved guidance on project forecasting principles, updated tools and templates to achieve more standardization of project-level documentation and reporting, and improved internal company training on required policies and procedures.

“Today’s filing marks the culmination of a thorough review of the financial reporting on a significant number of our lump-sum projects. We agree with the findings of the special committee and are moving forward with our remediation plan,” said Carlos Hernandez, Fluor chief executive officer. “Fluor continues to have substantial liquidity and dedicated employees who are ready to tackle current and future challenges.”

Strategic Update

In September 2019, Fluor announced actions intended to drive improved cash generation and de-risk the portfolio. The company has sold portions of its equipment rental business and continues to progress on transacting AMECO, public-private partnership assets and excess real estate. In addition, the company has suspended its dividend and remains on track to realize at least $100 million in annual savings by the end of the year.

Following on from last year’s review, Fluor has initiated a broader and more comprehensive analysis of our entire business model. The goal is to reshape the company to address today’s markets and to ensure future success. An ad-hoc two person committee of the board has been formed to be an added resource to management and to provide their ideas and expertise in the upfront part of this process.

In advance of this new strategy, for the Energy & Chemicals segment the company has determined that it will only pursue reimbursable or open-book lump-sum conversion engineering, procurement and construction prospects. The company believes that competitively bid lump-sum projects create a transactional market where the allocation of risk is not appropriately distributed.

Outlook

The company has experienced a significant shift in end markets in 2020 driven by volatility in commodity prices and the global disruption from the COVID-19 pandemic. As a result, the company is suspending all previously issued 2020 guidance. In addition, the company is providing updates on the following:

  • As of the end of August 2020, Fluor’s cash balance was $2.1 billion and the company expects the cash balance to be approximately in that range through the end of the year.
  • The company continues to have adequate liquidity to meet its operational and project needs and has no amounts drawn on the revolving loans under its committed credit facilities.
  • Fluor expects to file Q1 2020 results within the next month, followed approximately four weeks later by Q2 2020 results with Q3 2020 results approximately four weeks after that. The company will hold its next call with the investment community in conjunction with the release of its Q3 results.

Business Segments

The Energy & Chemicals segment reported a segment loss of $95 million in 2019 compared to a profit of $335 million in 2018. Segment profit in 2019 decreased significantly as a result of charges associated with forecast revisions on certain projects. Revenue for 2019 was $5.8 billion, down from $7.7 billion in the previous year. Full year new awards in 2019 totaled $3.7 billion, compared to $10.6 billion in 2018. Ending backlog was $14.1 billion compared to $17.8 billion a year ago.

The Mining & Industrial segment reported a segment profit of $159 million, up from $94 million in 2018. Full year revenue for the segment of $5.1 billion was up from $3.5 billion a year ago. Results for the year reflect increased project execution activities for several large mining projects and the favorable resolution of a longstanding customer dispute. Full year new awards in 2019 were $1.9 billion, and ending backlog was $5.4 billion compared to $8.9 billion a year ago.

The Infrastructure & Power segment reported a segment loss of $244 million compared to a loss of $30 million in 2018. Full year revenue for the segment was $1.4 billion compared to $1.7 billion a year ago. Results for 2019 include costs related to the settlement of three gas-fired power projects and forecast revisions related to several infrastructure projects. Full year new awards in 2019 were $2.6 billion, and ending backlog for the segment was $6.1 billion compared to $6.3 billion a year ago.

The Diversified Services segment, including certain retained AMECO operations, reported a segment profit of $15 million in 2019, compared to $69 million a year ago. Results for 2019 reflect reduced volumes of higher-margin operations and maintenance activities. Full year revenue was $2.0 billion compared to $2.3 billion in 2018. New awards totaled $2.2 billion for 2019, and ending backlog was $2.5 billion, up from $2.3 billion a year ago.

The Other segment, which is comprised of NuScale and the Radford and Warren government projects, reported a full year segment loss of $220 million, compared to a loss of $145 million a year ago. Results for the year include NuScale expenses of $66 million.

Discontinued Operations

During the third quarter of 2019, management announced a plan to sell the company’s government and AMECO equipment businesses. The results of the government and AMECO businesses have been presented as earnings from discontinued operations for all periods presented in its 2019 10-K. In February 2020, Fluor announced its intention to retain the government business, and will reflect its financial information in continuing operations starting with the first quarter of 2020.

Results from discontinued operations for 2019 were a net profit of $154 million, or $1.10 per diluted share, compared to $164 million, or $1.17 per diluted share a year ago. Results for the fourth quarter reflect an $89 million favorable settlement related to a completed project. New awards totaled $2.0 billion for the year including a contract for the Hanford Central Plateau Cleanup Contract for the Department of Energy. Ending backlog was $3.6 billion, compared to $4.4 billion a year ago.

Conference Call

Fluor will host a conference call at 8:30 a.m. Eastern time on Friday, September 25, which will be webcast live on the Internet and can be accessed by logging onto investor.fluor.com. The call will also be accessible by telephone at 888-204-4368 (U.S./Canada) or +1 323-994-2093. The conference ID is 3597615. A supplemental slide presentation will be available shortly before the call begins.

A replay of the webcast will be available for 30 days. A replay of the call will be available by telephone for one week. Click Here to register for the replay.

For more information including restated financial tables, please see 2019 Form 10-K filed earlier today.

Non-GAAP Financial Measures

This press release contains a discussion of consolidated segment profit (loss) from continuing operations that would be deemed a non-GAAP financial measure under SEC rules. Segment profit (loss) is calculated as revenue less cost of revenue and earnings attributable to noncontrolling interests excluding: corporate general and administrative expense; impairment, restructuring and other exit costs; interest expense; interest income; domestic and foreign income taxes; other non-operating income and expense items; and earnings from discontinued operations. The company believes that consolidated segment profit (loss) from continuing operations provides a meaningful perspective on its business results as it is the aggregation of individual segment profit (loss) measures that the company utilizes to evaluate and manage its business performance. A reconciliation of consolidated segment profit (loss) from continuing operations to earnings (loss) from continuing operations before taxes is included in the press release table.

About Fluor Corporation

Fluor Corporation (NYSE: FLR) is a global engineering, procurement, fabrication, construction and maintenance company with projects and offices on six continents. Fluor’s 45,000 employees build a better world by designing, constructing and maintaining safe, well-executed, capital-efficient projects. Fluor had revenue of $14.3 billion in 2019 and is ranked 181 among the Fortune 500 companies. With headquarters in Irving, Texas, Fluor has served its clients for more than 100 years. For more information, please visit www.fluor.com or follow Fluor on Twitter, LinkedIn, Facebook and YouTube.

Forward-Looking Statements: This release may contain forward-looking statements (including without limitation statements to the effect that the Company or its management "will," "believes," "expects," "plans," "continue" is "positioned" or other similar expressions). These forward-looking statements, including statements relating to our expectations as to the filing of our quarterly reports on Form 10-Q, strategic and operation plans, and projected cash balances and liquidity are based on current management expectations and involve risks and uncertainties.

Actual results may differ materially as a result of a number of factors, including, among other things, the severity and duration of the COVID-19 pandemic and actions by governments, businesses and individuals in response to the pandemic, including the duration and severity of economic disruptions; the cyclical nature of many of the markets the Company serves, including the Company’s Energy & Chemicals segment; the Company's failure to receive new contract awards; cost overruns, project delays or other problems arising from project execution activities, including the failure to meet cost and schedule estimates; failure to remediate material weaknesses in our internal controls over financial reporting or the failure to maintain an effective system of internal controls; failure to prepare and timely file our periodic reports; the restatement of certain of our previously issued consolidated financial statements; intense competition in the industries in which we operate; failure to obtain favorable results in existing or future litigation and regulatory proceedings, dispute resolution proceedings or claims, including claims for additional costs; failure of our joint venture or other partners, suppliers or subcontractors to perform their obligations; cyber-security breaches; foreign economic and political uncertainties; client cancellations of, or scope adjustments to, existing contracts; failure to maintain safe worksites and international security risks; risks or uncertainties associated with events outside of our control, including weather conditions, pandemics, public health crises, political crises or other catastrophic events; the use of estimates and assumptions in preparing our financial statements; client delays or defaults in making payments; the failure of our suppliers, subcontractors and other third parties to adequately perform services under our contracts; the Company’s failure, or the failure of our agents or partners, to comply with laws; risks related to our indebtedness; the availability of credit and restrictions imposed by credit facilities, both for the Company and our clients, suppliers, subcontractors or other partners; possible limitations on bonding or letter of credit capacity; failure to successfully implement our strategic and operational initiatives; risks or uncertainties associated with acquisitions, dispositions and investments; risks arising from the inability to successfully integrate acquired businesses; the inability to hire and retain qualified personnel; the potential impact of certain tax matters; possible information technology interruptions or inability to protect intellectual property; new or changing legal requirements, including those relating to climate change and environmental, health and safety matters; the Company's ability to secure appropriate insurance; liabilities associated with the performance of nuclear services; foreign currency risks; the loss of one or a few clients that account for a significant portion of the Company's revenues; damage to our reputation; failure to adequately protect intellectual property rights; and asset impairments. Caution must be exercised in relying on these and other forward-looking statements. Due to known and unknown risks, the Company’s results may differ materially from its expectations and projections.

Additional information concerning these and other factors can be found in the Company's public periodic filings with the Securities and Exchange Commission, including the discussion under the heading "Item 1A. Risk Factors" in the Company's Form 10-K filed on September 22, 2020. Such filings are available either publicly or upon request from Fluor's Investor Relations Department: (469) 398-7222. The Company disclaims any intent or obligation other than as required by law to update its forward-looking statements in light of new information or future events.


SUMMARY FINANCIALS AND U.S. GAAP RECONCILIATION OF CONSOLIDATED SEGMENT PROFIT


(in millions)


As Restated

YEAR ENDED DECEMBER 31


2019


2018


2017

Revenue


Energy & Chemicals


$

5,823.7


$

7,695.5


$

8,568.5


Mining & Industrial


5,057.2


3,491.0


2,100.9


Infrastructure & Power


1,370.4


1,668.0


1,810.0


Diversified Services


2,040.1


2,257.2


2,295.4


Other


56.6


60.8


31.7


Revenue


$

14,348.0


$

15,172.5


$

14,806.5


Segment profit (loss) $ and margin %


Energy & Chemicals


$

(95.0

)


(1.63

)%


$

334.5


4.35

%


$

428.2


5.00

%

Mining & Industrial


158.5


3.13

%


94.3


2.70

%


87.8


4.18

%

Infrastructure & Power


(243.9

)


(17.80

)%


(30.1

)


(1.80

)%


(271.0

)


(14.97

)%

Diversified Services


14.6


0.72

%


68.7


3.04

%


83.6


3.64

%

Other


(220.1

)


NM


(144.7

)


NM


(115.4

)


NM

Total segment profit (loss) $ and margin %


$

(385.9

)


(2.69

)%


$

322.7


2.13

%


$

213.2


1.44

%


Corporate general and administrative expense


(159.1

)


(118.4

)


(183.7

)


Impairment, restructuring and other exit costs


(532.6

)


Loss on pension settlement


(137.9

)


(21.9

)


(0.2

)


Interest expense, net


(19.7

)


(41.0

)


(40.0

)


Earnings (loss) attributable to NCI from continuing operations


(41.5

)


46.6


64.5


Earnings (loss) from continuing operations before taxes


(1,276.7

)


188.0


53.8


Income tax expense (benefit)


(441.0

)


(132.3

)


(16.4

)


Net earnings (loss) from continuing operations


$

(1,717.7

)


$

55.7


$

37.4


New awards


Energy & Chemicals


$

3,724.1


$

10,641.4


$

3,950.0


Mining & Industrial


1,861.9


8,696.1


2,277.8


Infrastructure & Power


2,608.7


2,066.0


1,525.3


Diversified Services


2,217.2


2,138.5


2,007.0


Other


152.2


Total new awards


$

10,564.1


$

23,542.0


$

9,760.1


Backlog


Energy & Chemicals


$

14,128.9


$

17,834.5


$

15,110.3


Mining & Industrial


5,384.0


8,889.3


3,634.9


Infrastructure & Power


6,079.4


6,344.4


5,915.3


Diversified Services


2,541.6


2,282.9


2,451.0


Other


244.0


252.4


237.8


Total backlog


$

28,377.9


$

35,603.5


$

27,349.3


New awards related to projects located outside of the U.S.


54%


80%


53%


Backlog related to projects located outside of the U.S.


74%


78%


63%


NM = Not meaningful


Contacts

Brian Mershon
Media Relations
469.398.7621 tel

Jason Landkamer
Investor Relations
469.398.7222 tel

First Wave of 11,000 Public Safety Power Shutoffs Completed Sunday Morning; Second Wave of 54,000 Customers Begins Sunday Afternoon, Primarily in the Central Sierra Region

Community Resource Centers Accommodate Physical Distancing While Providing Water and Device Charging for Customers Experiencing PSPS

SAN FRANCISCO--(BUSINESS WIRE)--Pacific Gas and Electric Company (PG&E) will continue to de-energize certain electrical lines as part of a Public Safety Power Shutoff (PSPS) due to a strong and dry wind event creating high fire risk. As communicated on Friday, the PSPS event will affect customers in portions of 16 counties, primarily in Northern and Central Sierra region, although the number of customers expected to be impacted has decreased by 27 percent due to favorable changes in forecast weather conditions.

This PSPS event is based on forecasts of widespread, severely dry conditions and strong, gusty winds. These conditions are expected to continue through Monday morning in most locations.

In total the power shutoff event is expected to impact approximately 65,000 customers in portions of 16 counties, including: Alpine, Amador, Butte, Calaveras, El Dorado, Lake, Napa, Nevada, Placer, Plumas, Shasta, Sierra, Tehama and Yuba counties. Two customers within Sonoma County and 15 customers in Kern County are also expected to be included in the scope of this PSPS.

Some customers may experience outages unrelated to this PSPS event due to requests from CAL FIRE to de-energize lines for the safety of firefighters in active fire areas or damage caused from wildfire related impacts to equipment.

PG&E is working to improve its PSPS program by making events smaller in size, shorter in length and smarter for our customers. While PSPS is an important wildfire safety tool, PG&E understands the burden PSPS places on its customers especially for those with medical needs and customers sheltering-at-home in response to COVID-19.

Timeline for safety shutoffs

PG&E began de-energization for the first wave of 11,000 customers around 4:00 a.m. on Sunday morning.

Based on wind forecasts, de-energization for the second wave of 54,000 customers will begin at approximately 4:00 p.m. on Sunday afternoon. Power is expected to be out overnight Sunday into Monday for all customers.

Once the high winds subside Monday morning, PG&E will inspect the de-energized lines to ensure they were not damaged during the wind event, and then restore power. PG&E will safely restore power in stages as quickly as possible, with the goal of restoring power to nearly all customers who are safe to restore within 12 daylight hours after severe weather has passed.

Customer notifications—via text, email and automated phone call—began Thursday, approximately 48 hours prior to the potential shutoff. Customers enrolled in the company’s Medical Baseline program who do not verify that they have received these important safety communications will be individually visited by a PG&E employee to deliver the warning if possible, starting with customers who rely on electricity for critical life-sustaining equipment.

Potentially Impacted Counties and Customers

The power shutoff is currently expected to impact approximately 65,000 customers in the following 16 counties, including:

  • Alpine County: 573 customers, 6 Medical Baseline
  • Amador County: 5,466 customers, 400 Medical Baseline
  • Butte County: 11,339 customers, 961 Medical Baseline
  • Calaveras County: 5,132 customers, 219 Medical Baseline
  • El Dorado County: 27,286 customers, 1,796 Medical Baseline
  • Kern County: 15 customers, 0 Medical Baseline
  • Lake County: 55 customers, 2 Medical Baseline
  • Napa County: 288 customers, 8 Medical Baseline
  • Nevada County: 2,887 customers, 166 Medical Baseline
  • Placer County: 4,380 customers, 281 Medical Baseline
  • Plumas County: 785 customers, 24 Medical Baseline
  • Shasta County: 2,815 customers, 240 Medical Baseline
  • Sierra County: 1,099 customers, 22 Medical Baseline
  • Sonoma County: 2 customers, 0 Medical Baseline
  • Tehama County: 1,223 customers, 58 Medical Baseline
  • Yuba County: 1,891 customers, 152 Medical Baseline
  • Total: 65,237 customers, 4,335 Medical Baseline

Customers can use an address lookup tool to find out if their location is being monitored for the potential safety shutoff at www.pge.com/pspsupdates.

Here’s Where to Go to Learn More

  • PG&E’s emergency website www.pge.com/pspsupdates is now available in thirteen languages. Currently, the website is available in English, Spanish, Chinese, Tagalog, Russian, Vietnamese, Korean, Farsi, Arabic, Hmong, Khmer, Punjabi and Japanese. Customers will have the opportunity to choose their language of preference for viewing the information when visiting the website.
  • Customers are encouraged to update their contact information and indicate their preferred language for notifications by visiting www.pge.com/mywildfirealerts or by calling 1-800-742-5000, where in-language support is available.
  • Tenants and non-account holders can sign up to receive PSPS Zip Code Alerts for any area where you do not have a PG&E account by visiting www.pge.com/pspszipcodealerts.
  • PG&E has launched a new tool at its online Safety Action Center www.safetyactioncenter.pge.com to help customers prepare. By using the "Make Your Own Emergency Plan" tool and answering a few short questions, visitors to the website can compile and organize the important information needed for a personalized family emergency plan.

Community Resource Centers Reflect COVID-Safety Protocols

PG&E has opened 27 outdoor, open-air Community Resource Centers (CRCs) in every county where a PSPS occurs. These temporary CRCs will be open to customers when power is out at their homes and will provide ADA-accessible restrooms, hand-washing stations; medical-equipment charging; Wi-Fi; bottled water; grab-and-go bags and non-perishable snacks. PG&E updates its CRC locations regularly, click here for updates.

All CRCs will follow important health and safety protocols including:

  • Facial coverings and maintaining a physical distance of at least six feet from those who are not part of the same household will be required at all CRCs.
  • Temperature checks will be administered before entering CRCs that are located indoors.
  • CRC staff will be trained in COVID-19 precautions and will regularly sanitize surfaces and use Plexiglass barriers at check-in.
  • All CRCs will follow county and state requirements regarding COVID-19, including limits on the number of customers permitted indoors at any time.

About PG&E

Pacific Gas and Electric Company, a subsidiary of PG&E Corporation (NYSE:PCG), is one of the largest combined natural gas and electric energy companies in the United States. Based in San Francisco, with more than 23,000 employees, the company delivers some of the nation's cleanest energy to 16 million people in Northern and Central California. For more information, visit pge.com and pge.com/news.


Contacts

Media Relations
415.973.5930

DUBLIN--(BUSINESS WIRE)--The "Aviation Lubricants Market by Type (Hydraulic Fluid, Engine Oil, Grease, Special Lubricants & Additives), End User (OEM, Aftermarket), Technology (Mineral-Based, Synthetic), Application, Platform, and Region - Global Forecast to 2025" report has been added to ResearchAndMarkets.com's offering.


The global aviation lubricants market size is projected to grow from an estimated USD 2.0 billion in 2020 to USD 2.9 billion by 2025, at a CAGR of 7.2% during the forecast period.

The COVID-19 has taken a colossal toll on the world's economic activity with individuals, organizations, governments, and businesses having to adapt to the challenges of the crisis. Air travel restrictions across various regions for both domestic and international flights have led to inactive fleets across the globe. Like many other sectors, the aviation lubricants market is also heavily impacted by the COVID-19 pandemic.

The two major factors which led to the decline in the lubricants market was the sudden drop in crude oil prices impacting the overall supply chain of the petroleum products and the decline in demand for aviation consumables such as lubricants and jet fuel due to temporary restrictions on air travel across the globe. Various stakeholders such as raw material providers, lubricant manufacturers, government agencies, lubricant suppliers, distributors, retailers, aircraft & engine manufacturers, and MRO companies are impacted significantly due to the slowdown of transportation, border closures, and increase in the number of inactive fleets.

Based on the end-user, the aftermarket segment is estimated to lead the aviation lubricants market in 2020

Based on end user type, the aviation lubricants market is segmented into OEM and Aftermarket. The aftermarket segment is estimated to account for a larger share of the overall market in 2020. Lubricants are replenished frequently, depending on the operating hours of the aircraft. The growth of this segment can be attributed to the increase in the aircraft fleet of emerging economies in the commercial and military aviation sectors. 2020. Lubricants are replenished frequently, depending on the operating hours of the aircraft.

Based on the platform, the commercial aviation segment is projected to grow at the highest CAGR during the forecast period

Based on the platform, the aviation lubricants market is segmented into commercial aviation, military aviation, and business & general aviation. The commercial aviation segment of the aviation lubricants market is projected to grow at the highest CAGR during the forecast period. The growth of this segment is driven by the increasing number of aircraft orders for military aviation globally.

Based on application, the engine segment of the aviation lubricants market is estimated to account for the largest share in 2020

Based on the application, the aviation lubricants market is segmented into engines, hydraulic systems, landing gear, airframe, and others. The engine segment is estimated to account for the largest share in 2020. The demand for advanced engine oils is increasing in this application as powerful and advanced turbofan engines are being introduced in the market.

North America is estimated to lead the aviation lubricants market in 2020, and Asia Pacific is projected to grow at the highest CAGR during the forecast period.

North America is estimated to lead the aviation lubricants market in 2020. Major aircraft and aircraft engine manufacturers, such as Boeing (US) and Pratt and Whitney (US), are present in the region and thus generate high demand for aviation lubricants. North America is projected to lead the aviation lubricants market during the forecast period as the region has the largest military and commercial aircraft fleet in the world. The aviation lubricants market in Asia Pacific is projected to grow at the highest CAGR during the forecast period, owing to the increasing demand for air travel and growing fleets in the region. The growth in air passenger traffic in the Asia Pacific has resulted in increased demand for new aircraft, which is boosting the growth of the Asia Pacific aviation lubricants market.

Market Dynamics

Drivers

  • Large, Existing and Growing Commercial and Military Aviation Fleet
  • Increased Complexity of Aircraft Engines Necessitates Proper Lubrication
  • Increased Consumption of Synthetic Lubricants

Restraint

  • Contamination of Lubricating Oils

Opportunities

  • Increasing Demand for Low Density Lubricants for Reduced Weight
  • Increasing Demand for Environmentally Safe Lubricants

Challenges

  • Operating Capability of Lubricants Under Extreme Conditions
  • Thermal and Oxidative Stress on Oil
  • Stringent Regulatory Norms
  • Cancellations and Delaying Orders from End-users Due to Covid-19

Companies Profiled

  • Exxonmobil
  • Total
  • BP
  • The Chemours Company
  • Royal Dutch Shell
  • Nyco
  • Lanxess
  • Lukoil
  • Phillips 66
  • Candan Industries
  • Nye Lubricants, Inc.
  • Eastman Chemical Company
  • Fuchs
  • Rocol
  • Aerospace Lubricants, Inc.
  • Everlube Products
  • National Process Industries, Inc.
  • Tiodize Co. Inc.
  • Mcgee Industries, Inc.
  • Jet-Lube
  • Las Aerospace Ltd
  • Tecsia Lubricants
  • Apar Lubricants Ltd
  • Ascend Aviation India
  • Monroe
  • Chemsol
  • Avi-Oil India [P] Ltd.
  • Petro Lubes Inc.
  • Lubrication Limited
  • Avia Prom Solutions Pvt Ltd.

For more information about this report visit https://www.researchandmarkets.com/r/bjz0l2


Contacts

ResearchAndMarkets.com
Laura Wood, Senior Press Manager
This email address is being protected from spambots. You need JavaScript enabled to view it.
For E.S.T Office Hours Call 1-917-300-0470
For U.S./CAN Toll Free Call 1-800-526-8630
For GMT Office Hours Call +353-1-416-8900

LONDON--(BUSINESS WIRE)--#FrackingWaterTreatmentMarket--Technavio has been monitoring the fracking water treatment market and it is poised to grow by USD 1.67 bn during 2020-2024, progressing at a CAGR of over 5% during the forecast period. The report offers an up-to-date analysis regarding the current market scenario, latest trends and drivers, and the overall market environment.


Although the COVID-19 pandemic continues to transform the growth of various industries, the immediate impact of the outbreak is varied. While a few industries will register a drop in demand, numerous others will continue to remain unscathed and show promising growth opportunities. Technavio’s in-depth research has all your needs covered as our research reports include all foreseeable market scenarios, including pre- & post-COVID-19 analysis. Download a Free Sample Report on COVID-19 Impacts

Frequently Asked Questions:

  • What are the major trends in the market?
    Adoption of supercritical carbon in fracking is a major trend driving the growth of the market.
  • At what rate is the market projected to grow?
    The year-over-year growth for 2020 is estimated at 4.59% and the incremental growth of the market is anticipated to be $ 1.67 bn.
  • Who are the top players in the market?
    Aquatech International LLC, DuPont de Nemours Inc., Evoqua Water Technologies Corp., Halliburton Co., Oasys Water Inc., Schlumberger Ltd., SUEZ SA, Veolia Environnement SA, WesTech Engineering Inc., and Xylem Inc., are some of the major market participants.
  • What is the key market driver?
    The increasing consumption of oil and natural gas is one of the major factors driving the market.
  • How big is the North America market?
    The North America region will contribute 87% of the market share

The market is fragmented, and the degree of fragmentation will accelerate during the forecast period. Aquatech International LLC, DuPont de Nemours Inc., Evoqua Water Technologies Corp., Halliburton Co., Oasys Water Inc., Schlumberger Ltd., SUEZ SA, Veolia Environnement SA, WesTech Engineering Inc., and Xylem Inc. are some of the major market participants. The increasing consumption of oil and natural gas will offer immense growth opportunities. To make most of the opportunities, market vendors should focus more on the growth prospects in the fast-growing segments, while maintaining their positions in the slow-growing segments.

Buy 1 Technavio report and get the second for 50% off. Buy 2 Technavio reports and get the third for free.

View market snapshot before purchasing

Technavio's custom research reports offer detailed insights on the impact of COVID-19 at an industry level, a regional level, and subsequent supply chain operations. This customized report will also help clients keep up with new product launches in direct & indirect COVID-19 related markets, upcoming vaccines and pipeline analysis, and significant developments in vendor operations and government regulations.

Fracking Water Treatment Market 2020-2024: Segmentation

Fracking Water Treatment Market is segmented as below:

  • Application
    • Treatment And Recycle
    • Deep Well Injection
  • Geographic Landscape
    • APAC
    • Europe
    • MEA
    • North America
    • South America

To learn more about the global trends impacting the future of market research, download a free sample: https://www.technavio.com/talk-to-us?report=IRTNTR40641

Fracking Water Treatment Market 2020-2024: Scope

Technavio presents a detailed picture of the market by the way of study, synthesis, and summation of data from multiple sources. The fracking water treatment market report covers the following areas:

  • Fracking Water Treatment Market Size
  • Fracking Water Treatment Market Trends
  • Fracking Water Treatment Market Industry Analysis

This study identifies the adoption of supercritical carbon in fracking as one of the prime reasons driving the fracking water treatment market growth during the next few years.

Technavio suggests three forecast scenarios (optimistic, probable, and pessimistic) considering the impact of COVID-19. Technavio’s in-depth research has direct and indirect COVID-19 impacted market research reports.
Register for a free trial today and gain instant access to 17,000+ market research reports.
Technavio's SUBSCRIPTION platform

Fracking Water Treatment Market 2020-2024: Key Highlights

  • CAGR of the market during the forecast period 2020-2024
  • Detailed information on factors that will assist fracking water treatment market growth during the next five years
  • Estimation of the fracking water treatment market size and its contribution to the parent market
  • Predictions on upcoming trends and changes in consumer behavior
  • The growth of the fracking water treatment market
  • Analysis of the market’s competitive landscape and detailed information on vendors
  • Comprehensive details of factors that will challenge the growth of fracking water treatment market vendors

Table of Contents:

Executive Summary

  • Market Overview

Market Landscape

  • Market ecosystem
  • Value chain analysis

Market Sizing

  • Market definition
  • Market segment analysis
  • Market size 2019
  • Market outlook: Forecast for 2019 - 2024

Five Forces Analysis

  • Five Forces Summary
  • Bargaining power of buyers
  • Bargaining power of suppliers
  • Threat of new entrants
  • Threat of substitutes
  • Threat of rivalry
  • Market condition

Market Segmentation by Application

  • Market segments
  • Comparison by Application placement
  • Treatment and recycle - Market size and forecast 2019-2024
  • Deep well injection - Market size and forecast 2019-2024
  • Market opportunity by Application

Customer landscape

  • Overview

Geographic Landscape

  • Geographic segmentation
  • Geographic comparison
  • North America - Market size and forecast 2019-2024
  • Europe - Market size and forecast 2019-2024
  • APAC - Market size and forecast 2019-2024
  • South America - Market size and forecast 2019-2024
  • MEA - Market size and forecast 2019-2024
  • Key leading countries
  • Market opportunity by geography

Drivers, Challenges, and Trends

  • Market drivers
  • Volume driver - Demand led growth
  • Volume driver - Supply led growth
  • Volume driver - External factors
  • Volume driver - Demand shift in adjacent markets
  • Price driver - Inflation
  • Price driver - Shift from lower to higher-priced units
  • Market challenges
  • Market trends

Vendor Landscape

  • Overview
  • Vendor landscape
  • Landscape disruption

Vendor Analysis

  • Vendors covered
  • Market positioning of vendors
  • Aquatech International LLC
  • DuPont de Nemours Inc.
  • Evoqua Water Technologies Corp.
  • Halliburton Co.
  • Oasys Water Inc.
  • Schlumberger Ltd.
  • SUEZ SA
  • Veolia Environnement SA
  • WesTech Engineering Inc.
  • Xylem Inc.

Appendix

  • Scope of the report
  • Currency conversion rates for US$
  • Research methodology
  • List of abbreviations


About Us
Technavio is a leading global technology research and advisory company. Their research and analysis focuses on emerging market trends and provides actionable insights to help businesses identify market opportunities and develop effective strategies to optimize their market positions. With over 500 specialized analysts, Technavio’s report library consists of more than 17,000 reports and counting, covering 800 technologies, spanning across 50 countries. Their client base consists of enterprises of all sizes, including more than 100 Fortune 500 companies. This growing client base relies on Technavio’s comprehensive coverage, extensive research, and actionable market insights to identify opportunities in existing and potential markets and assess their competitive positions within changing market scenarios.


Contacts

Technavio Research
Jesse Maida
Media & Marketing Executive
US: +1 844 364 1100
UK: +44 203 893 3200
Email: This email address is being protected from spambots. You need JavaScript enabled to view it.
Website: www.technavio.com/

NJNG’s largest energy-efficiency program request would expand opportunities for low- and moderate-income customers, align with State’s clean energy goals for energy efficiency

WALL, N.J.--(BUSINESS WIRE)--Building on its decade-long record of leadership in running energy-efficiency programs, New Jersey Natural Gas (NJNG) today filed a proposal with the New Jersey Board of Public Utilities (BPU), seeking to significantly expand its offerings to help customers save money, manage their energy usage and reduce emissions.


The $249 million proposal would strengthen NJNG’s existing energy-efficiency offerings for residential and commercial customers, launch a new program to serve multi-family properties and provide targeted assistance for low- and moderate-income households. In addition, this filing reflects new legislative provisions intended to shift administration of some programs from the State to utilities, and provides an innovative approach for collaboration with electric utilities that have overlapping service territories with NJNG.

If approved in full, the programs reflected in this filing will help NJNG customers save more than 128 million therms of natural gas, preventing the emission of over 677,000 metric tons of CO2 - the equivalent of taking 146,000 cars off the road for a year. As proposed, the filing would also allow NJNG to meet or exceed the energy reduction targets set by the BPU, consistent with the landmark New Jersey Clean Energy Act, which was signed into law in 2018 and for the first time ever set specific energy reduction targets for the State’s utilities.

“NJNG has been a leader in New Jersey’s energy-efficiency industry for over a decade, running robust programs that have conserved energy, delivered savings for our customers and reduced emissions to benefit the environment,” said Steve Westhoven, president and chief executive officer of New Jersey Natural Gas. “As NJNG’s largest-ever program to put energy efficiency within reach for our customers, this filing reflects our strong commitment to clean energy, emissions reduction and sustainability. We are doing our part to help New Jersey reduce emissions and realize a clean energy future, while doubling down on our efforts to help our most vulnerable customers save energy and money.”

Pending BPU approval, NJNG expects to invest more than $249 million over the three-year program, consisting of approximately $127 million of direct investment and $98 million in financing options, and approximately $23 million in operation and maintenance expenses. The average annual impact for the typical residential heating customer using 1,000 therms per year over the 15-year recovery term of the program is estimated to be $21.71 or 1.9%. Expected savings for participating customers will range from 1 to 30% depending on the program utilized. Lifetime net benefits – above and beyond the cost of the program – are expected to exceed $191 million.

Since 2009, NJNG has invested more than $169 million in energy-efficiency programs through The SAVEGREEN Project®, generating $463 million in economic activity in its service territory, while reducing greenhouse emissions. Over the last decade, more than 66,000 customers – one out of every nine – have participated in SAVEGREEN, helping to grow the green energy economy for the more than 2,800 contractors who have taken part in the program.

NJNG’s strong focus on running successful energy-efficiency programs has helped reduce its average customers’ gas consumption by 12% since 2006.

Residential Offerings

To increase the energy-efficiency opportunities for residential customers, NJNG will provide rebates and incentives for qualifying equipment replacement and comprehensive home energy measures and offer customers 0% APR repayment and on-bill repayment options, with special terms for Low-to-Moderate Income (LMI) customers. Additionally, there are new no cost programs proposed to help renters and homeowners achieve immediate energy savings and to provide a special no cost weatherization program that will help LMI households achieve deeper energy savings.

Multi-family Offerings

New multi-family offerings will provide potential services that include: energy-efficiency education through energy assessments; installation of standard energy savings measures; equipment replacement; and, custom retrofits and engineered solutions and emergency equipment replacement. In addition, this program will provide an on-bill repayment program with longer repayment terms for low and moderate income and affordable housing properties.

Commercial and Industrial Offerings

The filing proposes multiple approaches to help commercial customers address the upfront costs of energy-efficient equipment and whole-building energy improvements, as well as new retro-commissioning and energy management efforts to maximize savings and reduce payback time. The proposal includes incentives and on-bill repayment programs for comprehensive approaches like Direct Install and Engineered Solutions that start with energy audits of the facilities of commercial customers, including small businesses, non-profit organizations, municipalities, schools and faith-based organizations.

Putting Energy Efficiency in Reach for Low- and Moderate-Income Households

NJNG’s SAVEGREEN proposal focuses on a number of approaches that can help LMI customers reduce their energy bills. This includes special incentives and longer repayment terms for HVAC programs to make energy efficiency upgrades more accessible; an efficient products program to offer lower cost energy-efficiency products that can provide immediate savings and appeal to renters as well as homeowners; the no cost quick home energy check-up; distribution of free energy conservation kits in partnership with local foodbanks and community organizations; a new moderate income weatherization program; and, program options that serve the needs of a broad range of multi-family properties and are designed to help increase the likelihood of participation.

NJNG is also streamlining the process to allow automatic qualification for these special incentives based upon designated geographic location (e.g. Urban Enterprise Zones) or participation in another qualifying program.

Pending BPU approval, NJNG will earn a return on its investments at its currently allowed weighted average cost of capital.

About New Jersey Resources

New Jersey Resources (NYSE: NJR) is a Fortune 1000 company that, through its subsidiaries, provides safe and reliable natural gas and clean energy services, including transportation, distribution, asset management and home services. NJR is composed of five primary businesses:

  • New Jersey Natural Gas, NJR’s principal subsidiary, operates and maintains over 7,500 miles of natural gas transportation and distribution infrastructure to serve over half a million customers in New Jersey’s Monmouth, Ocean, Morris, Middlesex and Burlington counties.
  • NJR Clean Energy Ventures invests in, owns and operates solar projects with a total capacity of more than 350 megawatts, providing residential and commercial customers with low-carbon solutions.
  • NJR Energy Services manages a diversified portfolio of natural gas transportation and storage assets and provides physical natural gas services and customized energy solutions to its customers across North America.
  • NJR Midstream serves customers from local distributors and producers to electric generators and wholesale marketers through its ownership of Leaf River Energy Center and the Adelphia Gateway Pipeline Project, as well as our 50 percent equity ownership in the Steckman Ridge natural gas storage facility, and our 20 percent equity interest in the PennEast Pipeline Project.
  • NJR Home Services provides service contracts as well as heating, central air conditioning, water heaters, standby generators, solar and other indoor and outdoor comfort products to residential homes throughout New Jersey.

NJR and its more than 1,100 employees are committed to helping customers save energy and money by promoting conservation and encouraging efficiency through Conserve to Preserve® and initiatives such as The SAVEGREEN Project® and The Sunlight Advantage®. For more information about NJR: www.njresources.com.

Follow us on Twitter @NJNaturalGas.
“Like” us on facebook.com/NewJerseyNaturalGas.


Contacts

Media:
Michael Kinney
732-938-1031
This email address is being protected from spambots. You need JavaScript enabled to view it.

Investor:
Dennis Puma
732-938-1229
This email address is being protected from spambots. You need JavaScript enabled to view it.

LONDON--(BUSINESS WIRE)--#FuelAdditivesMarket--Technavio has been monitoring the fuel additives market and it is poised to grow by $ 4.08 bn during 2020-2024, progressing at a CAGR of almost 7% during the forecast period. The report offers an up-to-date analysis regarding the current market scenario, latest trends and drivers, and the overall market environment.


Although the COVID-19 pandemic continues to transform the growth of various industries, the immediate impact of the outbreak is varied. While a few industries will register a drop in demand, numerous others will continue to remain unscathed and show promising growth opportunities. Technavio’s in-depth research has all your needs covered as our research reports include all foreseeable market scenarios, including pre- & post-COVID-19 analysis. We offer $1000 worth of FREE customization

The market is fragmented, and the degree of fragmentation will accelerate during the forecast period. Afton Group, BASF SE, Chevron Corp., Clariant International Ltd., Cummins Inc., DuPont de Nemours Inc., Ecolab Inc., Evonik Industries AG, LyondellBasell Industries NV, and The Lubrizol Corp. are some of the major market participants. To make the most of the opportunities, market vendors should focus more on the growth prospects in the fast-growing segments, while maintaining their positions in the slow-growing segments.

Buy 1 Technavio report and get the second for 50% off. Buy 2 Technavio reports and get the third for free.

View market snapshot before purchasing

Rising demand for ULSD has been instrumental in driving the growth of the market. However, the rising need for renewable clean fuel might hamper the market growth.

Technavio's custom research reports offer detailed insights on the impact of COVID-19 at an industry level, a regional level, and subsequent supply chain operations. This customized report will also help clients keep up with new product launches in direct & indirect COVID-19 related markets, upcoming vaccines and pipeline analysis, and significant developments in vendor operations and government regulations. Download a Free Sample Report on COVID-19 Impacts

Fuel Additives Market 2020-2024: Segmentation

Fuel Additives Market is segmented as below:

  • Type
    • Deposit Control Additives
    • Cetane Improvers
    • Antioxidants
    • Cold Flow Improvers
    • Others
  • Application
    • Diesel Fuel Additives
    • Gasoline Fuel Additives
    • Aviation Fuel Additives
    • Others
  • Geography
    • APAC
    • Europe
    • North America
    • MEA
    • South America

Fuel Additives Market 2020-2024: Scope

Technavio presents a detailed picture of the market by the way of study, synthesis, and summation of data from multiple sources. The fuel additives market report covers the following areas:

  • Fuel Additives Market Size
  • Fuel Additives Market Trends
  • Fuel Additives Market Industry Analysis

This study identifies the growing demand for fuel from end-user industries as one of the prime reasons driving the fuel additives market growth during the next few years.

Technavio suggests three forecast scenarios (optimistic, probable, and pessimistic) considering the impact of COVID-19. Technavio’s in-depth research has direct and indirect COVID-19 impacted market research reports.

Register for a free trial today and gain instant access to 17,000+ market research reports.

Technavio's SUBSCRIPTION platform

Fuel Additives Market 2020-2024: Key Highlights

  • CAGR of the market during the forecast period 2020-2024
  • Detailed information on factors that will assist fuel additives market growth during the next five years
  • Estimation of the fuel additives market size and its contribution to the parent market
  • Predictions on upcoming trends and changes in consumer behavior
  • The growth of the fuel additives market
  • Analysis of the market’s competitive landscape and detailed information on vendors
  • Comprehensive details of factors that will challenge the growth of fuel additives market vendors

Table of Contents:

Executive Summary

Market Landscape

  • Market ecosystem
  • Market characteristics
  • Value chain analysis

Market Sizing

  • Market definition
  • Market segment analysis
  • Market size 2019
  • Market outlook: Forecast for 2019 - 2024

Five Forces Analysis

  • Five forces summary
  • Bargaining power of buyers
  • Bargaining power of suppliers
  • Threat of new entrants
  • Threat of substitutes
  • Threat of rivalry
  • Market condition

Market Segmentation by Application

  • Market segments
  • Comparison by Application
  • Diesel fuel additives - Market size and forecast 2019-2024
  • Gasoline fuel additives - Market size and forecast 2019-2024
  • Aviation fuel additives - Market size and forecast 2019-2024
  • Others - Market size and forecast 2019-2024
  • Market opportunity by Application

Market Segmentation by Type

  • Market segments
  • Comparison by Type
  • Deposit control additives - Market size and forecast 2019-2024
  • Cetane improvers - Market size and forecast 2019-2024
  • Antioxidants - Market size and forecast 2019-2024
  • Cold flow improvers - Market size and forecast 2019-2024
  • Others - Market size and forecast 2019-2024
  • Market opportunity by Type

Customer Landscape

Geographic Landscape

  • Geographic segmentation
  • Geographic comparison
  • APAC - Market size and forecast 2019-2024
  • Europe - Market size and forecast 2019-2024
  • North America - Market size and forecast 2019-2024
  • MEA - Market size and forecast 2019-2024
  • South America - Market size and forecast 2019-2024
  • Key leading countries
  • Market opportunity by geography
  • Volume driver-Demand led growth
  • Market challenges
  • Market trends

Vendor Landscape

  • Vendor landscape
  • Landscape disruption

Vendor Analysis

  • Vendors covered
  • Market positioning of vendors
  • Afton Group
  • BASF SE
  • Chevron Corp.
  • Clariant International Ltd.
  • Cummins Inc.
  • DuPont de Nemours Inc.
  • Ecolab Inc.
  • Evonik Industries AG
  • LyondellBasell Industries NV
  • The Lubrizol Corp.

Appendix

  • Scope of the report
  • Currency conversion rates for US$
  • Research methodology
  • List of abbreviations

About Us

Technavio is a leading global technology research and advisory company. Their research and analysis focus on emerging market trends and provides actionable insights to help businesses identify market opportunities and develop effective strategies to optimize their market positions. With over 500 specialized analysts, Technavio’s report library consists of more than 17,000 reports and counting, covering 800 technologies, spanning across 50 countries. Their client base consists of enterprises of all sizes, including more than 100 Fortune 500 companies. This growing client base relies on Technavio’s comprehensive coverage, extensive research, and actionable market insights to identify opportunities in existing and potential markets and assess their competitive positions within changing market scenarios.


Contacts

Technavio Research
Jesse Maida
Media & Marketing Executive
US: +1 844 364 1100
UK: +44 203 893 3200
Email: This email address is being protected from spambots. You need JavaScript enabled to view it.
Website: www.technavio.com/

HOUSTON--(BUSINESS WIRE)--Phillips 66 (NYSE: PSX) executive management will host a conference call webcast at noon EDT on Friday, Oct. 30, to discuss the company’s third-quarter 2020 financial results, which will be released earlier that day, and provide an update on strategic initiatives.


To access the webcast, go to the Phillips 66 Investors site, www.phillips66.com/investors, and click on “Events and Presentations.” A replay of the webcast will be archived on the Investors site approximately two hours after the live call, and a transcript will be available at a later date.

About Phillips 66

Phillips 66 is a diversified energy manufacturing and logistics company. With a portfolio of Midstream, Chemicals, Refining, and Marketing and Specialties businesses, the company processes, transports, stores and markets fuels and products globally. Phillips 66 Partners, the company's master limited partnership, is integral to the portfolio. Headquartered in Houston, the company has 14,500 employees committed to safety and operating excellence. Phillips 66 had $55 billion of assets as of June 30, 2020. For more information, visit http://www.phillips66.com or follow us on Twitter @Phillips66Co.


Contacts

Jeff Dietert, 832-765-2297 (investors)
This email address is being protected from spambots. You need JavaScript enabled to view it.
or
Brent Shaw, 832-765-2297 (investors)
This email address is being protected from spambots. You need JavaScript enabled to view it.
or
Joe Gannon, 855-841-2368 (media)
This email address is being protected from spambots. You need JavaScript enabled to view it.

LONDON--(BUSINESS WIRE)--#GlobalSlidingSleevesMarket--Technavio has been monitoring the sliding sleeves market and it is poised to grow by USD 743.19 million during 2020-2024, progressing at a CAGR of over 3% during the forecast period. The report offers an up-to-date analysis regarding the current market scenario, latest trends and drivers, and the overall market environment.


Although the COVID-19 pandemic continues to transform the growth of various industries, the immediate impact of the outbreak is varied. While a few industries will register a drop in demand, numerous others will continue to remain unscathed and show promising growth opportunities. Technavio’s in-depth research has all your needs covered as our research reports include all foreseeable market scenarios, including pre- & post-COVID-19 analysis. Download a Free Sample Report on COVID-19 Impacts

Frequently Asked Questions-

  • Based on segmentation by application, which is the leading segment in the market?
  • The onshore segment is expected to be the leading segment based on application in the global market during the forecast period.
  • What are the major trends in the market?
  • Adoption of new-generation automated drilling rigs is one of the major trends in the market.
  • At what rate is the market projected to grow?
  • Growing at a CAGR of over 3%, the incremental growth of the market is anticipated to be USD 743.19 million.
  • Who are the top players in the market?
  • Baker Hughes, a GE company, D&L Oil Tools, Halliburton Co., National Oilwell Varco Inc., NCS Multistage Holdings Inc., Nine Energy Service, Inc., Sapex Group Ltd., Schlumberger Ltd., Schoeller-Bleckmann Oilfield Equipment AG, and Weatherford International plc. are some of the major market participants.
  • What are the key market drivers and challenges?
  • Introduction of new oil & gas exploration policies is one of the major factors driving the market. However, the increased adoption of renewable sources of energy will restrain market growth.
  • How big is the North America market?
  • The North America region will contribute 49% of market growth.

The market is fragmented, and the degree of fragmentation will accelerate during the forecast period. Baker Hughes, a GE company, D&L Oil Tools, Halliburton Co., National Oilwell Varco Inc., NCS Multistage Holdings Inc., Nine Energy Service, Inc., Sapex Group Ltd., Schlumberger Ltd., Schoeller-Bleckmann Oilfield Equipment AG, and Weatherford International plc are some of the major market participants. The introduction of new oil & gas exploration policies will offer immense growth opportunities. To make most of the opportunities, market vendors should focus more on the growth prospects in the fast-growing segments, while maintaining their position in the slow-growing segments.

Buy 1 Technavio report and get the second for 50% off. Buy 2 Technavio reports and get the third for free.

View market snapshot before purchasing

Technavio's custom research reports offer detailed insights on the impact of COVID-19 at an industry level, a regional level, and subsequent supply chain operations. This customized report will also help clients keep up with new product launches in direct & indirect COVID-19 related markets, upcoming vaccines and pipeline analysis, and significant developments in vendor operations and government regulations.

Sliding Sleeves Market 2020-2024: Segmentation

Sliding Sleeves Market is segmented as below:

  • Application
    • Onshore
    • Offshore
  • Geographic Landscape
    • APAC
    • Europe
    • MEA
    • North America
    • South America

To learn more about the global trends impacting the future of market research, download a free sample: https://www.technavio.com/talk-to-us?report=IRTNTR41109

Sliding Sleeves Market 2020-2024: Scope

Technavio presents a detailed picture of the market by the way of study, synthesis, and summation of data from multiple sources. The sliding sleeves market report covers the following areas:

  • Sliding Sleeves Market Size
  • Sliding Sleeves Market Trends
  • Sliding Sleeves Market Analysis

This study identifies adoption of new-generation automated drilling rigs as one of the prime reasons driving the sliding sleeves market growth during the next few years.

Technavio suggests three forecast scenarios (optimistic, probable, and pessimistic) considering the impact of COVID-19. Technavio’s in-depth research has direct and indirect COVID-19 impacted market research reports.

Register for a free trial today and gain instant access to 17,000+ market research reports. Technavio's SUBSCRIPTION platform

Sliding Sleeves Market 2020-2024: Key Highlights

  • CAGR of the market during the forecast period 2020-2024
  • Detailed information on factors that will assist sliding sleeves market growth during the next five years
  • Estimation of the sliding sleeves market size and its contribution to the parent market
  • Predictions on upcoming trends and changes in consumer behavior
  • The growth of the sliding sleeves market
  • Analysis of the market’s competitive landscape and detailed information on vendors
  • Comprehensive details of factors that will challenge the growth of sliding sleeves market vendors

Table of Contents:

Executive Summary

  • Market Overview

Market Landscape

  • Market ecosystem
  • Value chain analysis

Market Sizing

  • Market definition
  • Market segment analysis
  • Market size 2019
  • Market outlook: Forecast for 2019 - 2024

Five Forces Analysis

  • Bargaining power of buyers
  • Bargaining power of suppliers
  • Threat of new entrants
  • Threat of substitutes
  • Threat of rivalry
  • Market condition

Market Segmentation by Application

  • Market segments
  • Comparison by Application placement
  • Onshore - Market size and forecast 2019-2024
  • Offshore - Market size and forecast 2019-2024
  • Market opportunity by Application

Customer landscape

  • Overview

Geographic Landscape

  • Geographic segmentation
  • Geographic comparison
  • MEA - Market size and forecast 2019-2024
  • North America - Market size and forecast 2019-2024
  • Europe - Market size and forecast 2019-2024
  • APAC - Market size and forecast 2019-2024
  • South America - Market size and forecast 2019-2024
  • Key leading countries
  • Market opportunity by geography

Drivers, Challenges, and Trends

  • Market drivers
  • Volume driver - Demand led growth
  • Volume driver - Supply led growth
  • Volume driver - External factors
  • Volume driver - Demand shift in adjacent markets
  • Price driver - Inflation
  • Price driver - Shift from lower to higher-priced units
  • Market challenges
  • Market trends

Vendor Landscape

  • Overview
  • Landscape disruption
  • Vendor Analysis

Vendors covered

  • Market positioning of vendors
  • Baker Hughes, a GE company
  • D&L Oil Tools
  • Halliburton Co.
  • National Oilwell Varco Inc.
  • NCS Multistage Holdings Inc.
  • Nine Energy Service, Inc.
  • Sapex Group Ltd.
  • Schlumberger Ltd.
  • Schoeller-Bleckmann Oilfield Equipment AG
  • Weatherford International plc

Appendix

  • Scope of the report
  • Currency conversion rates for US$
  • Research methodology
  • List of abbreviations


About Us

Technavio is a leading global technology research and advisory company. Their research and analysis focuses on emerging market trends and provides actionable insights to help businesses identify market opportunities and develop effective strategies to optimize their market positions. With over 500 specialized analysts, Technavio’s report library consists of more than 17,000 reports and counting, covering 800 technologies, spanning across 50 countries. Their client base consists of enterprises of all sizes, including more than 100 Fortune 500 companies. This growing client base relies on Technavio’s comprehensive coverage, extensive research, and actionable market insights to identify opportunities in existing and potential markets and assess their competitive positions within changing market scenarios.


Contacts

Technavio Research
Jesse Maida
Media & Marketing Executive
US: +1 844 364 1100
UK: +44 203 893 3200
Email: This email address is being protected from spambots. You need JavaScript enabled to view it.
Website: www.technavio.com/

HOUSTON--(BUSINESS WIRE)--In a federal tax refund case with significant implications for the oil and gas industry, Trafigura Trading, LLC, a market leader in the global commodities industry, retained Chamberlain Hrdlicka to challenge the constitutionality of 26 U.S.C. § 4611(b), which imposes a “tax on . . . domestic crude oil . . . exported from the United States.” The taxes are one of the sources of funding of the Oil Spill Liability Trust Fund, enacted as part of the Oil Pollution Act of 1990. For the tax periods in question, Trafigura paid over $4.2 million in taxes on its crude oil exports. After being denied a refund by the Internal Revenue Service, Trafigura filed a lawsuit in the Southern District of Texas.


Trafigura argued that § 4611(b) violates the Export Clause of the United States Constitution, which states: “No Tax or Duty shall be laid on Articles exported from any State.” The Government did not dispute that Trafigura paid the taxes but argued that § 4611(b), while labeled a tax, is a user fee paid by exporters in exchange for statutory capped liability under the Oil Pollution Act of 1990. If characterized as a user fee instead of a tax, the Government maintained, the Export Clause would not forbid the charge.

Supreme Court guidance on the user fee defense is found in two cases that stand in contrast. In Pace v. Burgess, decided in 1875, Congress imposed an excise tax on tobacco and enacted a companion provision exempting tobacco intended for export. To identify those exempt packages, exporters were required to pay 25 cents in exchange for a stamp that it could place on the package. The Court found that the charge was a user fee because the price of the stamp did not fluctuate with the quantity or value of the export and the fee closely approximated the cost in providing the stamp.

That was not the case in United States v. U.S. Shoe Corp., where, in 1998, the Court struck down a Harbor Maintenance Tax on commercial exports as unconstitutional under the Export Clause. Unlike the 25-cent charge in Pace, the Harbor Maintenance Tax fluctuated with the quantity or value of the export and did not closely approximate costs in providing harbor maintenance services to the taxpayer.

On September 8, 2020, the Court determined that § 4611(b) is an unconstitutional tax on exports because the amount of taxes varies depending on the quantity of the crude oil export, and “the charge does not fairly match the exporter’s use of the services provided by the funds raised from the charge.” The Court deferred its decision as to the remedy.

Trafigura is represented by Chamberlain Hrdlicka attorneys Steven J. Knight, lead counsel and Chair of the firm’s Appellate practice, Lawrence W. Sherlock, Co-Chair of the firm’s Tax Controversy practice, and Peter A. Lowy, Co-Chair of the firm’s State and Local Tax Controversy and Planning practice.

About Chamberlain Hrdlicka

Chamberlain Hrdlicka is a diversified business law firm with offices in Houston, Atlanta, Philadelphia and San Antonio. The firm represents both public and private companies, as well as individuals and family-owned businesses across the nation. The firm offers counsel in civil appeals, litigation, tax planning and tax controversy, corporate, securities and finance, energy law, estate planning and administration, intellectual property, international and immigration law, commercial and business litigation, real estate and construction law. For more information, visit: www.chamberlainlaw.com.


Contacts

Ania Czarnecka
713-351-9165
This email address is being protected from spambots. You need JavaScript enabled to view it.

Strong Winds Expected to begin Early Sunday Morning and Last Through Monday Morning in Most Locations

SAN FRANCISCO--(BUSINESS WIRE)--Pacific Gas and Electric Company (PG&E) has announced that it will de-energize certain electrical lines as part of a Public Safety Power Shutoff (PSPS) due to a strong and dry offshore wind event. The PSPS event will affect customers in portions of 16 counties, primarily in Northern Sierra and the North Valley.

The first de-energization phase will begin early Sunday morning and impact approximately 15,000 customers. The second phase is expected to begin Sunday afternoon and will impact approximately 74,000 customers. This PSPS event is based on forecasts of widespread, severely dry conditions and strong, gusty winds. These conditions are expected to continue through Monday morning in most locations.

The power shutoff is expected to impact approximately 89,000 customers in portions of 16 counties, including: Alpine, Amador, Butte, Calaveras, El Dorado, Lake, Napa, Nevada, Placer, Plumas, Shasta, Sierra, Tehama and Yuba counties. Two customers within Sonoma County and 15 customers in Kern County are also expected to be included in the scope of this PSPS.

PG&E is working to improve its PSPS program by making events smaller in size, shorter in length and smarter for our customers. While PSPS is an important wildfire safety tool, PG&E understands the burden PSPS places on its customers especially for those with medical needs and customers sheltering-at-home in response to COVID-19.

Timeline for safety shutoffs

Based on wind forecasts, the process to shut off power will begin in the early morning hours of Sunday, Sept. 27. PG&E expects to begin de-energization for the first wave of 15,000 customers at approximately 2:00 a.m. on Sunday morning.

Weather forecasts project a lull in wind activity during the day on Sunday, and then escalating again Sunday late afternoon. At that time—approximately 4 p.m.—PG&E will begin de-energization for the second wave of 74,000 customers, primarily in the Central Sierra region.

Once the high winds subside Monday morning, PG&E will inspect the de-energized lines to ensure they were not damaged during the wind event, and then restore power. PG&E will safely restore power in stages as quickly as possible, with the goal of restoring power to nearly all customers within 12 daylight hours after severe weather has passed.

Customer notifications—via text, email and automated phone call—began Thursday, approximately 48 hours prior to the potential shutoff. Customers enrolled in the company’s Medical Baseline program who do not verify that they have received these important safety communications will be individually visited by a PG&E employee to deliver the warning if possible, starting with customers who rely on electricity for critical life-sustaining equipment.

Potentially Impacted Counties and Customers

The power shutoff is currently expected to impact approximately 89,000 customers in the following 16 counties, including:

  • Alpine County: 573 customers, 6 Medical Baseline
  • Amador County: 5,465 customers, 400 Medical Baseline
  • Butte County: 18,001 customers, 1,726 Medical Baseline
  • Calaveras County: 9,978 customers, 386 Medical Baseline
  • El Dorado County: 30,259 customers, 2,011 Medical Baseline
  • Kern County: 15 customers, 0 Medical Baseline
  • Lake County: 55 customers, 2 Medical Baseline
  • Napa County: 216 customers, 5 Medical Baseline
  • Nevada County: 7,260 customers, 434 Medical Baseline
  • Placer County: 9,056 customers, 560 Medical Baseline
  • Plumas County: 785 customers, 24 Medical Baseline
  • Shasta County: 2,816 customers, 241 Medical Baseline
  • Sierra County: 1,099 customers, 22 Medical Baseline
  • Sonoma County: 2 customers, 0 Medical Baseline
  • Tehama County: 1,223 customers, 58 Medical Baseline
  • Yuba County: 1,891 customers, 152 Medical Baseline

Total: 88,703 customers, 6,027 Medical Baseline

Customers can use an address lookup tool to find out if their location is being monitored for the potential safety shutoff at www.pge.com/pspsupdates.

Here’s Where to Go to Learn More

  • PG&E’s emergency website www.pge.com/pspsupdates is now available in thirteen languages. Currently, the website is available in English, Spanish, Chinese, Tagalog, Russian, Vietnamese, Korean, Farsi, Arabic, Hmong, Khmer, Punjabi and Japanese. Customers will have the opportunity to choose their language of preference for viewing the information when visiting the website.
  • Customers are encouraged to update their contact information and indicate their preferred language for notifications by visiting www.pge.com/mywildfirealerts or by calling 1-800-742-5000, where in-language support is available.
  • Tenants and non-account holders can sign up to receive PSPS Zip Code Alerts for any area where you do not have a PG&E account by visiting www.pge.com/pspszipcodealerts.
  • PG&E has launched a new tool at its online Safety Action Center www.safetyactioncenter.pge.com to help customers prepare. By using the "Make Your Own Emergency Plan" tool and answering a few short questions, visitors to the website can compile and organize the important information needed for a personalized family emergency plan.

Community Resource Centers Reflect COVID-Safety Protocols

PG&E will open approximately 28 outdoor, open-air Community Resource Centers (CRCs) in every county where a PSPS occurs. These temporary CRCs will be open to customers when power is out at their homes and will provide ADA-accessible restrooms, hand-washing stations; medical-equipment charging; Wi-Fi; bottled water; grab-and-go bags and non-perishable snacks. PG&E updates its CRC locations regularly, click here for updates.

All CRCs will follow important health and safety protocols including:

  • Facial coverings and maintaining a physical distance of at least six feet from those who are not part of the same household will be required at all CRCs.
  • Temperature checks will be administered before entering CRCs that are located indoors.
  • CRC staff will be trained in COVID-19 precautions and will regularly sanitize surfaces and use Plexiglass barriers at check-in.
  • All CRCs will follow county and state requirements regarding COVID-19, including limits on the number of customers permitted indoors at any time. 

About PG&E

Pacific Gas and Electric Company, a subsidiary of PG&E Corporation (NYSE:PCG), is one of the largest combined natural gas and electric energy companies in the United States. Based in San Francisco, with more than 23,000 employees, the company delivers some of the nation's cleanest energy to 16 million people in Northern and Central California. For more information, visit pge.com and pge.com/news.


Contacts

Media Relations
415.973.5930

HOUSTON--(BUSINESS WIRE)--Phillips 66 Partners (NYSE: PSXP) executive management will host a conference call webcast at 2 p.m. EDT on Friday, Oct. 30, to discuss the partnership’s third-quarter 2020 financial results, which will be released earlier that day, and provide an update on strategic initiatives.


To access the webcast, go to the Phillips 66 Partners Events and Presentations site, www.phillips66partners.com/events. A replay of the webcast will be archived on the Events and Presentations site approximately two hours after the live call, and a transcript will be available at a later date.

About Phillips 66 Partners

Headquartered in Houston, Phillips 66 Partners is a growth-oriented master limited partnership formed by Phillips 66 to own, operate, develop and acquire primarily fee-based crude oil, refined petroleum products and natural gas liquids pipelines, terminals and other midstream assets. For more information, visit www.phillips66partners.com.


Contacts

Jeff Dietert, 832-765-2297 (investors)
This email address is being protected from spambots. You need JavaScript enabled to view it.
or
Brent Shaw, 832-765-2297 (investors)
This email address is being protected from spambots. You need JavaScript enabled to view it.
or
Joe Gannon, 855-841-2368 (media)
This email address is being protected from spambots. You need JavaScript enabled to view it.

LONDON--(BUSINESS WIRE)--#GlobalOffshoreOilandGasSeismicEquipmentandAcquisitionsMarket--Technavio has been monitoring the offshore oil and gas seismic equipment and acquisitions market and it is poised to grow by USD 1.39 bn during 2020-2024, progressing at a CAGR of over 7% during the forecast period. The report offers an up-to-date analysis regarding the current market scenario, latest trends and drivers, and the overall market environment.


Although the COVID-19 pandemic continues to transform the growth of various industries, the immediate impact of the outbreak is varied. While a few industries will register a drop in demand, numerous others will continue to remain unscathed and show promising growth opportunities. Technavio’s in-depth research has all your needs covered as our research reports include all foreseeable market scenarios, including pre- & post-COVID-19 analysis. We offer $1000 worth of FREE customization

The market is concentrated, and the degree of concentration will accelerate during the forecast period. Arabian Geophysical and Surveying Co., Fugro NV, ION Geophysical Corp., Mitcham Industries Inc., PGS ASA, Polarcus Ltd., SAExploration Holdings Inc., SeaBird Exploration Plc, Shearwater GeoServices Holdings AS, and TGS-NOPEC Geophysical Co. ASA are some of the major market participants. To make the most of the opportunities, market vendors should focus more on the growth prospects in the fast-growing segments, while maintaining their positions in the slow-growing segments.

Buy 1 Technavio report and get the second for 50% off. Buy 2 Technavio reports and get the third for free.

View market snapshot before purchasing

The rise in deepwater and ultra-deepwater E&P projects has been instrumental in driving the growth of the market.

Technavio's custom research reports offer detailed insights on the impact of COVID-19 at an industry level, a regional level, and subsequent supply chain operations. This customized report will also help clients keep up with new product launches in direct & indirect COVID-19 related markets, upcoming vaccines and pipeline analysis, and significant developments in vendor operations and government regulations. Download a Free Sample Report on COVID-19 Impacts

Offshore Oil and Gas Seismic Equipment and Acquisitions Market 2020-2024: Segmentation

Offshore Oil and Gas Seismic Equipment and Acquisitions Market is segmented as below:

  • Technology
    • 3D Seismic Survey
    • 2D Seismic Survey
    • 4D Seismic Survey
  • Geographic Landscape
    • North America
    • APAC
    • Europe
    • South America
    • MEA

Offshore Oil and Gas Seismic Equipment and Acquisitions Market 2020-2024: Scope

Technavio presents a detailed picture of the market by the way of study, synthesis, and summation of data from multiple sources. The offshore oil and gas seismic equipment and acquisitions market report covers the following areas:

  • Offshore Oil and Gas Seismic Equipment and Acquisitions Market Size
  • Offshore Oil and Gas Seismic Equipment and Acquisitions Market Trends
  • Offshore Oil and Gas Seismic Equipment and Acquisitions Market Industry Analysis

This study identifies the increasing adoption of 4D seismic survey technology as one of the prime reasons driving the offshore oil and gas seismic equipment and acquisitions market growth during the next few years.

Technavio suggests three forecast scenarios (optimistic, probable, and pessimistic) considering the impact of COVID-19. Technavio’s in-depth research has direct and indirect COVID-19 impacted market research reports.

Register for a free trial today and gain instant access to 17,000+ market research reports.

Technavio's SUBSCRIPTION platform

Offshore Oil and Gas Seismic Equipment and Acquisitions Market 2020-2024: Key Highlights

  • CAGR of the market during the forecast period 2020-2024
  • Detailed information on factors that will assist offshore oil and gas seismic equipment and acquisitions market growth during the next five years
  • Estimation of the offshore oil and gas seismic equipment and acquisitions market size and its contribution to the parent market
  • Predictions on upcoming trends and changes in consumer behavior
  • The growth of the offshore oil and gas seismic equipment and acquisitions market
  • Analysis of the market’s competitive landscape and detailed information on vendors
  • Comprehensive details of factors that will challenge the growth of offshore oil and gas seismic equipment and acquisitions market, vendors

Table of Contents:

PART 01: EXECUTIVE SUMMARY

PART 02: SCOPE OF THE REPORT

  • Preface
  • Currency conversion rates for US$

PART 03: MARKET LANDSCAPE

  • Market ecosystem
  • Market characteristics
  • Value chain analysis
  • Market segmentation analysis

PART 04: MARKET SIZING

  • Market definition
  • Market sizing 2019
  • Market outlook
  • Market size and forecast 2019-2024

PART 05: FIVE FORCES ANALYSIS

  • Bargaining power of buyers
  • Bargaining power of suppliers
  • Threat of new entrants
  • Threat of substitutes
  • Threat of rivalry
  • Market condition

PART 06: MARKET SEGMENTATION BY TECHNOLOGY

  • Market segmentation by technology
  • Comparison by technology
  • 3D seismic survey - Market size and forecast 2019-2024
  • 2D seismic survey - Market size and forecast 2019-2024
  • 4D seismic survey - Market size and forecast 2019-2024
  • Market opportunity by technology

PART 07: CUSTOMER LANDSCAPE

PART 08: GEOGRAPHIC LANDSCAPE

  • Geographic segmentation
  • Geographic comparison
  • Europe - Market size and forecast 2019-2024
  • APAC - Market size and forecast 2019-2024
  • MEA - Market size and forecast 2019-2024
  • South America - Market size and forecast 2019-2024
  • North America - Market size and forecast 2019-2024
  • Key leading countries
  • Market opportunity

PART 09: DECISION FRAMEWORK

PART 10: DRIVERS AND CHALLENGES

  • Market drivers
  • Market challenges

PART 11: MARKET TRENDS

  • Increasing adoption of 4D seismic survey technology
  • Emergence of seismic-while-drilling technology
  • Increasing demand for digital oilfields

PART 12: VENDOR LANDSCAPE

  • Overview
  • Landscape disruption
  • Competitive scenario

PART 13: VENDOR ANALYSIS

  • Vendors covered
  • Vendor classification
  • Market positioning of vendors
  • Arabian Geophysical and Surveying Co.
  • Fugro NV
  • ION Geophysical Corp.
  • Mitcham Industries Inc.
  • PGS ASA
  • Polarcus Ltd.
  • SAExploration Holdings Inc.
  • SeaBird Exploration Plc
  • Shearwater GeoServices Holdings AS
  • TGS-NOPEC Geophysical Co. ASA

PART 14: APPENDIX

  • Research methodology
  • List of abbreviations
  • Definition of market positioning of vendors

PART 15: EXPLORE TECHNAVIO

About Us

Technavio is a leading global technology research and advisory company. Their research and analysis focus on emerging market trends and provides actionable insights to help businesses identify market opportunities and develop effective strategies to optimize their market positions. With over 500 specialized analysts, Technavio’s report library consists of more than 17,000 reports and counting, covering 800 technologies, spanning across 50 countries. Their client base consists of enterprises of all sizes, including more than 100 Fortune 500 companies. This growing client base relies on Technavio’s comprehensive coverage, extensive research, and actionable market insights to identify opportunities in existing and potential markets and assess their competitive positions within changing market scenarios.


Contacts

Technavio Research
Jesse Maida
Media & Marketing Executive
US: +1 844 364 1100
UK: +44 203 893 3200
Email: This email address is being protected from spambots. You need JavaScript enabled to view it.
Website: www.technavio.com/

NEW YORK--(BUSINESS WIRE)--Today, Blackstone (NYSE: BX) announced that private equity funds managed by Blackstone Energy Partners have closed the sale of their approximately 42% stake in Cheniere Energy Partners, L.P. to Brookfield Infrastructure and funds managed by Blackstone Infrastructure Partners. The transaction values the approximately 42% stake at $7 billion.


The sale represents the culmination of Blackstone Energy Partners’ 8+ years of involvement with Cheniere. In 2012 Blackstone Energy Partners and its affiliates invested $1.5 billion in Cheniere Energy Partners to build the first two liquefaction trains at the Sabine Pass LNG facility in Louisiana. Sabine Pass was the first LNG export facility in the lower 48 states, providing a critical link between North American gas producers and growing international LNG demand centers. The construction of Sabine Pass created 5,000 U.S. jobs and continues to support American energy independence, generate export revenues, and provide cleaner, more affordable energy to millions of people worldwide.

Commenting on the transaction, David Foley, Global Head of Blackstone Energy Partners said:Blackstone’s early equity commitment to Cheniere enabled the timely construction of Sabine Pass, the first LNG export facility in the lower 48 states and one of the largest construction projects in the U.S. I’m proud of the success of the project, the support we were able to provide to Cheniere’s outstanding executive management team as they ably dealt with various challenges over the years and the tremendous return we delivered for our investors.”

Jack Fusco, Chief Executive Officer, Cheniere said:Cheniere is grateful for the collaborative and mutually beneficial partnership we have had with Blackstone Energy Partners over the past eight years. Today, Sabine Pass is a world-scale LNG complex, providing flexible, reliable, and cost competitive U.S. LNG to markets worldwide, and I would like to thank David Foley and the Blackstone team for their contributions to Cheniere’s many successes. We still have much to accomplish at Cheniere, and I look forward to working alongside Blackstone Infrastructure Partners and Brookfield Infrastructure Management to achieve our shared goals.”

Sean Klimczak, Global Head of Blackstone Infrastructure Partners added:Under the leadership of Jack Fusco and his team, Sabine Pass has successfully transitioned from a construction project to a global leader in the LNG sector. Cheniere benefits from long-term contracted revenues across a diverse set of investment-grade counterparties, generating the stable and growing cash flows we seek to add to our infrastructure investment portfolio. Our team is excited to partner with Brookfield to invest in this large-scale, high quality infrastructure company.”

Jefferies LLC and Morgan Stanley acted as financial advisors to Blackstone Energy Partners, while Latham & Watkins acted as legal advisor. Rothschild & Co acted as financial advisor to Blackstone Infrastructure Partners, while Simpson Thacher & Bartlett served as legal advisor.

About Blackstone Energy Partners

Blackstone Energy Partners is Blackstone's energy-focused private equity business, a leading energy investor with a successful long-term record, having invested over $17 billion equity globally across a broad range of sectors within the energy industry. Our investment philosophy is based on backing exceptional management teams with flexible capital to provide solutions that help energy companies grow and improve performance, thereby delivering cleaner, more reliable and affordable energy to meet the needs of the global community. In the process, we build stronger, larger scale enterprises, create jobs and generate lasting value for our investors, employees and all stakeholders.

About Blackstone Infrastructure Partners

Infrastructure is one of Blackstone's most active investment areas. Over the last 15 years, we have invested in more than $46 billion of infrastructure-related projects globally. Blackstone’s approach to infrastructure investing is one that puts a focus on responsible stewardship and community engagement. In areas such as clean power, energy transmission, communications technology, and many others, we have helped move forward sustainable projects that drive local economic growth and job creation, and enhance quality of life. In doing so, we work closely with civic stakeholders to help make sure that critical infrastructure is developed in a responsible manner that is responsive to community needs.


Contacts

Blackstone
Paula Chirhart
347-463-5453
This email address is being protected from spambots. You need JavaScript enabled to view it.

Virtual Session

HOUSTON--(BUSINESS WIRE)--Pursuant to Texas Governor Abbott’s action of March 16, 2020 to allow virtual and telephonic open meetings to maintain government transparency the Port Commission of the Port of Houston Authority will conduct its regular monthly meeting virtually on Tuesday, Sept. 29. The virtual meeting will start at 9:15 a.m. via Webex webinar.


The Executive Office Building is closed to the general public; however, the public can participate in the meetings virtually via Webex, which can be accessed as provided on the following pages. Sign up for public comment is available up to an hour prior to the meeting by contacting Erik Eriksson at This email address is being protected from spambots. You need JavaScript enabled to view it. or Liana Christian at This email address is being protected from spambots. You need JavaScript enabled to view it..

Immediately following the Port Commission meeting, the Community Relations Committee will commence. Instructions for accessing these virtual meetings can be found on the posted agendas for these meetings.

Meeting agendas are available at http://porthouston.com/leadership/public-meetings/.

About Port Houston

For more than 100 years, the Port of Houston Authority has owned and operated the public wharves and terminals of Port Houston – the nation’s largest port for foreign waterborne tonnage and an essential economic engine for the Houston region, the state of Texas, and the nation.  It supports the creation of nearly 1.175 million jobs in Texas and 2.7 million jobs nationwide, and economic activity totaling almost $265 billion in Texas – 16 percent of Texas’ total gross domestic product – and more than $617 billion in economic impact across the nation. For more information, visit Port Houston’s website at: www.porthouston.com.

The Executive Office Building is closed to the general public at this time.

The safety and security of the Port of Houston Authority’s visitors and employees is our first priority. Guests entering the Port Authority Executive Building must show a valid government-issued photo ID, and may be required to pass through security screening, including the use of a hand-held metal detector and other measures as deemed necessary. To learn more about port security visit: http://porthouston.com/portweb/port-security/.

Please note the following to help the meeting run smoothly:

  • The meeting will begin at 9:15 a.m.
  • Please dial in via phone for the audio portion, and use your attendee number to merge your phone and computer presence.
  • All participants will be muted upon entry. Please stay muted unless speaking.
  • Please turn off your video to help the call run more smoothly.

The Community Relations Committee Meeting will begin once the Port Commission meeting has adjourned.

When it's time, join your Webex meeting here.

Meeting number (access code): 146 640 6806
Meeting password: hFyjymvU953

Join meeting

Tap to join from a mobile device (attendees only)

+1-720-650-7664,,1466406806## United States Toll (Denver)
+1-469-210-7159,,1466406806## United States Toll (Dallas)

Join by phone

+1-720-650-7664 United States Toll (Denver)
+1-469-210-7159 United States Toll (Dallas)

Global call-in numbers

Join from a video system or application

Dial This email address is being protected from spambots. You need JavaScript enabled to view it.
You can also dial 173.243.2.68 and enter your meeting number.

Join using Microsoft Lync or Microsoft Skype for Business

Dial This email address is being protected from spambots. You need JavaScript enabled to view it.
Need help? Go to http://help.webex.com


Contacts

Lisa Ashley, Director, Media Relations
Office: 713-670-2644; Mobile: 832-247-8179
E-mail: This email address is being protected from spambots. You need JavaScript enabled to view it.

LONDON--(BUSINESS WIRE)--#GlobalMarineEnginesMarket--The global marine engines market is expected to grow by USD 974.45 million as per Technavio. This marks a significant market slow down compared to the 2019 growth estimates due to the impact of the COVID-19 pandemic in the first half of 2020. However, steady growth is expected to continue throughout the forecast period, and the market is expected to grow at a CAGR of over 1%.


For the Right Perspective & Competitive Insights- Request Free Sample Report on Pandemic Recovery Analysis

Read the 120-page report with TOC on "Marine Engines Market Analysis Report by Type (Outboard engines and Inboard engines), Geography (APAC, Europe, North America, MEA, and South America), and the Segment Forecasts, 2020-2024". Gain competitive intelligence about market leaders. Track key industry opportunities, trends, and threats. Information on marketing, brand, strategy and market development, sales, and supply functions. https://www.technavio.com/report/marine-engines-market-industry-analysis

The marine engines market is driven by the increase in maritime trade and fleet size. In addition, the growth in demand for naval vessels is anticipated to boost the growth of the marine engines market.

Rapid industrialization and the liberalization of economies has significantly increased the trade volume between countries globally. In addition, the growing population in developing countries in Asia has increased the demand for goods and raw materials. This has increased the need for large ships and containers to cater to the growing demand. However, the growth in seaborne trade is leading to an increase in carbon emissions. Also, the growing stringency of emission regulations is increasing the adoption of gas turbine engines in marine vessels to reduce carbon emissions. All these factors are positively influencing the growth of the global marine engines market.

Buy 1 Technavio report and get the second for 50% off. Buy 2 Technavio reports and get the third for free.

View market snapshot before purchasing

Major Five Marine Engines Companies:

AB Volvo

AB Volvo operates its business through segments such as Industrial Operations and Financial Services. The company offers marine engines such as Volvo Penta IPS, Aquamatic Sterndrive, and Diesel Inboard.

BAE Systems Plc

BAE Systems Plc operates its business through segments such as Electronic Systems, Cyber & Intelligence, Platforms & Services (US), Air, and Maritime. The company offers various types of marine engines including marine propulsion and auxiliary systems.

Beta Marine Ltd.

Beta Marine Ltd. operates its business through the Products segment. The company offers various types of marine engines and generating sets.

Caterpillar Inc.

Caterpillar Inc. operates its business through segments such as Construction Industries, Resource Industries, Energy & Transportation, and Financial Products Segment. The company offers commercial marine engines and high-performance marine and maneuvering solutions.

Cummins Inc.

Cummins Inc. operates its business through segments such as Engine, Distribution, Components, Power Systems, and New Power. The company offers a complete line of variable speed solutions designed specifically for the challenges of commercial, government, and recreational marine applications.

Register for a free trial today and gain instant access to 17,000+ market research reports.

Technavio's SUBSCRIPTION platform

Marine Engines Market Type Outlook (Revenue, USD Million, 2020-2024)

  • Outboard engines
  • Inboard engines

Marine Engines Market Geography Outlook (Revenue, USD Million, 2020-2024)

  • APAC
  • Europe
  • North America
  • MEA
  • South America

Are you a start-up willing to make it big in the business? Grab an exclusive Report

Related Reports on Industrials Include:

Global Hybrid Electric Marine Propulsion Engine Market – Global hybrid electric marine propulsion engine market by application (commercial and leisure) and geography (APAC, Europe, MEA, North America, and South America).

Global Marine Outboard Engines Market – Global marine outboard engines market by engine power (low-power, mid-power, and high-power) and geography (North America, Europe, APAC, South America, and MEA).

About Technavio

Technavio is a leading global technology research and advisory company. Their research and analysis focuses on emerging market trends and provides actionable insights to help businesses identify market opportunities and develop effective strategies to optimize their market positions.

With over 500 specialized analysts, Technavio’s report library consists of more than 17,000 reports and counting, covering 800 technologies, spanning across 50 countries. Their client base consists of enterprises of all sizes, including more than 100 Fortune 500 companies. This growing client base relies on Technavio’s comprehensive coverage, extensive research, and actionable market insights to identify opportunities in existing and potential markets and assess their competitive positions within changing market scenarios.


Contacts

Technavio Research
Jesse Maida
Media & Marketing Executive
US: +1 844 364 1100
UK: +44 203 893 3200
Email: This email address is being protected from spambots. You need JavaScript enabled to view it.
Website: www.technavio.com/

Offshore Source Logo

Offshore Source keeps you updated with relevant information concerning the Offshore Energy Sector.

Any views or opinions represented on this website belong solely to the author and do not represent those of the people, institutions or organizations that Offshore Source or collaborators may or may not have been associated with in a professional or personal capacity, unless explicitly stated.

Corporate Offices

Technology Systems Corporation
8502 SW Kansas Ave
Stuart, FL 34997

info@tscpublishing.com