Business Wire News

DUBLIN--(BUSINESS WIRE)--The "Environmental and Safety Mandates Driving the Global Oil & Gas Analytical Instrumentation Market, 2020-2026" report has been added to ResearchAndMarkets.com's offering.


Environmental mandates on achieving a low carbon footprint are driving the analytical instrumentation market in the oil & gas industry. Applications in the refining segment, including monitoring of air/water quality and measuring greenhouse gas (GHG) emissions, to present increased growth opportunities.

The market for analytical instrumentation in the oil & gas industry crashed due to the Coronavirus 2019 (COVID-19) induced slowdown that caused a decline in oil prices due to oversupply and less demand. The global demand for gas is expected to peak in 2026 and surpass that for oil, making it the world's primary energy source. This will result in a high demand for analytical instrumentation in upstream and midstream activities.

Key Findings

  • Oil demand will peak around the mid-2020s, which will result in extreme upstream activities.
  • The global demand for gas is expected to peak in 2026 and surpass the demand for oil, making it the world's primary energy source. This would result in high demand for analytical instrumentation for upstream and midstream activities.
  • New sources of gases including biogas, hydrogen, and synthetic methane are being introduced to domestic and commercial energy systems to decarbonize gas consumption. This will further increase the demand for analyzers to measure these gases and their relative carbon emissions.
  • A lower carbon shift is realized in the midstream and downstream sectors, which will result in a high demand for emission analyzers.
  • Oil and natural gas met 54% of the world's energy demand in 2017. This ratio, however, will reduce to 46% in 2050, leading to a lower demand for analyzers. China has registered the fastest growth in shale gas production, with the highest CAGR of 38.2% from 2015 to 2022. This will result in a high demand for gas chromatographs.
  • The price of oil and gas determines the growth of the market. Thanks to the financial crisis caused by COVID-19, the price of a barrel is now close to $20, but usually ranges between $50 and $70. This will result in a much lower market for analytical equipment.
  • The market for oil in particular has plunged as a result of the decrease in road transport and air travel. With the demand for green energy, the projection for oil demand in 2030 is already weak. With the pandemic, the demand could be much slower due to a combination of factors such as weak economic growth, changes in consumer behavior, and government policies. Oil and gas accounted for 54% of the world's energy demand in 2017. The demand for oil will peak around the mid-2020s, with a shift in the fuel source to gas thereafter.
  • Emissions monitoring and other applications ensuring safety will strongly drive the demand for analytical instruments. The shift from laboratory to process analyzers will result in the deployment of analyzers in the process set-up to meet ASTM regulations. Stringent regulations that restrict the fracking and drilling process associated with oil and gas production will refrain the growth of the analytical instrumentation market.

Key Topics Covered:

1. Executive Summary

2. Market Overview

3. Drivers and Restraints - Total Analytical Instrumentation Market in the Oil & Gas Industry

4. Forecasts and Trends - Total Analytical Instrumentation Market in the Oil & Gas Industry

5. Market Share and Competitive Analysis - Total Analytical Instrumentation Market in the Oil & Gas Industry

  • Market Share
  • Market Share Analysis
  • Competitive Environment
  • Top Competitors
  • Product Analysis
  • Competitive Factors and Assessment

6. Growth Opportunities and Companies to Action

  • Growth Opportunity 1 - Consumption of Gas to be Faster than that of Oil
  • Growth Opportunity 2 - Emission Monitoring Application
  • Strategic Imperatives for Success and Growth

7. Gas Analyzer Segment Analysis

  • Gas Analyzer Segment - Key Findings
  • Market Engineering Measurements
  • Segment Revenue Forecast
  • Gas Analyzer Segment - Revenue Forecast by Analyzer Type
  • Gas Analyzer Segment - Percent Revenue Forecast by Region
  • Revenue Forecast by Region
  • Revenue Forecast Discussion

8. Liquid Analyzer Segment Analysis

  • Liquid Analyzer Segment - Key Findings
  • Market Engineering Measurements
  • Segment Revenue Forecast
  • Liquid Analyzer Segment - Revenue Forecast by Analyzer Type
  • Liquid Analyzer Segment - Percent Revenue Forecast by Region
  • Revenue Forecast by Region
  • Revenue Forecast Discussion

9. Spectrometer Segment Analysis

  • Spectrometer Segment - Key Findings
  • Market Engineering Measurements
  • Segment Revenue Forecast
  • Spectrometers Segment - Revenue Forecast by Analyzer Type
  • Spectrometer Segment - Percent Revenue Forecast by Region
  • Revenue Forecast by Region
  • Revenue Forecast Discussion

10. Gas Chromatograph Segment Analysis

  • Gas Chromatograph Segment - Key Findings
  • Market Engineering Measurements
  • Segment Revenue Forecast
  • Gas Chromatograph Segment - Percent Revenue Forecast by Region
  • Revenue Forecast by Region
  • Revenue Forecast Discussion

11. Application Analysis - Upstream Segment

12. Midstream Segment Analysis

13. Downstream Segment Analysis

14. The Last Word

15. Appendix

For more information about this report visit https://www.researchandmarkets.com/r/rl06dg


Contacts

ResearchAndMarkets.com
Laura Wood, Senior Press Manager
This email address is being protected from spambots. You need JavaScript enabled to view it.

For E.S.T Office Hours Call 1-917-300-0470
For U.S./CAN Toll Free Call 1-800-526-8630
For GMT Office Hours Call +353-1-416-8900

PRINCETON, N.J.--(BUSINESS WIRE)--$NRG #earnings--NRG Energy, Inc. (NYSE:NRG) plans to report Third Quarter 2020 financial results on Thursday, November 5, 2020. Management will present the results during a conference call and webcast at 9:00 a.m. Eastern.

A live webcast of the conference call, including presentation materials, can be accessed through NRG’s website at http://www.nrg.com and clicking on “Presentations & Webcasts” in the “Investors” section found at the top of the home page. The webcast will be archived on the site for those unable to listen in real time.

About NRG Energy

At NRG, we’re bringing the power of energy to people and organizations by putting customers at the center of everything we do. We generate electricity and provide energy solutions and natural gas to more than 3.7 million residential, small business, and commercial and industrial customers through our diverse portfolio of retail brands. A Fortune 500 company, operating in the United States and Canada, NRG delivers innovative solutions while advocating for competitive energy markets and customer choice, and by working towards a sustainable energy future. More information is available at www.nrg.com. Connect with NRG on Facebook, LinkedIn and follow us on Twitter @nrgenergy, @nrginsight.


Contacts

Investors:
Kevin L. Cole, CFA
609.524.4526
This email address is being protected from spambots. You need JavaScript enabled to view it.

Media:
Candice Adams
609.524.5428
This email address is being protected from spambots. You need JavaScript enabled to view it.

DUBLIN--(BUSINESS WIRE)--Kroll Bond Rating Agency Europe (KBRA) releases a recap of the virtual Infrastructure Investor Global Summit 2020 held on 12-15 October.


The event, which attracted over 1,500 registered attendees, explored a number of topics with a particular focus on the emergence of digital infrastructure, the industry’s reaction to environmental, social, and governance (ESG), and the continued growth of the renewable energy industry as economies transition to a net zero carbon energy model.

The recap provides a summary of the discussions emerging from each panel.

Click here to view the report.

Related Publications

About KBRA and KBRA Europe

KBRA is a full-service credit rating agency registered with the U.S. Securities and Exchange Commission as an NRSRO. In addition, KBRA is designated as a designated rating organization by the Ontario Securities Commission for issuers of asset-backed securities to file a short form prospectus or shelf prospectus. KBRA is also recognized by the National Association of Insurance Commissioners as a Credit Rating Provider and is a certified Credit Rating Agency (CRA) with the European Securities and Markets Authority (ESMA). Kroll Bond Rating Agency Europe is registered with ESMA as a CRA. Kroll Bond Rating Agency Europe is located at 6-8 College Green, Dublin 2, Ireland.


Contacts

Analytical Contacts

Garret Tynan, Senior Director
+353 87 455 9936
This email address is being protected from spambots. You need JavaScript enabled to view it.

Karim Nassif, Director
+353 87 178 4335
This email address is being protected from spambots. You need JavaScript enabled to view it.

Andrew Giudici, Senior Managing Director
+1 (646) 731-2372
This email address is being protected from spambots. You need JavaScript enabled to view it.

Yee Cent Wong, Senior Managing Director
+44 208 148 1005
This email address is being protected from spambots. You need JavaScript enabled to view it.

Business Development Contact

Mauricio Noé, Senior Managing Director, Head of Europe
+44 208 148 1010
This email address is being protected from spambots. You need JavaScript enabled to view it.

TORONTO--(BUSINESS WIRE)--Chemtrade Logistics Income Fund (TSX: CHE.UN) will release its results for the three months and nine months ended September 30, 2020 on Thursday, November 12, 2020 after close of markets.


A conference call to review the results will be webcast live on Friday, November 13, 2020 at 10:00 a.m. To access the webcast click here.


Contacts

Mark Davis
President & CEO
Tel: (416) 496-4176

Rohit Bhardwaj
Vice-President, Finance and CFO
Tel: (416) 496-4177

DUBLIN--(BUSINESS WIRE)--The "Pipes and Fittings Market - Forecast (2020 - 2025)" report has been added to ResearchAndMarkets.com's offering.


Global Pipes and Fittings Market is forecast to reach $8 billion by 2025, growing at a CAGR of 4.7% during the forecast period from 2020 to 2025.

The Pipes and Fittings market is driven primarily by the factors such as increasing urbanization leading to infrastructure growth, and growing demand towards plastic pipes. Moreover, rising use of pipes and fittings in mining industries and chemical industries can help the market to grow further. Adoption of steel pipes and fittings by various industries can also help the market to rise significantly during the forecast period.

Key Takeaways

  • Rapid urbanization has caused rise in infrastructure developments, thus leading to high market demands in plastic piping market across the globe.
  • Increased pipeline projects due to high gas infrastructure demands are majorly driving the pipes and fittings market.
  • With high demands from automotive sectors, fittings market is expected to rise in APAC region during the forecast period 2020-2025.

Piping material- Segment Analysis

Plastic pipes are expected to have a major share in the pipes and fittings market during the forecast period 2020-2025. With being anti-corrosive, highly economical and deployment in demanding applications, plastic pipes like PVC and PEX are highly dominating the pipes and fittings market. Due to rising demand towards water management systems, plastic pipes are causing more demands with respect to metal pipes. Withstanding high temperatures and pressure along with providing high insulation properties are the key factors driving the demand towards PVC pipes market by the chemical industries. Due to overcoming major issues of metal pipes, the plastic pipes are expected to dominate the market in the near future.

Geography - Segment Analysis

APAC is expected to have a major growth in the global Pipes and Fittings market during the forecast period from 2020 to 2025. The region is anticipated to hold a major market share in near future due to high government investments for infrastructure as well as demands in automobile industries. Key players like Hindware and Mueller Industries have contributed for a major market share in the APAC region. During 2019, Indian government had announced of investment of $1.45 trillion towards infrastructure development over the next five years, thereby creating major demands for the pipes and fittings market.

Drivers - Pipes and Fittings Market

- Increased investments towards infrastructure

Government investments for construction projects due to rapid urbanization is anticipated to mark a major rise towards the pipes and fittings market over the forecast 2020. Government is investing huge amounts towards infrastructure growth, thereby fueling the growth for plastic pipes due to their demanding applications such as in wires, cables, and water distribution systems. Huge investments of about $1.45 trillion by the Indian government towards infrastructure development has been acting as a major driver and fueling the pipes and fittings market.

- Increased pipeline projects

With the rising growth towards pipeline projects, Oil and gas industry contributes for a major share in the pipes and fittings market. Permian Basin, one of the world's largest oil fields have been contributing towards gas related infrastructures due to rising gas production in the near future. In 2019, the company had confirmed its beginning of two major gas pipelines construction along with another pipeline on the way towards development. With growing gas pipeline projects, pipes and fittings market can expect to have a major market share in 2020. Major oil based companies are continuously focusing towards pipeline projects, thereby driving the global pipes and fittings market.

Challenges - Pipes and Fittings Market

- Leakage issues

Pipe leakage is a major issue faced in the pipes and fittings market. Due to its major applications in water distribution and sewage, leakages cause high investments by the end users, thereby leading to high maintenance. Water leakage causes a major problem leading to water wastage, thus increasing environmental as well as economic issues. With rising additional costs to avoid pipe leakages, the pipes and fittings market is getting hampered.

Market Landscape

Partnerships and acquisitions along with product launches are the key strategies of the players in the Pipes and Fittings Market. The major key players in the Pipes and Fittings Market include Saint Gobain, Jaquar Group, Aliaxis, Kohler Co., Grohe, Aluminum Roofline products, Charlotte Pipe and Foundry, Hindware, Alumasc Building Products, McAlpine and Co., McWane and Mueller Industries.

For more information about this report visit https://www.researchandmarkets.com/r/1migr3


Contacts

ResearchAndMarkets.com
Laura Wood, Senior Press Manager
This email address is being protected from spambots. You need JavaScript enabled to view it.

For E.S.T Office Hours Call 1-917-300-0470
For U.S./CAN Toll Free Call 1-800-526-8630
For GMT Office Hours Call +353-1-416-8900

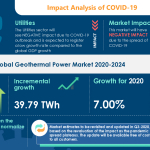
LONDON--(BUSINESS WIRE)--#GeothermalPowerMarket--Technavio has been monitoring the global geothermal power market size and it is poised to grow by 39.79 TWh during 2020-2024, progressing at a CAGR of about 8% during the forecast period. The report offers an up-to-date analysis regarding the current market scenario, latest trends and drivers, and the overall market environment.


Technavio’s in-depth research has all your needs covered as our research reports include all foreseeable market scenarios, including pre- & post-COVID-19 analysis. Download Latest Free Sample Report on COVID-19 Analysis

The market is concentrated, and the degree of concentration will accelerate during the forecast period. Aboitiz Power Corp., Berkshire Hathaway Energy Co., Calpine Corp., Enel Spa, Energy Development Corp., Geothermal Engineering Ltd., HS Orka hf, Kenya Electricity Generating Co. Plc, Kyushu Electric Power Co. Inc., and Ormat Technologies Inc. are some of the major market participants. To make the most of the opportunities, market vendors should focus more on the growth prospects in the fast-growing segments, while maintaining their positions in the slow-growing segments.

Buy 1 Technavio report and get the second for 50% off. Buy 2 Technavio reports and get the third for free.

View market snapshot before purchasing

Rising investments and government initiatives have been instrumental in driving the growth of the market. However, the high initial capital investments in establishing geothermal power plants might hamper market growth.

Technavio's custom research reports offer detailed insights on the impact of COVID-19 at an industry level, a regional level, and subsequent supply chain operations. This customized report will also help clients keep up with new product launches in direct & indirect COVID-19 related markets, upcoming vaccines and pipeline analysis, and significant developments in vendor operations and government regulations. Download a Free Sample Report on COVID-19 Impacts

Geothermal Power Market 2020-2024: Segmentation

Geothermal Power Market is segmented as below:

  • Type
    • Flash
    • Dry Steam
    • Binary
  • Geographic Landscape
    • APAC
    • North America
    • MEA
    • Europe
    • South America

Geothermal Power Market 2020-2024: Scope

Technavio presents a detailed picture of the market by the way of study, synthesis, and summation of data from multiple sources. The geothermal power market report covers the following areas:

  • Geothermal Power Market Size
  • Geothermal Power Market Trends
  • Geothermal Power Market Industry Analysis

This study identifies the growing demand for renewable energy sources as one of the prime reasons driving the Geothermal Power Market growth during the next few years.

Technavio suggests three forecast scenarios (optimistic, probable, and pessimistic) considering the impact of COVID-19. Technavio’s in-depth research has direct and indirect COVID-19 impacted market research reports.

Register for a free trial today and gain instant access to 17,000+ market research reports.

Technavio's SUBSCRIPTION platform

Geothermal Power Market 2020-2024: Key Highlights

  • CAGR of the market during the forecast period 2020-2024
  • Detailed information on factors that will assist geothermal power market growth during the next five years
  • Estimation of the geothermal power market size and its contribution to the parent market
  • Predictions on upcoming trends and changes in consumer behavior
  • The growth of the geothermal power market
  • Analysis of the market’s competitive landscape and detailed information on vendors
  • Comprehensive details of factors that will challenge the growth of geothermal power market vendors

Table of Contents:

Executive Summary

Market Landscape

  • Market ecosystem
  • Market landscape
  • Value chain analysis

Market Sizing

  • Market definition
  • Market segment analysis
  • Market size 2019
  • Market outlook: Forecast for 2019-2024

Five Forces Analysis

  • Five forces summary
  • Bargaining power of buyers
  • Bargaining power of suppliers
  • Threat of new entrants
  • Threat of substitutes
  • Threat of rivalry
  • Market condition

Market Segmentation by Type

  • Market segments
  • Comparison by Type
  • Flash - Market size and forecast 2019-2024
  • Dry Steam - Market size and forecast 2019-2024
  • Binary - Market size and forecast 2019-2024
  • Market opportunity by Type

Customer landscape

Geographic Landscape

  • Geographic segmentation
  • Geographic comparison
  • APAC - Market size and forecast 2019-2024
  • North America - Market size and forecast 2019-2024
  • MEA - Market size and forecast 2019-2024
  • Europe - Market size and forecast 2019-2024
  • South America - Market size and forecast 2019-2024
  • Key leading countries
  • Market opportunity by geography
  • Volume driver-Demand led growth
  • Market challenges
  • Market trends

Vendor Landscape

  • Vendor landscape
  • Landscape disruption

Vendor Analysis

  • Vendors covered
  • Market positioning of vendors
  • Aboitiz Power Corp.
  • Berkshire Hathaway Energy Co.
  • Calpine Corp.
  • Enel Spa
  • Energy Development Corp.
  • Geothermal Engineering Ltd.
  • HS Orka hf
  • Kenya Electricity Generating Co. Plc
  • Kyushu Electric Power Co. Inc.
  • Ormat Technologies Inc.

Appendix

  • Scope of the report
  • Currency conversion rates for US$
  • Research methodology
  • List of abbreviations

About Us

Technavio is a leading global technology research and advisory company. Their research and analysis focuses on emerging market trends and provides actionable insights to help businesses identify market opportunities and develop effective strategies to optimize their market positions. With over 500 specialized analysts, Technavio’s report library consists of more than 17,000 reports and counting, covering 800 technologies, spanning across 50 countries. Their client base consists of enterprises of all sizes, including more than 100 Fortune 500 companies. This growing client base relies on Technavio’s comprehensive coverage, extensive research, and actionable market insights to identify opportunities in existing and potential markets and assess their competitive positions within changing market scenarios.


Contacts

Technavio Research
Jesse Maida
Media & Marketing Executive
US: +1 844 364 1100
UK: +44 203 893 3200
Email: This email address is being protected from spambots. You need JavaScript enabled to view it.
Website: www.technavio.com/

SEOUL, South Korea--(BUSINESS WIRE)--#ElectricVehicles--KCC Co., Ltd., was selected as the ‘Global Hidden Champion 2020’ for Korea. Global Hidden Champions is a project led by the Korean Ministry of SMEs and Startups to discover small and medium-sized enterprises with innovative power and growth potential and develop them into export leaders.


Established in 1992, KCC has spent 28 years focused on the development of hydraulic and pneumatic parts and technologies. At the time of its foundation, the valve market in Korea was completely controlled by Japanese, German, and U.S. companies. “It hurt my pride. I wanted to localize key parts by any means available and reduce dependence on imported products,” said Dukgyu Park, CEO of KCC.

For that reason, he has invested over 10% of the company’s sales revenue in R&D. With its management philosophy that “quality is pride,” KCC established the Hydraulic and Pneumatic Pressure R&D Center in 2004. In addition, all employees must complete 50 hours of external training each year.

Hydraulic and pneumatic parts, which rely on oil pressure and air pressure, respectively, are used in machinery and automated products including cylinders, buttons, paddles, and grabs. These parts are mainly found in excavators and machine tools. In line with future industrial trends, KCC has established its own lineup of facilities to produce secondary cells for electric vehicles and drones, etc.

The company’s R&D efforts have borne fruit. In 2007, KCC began exporting pneumatic solenoid valves to Japan. Additionally, KCC won recognition for the reliability of its products from the Korea Institute of Machinery & Materials and became the only company in the industry to be selected as an autonomous procurement supplier of POSCO. KCC has obtained dozens of patents, such as for a gripper/gripper sensor detection unit, a vacuum pad system, a solenoid valve, and a valve-integrated mechatronics cylinder system. KCC has also achieved various qualifications and certifications for domestic product supply and export, including R Mark, CE Certification, a Blast Valve Performance Certificate, and maintenance certification from five power generating companies.

KCC operates factories in Gunpo and Daegu, with its head office located in Seoul. KCC is a global hidden champion that has built not only a domestic sales network, but a global one extending beyond the Asian markets of Japan, China, Thailand, and Indonesia to Iran and Turkey.


Contacts

KCC Co., Ltd.
Hyojin Kim
+82-2-2637-4000
This email address is being protected from spambots. You need JavaScript enabled to view it.

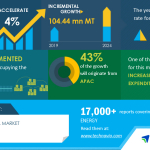
LONDON--(BUSINESS WIRE)--#BunkerOilMarket--The bunker oil market size is set to grow by 104.44 million MT accelerating at a CAGR of over 4%, during the period spanning over 2020-2024. One of the key factors driving growth is the increasing naval expenditure. Increasing security concerns and external threats have led many countries to increase their expenditure on enhancing defense capabilities. The growing LNG market is a significant trend that will further stimulate market growth. LNG is steadily gaining prominence among end-users due to its odorless, non-toxic, and non-corrosive nature.


To learn more about the global trends impacting the future of market research, download a free sample now

Parent Market Analysis

Technavio categorizes the global bunker oil market as a part of the global oil and gas storage and transportation market, within the global oil and gas market. The global oil and gas storage and transportation market covers companies engaged in the transportation and/or storage of gas, oil, and/or refined products. The oil and gas midstream or storage and transportation market is one of the three links in the overall oil and gas value chain. Growth in the global oil and gas market will be driven by the increasing global demand for energy.

Technavio’s in-depth research has all your needs covered as our research reports include all foreseeable market scenarios, including pre- & post-COVID-19 analysis. Download a Free Sample Report on COVID-19 Impacts

Bunker Oil Market: Geographic Segmentation

The report segments the market by geography: APAC, North America, Europe, MEA, and South America. About 43% of the market’s growth will originate from APAC during the forecast period. Increasing demand for fuel in China and India is driving the growth of the market in APAC. Singapore and China are the key markets for bunker oil in APAC.

Bunker Oil Market: Segmentation by Product

The residual fuel segment was the leading the market in 2019. Heavy fuels such as residual fuel are highly preferred in large ships. This is because larger engines can only efficiently burn fuels that have higher proportions of heavy fuel oil. These factors are crucial in driving the growth of the segment. This report provides an accurate prediction of the contribution of all the segments to the growth of the bunker oil market size.

Bunker Oil Market: Growth Drivers

The market is driven by increasing naval expenditure. Rising incidents of terrorist attacks and border disputes have led many countries to focus on strengthening their defense capabilities. This has increased the expenditure in the defense sector, which has also increased the overall naval spending. For instance, in March 2017, the People's Liberation Army (PLA) Navy division announced its plans to secure substantial new funding in China’s defense budget in 2017. Similarly, other countries such as Indonesia and South Korea have also increased their spending on the military during the past few years. Therefore, the increase in naval spending will positively influence the demand for bunker oil during the forecast period.

Bunker Oil Market: Challenges to Overcome

The adoption of slow-steaming is increasingly becoming popular in the shipping industry as it helps shipping companies to reduce fuel costs by up to one-seventh. Also, speed reduction has a direct impact on the drag of the vessel while sailing. This is leading to reduced fuel consumption, which is affecting the growth of the global bunker oil market.

Bunker Oil Market: Vendor landscape

This report provides information on revenue, organizational developments, and key go-to-market strategies of several leading bunker oil companies, including:

  • BP Plc
  • Chevron Corp.
  • Exxon Mobil Corp.
  • Hindustan Petroleum Corp. Ltd.
  • Marquard & Bahls AG
  • PetroChina Co. Ltd.
  • Public Joint Stock Company Gazprom
  • Royal Dutch Shell Plc
  • Total SA
  • Toyota Tsusho Petroleum Pte. Ltd.

Buy 1 Technavio report and get the second for 50% off. Buy 2 Technavio reports and get the third for free.

View market snapshot before purchasing

Technavio reports cover the following key research areas:

  • Detailed Analysis of Market Eco System
  • Market favorability index
  • Market opportunity by segments
  • Customer Landscape
    • Analysis of drivers of price sensitivity
    • Key purchase criteria
    • Customer purchase basket
  • Impact of drivers and Challenges
  • Vendor landscape
    • Factors of differentiation
    • Landscape disruption
    • Key industry risks
    • Market position of vendors

About Technavio

Technavio is a leading global technology research and advisory company. Their research and analysis focus on emerging market trends and provides actionable insights to help businesses identify market opportunities and develop effective strategies to optimize their market positions.

With over 500 specialized analysts, Technavio’s report library consists of more than 17,000 reports and counting, covering 800 technologies, spanning across 50 countries. Their client base consists of enterprises of all sizes, including more than 100 Fortune 500 companies. This growing client base relies on Technavio’s comprehensive coverage, extensive research, and actionable market insights to identify opportunities in existing and potential markets and assess their competitive positions within changing market scenarios.


Contacts

Technavio Research
Jesse Maida
Media & Marketing Executive
US: +1 844 364 1100
UK: +44 203 893 3200
Email: This email address is being protected from spambots. You need JavaScript enabled to view it.
Website: https://www.technavio.com


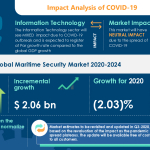
LONDON--(BUSINESS WIRE)--#GlobalMaritimeSecurityMarket--The global maritime security market size is poised to grow by USD 2.06 billion during 2020-2024, progressing at a CAGR of about 2% throughout the forecast period, according to the latest report by Technavio. The report offers an up-to-date analysis regarding the current market scenario, latest trends and drivers, and the overall market environment. The report also provides the market impact and new opportunities created due to the COVID-19 pandemic. Download a Free Sample of REPORT with COVID-19 Crisis and Recovery Analysis.


The maritime security market is driven by the growing marine threats. Marine borders play an important role in national security and territorial integrity. Marine borders are also important for global trade, immigration, and emigration. In many countries that have a long coastline, the patrolling of territorial waters using highly advanced airborne platforms is gaining importance. Maritime security systems are highly effective in the detection and identification of threats and the carrying out of operations for security. For instance, the oil rigs in the Gulf of Guinea in western Africa are highly vulnerable to the threat of piracy. The region has witnessed about six such instances of piracy since 2007. Also, pirate groups operating in the region often resort to violent and extreme measures, such as kidnapping, torturing, and shooting of crewmen. The integration of the maritime security system helps in sending information about marine threats. Thus, growing marine threats is driving the market for maritime security.

Register for a free trial today and gain instant access to 17,000+ market research reports.

Technavio's SUBSCRIPTION platform

Report Highlights:

  • The major maritime security market growth came from the deepwater security segment in 2019, and is expected to witness the fastest growth during the next five years.
  • APAC was the largest maritime security market in 2019, and the region will offer several growth opportunities to market vendors during the forecast period. This is attributed to factors such as the need to augment maritime security in the South China Sea owing to the rising number of maritime conflicts in the Indian Ocean and the South China Sea.
  • The global maritime security market is fragmented. BAE Systems Plc, Elbit Systems Ltd., FLIR Systems Inc., Kongsberg Gruppen ASA, Northrop Grumman Corp., Raytheon Technologies Corp., Saab AB, Terma Group, Thales Group, and Ultra Electronics Holdings Plc. are some of the major market participants. To help clients improve their market position, this maritime security market forecast report provides a detailed analysis of the market leaders.
  • As the business impact of COVID-19 spreads, the global maritime security market 2020-2024 is expected to have neutral growth. As the pandemic spreads in some regions and plateaus in other regions, we revaluate the impact on businesses and update our report forecasts.

Buy 1 Technavio report and get the second for 50% off. Buy 2 Technavio reports and get the third for free.

View market snapshot before purchasing

Expansion of the Chinese Naval Fleet in Critical Regions will be a Key Market Trend

China has been focusing on its naval fleet expansion since the announcement by the Chinese President in 2012 on making China a maritime superpower. The expansion of its naval fleet by China is encouraging the country to prove its dominance in critical regions, such as the disputed South China Sea and the Indian Ocean. In July 2019, China held military exercises in the South China Sea, which is the world's most critical seaborne trade route. Furthermore, in May 2019, China announced the deployment of a coastguard vessel in the South China Sea to monitor the Parcel Islands. These activities undertaken by China in the South China Sea are compelling countries such as the Philippines, Taiwan, and Vietnam to focus on the strengthening of their own naval fleets. Thus, the aggressive expansion of its naval fleet by China in critical regions is likely to augment the growth of the global maritime security market during the forecast period.

Technavio’s sample reports are free of charge and contain multiple sections of the report, such as the market size and forecast, drivers, challenges, trends, and more. Request a free sample report

Maritime Security Market 2020-2024: Key Highlights

  • CAGR of the market during the forecast period 2020-2024
  • Detailed information on factors that will assist maritime security market growth during the next five years
  • Estimation of the maritime security market size and its contribution to the parent market
  • Predictions on upcoming trends and changes in consumer behavior
  • The growth of the maritime security market
  • Analysis of the market’s competitive landscape and detailed information on vendors
  • Comprehensive details of factors that will challenge the growth of maritime security market vendors

Buy 1 Technavio report and get the second for 50% off. Buy 2 Technavio reports and get the third for free.

View market snapshot before purchasing

Executive Summary

Market Landscape

  • Market ecosystem
  • Value chain analysis

Market Sizing

  • Market definition
  • Market segment analysis
  • Market size 2019
  • Market outlook: Forecast for 2019 - 2024

Five Forces Analysis

  • Five Forces Summary
  • Bargaining power of buyers
  • Bargaining power of suppliers
  • Threat of new entrants
  • Threat of substitutes
  • Threat of rivalry
  • Market condition

Market Segmentation by Threats and vulnerabilities

  • Market segments
  • Comparison by threats and vulnerabilities
  • Deepwater security - Market size and forecast 2019-2024
  • Perimeter security - Market size and forecast 2019-2024
  • Market opportunity by threats and vulnerabilities

Customer Landscape

  • Customer landscape

Geographic Landscape

  • Geographic segmentation
  • Geographic comparison
  • North America - Market size and forecast 2019-2024
  • Europe - Market size and forecast 2019-2024
  • APAC - Market size and forecast 2019-2024
  • MEA - Market size and forecast 2019-2024
  • South America - Market size and forecast 2019-2024
  • Key leading countries
  • Market opportunity by geography
  • Market drivers – Demand led growth
  • Market challenges
  • Market trends

Vendor Landscape

  • Overview
  • Vendor landscape
  • Landscape disruption

Vendor Analysis

  • Vendors covered
  • Market positioning of vendors
  • BAE Systems Plc
  • Elbit Systems Ltd.
  • FLIR Systems Inc.
  • Kongsberg Gruppen ASA
  • Northrop Grumman Corp.
  • Raytheon Technologies Corp.
  • Saab AB
  • Terma Group
  • Thales Group
  • Ultra Electronics Holdings Plc

Appendix

  • Scope of the report
  • Currency conversion rates for US$
  • Research methodology
  • List of abbreviations

About Us

Technavio is a leading global technology research and advisory company. Their research and analysis focuses on emerging market trends and provides actionable insights to help businesses identify market opportunities and develop effective strategies to optimize their market positions. With over 500 specialized analysts, Technavio’s report library consists of more than 17,000 reports and counting, covering 800 technologies, spanning across 50 countries. Their client base consists of enterprises of all sizes, including more than 100 Fortune 500 companies. This growing client base relies on Technavio’s comprehensive coverage, extensive research, and actionable market insights to identify opportunities in existing and potential markets and assess their competitive positions within changing market scenarios.


Contacts

Technavio Research
Jesse Maida
Media & Marketing Executive
US: +1 844 364 1100
UK: +44 203 893 3200
Email: This email address is being protected from spambots. You need JavaScript enabled to view it.
Website: www.technavio.com/

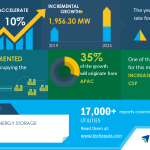
LONDON--(BUSINESS WIRE)--#GlobalThermalEnergyStorageMarket--The thermal energy storage market is expected to grow by 1,956.30 MW during 2020-2024. The report also provides the market impact and new opportunities created due to the COVID-19 pandemic. We expect the impact to be significant in the first quarter but gradually lessen in subsequent quarters – with a limited impact on the full-year economic growth.


Request challenges and opportunities influenced by COVID-19 pandemic - Request a Free Sample Report on COVID-19 Impacts

Thermal storage enhances the solar plant system’s flexibility by extending the rate of solar electricity generation and improving its coincidence with existing demand. This is accomplished by reducing constraints of ramping and minimum generation levels in CSP plants. The use of thermal energy storage in CSP plants allows generating power in adverse weather conditions as well as with no reduction in the operating efficiency. Additionally, the cost of electricity generation using CSP plants has reduced significantly in recent years. The cost of electricity generation from projects commissioned from 2020 onwards is expected to decrease by up to 70%. These factors are increasing the demand for the installation of CSP plants and will drive the thermal energy storage market growth.

To learn more about the global trends impacting the future of market research, download a free sample: https://www.technavio.com/talk-to-us?report=IRTNTR45188

As per Technavio, the increasing use of thermal energy storage in smart cities and smart buildings will have a positive impact on the market and contribute to its growth significantly over the forecast period. This research report also analyzes other significant trends and market drivers that will influence market growth over 2020-2024.

Thermal Energy Storage Market: Increasing Use of Thermal Energy Storage in Smart Cities and Smart Buildings

The increasing use of thermal energy storage in smart cities and smart buildings is one of the significant thermal energy storage market trends that will impact the growth of the market across the globe. Market experts predict that the dependence on fuel-based energy is expected to be eliminated with the concept of smart cities. The need for peak load electricity distribution demand will lead to the adoption of thermal energy storage systems. The demand charges can be reduced significantly from on-peak to off-peak rates by using cooling technologies such as PCM. With growing applications and cost-efficient solutions, thermal energy storage is becoming an essential component for smart cities. As a result of such factors, the thermal energy storage market will grow during the forecast period.

Register for a free trial today and gain instant access to 17,000+ market research reports

Technavio's SUBSCRIPTION platform

Thermal Energy Storage Market: Segmentation Analysis

This market research report segments the thermal energy storage market by Technology (MSES and PCM) and Geography (Europe, North America, APAC, MEA, and South America).

The APAC region led the thermal energy storage market in 2019, followed by North America, Europe, MEA, and South America respectively. During the forecast period, the APAC region is expected to register the highest incremental growth due to factors such as the rising focus on more reliable sources of energy and traditional sources of energy, such as fossil fuels, moving toward extinction.

Technavio’s sample reports are free of charge and contain multiple sections of the report, such as the market size and forecast, drivers, challenges, trends, and more. Request a free sample report

Some of the key topics covered in the report include:

Market Drivers

Market Challenges

Market Trends

Vendor Landscape

  • Vendors covered
  • Vendor classification
  • Market positioning of vendors
  • Competitive scenario

About Technavio

Technavio is a leading global technology research and advisory company. Their research and analysis focuses on emerging market trends and provides actionable insights to help businesses identify market opportunities and develop effective strategies to optimize their market positions.

With over 500 specialized analysts, Technavio’s report library consists of more than 17,000 reports and counting, covering 800 technologies, spanning across 50 countries. Their client base consists of enterprises of all sizes, including more than 100 Fortune 500 companies. This growing client base relies on Technavio’s comprehensive coverage, extensive research, and actionable market insights to identify opportunities in existing and potential markets and assess their competitive positions within changing market scenarios.


Contacts

Technavio Research
Jesse Maida
Media & Marketing Executive
US: +1 844 364 1100
UK: +44 203 893 3200
Email: This email address is being protected from spambots. You need JavaScript enabled to view it.
Website: www.technavio.com/

CANONSBURG, Pa.--(BUSINESS WIRE)--#ETRN--Equitrans Midstream Corporation (NYSE: ETRN) declared quarterly cash dividends of $0.15 per common share and $0.4873 per share of Series A Perpetual Convertible Preferred Stock for the third quarter 2020. The dividends will be paid on November 13, 2020, to the applicable ETRN shareholders of record at the close of business on November 3, 2020.


About Equitrans Midstream Corporation:

Equitrans Midstream Corporation (ETRN) has a premier asset footprint in the Appalachian Basin and, as the parent company of EQM Midstream Partners, is one of the largest natural gas gatherers in the United States. Through its strategically located assets in the Marcellus and Utica regions, ETRN has an operational focus on gas transmission and storage systems, gas gathering systems, and water services that support natural gas development and production across the Basin. With a rich 135-year history in the energy industry, ETRN was launched as a standalone company in 2018 with the vision to be the premier midstream services provider in North America. ETRN is helping to meet America’s growing need for clean-burning energy, while also providing a rewarding workplace and enriching the communities where its employees live and work.

For more information on Equitrans Midstream Corporation, visit www.equitransmidstream.com; and to learn more about our environmental, social, and governance practices visit ETRN Sustainability Reporting.

Source: Equitrans Midstream Corporation


Contacts

Analyst inquiries:
Nate Tetlow – Vice President, Corporate Development and Investor Relations
412.553.5834
This email address is being protected from spambots. You need JavaScript enabled to view it.

Media inquiries:
Natalie A. Cox – Communications and Corporate Affairs
412.395.3941
This email address is being protected from spambots. You need JavaScript enabled to view it.

LONDON--(BUSINESS WIRE)--#GlobalHighPressureOilandGasSeparatorMarket--The high-pressure oil and gas separator market size is set to grow by USD 134.54 million accelerating at a CAGR of about 1%, during the period spanning over 2020-2024. One of the key factors driving growth is the rise in unconventional oil and gas resources. The successful extraction of shale oil and gas in the US has led to an increase in the global oil and gas supply. The rise in global oil and gas consumption is a significant trend that will further stimulate market growth. Governments and vendors across the world are increasing investments in E&P activities to meet the growing energy demand.


To learn more about the global trends impacting the future of market research, download a free sample now

Parent Market Analysis

Technavio categorizes the global high-pressure oil and gas separator (HPOGS) market as a part of the global oilfield equipment and services within the global oil and gas market. The global oilfield equipment and services market covers products and companies engaged in upstream exploration and production (E&P) operations, production of equipment or service contracts, and is an important manufacturing sector, which caters to the needs of the oil and gas upstream sector. Growth in the oil and gas market will be driven by the increasing global demand for energy.

Technavio’s in-depth research has all your needs covered as our research reports include all foreseeable market scenarios, including pre- & post-COVID-19 analysis. Download a Free Sample Report on COVID-19 Impacts

High-Pressure Oil and Gas Separator Market: Geographic Segmentation

The report segments the market by geography: APAC, Europe, MEA, North America, and South America. About 30% of the market’s growth will originate from APAC during the forecast period. The growth of the market in this region will be faster than the market growth in other regions. China is a key market for high-pressure oil and gas separators in APAC.

High-Pressure Oil and Gas Separator Market: Segmentation by Vessel Type

The horizontal separators segment was leading the market in 2019. Horizontal separators can handle higher pressures, which makes them more suitable for offshore and deepwater reservoirs. With the rise in offshore and deepwater E&P activities worldwide, the demand for horizontal separators will increase during the forecast period. This report provides an accurate prediction of the contribution of all the segments to the growth of the high-pressure oil and gas separator market size.

High-Pressure Oil and Gas Separator Market: Growth Drivers

The market is driven by the rise in unconventional oil and gas resources. Over the years, the global oil and gas industry has witnessed significant growth in the production of unconventional oil and gas resources such as oil sands and shale oil and gas. For instance, the production of shale oil and gas in the US has increased from 3.76 mbpd in 2011 to 7.76 mbpd in 2019. This has increased the number of rigs and related E&P equipment such as high-pressure separators. With rising global demand for oil and gas, the demand for high-pressure separators will increase during the forecast period.

High-Pressure Oil and Gas Separator Market: Challenges to Overcome

High-pressure oil and gas separators are associated with several issues such as the accumulation of emulsified materials, corrosion, paraffin deposition, and improper installation. These issues increase the probability of oil or gas spills as well as the operating costs for pipeline operators.

High-Pressure Oil and Gas Separator Market: Vendor Landscape

This report provides information on revenue, organizational developments, and key go-to-market strategies of several leading high-pressure oil and gas separator companies, including:

  • Alfa Laval AB
  • CECO Environmental Corp.
  • Exterran Corp.
  • Frames Energy Systems BV
  • GEA Group Aktiengesellschaft
  • Halliburton Co.
  • HAT International Ltd.
  • Parker Hannifin Corp.
  • Schlumberger Ltd.
  • TechnipFMC Plc

Buy 1 Technavio report and get the second for 50% off. Buy 2 Technavio reports and get the third for free.

View market snapshot before purchasing

Technavio reports cover the following key research areas:

  • Detailed Analysis of Market Eco System
  • Market favorability index
  • Market opportunity by segments
  • Customer Landscape
    • Analysis of drivers of price sensitivity
    • Key purchase criteria
    • Customer purchase basket
  • Impact of drivers and Challenges
  • Vendor landscape
    • Factors of differentiation
    • Landscape disruption
    • Key industry risks
    • Market position of vendors

About Technavio

Technavio is a leading global technology research and advisory company. Their research and analysis focus on emerging market trends and provides actionable insights to help businesses identify market opportunities and develop effective strategies to optimize their market positions.

With over 500 specialized analysts, Technavio’s report library consists of more than 17,000 reports and counting, covering 800 technologies, spanning across 50 countries. Their client base consists of enterprises of all sizes, including more than 100 Fortune 500 companies. This growing client base relies on Technavio’s comprehensive coverage, extensive research, and actionable market insights to identify opportunities in existing and potential markets and assess their competitive positions within changing market scenarios.


Contacts

Technavio Research
Jesse Maida
Media & Marketing Executive
US: +1 844 364 1100
UK: +44 203 893 3200
Email: This email address is being protected from spambots. You need JavaScript enabled to view it.
Website: https://www.technavio.com

SAN DIEGO & CHARLOTTE, N.C.--(BUSINESS WIRE)--EDF Renewables North America (EDFR) and Geenex Solar, LLC (Geenex), today announced the close of an agreement of up to 4.5 gigawatt (GWac) pipeline of solar development assets throughout PJM. The pipeline acquisition brings to EDF Renewables the regional development expertise of Geenex, a leader of utility-scale solar development, while EDFR contributes with its financial and late-stage development expertise from a long-term owner and operator perspective. The transaction will accelerate EDFR growth in the PJM wholesale electricity market to meet the growing demands of corporate and utility customers seeking cost-effective renewable energy sources.


Founded in 2012, Geenex is a skilled developer of greenfield utility-scale solar projects ranging in size from 20 megawatt (MW) to more than 400 MW. The team is experienced in all aspects of project development including site evaluation, land acquisition, facility and interconnection engineering, environmental analysis, as well as federal, state and local permitting. In a relatively short time, Geenex has successfully expanded its business by working with the financial team at New Energy Capital. This has allowed them to triple the number of employees and build a development pipeline that has led to over 1.9 GW of solar development sales prior to this transaction.

“Having an industry leader such as EDFR recognize the strength and value of Geenex-developed projects is quite a testimony to the hard work of the Geenex Solar team,” commented Georg Veit, CEO of Geenex. “Our regional approach has enabled us to build a competitive development pipeline of over 20 projects in the PJM market. We are excited by the opportunity to build out this solar pipeline with a development partner such as EDFR. They share our vision on local engagement and long-term commitment to projects that will provide valuable economic benefits for our landowners and our communities.”`

EDF Renewables was introduced to Geenex through the development and construction of the Pecan and Gutenberg solar projects in 2015. “We were initially impressed with the team’s development expertise and distinguished high quality of solar assets,” said Hanson Wood, Vice President, Strategic Development Initiatives, EDF Renewables. “Their regional approach is particularly attractive as they enter markets early and foster strong and deep relationships with the local community. Geenex, as the largest holder of development assets in PJM market, enables EDF Renewables to expand into over five key states where solar is poised to be a market leading technology.”

Jefferies Financial Group served as exclusive financial advisor to Geenex. “It was a real pleasure working alongside Geenex over the course of the last year to support them in achieving their objective of identifying a partner that could bring to bear complimentary skillsets and capabilities. EDF Renewables stood out as a highly dedicated and thoughtful partner throughout this process despite the challenges associated with COVID-19,” said Georges Arbache, Senior Vice President at Jefferies’ Power, Utilities and Infrastructure practice.

The portfolio of project assets in the transaction exceed 20 solar projects in various stages of development. The first projects expect commercial operation in 2023 with other projects to follow.

About EDF Renewables North America

EDF Renewables North America is a market leading independent power producer and service provider with 35 years of expertise in renewable energy. The Company delivers grid-scale power: wind (onshore and offshore), solar photovoltaic, and storage projects; distributed solutions: solar, solar+storage, EV charging and energy management; and asset optimization: technical, operational, and commercial skills to maximize performance of generating projects. EDF Renewables’ North American portfolio consists of 16 GW of developed projects and 11 GW under service contracts. EDF Renewables is a subsidiary of EDF Renouvelables, the dedicated renewable energy affiliate of the EDF Group. For more information visit: www.edf-re.com. Connect with us on LinkedIn, Facebook and Twitter.

About Geenex Solar

Geenex Solar is a greenfield developer of utility-scale solar projects with a focus on PJM Interconnected projects in the Southeast and Midwest regions of the United States. Geenex is skilled in all aspects of solar project development including site evaluation, real estate procurement, facility and interconnection engineering, environmental analysis, as well as federal, state and local permitting. Geenex Solar’s experienced and community-focused team ensures a solar project’s successful navigation of the development process from its initial stages through to its delivery of clean, reliable power to the grid. Geenex – Simply Solar. Please visit www.geenexsolar.com for more information.


Contacts

EDF Renewables Contact:
Sandi Briner, 858-521-3525
This email address is being protected from spambots. You need JavaScript enabled to view it.

LONDON--(BUSINESS WIRE)--#GlobalSolarPVBalanceOfSystemsBOSMarket--Technavio has been monitoring the solar pv balance of systems market and it is poised to grow by $ 42.17 bn during 2020-2024, progressing at a CAGR of 16% during the forecast period. The report offers an up-to-date analysis regarding the current market scenario, latest trends and drivers, and the overall market environment.


Technavio’s in-depth research has all your needs covered as our research reports include all foreseeable market scenarios, including pre- & post-COVID-19 analysis. Download Latest Free Sample Report on COVID-19 Analysis

The market is fragmented, and the degree of fragmentation will accelerate during the forecast period. ABB Ltd., Eaton Corp. Plc, Golden Concord Holdings Ltd., Huawei Investment & Holding Co. Ltd., Prysmian Spa, ReneSola Ltd., Schneider Electric SE, SMA Solar Technology AG, Sungrow Power Supply Co. Ltd., and Unirac Inc. are some of the major market participants. To make the most of the opportunities, market vendors should focus more on the growth prospects in the fast-growing segments, while maintaining their positions in the slow-growing segments.

Buy 1 Technavio report and get the second for 50% off. Buy 2 Technavio reports and get the third for free.

View market snapshot before purchasing

Increasing investments in renewable energy has been instrumental in driving the growth of the market. However, rising competition from other sources of energy might hamper market growth.

Technavio's custom research reports offer detailed insights on the impact of COVID-19 at an industry level, a regional level, and subsequent supply chain operations. This customized report will also help clients keep up with new product launches in direct & indirect COVID-19 related markets, upcoming vaccines and pipeline analysis, and significant developments in vendor operations and government regulations. Download a Free Sample Report on COVID-19 Impacts

Solar PV Balance Of Systems Market 2020-2024: Segmentation

Solar PV Balance Of Systems Market is segmented as below:

  • Product
    • Electrical BOS
    • Structural BOS
    • Inverter
  • Geography
    • APAC
    • North America
    • Europe
    • South America
    • MEA

Solar PV Balance Of Systems Market 2020-2024: Scope

Technavio presents a detailed picture of the market by the way of study, synthesis, and summation of data from multiple sources. The solar pv balance of systems market report covers the following areas:

  • Solar PV Balance Of Systems Market Size
  • Solar PV Balance Of Systems Market Trends
  • Solar PV Balance Of Systems Market Industry Analysis

This study identifies as one of the prime reasons driving the Solar PV Balance Of Systems Market growth during the next few years.

Technavio suggests three forecast scenarios (optimistic, probable, and pessimistic) considering the impact of COVID-19. Technavio’s in-depth research has direct and indirect COVID-19 impacted market research reports.

Register for a free trial today and gain instant access to 17,000+ market research reports.

Technavio's SUBSCRIPTION platform

Solar PV Balance Of Systems Market 2020-2024: Key Highlights

  • CAGR of the market during the forecast period 2020-2024
  • Detailed information on factors that will assist solar PV balance of systems market growth during the next five years
  • Estimation of the solar PV balance of systems market size and its contribution to the parent market
  • Predictions on upcoming trends and changes in consumer behavior
  • The growth of the solar PV balance of systems market
  • Analysis of the market’s competitive landscape and detailed information on vendors
  • Comprehensive details of factors that will challenge the growth of solar PV balance of systems market, vendors

Table of Contents:

Executive Summary

  • Market Overview

Market Landscape

  • Market ecosystem
  • Market characteristics
  • Value chain analysis

Market Sizing

  • Market definition
  • Market segment analysis
  • Market size 2019
  • Market outlook: Forecast for 2019 - 2024

Five Forces Analysis

  • Five forces summary
  • Bargaining power of buyers
  • Bargaining power of suppliers
  • Threat of new entrants
  • Threat of substitutes
  • Threat of rivalry
  • Market condition

Market Segmentation by Product

  • Market segments
  • Comparison by Product
  • Electrical BOS - Market size and forecast 2019-2024
  • Structural BOS - Market size and forecast 2019-2024
  • Inverter - Market size and forecast 2019-2024
  • Market opportunity by Product

Customer landscape

  • Overview

Geographic Landscape

  • Geographic segmentation
  • Geographic comparison
  • APAC - Market size and forecast 2019-2024
  • North America - Market size and forecast 2019-2024
  • Europe - Market size and forecast 2019-2024
  • South America - Market size and forecast 2019-2024
  • MEA - Market size and forecast 2019-2024
  • Key leading countries
  • Market opportunity by geography
  • Volume driver - Demand led growth
  • Market challenges
  • Market trends

Vendor Landscape

  • Vendor landscape
  • Landscape disruption

Vendor Analysis

  • Vendors covered
  • Market positioning of vendors
  • ABB Ltd.
  • Eaton Corp. Plc
  • Golden Concord Holdings Ltd.
  • Huawei Investment & Holding Co. Ltd.
  • Prysmian Spa
  • ReneSola Ltd.
  • Schneider Electric SE
  • SMA Solar Technology AG
  • Sungrow Power Supply Co. Ltd.
  • Unirac Inc.

Appendix

  • Scope of the report
  • Currency conversion rates for US$
  • Research methodology
  • List of abbreviations

About Us

Technavio is a leading global technology research and advisory company. Their research and analysis focus on emerging market trends and provides actionable insights to help businesses identify market opportunities and develop effective strategies to optimize their market positions. With over 500 specialized analysts, Technavio’s report library consists of more than 17,000 reports and counting, covering 800 technologies, spanning across 50 countries. Their client base consists of enterprises of all sizes, including more than 100 Fortune 500 companies. This growing client base relies on Technavio’s comprehensive coverage, extensive research, and actionable market insights to identify opportunities in existing and potential markets and assess their competitive positions within changing market scenarios.


Contacts

Technavio Research
Jesse Maida
Media & Marketing Executive
US: +1 844 364 1100
UK: +44 203 893 3200
Email: This email address is being protected from spambots. You need JavaScript enabled to view it.
Website: www.technavio.com/

SCOTTSDALE, Ariz.--(BUSINESS WIRE)--Nuverra Environmental Solutions, Inc. (NYSE American: NES) announced today that it has set December 18, 2020 as the date for the 2020 Annual Meeting of Stockholders (the “Annual Meeting”) and the close of business on October 26, 2020 as the record date for determining the stockholders entitled to vote at the Annual Meeting. A proxy statement containing the meeting details is expected to be available on or before October 30, 2020 to stockholders as of the record date.


About Nuverra

Nuverra Environmental Solutions, Inc. provides water logistics and oilfield services to customers focused on the development and ongoing production of oil and natural gas from shale formations in the United States. Our services include the delivery, collection, and disposal of solid and liquid materials that are used in and generated by the drilling, completion, and ongoing production of shale oil and natural gas. We provide a suite of solutions to customers who demand safety, environmental compliance and accountability from their service providers. Find additional information about Nuverra in documents filed with the U.S. Securities and Exchange Commission (“SEC”) at http://www.sec.gov.


Contacts

Nuverra Environmental Solutions, Inc.
Investor Relations
602-903-7802
This email address is being protected from spambots. You need JavaScript enabled to view it.

Temporary Generation and Line Sectionalizing Devices Reduced Number of Customers Who Needed to be De-energized by Approximately 12,000

40 Community Resource Centers Providing Water, Restrooms, Device Charging and More

PG&E Partnering with Community-Based Organizations to Assist Customers with Medical, Financial, Language and Aging Needs Before, During and After PSPS events

SAN FRANCISCO--(BUSINESS WIRE)--With an ongoing Public Safety Power Shutoff (PSPS) event that could have affected about 53,000 customers, Pacific Gas and Electric Company (PG&E) continued Thursday to focus on safety, monitor the weather, and support our customers recognizing the hardship that a PSPS represents.

Here are some updates on the weather, the event, and how customers are being supported.

Oct. 14-16 Public Safety Power Shutoff

About 53,000 customers in 24 counties were within the original forecasted PSPS footprint. Due to some improving weather conditions and deployment of technology, only about 41,000 were de-energized. This includes 4,000 customers in the Southern Sierra who had been told that they would be de-energized today have now been told that more favorable weather means that they won’t lose power during the PSPS event.

Before the event began, PG&E was able to reduce the impact of the PSPS event by keeping about 12,000 customers energized through temporary and permanent generation, off-grid service, and by using devices that split or sectionalize power lines, which allows more precise de-energization. PG&E’s goal this year is to reduce the number of customers affected by a PSPS event by one-third compared to last year.

In some locations, the severe weather subsided enough during the day for PG&E’s Meteorology team to issue an “all clear,” meaning that electric crews could begin patrols of power lines as the first step toward restoration. Once de-energized for a PSPS event, power lines must be visually inspected to ensure that no wind-driven damage or hazards such as tree limbs entwined in lines exist. Once inspected, the lines can be energized, restoring service to customers. As of 6 p.m. today, PG&E restored about 8,000 customers who had been de-energized for this event with an expectation that another 2,000 customers could be restored tonight.

PG&E expects that the “all clear” will be issued in all remaining areas of the PSPS footprint Friday morning, which means more than 1,000 PG&E employees will be on the ground or in more than 40 helicopters to conduct line patrols and restore customers. The majority of customers affected by this PSPS event are expected to be restored by late Friday.

Community Resource Centers

To support our customers during this PSPS event, PG&E opened 40 Community Resource Centers (CRCs) that operate from 8 a.m. to 10 p.m. throughout the event. These temporary CRCs will be open to customers when power is out at their homes and will provide ADA-accessible restrooms, hand-washing stations, medical-equipment charging, Wi-Fi, bottled water, grab-and-go bags, and non-perishable snacks.

Many of these CRCs opened Wednesday afternoon and all were open on Thursday. As of this afternoon, about 1,500 customers visited a CRC.

PG&E updates its CRC locations regularly. Click here for updates.

Support for Customers with Medical Needs

PG&E is also partnering with 47 community-based organizations (CBOs) to assist customers with medical, financial, language, and aging needs before, during, and after PSPS events. These activities include:

  • Collaborating with the California Foundation for Independent Living Centers (CFILC) through a grant program to support the Access and Functional Needs (AFN) community. This support for customers with medical and independent living needs includes:
    • Enabling qualifying customers who use electrical medical devices to access backup portable batteries
    • Emergency preparedness outreach and education
    • Promotion of Medical Baseline Program
    • Accessible transportation resources
    • Hotel stays
    • Food stipends
  • Working with 14 food banks and 17 local Meals on Wheels chapters.
  • Expanding availability of materials in American Sign Language (ASL).
  • Providing emergency information in 13 languages.
  • Establishing an advisory group to help create solutions for emergency preparedness for customers with medical needs.

Details about these resources are at our website at pge.com/disabilityandaging

Also, as of Oct. 14, PG&E provided a total of 1,244 portable batteries to customers to support backup power, including:

During this Oct. 14-16 PSPS event, PG&E’s partners have engaged proactively or reactively with nearly 2,400 individuals. Through Thursday afternoon, 119 customers have used batteries provided by the CFILC and 34 hotel stays have been coordinated.

Here’s Where to Go to Learn More

  • PG&E’s emergency website www.pge.com/pspsupdates is now available in 13 languages. Currently, the website is available in English, Spanish, Chinese, Tagalog, Russian, Vietnamese, Korean, Farsi, Arabic, Hmong, Khmer, Punjabi, and Japanese. Customers will have the opportunity to choose their language of preference for viewing the information when visiting the website.
  • Customers are encouraged to update their contact information and indicate their preferred language for notifications by visiting www.pge.com/mywildfirealerts or by calling 1-800-742-5000, where in-language support is available.
  • Tenants and non-account holders can sign up to receive PSPS ZIP Code Alerts for any area where you do not have a PG&E account by visiting www.pge.com/pspszipcodealerts.
  • PG&E has launched a new tool at its online Safety Action Center (www.safetyactioncenter.pge.com) to help customers prepare an emergency plan. By using the "Make Your Own Emergency Plan" tool and answering a few short questions, visitors to the website can compile and organize the important information needed for a personalized family emergency plan.

About PG&E

Pacific Gas and Electric Company, a subsidiary of PG&E Corporation (NYSE:PCG), is one of the largest combined natural gas and electric energy companies in the United States. Based in San Francisco, with more than 20,000 employees, the company delivers some of the nation's cleanest energy to 16 million people in Northern and Central California. For more information, visit pge.com and pge.com/news.


Contacts

MEDIA RELATIONS:
415-973-5930


MADISON, Wis.--(BUSINESS WIRE)--The board of directors of MGE Energy, Inc. (Nasdaq: MGEE) today declared the regular quarterly dividend of $0.37 per share on the outstanding shares of the company's common stock, payable Dec. 15, 2020, to shareholders of record at the close of business Dec. 1, 2020.

MGE Energy has increased its dividend annually for the past 45 years and has paid cash dividends for more than 110 years.

About MGE Energy

MGE Energy is a public utility holding company. Its principal subsidiary, Madison Gas and Electric (MGE), generates and distributes electricity to 155,000 customers in Dane County, Wis., and purchases and distributes natural gas to 163,000 customers in seven south-central and western Wisconsin counties.


Contacts

Steve Schultz
Corporate Communications Manager
608-252-7219 | This email address is being protected from spambots. You need JavaScript enabled to view it.

LOS ANGELES--(BUSINESS WIRE)--#PepperdineProud--Nanotechnology company BNNano, Inc., biotechnology company Calviri, Inc., and electronics materials company Terecircuits Corporation claimed top recognition (Platinum category) on Pepperdine Graziadio Business School’s third annual Most Fundable Companies List, which was announced during the virtual event yesterday. The Graziadio School named the 20 Most Fundable Companies, all of which have less than $10 million in annual revenue, strong business plans, and impressive near-term growth projections.


More than 4,500 early-stage U.S. companies spanning all 50 states participated in the Most Fundable Companies initiative, which is designed to bridge the gap between startups and the capital they need to succeed. The companies on the third annual list are located across the country and come from a variety of industries including biotechnology, renewable energy, aeronautics, and software technology.

“Investing in innovative companies can help our nation get back to work with good-paying jobs and bring the transformative change we all want,” said Deryck J. van Rensburg, dean of Pepperdine Graziadio Business School. “The Most Fundable Companies initiative aims to educate founders on the investor diligence process and recognize exceptional entrepreneurs who are solving today’s problems with inventive solutions and are also seeking investment capital to fuel their company's accelerated growth.”

Amongst the Most Fundable Companies winners were three Pepperdine Graziadio and Pepperdine Caruso School of Law alumni: Wayne Rickard (MBA) with Terecircuits, Dan O’Day (JD/MBA) with ECFX, and Nelson Quintero (JD) with ECFX.

The Most Fundable Companies assessment evaluates several company variables including financial projections, market opportunity, intellectual property, competitive advantage in their market, and the strength of the management team expertise, all of which are used to produce a fundability score for every company that participates. Pepperdine Most Fundable Companies is powered by The Venture Alliance.

To learn more about the winners and find out how to participate visit the 2020 Most Fundable Companies webpage.

Pepperdine Graziadio 2020 Most Fundable Companies List (alphabetically listed by category)

Platinum:

BNNano, Inc. (Burlington, NC)

BNNano leverages cutting-edge materials innovations to transform and return value to industrial commodities, facilitating applications such as aerospace, hypersonics, thermal management, and additive manufacturing.

Calviri, Inc. (Tempe, AZ)

Calviri will end cancer deaths worldwide via development of new diagnostic and therapeutic products, such as a chip for early detection of antibodies in blood and preventive vaccines.

Terecircuits Corporation (Mountain View, CA)

Terecircuits has developed a new class of polymer and novel circuit assembly techniques to support microassembly and mass transfer for advanced displays and electronics.

Gold:

Ai Software, LLC d/b/a Capacity (St. Louis, MO)

Capacity is a new kind of help desk, powered by artificial intelligence, that automates support for your customers and employees.

Athena, Inc. (New Orleans, LA)

Athena enables users to collect back child support in less time and for less money.

Flower Turbines, Inc. (Lawrence, NY)

Flower Turbines makes small wind turbines with aerodynamic innovations that allow them to change the world market for uses near people and buildings.

RRTC, Inc. (Belle Mead, NJ)

RRTC is a platform-manufacturing technology company. Patented, low-cost, sustainable solidification technology creates novel composites with a performance edge for a wide range of applications.

Silver:

Agtools, Inc. (Irvine, CA)

Agtools is a SaaS Food and Ag worldwide supply-chain platform offering real-time actionable intelligence data to increase profitability and avoid food waste. 2019 Microsoft ML/AI award winner.

Baby Barista (Simi Valley, CA)

Baby Barista’s connected machine revolutionizes infant formula feeding by making the perfect bottle in under 30 seconds and delivering organic formula right to your doorstep.

ECFX (Venice, CA)

ECFX provides a cloud-based enterprise notice management system using intelligent automation to streamline the entire electronic court notice workflow with firmwide administration and analytics.

ExpressCells (Philadelphia, PA)

ExpressCells is a revenue-generating genetic engineering company that creates knock-in cell lines for biological research more quickly than competing technologies and enabling better experiments.

Global Thermostat (New York, NY)

Global Thermostat commercializes its advanced, multi-patented technology to transform carbon dioxide from a global liability into an opportunity for global prosperity.

Target Arm, Inc. (Ridgefield, CT)

Target Arm’s device, Tular, enables launch and recovery of both rotary wing and fixed wing drones from any moving vehicle, autonomously, and even during windy conditions.

WinSanTor, Inc. (San Diego, CA)

WinSanTor is developing what may be the only disease-modifying treatment for peripheral neuropathy, a debilitating neurodegenerative condition that affects the lives of hundreds of millions of people.

Bronze:

Adranos, Inc. (West Lafayette, IN)

Adranos has developed a high-performance solid rocket fuel, ALITEC, that can increase the range or payload capacity of launch systems by up to 40 percent.

Cast21 (Chicago, IL)

Cast21 is changing the way the world heals with QUINTM technology, a waterproof alternative to a cast or brace for broken bones.

Hope Trust (Holmdel, NJ)

Hope Trust automates the special needs planning process, allowing families to ensure that the complex, interdisciplinary needs of their loved one will be fulfilled.

Perfitly, LLC (New York, NY)

Perfitly’s AR/VR-AI platform enables online apparel shoppers to try on and visualize garments in 3D before buying, reducing returns and increasing sales.

Perytor Therapeutics, Inc. (San Antonio, TX)

Perytor Therapeutics discovered a new category of drugs extracted from placental tissue that can be used to promote regeneration, while reducing pain and inflammation.

Wind Talker Innovations, Inc. (Anchorage, AK)

Wind Talker Innovations develops solutions to transcend the limitations of existing networks, allowing instantaneous and high-speed communications between users on- or off-grid.

Disclaimers: The Pepperdine Graziadio Most Fundable Companies List does not represent an offer to sell securities. It does not constitute investment advice, nor is it an endorsement of any particular product or service. Pepperdine University is not a broker-dealer and does not perform services provided by a broker-dealer, including but not limited to any financial or investment advising.

About Pepperdine University Graziadio Business School

For more than 50 years, the Pepperdine Graziadio Business School has challenged individuals to think boldly and drive meaningful change within their industries and communities. Dedicated to developing Best for the World Leaders, the Graziadio School offers a comprehensive range of MBA, MS, executive, and doctoral degree programs grounded in integrity, innovation, and entrepreneurship. The Graziadio School advances experiential learning through small classes with distinguished faculty that stimulate critical thinking and meaningful connection, inspiring students and working professionals to realize their greatest potential as values-centered leaders. Follow Pepperdine Graziadio on Facebook, Twitter, Instagram, and LinkedIn.


Contacts

Hillary Doran
Associate Director of Marketing
Pepperdine Graziadio Business School
(310) 568-2339
This email address is being protected from spambots. You need JavaScript enabled to view it.

HOUSTON--(BUSINESS WIRE)--Permianville Royalty Trust (NYSE: PVL, the “Trust”) today announced the net profits interest calculation for October 2020. The net profits interest calculation represents reported oil production for the month of July 2020 and reported natural gas production during June 2020. The calculation includes accrued costs incurred in August 2020.

This month, there was a continued rebound in the reported oil volumes, which partly reflects a return of previously deferred sales and shut-in production by some of the operators of the oil and gas properties underlying the Trust (the “Underlying Properties”). Excluding prior net profits interest shortfalls, income from the distributable net profits interest this month would have been approximately $0.1 million, or $0.0042 per unit. As a result of the cumulative outstanding net profits shortfall of approximately $2.4 million, however, no distribution will be paid to the Trust’s unitholders of record on October 30, 2020 in November 2020. Distributions to the Trust will resume once the cumulative net profits shortfall, which now totals approximately $2.2 million, is eliminated.

The following table displays reported underlying oil and natural gas sales volumes and average received wellhead prices attributable to the current and prior month recorded net profits interest calculations. The amounts in the table have not been adjusted to reflect temporarily delayed sales and shut-in oil volumes discussed below.


Underlying Sales Volumes


Average Price


Oil


Natural Gas


Oil


Natural Gas


Bbls


Bbls/D


Mcf


Mcf/D


(per Bbl)


(per Mcf)

Current Month


54,070


1,744


465,732


15,524


$

35.70


$

1.23

Prior Month


44,028


1,468


230,839


7,446


$

33.31


$

1.12

Recorded oil cash receipts from the Underlying Properties totaled $1.9 million for the current month on realized wellhead prices of $35.70/Bbl, up $0.4 million from the prior month distribution period. Based on current data for the Underlying Properties, COERT Holdings 1 LLC (the “Sponsor”) indicates that production and cash receipts continue to normalize.

Recorded natural gas cash receipts from the Underlying Properties totaled $0.6 million for the current month, an increase of $0.3 million from the prior month’s distribution period, due in part to the receipt of proceeds from the sales of prior months’ production.

Total accrued operating expenses for the period were $2.3 million, a $0.8 million increase month-over-month from September 2020 primarily due to the increase in recorded production. Capital expenditures increased $0.4 million from the prior month.

The remaining cumulative shortfall in net profits for the prior months will be deducted from any net profits in next month’s net profits interest calculation. At this time based on current commodity prices, the Sponsor anticipates that the Underlying Properties will continue to generate positive net profits to reduce the cumulative shortfall before returning to monthly distributions again.

About Permianville Royalty Trust

Permianville Royalty Trust is a Delaware statutory trust formed to own a net profits interest representing the right to receive 80% of the net profits from the sale of oil and natural gas production from certain, predominantly non-operated, oil and gas properties in the states of Texas, Louisiana and New Mexico. As described in the Trust’s filings with the Securities and Exchange Commission (the “SEC”), the amount of the periodic distributions is expected to fluctuate, depending on the proceeds received by the Trust as a result of actual production volumes, oil and gas prices, the amount and timing of capital expenditures, and the Trust’s administrative expenses, among other factors. Future distributions are expected to be made on a monthly basis. For additional information on the Trust, please visit www.permianvilleroyaltytrust.com.

Forward-Looking Statements and Cautionary Statements

This press release contains statements that are “forward-looking statements” within the meaning of Section 21E of the Securities Exchange Act of 1934, as amended. All statements contained in this press release, other than statements of historical facts, are “forward-looking statements” for purposes of these provisions. These forward-looking statements include the amount and date of any anticipated distribution to unitholders, expected expenses, including capital expenditures, and expectations regarding the ability of the Underlying Properties to continue to generate positive net profits before returning to monthly distributions. The anticipated distribution is based, in large part, on the amount of cash received or expected to be received by the Trust from the Sponsor with respect to the relevant period. The amount of such cash received or expected to be received by the Trust (and its ability to pay distributions) has been and will continue to be directly affected by the volatility in commodity prices, which have declined since the beginning of 2020 in response to the economic effects of the COVID-19 pandemic and the dispute over production levels between Russia and the members of the Organization of Petroleum Exporting Countries, including Saudi Arabia, resulting in an oversupply of crude oil and exacerbating the decline in crude oil prices, and could remain low for an extended period of time. Continued low oil and natural gas prices will reduce profits to which the Trust is entitled, which will reduce the amount of cash available for distribution to unitholders and in certain periods could result in no distributions to unitholders. Other important factors that could cause actual results to differ materially include expenses of the Trust, reserves for anticipated future expenses and the effect, impact, potential duration or other implications of the COVID-19 pandemic. In addition, future monthly capital expenditures may exceed the average levels experienced in 2019 and prior periods. Statements made in this press release are qualified by the cautionary statements made in this press release. Neither the Sponsor nor the Trustee intends, and neither assumes any obligation, to update any of the statements included in this press release. An investment in units issued by the Trust is subject to the risks described in the Trust’s filings with the SEC, including the risks described in the Trust’s Annual Report on Form 10-K for the year ended December 31, 2019, filed with the SEC on March 16, 2020, and the Trust’s Quarterly Report on Form 10-Q for the period ended June 30, 2020, filed with the SEC on August 7, 2020. The Trust’s quarterly and other filed reports are or will be available over the Internet at the SEC’s website at http://www.sec.gov.


Contacts

Permianville Royalty Trust
The Bank of New York Mellon Trust Company, N.A., as Trustee
Sarah Newell 1 (512) 236-6555

  • Worldwide revenue of $5.3 billion decreased 2% sequentially
  • International revenue of $4.1 billion decreased 1% sequentially
  • North America revenue of $1.2 billion decreased 2% sequentially
  • GAAP loss per share, including charges and credits of $0.22 per share, was $0.06
  • EPS, excluding charges and credits, was $0.16
  • Cash flow from operations was $479 million and free cash flow was $226 million
  • Board approved quarterly cash dividend of $0.125 per share

HOUSTON--(BUSINESS WIRE)--Schlumberger Limited (NYSE: SLB) today reported results for the third quarter of 2020.


Third-Quarter Results (Stated in millions, except per share amounts)
Three Months Ended Change
Sept. 30, 2020 Jun. 30, 2020 Sept. 30, 2019 Sequential Year-on-year
Revenue

$5,258

$5,356

$8,541

-2%


-38%

Income (loss) before taxes - GAAP basis

$(54)

$(3,627)

$(11,971)

n/m


n/m

Adjusted EBITDA*

$1,018

$838

$1,773

21%


-43%

Adjusted EBITDA margin*

19.4%

15.6%

20.8%

371 bps


-140 bps

Pretax segment operating income*

$575

$396

$1,096

45%


-48%

Pretax segment operating margin*

10.9%

7.4%

12.8%

355 bps


-190 bps

Net income (loss) - GAAP basis

$(82)

$(3,434)

$(11,383)

n/m


n/m

Net income, excluding charges & credits*

$228

$69

$596

231%


-62%

Diluted EPS (loss per share) - GAAP basis

$(0.06)

$(2.47)

$(8.22)

n/m


n/m

Diluted EPS, excluding charges & credits*

$0.16

$0.05

$0.43

220%


-63%


North America revenue

$1,157

$1,183

$2,850

-2%


-59%

International revenue

$4,091

$4,138

$5,629

-1%


-27%

 
*These are non-GAAP financial measures. See sections titled "Charges & Credits", "Segments", and "Supplemental Information" for details.
n/m = not meaningful

Schlumberger CEO Olivier Le Peuch commented, “Our results in the third quarter clearly demonstrate our focus on execution, returns, and customer performance. Margins expanded sequentially while pretax segment operating income and adjusted EBITDA grew 45% and 21%, respectively, highlighting notable progress in the reset of our earnings power and further demonstrating our execution capabilities as we transition to our new organization.

“Through this cycle, we are leading technology innovation for our customers and reinventing ourselves to deliver a return above our cost of capital through the combination of capital stewardship, margin expansion, and free cash flow generation.

“In North America, we have exhibited capital discipline, and are high-grading and rationalizing our portfolio, with a focus on reduced volatility of earnings and less capital-intensive businesses as demonstrated by two key milestones we achieved during the quarter. The first is the agreement to combine our OneStim® pressure pumping business with Liberty Oilfield Services Inc. The second is an agreement to divest our low-flow artificial lift business in a cash transaction.

“Internationally, our fit-for-basin approach continues to extend our leadership position built on the largest and most diverse footprint in the industry. Despite the rig count decline during the quarter, we have experienced significant new technology uptake, achieved new performance benchmarks for our customers, and captured higher performance incentives on multiple projects. In addition, our international business continues to generate resilient, accretive margins and significant free cash flow. Upon the close of the two North America transactions, we expect our international revenue to represent more than 80% of consolidated revenue, up from an average of approximately 65% over the past decade. The combination of our fit-for-basin strategy, digital technology innovation, and scale puts us in the best position to leverage the anticipated shift of spending growth toward the international market.

“Third-quarter revenue declined 2% sequentially, as North America revenue was 2% lower and international revenue declined 1%. In North America land, increased completions activity on drilled but uncompleted (DUC) wells was offset by reduced drilling in US land. North America offshore was affected by reduced rig activity, lower multiclient seismic license sales, and hurricane disruption.

“International revenue was driven by higher activity in Latin America, boosted by the resumption of production in our Asset Performance Solutions (APS) projects in Ecuador and increased seasonal summer activity in the North Sea and Russia. These increases were offset by the effects of rig count declines and extended COVID-19 disruptions in Africa and in the Middle East & Asia.

Third-Quarter Revenue by Segment (Stated in millions)
Three Months Ended Change
Sept. 30, 2020 Jun. 30, 2020 Sept. 30, 2019 Sequential Year-on-year
Reservoir Characterization

$1,010

$1,052

$1,651

-4%


-39%

Drilling

1,519

1,731

2,469

-12%


-38%

Production

1,801

1,615

3,153

12%


-43%

Cameron

965

1,015

1,363

-5%


-29%

Other

(37)

(57)

(95)

n/m


n/m

$5,258

$5,356

$8,541

-2%


-38%

n/m = not meaningful
Certain prior period amounts have been reclassified to conform to the current period presentation.

“Sequentially, by business segment, third-quarter Production revenue increased 12%, driven by the gradual recovery in DUC well completions activity in US land and the resumption of APS production in Ecuador, which was further boosted by digital technology, improving project performance and efficiency. Reservoir Characterization, Drilling, and Cameron decreased 4%, 12%, and 5%, respectively, due to lower WesternGeco® multiclient seismic license sales, the US land drilling activity decline, hurricane disruption in the US Gulf of Mexico, and persistent COVID-19 disruptions internationally.

“Our cost-reduction program, which will permanently remove $1.5 billion of structural costs on an annual basis, is progressing well. We expect to realize the vast majority of these savings as we exit this year. This represents a critical step toward our intermediate goal of restoring 2019 adjusted EBITDA margins before the end of 2021.

“I am extremely proud of our operational and financial performance during the quarter, as we continue to build the foundation of our future success.

“As we look to the fourth quarter, we expect to continue to benefit from the effectiveness of our strategy, disciplined approach to North America, and broad strength of our international business, as reflected in our third-quarter results. In North America, the conditions are set for continued momentum, with improving DUC well completion activity in US land and a modest drilling resumption in the US and Canada. International activity is steady following the budget resets completed in the third quarter and activity will be affected by the seasonal decline in the Northern Hemisphere, partly offset by muted year-end product and multiclient license sales.

“Overall internationally, we view the next two quarters as a period of transition for our industry at the trough of this cycle. Improving demand recovery supported by various government measures to stimulate economic activity and continued supply discipline from the major producers set the conditions for a long-term activity rebound. However, while the global lockdowns are evolving and vaccine development is progressing, the near-term recovery remains fragile owing to potential subsequent waves of COVID-19 that could pose a significant risk to this outlook.

“Therefore, in this flattening near-term activity outlook, we will continue to execute on a path toward restoring our 2019 adjusted EBITDA margins and generating robust free cash flow—through our restructuring measures, the high-grading of our portfolio, and the further strengthening of our broad international portfolio.

“As our industry emerges from this trough, the ability to deliver new performance benchmarks—to innovate and collaborate in every basin—will define success for the coming decades. Schlumberger will lead this innovation and the path to recovery. Our performance and returns-focused strategy will allow us to capitalize upon the emerging growth cycle and deliver industry-leading returns, through our capital stewardship, fit-for-basin technology, digital leadership, and a unique talent pool supporting our global execution. In addition, we are accelerating the expansion of our New Energy portfolio as we develop avenues to contribute to the sustainable energy mix of the future, leveraging our technology, expertise, and execution platform to reduce our environmental impacts while helping our customers reach their environmental goals.

“The crisis has served as a catalyst for reinventing Schlumberger. We are executing our performance strategy and are determined to continue taking bold actions to secure resilience and reposition ourselves as clear leaders—both in performance measured by our customers and in returns measured by our shareholders.”

Other Events

During the third quarter, Schlumberger issued $500 million of 1.400% Senior Notes due 2025 and $350 million of 2.650% Senior Notes due 2030.

On August 31, 2020, Schlumberger and Liberty Oilfield Services Inc. (Liberty) signed an agreement for the contribution to Liberty of OneStim, Schlumberger’s onshore hydraulic fracturing business in the United States and Canada, including its pressure pumping, pumpdown perforating, and Permian frac sand businesses, in exchange for a 37% equity interest in Liberty. The transaction is expected to close in the fourth quarter of 2020 and is subject to Liberty stockholder approval and other customary closing conditions.

On October 15, 2020, Schlumberger’s Board of Directors approved a quarterly cash dividend of $0.125 per share of outstanding common stock, payable on January 14, 2021 to stockholders of record on December 2, 2020.

Consolidated Revenue by Area

(Stated in millions)
Three Months Ended Change
Sept. 30, 2020 Jun. 30, 2020 Sept. 30, 2019 Sequential Year-on-year
North America

$1,157

$1,183

$2,850

-2%


-59%

Latin America

707

543

1,014

30%


-30%

Europe/CIS/Africa

1,397

1,449

2,062

-4%


-32%

Middle East & Asia

1,987

2,146

2,553

-7%


-22%

Other

10

35

62

n/m


n/m

$5,258

$5,356

$8,541

-2%


-38%


North America revenue

$1,157

$1,183

$2,850

-2%


-59%

International revenue

$4,091

$4,138

$5,629

-1%


-27%

 
n/m = not meaningful
Certain prior period amounts have been reclassified to conform to the current period presentation.

North America

North America area consolidated revenue of $1.2 billion was 2% lower sequentially. On land, an uptick in DUC well completions was partially offset by reduced drilling activity. OneStim fracturing revenue grew on higher fleet utilization driven by a US-market stage count increase of more than 30% as customers worked on their DUCs in the Permian and in the resilient gas basins in the Haynesville. Land drilling activity was lower as the average US land rig count declined 29% sequentially, though the rig count had increased slightly by quarter end. In addition, sales in Surface Systems and Valves & Process Systems, mainly on land, decreased sequentially due to reduced drilling activity. North America offshore revenue decreased 13% sequentially due to the combination of reduced rig count, lower WesternGeco multiclient seismic license sales, and hurricane disruption.

International

Consolidated revenue in the Latin America area of $707 million increased 30% sequentially, primarily due to the resumption of production in our APS projects in Ecuador. Argentina revenue increased as activity rebounded following the easing of COVID-19 lockdown restrictions while revenue in both Mexico and Brazil declined.

Europe/CIS/Africa area consolidated revenue of $1.4 billion decreased 4% sequentially as increased seasonal summer activity in the North Sea and Russia was offset by rig count declines and extended COVID-19 disruptions in Africa and the Caspian region. Resilient activity in Russia and the North Sea was driven by summer drilling and pressure pumping activity campaigns, partially offset by disruptions and delays in Kazakhstan and in Sakhalin. The seasonal activity increase in the Northern Hemisphere, however, was offset by a significant drop in activity in Sub-Sahara Africa from COVID-19 disruptions, reduced rig count, and project delays.

Consolidated revenue in the Middle East & Asia area of $2.0 billion decreased 7% sequentially, primarily due to extended COVID-19 disruptions and project delays in Asia and as customers reduced spending and activity due to budget adjustments, particularly in the Middle East.

Reservoir Characterization

(Stated in millions)
Three Months Ended Change
Sept. 30, 2020 Jun. 30, 2020 Sept. 30, 2019 Sequential Year-on-year
Revenue

$1,010

$1,052

$1,651

-4%


-39%

Pretax operating income

$169

$185

$360

-9%


-53%

Pretax operating margin

16.7%

17.6%

21.8%

-90 bps


-512 bps

 
Certain prior period amounts have been reclassified to conform to the current period presentation.

Reservoir Characterization revenue of $1.0 billion, 85% of which came from the international markets, decreased 4% sequentially. North America and international revenues declined 14% and 2%, respectively. This was mainly due to lower WesternGeco multiclient seismic license sales in North America offshore. Revenue was also lower in the Middle East due to reduced WesternGeco activity as a result of a completed project and lower Testing Services activity due to project cancellations and delays. Sequentially, Wireline activity was essentially flat while Software Integrated Solutions (SIS) revenue was higher.

Reservoir Characterization pretax operating margin of 17% contracted 90 basis points (bps) sequentially due to lower sales of WesternGeco multiclient seismic licenses, which impacted North America margin, while international margin was flat sequentially.

Drilling


(Stated in millions)
Three Months Ended Change
Sept. 30, 2020 Jun. 30, 2020 Sept. 30, 2019 Sequential Year-on-year
Revenue

$1,519

$1,731

$2,469

-12%


-38%

Pretax operating income

$144

$165

$306

-13%


-53%

Pretax operating margin

9.5%

9.6%

12.4%

-9 bps


-292 bps

Drilling revenue of $1.5 billion, 83% of which came from the international markets, decreased 12% sequentially. North America and international revenues declined 16% and 11%, respectively. The revenue decline in North America was primarily due to lower activity in US land as rig count dropped 29%, along with rig count reductions and activity disruptions in the US Gulf of Mexico due to a more active hurricane season. In addition, extended COVID-19 disruptions caused drilling activities to be suspended or deferred in several international GeoMarkets.

Sequentially, Drilling pretax operating margin of 10% was essentially flat, despite the significant revenue decline. Margin was resilient both in North America and internationally supported by prompt cost reduction measures.

Production

(Stated in millions)
Three Months Ended Change
Sept. 30, 2020 Jun. 30, 2020 Sept. 30, 2019 Sequential Year-on-year
Revenue

$1,801

$1,615

$3,153

12%


-43%

Pretax operating income

$227

$25

$288

816%


-21%

Pretax operating margin

12.6%

1.5%

9.1%

1,107 bps


347 bps

Production revenue of $1.8 billion, 74% of which came from the international markets, increased 12% sequentially. North America and international revenues increased 13% and 11%, respectively. This was driven primarily by the gradual recovery in DUC well completions activity in US land and the resumption of APS production in Ecuador, which was further boosted by digital technology, improving project performance and efficiency. OneStim revenue grew more than 50% sequentially as US-market stage counts increased by more than 30%. Artificial Lift Solutions revenue increased, also benefitting from the US land recovery. These increases were offset by international declines in Well Services and Completions revenue, resulting from lower spending and activity due to customer budget adjustments, particularly in the Middle East, and from extended COVID-19 lockdown disruption across several GeoMarkets.

Production pretax operating margin of 13% expanded by 1,107 bps sequentially, posting a 108% incremental operating margin. The margin expansion was due to the resumption of production in our APS projects in Ecuador and improved profitability across each of Completions, Artificial Lift Solutions, and Well Services, supported by cost reduction measures. OneStim margin improved due to better operating leverage as revenue increased by more than 50%. Margins improved both in North America and internationally.

Cameron

(Stated in millions)
Three Months Ended Change
Sept. 30, 2020 Jun. 30, 2020 Sept. 30, 2019 Sequential Year-on-year
Revenue

$965

$1,015

$1,363

-5%


-29%

Pretax operating income

$60

$80

$173

-25%


-65%

Pretax operating margin

6.3%

7.9%

12.7%

-162 bps


-644 bps

 
Certain prior period amounts have been reclassified to conform to the current period presentation.

Cameron revenue of $965 million, 67% of which came from the international markets, decreased 5% sequentially. This was primarily due to revenue declines in the long-cycle businesses of OneSubsea® and Drilling Systems, driven by projects ending in Asia and Europe, coupled with the extended COVID-19 disruptions. Despite lower equipment sales in North America, the short-cycle businesses of Surface Systems and Valves & Process Systems were resilient, driven by growth internationally.

Cameron pretax operating margin of 6% declined by 162 bps sequentially. The margin contraction was primarily due to the unfavorable mix where contribution from the long-cycle businesses of OneSubsea and Drilling Systems was lower due to reduced activity. The margins of the short-cycle businesses of Surface Systems and Valves & Process Systems were flat.

Quarterly Highlights

During the quarter, Schlumberger continued to deploy innovative technology and digital enablement to help move the industry toward safer and more efficient operations with lower environmental impact. Schlumberger’s digital platform for the industry continued to gain adoption, as Schlumberger helped customers at various stages of their digital journeys:

  • Kuwait Oil Company (KOC) awarded Schlumberger a five-year contract for the ability to implement digital solutions, including the Petrel* E&P software platform and other petrotechnical domain applications. The contract, valued at USD 109 million, furthers KOC’s objective to deploy best-in-class software solutions that increase asset team efficiency while reducing overall cost per barrel. KOC seeks to improve cross-discipline collaboration between geosciences, reservoir engineering, production engineering, and drilling to facilitate better investment decisions based on a clear understanding of opportunities and risks.
  • Suncor Energy signed a multiyear agreement to use the Schlumberger DELFI* cognitive E&P environment for the multidomain integration of reservoir engineering, production, and geomechanics in Canada’s large-scale unconventional thermal reservoirs. The agreement includes a heavy oil research and development collaboration for Schlumberger to develop new digital technologies for these complex environments.
  • The Angolan Agência Nacional de Petróleo, Gás e Biocombustíveis (ANPG) issued a contract award to Schlumberger for the agency’s first-ever digital transformation project. ANPG’s vision is to move to a cloud-based platform to improve the efficiency and performance of oil and gas exploration activities in Angola. The project comprises a technology landscape review, digital readiness evaluation, and an implementation roadmap. A Schlumberger digital transformation consulting team will conduct the reviews and then define a path to advance the digitalization of ANPG, enabled by the Schlumberger DELFI environment.

New technology, workflows, and digitally enabled hardware—including artificial intelligence (AI) and internet of things (IoT) solutions at the edge—continue to positively impact our internal delivery, our performance for customers, and the environment:

  • In Ecuador, Schlumberger accelerated adoption of digital solutions through its integrated business model by implementing Agora* edge AI and IoT solutions on its own APS project. By combining digital technologies within an integrated environment, production performance was increased while operational and environmental footprint were reduced. To solve production challenges with high gas/oil ratio wells, Agora solutions were used to deliver an automated electrical submersible pump (ESP) gas-handling process. Using a securely connected, solar-powered skid running predictive AI at the edge to optimize well and ESP performance, production was increased 30% in wells connected by the Agora solution, while reducing field crew visits to these wells by 97%—an example of the performance made possible by combining digital and integration.
  • Offshore Malaysia, PETRONAS Carigali Sdn Bhd (PCSB), a subsidiary of PETRONAS, has deployed the Agora platform on mature assets to improve its wellsite safety and productivity while reducing greenhouse gas emissions. By using an artificial-intelligence-based video analytics solution, PCSB has achieved a step change in safety and productivity with zero facilities modification. This solution has enabled mature assets to be successfully digitalized. An Agora platform gateway connected to an edge-empowered camera and stand-alone sensors reduced human exposure in the field while providing continuous access to critical equipment data.
  • In Saudi Arabia, the DrillPlan* well construction planning and DrillOps* automation well delivery solutions surpassed 63,000 ft drilled, achieving a key milestone for our Integrated Well Construction LSTK operations. The on-bottom rate of penetration (ROP) with AutoROP* was 17% higher than previous wells drilled by the same rigs' field average. Furthermore, DrillOps controlled the preconnection, reaming, and backreaming operations, significantly reducing nonproductive time, optimized well delivery time, and contributed to a 30% improvement in on-bottom ROP and shoe-to-shoe run in a recent section of a horizontal well.
  • Onshore Thailand, Schlumberger used Performance Live* digitally connected service on four rigs for PTT Exploration and Production Plc., Ltd. (PTTEP), reducing crew HSE exposure while sustaining improved ROP. To overcome pandemic-related operational challenges while maintaining drilling execution, Performance Live service enabled PTTEP to conduct most analytical tasks from an office rather than at the wellsite, resulting in a wellsite crew reduction of 50% during directional drilling operations. When combined with upgraded and optimized bottomhole assembly tools with digitally connected capability, Performance Live service also helped PTTEP consistently achieve ROP in excess of 1,500 ft/d.
  • In Brazil, Drilling & Measurements deployed TerraSphere* high-definition dual-imaging-while-drilling service for the first time in the country to log presalt carbonates for Total. TerraSphere service enabled acquisition of high-definition borehole images—while drilling—de-risking the logging operations on depleted and complex reservoirs. This technology enables well completion optimization and unprecedented reservoir characterization detail for Total’s Lapa field development.
  • In the US Gulf of Mexico, Byron Energy began production from its SM58 G1 well, crediting a WesternGeco data enrichment initiative with leading to the successful discovery in 2019. The well, which is producing 19.

Contacts

For more information, contact

Ndubuisi Maduemezia – Vice President of Investor Relations, Schlumberger Limited
Joy V. Domingo – Director of Investor Relations, Schlumberger Limited
Office +1 (713) 375-3535
This email address is being protected from spambots. You need JavaScript enabled to view it.


Read full story here
Offshore Source Logo

Offshore Source keeps you updated with relevant information concerning the Offshore Energy Sector.

Any views or opinions represented on this website belong solely to the author and do not represent those of the people, institutions or organizations that Offshore Source or collaborators may or may not have been associated with in a professional or personal capacity, unless explicitly stated.

Corporate Offices

Technology Systems Corporation
8502 SW Kansas Ave
Stuart, FL 34997

info@tscpublishing.com