Business Wire News

VERNAL, Utah--(BUSINESS WIRE)--Superior Drilling Products, Inc. (NYSE American: SDPI) (“SDP” or the “Company”), an innovator and manufacturer of drilling tool technologies, today announced that on November 18, 2020, the Company received notification from the NYSE American LLC (the “NYSE American”) that it had not met compliance standards of Section 1003(a)(iii) as a result of stockholders’ equity falling below $6.0 million and having reported losses in its five most recent fiscal years ended December 31, 2019. Stockholders’ equity was approximately $4.7 million as of September 30, 2020.


The Company will evaluate all available options to regain compliance with the continued listing standards by the required date of May 18, 2022. SDP then intends to submit a plan for regaining compliance to the NYSE American by the required submission date of December 18, 2020. If the NYSE American accepts the plan, the Company will be subject to ongoing periodic reviews, including quarterly monitoring, for compliance with the plan.

About Superior Drilling Products, Inc.

Superior Drilling Products, Inc. is an innovative, cutting-edge drilling tool technology company providing cost saving solutions that drive production efficiencies for the oil and natural gas drilling industry. The Company designs, manufactures, repairs and sells drilling tools. SDP drilling solutions include the patented Drill-N-Ream® well bore conditioning tool and the patented Strider oscillation system technology. In addition, SDP is a manufacturer and refurbisher of PDC (polycrystalline diamond compact) drill bits for a leading oil field service company. SDP operates a state-of-the-art drill tool fabrication facility, where it manufactures its solutions for the drilling industry, as well as customers’ custom products. The Company’s strategy for growth is to leverage its expertise in drill tool technology and innovative, precision machining in order to broaden its product offerings and solutions for the oil and gas industry.

Additional information about the Company can be found at: www.sdpi.com.

Safe Harbor Regarding Forward Looking Statements

This news release contains forward-looking statements and information that are subject to a number of risks and uncertainties, many of which are beyond our control. All statements, other than statements of historical fact included in this release, including, without limitations, the continued impact of COVID-19 on the business, the Company’s strategy, future operations, success at developing future tools, the Company’s effectiveness at executing its business strategy and plans, financial position, estimated revenue and losses, projected costs, prospects, plans and objectives of management, and ability to outperform are forward-looking statements. The use of words “could,” “believe,” “anticipate,” “intend,” “estimate,” “expect,” “may,” “continue,” “predict,” “potential,” “project”, “forecast,” “should” or “plan, and similar expressions are intended to identify forward-looking statements, although not all forward -looking statements contain such identifying words. These statements reflect the beliefs and expectations of the Company and are subject to risks and uncertainties that may cause actual results to differ materially. These risks and uncertainties include, among other factors, the duration of the COVID-19 pandemic and related impact on the oil and natural gas industry, the effectiveness of success at expansion in the Middle East, options available for market channels in North America, the deferral of the commercialization of the Strider technology, the success of the Company’s business strategy and prospects for growth; our ability to maintain the listing of our common stock on the NYSE American; the market success of the Company’s specialized tools, effectiveness of its sales efforts, its cash flow and liquidity; financial projections and actual operating results; the amount, nature and timing of capital expenditures; the availability and terms of capital; competition and government regulations; and general economic conditions. These and other factors could adversely affect the outcome and financial effects of the Company’s plans and described herein. The Company undertakes no obligation to revise or update any forward-looking statements to reflect events or circumstances after the date hereof.


Contacts

For more information, contact investor relations:
Deborah K. Pawlowski
Kei Advisors LLC
(716) 843-3908
This email address is being protected from spambots. You need JavaScript enabled to view it.


WALL, N.J.--(BUSINESS WIRE)--New Jersey Natural Gas (NJNG), the principal subsidiary of New Jersey Resources (NYSE: NJR) today notified the New Jersey Board of Public Utilities (BPU) it will provide residential and small commercial customers with a bill credit totaling $10 million, effective December 1, 2020 through December 31, 2020. This one-time bill credit will save the average residential heating customer using approximately 158 therms $19.31, a decrease of 11.2% on their December bill.


“As we head into the winter months when the weather is typically colder and heating costs higher, we are pleased to provide this bill credit to our customers.” said Steve Westhoven, President and CEO of New Jersey Natural Gas. “We will continue to utilize our market expertise and work to manage costs and identify savings where possible. This is our commitment to our customers.”

NJNG is able to provide a bill credit at this time due to rate case refunds from interstate pipelines and lower natural gas prices. NJNG does not earn a return on the price of natural gas used to serve its customers. This bill credit does not affect NJNG’s profitability.

About New Jersey Resources

New Jersey Resources (NYSE: NJR) is a Fortune 1000 company that, through its subsidiaries, provides safe and reliable natural gas and clean energy services, including transportation, distribution, asset management and home services. NJR is composed of five primary businesses:

  • New Jersey Natural Gas, NJR’s principal subsidiary, operates and maintains over 7,500 miles of natural gas transportation and distribution infrastructure to serve over half a million customers in New Jersey’s Monmouth, Ocean, Morris, Middlesex and Burlington counties.
  • NJR Clean Energy Ventures invests in, owns and operates solar projects with a total capacity of more than 350 megawatts, providing residential and commercial customers with low-carbon solutions.
  • NJR Energy Services manages a diversified portfolio of natural gas transportation and storage assets and provides physical natural gas services and customized energy solutions to its customers across North America.
  • NJR Midstream serves customers from local distributors and producers to electric generators and wholesale marketers through its ownership of Leaf River Energy Center and the Adelphia Gateway Pipeline Project, as well as our 50 percent equity ownership in the Steckman Ridge natural gas storage facility, and our 20 percent equity interest in the PennEast Pipeline Project.
  • NJR Home Services provides service contracts as well as heating, central air conditioning, water heaters, standby generators, solar and other indoor and outdoor comfort products to residential homes throughout New Jersey.

NJR and its more than 1,100 employees are committed to helping customers save energy and money by promoting conservation and encouraging efficiency through Conserve to Preserve® and initiatives such as The SAVEGREEN Project® and The Sunlight Advantage®. For more information about NJR: www.njresources.com.

Follow us on Twitter @NJNaturalGas.
“Like” us on facebook.com/NewJerseyNaturalGas.


Contacts

Media Contact:
Michael Kinney
732-938-1031
This email address is being protected from spambots. You need JavaScript enabled to view it.

Investor Contact:
Dennis Puma
732-938-1229
This email address is being protected from spambots. You need JavaScript enabled to view it.

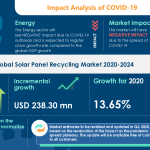
LONDON--(BUSINESS WIRE)--#GlobalSolarPanelRecyclingMarket--The solar panel recycling market is poised to grow by USD 238.30 million during 2020-2024, progressing at a CAGR of over 28% during the forecast period.


Worried about the impact of COVID-19 on your Business? Here is an Exclusive report talking about Market scenarios, Estimates, the impact of lockdown, and Customer Behaviour.

Get FREE Sample Report in Minutes!

The report on the solar panel recycling market provides a holistic update, market size and forecast, trends, growth drivers, and challenges, as well as vendor analysis.

The report offers an up-to-date analysis regarding the current global market scenario and the overall market environment. The market is driven by growth in solar PV panel installation.

The solar panel recycling market analysis includes product segment and geography landscape. This study identifies the growth in solar panel recycling R&D activities as one of the prime reasons driving the solar panel recycling market growth during the next few years.

This report presents a detailed picture of the market by the way of study, synthesis, and summation of data from multiple sources by an analysis of key parameters.

The solar panel recycling market covers the following areas:

Solar Panel Recycling Market Sizing

Solar Panel Recycling Market Forecast

Solar Panel Recycling Market Analysis

Companies Mentioned

  • Canadian Solar Inc.
  • Dynamic Lifecycle Innovations
  • EIKI SHOJI Co. Ltd.
  • ENVARIS GmbH
  • First Solar Inc.
  • Reiling GmbH & Co. KG
  • REMA System
  • Rinovasol Global Services BV
  • Targray Technology International Inc.
  • VEOLIA ENVIRONNEMENT SA 

Related Reports on Energy Include:

Global Single Axis Solar PV Tracker Market: The single axis solar PV tracker market size will likely grow by 76.78 GW during 2020-2024, and the market’s growth momentum will decelerate during the forecast period because of the decline in year-over-year growth. To get extensive research insights: Click and Get FREE Sample Report in Minutes!

Global Building Integrated Photovoltaics Market: The building integrated photovoltaics market size will grow at a CAGR of 17% at an incremental growth of USD 10.67 billion during 2020-2024. To get extensive research insights: Click and Get FREE Sample Report in Minutes!

Key Topics Covered:

Executive Summary

Market Landscape

  • Market ecosystem
  • Value chain analysis

Market Sizing

  • Market definition
  • Market segment analysis
  • Market size 2019
  • Market outlook: Forecast for 2019 - 2024

Five Forces Analysis

  • Five force summary
  • Bargaining power of buyers
  • Bargaining power of suppliers
  • Threat of new entrants
  • Threat of substitutes
  • Threat of rivalry
  • Market condition

Market Segmentation by Product

  • Market segments
  • Comparison by Product
  • Crystalline - Market size and forecast 2019-2024
  • Thin-film - Market size and forecast 2019-2024
  • Market opportunity by Product

Customer landscape

Geographic Landscape

  • Geographic segmentation
  • Geographic comparison
  • Europe - Market size and forecast 2019-2024
  • APAC - Market size and forecast 2019-2024
  • North America - Market size and forecast 2019-2024
  • MEA - Market size and forecast 2019-2024
  • South America - Market size and forecast 2019-2024
  • Key leading countries
  • Market opportunity by geography
  • Market drivers
  • Market challenges
  • Market trends

Vendor Landscape

  • Vendor landscape
  • Landscape disruption

Vendor Analysis

  • Vendors covered
  • Market positioning of vendors
  • Canadian Solar Inc.
  • Dynamic Lifecycle Innovations
  • EIKI SHOJI Co. Ltd.
  • ENVARIS GmbH
  • First Solar Inc.
  • Reiling GmbH & Co. KG
  • REMA System
  • Rinovasol Global Services BV
  • Targray Technology International Inc.
  • VEOLIA ENVIRONNEMENT SA

Appendix

  • Scope of the report
  • Currency conversion rates for US$
  • Research methodology
  • List of abbreviations

Technavio suggests three forecast scenarios (optimistic, probable, and pessimistic) considering the impact of COVID-19. Technavio’s in-depth research has direct and indirect COVID-19 impacted market research reports.

Register for a free trial today and gain instant access to 17,000+ market research reports.

Technavio's SUBSCRIPTION platform

About Us

Technavio is a leading global technology research and advisory company. Their research and analysis focuses on emerging market trends and provides actionable insights to help businesses identify market opportunities and develop effective strategies to optimize their market positions. With over 500 specialized analysts, Technavio’s report library consists of more than 17,000 reports and counting, covering 800 technologies, spanning across 50 countries. Their client base consists of enterprises of all sizes, including more than 100 Fortune 500 companies. This growing client base relies on Technavio’s comprehensive coverage, extensive research, and actionable market insights to identify opportunities in existing and potential markets and assess their competitive positions within changing market scenarios.


Contacts

Technavio Research
Jesse Maida
Media & Marketing Executive
US: +1 844 364 1100
UK: +44 203 893 3200
Email: This email address is being protected from spambots. You need JavaScript enabled to view it.
Website: www.technavio.com/

DUBLIN--(BUSINESS WIRE)--The "Emergency Shutdown Systems Market - Growth, Trends, and Forecasts (2020-2025)" report has been added to ResearchAndMarkets.com's offering.


The global emergency shutdown systems market was valued at USD 1.42 billion in 2019 and is expected to reach a value of USD 2.57 billion by 2025 registering a CAGR of 9.29% during the forecast period (2020 - 2025).

These systems are highly deployed in the oil and gas industry, general manufacturing processes, power generating sector, and several other industries. Out of all the end-users, the oil and gas industry is the largest source of demand for emergency shutdown systems.

Companies Mentioned

  • ABB Limited
  • Emerson Electric Company
  • General Electric Co.
  • Hima Paul Hildebrandt GmbH
  • Honeywell International Inc,
  • Omron Corporation
  • Proserv Ingenious Simplicity
  • Rockwell Automation, Inc.
  • Schneider Electric SE
  • Siemens AG
  • Yokogawa Electric Corporation
  • Wartsila Oyj Abp
  • Doedijns Group
  • Safoco Inc.
  • Winn-Marion Companies
  • National Oilwell Varco Inc.
  • Ruelco Inc.
  • BWB Controls Inc.
  • Bifold Group Ltd
  • Versa Products Company Inc.
  • Halliburton Company

Key Market Trends

Oil and Gas is Expected to Witness Significant Growth

Oil and gas is the largest sector for emergency shutdown systems globally. Recovering oil and gas prices and increasing upstream activity are expected to increase the demand for emergency shutdown systems, especially from offshore establishments. Demand for the ESD systems from upstream, midstream, and downstream (oil refineries) activities are taken into account under this segment.

  • Regulations like the Bureau of Safety and Environmental Enforcement (BSEE) which enforces safety and environmental protection regulations for offshore oil and natural gas industry in the United States are prevalent across other regions like Europe as well (Europe 4 and 5 standards).To minimize the risk of a major incident, pressure and temperature of the line are closely monitored and that is where the ESD system comes into play.
  • With new refinery projects anticipated across regions like India, which is expected to commission the largest green refinery in the world, the demand for the ESD systems is expected to increase over the forecast period. New upcoming oil and gas refinery projects to be commissioned between the timeframe of 2017-2023 across Norway, Denmark, Uzbekistan, Kuwait among others can be potential customers for the ESD systems.
  • With the US Department of the Interior planning to allow the offshore exploratory drilling in about 90% of the Outer Continental Shelf (OCS) acreage, under the National Outer Continental Shelf Oil and Gas Leasing Program (National OCS Program) planned for 2019-2024, the oil and gas sector in the region is also anticipated to offer new opportunities to the market.

Europe is Expected to Hold a Significant Market Share

Europe is one of the largest markets for emergency shutdown systems (ESD) in the world. Considerable activity in the downstream oil and gas sector and high industrial activity in the region is one of the most prominent drivers for the ESD systems market in Europe.

  • Europe is one of the most advanced and one of the largest crude oil refiners in the world. As of 2017, the region is responsible for 15% of the global oil refining capacity. The low crude oil situation in the recent past has significantly increased the demand for the expansion of existing refineries and the inception of new projects.
  • Also, there has been a considerable exploration activity in countries like the United Kingdom that have led to key discoveries such as Glendronach (by Total). It is estimated that Glendronach is the fifth-largest conventional natural gas reserve discovery on the UK Continental Shelf, in the millennium.
  • The increased adoption of industrial control systems with advanced technologies across multiple end-user industries is also anticipated to encourage the adoption of the emergency shutdown systems among considerably large, small and medium enterprise across the region. Thus, the region is expected to provide business opportunities for the market players during the forecast period.

Key Topics Covered:

1 INTRODUCTION

2 RESEARCH METHODOLOGY

3 EXECUTIVE SUMMARY

4 MARKET DYNAMICS

4.1 Market Overview

4.2 Market Drivers

4.2.1 Stringent Regulatory Policies for Industrial Safety

4.2.2 Growing Large-scale Production Projects due to Expansion of Oil and Gas Industry

4.3 Market Restraints

4.3.1 High Initial and Maintenance Costs

4.4 Industry Value Chain Analysis

4.5 Industry Attractiveness Porters Five Force Analysis

4.6 Technology Snapshot

5 MARKET SEGMENTATION

5.1 By Control Method

5.1.1 Electrical

5.1.2 Fiber Optic

5.1.3 Pneumatic

5.1.4 Hydraulic

5.1.5 Other Control Methods

5.2 By End-user Vertical

5.2.1 Oil and Gas

5.2.2 Refining

5.2.3 Power Generation

5.2.4 Metal and Mining

5.2.5 Paper and Pulp

5.2.6 Other End-user Verticals

5.3 Geography

5.3.1 North America

5.3.2 Europe

5.3.3 Asia-Pacific

5.3.4 Latin America

5.3.5 Middle East & Africa

6 COMPETITIVE LANDSCAPE

6.1 Company Profiles

7 INVESTMENT OPPORTUNITIES

8 MARKET OPPORTUNITIES AND FUTURE TRENDS

For more information about this report visit https://www.researchandmarkets.com/r/jlurs6


Contacts

ResearchAndMarkets.com
Laura Wood, Senior Press Manager
This email address is being protected from spambots. You need JavaScript enabled to view it.

For E.S.T Office Hours Call 1-917-300-0470
For U.S./CAN Toll Free Call 1-800-526-8630
For GMT Office Hours Call +353-1-416-8900

VALLEY FORGE, Pa.--(BUSINESS WIRE)--UGI Corporation (NYSE: UGI) announced today that its subsidiary, UGI Energy Services, LLC, entered into definitive agreements to invest in New Energy One HoldCo LLC, which is part of the team developing a utility-scale renewable natural gas (“RNG”) project in Idaho.


The Idaho RNG project is being developed jointly by Sevana Bioenergy, LLC (“Sevana”), an affiliate of New Energy One HoldCo LLC, and Meridiam, a leading global independent investment Benefit Corporation and asset manager of sustainable public infrastructure. The Idaho project, currently generating renewable electricity, is expected to produce several hundred million cubic feet of RNG each year from on-site dairy waste feedstock once it is expanded to reach full production in 2022; initial RNG production is expected to commence in late 2021.

Sevana, based in Larkspur, California, develops, designs, owns and operates large-scale anaerobic digestion projects which produce RNG and organic based soil amendments. Using state-of-the-art technology, engineering, and design, they are a market leader of RNG production in the United States. Biogas projects reduce waste and long-term greenhouse gas emissions, while also increasing the use of renewable energy.

Earlier this year, UGI announced its acquisition of GHI Energy, LLC, an RNG marketing business based in Houston, Texas. As part of its announcement of that acquisition, UGI outlined how that investment would provide a platform for growth in other RNG projects. UGI’s investment in the Idaho project reinforces UGI’s commitment to the development of RNG and sustainable energy. Additionally, the investment in the Idaho project reinforces the company’s existing greenhouse gas emission reduction strategies highlighted in UGI’s recently published environmental, social and governance report titled “Today’s Energy, Tomorrow’s World” and provides a platform to further advance our efforts.

“Sevana’s team believes in building value for all the stakeholders in our projects,” said John McKinney, Sevana’s President. “We are pleased to be working with such great partners in developing renewable natural gas projects. UGI brings a unique and complementary set of capabilities to this project.”

“For over 135 years, UGI has focused on providing safe, reliable service to its customers and to the many communities it serves,” said Robert F. Beard, UGI’s Executive Vice President - Natural Gas. “We are excited about the partnership we have developed with both Sevana and its associated investment holding company. Adding the Idaho investment to our portfolio further advances UGI’s commitment to the development of sustainable fuels for the future and we are looking forward to making incremental investments in this sector,” Beard concluded.

“The Idaho project advances our strategy positioning UGI as a leading provider of energy solutions that meet the environmental and social needs of our customers and our communities,” said John Walsh, President and CEO - UGI Corporation. “We’re pleased with our progress on RNG as well as our good success with our Bio-LPG product in Europe and we look forward to expanding our portfolio of renewable offerings. UGI is committed to be a leader in this area of critical importance to our company and our environment.”

About UGI Corporation

UGI Corporation is a distributor and marketer of energy products and services. Through subsidiaries, UGI operates natural gas and electric utilities in Pennsylvania, distributes LPG both domestically (through AmeriGas) and internationally (through UGI International), manages midstream energy assets in Pennsylvania, Ohio, and West Virginia and electric generation assets in Pennsylvania, and engages in energy marketing, including renewable natural gas in the Mid-Atlantic region of the United States, California, and the District of Columbia and internationally in France, Belgium, the Netherlands and the UK.

Comprehensive information about UGI Corporation is available on the Internet at https://www.ugicorp.com.

About Meridiam

Meridiam was founded in 2005 by Thierry Déau, with the belief that the alignment of interests between the public and private sector can provide critical solutions to the collective needs of communities. Meridiam is an independent investment Benefit Corporation under French law and an asset manager. The firm specializes in the development, financing, and long-term management of sustainable public infrastructure in three core sectors: mobility, energy transition and environment, and social infrastructure. With offices in, Addis Ababa, Amman, Dakar, Istanbul, New York, Luxembourg, Paris, Toronto and Vienna, Meridiam currently manages US$8 billion and more than 80 projects and assets to date. Meridiam is certified ISO 9001: 2015, Advanced Sustainability Rating by VigeoEiris and applies a proprietary methodology in relation to ESG and impact based on United Nations’ Sustainable Development Goals (SDGs).


Contacts

Investor Relations
610-337-1000
Brendan Heck, ext. 6608
Alanna Zahora, ext. 1004
Shelly Oates, ext. 3202

Agreements establish a path to Tantalus’ TSX-V listing

NORWALK, Conn.--(BUSINESS WIRE)--#smartgrid--Smart grid technology leader Tantalus Systems today announced it has entered into a definitive agreement to merge with RiseTech Capital Corp., a TSX Venture Exchange-listed capital pool company, and also that it closed on a concurrent financing to bolster the company’s balance sheet in order to support and accelerate several strategic growth initiatives as well as for general working capital purposes. Following the closing of the merger, Tantalus’ board and management team will remain in place and lead the combined company, which will continue to focus on delivering innovative smart grid solutions to electric, water and gas utilities. Upon receiving the necessary approvals for listing from the TSX Venture Exchange, Tantalus will gain increased access to the capital markets as a publicly traded company.


“When RiseTech Capital entered into a letter of intent with Tantalus on September 8, 2020, we sought to partner with the experienced leadership team at Tantalus to accelerate the growth of this purpose-driven, innovative technology company,” said Manny Padda, CEO of RiseTech Capital. “In entering into definitive agreements today and securing additional capital, we believe that Tantalus is well-positioned to leverage its industry proven solutions and become a market leader in helping utilities prepare for the transformation of distribution grids across North America and beyond. Our shareholders are extremely excited to have the opportunity to support them in their mission.”

In parallel, Tantalus also announced the closing of a financing in the amount of approximately CAD$8.8 million through a private placement of subscription receipts that will ultimately be exchanged for shares of the publicly-traded company. The financing, led by Canaccord Genuity and Cormark Securities, as Joint Book Runners, and PI Financial, included contributions from several institutional technology funds and retail investors. In announcing both events, Tantalus and RiseTech will submit a Filing Statement to the TSX-Venture Exchange to seek approval for the public listing of the combined entity.

“On behalf of our Board of Directors, shareholders, employees, utility users and partners, our management team is extremely excited to take this pivotal next step in the evolution of Tantalus. This milestone marks the continued success resulting from our unwavering purpose to deliver mission-critical solutions to public power and electric cooperative utilities,” said Peter Londa, President & CEO of Tantalus Systems. “As we seek to help communities prepare for the future where technological, environmental and behavioral developments impact the needs and expectations of consumers, we believe this transaction will position our company to remain a long-term partner to the utilities we serve. Tantalus plans to be at the epicenter of empowering our utilities to transform their distribution grids, engage with their customers and members, utilize granular data to enhance their operations, quickly respond to unexpected events and proactively support the communities they serve.”

About Tantalus

Over the past three decades, Tantalus has consistently and creatively delivered mission-critical technology solutions that enhance the safety, security, reliability and efficiency of public power and electric cooperative utilities across North America and the Caribbean Basin. By leveraging technology, Tantalus empowers utilities to transform their distribution grids from systems designed to support one-way power flow into a connected network of devices capable of supporting multi-directional power flow from solar panels, distributed storage and electric vehicles. The solutions and tools delivered by Tantalus enable utilities to also engage proactively with their customers and members, to be more responsive and reliable, pinpoint where to make capital investments to improve the resiliency of their grids, and generate cost savings by streamlining system operations. Tantalus’ comprehensive suite of smart grid solutions includes advanced metering infrastructure, demand-management technologies, data analytics, distribution automation and street lighting control systems - a broad portfolio built purposefully to support smart community initiatives essential to both the near-term and long-term success of the utilities Tantalus supports and the communities they serve.

This news release includes information, statements, beliefs and opinions which are forward-looking, and which reflect current estimates, expectations and projections about future events, including, but not limited to, the completion of the merger with RiseTech Capital Corp. and gaining increased access to capital markets and other statements that contain words such as “believe,” “expect,” “project,” “should,” “seek,” “anticipate,” “will,” “intend,” “positioned,” “risk,” “plan,” “may,” “estimate” or, in each case, their negative and words of similar meaning. By its nature, forward-looking information involves a number of risks, uncertainties and assumptions that could cause actual results or events to differ materially from those expressed or implied by the forward-looking information. These risks, uncertainties and assumptions could adversely affect the outcome and financial effects of the plans and events described herein. Readers should not place undue reliance on forward-looking information, which is based on the information available as of the date of this news release and Tantalus disclaims any intention or obligation to update or revise any forward-looking information contained in this new release, whether as a result of new information, future events or otherwise, unless required by applicable law. The forward-looking information included in this new release is expressly qualified in its entirety by this cautionary statement.


Contacts

Jacquie Hudson
Marketing Communications Manager
Tantalus Systems Inc.
613-552-4244 | This email address is being protected from spambots. You need JavaScript enabled to view it.
W: www.tantalus.com
Twitter: @TantalusCorp

U.S. Department of Energy funded project aims to develop more cost effective and sustainable drivetrain for electric vehicles utilizing Niron’s Clean Earth Magnet™ technology


MINNEAPOLIS--(BUSINESS WIRE)--Niron Magnetics, the company that has developed the world’s first advanced manufacturing process for the mass production of high performance, rare-earth free permanent magnets, today announced a partnership with Marquette University and General Motors to develop the next generation of electric vehicle drivetrains through a $5 million grant from the Department of Energy.

Demand for electric and hybrid vehicles continues to grow and new forecasts predict that they will account for an estimated 30% of all vehicle sales by 2025. However, the drivetrains traditionally utilized in EV and HV designs are powered by rare-earth materials, which are predicted to experience a shortage by 2030, hindering long-term growth potential.

Dr. Ayman El-Refaie, Werner Endowed Chair in Secure/Sustainable Energy and professor of electrical and computer engineering at Marquette University will serve as the lead on the three-year DOE Vehicle Technologies Office project that seeks to meet and even exceed the DOE targets around metrics such as max torque, power, speed current and bus voltage as demand for electric vehicles continues to grow, without the use of rare earths.

“We are very excited about teaming with Niron Magnetics on this project and see their Iron Nitride permanent magnets as a key enabling technology to achieve our project objectives,” said Dr. El-Refaie. “Beyond this project, Niron’s technology will help achieve higher performance in electrical machines over a broad range of applications. We are very much looking forward to working with their team.”

The proposed design incorporates high performance Iron Nitride (FeN) magnets that the team at Niron will be developing. Niron’s Clean Earth Magnet technology does not utilize any rare earth elements and offers several major advantages over traditional magnets, including higher magnetic field strength, enhanced temperature stability, and lower cost input materials and manufacturing. Niron’s magnets have a higher magnetic flux density than conventional Ferrite and NdFeB-based magnets, enabling size and weight reduction in motors without compromising power or torque, which will be critical to meet DOE targets around cost and efficiency.

“This collaboration, along with the other vehicle technology innovation projects funded by the DOE will help shape the future of the transportation sector and increase access to more sustainable options for consumers,” said Frank Johnson, Ph.D., CTO, Niron. “Professor El-Refaie and his team understand the potential our technology has to unlock new possibilities in power generation without the use of rare earths, ensuring that electrics motors of the future are not only more cost effective, but sustainable.”

The project is funded by the Vehicle Technologies Office of the Department of Energy. The National Renewable Energy Laboratory and Virginia Polytechnic Institute and State University are also partnering on the project. To learn more about the $139 million in federal funding from the DOE to advance innovative vehicle technologies, and the other related projects, please visit the Department of Energy’s website.

To learn more about Niron Magnetics and its Clean Earth Magnet™ technology, please visit https://nironmagnetics.com/.

About Niron Magnetics
Niron Magnetics is developing the world’s first advanced manufacturing process for the mass production of permanent magnets powered by its breakthrough material formulation. Niron’s proprietary Iron nitride magnets possess inherently higher magnetization and can be produced at a lower cost compared to today’s rare-earth magnets and will enable a revolution in the design of new electric motors and generators. For more information, please visit https://nironmagnetics.com/.


Contacts

Kalyn Schieffer
This email address is being protected from spambots. You need JavaScript enabled to view it.

RICHARDSON, Texas--(BUSINESS WIRE)--EPCOR USA Inc. (EPCOR USA) today announces the expansion of its partnership with VertexOne, a leading provider of meter-to-cash solutions for utilities across North America. EPCOR USA enters into this new contract to collaborate with VertexOne on a portfolio of solutions over the coming decades. This collaboration supports EPCOR USA‘s continued evolution and modernization to meet changing customer expectations and utility needs.


Under this new contract, EPCOR USA will embark upon a modernization strategy that includes the following VertexOne solutions: VertexOne CIS Essentials™, VertexOne vxField™, VertexOne MeterSmart™, VertexOne WaterSmart™, VertexOne GasSmart™ and enhanced electronic bill presentment and payments. “VertexOne is thrilled to continue this partnership with EPCOR USA as we work alongside their team to upgrade and refine their systems,” said VertexOne President and CEO Andrew Jornod. “This project builds upon our seven-year partnership and extends it past 2030 so we can continue to support EPCOR in meeting their long-term goals.”

EPCOR will be upgrading its current systems to the latest and most modern offerings available with VertexOne to drive success in a variety of areas:

  • Customer Service: EPCOR USA’s 226,000 regulated water, wastewater and natural gas customers will enjoy modern customer self-serve functionality that improves the customers’ experience and is adaptable to changing customer needs
  • Business Processes: EPCOR USA will enhance business processes by adopting industry-leading best practices and technology to deliver integrated customer service in an efficient and effective manner.
  • Digital Transformation: Utility staff and end-customers will have access to the best digital solutions for customer engagement, billing, payments, and data analytics.
  • Optimized Field Work: With VertexOne Field™, dispatchers and field technicians will be better aligned, old paper-based systems will be automated and scheduling of work assignments will be optimized.

“EPCOR is excited to continue our work with the VertexOne team and launch expanded solutions for our customers. We pride ourselves on staying ahead of the game with the latest and greatest technology solutions to provide the best experience for our staff and customers and have been very impressed with VertexOne’s ability to offer just that,” says Sarah Skaggs, Director of Customer Care. “For the past seven years, VertexOne has gone above and beyond to provide excellent service and support. Their team truly serves as an extension of our internal team and continue to demonstrate aligned objectives and dedication to our success.”

"This project will allow for the evolution and transformation of our business practices and will serve as a model for best-practices for utilities across the country. It will result in a flexible and user-centric set of systems that improves internal and external services through more efficient processes,” continues Skaggs.

As part of the program, EPCOR USA will also serve as a premier development partner for VertexOne GasSmart™, a customer engagement and data analytics platform designed to surface actionable insights and valuable recommendations for gas customers. “We look forward to bringing these best-in-class technologies to EPCOR USA and help them achieve impressive results and elevate both utility staff and end-customer experiences,” shares Jornod.

About EPCOR USA

Headquartered in Phoenix, Arizona, EPCOR USA’s wholly owned subsidiaries build, own and operate water and wastewater and natural gas facilities and infrastructure in the southwestern United States. EPCOR USA provides water, wastewater, wholesale water and natural gas services to approximately 670,000 people across 39 communities and 15 counties in Arizona, New Mexico and Texas. Visit www.epcor.com for more.

About VertexOne

VertexOne is the recognized leader in SaaS platforms for critical business processes of utilities across North America. Through a wide range of innovative services and solutions—including the VertexOne Complete™ SaaS Solution for Utilities comprised of the Customer Information System (CIS), Mobile Workforce Management (MWM), Meter Data Management (MDM), Digital Customer Engagement and Customer Self Service, and now the addition of WaterSmart solutions and services—VertexOne helps utilities more efficiently deliver a compelling customer experience; reducing the cost to serve customers, increasing operational efficiency, improving customer satisfaction, and driving utility operations forward. VertexOne takes on the heavy lifting of keeping current with the rapid pace of technology changes through our VertexOne Complete™ SaaS offering, so utilities don't have to—leaving our customers more time to focus on core utility business while leaving the technology to us. For more information, visit https://www.vertexone.net.


Contacts

Ali Barsamian
This email address is being protected from spambots. You need JavaScript enabled to view it.
925-451-1767

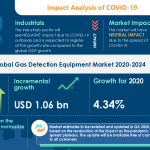
LONDON--(BUSINESS WIRE)--#GasDetectionEquipmentMarket--The gas detection equipment market is expected to grow by USD 1.06 billion, progressing at a CAGR of over 5% during the forecast period.


Click & Get Free Sample Report in Minutes

The growing production volume of shale gas is one of the major factors propelling market growth. However, factors such as technical challenges in the production of gas detectors will hamper the market growth.

More details: https://www.technavio.com/report/gas-detection-equipment-market-industry-analysis

Gas Detection Equipment Market: Product Landscape

Fixed gas detection equipment is mostly adopted in large facilities and is configured using relays and customizable alarm point settings, primarily to ensure that the detectors instantly respond to atmospheric hazards. The demand for fixed detectors is expected to grow, especially from two user end-user segments, which are industrial and commercial sectors due to an increasing number of industries including chemical, petrochemical, textile, food, and biotechnology. These industries require continuous monitoring of gas emissions in areas, including production units, laboratories, and other places. Therefore, the gas detection equipment market share growth by the fixed segment will be significant during the forecast period.

Gas Detection Equipment Market: Geographic Landscape

APAC was the largest gas detection equipment market in 2019, and the region will offer several growth opportunities to market vendors during the forecast period. Factors such as the growing sales of automobiles, thereby increasing the demand for diesel and petrol, will significantly drive gas detection equipment market growth in this region over the forecast period. 35% of the market’s growth will originate from APAC during the forecast period. China and India are the key markets for gas detection equipment in APAC. Market growth in this region will be faster than the growth of the market in other regions.

Buy 1 Technavio report and get the second for 50% off. Buy 2 Technavio reports and get the third for free.

View market snapshot before purchasing

Related Reports on Industrials Include:

Global Explosive Detection Equipment Market: The explosive detection equipment market size has the potential to grow by USD 2.72 billion during 2020-2024, and the market’s growth momentum will accelerate during the forecast period. To get extensive research insights: Click and Get FREE Sample Report in Minutes!

Global Marine Loading Arms Market: The marine loading arms market size has the potential to grow by USD 31.56 million during 2020-2024, and the market’s growth momentum will accelerate during the forecast period. To get extensive research insights: Click and Get FREE Sample Report in Minutes!

Companies Covered:

  • 3M Co.
  • Dragerwerk AG & Co. KGaA
  • Emerson Electric Co.
  • General Electric Co.
  • Honeywell International Inc.
  • MSA Safety Inc.
  • RAE Systems Inc.
  • Robert Bosch GmbH
  • Siemens AG
  • United Technologies Corp.

What our reports offer:

  • Market share assessments for the regional and country-level segments
  • Strategic recommendations for the new entrants
  • Covers market data for 2019, 2020, until 2024
  • Market trends (drivers, opportunities, threats, challenges, investment opportunities, and recommendations)
  • Strategic recommendations in key business segments based on the market estimations
  • Competitive landscaping mapping the key common trends
  • Company profiling with detailed strategies, financials, and recent developments
  • Supply chain trends mapping the latest technological advancements

Technavio suggests three forecast scenarios (optimistic, probable, and pessimistic) considering the impact of COVID-19. Technavio’s in-depth research has direct and indirect COVID-19 impacted market research reports.

Register for a free trial today and gain instant access to 17,000+ market research reports.

Technavio's SUBSCRIPTION platform

Key Topics Covered:

Executive Summary

Market Landscape

  • Market ecosystem
  • Value chain analysis

Market Sizing

  • Market definition
  • Market segment analysis
  • Market size 2019
  • Market outlook: Forecast for 2019 - 2024

Five Forces Analysis

  • Five Forces Analysis
  • Bargaining power of buyers
  • Bargaining power of suppliers
  • Threat of new entrants
  • Threat of substitutes
  • Threat of rivalry
  • Market condition

Market Segmentation by Product

  • Market segments
  • Comparison by Product
  • Fixed - Market size and forecast 2019-2024
  • Portable - Market size and forecast 2019-2024
  • Market opportunity by Product

Market Segmentation by Application

  • Market segments
  • Comparison by Application
  • Industrial - Market size and forecast 2019-2024
  • Commercial - Market size and forecast 2019-2024
  • Residential - Market size and forecast 2019-2024
  • Market opportunity by Application

Customer Landscape

Geographic Landscape

  • Geographic segmentation
  • Geographic comparison
  • APAC - Market size and forecast 2019-2024
  • North America - Market size and forecast 2019-2024
  • Europe - Market size and forecast 2019-2024
  • MEA - Market size and forecast 2019-2024
  • South America - Market size and forecast 2019-2024
  • Key leading countries
  • Market opportunity by geography
  • Volume driver- Demand led growth
  • Market challenges
  • Market trends

Vendor Landscape

  • Vendor landscape
  • Landscape disruption

Vendor Analysis

  • Vendors covered
  • Market positioning of vendors
  • 3M Co.
  • Dragerwerk AG & Co. KGaA
  • Emerson Electric Co.
  • General Electric Co.
  • Honeywell International Inc.
  • MSA Safety Inc.
  • RAE Systems Inc.
  • Robert Bosch GmbH
  • Siemens AG
  • United Technologies Corp.

Appendix

  • Scope of the report
  • Currency conversion rates for US$
  • Research methodology
  • List of abbreviations

About Us

Technavio is a leading global technology research and advisory company. Their research and analysis focuses on emerging market trends and provides actionable insights to help businesses identify market opportunities and develop effective strategies to optimize their market positions. With over 500 specialized analysts, Technavio’s report library consists of more than 17,000 reports and counting, covering 800 technologies, spanning across 50 countries. Their client base consists of enterprises of all sizes, including more than 100 Fortune 500 companies. This growing client base relies on Technavio’s comprehensive coverage, extensive research, and actionable market insights to identify opportunities in existing and potential markets and assess their competitive positions within changing market scenarios.


Contacts

Technavio Research
Jesse Maida
Media & Marketing Executive
US: +1 844 364 1100
UK: +44 203 893 3200
Email: This email address is being protected from spambots. You need JavaScript enabled to view it.
Website: www.technavio.com/

Trading of New Common Stock to Commence on NYSE American under Ticker “FTSI” on November 20, 2020

FORT WORTH, Texas--(BUSINESS WIRE)--FTS International, Inc. (NYSE American: FTSI) (“FTSI” or the “Company”) today announced that it has successfully completed its fully consensual financial restructuring and has emerged from Chapter 11.


Michael Doss, Chief Executive Officer, commented, “Today is an important day for FTSI. We have quickly and efficiently completed our financial restructuring and emerge with sufficient cash and revolving credit capacity to deploy stacked fleets, invest in new technology, rebuild working capital and create long-term value for our stakeholders.”

“FTSI is a leader in the pressure pumping space and with the entire organization focused on enhancing the value proposition to our customers, we will continue to set records in operational performance and attract new customer relationships. Our team and our pressure pumping fleet are well-positioned to quickly take advantage of increased customer demand as the world returns to a more normalized environment. I would like to express my gratitude to all of our employees for their dedication during this process, and thank our customers, vendors, and service providers for their continued cooperation and support.”

“The new owners, which include Amundi Pioneer Asset Management, Glendon Capital Management, Wexford Capital, and the Wilks Brothers, have deep industry experience, and understand the value of FTSI and the proposition to our customers and the industry,” continued Mr. Doss. “We expect them to be active partners, who are strongly committed to supporting our company. The proactive transaction agreed to by our equity and debt holders enhances value for all stakeholders and solidifies the company’s prospects for the future—I am proud that FTSI now has one of the cleanest balance sheets of any public, pure-play pressure pumping company.”

As previously announced, the U.S. Bankruptcy Court for the Southern District of Texas, Houston Division confirmed FTSI’s prepackaged plan of reorganization (the “Confirmed Plan”) on November 4, 2020. Pursuant to the Confirmed Plan, FTSI deleveraged its balance sheet by equitizing all prepetition funded debt, resulting in holders of FTSI’s legacy senior notes and term loan collectively holding over 90% of FTSI’s new common stock. Holders of FTSI’s legacy equity interests received approximately 9.4% of FTSI’s new common stock under the Confirmed Plan.

Upon emergence, FTSI expects to have approximately $90 million cash on hand and has entered into a new $40 million asset-based revolving credit facility with Wells Fargo Bank, N.A., as administrative agent and lender, to support working capital needs.

Issuance of Equity and Listing on the NYSE American

In connection with emergence from Chapter 11, all of the Company’s existing equity interests will be cancelled and will cease to exist, effective before the market opens on November 20, 2020. At emergence, approximately 13,687,620 shares of new Class A common stock are outstanding, with 49 million shares authorized at emergence. Shares of the Company’s new Class A common stock will commence trading on the NYSE American under the ticker symbol “FTSI” on November 20, 2020. Additionally, at emergence, approximately 312,306 shares of the Company’s new Class B common stock are outstanding, with 1 million shares of Class B common stock authorized at emergence. Shares of the Company’s new Class B common stock are identical to the shares of the Company’s new Class A common stock, except that such shares will not be listed on any stock exchange.

In addition, 1,555,521 Tranche 1 Warrants exercisable for one share of Class A common stock per Tranche 1 Warrant were issued at emergence at an initial exercise price of $33.04, expiring on November 19, 2023 and 3,888,849 Tranche 2 Warrants exercisable for one share of Class A common stock per Tranche 2 Warrant were issued at emergence at an initial exercise price of $37.14, expiring on November 19, 2023.

Details of the restructuring, the securities issued pursuant to the Confirmed Plan and the debt and other agreements entered into as part of the Plan will be provided in a Form 8-K which can be viewed on the Company’s website or the Securities and Exchange Commission’s (“SEC”) website at www.sec.gov.

Adoption of Rights Agreement

FTSI’s Board of Directors has also approved the adoption of a stockholder rights agreement (the “Rights Agreement”) and declared a dividend distribution of one right (“Right”) for each outstanding share of common stock (both Class A common stock and Class B common stock) outstanding as of the record date. The record date for such dividend distribution is November 30, 2020. The Rights expire, without any further action being required to be taken by FTSI’s Board of Directors, on November 18, 2021.

The adoption of the Rights Agreement is intended to enable all FTSI stockholders to realize the full potential value of their investment in the company and to protect the interests of the Company and its stockholders by reducing the likelihood that any person or group gains control of FTSI through acquisitions from other stockholders, open market accumulation or other tactics (especially in current volatile markets) without paying an appropriate control premium. In addition, the Rights Agreement provides the FTSI Board of Directors with time to make informed decisions that are in the best long-term interests of FTSI and its stockholders and does not deter the FTSI Board of Directors from considering any offer that is fair and otherwise in the best interest of FTSI stockholders. Under the Rights Agreement, the rights generally would become exercisable only if a person or group acquires beneficial ownership of 20% or more of FTSI common stock in a transaction not approved by the FTSI Board of Directors.

Further details of the Rights Agreement will be contained in a Current Report on Form 8-K and in a Registration Statement on Form 8-A that FTSI will be filing with the SEC. These filings will be available on the SEC’s web site at www.sec.gov.

Kirkland & Ellis LLP and Winston & Strawn LLP acted as legal advisors, Lazard Frères & Co, acted as financial advisor, and Alvarez & Marsal North America, LLC acted as restructuring advisor to the Company. Davis Polk & Wardwell LLP acted as legal advisor, and Ducera Partners, LLC and Silver Foundry, LP acted as financial advisor for the ad hoc group of secured noteholders. Stroock & Stroock & Lavan LLP acted as legal counsel to the ad hoc group of term loan lenders.

Court filings and other documents related to the restructuring are available on a separate website administered by the Company’s claims agent, Epiq, at https://dm.epiq11.com/FTSI. For inquiries regarding the Company’s emergence, please call the hotline established by Epiq at (888) 490-0882 (toll-free in the United States and Canada) or (503) 597-5602 (outside the United States).

About FTS International, Inc.

Headquartered in Fort Worth, Texas, FTSI is an independent hydraulic fracturing service company and one of the only vertically integrated service providers of its kind in North America.

To learn more, visit www.FTSI.com

Forward-Looking Statements

This news release contains statements that we believe to be “forward-looking statements” within the meaning of Section 27A of the Securities Act of 1933 and Section 21E of the Securities Exchange Act of 1934. All statements other than historical facts, including, without limitation, statements regarding our future financial position, business strategy, projected revenues, earnings, costs, capital expenditures and debt levels, and plans and objectives of management for future operations, are forward-looking statements. When used in this news release, words such as we “expect,” “intend,” “plan,” “estimate,” “anticipate,” “believe” or “should” or the negative thereof or variations thereon or similar terminology are generally intended to identify forward-looking statements. Such forward-looking statements are subject to risks and uncertainties that could cause actual results to differ materially from those expressed in, or implied by, such statements.

These risks and uncertainties include, but are not limited to: the effects of the Chapter 11 petitions (the “Chapter 11 Cases”) the effects of the Chapter 11 Cases on the Company’s liquidity or results of operations or business prospects; the effects of the Chapter 11 Cases on the Company’s business and the interests of various constituents; further declines in domestic spending by the onshore oil and natural gas industry; continued volatility in oil and natural gas prices; the effect of a loss of, financial distress of, or decline in activity levels of, one or more significant customers; actions of the Organization of the Petroleum Exporting Countries, or OPEC, its members and other state-controlled oil companies relating to oil price and production controls; the Company’s inability to employ a sufficient number of key employees, technical personnel and other skilled or qualified workers; the price and availability of alternative fuels and energy sources; the discovery rates of new oil and natural gas reserves; the availability of water resources, suitable proppant and chemicals in sufficient quantities and pricing for use in hydraulic fracturing fluids; uncertainty in capital and commodities markets and the ability of oil and natural gas producers to raise equity capital and debt financing; potential securities litigation and other litigation and legal proceedings, including arbitration proceedings; the Company’s ability to participate in consolidation opportunities within its industry; the ability to successfully manage the economic and operational challenges associated with a disease outbreak, including epidemics, pandemics, or similar widespread public health concerns, including the COVID-19 pandemic; the ultimate geographic spread, duration and severity of the COVID-19 outbreak, and the effectiveness of actions taken, or actions that may be taken, by governmental authorities to contain such outbreak or treat its impact ; the ultimate duration and impact of geopolitical events that adversely affect the price of oil, including the Saudi-Russia price war earlier this year; and a deterioration in general economic conditions or a weakening of the broader energy industry. We assume no obligation, and disclaim any duty, to update the forward-looking statements in this news release.


Contacts

Lance Turner
Chief Financial Officer
817-862-2000

DUBLIN--(BUSINESS WIRE)--The "Low strength Proppants Market Research Report: By End Use (Shale Gas, Crude Oil, Coal-Bed Methane) - Global Industry Analysis and Demand Forecast to 2030" report has been added to ResearchAndMarkets.com's offering.


The major factors propelling the growth of the global low strength proppants market are the increasing exploration and production (E&P) activities in the North American nations and the soaring technological advancements being made in the crude oil recovery process. Due to these factors, the market is predicted to advance at a CAGR of 9.8% from 2020 to 2030 and generate a revenue of $5,294.8 million by 2030. Low strength proppants are extensively used in oil and gas E&P activities as they have the ability to drastically increase the flow of oil and gas.

Depending on end-use, the low strength proppants market is divided into coal-bed methane, shale gas, crude oil, and others. Out of these categories, the crude oil division is predicted to exhibit the fastest market growth in the coming years. This is ascribed to the fact that there are over 400 billion recoverable shale oil barrels across the U.S., the U.K., Russia, and Saudi Arabia, and the low strength proppants are widely required for exploring these reserves.

The oil and gas explorers in the U.S. are increasingly focusing on the extraction of shale gas. As per a report published by the U.S. Energy Information Administration (EIA), the total shale gas production in the country was found to be 75% of the total natural gas production across the country in 2019. Hence, with the ballooning production of shale gas in the country, the usage of low strength proppants will increase in shale gas exploration in the future years.

Globally, the North American low strength proppants market is predicted to demonstrate the highest growth in the upcoming years, mainly on account of the increasing investments being made by the major market players in the region. Additionally, the soaring natural gas and crude oil exports are tremendously boosting the utilization of low-density proppants in the region.

The major market players are rapidly expanding their operations across the globe in order to gain a foothold in the market. For example, in August 2018, Black Mountain Sand LLC, a leading market player, announced its plans of expanding its operations in Western Oklahoma's Mid Continent, that will have a production capacity of 3 million tons every year. The addition of this mine will increase the annual capacity of the company to more than 19 million tons, making it the largest in-basin sand providing organization in the U.S.

Similarly, Alpine Silica, another key market player, set up two new production plants in Van Horn, Texas and Fay, Oklahoma in June 2018. These new facilities increased the company's presence in the Permian basin. The company supplies frac sand to the oil and gas sector. This material is required in the oil and gas sector for enhancing the recovery rates. Due to these factors, the usage of low-density proppants will increase sharply in the U.S. in the forthcoming years.

Black Mountain Sand LLC, Hi-Crush Inc., Superior Silica Sands LLC (a subsidiary of Emerge Energy Services LP), Atlas Sand Company LLC, and U.S. Silica Holdings Inc. are some of the leading players in the low strength proppants market.

Market Dynamics

Drivers

  • Increasing E&P activities in North America
  • Increasing technological advancements for crude oil recovery
  • Impact analysis of drivers on market forecast

Restraints

  • Increasing concerns for fast paced depletion in fossil fuel reserves
  • Impact analysis of restraints on market forecast

Opportunities

  • Unexplored natural gas reserves in APAC

Companies Mentioned

  • Fairmount Santrol Holdings Inc.
  • Superior Silica Sands LLC
  • U.S. Silica Holdings Inc.
  • CARBO Ceramics Inc.
  • Badger Mining Corporation
  • Preferred Sands
  • Saint-Gobain Proppants Inc.
  • JSC "Borovichi Refractories Plant"
  • Black Mountain Sand LLC
  • Hi-Crush Inc.
  • Atlas Sand Company LLC
  • Wisconsin Proppants LLC
  • Gongyi Tianxiang Refractory Materials Co. Ltd.
  • TEXAS SILICA

For more information about this report visit https://www.researchandmarkets.com/r/4mdzgq


Contacts

ResearchAndMarkets.com
Laura Wood, Senior Press Manager
This email address is being protected from spambots. You need JavaScript enabled to view it.
For E.S.T Office Hours Call 1-917-300-0470
For U.S./CAN Toll Free Call 1-800-526-8630
For GMT Office Hours Call +353-1-416-8900

Can Provide New or Repowered Locomotives From 44 ft. to 68 ft Frame Length and Up to 2,200 Diesel Gallon Equivalents (DGE) of RNG for 7 to 10 Days from a Mobile Refueler or from Stationary Fueling

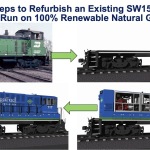
BEAUFORT, S.C.--(BUSINESS WIRE)--OptiFuel Systems (“OptiFuel”), a solution provider of zero emission rail, marine and generator products, is now taking orders for a new line of affordable 1,200 hp to 2,400 hp, 100% natural gas freight locomotives. All of the locomotives use OptiFuel’s proprietary, EPA rail certified engine (KOFSG11.9400), which feature 0.00 g-bhp/hr NOx and PM criteria emissions. Powered by 100% RNG/Biomethane, the locomotives can have energy-weighted carbon intensity (CI) value ratings that are 200 to 300% lower than even a 100% battery-electric locomotive powered by renewable energy such as solar or wind. OptiFuel certified rail engine is based on the Cummins ISX12N. Since 2016, the ISX12N onroad engine has been utilized in more than 12,000 Class 8 long-haul trucks. With OptiFuel’s multi-engine configuration and instant stop and start capability, the fleet owner can expect to reduce fuel consumption by 20% to 40%, compared to a standard single engine locomotive configuration.


OptiFuel is capable of refurbishing most of the standard switcher and road switcher families (SW, MP, GP, SD, U, B, C, etc.) and lengths from 44 ft to 68 ft with modular components. Multiple modular KOFSG11.9400 engine pods can be incorporated into the overall design of the locomotive to provide for 1,200, 1,600, 2,000, or 2,400 hp. Each engine pod can be replaced within 3 hours with a forklift or crane. Customers have a choice of two different modular electronic controls manufacturers – TMV or Medha – containing the locomotive controls and high-power traction system electronics. Depending on frame size, horsepower, size of onboard fuel storage system, and other options, the estimated cost for a completely refurbished locomotive is $1.7 to $2.4 million and a new locomotive is from $2 to $2.7 million. OptiFuel is also able to provide kits and assembly support, allowing the customer to provide preferred content in the final assembly of the locomotives. OptiFuel also has the ability to work with customers to arrange for leasing options, including dovetailing leases with grant funds, where permissible.

OptiFuel is providing a standard 5 year / 10,000 hours warranty for all engine pods, CNG onboard storage system, and locomotive controls. Total semi-annual and annual maintenance hours for each engine pod is 8 to 10 hours. Just as in onroad use, periods between locomotive engine overhaul are 18,750 to 25,000 hours with overhaul cost of around $20,000 per engine. All parts and supplies for the KOFSG11.9400, as well as the overhaul, can be purchased at any certified Cummins dealer or from OptiFuel. All CNG storage cylinders have a 20 years lifecycle, that may be extended to 30 years.

OptiFuel is providing a variety of mobile or fixed refueling options depending on the operating conditions of a customer’s fleet. Customers can rent or purchase mobile refueling equipment, or OptiFuel can manage the refueling for the customer. For those customers who refuel multiple locomotives from a single refueling site, OptiFuel will provide its proven locomotive CNG fueling station solution (Video Link: https://optifuelsystems.com/media) and expect the CNG to cost between $0.90 to $1.35 per DGE in most deployments. This is well below the 10-year average cost of $2.45 that the Class 1 railroads have paid for diesel. Customers can purchase the refueling station or OptiFuel will cover the cost of the station and manage the refueling for the customer for a fixed DGE cost.

In addition to switcher production, OptiFuel has a U.S. Department of Energy (DOE) grant to demonstrate a zero emission, 4,400 hp line-haul locomotive powered with renewable natural gas (RNG). This program will allow pre-production testing at AAR’s Transportation Technology Center, Inc. (TTCI) and will demonstrate in-service with a regional railroad to validate that OptiFuel’s low-risk, affordable technology can also be applied in the higher horsepower freight and passenger locomotive markets.

“We believe there is a need for locomotives that deliver value and cleaner, more economical solutions simultaneously to railroads, railroad customers, and urban and Environmental Justice communities,” said Scott Myers, President of OptiFuel. “Beyond Tier 5, EPA certified technology is available today. We think that in the next two years there will be a 50-state Low Carbon Fuel Standard (LCFS) program that includes rail and an extension of the existing federal Alternative Fuel Credit program to include rail. These programs, just as in trucking and aviation, will provide RNG to the railroads at a near zero cost and providing them the financial incentive to decarbonize their fleets over the next 15 years.”

About OptiFuel Systems:

OptiFuel is providing zero emissions products (NOx, PM, CO2) for decarbonizing rail, marine, and microgrid power applications with innovative, cost-efficient, and sustainable solutions utilizing advance gaseous fuels and Cummins hybrid power products. In 2021, OptiFuel will be introducing additional zero emissions solutions in the rail, marine and generator markets to replace diesel, powered with negative-carbon RNG.

More information can be learned at https://optifuelsystems.com/


Contacts

Scott D. Myers, OptiFuel Systems LLC - (339) 222-7575, This email address is being protected from spambots. You need JavaScript enabled to view it.

LONDON--(BUSINESS WIRE)--#covidrecovery--The Oil and Gas Specialty Maintenance Services Market is poised to experience spend growth of more than $ 9 billion between 2020-2024 at a CAGR of over 9.34%. The report also provides the market impact and new opportunities created due to the COVID-19 pandemic. Request free sample pages


Read the 120-page research report with TOC and LOE on "Oil And Gas Specialty Maintenance Services Market – Procurement Intelligence Report, Pricing Outlook in Geographies that include APAC, North America, South America, and MEA, and insights into best practices to optimize procurement spend."

SpendEdge's reports now include an in-depth complimentary analysis of the COVID-19 impact on procurement and the latest market data to help your company overcome sourcing challenges. Our Oil and Gas Specialty Maintenance Services Market procurement intelligence report offers actionable procurement intelligence insights, sourcing strategies, and action plans to mitigate risks arising out of the current pandemic situation. The insights offered by our reports will help procurement professionals streamline supply chain operations and gain insights into the best procurement practices to mitigate losses.

Information on Latest Trends and Supply Chain Market Information Knowledge centre on COVID-19 impact assessment

Insights into the Market Price Trends

  • Suppliers in this market have moderate bargaining power owing to moderate pressure from substitutes and a moderate level of threat from new entrants.
  • Buyers can benchmark their preferred pricing models for oil and gas specialty maintenance services Market, Procurement, Management with the wider industry information and identify the cost-saving potential.

Insights to help buyers identify and shortlist the most suitable suppliers for their Oil And Gas Specialty Maintenance Services Market requirements. This procurement report answers the following questions:

  • Am I engaging with the right suppliers?
  • Which KPIs should I use to evaluate my incumbent suppliers?
  • Which supplier selection criteria are relevant for?
  • What are the Oil And Gas Specialty Maintenance Services Market category essentials in terms of SLAs and RFx?

To get instant access to over 1000 market-ready procurement intelligence reports without any additional costs or commitment, Subscribe Now for Free.

Insights into strategies that will help buyers optimize their category management practices. The report answers the following questions:

  • What should be my strategic procurement objectives, activities, and enablers for the Oil And Gas Specialty Maintenance Services Market category?
  • What negotiation levers can I pull for cost-saving?
  • What are Oil And Gas Specialty Maintenance Services Market procurement best practices I should be promoting in my supply chain?

Some of the top Oil And Gas Specialty Maintenance Services Market suppliers enlisted in this report

This Oil And Gas Specialty Maintenance Services Market procurement intelligence report has enlisted the top suppliers and their cost structures, SLA terms, best selection criteria, and negotiation strategies.

  • Baker Hughes Co.
  • Halliburton Energy Services Inc.
  • Schlumberger Ltd.
  • SGS SA
  • Weatherford International Plc
  • National Oilwell Varco
  • TechnipFMC Plc
  • Trican Well Service Ltd.
  • Bonatti Spa
  • ABB Ltd.

Get access to regular sourcing and procurement insights to our digital procurement platform- Contact Us.

Table of Content

Executive Summary

Market Insights

Category Pricing Insights

Cost-saving Opportunities

Best Practices

Category Ecosystem

Category Management Strategy

Category Management Enablers

Suppliers Selection

Suppliers under Coverage

US Market Insights

Category scope

Appendix

About SpendEdge:

SpendEdge shares your passion for driving sourcing and procurement excellence. We are the preferred procurement market intelligence partner for 120+ Fortune 500 firms and other leading companies across numerous industries. Our strength lies in delivering robust, real-time procurement market intelligence reports and solutions. To know more https://www.spendedge.com/request-for-demo


Contacts

SpendEdge
Anirban Choudhury
Marketing Manager
US: +1 630 984 7340
UK: +44 148 459 9299
https://www.spendedge.com/contact-us

DALLAS--(BUSINESS WIRE)--Pioneer Natural Resources Company (NYSE:PXD) (“Pioneer” or “the Company”) announced today that its Board of Directors declared a quarterly cash dividend of $0.55 per share on Pioneer’s outstanding common stock. The dividend is payable January 14, 2021, to stockholders of record at the close of business on December 31, 2020.

Pioneer is a large independent oil and gas exploration and production company, headquartered in Dallas, Texas, with operations in the United States. For more information, visit Pioneer’s website at www.pxd.com.


Contacts

Pioneer Natural Resources Contacts:
Investors
Neal Shah – 972-969-3900
Tom Fitter – 972-969-1821
Michael McNamara – 972-969-3592
Greg Wright – 972-969-1770

Media and Public Affairs
Tadd Owens – 972-969-5760

GUANGZHOU, China--(BUSINESS WIRE)--$XPEV #EV--Xpeng Inc. (“Xpeng” or the “Company”, NYSE: XPEV), a leading Chinese smart electric vehicle (“Smart EV”) company, today unveiled the P7 Wing, the limited edition of its P7 super-long range sports sedan at the 2020 Auto Guangzhou show.


The new flagship limited edition is designed to maximize the sporty and dynamic style of the smart EV sedan with a pair of specifically-designed scissor-style front doors that are traditionally only available in luxury sports vehicles.

The P7 Wing limited edition is available in four-wheel drive high-performance and rear-wheel drive super-long range versions at post-subsidies prices of RMB409,000 and RMB366,900 respectively for the Chinese market.

Equipped with XPILOT 3.0 hardware and software, with 18-speaker Dynaudio concert-hall style in-car sound system, the P7 Wing brings extra exclusivity for its owners.

Customers can personalize the opening angle of the doors. Two obstacle avoidance radars are installed on the left and right sides, which automatically identify obstacles and control the door movements during the opening process.

The electric scissor-style doors can be unlocked in multiple ways, i.e. via car key, Bluetooth/NFC digital key, mobile phone APP, control panel or in-car voice assistant.

About Xpeng

Xpeng Inc. (NYSE: XPEV) is a leading Chinese smart electric vehicle company that designs, develops, manufactures, and markets Smart EVs that appeal to the large and growing base of technology-savvy middle-class consumers in China. Its mission is to drive Smart EV transformation with technology and data, shaping the mobility experience of the future. In order to optimize its customers’ mobility experience, Xpeng develops in-house its full-stack autonomous driving technology and in-car intelligent operating system, as well as core vehicle systems including powertrain and the electrification/electronic architecture. Xpeng is headquartered in Guangzhou, China, with offices in Beijing, Shanghai, Silicon Valley, and San Diego. The Company’s Smart EVs are manufactured at plants in Zhaoqing and Zhengzhou, located in Guangdong and Henan provinces, respectively. For more information, please visit https://en.xiaopeng.com.


Contacts

For Media Enquiries:
Marie Cheung
Xpeng Inc.
Tel: +852 9750 5170 / +86 1550 7577 546
E-mail: This email address is being protected from spambots. You need JavaScript enabled to view it.

HOUSTON--(BUSINESS WIRE)--Geospace Technologies (NASDAQ: GEOS) today announced a net loss of $19.2 million, or $(1.42) per diluted share, on revenue of $87.8 million for its fiscal year ended September 30, 2020. This compares with a net loss of $146,000, or ($0.01) per diluted share, on revenue of $95.8 million for the comparable year-ago period.


For the fourth quarter ended September 30, 2020, the company reported revenue of $21.5 million and a net loss of $3.9 million, or ($0.29) per diluted share. For the comparable period last year, the company recorded revenue of $28.9 million and net income of $8.7 million, or $0.63 per diluted share.

The company noted that both the 2019 fiscal year and the fourth quarter periods benefited from a $7.0 million gain on the sale of non-essential real estate. Also noted, fiscal year 2020 operating income includes a $0.7 million non-cash charge for goodwill impairment in the company’s oil and gas segment, and a $1.1 million non-cash charge for changes in contingent consideration whereas fiscal year 2019 benefited from a $2.1 million reversal.

Walter R. (“Rick”) Wheeler, President and CEO of Geospace Technologies (the “Company”) said, “The spread of the novel coronavirus that began in late 2019 and early 2020, continues to negatively impact economies around the world. In response to this pandemic, we have continued to maintain our steadfast commitment to the health and safety measures implemented earlier this year. These measures are designed to protect our employees, as well as ensure that we can continue to serve our valued customers in the fashion to which they are accustomed.

Wheeler continued, “Despite the negative impact that COVID-19 has had on each of our business segments, we are pleased to report that our fiscal year 2020 total revenue of $87.8 million remained within 8% of last year’s total, and that we generated over $18 million in cash from operations over the course of the year. Notably, this reported revenue figure does not include any amounts from the sale of a GCL land recording system, valued at $12.5 million, to one of our customers in the second quarter. The purchase included $10 million of financing through a promissory note, and by the end of September 2020, almost $5.0 million had been received toward this system, including interest charges. Principal payment amounts toward this sale are included on our balance sheet as part of non-current deferred revenue, which we intend to recognize at a later date when collection of the note is deemed likely.”

Wheeler further noted, “As was the case throughout the fiscal year, our fourth quarter results continued to be fueled by demand for our OBX ocean-bottom recording systems. Moreover, rental contracts for our OBX marine systems pushed revenue from our wireless exploration products above last year’s mark. This helped to partially offset the reduced demand for our other oil and gas segment products, as well as the lower demand we experienced for products in our adjacent market businesses. The reduced demand was largely brought about by the negative impacts of COVID-19. Efforts to combat this disease have driven down the world’s demand for oil and gas, which has led to the largest supply and demand imbalance we’ve experienced. With a majority of seismic exploration activities currently suspended, demand for our oil and gas products remains limited. In addition, our adjacent markets graphic imaging products have seen similar setbacks. These products are used in the printing processes, merchandizing, and promotions of sports, entertainment, schools, tourism, and other social gathering events. Due to COVID-19, many of these activities have been curtailed, thus lowering demand for these products. In recognition of this lower products and rental demand and in keeping with our conservative management approach, we took steps to address our operating costs with a reduction in force in the third quarter of fiscal year 2020. Although a return to normalcy from these circumstances seems almost certain, the timing and extent of such recovery is unclear.”

Oil and Gas Markets Segment

Combined revenue from the Company’s Oil and Gas Markets segment totaled $14.2 million for the three months ended September 30, 2020. For the full fiscal year, revenue from this segment totaled $61.7 million. This compares with $20.8 million and $65.0 million for the equivalent three- and twelve-month periods a year ago, reflecting respective decreases of 32% and 5%. The decrease for the three-month period stems from lower demand for the Company’s wireless and reservoir seismic products and services, and for the full year period, reduced demand for its traditional and reservoir seismic products. Given the reduction in demand for oil and gas as a consequence of COVID-19, the Company’s Oil and Gas Markets segment will remain challenged as a result of minimal seismic exploration activity.

Revenue contributions to this segment from the Company’s traditional exploration products totaled $1.1 million and $6.7 million respectively for the three-month and full year periods ended September 30, 2020. These reflect an increase of 83% and a decrease of 30% compared to the same periods a year ago. The increase for the three-month period arises from comparing to last year’s historic low figure, while the decrease for the full year period is attributed to a persistent low overall demand for these products brought about by stark reductions in seismic exploration activities for oil and gas.

Segment contributions from the Company’s wireless seismic products totaled $13.0 million and $54.1 million respectively for the three- and twelve-month periods ended September 30, 2020. This equates to a 35% decrease and a 2% increase compared to the corresponding respective year ago periods. The fourth quarter decrease from last year is due to lower sales and rentals of the Company’s wireless products over the narrow three-month period. The full year comparative increase is a result of greater rental revenue during the year from the Company’s OBX marine nodal recording systems, partially offset by lower sales and rentals of its wireless land products. Demand for the Company’s OBX systems is driven by the desire of many oil and gas companies to find new resources near producing fields and to leverage existing offshore assets for their recovery to achieve lower cost. The Company’s rental of OBX systems is not immune from the reduced global demand for oil and gas, as such the Company expects reduced revenue from the rental of OBX systems in fiscal year 2021. Not recognized in the Company’s fiscal year 2020 revenue is the sale of a 30,000 channel GCL wireless land recording system, valued at $12.5 million. Payments received toward the system purchase are included in non-current deferred revenue on the Company’s balance sheet and are intended to be recognized as revenue at a future date when payment of a promissory note on the sale is likely.

The Company’s reservoir seismic products contributed $0.1 million and $0.9 million in total revenue for the three-month and full year periods ended September 30, 2020. This compares with $0.3 million and $2.7 million for the equivalent periods one year earlier, reflecting respective decreases of 56% and 65%. Reductions in engineering services and lower demand for the sale, rental, and repair of the Company’s borehole tools are responsible for the decreases in both periods. Management believes that contracts for the manufacture and deployment of permanent reservoir monitoring (PRM) systems offer the greatest opportunity for meaningful revenue from this product category. The Company has the largest installed base of PRM systems in the world, and offers configurations utilizing high-resolution electromagnetic motion sensors or OptoSeis® fiber optic sensor technology. In the fourth quarter of fiscal year 2020, the Company received a request from a major oil and gas producer to propose on the manufacture and installation of a large-scale seabed PRM system. In the event of a provided response, the potential customer is expected to award a contract in the second or third quarter of fiscal year 2021. If the Company were awarded the contract, revenue from the contract would not likely be recognized until the latter part of fiscal year 2021 and beyond. The Company is also continuing its ongoing discussions with other major oil and gas producers for possible PRM systems.

Adjacent Markets Segment

Combined revenue from the Company’s Adjacent Markets segment totaled $7.1 million and $25.4 million for the three- and twelve-month periods ended September 30, 2020. This compares with $8.0 million and $30.1 million for the equivalent year ago periods, representing decreases of 11% and 16% respectively. Lower sales of the Company’s sensors, cables, and connectors used in non-oil and gas industrial markets, and lower demand for its contract manufacturing services contributed to the decreases in both periods. In addition, reduced sales of the Company’s graphic imaging products further contributed to the comparative decrease over the full year period. In all cases, negative impacts of the COVID-19 pandemic are believed to be the primary cause of lower demand for the Company’s various adjacent markets products. As the effects of COVID-19 are abated, demand for the Company’s adjacent markets products will likely improve, but the extent and timing of possible recovery cannot be determined.

Emerging Markets Segment

The Company’s Emerging Markets segment generated revenue of $177,000 and $734,000 for the three-month and full year periods ended September 30, 2020. This compares with $14,000 and $159,000 for the similar three- and twelve-month periods of the previous year. For both periods, increased revenue is attributed to (i) the sale of border and perimeter security products to a commercial customer and (ii) initial site preparation and engineering related to a U.S. Customs and Border Protection, U.S. Border Patrol contract. Revenue from this $10 million contract, secured in April 2020, is expected to be recognized in the Company’s 2021 fiscal year. The contract is evidence of the Company’s successful execution of strategic diversification. Through its Quantum acquisition and analytics integration, the Company has leveraged its core engineering and manufacturing competencies to create novel products incorporating seismic acoustic technology and advanced analytics. These products provide unique technology solutions to government and commercial customers in the security, industrial, oil and gas, and other markets.

Balance Sheet and Liquidity

For the fiscal year ended September 30, 2020, the Company generated $18.1 million in cash and cash equivalents from operating activities. The Company used $4.1 million of cash for investment activities that included (i) $5.5 million invested in its rental equipment primarily to expand its OBX rental fleet, and (ii) $2.9 million for additions to property, plant, and equipment. These uses were partially offset by (i) $4.1 million of proceeds for the sale of rental equipment, and (ii) $0.2 million of proceeds from the sale of equipment. As of September 30, 2020, the Company had $32.7 million in cash and cash equivalents, and maintained an additional borrowing availability of $17.7 million under its bank credit agreement with no borrowings outstanding. Thus, as of September 30, 2020, the Company’s total liquidity stood at $50.4 million. The Company additionally owns unencumbered property and real estate in both domestic and international locations.

Wheeler concluded, “COVID-19 continues to exert a tight grip on the economies of countries around the world, and until there is a successful vaccine and infection rates consistently decline, there is no way to predict what a recovery will look like. Although the impact of the pandemic on some of our business segments was initially delayed, the negative effects have largely caught up. Seismic exploration activity will remain at a minimum as long as oil and gas supplies outstrip demand, and the lower energy demands brought about in reaction to COVID-19 reinforce this condition. As the businesses of some of our customers suffer from the pandemic’s effects, some of our adjacent market products will see reduced demand. However, much of our current efforts are focused on longer term strategic goals and projects of major customers looking further into the future. This includes oil and gas companies eager to find new reserves near existing assets using our OBX systems, as well as those intending to maximize recoveries of existing fields using our PRM systems. Transcending the pandemic is the critical mission of the U.S. Customs and Border Protection, U.S. Border Patrol, as we fulfill our contract to provide the Department of Homeland Security with a technology solution to protect our borders and society at large. We believe our strong balance sheet with no debt and ample liquidity gives us the fundamental strength to weather this pandemic and emerge on good footing. As such, we believe we are well positioned to leverage our comprehensive engineering and significant manufacturing operation in pursuit of new specialized industrial manufacturing customers and in support of national and homeland security missions. By maintaining our own manufacturing operation, we’ve de-risked our supply chain and enabled rapid time to market for new products, all of which make us highly attractive for partnership and fulfillment of commercial and government contracts. In other matters, I’d like to highlight the recent additions to our Board of Directors of Margaret “Sid” Ashworth, former Vice President of Government Relations for Northrop Grumman, and Kenneth Asbury, former President and CEO of CACI International. The experience each of them bring from such remarkable careers and accomplishments will bring fresh and diverse perspectives to our board and future strategies, creating new value for our shareholders.”

Stock Repurchase Program

The Company also announced that its Board of Directors has authorized a stock repurchase program under which the Company may purchase up to $5 million of its outstanding common stock. Under the repurchase program, the Company may purchase shares of common stock on a discretionary basis from time to time through open market transactions. The timing and number of shares repurchased will depend on a variety of factors, including stock price, trading volume, and general business and market conditions. The repurchase program has no time limit, does not obligate the Company to acquire a specified number of shares and may be modified, suspended or discontinued at any time at the Company’s discretion. The repurchase plan will be funded using existing cash or future cash flow.

Conference Call Information

Geospace Technologies will host a conference call to review its fiscal year 2020 full year financial results on November 20, 2020 at 10:00 a.m. Eastern Time (9 a.m. Central). Participants can access the call at (866) 518-6930 (US) or (203) 518-9797 (International). Please reference the conference ID: GEOSQ420 prior to the start of the conference call. A replay will be available for approximately 60 days and may be accessed through the Investor tab of our website at www.geospace.com.

About Geospace Technologies

Geospace principally designs and manufactures seismic instruments and equipment. We market our seismic products to the oil and gas industry to locate, characterize and monitor hydrocarbon-producing reservoirs. We also market our seismic products to other industries for vibration monitoring, border and perimeter security and various geotechnical applications. We design and manufacture other products of a non-seismic nature, including water meter products, imaging equipment and offshore cables.

Forward Looking Statements

This press release contains “forward-looking statements” within the meaning of Section 27A of the Securities Act of 1933, as amended, and Section 21E of the Securities Exchange Act of 1934, as amended. These forward-looking statements can be identified by terminology such as “may”, “will”, “should”, “intend”, “expect”, “plan”, “budget”, “forecast”, “anticipate”, “believe”, “estimate”, “predict”, “potential”, “continue”, “evaluating” or similar words. Statements that contain these words should be read carefully because they discuss our future expectations, contain projections of our future results of operations or of our financial position or state other forward-looking information. Examples of forward-looking statements include, among others, statements that we make regarding our expected operating results, the results and success of our transactions with Quantum and the OptoSeis® technology, the adoption and sale of our products in various geographic regions, potential tenders for PRM systems, future demand for OBX systems, the completion of new orders for our channels of our GCL system, the fulfillment of customer payment obligations, the impact of the coronavirus (COVID-19) pandemic, the Company’s ability to manage changes and the continued health or availability of management personnel, volatility and development, market position, financial results and the provision of accounting reserves. These forward-looking statements reflect our best judgment about future events and trends based on the information currently available to us. However, there will likely be events in the future that we are not able to predict or control. The factors listed under the caption “Risk Factors” and elsewhere in our most recent Annual Report on Form 10-K which is on file with the Securities and Exchange Commission, as well as other cautionary language in such Annual Report, any subsequent Quarterly Report on the Form 10-Q, or in our other periodic reports, provide examples of risks, uncertainties and events that may cause our actual results to differ materially from the expectations we describe in our forward-looking statements. Such examples include, but are not limited to, the failure of the Quantum or OptoSeis® technology transactions to yield positive operating results, decreases in commodity price levels, which could reduce demand for our products, the failure of our products to achieve market acceptance, despite substantial investment by us, our sensitivity to short term backlog, delayed or cancelled customer orders, product obsolescence resulting from poor industry conditions or new technologies, bad debt write-offs associated with customer accounts, lack of further orders for our OBX systems, failure of our Quantum products to be adopted by the border and security perimeter market, and infringement or failure to protect intellectual property. The occurrence of the events described in these risk factors and elsewhere in our most recent Annual Report on Form 10-K or in our other periodic reports could have a material adverse effect on our business, results of operations and financial position, and actual events and results of operations may vary materially from our current expectations. We assume no obligation to revise or update any forward-looking statement, whether written or oral, that we may make from time to time, whether as a result of new information, future developments or otherwise.

Geospace Technologies Corporation and Subsidiaries

Consolidated Statements of Operations

(In thousands, except share and per share amounts)

(unaudited)


Three Months Ended


Year Ended


September 30, 2020


September 30, 2019


September 30, 2020


September 30, 2019

Revenue:


Products


$

8,561


$

11,390


$

34,136


$

45,847


Rental equipment


12,959


17,549


53,699


49,962


Total revenue


21,520


28,938


87,835


95,809


Cost of revenue:


Products


11,685


13,092


39,970


46,059


Rental equipment


4,869


5,450


24,433


18,322


Total cost of revenue


16,554


18,541


64,403


64,381


Gross profit


4,966


10,397


23,432


31,428


Operating expenses:


Selling, general and administrative


5,301


6,133


23,068


23,626


Research and development


4,034


4,180


16,569


15,495


Goodwill impairment

671


671


Change in estimated fair value of contingent consideration


(534

)


(2,115

)


1,100


(2,115

)

Bad debt expense (recovery)


(343

)


(163

)


63


436


Total operating expenses


9,129


8,035


41,471


37,442


Gain on disposal of property


7,047


7,047


Income (loss) from operations


(4,163

)


9,409


(18,039

)


1,033


Other income (expense):


Interest expense


(7

)


(14

)


(38

)


(99

)

Interest income


178


410


1,102


1,308


Foreign exchange gains, net


208


56


491


241


Other, net


(31

)


(29

)


(109

)


(212

)

Total other income, net


348


423


1,446


1,238


Income (loss) before income taxes


(3,815

)


9,832


(16,593

)


2,271


Income tax expense


49


1,160


2,649


2,417


Net income (loss)


$

(3,864

)


$

8,672


$

(19,242

)


$

(146

)


Income (loss) per common share:


Basic


$

(0.29

)


$

0.64


$

(1.42

)


$

(0.01

)

Diluted


$

(0.29

)


$

0.63


$

(1.42

)


$

(0.01

)


Weighted average common shares outstanding:


Basic


13,548,644


13,408,912


13,525,179


13,388,626


Diluted


13,548,644


13,569,951


13,525,179


13,388,626


Geospace Technologies Corporation and Subsidiaries

Consolidated Balance Sheets

(In thousands, except share amounts)

(unaudited)


AS OF SEPTEMBER 30,


2020


2019

ASSETS


Current assets:


Cash and cash equivalents


$

32,686


$

18,925


Trade accounts and financing receivables, net of allowance of $496 and $951


13,778


27,426


Inventories, net


16,933


23,855


Property held for sale


587


Prepaid expenses and other current assets


953


1,008


Total current assets


64,937


71,214


Non-current financing receivables


184


Non-current inventories, net


16,930


21,524


Rental equipment, net


54,317


62,062


Property, plant and equipment, net


29,874


31,474


Goodwill


4,337


5,008


Other intangible assets, net


8,331


10,063


Deferred cost of revenue and other assets


8,119


479


Total assets


$

186,845


$

202,008


LIABILITIES AND STOCKHOLDERS’ EQUITY


Current liabilities:


Accounts payable trade


$

1,593


$

4,051


Deferred revenue and other liabilities


8,753


9,119


Total current liabilities


10,346


13,170


Contingent consideration


10,962


9,940


Non-current deferred revenue and other liabilities


4,567


51


Total liabilities


25,875


23,161


Commitments and contingencies


Stockholders’ equity:


Preferred stock, 1,000,000 shares authorized, no shares issued and outstanding


Common stock, $.01 par value, 20,000,000 shares authorized, 13,670,639 and 13,630,666 shares issued and outstanding


137


136


Additional paid-in capital


90,965


88,660


Retained earnings


86,566


105,808


Accumulated other comprehensive loss


(16,698

)


(15,757

)

Total stockholders’ equity


160,970


178,847


Total liabilities and stockholders’ equity


$

186,845


$

202,008


Geospace Technologies Corporation and Subsidiaries

Consolidated Statements of Cash Flows

(In thousands)

(unaudited)


YEAR ENDED SEPTEMBER 30,


2020


2019

Cash flows from operating activities:


Net loss


$

(19,242

)


$

(146

)

Adjustments to reconcile net loss to net cash provided by operating activities:


Deferred income tax expense


181


16


Rental equipment depreciation


17,945


13,713


Property, plant and equipment depreciation


4,016


3,965


Amortization of other intangible assets


1,732


1,661


Goodwill impairment expense


671


Amortization of premiums on short-term investments


(9

)

Stock-based compensation expense


2,305


2,329


Bad debt expense


63


436


Inventory obsolescence expense


4,726


4,614


Change in estimate of collectability of rental revenue


7,993


Change in estimated fair value of contingent consideration


1,100


(2,115

)

Gross profit from sale of used rental equipment


(743

)


(652

)

Gain on disposal of property


(7,047

)

Gain on disposal of equipment


(116

)


(100

)

Realized loss on short-term investments


66


Effects of changes in operating assets and liabilities:


Trade accounts and other receivables


2,482


(9,159

)

Inventories


5


(1,865

)

Deferred cost of revenue and other assets


(7,786

)


343


Accounts payable trade


(2,453

)


(44

)

Deferred revenue and other liabilities


5,243


(377

)

Net cash provided by operating activities


18,122


5,629


Cash flows from investing activities:


Purchase of property, plant and equipment


(2,916

)


(1,936

)

Investment in rental equipment


(5,487

)


(34,070

)

Proceeds from the sale of property


8,265


Proceeds from the sale of equipment


204


142


Proceeds from the sale of used rental equipment


4,149


4,856


Proceeds from the sale of short-term investments


25,606


Business acquisition, net of acquired cash


(1,819

)

Payments for damages related to insurance claim


(650

)

Proceeds from insurance claim


1,166


Net cash (used in) provided by investing activities


(4,050

)


1,560


Cash flows from financing activities:


Payments on contingent consideration


(78

)


Proceeds from exercise of stock options and other


215


Net cash provided by (used in) financing activities


(78

)


215


Effect of exchange rate changes on cash


(233

)


(413

)

Increase in cash and cash equivalents


13,761


6,991


Cash and cash equivalents, beginning of fiscal year


18,925


11,934


Cash and cash equivalents, end of fiscal year


$

32,686


$ 18,925


Contacts

Rick Wheeler
President and CEO
TEL: 713.986.4444
FAX: 713.986.4445


Read full story here

DUBLIN--(BUSINESS WIRE)--The "Oil Condition Monitoring - Global Market Outlook (2018-2027)" report has been added to ResearchAndMarkets.com's offering.


The Global Oil Condition Monitoring market accounted for $637.99 million in 2018 and is expected to reach $1567.02 million by 2027 growing at a CAGR of 10.5% during the forecast period.

Growing need for optimization of time, and growing demand for power generation are the major factors propelling the market growth. However, factors such as additional expenses incurred in retrofitting existing systems, and limited availability of skilled personnel are hampering the market growth.

In order to avoid the failures of the engine and the power train and to avoid the machinery that is costly, the testing of oil condition monitoring is done. With the help of the oil condition monitoring the maintenance of the engines, machines, and other systems is done in an effective way and it helps in reducing the downtime expense. Different types of tests are conducted for the oil condition monitoring. Some of the tests for the oil condition monitoring are oil condition monitoring tests, marine lubricants quality scanning, wear metals testing, OCM testing, ferrography testing, and others.

Based on the sampling type, the on-site segment is going to have a lucrative growth during the forecast period owing to the factors such as reduced servicing and maintenance costs, increased equipment productivity, minimize oil waste and disposal, and reduce downtime. The user can ensure the proper functioning of engines used in industries such as power generation, transportation, and marine.

By geography, North America is going to have a lucrative growth during the forecast period due to the presence of several major players in the industries such as automotive, oil & gas, power generation, and mining. The advancements in predictive maintenance technologies are encouraging end-users to adopt oil condition monitoring solutions across industries existing in this region.

Companies Mentioned

  • Avenisense S.A.
  • Bureau Veritas
  • Castrol Limited
  • Chevron Corporation
  • Delta Services Industriels (DSi)
  • GE
  • Intertek Group Plc
  • Micromem Applied Sensor Technologies Inc.
  • Parker Hannifin Manufacturing Ltd
  • Poseidon Systems, LLC
  • Shell
  • SPECTRO Analytical Instruments GmbH
  • Test Oil (Insight Services Inc.)
  • TRIBOMAR GmbH
  • Unimarine

What our report offers:

  • Market share assessments for the regional and country-level segments
  • Strategic recommendations for the new entrants
  • Covers Market data for the years 2017, 2018, 2019, 2023 and 2027
  • Market Trends (Drivers, Constraints, Opportunities, Threats, Challenges, Investment Opportunities, and recommendations)
  • Strategic recommendations in key business segments based on the market estimations
  • Competitive landscaping mapping the key common trends
  • Company profiling with detailed strategies, financials, and recent developments
  • Supply chain trends mapping the latest technological advancements

Key Topics Covered:

1 Executive Summary

2 Preface

3 Market Trend Analysis

3.1 Introduction

3.2 Drivers

3.3 Restraints

3.4 Opportunities

3.5 Threats

3.6 Product Analysis

3.7 End User Analysis

3.8 Emerging Markets

3.9 Impact of Covid-19

4 Porters Five Force Analysis

4.1 Bargaining power of suppliers

4.2 Bargaining power of buyers

4.3 Threat of substitutes

4.4 Threat of new entrants

4.5 Competitive rivalry

5 Global Oil Condition Monitoring Market, By Product

5.1 Introduction

5.2 Compressors

5.3 Engines

5.4 Gear Systems

5.5 Hydraulic Systems

5.6 Turbines

6 Global Oil Condition Monitoring Market, By Sampling

6.1 Introduction

6.2 Off-Site

6.3 On-Site

6.4 Fixed Continuous Monitoring

Portable Kit (On-Board)

7 Global Oil Condition Monitoring Market, By Measurement

7.1 Introduction

7.2 Density

7.3 Dielectric

7.4 Fuel Dilution

7.5 Pressure

7.6 Soot

7.7 Tan

7.8 Temperature

7.9 Total Base Number (TBN)

7.10 Viscosity

7.11 Water Dilution

7.12 Wear Particles

8 Global Oil Condition Monitoring Market, By End User

8.1 Introduction

8.2 Energy & Power

8.3 Industrial

8.4 Mining

8.5 Oil & Gas

8.6 Transportation

8.6.1 Aerospace

8.6.2 Automobile

8.6.3 Heavy Vehicle

8.6.4 Locomotive Engine

8.6.5 Marine

9 Global Oil Condition Monitoring Market, By Geography

9.1 Introduction

9.2 North America

9.3 Europe

9.4 Asia Pacific

9.5 South America

9.6 Middle East & Africa

10 Key Developments

10.1 Agreements, Partnerships, Collaborations and Joint Ventures

10.2 Acquisitions & Mergers

10.3 New Product Launch

10.4 Expansions

10.5 Other Key Strategies

11 Company Profiling

For more information about this report visit https://www.researchandmarkets.com/r/7t2r94


Contacts

ResearchAndMarkets.com
Laura Wood, Senior Press Manager
This email address is being protected from spambots. You need JavaScript enabled to view it.
For E.S.T Office Hours Call 1-917-300-0470
For U.S./CAN Toll Free Call 1-800-526-8630
For GMT Office Hours Call +353-1-416-8900

  • The Company ended the quarter with $577 million in cash and short-term investments and no amounts drawn on its $750 million revolving credit facility culminating in over $1.3 billion in liquidity
  • H&P expects its first quarter of fiscal 2021 North America Solutions rig count to exit at approximately 90 rigs up over 30% during the quarter
  • Reported a fiscal fourth quarter net loss of $(0.55) per diluted share; including select items(1) of $0.19 per diluted share
  • Quarterly North America Solutions operating gross margins(2) decreased $63 million to $39 million sequentially, as revenues decreased by $105 million to $149 million and expenses decreased by $43 million to $110 million
  • H&P's leadership position in automated directional drilling technology continues as AutoSlide® commercial deployments accelerated despite a significantly declining rig market with some notable operators implementing this technology on 100% of their wells in multiple basins
  • On September 9, 2020, Directors of the Company declared a quarterly cash dividend of $0.25 per share payable on December 1, 2020 to stockholders of record at the close of business on November 13, 2020

TULSA, Okla.--(BUSINESS WIRE)--Helmerich & Payne, Inc. (NYSE: HP) reported a net loss of $59 million, or $(0.55) per diluted share, from operating revenues of $208 million for the quarter ended September 30, 2020, compared to a net loss of $46 million, or $(0.43) per diluted share, on revenues of $317 million for the quarter ended June 30, 2020. The net losses per diluted share for the fourth and third quarters of fiscal year 2020 include $0.19 and $(0.09) of after-tax gains and losses, respectively, comprised of select items(1). For the fourth quarter of fiscal year 2020, select items(1) were comprised of:


  • $0.20 of after-tax gains pertaining to the sale of industrial real estate property
  • $(0.01) of after-tax losses pertaining to a non-cash fair market adjustment to our equity investment and restructuring charges

Net cash provided by operating activities was $93 million for the fourth quarter of fiscal year 2020 compared to $214 million for the third quarter of fiscal year 2020.

For fiscal year 2020, the Company reported a net loss of $494 million, or $(4.60) per diluted share, from operating revenues of $1.8 billion. The net loss per diluted share includes $(3.74) of after-tax losses comprised of select items(1), the most significant of which are non-cash losses of $563 million related to impairments of goodwill, less capable rigs, predominantly consisting of U.S. non-super-spec rigs, and excess related drilling equipment, and inventory and $16 million related to restructuring charges. Net cash provided by operating activities was $539 million in fiscal year 2020 compared to $856 million in fiscal year 2019.

President and CEO John Lindsay commented, “In terms of activity, this past fourth fiscal quarter was one of the most challenging in the Company's history. Our strong financial position together with our long-term vision for the future of the business enabled us to focus on introducing new commercial models and expanding our drilling and digital technology solutions to customers. These efforts are making good progress in this difficult environment and will serve as the foundation from which the Company will build as the market begins to recover.

"Our embedded customer centric approach is one that focuses on providing customized solutions, employing a combination of people, rigs and automation technology to provide more value and lower risk. This approach is distinctive in the industry, resonating well across our customer base, and is a driver for the recent increased activity levels with further improvements on the horizon. We expect our contracted rigs to increase by one-third during the first fiscal quarter of 2021, exiting at approximately 90 rigs, almost doubling the number of rigs turning to the right compared to our fourth fiscal quarter trough rig count.

"Concurrent with the expected increase in near-term activity, we are also experiencing increased customer utilization of our performance-based contracts and rig automation software, AutoSlide, and we expect adoption to increase and become more prevalent in the industry. H&P's 'touch of a button' autonomous drilling approach optimizes every major facet of the operation, from real-time automated geosteering, to rotary and sliding execution, to wellbore quality and placement. The uniqueness of our automated solutions is backed by a patented economic-driven approach where the software not only makes optimal cost/benefit decisions, but also directs the rig to execute those decisions without the need of an on-site directional driller, which improves reliability, enhances value and reduces risk for our customers.

"While we are encouraged by these developments, we are also cognizant that there remains a substantial amount of uncertainty in the market and that it may take several quarters to realize what the 'new normal' activity environment will look like given the uncertain timeline and lasting impacts of the COVID-19 pandemic."

Senior Vice President and CFO Mark Smith also commented, "The Company's financial strength continues to be a bright spot in this very challenging environment. Our strong capital stewardship continues looking out into fiscal 2021 as well with our anticipated capex spend to range between $85 and $105 million.

"Additionally during the fourth fiscal quarter, we completed the sale of the Company's industrial real estate assets. The decision to divest these legacy, non-core assets was considered as we entered 2020, but the close of the sale was delayed by several months due to the COVID-19 pandemic. The proceeds from the sale serve to further bolster our cash position, which together with short-term investments was $577 million at our fiscal year-end, resulting in cash in excess of debt of $90 million."

John Lindsay concluded, “Looking back at an unprecedented and demanding 2020 fiscal year, we remain steadfast in our commitment to reshape our business and the industry during this challenging time. Our teams are doing great work to accelerate long-term strategic priorities, including driving efficiency across the company and evolving our digital technology and data platforms to deliver value-added solutions and services to our customers and partners."

Operating Segment Results for the Fourth Quarter of Fiscal Year 2020

North America Solutions:

This segment had an operating loss of $78 million compared to an operating loss of $25 million during the previous quarter. The increase in the operating loss was driven by the continued decline in rig activity due to significantly lower crude oil prices resulting from a global supply and demand imbalance caused by the pandemic.

Operating gross margins(2) declined by $62.5 million to $39.3 million as both revenues and expenses declined sequentially. Revenues during the current quarter benefited from $11.7 million in early contract termination revenue compared to $50.2 million in the prior quarter. Expenses during the quarter were adversely impacted by higher than expected self-insurance expenses. Our technology solutions were in-line with expectations and had a positive, albeit small, contribution to the total North America Solutions operating gross margins(2).

International Solutions:

This segment had an operating loss of $3.5 million compared to an operating loss of $9.5 million during the previous quarter. Despite a decline in revenue days, operating gross margins(2) improved $4.0 million to a negative $1.2 million due to certain revenue reimbursements received during the quarter. This segment continues to carry a higher level of expenses relative to activity levels resulting from compliance with local jurisdictional requirements surrounding COVID-19. The Company continues to explore opportunities to mitigate these expenses, while maintaining strict adherence to local regulations. Current quarter results included a $2.6 million foreign currency loss related to our South American operations compared to an approximate $3.2 million foreign currency loss in the third quarter of fiscal year 2020.

Offshore Gulf of Mexico:

This segment had operating income of $1.5 million compared to operating income of $3.0 million during the previous quarter. Operating gross margins(2) declined by $3.9 million to $4.6 million due to unfavorable adjustments to self-insurance expenses related to a prior period claim. Segment operating income from management contracts on customer-owned platform rigs contributed approximately $1.1 million of the total, compared to approximately $1.7 million during the prior quarter.

Operational Outlook for the First Quarter of Fiscal Year 2021

North America Solutions:

  • We expect North America Solutions operating gross margins(2) to be between $40-$50 million, inclusive of approximately $1 million of contract early termination compensation
  • We expect to exit the quarter at between 88-93 contracted rigs, inclusive of approximately 0-2 contracted rigs generating revenue that could remain idle

International Solutions:

  • We expect International Solutions operating gross margins(2) to be between $(5)-$(7) million, exclusive of any foreign exchange gains or loses

Offshore Gulf of Mexico:

  • We expect Offshore Gulf of Mexico rig operating gross margins(2) to be between $5-$7 million
  • Management contracts are also expected to generate approximately $1-2 million in operating income

Other Estimates for Fiscal Year 2021

  • Gross capital expenditures are expected to be approximately $85 to $105 million; roughly one-third expected for maintenance, roughly one-third expected for skidding to walking conversions and roughly one-third for corporate and information technology. Asset sales include reimbursements for lost and damaged tubulars and sales of other used drilling equipment that offset a portion of the gross capital expenditures and are expected to total approximately $20 million in fiscal year 2021.
  • Depreciation is expected to be approximately $430 million
  • Research and development expenses for fiscal year 2021 are expected to be roughly $30 million
  • General and administrative expenses for fiscal year 2021 are expected to be approximately $160 million

COVID-19 Update

The COVID-19 pandemic continues to have a significant impact around the world and on our Company. After falling dramatically, crude oil prices and industry activity appear to have stabilized, albeit at much lower levels. The environment in which we operate is still uncertain; however, upon the onset of COVID-19's rapid spread across the United States in early March 2020, we responded quickly and took several actions to maintain the health and safety of H&P employees, customers and stakeholders and to preserve our financial strength. We discussed these actions in our press releases dated April 30, 2020 and July 28, 2020 and in our quarterly reports on Form 10-Q for the quarters ended March 31, 2020 and June 30, 2020 and will provide updates in our annual report on Form 10-K for the fiscal year ended September 30, 2020 when filed.

Select Items Included in Net Income per Diluted Share

Fourth quarter of fiscal year 2020 net loss of $(0.55) per diluted share included $0.19 in after-tax gains comprised of the following:

  • $0.20 of after-tax gains pertaining to the sale of industrial real estate property
  • $(0.00) of after-tax losses related to restructuring charges
  • $(0.01) of non-cash after-tax losses related to fair market value adjustments to equity investments

Third quarter of fiscal year 2020 net loss of $(0.43) per diluted share included $(0.09) in after-tax losses comprised of the following:

  • $0.02 of non-cash after-tax gains related to fair market value adjustments to equity investments
  • $(0.11) of after-tax losses related to restructuring charges

Fiscal year 2020 net loss of $(4.60) per diluted share included $(3.74) in after-tax losses comprised of the following:

  • $0.03 of after-tax gains related to the change in fair value of a contingent liability
  • $0.10 of after-tax gains related to the sale of a subsidiary
  • $0.13 of after-tax benefits from the reversal of accrued compensation
  • $0.20 of after-tax gains pertaining to the sale of industrial real estate property
  • $(0.06) of non-cash after-tax losses related to fair market value adjustments to equity investments
  • $(0.11) of after-tax losses related to restructuring charges
  • $(4.03) of non-cash after-tax losses related to the impairment of goodwill, less capable rigs, predominantly consisting of U.S. non-super-spec rigs, and excess related equipment and inventory

Conference Call

A conference call will be held on Friday, November 20, 2020 at 11:00 a.m. (ET) with John Lindsay, President and CEO, Mark Smith, Senior Vice President and CFO, and Dave Wilson, Director of Investor Relations to discuss the Company’s fourth quarter fiscal year 2020 results. Dial-in information for the conference call is (866) 342-8591 for domestic callers or (203) 518-9713 for international callers. The call access code is ‘Helmerich’. You may also listen to the conference call that will be broadcast live over the Internet by logging on to the Company’s website at http://www.hpinc.com and accessing the corresponding link through the Investor Relations section by clicking on “INVESTORS” and then clicking on “Event Calendar” to find the event and the link to the webcast.

About Helmerich & Payne, Inc.

Founded in 1920, Helmerich & Payne, Inc. (H&P) (NYSE: HP) is committed to delivering industry leading levels of drilling productivity and reliability. H&P operates with the highest level of integrity, safety and innovation to deliver superior results for its customers and returns for shareholders. Through its subsidiaries, the Company designs, fabricates and operates high-performance drilling rigs in conventional and unconventional plays around the world. H&P also develops and implements advanced automation, directional drilling and survey management technologies. At September 30, 2020, H&P's fleet included 262 land rigs in the United States, 32 international land rigs and eight offshore platform rigs. For more information, see H&P online at www.hpinc.com.

Forward-Looking Statements

This release includes “forward-looking statements” within the meaning of the Securities Act of 1933 and the Securities Exchange Act of 1934, and such statements are based on current expectations and assumptions that are subject to risks and uncertainties. All statements other than statements of historical facts included in this release, including, without limitation, statements regarding the registrant’s future financial position, operations outlook, business strategy, dividends, budgets, projected costs and plans and objectives of management for future operations, and the impact or duration of the COVID-19 pandemic and any subsequent recovery, are forward-looking statements. For information regarding risks and uncertainties associated with the Company’s business, please refer to the “Risk Factors” and “Management’s Discussion and Analysis of Financial Condition and Results of Operations” sections of the Company’s SEC filings, including but not limited to its annual report on Form 10-K and quarterly reports on Form 10-Q. As a result of these factors, Helmerich & Payne, Inc.’s actual results may differ materially from those indicated or implied by such forward-looking statements. We undertake no duty to update or revise our forward-looking statements based on changes in internal estimates, expectations or otherwise, except as required by law.

We use our Investor Relations website as a channel of distribution for material company information. Such information is routinely posted and accessible on our Investor Relations website at www.hpinc.com.


Note Regarding Trademarks. Helmerich & Payne, Inc. owns or has rights to the use of trademarks, service marks and trade names that it uses in conjunction with the operation of its business. Some of the trademarks that appear in this release or otherwise used by H&P include FlexRig and AutoSlide, which may be registered or trademarked in the United States and other jurisdictions.

(1) See the corresponding section of this release for details regarding the select items. The Company believes identifying and excluding select items is useful in assessing and understanding current operational performance, especially in making comparisons over time involving previous and subsequent periods and/or forecasting future periods results. Select items are excluded as they are deemed to be outside of the Company's core business operations.

(2) Operating gross margin is defined as operating revenues less direct operating expenses.


HELMERICH & PAYNE, INC.

(Unaudited)

(in thousands, except per share data)


Three Months Ended


Year Ended


September 30,


June 30,


September 30,


September 30,

CONSOLIDATED STATEMENTS OF OPERATIONS

2020


2020


2019


2020


2019

Operating revenues


Drilling services

$

205,621


$

314,405


$

645,759


$

1,761,714


$

2,785,557


Other

2,646


2,959


3,291


12,213


12,933


208,267


317,364


649,050


1,773,927


2,798,490


Operating costs and expenses


Drilling services operating expenses, excluding depreciation and amortization

162,518


205,198


430,778


1,184,788


1,803,204


Other operating expenses

1,491


1,549


1,072


5,777


5,382


Depreciation and amortization

109,587


110,161


134,887


481,885


562,803


Research and development

4,915


3,638


6,121


21,645


27,467


Selling, general and administrative

32,619


43,108


49,812


167,513


194,416


Asset impairment charge


563,234


224,327


Restructuring charges

552


15,495


16,047


Gain on sale of assets

(27,985

)


(4,201

)


(12,641

)


(46,775

)


(39,691

)


283,697


374,948


610,029


2,394,114


2,777,908


Operating income (loss) from continuing operations

(75,430

)


(57,584

)


39,021


(620,187

)


20,582


Other income (expense)


Interest and dividend income

753


771


2,607


7,304


9,468


Interest expense

(6,154

)


(6,125

)


(8,043

)


(24,474

)


(25,188

)

Gain (loss) on investment securities

(1,395

)


2,267


(4,260

)


(8,720

)


(54,488

)

Gain on sale of subsidiary


14,963


Other

(1,673

)


(2,914

)


(546

)


(5,384

)


(1,596

)


(8,469

)


(6,001

)


(10,242

)


(16,311

)


(71,804

)

Income (loss) from continuing operations before income taxes

(83,899

)


(63,585

)


28,779


(636,498

)


(51,222

)

Income tax benefit

(23,253

)


(17,578

)


(13,110

)


(140,106

)


(18,712

)

Income (loss) from continuing operations

(60,646

)


(46,007

)


41,889


(496,392

)


(32,510

)

Income from discontinued operations before income taxes

7,905


9,151


10,050


30,580


32,848


Income tax provision

6,222


8,743


10,763


28,685


33,994


Income (loss) from discontinued operations

1,683


408


(713

)


1,895


(1,146

)

Net income (loss)

$

(58,963

)


$

(45,599

)


$

41,176


$

(494,497

)


$

(33,656

)


Basic earnings (loss) per common share:


Income (loss) from continuing operations

$

(0.57

)


$

(0.43

)


$

0.38


$

(4.62

)


$

(0.33

)

Income (loss) from discontinued operations

0.02


(0.01

)


0.02


(0.01

)

Net income (loss)

$

(0.55

)


$

(0.43

)


$

0.37


$

(4.60

)


$

(0.34

)


Diluted earnings (loss) per common share:


Income (loss) from continuing operations

$

(0.57

)


$

(0.43

)


$

0.38


$

(4.62

)


$

(0.33

)

Income (loss) from discontinued operations

0.02


(0.01

)


0.02


(0.01

)

Net income (loss)

$

(0.55

)


$

(0.43

)


$

0.37


$

(4.60

)


$

(0.34

)


Weighted average shares outstanding (in thousands):


Basic

107,484


107,439


108,896


108,009


109,216


Diluted

107,484


107,439


108,950


108,009


109,216


HELMERICH & PAYNE, INC.

(Unaudited)

(in thousands)


September 30,


September 30,

CONSOLIDATED BALANCE SHEETS

2020


2019

Assets


Cash and cash equivalents

$

487,884


$

347,943


Short-term investments

89,335


52,960


Other current assets

386,108


714,183


Total current assets

963,327


1,115,086


Investments

31,585


31,991


Property, plant and equipment, net

3,646,341


4,502,084


Other noncurrent assets

188,368


190,354


Total Assets

$

4,829,621


$

5,839,515


Liabilities and Shareholders' Equity


Current liabilities

$

219,136


$

410,238


Long-term debt, net

480,727


479,356


Other noncurrent liabilities

797,855


922,357


Noncurrent liabilities - discontinued operations

13,389


15,341


Total shareholders’ equity

3,318,514


4,012,223


Total Liabilities and Shareholders' Equity

$

4,829,621


$

5,839,515


HELMERICH & PAYNE, INC.

(Unaudited)

(in thousands)


Year Ended September 30,

CONDENSED CONSOLIDATED STATEMENTS OF CASH FLOWS

2020


2019

OPERATING ACTIVITIES:


Net loss

$

(494,497

)


$

(33,656

)

Adjustment for (income) loss from discontinued operations

(1,895

)


1,146


Loss from continuing operations

(496,392

)


(32,510

)

Adjustments to reconcile net loss to net cash provided by operating activities:


Depreciation and amortization

481,885


562,803


Asset impairment charge

563,234


224,327


Restructuring charges


Amortization of debt discount and debt issuance costs

1,817


1,732


Provision for bad debt

2,203


2,321


Stock-based compensation

36,329


34,292


Loss on investment securities

8,720


54,488


Gain on sale of assets

(46,775

)


(39,691

)

Gain on sale of subsidiary

(14,963

)


Deferred income tax benefit

(157,555

)


(44,554

)

Other

(200

)


(3,295

)

Changes in assets and liabilities

160,625


95,900


Net cash provided by operating activities from continuing operations

538,928


855,813


Net cash used in operating activities from discontinued operations

(47

)


(62

)

Net cash provided by operating activities

538,881


855,751


INVESTING ACTIVITIES:


Capital expenditures

(140,795

)


(458,402

)

Purchase of short-term investments

(134,641

)


(97,652

)

Payment for acquisition of business, net of cash acquired


(16,163

)

Proceeds from sale of short-term investments

94,646


86,765


Proceeds from sale of subsidiary

15,056


Proceeds from sale of marketable securities


11,999


Proceeds from asset sales

78,399


50,817


Other

(550

)


Net cash used in investing activities

(87,885

)


(422,636

)


FINANCING ACTIVITIES:


Dividends paid

(260,335

)


(313,421

)

Debt issuance costs paid


(3,912

)

Proceeds from stock option exercises

4,100


3,053


Payments for employee taxes on net settlement of equity awards

(3,784

)


(6,418

)

Payment of contingent consideration from acquisition of business

(8,250

)


Payments for early extinguishment of long term debt


(12,852

)

Share repurchase

(28,505

)


(42,779

)

Other

(446

)


Net cash used in financing activities

(297,220

)


(376,329

)

Net increase in cash and cash equivalents and restricted cash

153,776


56,786


Cash and cash equivalents and restricted cash, beginning of period

382,971


326,185


Cash and cash equivalents and restricted cash, end of period

$

536,747


$

382,971


Three Months Ended


Year Ended

SEGMENT REPORTING

(in thousands, except operating statistics)

September 30,


June 30,


September 30,


September 30,

2020


2020


2019 (1)


2020


2019 (1)

NORTH AMERICA SOLUTIONS


Operating revenues

$

149,304


$

254,434


$

558,938


$

1,474,380


$

2,426,191


Direct operating expenses

110,048


152,663


355,830


942,277


1,532,576


Research and development

4,828


3,459


5,918


20,699


25,164


Selling, general and administrative expense

10,916


13,533


15,818


53,714


66,179


Depreciation

101,941


102,699


120,988


438,039


504,466


Asset impairment charge


406,548


216,908


Restructuring charges

(232

)


7,237


7,005


Segment operating income (loss)

$

(78,197

)


$

(25,157

)


$

60,384


$

(393,902

)


$

80,898


Revenue days

5,945


8,101


18,765


49,003


81,805


Average rig revenue per day

$

23,951


$

27,975


$

26,218


$

26,589


$

26,167


Average rig expense per day

17,348


15,412


15,394


15,730


15,243


Average rig margin per day

$

6,603


$

12,563


$

10,824


$

10,859


$

10,924


Rig utilization

25

%


32

%


68

%


47

%


67

%


INTERNATIONAL SOLUTIONS


Operating revenues

$

23,996


$

22,477


$

48,353


$

144,185


$

211,731


Direct operating expenses

25,157


27,595


43,119


124,791


157,856


Selling, general and administrative expense

733


1,129


1,399


4,565


5,624


Depreciation

897


996


8,042


17,531


35,466


Asset impairment charge


156,686


7,419


Restructuring charges

683


2,297


2,980


Segment operating income (loss)

$

(3,474

)


$

(9,540

)


$

(4,207

)


$

(162,368

)


$

5,366


Revenue days

452


988


1,598


4,605


6,426


Average rig revenue per day

$

45,986


$

19,642


$

28,199


$

29,116


$

31,269


Average rig expense per day

42,816


21,589


22,722


23,066


21,626


Average rig margin per day

$

3,170


$

(1,947

)


$

5,477


$

6,050


$

9,643


Rig utilization

15

%


34

%


56

%


40

%


55

%


OFFSHORE GULF OF MEXICO


Operating revenues

$

32,321


$

37,494


$

38,468


$

143,149


$

147,635


Direct operating expenses

27,711


28,967


32,148


119,371


114,306


Selling, general and administrative expense

72


1,248


1,004


3,365


3,725


Depreciation

3,090


3,004


2,499


11,681


10,010


Restructuring charges

(8

)


1,262


1,254


Segment operating income

$

1,456


$

3,013


$

2,817


$

7,478


$

19,594


Revenue days

460


455


552


1,922


2,163


Average rig revenue per day

$

45,254


$

49,654


$

43,072


$

45,145


$

37,478


Average rig expense per day

37,591


34,702


35,612


37,410


28,663


Average rig margin per day

$

7,663


$

14,952


$

7,460


$

7,735


$

8,815


Rig utilization

63

%


63

%


75

%


66

%


74

%


Contacts

Dave Wilson, Director of Investor Relations
This email address is being protected from spambots. You need JavaScript enabled to view it.
(918) 5885190


Read full story here

DUBLIN--(BUSINESS WIRE)--The "United States LNG Bunkering Market - Growth, Trends, and Forecasts (2020 - 2025)" report has been added to ResearchAndMarkets.com's offering.


The United States LNG bunkering market is expected to grow at a CAGR of more than 5.2% over the forecast period.

The strict norms to restrict the sulfur content produced by conventional fuels are driving the demand for LNG bunkering infrastructure in the United States. However, high initial infrastructure development costs and competition from alternative fuels are likely to restrain the market for the LNG bunkering in the country.

Ferries and OSV segment is expected to dominate in the United States LNG bunkering market over the forecast period.

The increased production and the reduced natural gas prices in 2019 had marked the beginning of expanding opportunities for the market in the coming years.

The growth of natural gas is expected to drive the United States LNG bunkering market during the forecast period.

Key Market Trends

Container Fleet is Expected to Dominate in the Market

As of 2019, LNG bunkering in the United States takes place in two locations Jacksonville, FL, and Port Fourchon, LA-with a third facility under development in Tacoma, WA. The LNG facilities in these ports serve the relatively small United States-flag domestic market.

  • Jacksonville is the largest LNG bunkering operation at a United States port. One bunkering facility at the port, developed by JAX LNG, initially began truck-to-ship refueling operations in 2016 for two LNG-capable container ships. In August 2018, upon delivery of the Clean Jacksonville bunker barge, the facility began to replace truck-to-ship bunkering with ship-to-ship bunkering. In the future, the barge plans to source LNG from a new, small-scale liquefaction plant which JAX LNG is currently constructing at the port.
  • A second facility at Jacksonville's port, operated by Eagle LNG, provides LNG bunkering sourced from a liquefaction plant in West Jacksonville. Taken together, the JAX LNG and Eagle LNG facilities is expected to establish Jacksonville as a significant LNG-bunkering location with the capability to serve not only the domestic fleet but larger international vessels as well.
  • At Tacoma, WA facility, Puget Sound Energy has proposed an LNG liquefaction and bunkering facility at the Port of Tacoma, WA. Vessels traveling between Washington and Alaska typically spend the entire journey within the 200-mile North America ECA. Consequently, vessel owners operating along these routes have been interested in LNG as bunker fuel. TOTE Maritime, has begun the process of retrofitting the engines of two of its container ships to be LNG-compatible.
  • The United States LNG bunkering market has followed its growth momentum from previous years, and the new emission standard from IMO is expected to significantly contribute toward the market growth. The Jacksonville port, which had limited experience of LNG, limited infrastructure, and a relatively small market share in marine fuel bunkering, has now grown toward becoming LNG bunkering operation leader in the United States, within a span of 3 years.

Increasing Demand for Natural Gas to Drive the Market

The United States' natural gas production in 2019 was about 920.9 billion cubic meters, the highest annual amount recorded. The top five natural gas-producing states in the United States are Texas, Pennsylvania, Oklahoma, Louisiana, and Ohio.

  • The key factors driving the LNG bunkering market in the United States are the increase in LNG demand to reduce carbon footprint in the shipping industry and the increased production of natural gas in the country. Furthermore, LNG is a better alternative fuel, and the government has been taking initiatives for LNG adaptation.
  • The use of LNG allows for a significant reduction in sulfur oxide (SOX), nitrogen oxide (NOX), and carbon dioxide (CO2) emissions, thus offering ship owners and operators a sustainable solution to meet existing and future emission standards.
  • If LNG producers in the United States can supply a significant share of this market, owing to low LNG production costs, compared to other countries. LNG bunkering could increase the demand for United States natural gas production, transportation, and liquefaction. Furthermore, increasing demand can also provide an opportunity for the increase in domestically-constructed LNG bunkering barges.

Competitive Landscape

The United States LNG bunkering market is consolidated. Some of the key players in the market include Harvey Gulf International Marine LLC, NorthStar Holdco Energy, LLC, Royal Dutch Shell PLC, Conrad Shipyards LLC, and Crowley Maritime Corporation.

Key Topics Covered:

1 INTRODUCTION

2 EXECUTIVE SUMMARY

3 RESEARCH METHODOLOGY

4 MARKET OVERVIEW

4.1 Introduction

4.2 Market Size and Demand Forecast in USD billion, till 2025

4.3 Recent Trends and Developments

4.4 Government Policies and Regulations

4.5 Market Dynamics

4.6 Supply Chain Analysis

4.7 PESTLE Analysis

5 MARKET SEGMENTATION

5.1 End-User

5.1.1 Tanker Fleet

5.1.2 Container Fleet

5.1.3 Bulk and General Cargo Fleet

5.1.4 Ferries and OSV

5.1.5 Others

6 COMPETITIVE LANDSCAPE

6.1 Mergers and Acquisitions, Joint Ventures, Collaborations, and Agreements

6.2 Strategies Adopted by Leading Players

6.3 Company Profiles

6.3.1 Harvey Gulf International Marine LLC

6.3.2 NorthStar Holdco Energy, LLC

6.3.3 Royal Dutch Shell PLC

6.3.4 Crowley Maritime Corporation

6.3.5 Conrad Shipyards LLC

6.3.6 JAX LNG, LLC

6.3.7 Eagle LNG Partners LLC

7 MARKET OPPORTUNITIES AND FUTURE TRENDS

For more information about this report visit https://www.researchandmarkets.com/r/348hjr


Contacts

ResearchAndMarkets.com
Laura Wood, Senior Press Manager
This email address is being protected from spambots. You need JavaScript enabled to view it.
For E.S.T Office Hours Call 1-917-300-0470
For U.S./CAN Toll Free Call 1-800-526-8630
For GMT Office Hours Call +353-1-416-8900

KANSAS CITY, Mo.--(BUSINESS WIRE)--Kansas City Southern (KCS) (NYSE: KSU) President and Chief Executive Officer Patrick J. Ottensmeyer, and Executive Vice President Precision Scheduled Railroading Sameh Fahmy, will address the Credit Suisse 8th Annual Virtual Industrials Conference at 9:30 a.m. eastern time on Thursday, December 3, 2020. Interested investors not attending the conference may listen to the presentation via a simultaneous webcast on KCS’ website at http://investors.kcsouthern.com. A link to the replay will be available following the event.


Headquartered in Kansas City, Mo., Kansas City Southern (KCS) (NYSE: KSU) is a transportation holding company that has railroad investments in the U.S., Mexico and Panama. Its primary U.S. holding is The Kansas City Southern Railway Company, serving the central and south central U.S. Its international holdings include Kansas City Southern de Mexico, S.A. de C.V., serving northeastern and central Mexico and the port cities of Lázaro Cárdenas, Tampico and Veracruz, and a 50 percent interest in Panama Canal Railway Company, providing ocean-to-ocean freight and passenger service along the Panama Canal. KCS’ North American rail holdings and strategic alliances with other North American rail partners are primary components of a unique railway system, linking the commercial and industrial centers of the U.S., Mexico and Canada. More information about KCS can be found at www.kcsouthern.com.


Contacts

KCS: Ashley Thorne, 816-983-1530, This email address is being protected from spambots. You need JavaScript enabled to view it.

Offshore Source Logo

Offshore Source keeps you updated with relevant information concerning the Offshore Energy Sector.

Any views or opinions represented on this website belong solely to the author and do not represent those of the people, institutions or organizations that Offshore Source or collaborators may or may not have been associated with in a professional or personal capacity, unless explicitly stated.

Corporate Offices

Technology Systems Corporation
8502 SW Kansas Ave
Stuart, FL 34997

info@tscpublishing.com