Business Wire News

NEW YORK--(BUSINESS WIRE)--Golar LNG Partners LP, an indirect subsidiary of New Fortress Energy Inc. (NASDAQ: NFE), has declared a cash distribution of $0.546875 per Series A preferred unit (NASDAQ: GMLPP) for the period from February 15, 2021 through May 14, 2021. This will be payable on May 17, 2021 to all Series A preferred unitholders of record as of May 10, 2021.


About New Fortress Energy Inc.

New Fortress Energy Inc. (NASDAQ: NFE) is a global energy infrastructure company founded to help accelerate the world’s transition to clean energy. The company funds, builds and operates natural gas infrastructure and logistics to rapidly deliver fully integrated, turnkey energy solutions that enable economic growth, enhance environmental stewardship and transform local industries and communities.


Contacts

IR:
Joshua Kane
(516) 268-7455
This email address is being protected from spambots. You need JavaScript enabled to view it.

Media:
Jake Suski
(516) 268-7403
This email address is being protected from spambots. You need JavaScript enabled to view it.

StormFisher and Generate Capital team recognized for innovations in renewable natural gas production


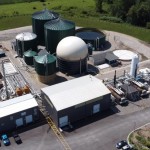
LONDON, Ontario & SAN FRANCISCO--(BUSINESS WIRE)--StormFisher, a leader in the circular economy and decarbonization solutions and Generate Capital, a leading diversified sustainable infrastructure company, announced today that their facility in London, Ontario has been awarded the 2021 Project of the Year by the Canadian Biogas Association. This award recognizes StormFisher for its renewable natural gas production system created to reduce greenhouse gases in the environment through the transformation of food waste into carbon negative fuels.

“The entire StormFisher team is extremely proud to receive this award. The addition of our renewable natural gas production system is one of the first to produce renewable natural gas from food waste to help solve both the food waste and carbon emission challenges,” says Brandon Moffatt, Co-Founder and Vice President of Development.

Decarbonization of the natural gas supply system is the next big challenge to meet the world’s collective greenhouse gas reduction goals. With over 15 years of plant operating experience across many facilities, StormFisher is a key driver in transitioning Canada’s dependence on fossil fuels into sustainable renewable energy through waste while growing the economy.

“These awards recognize and honour the accomplishments of industry leaders in the biogas sector. We are proud to showcase successful Canadian biogas projects and provide well-deserved recognition to organizations like StormFisher who are creating sustainable solutions to create a safe and clean planet,” says Jennifer Green, Executive Director, Canadian Biogas Association.

StormFisher’s London facility is one of the largest in North America processing over 120,000 tons of organics from restaurants, grocery stores, municipalities and other organizations including Enbridge, Maple Leaf Foods, Bartels International, Ontario Centre of Innovation, Labatt, and Waste Management.

The facility is owned by Generate Capital Inc., which has partnered with StormFisher to scale the biogas industry in Canada. “We’ve developed several sustainable waste management assets with StormFisher over the last several years and plan to do many more,” said Scott Jacobs, CEO of Generate. “We’re thrilled the hard work, dedication and innovation of the StormFisher and Generate teams were recognized with this award.”

“On behalf of the Ontario government, I would like to congratulate StormFisher for their leadership and innovation in the production of renewable natural gas from food and organic waste,” said Jeff Yurek, Ontario’s Minister of the Environment, Conservation and Parks and MPP for Elgin-Middlesex-London. “Private sector investments like these in clean, renewable energy programs is a great example of how industry can do their part by bringing forward innovative solutions that help Ontario meet its greenhouse gas emissions targets, while creating local jobs and powering Ontario’s economic renewal.”

To learn more about the project and the award please see the following video: https://www.youtube.com/watch?v=6b_pWXEpJtk

About StormFisher

At StormFisher, our mission is to help mitigate climate change and create a safe and clean planet for people around the world through decarbonization strategies and solutions. We do this by converting food waste, water, and energy into renewable natural gas that can be used to power businesses, manufacturing plants, schools and other organizations. Visit stormfisher.com for more information or follow up on social media:

TW: @StormFisher05
Insta: @StormFisher8
FB: @StormFisher
LinkedIn: @stormfisher-environmental-ltd

About Generate

Generate Capital, Inc. is a leading sustainable infrastructure company driving the infrastructure revolution. Generate builds, owns, operates and finances solutions for clean energy, water, waste and transportation. Founded in 2014, Generate partners with over 35 technology and project developers and owns and operates more than 2,000 assets globally. Generate is the one-stop shop offering pioneers of the infrastructure revolution tailored funding and support needed to get projects built. Our Infrastructure-as-a-Service model delivers affordable, reliable and sustainable resources to over 1,000 customers, companies, communities, school districts and universities. Together, we are rebuilding the world. For more information, please visit www.generatecapital.com.


Contacts

Chris Guillon
This email address is being protected from spambots. You need JavaScript enabled to view it.
647-295-8440

Emily Chasan
This email address is being protected from spambots. You need JavaScript enabled to view it.
415-480-2914

  • H&P's North America Solutions segment exited the second quarter of fiscal year 2021 with 109 active rigs up roughly 15% during the quarter
  • The Company ended the quarter with $562 million in cash and short-term investments and no amounts drawn on its $750 million revolving credit facility culminating in approximately $1.3 billion in available liquidity
  • Quarterly North America Solutions operating gross margins(1) increased $19 million to $64 million sequentially, as revenues increased by $48 million to $250 million and expenses increased by $29 million to $186 million
  • The Company reported a fiscal second quarter net loss of $(1.13) per diluted share; including select items(2) of $(0.53) per diluted share
  • The Company incurred a non-cash impairment charge of $54 million related to fair market adjustments for decommissioned rigs that are held for sale and recognized a $23 million loss on sales related to excess drilling equipment and spares
  • Adoption of our drilling automation technologies and new commercial models continues to increase with 25% to 30% of our active FlexRig® fleet utilizing AutoSlide®, and roughly 30% utilizing some form of performance-based contract
  • On March 3, 2021, the Board of Directors of the Company declared a quarterly cash dividend of $0.25 per share, payable on June 1, 2021, to stockholders of record at the close of business on May 17, 2021

TULSA, Okla.--(BUSINESS WIRE)--Helmerich & Payne, Inc. (NYSE: HP) reported a net loss of $121 million, or $(1.13) per diluted share, from operating revenues of $296 million for the quarter ended March 31, 2021, compared to a net loss of $70 million, or $(0.66) per diluted share, on revenues of $246 million for the quarter ended December 31, 2020. The net losses per diluted share for the second and first quarters of fiscal year 2021 include $(0.53) and $0.16, respectively, of after-tax gains and losses comprised of select items(2). For the second quarter of fiscal year 2021, select items(2) were comprised of:


  • $0.04 of after-tax gains pertaining to a non-cash fair market adjustment to our equity investment, and discontinued operations related to adjustments resulting from currency fluctuations
  • $(0.57) of after-tax losses pertaining to a non-cash impairment for fair market adjustments to decommissioned rigs that are held for sale, loss on sales of excess drilling equipment and spares, and restructuring charges

Net cash provided by operating activities was $78 million for the second quarter of fiscal year 2021 compared to net cash used in operating activities of $20 million for the first quarter of fiscal year 2021.

President and CEO John Lindsay commented, "The increase in activity we experienced during the first half of our fiscal 2021 year has been encouraging, particularly in light of the record industry downturn last year. As in the past, our strong market standing and flexible financial position is enabling us to concentrate on long-term, strategic objectives during volatile and uncertain markets. We are making good progress in deploying digital technology solutions and introducing new commercial models to the industry, but realize there is still a lot of work ahead of us.

"Clearly, the energy industry's capital discipline, which started prior to the global pandemic, remains resolute, and this is something we are actually pleased to see. The attention to controlled spending and generating returns in a variety of commodity price environments is what the industry needs to attract and retain investment. A natural step in capital discipline is deriving the most value per capital dollar spent, not just in a one-year budget cycle, but over the life of an investment. This corresponds directly to where we believe H&P, as the leading drilling solutions provider, delivers the most value to our customers and is the driver behind the development of our digital technology solutions and commercial models that are structured around achieving value-added outcomes.

"H&P's focus will remain on bringing value to the customer by leveraging software, data and FlexRig technology. Our digitally-enabled drilling operations provide automation solutions that deliver both efficiency gains and wellbore quality. Our customers experience not only near-term financial benefits, like lower well costs and the reduction of certain downhole risks, but also have positive economic implications over the long-term life of the well. An important ingredient to a successful technology strategy is the integration of new commercial models, which incorporate performance metrics into the contract. New commercial models are designed to generate win-win outcomes - the customer has a well with improved economics and H&P is compensated for helping to create a portion of that value. Currently, approximately 30% of our active fleet in the U.S. is under some type of performance contract."

Senior Vice President and CFO Mark Smith also commented, "The quality and strength of H&P's financial position, after emerging from one of the most challenging times in the Company's history, bears reiteration. H&P exited the March fiscal quarter with $562 million in cash and short-term investments, a debt-to-cap of 14% and approximately $1.3 billion in available liquidity. Additionally, lenders with $680 million of commitments under our undrawn revolving credit facility recently exercised their option to extend the maturity of our credit facility by one year to 2025. Much like the Company's strong balance sheet, the commitment to our long-standing capital allocation strategy of returning cash to shareholders remains firmly intact.

"As the market landscape continues to evolve, the Company's focus on marketing its highly capable, super-spec FlexRig fleet is more pronounced leading us to initiate a plan in March of this year to sell certain older, less capable rigs, the majority of which were previously decommissioned, written down and expected to be sold for scrap. As a result of this plan, we reclassified those assets to held for sale for accounting purposes and we incurred an impairment of $54 million related to fair market adjustments. Additionally we recognized a $23 million loss on sales related to excess drilling equipment and spares.

"We continue to move forward with our strategies of further rationalizing our operating cost structure by identifying other areas of potential cost improvement. We are now quantifying the expected savings and timing of these strategies with the expectation of implementing these initiatives in the coming quarters. The margin improvements resulting from these additional cost saving initiatives will be recognized over the next few quarters with the full ongoing benefits expected to be realized in fiscal 2022."

John Lindsay concluded, “One of H&P's strengths is its ability to adapt to changing, and often volatile, market conditions. Our people, rig assets and technology, and financial position are the drivers behind why H&P is considered a market leader and partner of choice within the industry. While challenges still remain ahead, I am confident that H&P and our people are up to the task and will be successful."

Operating Segment Results for the Second Quarter of Fiscal Year 2021

North America Solutions:

This segment had an operating loss of $109.8 million compared to an operating loss of $72.9 million during the previous quarter. The increase in the operating loss was due to impairments related to fair market adjustments to decommissioned rigs that are held for sale and restructuring charges. Absent these select items(2), this segment's operating loss declined by $18.8 million on a sequential basis, due mainly to a higher level of rig activity.

Operating gross margins(1) increased by $19.4 million to $64.1 million as both revenues and expenses increased sequentially. There was no early contract termination revenue recognized during the quarter compared to the prior quarter, which benefited from $5.8 million in early contract termination revenue. Operating results were still negatively impacted by the costs associated with reactivating rigs; $9.7 million in the second fiscal quarter compared to $10.6 million in the first fiscal quarter. While 21 idle rigs were reactivated during the quarter, only 15 were incremental to the rig count due to the normal contracting churn. The majority of the remaining reactivated rigs have already returned to service subsequent to March 31, 2021.

International Solutions:

This segment had an operating loss of $3.5 million compared to an operating loss of $8.4 million during the previous quarter. Operating gross margins(1) improved to a negative $1.9 million from a negative $7.0 million in the previous quarter, as the current quarter benefited from additional revenue days and certain revenue reimbursements of approximately $1.9 million. Current quarter results included a $2.4 million foreign currency loss related to our South American operations compared to an approximate $1.9 million foreign currency loss in the first quarter of fiscal year 2021.

Offshore Gulf of Mexico:

This segment had operating income of $3.0 million compared to operating income of $2.7 million during the previous quarter. Operating gross margins(1) remained relatively flat at $6.2 million compared to $6.0 million in the prior quarter.

Operational Outlook for the Third Quarter of Fiscal Year 2021

North America Solutions:

  • We expect North America Solutions operating gross margins(1) to be between $65-$75 million
  • We expect to exit the quarter at between 120-125 contracted rigs

International Solutions:

  • We expect International Solutions operating gross margins(1) to be between $(1)-$(3) million, exclusive of any foreign exchange gains or losses

Offshore Gulf of Mexico:

  • We expect Offshore Gulf of Mexico operating gross margins(1) to be between $6-$9 million

Other Estimates for Fiscal Year 2021

  • Gross capital expenditures are still expected to be approximately $85 to $105 million; roughly one-third expected for maintenance, roughly one-third expected for skidding to walking conversions and roughly one-third for corporate and information technology. Ongoing asset sales include reimbursements for lost and damaged tubulars and sales of other used drilling equipment that offset a portion of the gross capital expenditures and are still expected to total approximately $25 million in fiscal year 2021. Note the sale of the offshore platform rig during the first quarter of fiscal year 2021 is excluded from this number.
  • Depreciation is now expected to be approximately $425 million
  • Research and development expenses for fiscal year 2021 are now expected to be roughly $25 million
  • General and administrative expenses for fiscal year 2021 are still expected to be approximately $160 million

Select Items Included in Net Income per Diluted Share

Second quarter of fiscal year 2021 net loss of $(1.13) per diluted share included $(0.53) in after-tax losses comprised of the following:

  • $0.02 of non-cash after-tax gains related to fair market value adjustments to equity investments
  • $0.02 of non-cash after-tax gains from discontinued operations related to adjustments resulting from currency fluctuations
  • $(0.01) of after-tax losses related to restructuring charges
  • $(0.17) of after-tax losses pertaining to the sale of excess drilling equipment and spares
  • $(0.39) of non-cash after-tax losses for impairments related to fair market value adjustments to decommissioned rigs that are held for sale

First quarter of fiscal year 2021 net loss of $(0.66) per diluted share included $0.16 in after-tax gains comprised of the following:

  • $0.07 of after-tax gains pertaining to the sale of an offshore platform rig
  • $0.07 of non-cash after-tax gains from discontinued operations related to adjustments resulting from currency fluctuations
  • $0.02 of non-cash after-tax gains related to fair market value adjustments to equity investments
  • $(0.00) of after-tax losses related to restructuring charges

Conference Call

A conference call will be held on Friday, April 30, 2021, at 11:00 a.m. (ET) with John Lindsay, President and CEO, Mark Smith, Senior Vice President and CFO, and Dave Wilson, Vice President of Investor Relations, to discuss the Company’s second quarter fiscal year 2021 results. Dial-in information for the conference call is (800) 895-3361 for domestic callers or (785) 424-1062 for international callers. The call access code is ‘Helmerich’. You may also listen to the conference call that will be broadcast live over the internet by logging on to the Company’s website at http://www.helmerichpayne.com and accessing the corresponding link through the investor relations section by clicking on “Investors” and then clicking on “News and Events - Events & Presentations” to find the event and the link to the webcast.

About Helmerich & Payne, Inc.

Founded in 1920, Helmerich & Payne, Inc. (H&P) (NYSE: HP) is committed to delivering industry leading levels of drilling productivity and reliability. H&P operates with the highest level of integrity, safety and innovation to deliver superior results for its customers and returns for shareholders. Through its subsidiaries, the Company designs, fabricates and operates high-performance drilling rigs in conventional and unconventional plays around the world. H&P also develops and implements advanced automation, directional drilling and survey management technologies. At March 31, 2021, H&P's fleet included 242 land rigs in the U.S., 32 international land rigs and seven offshore platform rigs. For more information, see H&P online at www.helmerichpayne.com.

Forward-Looking Statements

This release includes “forward-looking statements” within the meaning of the Securities Act of 1933 and the Securities Exchange Act of 1934, and such statements are based on current expectations and assumptions that are subject to risks and uncertainties. All statements other than statements of historical facts included in this release, including, without limitation, statements regarding the registrant’s future financial position, operations outlook, business strategy, dividends, budgets, projected costs and plans and objectives of management for future operations are forward-looking statements. For information regarding risks and uncertainties associated with the Company’s business, please refer to the “Risk Factors” and “Management’s Discussion and Analysis of Financial Condition and Results of Operations” sections of the Company’s SEC filings, including but not limited to its annual report on Form 10‑K and quarterly reports on Form 10‑Q. As a result of these factors, Helmerich & Payne, Inc.’s actual results may differ materially from those indicated or implied by such forward-looking statements. We undertake no duty to update or revise our forward-looking statements based on changes in internal estimates, expectations or otherwise, except as required by law.

We use our Investor Relations website as a channel of distribution for material company information. Such information is routinely posted and accessible on our Investor Relations website at www.helmerichpayne.com.


Note Regarding Trademarks. Helmerich & Payne, Inc. owns or has rights to the use of trademarks, service marks and trade names that it uses in conjunction with the operation of its business. Some of the trademarks that appear in this release or otherwise used by H&P include FlexRig and AutoSlide, which may be registered or trademarked in the U.S. and other jurisdictions.

(1) Operating gross margin is defined as operating revenues less direct operating expenses.

(2) See the corresponding section of this release for details regarding the select items. The Company believes identifying and excluding select items is useful in assessing and understanding current operational performance, especially in making comparisons over time involving previous and subsequent periods and/or forecasting future periods results. Select items are excluded as they are deemed to be outside of the Company's core business operations.

HELMERICH & PAYNE, INC.

Condensed Consolidated Statements of Operations

(Unaudited)


Three Months Ended


Six Months Ended

(in thousands, except per share amounts)

March 31,


December 31


March 31,


March 31,


March 31,

2021


2020


2020


2021


2020

Operating revenues


Drilling services

$

294,026


$

244,781


$

630,290


$

538,807


$

1,241,688


Other

2,145


1,596


3,349


3,741


6,608


296,171


246,377


633,639


542,548


1,248,296


Operating costs and expenses


Drilling services operating expenses, excluding depreciation and amortization

230,313


198,689


417,743


429,002


817,072


Other operating expenses

1,274


1,362


1,315


2,636


2,737


Depreciation and amortization

106,417


106,861


132,006


213,278


262,137


Research and development

5,334


5,583


6,214


10,917


13,092


Selling, general and administrative

39,349


39,303


41,978


78,652


91,786


Asset impairment charge

54,284


563,234


54,284


563,234


Restructuring charges

1,608


138


1,746


(Gain) loss on sale of assets

18,515


(12,336

)


(10,310

)


6,179


(14,589

)


457,094


339,600


1,152,180


796,694


1,735,469


Operating loss from continuing operations

(160,923

)


(93,223

)


(518,541

)


(254,146

)


(487,173

)

Other income (expense)


Interest and dividend income

4,819


1,879


3,566


6,698


5,780


Interest expense

(5,759

)


(6,139

)


(6,095

)


(11,898

)


(12,195

)

Gain (loss) on investment securities

2,520


2,924


(12,413

)


5,444


(9,592

)

Gain on sale of subsidiary


14,963


Other

(577

)


(1,480

)


(398

)


(2,057

)


(797

)


1,003


(2,816

)


(15,340

)


(1,813

)


(1,841

)

Loss from continuing operations before income taxes

(159,920

)


(96,039

)


(533,881

)


(255,959

)


(489,014

)

Income tax benefit

(36,624

)


(18,115

)


(113,413

)


(54,739

)


(99,275

)

Loss from continuing operations

(123,296

)


(77,924

)


(420,468

)


(201,220

)


(389,739

)

Income from discontinued operations before income taxes

2,293


7,493


6,067


9,786


13,524


Income tax provision


6,139


13,720


Income (loss) from discontinued operations

2,293


7,493


(72

)


9,786


(196

)

Net loss

$

(121,003

)


$

(70,431

)


$

(420,540

)


$

(191,434

)


$

(389,935

)


Basic earnings (loss) per common share:


Loss from continuing operations

$

(1.15

)


$

(0.73

)


$

(3.88

)


$

(1.87

)


$

(3.61

)

Income from discontinued operations

$

0.02


$

0.07


$


$

0.09


$


Net loss

$

(1.13

)


$

(0.66

)


$

(3.88

)


$

(1.78

)


$

(3.61

)


Diluted earnings (loss) per common share:


Loss from continuing operations

$

(1.15

)


$

(0.73

)


$

(3.88

)


$

(1.87

)


$

(3.61

)

Income from discontinued operations

$

0.02


$

0.07


$


$

0.09


$


Net loss

$

(1.13

)


$

(0.66

)


$

(3.88

)


$

(1.78

)


$

(3.61

)


Weighted average shares outstanding (in thousands):


Basic

107,861


107,617


108,577


107,738


108,556


Diluted

107,861


107,617


108,577


107,738


108,556


HELMERICH & PAYNE, INC.

Condensed Consolidated Balance Sheets

(Unaudited)


March 31,


September 30,

(in thousands except share data and share amounts)

2021


2020

Assets


Current Assets:


Cash and cash equivalents

$

427,243


$

487,884


Short-term investments

134,491


89,335


Accounts receivable, net of allowance of $1,806 and $1,820, respectively

209,402


192,623


Inventories of materials and supplies, net

96,504


104,180


Prepaid expenses and other, net

97,857


89,305


Assets held-for-sale

13,076


Total current assets

978,573


963,327


Investments

34,569


31,585


Property, plant and equipment, net

3,374,235


3,646,341


Other Noncurrent Assets:


Goodwill

45,653


45,653


Intangible assets, net

77,430


81,027


Operating lease right-of-use asset

56,474


44,583


Other assets, net

21,170


17,105


Total other noncurrent assets

200,727


188,368


Total assets

$

4,588,104


$

4,829,621


Liabilities and Shareholders’ Equity


Current Liabilities:


Accounts payable

$

63,934


$

36,468


Dividends payable

27,327


27,226


Accrued liabilities

160,342


155,442


Total current liabilities

251,603


219,136


Noncurrent Liabilities:


Long-term debt, net

481,647


480,727


Deferred income taxes

604,536


650,675


Other

163,063


147,180


Noncurrent liabilities - discontinued operations

3,559


13,389


Total noncurrent liabilities

1,252,805


1,291,971


Shareholders' Equity:


Common stock, $.10 par value, 160,000,000 shares authorized, 112,222,865 and 112,151,563 shares issued as of March 31, 2021 and September 30, 2020, respectively, and 107,893,998 and 107,488,242 shares outstanding as of March 31, 2021 and September 30, 2020, respectively

11,222


11,215


Preferred stock, no par value, 1,000,000 shares authorized, no shares issued


Additional paid-in capital

516,870


521,628


Retained earnings

2,762,735


3,010,012


Accumulated other comprehensive loss

(25,274

)


(26,188

)

Treasury stock, at cost, 4,328,867 shares and 4,663,321 shares as of March 31, 2021 and September 30, 2020, respectively

(181,857

)


(198,153

)

Total shareholders’ equity

3,083,696


3,318,514


Total liabilities and shareholders' equity

$

4,588,104


$

4,829,621


HELMERICH & PAYNE, INC.

Condensed Consolidated Statements of Cash Flows

(Unaudited)


Six Months Ended March 31,

(in thousands)

2021


2020

OPERATING ACTIVITIES:


Net loss

$

(191,434

)


$

(389,935

)

Adjustment for (income) loss from discontinued operations

(9,786

)


196


Loss from continuing operations

(201,220

)


(389,739

)

Adjustments to reconcile net loss to net cash provided by operating activities:


Depreciation and amortization

213,278


262,137


Asset impairment charge

54,284


563,234


Amortization of debt discount and debt issuance costs

920


900


Provision for credit loss

(227

)


1,779


Provision for obsolete inventory

423


684


Stock-based compensation

14,277


20,952


(Gain) loss on investment securities

(5,444

)


9,592


(Gain) loss on sale of assets

6,179


(14,589

)

Gain on sale of subsidiary


(14,963

)

Deferred income tax benefit

(46,068

)


(106,878

)

Other

3,646


(3,779

)

Changes in assets and liabilities

18,779


(96,660

)

Net cash provided by operating activities from continuing operations

58,827


232,670


Net cash used in operating activities from discontinued operations

(25

)


(28

)

Net cash provided by operating activities

58,802


232,642


INVESTING ACTIVITIES:


Capital expenditures

(30,745

)


(94,312

)

Purchase of investments

(106,731

)


(36,336

)

Proceeds from sale of investments

63,742


43,894


Proceeds from sale of subsidiary


15,056


Proceeds from asset sales

13,419


24,799


Other


(51

)

Net cash used in investing activities

(60,315

)


(46,950

)


FINANCING ACTIVITIES:


Dividends paid

(54,230

)


(155,890

)

Proceeds from stock option exercises


4,100


Payments for employee taxes on net settlement of equity awards

(2,119

)


(3,455

)

Payment of contingent consideration from acquisition of business

(250

)


(4,250

)

Share repurchase


(28,504

)

Other


(445

)

Net cash used in financing activities

(56,599

)


(188,444

)

Net decrease in cash and cash equivalents and restricted cash

(58,112

)


(2,752

)

Cash and cash equivalents and restricted cash, beginning of period

536,747


382,971


Cash and cash equivalents and restricted cash, end of period

$

478,635


$

380,219


Three Months Ended


Six Months Ended

SEGMENT REPORTING

March 31,


December 31


March 31,


March 31,

(in thousands, except operating statistics)

2021


2020


2020(1)


2021


2020(1)

NORTH AMERICA SOLUTIONS OPERATIONS


Operating revenues

$

249,939


$

201,990


$

545,961


$

451,929


$

1,070,642


Direct operating expenses

185,841


157,309


346,564


343,150


679,546


Segment gross margin (3)

64,098


44,681


199,397


108,779


391,096


Depreciation

99,917


100,324


117,334


200,241


233,399


Research and development

5,329


5,466


5,663


10,795


12,412


Selling, general and administrative expense

12,960


11,680


12,519


24,640


29,265


Asset impairment charge

54,284


406,548


54,284


406,548


Restructuring charges

1,442


139


1,581


Segment operating loss

$

(109,834

)


$

(72,928

)


$

(342,667

)


$

(182,762

)


$

(290,528

)

Operating Statistics (2):


Average active rigs

105


81


190


93


191


Number of active rigs at the end of period

109


94


150


109


150


Number of available rigs at the end of period

242


262


299


242


299


Reimbursements of "out-of-pocket" expenses

$

27,290


$

18,789


$

77,166


$

46,079


$

136,734


INTERNATIONAL SOLUTIONS OPERATIONS


Operating revenues

$

14,813


$

10,518


$

51,250


$

25,331


$

97,712


Direct operating expenses

16,718


17,523


37,964


34,241


72,039


Segment gross margin (3)

(1,905

)


(7,005

)


13,286


(8,910

)


25,673


Depreciation

415


373


7,821


788


15,638


Selling, general and administrative expense

1,138


979


1,248


2,117


2,703


Asset impairment charge


156,686


156,686


Segment operating loss

$

(3,458

)


$

(8,357

)


$

(152,469

)


$

(11,815

)


$

(149,354

)

Operating Statistics (2):


Average active rigs

4


4


17


4


17


Number of active rigs at the end of period

5


4


15


5


15


Number of available rigs at the end of period

32


32


32


32


32


Reimbursements of "out-of-pocket" expenses

$

1,613


$

2,559


$

2,209


$

4,172


$

3,796


OFFSHORE GULF OF MEXICO OPERATIONS


Operating revenues

$

29,274


$

32,273


$

33,079


$

61,547


$

73,334


Direct operating expenses

23,069


26,256


32,648


49,325


62,693


Segment gross margin (3)

6,205


6,017


431


12,222


10,641


Depreciation

2,593


2,606


2,842


5,199


5,587


Selling, general and administrative expense

634


669


908


1,303


2,045


Segment operating income (loss)

$

2,978


$

2,742


$

(3,319

)


$

5,720


$

3,009


Operating Statistics (2):


Average active rigs

4


5


5


5


6


Number of active rigs at the end of period

4


4


5


4


5


Number of available rigs at the end of period

7


7


8


7


8


Reimbursements of "out-of-pocket" expenses

$

5,193


$

7,868


$

6,763


$

13,061


$

16,663


Contacts

Dave Wilson, Vice President of Investor Relations
This email address is being protected from spambots. You need JavaScript enabled to view it.
(918) 588‑5190


Read full story here

DAR ES SALAAM, Tanzania--(BUSINESS WIRE)--Recently, a 750 HP desert drilling rig and supporting equipment developed and manufactured by Shandong Kerui Petroleum & Gas Equipment Co., Ltd. arrived in Libya smoothly. The truck-mounted drilling and work-over rig provided by Kerui Petroleum & Gas Equipment is customized for the special service environment, which can adapt to 55 ℃ high temperature environment and fully meet the operation requirements of soft sand environment in the desert area in Sahara.

The chassis of the truck-mounted work over rig is a 10 × 10 full drive oil field special off-road chassis, equipped with desert tires, which can reasonably distribute the chassis load and has super off-road performance. The rig adopts a unique radiator suitable for high temperature desert areas to cool down the hydraulic oil. At the same time, the engine adopts a special air filter to adapt to the desert high temperature and strong sand working environment. The workover platform can realize overall transportation with the rig, thus to improve the moving efficiency and reduces the transportation unit and transportation cost.

Kerui Petroleum & Gas is an international comprehensive industrial group providing high-end oil equipment, oil and gas field technical services and EPC engineering services to the global oil and gas industry. At present, Kerui's marketing and service network has covered 57 countries and regions in the world, providing quality services and practical products for more than 8000 customers in more than 80 countries and regions. Up to now, Kerui has established a complete sales and service network in many major African petroleum producing countries such as Algeria, Ethiopia, Libya and Egypt. More than 10 sets of Kerui drilling and work-over rig are in operated actively in the vast Sahara area, contributing a great force to the oil exploitation and steady increase in Africa.


Contacts

Jason Guo
Sales Director - Kenya/Tanzania
Tel: +254-79-957-4005 Kenya
+255-76-650-6239 Tanzania

Strategy and execution delivering free cash flow and reducing debt

SPRING, Texas--(BUSINESS WIRE)--Southwestern Energy Company (NYSE: SWN) today announced financial and operating results for the first quarter ended March 31, 2021.


  • Achieved $347 million net cash provided by operating activities; invested $266 million consistent with its maintenance capital plan;
  • Generated $88 million free cash flow (non-GAAP);
  • Free cash flow fully utilized to reduce debt; expect to approach 2.0x leverage by year-end;
  • Borrowing base and commitments reaffirmed at elected $2.0 billion;
  • Reported total production of 269 Bcfe, or 3.0 Bcfe per day, including 2.4 Bcf per day of gas and 103 MBbls per day of liquids;
  • Received weighted average realized price (excluding transportation) of $2.99 per Mcfe; and
  • Approximately 80% of annual natural gas production protected from impacts of widening Appalachia differentials through transportation capacity and basis hedges.

“The Company’s returns-driven strategy is underpinned by a lower cost structure, improving operational performance, a strong balance sheet, the generation of free cash flow and capturing the benefits of scale, all while operating safely and responsibly. In the first quarter, we delivered on each of these aspects of our strategy. Our teams continue to innovate and create opportunities to further improve results,” said Bill Way, Southwestern Energy President and Chief Executive Officer.

Financial Results


For the three months ended


March 31,

(in millions)

2021


2020

Net income (loss)

$

80


$

(1,547

)

Adjusted net income (non-GAAP)

$

196


$

56


Diluted earnings (loss) per share

$

0.12


$

(2.86

)

Adjusted diluted earnings per share (non-GAAP)

$

0.29


$

0.10


Adjusted EBITDA (non-GAAP)

$

382


$

206


Net cash provided by operating activities

$

347


$

160


Net cash flow (non-GAAP)

$

354


$

191


Total capital investments (1)

$

266


$

237


(1)

Capital investments include increases of $38 million and $8 million for the three months ended March 31, 2021 and 2020, respectively, relating to the change in capital accruals between periods.

For the quarter ended March 31, 2021, Southwestern Energy recorded net income of $80 million, or $0.12 per diluted share, compared to a net loss in 2020 of $1.5 billion, or ($2.86) per diluted share, attributable to a $1.48 billion non-cash full cost ceiling test impairment and $408 million tax valuation allowance included in 2020 results.

Adjusted net income was $196 million, or $0.29 per diluted share, in the first quarter of 2021, compared to $56 million, or $0.10 per diluted share, for the prior year period. The increase was primarily related to an 18% increase in the weighted average realized price including derivatives and a 34% increase in production volumes, largely due to the Montage acquisition. Adjusted EBITDA (non-GAAP) was $382 million, net cash provided by operating activities was $347 million and net cash flow (non-GAAP) was $354 million.

As indicated in the table below, first quarter 2021 weighted average realized price, including $0.37 per Mcfe of transportation expenses, was $2.62 per Mcfe excluding the impact of derivatives. Including derivatives, weighted average realized price (including transportation) for the quarter was up 18% from $2.16 per Mcfe in 2020 to $2.54 per Mcfe in 2021 primarily due to higher commodity prices including a 38% increase in NYMEX Henry Hub and a 25% increase in WTI. First quarter 2021 weighted average realized price before transportation expense and excluding the impact of derivatives was $2.99 per Mcfe.

At quarter end, the Company had hedges in place for 88% of its remaining 2021 expected natural gas production, 60% of its 2021 expected natural gas liquids (NGLs) production and 93% of its 2021 expected oil production. During the quarter, SWN realized a $41 million gain from settled basis hedges which was more than offset by losses associated with settled NGL and oil hedges due to increased liquids prices, for a total $22 million settled hedge loss.

As of March 31, 2021, Southwestern Energy had total debt of $3.0 billion with the leverage ratio improving to 3.0x. The Company’s borrowing base was reaffirmed as part of its regularly scheduled spring redetermination, with revolving credit facility commitments unchanged at the elected $2.0 billion and asset coverage continuing to exceed the borrowing base. At quarter end, the Company had $567 million of borrowings under its revolving credit facility with $233 million in letters of credit. During the quarter, debt was reduced by $133 million, which included $88 million in free cash flow and changes in working capital.

Realized Prices


For the three months ended

(includes transportation costs)


March 31,


2021


2020

Natural Gas Price:


NYMEX Henry Hub price ($/MMBtu) (1)


$

2.69


$

1.95


Discount to NYMEX (2)


(0.58

)


(0.42

)

Realized gas price per Mcf, excluding derivatives


$

2.11


$

1.53


Gain on settled financial basis derivatives ($/Mcf)


0.19


0.10


Gain on settled commodity derivatives ($/Mcf)


0.03


0.31


Realized gas price, including derivatives ($/Mcf)


$

2.33


$

1.94


Oil Price:


WTI oil price ($/Bbl)


$

57.84


$

46.17


Discount to WTI


(9.70

)


(9.45

)

Realized oil price, excluding derivatives ($/Bbl)


$

48.14


$

36.72


Realized oil price, including derivatives ($/Bbl)


$

36.97


$

45.97


NGL Price:


Realized NGL price, excluding derivatives ($/Bbl)


$

22.86


$

8.16


Realized NGL price, including derivatives ($/Bbl)


$

16.11


$

10.78


Percentage of WTI, excluding derivatives


40

%


18

%

Total Weighted Average Realized Price:


Excluding derivatives ($/Mcfe)


$

2.62


$

1.69


Including derivatives ($/Mcfe)


$

2.54


$

2.16


(1)

Based on last day monthly futures settlement prices.

(2)

This discount includes a basis differential, a heating content adjustment, physical basis sales, third-party transportation charges and fuel charges, and excludes financial basis derivatives.

Operational Results

Total production for the quarter ended March 31, 2021 was 269 Bcfe, of which 79% was natural gas, 17% NGLs and 4% oil. Capital investments totaled $266 million for the first quarter, with 23 wells drilled, 29 wells completed and 17 wells placed to sales.


For the three months ended


March 31,


2021


2020

Production


Gas production (Bcf)


214


156


Oil production (MBbls)


1,662


1,399


NGL production (MBbls)


7,578


6,128


Total production (Bcfe)


269


201


Average unit costs per Mcfe


Lease operating expenses (1)


$

0.93


$

0.96


General & administrative expenses (2,3)


$

0.13


$

0.11


Taxes, other than income taxes


$

0.09


$

0.07


Full cost pool amortization


$

0.33


$

0.53


(1)

Includes post-production costs such as gathering, processing, fractionation and compression.

(2)

Excludes $6 million in restructuring and $1 million in Montage merger-related expenses for the three months ended March 31, 2021, and $10 million in restructuring charges for the same period in 2020.

(3)

Increased $12 million for the three months ended March 31, 2021, compared to the same period in 2020, as a result of increased share price and mark-to-market impact on the value of share-based awards.

Southwest Appalachia – In the first quarter, total production was 151 Bcfe, with NGL production of 84 MBbls per day and oil production of 18 MBbls per day. The Company drilled 12 wells, completed 17 wells and placed nine wells to sales, with all the wells to sales located in the super rich acreage with an average lateral length of 12,629 feet. The wells placed to sales during the quarter had an average 30-day rate of 11 MMcfe per day, including 68% liquids.

Northeast Appalachia – First quarter 2021 production was 118 Bcf. The Company drilled 11 wells, completed 12 wells and placed eight wells to sales with an average lateral length of 13,470 feet. The wells placed to sales during the quarter had an average 30-day rate of 18 MMcf per day.

E&P Division Results

For the three months ended

March 31, 2021


Northeast


Southwest

Gas production (Bcf)


118


96

Liquids production


Oil (MBbls)


1,658

NGL (MBbls)


7,577

Production (Bcfe)


118


151


Gross operated production March 2021 (MMcfe/d)


1,560


2,502

Net operated production March 2021 (MMcfe/d)


1,278


1,702


Capital investments (in millions)


Drilling and completions, including workovers

$

71


$

142

Land acquisition and other


4


9

Capitalized interest and expense


5


32

Total capital investments

$

80


$

183


Gross operated well activity summary


Drilled


11


12

Completed


12


17

Wells to sales


8


9


Average well cost on wells to sales (in millions)

$

8.4


$

8.0

Average lateral length (in ft)


13,470


12,629


Total weighted average realized price per Mcfe, excluding derivatives

$

2.24


$

2.91

Conference Call

Southwestern Energy will host a conference call and webcast on Friday, April 30, 2021 at 9:30 a.m. Central to discuss first quarter 2021 results. To participate, dial US toll-free 877-883-0383, or international 412-902-6506 and enter access code 2265512. The conference call will webcast live at www.swn.com.

To listen to a replay of the call, dial 877-344-7529, International 412-317-0088, or Canada Toll Free 855-669-9658. Enter replay access code 10154901. The replay will be available until May 30, 2021.

About Southwestern Energy

Southwestern Energy Company is an independent energy company engaged in natural gas, natural gas liquids and oil exploration, development, production and marketing. For additional information, visit our website www.swn.com.

Forward Looking Statement

Certain statements and information herein may constitute “forward-looking statements” within the meaning of the Private Securities Litigation Reform Act of 1995. The words “believe,” “expect,” “anticipate,” “plan,” “intend,” “foresee,” “should,” “would,” “could,” “attempt,” “appears,” “forecast,” “outlook,” “estimate,” “project,” “potential,” “may,” “will,” “are likely,” “guidance,” “goal,” “model,” “target,” “budget” and other similar expressions are intended to identify forward-looking statements, which are generally not historical in nature. Statements may be forward looking even in the absence of these particular words. Examples of forward-looking statements include, but are not limited to, statements regarding the financial position, business strategy, production, reserve growth and other plans and objectives for our future operations, and generation of free cash flow. These forward-looking statements are based on our current expectations and beliefs concerning future developments and their potential effect on us. The forward-looking statements contained in this document are largely based on our expectations for the future, which reflect certain estimates and assumptions made by our management. These estimates and assumptions reflect our best judgment based on currently known market conditions, operating trends, and other factors. Although we believe such estimates and assumptions to be reasonable, they are inherently uncertain and involve a number of risks and uncertainties that are beyond our control. As such, management’s assumptions about future events may prove to be inaccurate. For a more detailed description of the risks and uncertainties involved, see “Risk Factors” in our most recently filed Annual Report on Form 10-K, subsequent Quarterly Reports on Form 10-Q, Current Reports on Form 8-K, and other SEC filings. We do not intend to publicly update or revise any forward-looking statements as a result of new information, future events, changes in circumstances, or otherwise. These cautionary statements qualify all forward-looking statements attributable to us, or persons acting on our behalf. Management cautions you that the forward looking statements contained herein are not guarantees of future performance, and we cannot assure you that such statements will be realized or that the events and circumstances they describe will occur. Factors that could cause actual results to differ materially from those anticipated or implied in the forward-looking statements herein include, but are not limited to: the timing and extent of changes in market conditions and prices for natural gas, oil and natural gas liquids (“NGLs”), including regional basis differentials and the impact of reduced demand for our production and products in which our production is a component due to governmental and societal actions taken in response to the COVID-19 pandemic; our ability to fund our planned capital investments; a change in our credit rating, an increase in interest rates and any adverse impacts from the discontinuation of the London Interbank Offered Rate; the extent to which lower commodity prices impact our ability to service or refinance our existing debt; the impact of volatility in the financial markets or other global economic factors, including the impact of COVID-19; difficulties in appropriately allocating capital and resources among our strategic opportunities; the timing and extent of our success in discovering, developing, producing and estimating reserves; our ability to maintain leases that may expire if production is not established or profitably maintained; our ability to realize the expected benefits from the acquisition of Montage Resources Corporation (“Montage Acquisition”); costs in connection with the Montage Acquisition; integration of operations and results subsequent to the Montage Acquisition; our ability to transport our production to the most favorable markets or at all; the impact of government regulation, including changes in law, the ability to obtain and maintain permits, any increase in severance or similar taxes, and legislation or regulation relating to hydraulic fracturing, climate and over-the-counter derivatives; the impact of the adverse outcome of any material litigation against us or judicial decisions that affect us or our industry generally; the effects of weather; increased competition; the financial impact of accounting regulations and critical accounting policies; the comparative cost of alternative fuels; credit risk relating to the risk of loss as a result of non-performance by our counterparties; and any other factors listed in the reports we have filed and may file with the SEC that are incorporated by reference herein. All written and oral forward-looking statements attributable to us are expressly qualified in their entirety by this cautionary statement.


SOUTHWESTERN ENERGY COMPANY AND SUBSIDIARIES

CONSOLIDATED STATEMENTS OF OPERATIONS

(Unaudited)


For the three months ended


March 31,

(in millions, except share/per share amounts)


2021


2020

Operating Revenues:


Gas sales


$

464


$

248


Oil sales


81


52


NGL sales


173


50


Marketing


352


239


Other


2


3


1,072


592


Operating Costs and Expenses:


Marketing purchases


356


248


Operating expenses


250


193


General and administrative expenses


38


26


Montage merger-related expenses


1


Restructuring charges


6


10


Depreciation, depletion and amortization


96


113


Impairments


1,479


Taxes, other than income taxes


24


13


771


2,082


Operating Income (Loss)


301


(1,490

)

Interest Expense:


Interest on debt


50


40


Other interest charges


3


2


Interest capitalized


(22

)


(23

)


31


19


Gain (Loss) on Derivatives


(191

)


339


Gain on Early Extinguishment of Debt


28


Other Income, Net


1


1


Income (Loss) Before Income Taxes


80


(1,141

)

Provision (Benefit) for Income Taxes:


Current


(2

)

Deferred


408


406


Net Income (Loss)


$

80


$

(1,547

)


Earnings (Loss) Per Common Share:


Basic


$

0.12


$

(2.86

)

Diluted


$

0.12


$

(2.86

)


Weighted Average Common Shares Outstanding:


Basic


675,385,145


540,308,491


Diluted


679,359,277


540,308,491


SOUTHWESTERN ENERGY COMPANY AND SUBSIDIARIES

CONSOLIDATED BALANCE SHEETS

(Unaudited)


March 31,
2021


December 31,
2020

ASSETS


(in millions)


Current assets:


Cash and cash equivalents


$

4


$

13


Accounts receivable, net


400


368


Derivative assets


157


241


Other current assets


41


49


Total current assets


602


671


Natural gas and oil properties, using the full cost method


27,532


27,261


Other


493


523


Less: Accumulated depreciation, depletion and amortization


(23,741

)


(23,673

)

Total property and equipment, net


4,284


4,111


Operating lease assets


155


163


Deferred tax assets


Other long-term assets


206


215


Total long-term assets


361


378


TOTAL ASSETS


$

5,247


$

5,160


LIABILITIES AND EQUITY


Current liabilities:


Current portion of long-term debt


$

207


$


Accounts payable


639


573


Taxes payable


67


74


Interest payable


55


58


Derivative liabilities


338


245


Current operating lease liabilities


41


42


Other current liabilities


23


20


Total current liabilities


1,370


1,012


Long-term debt


2,812


3,150


Long-term operating lease liabilities


111


117


Long-term derivative liabilities


168


183


Pension and other postretirement liabilities


40


45


Other long-term liabilities


160


156


Total long-term liabilities


3,291


3,651


Commitments and contingencies


Equity:


Common stock, $0.01 par value; 1,250,000,000 shares authorized; issued 721,195,122 shares as of March 31, 2021 and 718,795,700 shares as of December 31, 2020


7


7


Additional paid-in capital


5,102


5,093


Accumulated deficit


(4,283

)


(4,363

)

Accumulated other comprehensive loss


(38

)


(38

)

Common stock in treasury, 44,353,224 shares as of March 31, 2021 and December 31, 2020


(202

)


(202

)

Total equity


586


497


TOTAL LIABILITIES AND EQUITY


$

5,247


$

5,160


SOUTHWESTERN ENERGY COMPANY AND SUBSIDIARIES

CONDENSED CONSOLIDATED STATEMENTS OF CASH FLOWS

(Unaudited)


For the three months ended


March 31,

(in millions)


2021


2020

Cash Flows From Operating Activities:


Net income (loss)


$

80


$

(1,547

)

Adjustments to reconcile net income (loss) to net cash provided by operating activities:


Depreciation, depletion and amortization


96


113


Amortization of debt issuance costs


2


1


Impairments


1,479


Deferred income taxes


408


(Gain) loss on derivatives, unsettled


169


(246

)

Stock-based compensation


1


Gain on early extinguishment of debt


(28

)

Change in assets and liabilities:


Accounts receivable


(33

)


53


Accounts payable


33


(86

)

Taxes payable


(8

)


(6

)

Interest payable


(2

)


1


Inventories


9


8


Other assets and liabilities


1


9


Net cash provided by operating activities


347


160


Cash Flows From Investing Activities:


Capital investments


(227

)


(228

)

Proceeds from sale of property and equipment


1


Other


(1

)


Net cash used in investing activities


(227

)


(228

)


Cash Flows From Financing Activities:


Payments on long-term debt


(52

)

Payments on revolving credit facility


(923

)


(500

)

Borrowings under revolving credit facility


790


615


Change in bank drafts outstanding


7


5


Cash paid for tax withholding


(3

)


Net cash provided by (used in) financing activities


(129

)


68


Decrease in cash and cash equivalents


(9

)


Cash and cash equivalents at beginning of year


13


5


Cash and cash equivalents at end of period

$

4


$

5


Hedging Summary

A detailed breakdown of derivative financial instruments and financial basis positions as of March 31, 2021, including the remainder of 2021 and excluding those positions that settled in the first quarter, is shown below. Please refer to the Company’s quarterly report on Form 10-Q to be filed with the Securities and Exchange Commission for complete information on the Company’s commodity, basis and interest rate protection.


Weighted Average Price per MMBtu


Volume (Bcf)


Swaps


Sold Puts


Purchased Puts


Sold Calls

Natural gas


2021


Fixed price swaps

176


$

2.79


$


$


$

Two-way costless collars

195


2.57


2.93

Three-way costless collars

218


2.17


2.50


2.84

Total

589


2022


Fixed price swaps

112


$

2.68


$


$


$

Two-way costless collars

63


2.52


3.03

Three-way costless collars

278


2.06


2.50


2.97

Total

453


2023


Three-way costless collars

103


$


$

2.05


$

2.46


$

3.01

Natural gas financial basis positions


Volume


Basis Differential


(Bcf)


($/MMBtu)

Q2 2021


Dominion South


36


$

(0.58

)

TCO


28


$

(0.51

)

TETCO M3


24


$

(0.44

)

Total


88


$

(0.52

)

Q3 2021


Dominion South


36


$

(0.63

)

TCO


28


$

(0.51

)

TETCO M3


24


$

(0.44

)

Total


88


$

(0.54

)

Q4 2021


Dominion South


24


$

(0.60

)

TCO


15


$

(0.48

)

TETCO M3


18


$

(0.00

)

Total


57


$

(0.38

)

2022


Dominion South


114


$

(0.58

)

TCO


51


$

(0.46

)

TETCO M3


55


$

(0.11

)

Total


220


$

(0.44

)


Weighted Average Price per Bbl


Volume (MBbls)


Swaps


Sold Puts


Purchased Puts


Sold Calls

Oil


2021


Fixed price swaps

3,272


$

49.27


$


$


$

Two-way costless collars

156


37.79


45.73

Three-way costless collars

1,498


37.86


47.70


53.10

Total

4,926


2022


Fixed price swaps

1,719


$

48.54


$


$


$

Three-way costless collars

1,380


39.89


50.23


57.05

Total

3,099


2023


Three-way costless collars

1,268


$


$

33.97


$

45.51


$

56.12

Ethane


2021


Fixed price swaps

4,429


$

7.17


$


$


$

Two-way costless collars

440


7.14


10.40

Total

4,869


2022


Fixed price swaps

1,758


$

8.68


$


$


$

Two-way costless collars

135


7.56


9.66

Total

1,893


Propane


2021


Fixed price swaps

5,443


$

20.84


$


$


$

2022


Fixed price swaps

2,723


$

21.83


$


$


$

Three-way costless collars

305


16.80


21.00


31.92

Total

3,028


Normal Butane


2021


Fixed price swaps

1,568


$

25.30


$


$


$

2022


Fixed price swaps

888


$

24.47


$


$


$

Natural Gasoline


2021


Fixed price swaps

1,513


$

37.91


$


$


$

2022


Fixed price swaps

857


$

40.48


$


$


$


Explanation and Reconciliation of Non-GAAP Financial Measures

The Company reports its financial results in accordance with accounting principles generally accepted in the United States of America (“GAAP”). However, management believes certain non-GAAP performance measures may provide financial statement users with additional meaningful comparisons between current results, the results of its peers and of prior periods.

One such non-GAAP financial measure is net cash flow. Management presents this measure because (i) it is accepted as an indicator of an oil and gas exploration and production company’s ability to internally fund exploration and development activities and to service or incur additional debt, (ii) changes in operating assets and liabilities relate to the timing of cash receipts and disbursements which the Company may not control and (iii) changes in operating assets and liabilities may not relate to the period in which the operating activities occurred.

Additional non-GAAP financial measures the Company may present from time to time are net debt, adjusted net income, adjusted diluted earnings per share and adjusted EBITDA, all which exclude certain charges or amounts. Management presents these measures because (i) they are consistent with the manner in which the Company’s position and performance are measured relative to the position and performance of its peers, (ii) these measures are more comparable to earnings estimates provided by securities analysts, and (iii) charges or amounts excluded cannot be reasonably estimated and guidance provided by the Company excludes information regarding these types of items.


Contacts

Investor Contact
Brittany Raiford
Director, Investor Relations
(832) 796-7906
This email address is being protected from spambots. You need JavaScript enabled to view it.

Bernadette Butler
Investor Relations Advisor
(832) 796-6079
This email address is being protected from spambots. You need JavaScript enabled to view it.


Read full story here

Tula Technology Presents Findings on its Dynamic Motor Drive at the 42nd International Vienna Motor Symposium

SAN JOSE, Calif.--(BUSINESS WIRE)--#BEV--Tula Technology, Inc., a leader in propulsion efficiency, reported today at the International Vienna Motor Symposium that their product Dynamic Motor Drive (DMD™) mitigates efficiency losses of electric motors while significantly reducing reliance on rare-earth materials. DMD’s application to electric vehicle motors has the potential to increase range while using less energy.


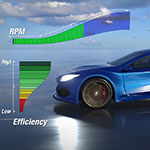
Improving the efficiency of the powertrain is key to reducing the energy consumed by an electric vehicle. Electric motors equipped with rare earth magnets can exceed 90% efficiency at peak performance; however, real-world driving conditions often reduce motor efficiency to approximately 70-85%, far below the peak. The patented DMD pulse density strategy mitigates efficiency losses through improvements in control software. Tula has simulated the DMD concept and projects efficiency improvements of 2.5% on the Worldwide Harmonized Light Vehicle Test Procedure (WLTP) cycle for an average electric vehicle. These improvements increase driving range while lowering total energy consumed. DMD is cost-effective, software-driven and does not require hardware changes to the motor or vehicle. Additionally, DMD avoids many of the rare earth material challenges including escalating future costs, limited supply and sourcing risks.

R. Scott Bailey, president and CEO of Tula Technology, commented, “By 2040, more than half of all passenger vehicles sold globally will be electric*. Tula’s Dynamic Motor Drive technology delivers high-value efficiency improvement to the full spectrum of electrification applications. With DMD, we can take a synchronous reluctance motor with low permanent magnet content and increase its efficiency to a level nearly comparable to a full permanent magnet motor. This reduces reliance on rare earth metals, which translates to lower cost and greater supply chain security. We are very excited about our DMD results, and our team is ready to work with partners and customers to optimize motor system performance in the transportation, industrial and power generation industries.”

Tula’s first product, Dynamic Skip Fire (DSF®), is an advanced cylinder deactivation control strategy that has been shown to significantly reduce CO2 emissions in gasoline engines and has been in production since 2018 with more than one million vehicles on the road. As presented jointly with Cummins at the Society of Automotive Engineers World Congress this year, the diesel application of DSF, Diesel Dynamic Skip Fire (dDSF™), was shown to reduce nitrogen oxide emissions by 74% and CO2 emissions by 5% in a Class 8 truck operating in a low-load cycle. DMD takes Tula’s control strategy to electric motors and has the potential to improve efficiency beyond electric vehicles into other modes of transportation, propulsion, and power conversion.

*Electric Vehicle Outlook 2020, Bloomberg NEF

About Tula Technology, Inc.

Silicon Valley-based Tula Technology provides innovative award-winning software controls to optimize propulsion efficiency and emissions across the mobility spectrum, including gasoline-powered, diesel, alternative fuel, hybrid, and electric vehicles. Tula’s culture of innovation has resulted in breakthrough technology and a robust global patent portfolio of more than 340 patents issued and pending. Tula Technology is a privately held company backed by Sequoia Capital, Sigma Partners, Khosla Ventures, GM Ventures, BorgWarner and Franklin Templeton. More information is available at www.tulatech.com.

Editor’s note: Tula (DMD) video introduces Tula, current electric vehicle motor technology challenges and DMD™ concept, operation and benefits. https://youtu.be/Zx74lfvOZ-U


Contacts

Tula Technology, Inc.
Ram Subramanian
Principal Marketing Strategist
This email address is being protected from spambots. You need JavaScript enabled to view it.

Media:
Financial Profiles, Inc.
Debbie Douglas
Senior Vice President
This email address is being protected from spambots. You need JavaScript enabled to view it.
(949) 375-3436

AKRON, Ohio--(BUSINESS WIRE)--$BW #BabcockWilcox--Babcock & Wilcox Enterprises, Inc. (NYSE:BW) (B&W or the “Company”) expects to host a conference call and webcast on Thursday, May 13, 2021 at 8 a.m. ET.


B&W Chairman and Chief Executive Officer, Kenneth Young, and B&W Chief Financial Officer, Louis Salamone, will discuss the Company’s first quarter 2021 results. A news release detailing the results is expected to be issued before the market opens on Thursday, May 13, 2021.

The listen-only audio of the conference call will be broadcast live via the Internet on B&W’s Investor Relations site. The dial-in number for participants in the U.S. is (833) 227-5843; the dial-in number for participants outside the U.S. is (647) 689-4070. The conference ID for all participants is 2970079. A replay of this conference call will remain accessible in the investor relations section of the Company's website for a limited time.

About B&W

Headquartered in Akron, Ohio, B&W is a global leader in energy and environmental technologies and services for the power and industrial markets. Follow B&W on LinkedIn and learn more at www.babcock.com.


Contacts

Investor Contact:
Megan Wilson
Vice President, Corporate Development & Investor Relations
Babcock & Wilcox
704.625.4944
This email address is being protected from spambots. You need JavaScript enabled to view it.

Media Contact:
Ryan Cornell
Public Relations
Babcock & Wilcox
330.860.1345
This email address is being protected from spambots. You need JavaScript enabled to view it.

DUBLIN--(BUSINESS WIRE)--The "Marine Audio Market Report: Trends, Forecast and Competitive Analysis" report has been added to ResearchAndMarkets.com's offering.


The global marine audio market is expected to reach an estimated $2,195.4 million by 2023 and it is forecast to grow at a CAGR of 2.5% from 2018 to 2023.

Emerging trends, which have a direct impact on the dynamics of the marine audio market, include development of multi-zone marine stereo receivers and the introduction of Wi-Fi stereos.

The future of the global marine audio market looks good with opportunities in the inboard, outboard, and sterndrive market. The major drivers for this market are the growth in re creational boats production and increasing customer demand for better quality sound systems.

The study includes the marine audio market size and forecast for the global marine audio market through 2023, segmented by component, boat type, and region.

Some of the marine audio companies profiled in this report include SONY, Harman, Clarion, JVC, Pioneer, Fusion, Rockford, JL Audio, Wet Sounds, and MTX Audio and others.

On the basis of its comprehensive research, the analyst forecasts that the speakers will remain the largest segment and subwoofer will experience the highest growth over the forecast period due to the increasing customer demand for better quality multimedia entertainment products.

Within this market, marine audio system for inboard will remain the largest boat type and it is expected to show highest growth over the forecast period due to rising demand of cruise in the emerging markets.

Europe is expected to remain the largest region due to higher production of recreational boat. Asia Pacific is expected to witness highest growth over the forecast period due to the increasing boat production and growth in tourism & water sports activities.

Some of the features of "Marine Audio Market Report: Trends, Forecast and Competitive Analysis" include:

  • Market size estimates: Global marine audio market size estimation in terms of value ($M) and volume (Thousand Units) shipment.
  • Trend and forecast analysis: Market trend (2012-2017) and forecast (2018-2023) by application, and end use industry.
  • Segmentation analysis: Global marine audio market size by various applications such as component, and boat type in terms of value and volume shipment.
  • Regional analysis: Global marine audio market breakdown by North America, Europe, Asia Pacific, and the Rest of the World.
  • Growth opportunities: Analysis on growth opportunities in different applications and regions of marine audio in the global marine audio market.
  • Strategic analysis: This includes M&A, new product development, and competitive landscape of marine audio in the global marine audio market.
  • Analysis of the competitive intensity of the industry based on Porter's Five Forces model.

Key Topics Covered:

1. Executive Summary

2. Market Background and Classifications

2.1: Introduction, Background, and Classifications

2.2: Supply Chain

2.3: Industry Drivers and Challenges

3. Market Trends and Forecast Analysis from 2012 to 2023

3.1: Macroeconomic Trends and Forecast

3.2: Global Marine Audio Market Trends and Forecast

3.3: Global Marine Audio Market by Product Type

3.3.1: Speakers

3.3.2: Stereo Receivers

3.3.3: Subwoofers

3.3.4: Amplifiers

3.4: Global Marine Audio Market by Boat Type

4. Market Trends and Forecast Analysis by Region

4.1: Global Marine Audio Market by Region

4.2: North American Marine Audio Market

4.2.1: North America Marine Audio Market by Product Type

4.2.2: North America Marine Audio Market by Boat Type

4.2.3: United States Marine Audio Market

4.2.4: Canadian Marine Audio Market

4.2.5: Mexican Marine Audio Market

4.3: European Marine Audio Market

4.3.1: European Marine Audio Market by Product Type

4.3.2: European Marine Audio Market by Boat Type

4.3.3: Italian Marine Audio Market

4.3.4: United Kingdom Marine Audio Market

4.3.5: French Marine Audio Market

4.3.6: German Marine Audio Market

4.4: APAC Marine Audio Market

4.4.1: APAC Marine Audio Market by Product Type

4.4.2: APAC Marine Audio Market by Boat Type

4.4.3: Australian Marine Audio Market

4.4.4: Chinese Marine Audio Market

4.4.5: Taiwanese Marine Audio Market

4.4.6: New Zealand Marine Audio Market

4.5: ROW Marine Audio Market

4.5.1: ROW Marine Audio Market by Product Type

4.5.2: ROW Marine Audio Market by Boat Type

4.5.3: Brazilian Marine Audio Market

5. Competitor Analysis

5.1: Product Portfolio Analysis

5.2: Geographical Reach

5.3: Porter's Five Forces Analysis

6. Growth Opportunities and Strategic Analysis

6.1: Growth Opportunity Analysis

6.1.1: Growth Opportunities for the Global Marine Audio Market by Product Type

6.1.2: Growth Opportunities for the Global Marine Audio Market by Region

6.2: Emerging Trends in the Global Marine Audio Market

6.2.1: New Product Development

6.2.2: Mergers, Acquisitions, and Joint Ventures in the Global Marine audio Market

7. Company Profiles of Leading Players

7.1: SONY

7.2: Harman International Industries Ltd.

7.3: Clarion Co. Ltd.

7.4: JVC

7.5: Pioneer Corporation

7.6: Fusion Entertainment Ltd.

7.7: Rockford Corporation

7.8: JL Audio

7.9: Wet Sound

7.10: MTX Audio

For more information about this report visit https://www.researchandmarkets.com/r/52215z


Contacts

ResearchAndMarkets.com
Laura Wood, Senior Press Manager
This email address is being protected from spambots. You need JavaScript enabled to view it.

For E.S.T Office Hours Call 1-917-300-0470
For U.S./CAN Toll Free Call 1-800-526-8630
For GMT Office Hours Call +353-1-416-8900

THE WOODLANDS, Texas--(BUSINESS WIRE)--Earthstone Energy, Inc. (NYSE: ESTE) (“Earthstone” or the “Company”), announced today that its management team will host a conference call on Thursday, May 6, 2021 at 12:00 p.m. Eastern (11:00 a.m. Central) to discuss the Company’s financial results for the first quarter 2021 and its outlook for the remainder of 2021. Prepared remarks by Robert J. Anderson, President and Chief Executive Officer, Mark Lumpkin, Jr., Executive Vice President and Chief Financial Officer and Steven C. Collins, Executive Vice President of Operations, will be followed by a question and answer session. The Company intends to file its earnings press release for the period ended March 31, 2021, prior to the conference call.


Investors and analysts are invited to participate in the call by dialing 877-407-6184 for domestic calls or 201-389-0877 for international calls, in both cases asking for the Earthstone conference call. A webcast will also be available through the Company website (www.earthstoneenergy.com). Please select "Events & Presentations" under the "Investors" section of the Company's website and log on at least 10 minutes in advance to register.

A replay of the call and webcast will be available on the Company’s website and by telephone until 12:00 p.m. Eastern (11:00 a.m. Central), Thursday, May 20, 2021. The number for the replay is 877-660-6853 for domestic calls or 201-612-7415 for international calls, using Replay ID: 13719456.

About Earthstone Energy, Inc.

Earthstone Energy, Inc. is a growth-oriented independent oil and gas company engaged in the acquisition, development and operation of oil and natural gas properties. The Company’s primary assets are located in the Midland Basin of west Texas and the Eagle Ford Trend of south Texas. Earthstone is traded on NYSE under the symbol “ESTE.” For more information, visit the Company’s website at www.earthstoneenergy.com.


Contacts

Mark Lumpkin, Jr.
Executive Vice President – Chief Financial Officer
Earthstone Energy, Inc.
1400 Woodloch Forest Drive, Suite 300
The Woodlands, TX 77380
281-298-4246
This email address is being protected from spambots. You need JavaScript enabled to view it.

Scott Thelander
Vice President of Finance
Earthstone Energy, Inc.
1400 Woodloch Forest Drive, Suite 300
The Woodlands, TX 77380
281-298-4246
This email address is being protected from spambots. You need JavaScript enabled to view it.

Smart cities continue to provide significant opportunities for technology and service providers that can demonstrate support for sustainable and equitable city recovery programs


BOULDER, Colo.--(BUSINESS WIRE)--#cityrecovery--A new report from Guidehouse Insights examines recent developments in the global smart city market, with a focus on global revenue forecasts for smart city technologies, segmented by industry and region, through 2030.

The coronavirus pandemic has amplified many urban challenges and created new ones, particularly around health, mobility, education, and economic development issues. Some smart city investments have been delayed, redirected, or cancelled. However, city recovery programs are already showing a strong commitment to infrastructure investment, digital technologies, and increased sustainability. According to a new report from Guidehouse Insights, the global annual smart city technology market is expected to grow from approximately $101 billion in 2021 to $240 billion by 2030 at a compound annual growth rate of 10.2%.

“City governments are looking to rebuild better to ensure resilience to future pandemic events, accelerate the shift to zero carbon, and address the social inequalities in many cities,” says Eric Woods, research director with Guidehouse Insights. “Smart city solutions that support these ambitions are expected to thrive even during a tough period for local government finances.”

City leaders are advocating a focus on digital and clean technologies to make cities more resilient, sustainable, and equitable. The focus on climate change mitigation and adaptation in many national recovery funding programs is likely to boost city investment in clean energy programs and supporting infrastructure (including low carbon transportation and energy efficient buildings). Data platforms and data analytics are also expected to be a focus area. As cities look to reduce spending on legacy infrastructure and applications, the move to cloud-based infrastructure and application services is expected to further accelerate.

The report, Market Data: Smart Cities, examines recent developments in the global smart city market, with a focus on five key industries: energy, water, mobility, buildings, and government. The study examines key market and technology trends, city strategies, key projects, competitor profiles, and regional developments. Global revenue forecasts for smart city technologies, segmented by industry and region, extend through 2030. An executive summary of the report is available for free download on the Guidehouse Insights website.

About Guidehouse Insights

Guidehouse Insights, the dedicated market intelligence arm of Guidehouse, provides research, data, and benchmarking services for today’s rapidly changing and highly regulated industries. Our insights are built on in-depth analysis of global clean technology markets. The team’s research methodology combines supply-side industry analysis, end-user primary research, and demand assessment, paired with a deep examination of technology trends, to provide a comprehensive view of emerging resilient infrastructure systems. Additional information about Guidehouse Insights can be found at www.guidehouseinsights.com.

About Guidehouse

Guidehouse is a leading global provider of consulting services to the public and commercial markets with broad capabilities in management, technology, and risk consulting. We help clients address their toughest challenges and navigate significant regulatory pressures with a focus on transformational change, business resiliency, and technology-driven innovation. Across a range of advisory, consulting, outsourcing, and digital services, we create scalable, innovative solutions that prepare our clients for future growth and success. The company has more than 8,000 professionals in over 50 locations globally. Guidehouse is a Veritas Capital portfolio company, led by seasoned professionals with proven and diverse expertise in traditional and emerging technologies, markets, and agenda-setting issues driving national and global economies. For more information, please visit: www.guidehouse.com.

* The information contained in this press release concerning the report, Market Data: Smart Cities, is a summary and reflects the current expectations of Guidehouse Insights based on market data and trend analysis. Market predictions and expectations are inherently uncertain and actual results may differ materially from those contained in this press release or the report. Please refer to the full report for a complete understanding of the assumptions underlying the report’s conclusions and the methodologies used to create the report. Neither Guidehouse Insights nor Guidehouse undertakes any obligation to update any of the information contained in this press release or the report.


Contacts

Lindsay Funicello-Paul
+1.781.270.8456
This email address is being protected from spambots. You need JavaScript enabled to view it.

MIAMI--(BUSINESS WIRE)--World Fuel Services Corporation (NYSE: INT):

First-Quarter 2021 Highlights

  • Total gross profit of $191.6 million, down 26% year-over-year
  • GAAP net income of $18.9 million, or $0.30 per diluted share
  • Adjusted net income of $20.7 million, or $0.33 per diluted share
  • Adjusted EBITDA of $61.9 million

“One year after the onset of the pandemic, we are optimistic about a continuing improvement in demand as vaccination rates increase and the global economy begins to recover,” stated Michael J. Kasbar, chairman and chief executive officer of World Fuel Services Corporation. “As the markets we serve continue to strengthen and opportunities to support global sustainability initiatives evolve, the breadth of our value-added service offerings will enable us to benefit from the numerous opportunities ahead.”

For the first quarter, our aviation segment generated gross profit of $76.7 million, a decrease of 18% year-over-year, driven by the decline in volume as a consequence of the depressed demand for air travel due to the coronavirus pandemic, together with a reduction in our government-related activity in Afghanistan, partially offset by higher average margins from a more profitable business mix. Our marine segment generated gross profit of $25.4 million, a decrease of 57% year-over-year, principally attributable to lower profitability as compared to the first quarter of 2020 which benefited from certain supply imbalances and price volatility arising from the implementation of the IMO 2020 regulations in January 2020, as well as a decline in demand related to the pandemic. Our land segment generated gross profit of $89.5 million, a decrease of 16% year-over-year, predominantly due to the sale of the MultiService payment solutions business in September 2020, partially offset by improved performance in our natural gas business in North America.

“We generated another $103 million of cash flow from operations during the first quarter, further strengthening our balance sheet during these challenging times,” said Ira M. Birns, executive vice president and chief financial officer. “In demonstration of our commitment to enhancing shareholder value, we also increased our cash dividend by 20% during the first quarter.”

COVID-19 Update

Throughout 2020, the COVID-19 pandemic had a significant impact on the global economy as a whole, and the transportation industries in particular, which has continued into 2021. Many of our customers in these industries, especially commercial airlines, have experienced a substantial decline in business activity arising from the various measures enacted by governments around the world to contain the spread of the virus. As a result, we experienced a significant decline in sales volume and profitability across most of our businesses beginning in the second quarter of 2020, which persisted throughout the balance of the year. Demand showed some moderate improvement through the second half of 2020 and into 2021, however, it has remained well below pre-pandemic levels. Since the level of activity in our business and that of our customers has historically been driven by the level of economic activity globally, we generally expect these negative impacts to continue throughout 2021.

In response to the challenges arising from the pandemic, we took a number of actions throughout 2020 to ensure the safety of our employees and other stakeholders by implementing our business continuity and emergency response plans and maximizing remote work throughout our global offices. Since the first quarter of 2020, many of our employees have been collaborating virtually with our customers, suppliers and each other using the information-sharing tools and technology that we have invested in over the last several years. We also commenced a number of initiatives in 2020 related to cost reduction, liquidity and operating efficiencies, which remain an area of focus for us in 2021.

The ultimate magnitude and duration of the adverse effects of the pandemic on our business will depend on the timing and extent to which the global economy, and our customers in the transportation industries in particular, recover from the health crisis and global economic downturn. Any subsequent recovery will be dependent on, among other things, continued actions taken by governments and businesses to contain and combat the virus, the speed and effectiveness of global vaccine distribution, as well as how quickly, and to what extent, normal economic and operating conditions can resume on a sustainable basis globally.

Non-GAAP Financial Measures

This press release contains non-GAAP financial measures (collectively, the “Non-GAAP Measures”), including adjusted net income, adjusted diluted earnings per share, and adjusted earnings before interest, taxes, depreciation and amortization (“EBITDA”). The Non-GAAP Measures exclude acquisition and divestiture related expenses, restructuring costs, impairments, gains or losses on the extinguishment of debt and gains or losses on business dispositions primarily because we do not believe they are reflective of our core operating results.

We believe that the Non-GAAP Measures, when considered in conjunction with our financial information prepared in accordance with GAAP, are useful to investors to further aid in evaluating the ongoing financial performance of the Company and to provide greater transparency as supplemental information to our GAAP results.

Non-GAAP financial measures should not be considered in isolation from, or as a substitute for, financial information prepared in accordance with GAAP. In addition, our presentation of the Non-GAAP Measures may not be comparable to the presentation of such metrics by other companies. Non-GAAP diluted earnings per common share is computed by dividing non-GAAP net income attributable to World Fuel Services and available to common shareholders by the sum of the weighted average number of shares of common stock, stock units, restricted stock entitled to dividends not subject to forfeiture and vested restricted stock units outstanding during the period and the number of additional shares of common stock that would have been outstanding if our outstanding potentially dilutive securities had been issued. Investors are encouraged to review the reconciliation of these Non-GAAP Measures to their most directly comparable GAAP financial measures in this press release and on our website.

Information Relating to Forward-Looking Statements

This release includes forward-looking statements within the meaning of the Private Securities Litigation Reform Act of 1995, including statements regarding our beliefs and expectations about improvement in demand as vaccination rates increase and the global economy recovers, the strengthening of the markets we serve, our ability to benefit from the opportunities ahead, as well as our expectations about our ability to seek additional opportunities to enhance operating efficiencies, reduce costs and the ultimate impact of the coronavirus pandemic on us. These forward-looking statements are qualified in their entirety by cautionary statements and risk factor disclosures contained in the Company’s Securities and Exchange Commission (“SEC”) filings, including the Company’s most recent Annual Report on Form 10-K filed with the SEC. Actual results may differ materially from any forward-looking statements due to risks and uncertainties, including, but not limited to: our ability to effectively manage the effects of the COVID-19 pandemic, the extent of the impact of the pandemic on ours and our customers' sales, profitability, operations and supply chains due to actions taken by governments and businesses to contain the virus, such as restrictions on travel, the speed and effectiveness of vaccine development and distribution, customer and counterparty creditworthiness and our ability to collect accounts receivable and settle derivative contracts, particularly for those customers most significantly impacted by the pandemic, sudden changes in the market price of fuel or extremely high or low fuel prices that continue for an extended period of time, the loss of, or reduced sales to a significant government customer, such as the North Atlantic Treaty Organization as a result of the ongoing troop withdrawal in Afghanistan, the availability of cash and sufficient liquidity to fund our working capital and strategic investment needs, adverse conditions in the markets or industries in which we or our customers and suppliers operate such as the current global economic environment as a result of the coronavirus pandemic, our failure to comply with restrictions and covenants in our senior revolving credit facility and our senior term loans, including our financial covenants, our ability to effectively utilize the proceeds from the sale of the Multi Service business and derive the expected benefits, our ability to manage the changes in supply and other market dynamics in the regions where we operate, our ability to successfully execute and achieve efficiencies, our ability to achieve the expected level of benefit from any restructuring activities and cost reduction initiatives, our ability to successfully implement our growth strategy and integrate acquired businesses and recognize the anticipated benefits, unanticipated tax liabilities or adverse results of tax audits, assessments, or disputes ,our ability to capitalize on new market opportunities, risks related to the complexity of U.S. Tax Cuts and Jobs Act and any subsequently issued regulations and our ability to accurately predict the impact on our effective tax rate and future earnings, our ability to effectively leverage technology and operating systems and realize the anticipated benefits, potential liabilities and the extent of any insurance coverage, actions that may be taken under the new administration in the U.S. that increase costs or otherwise negatively impact ours or our customers and suppliers businesses, the outcome of pending litigation and other proceedings, the impact of quarterly fluctuations in results, particularly as a result of seasonality, supply disruptions, border closures and other logistical difficulties that can arise when sourcing and delivering fuel in areas that are actively engaged in war or other military conflicts, our failure to effectively hedge certain financial risks associated with the use of derivatives, uninsured losses, the impact of climate change and natural disasters, adverse results in legal disputes, and other risks detailed from time to time in our SEC filings. In addition, other current or potential risks and uncertainties related to the coronavirus pandemic include, but are not limited to: disruptions resulting from office and facility closures, reductions in operating hours, and changes in operating procedures, including additional cleaning and disinfecting procedures, possible infections or quarantining of our employees which could impact our ability to service our customers or operate our business, notices from customers, suppliers and other third parties asserting force majeure or other bases for their non-performance, losses on hedging transactions with customers arising from the decline in fuel prices and their inability to benefit from the reduced cost of fuel due to substantial reductions in their operations, heightened risk of cybersecurity issues as digital technologies may become more vulnerable and experience a higher rate of cyber-attacks in a remote connectivity environment, reduction of our global workforce to adjust to market conditions, including increased costs associated with severance payments, retention issues, and an inability to hire employees when market conditions improve, the impact of asset impairments, including any impairment of the carrying value of our goodwill in our aviation and land segments, as well as other accounting charges if expected future demand for our products and services materially decreases, a structural shift in the global economy and its demand for fuel and related products and services as a result of changes in the way people work, travel and interact, or in connection with a global recession. New risks emerge from time to time and it is not possible for management to predict all such risk factors or to assess the impact of such risks on our business. Accordingly, we undertake no obligation to publicly update or revise any forward-looking statements, whether as a result of new information, changes in expectations, future events, or otherwise, except as required by law.

About World Fuel Services Corporation

Headquartered in Miami, Florida, World Fuel Services is a global energy management company involved in providing energy procurement advisory services, supply fulfillment and transaction and payment management solutions to commercial and industrial customers, principally in the aviation, marine and land transportation industries. World Fuel Services sells fuel and delivers services to its clients at more than 8,000 locations in more than 200 countries and territories worldwide.

For more information, call 305-428-8000 or visit www.wfscorp.com.

-- Some amounts in this press release may not add due to rounding. All percentages have been calculated using unrounded amounts --

WORLD FUEL SERVICES CORPORATION

CONDENSED CONSOLIDATED BALANCE SHEETS

(Unaudited - In millions, except per share data)


As of


March 31,


December 31,


2021


2020

Assets:


Current assets:


Cash and cash equivalents


$

735.3


$

658.8


Accounts receivable, net of allowance for credit losses of $43.8 million and $53.8 million as of March 31, 2021 and December 31, 2020, respectively


1,669.2


1,238.4


Inventories


333.7


344.3


Prepaid expenses


53.2


51.1


Short-term derivative assets, net


58.9


66.4


Other current assets


214.1


280.4


Total current assets


3,064.5


2,639.3


Property and equipment, net


334.6


342.6


Goodwill


858.0


858.6


Identifiable intangible and other non-current assets


668.3


659.8


Total assets


$

4,925.4


$

4,500.3


Liabilities:


Current liabilities:


Current maturities of long-term debt


$

26.6


$

22.9


Accounts payable


1,619.3


1,214.7


Customer deposits


132.9


155.8


Accrued expenses and other current liabilities


313.4


290.6


Total current liabilities


2,092.2


1,684.0


Long-term debt


496.9


501.8


Non-current income tax liabilities, net


218.8


215.5


Other long-term liabilities


174.5


186.1


Total liabilities


2,982.3


2,587.4


Commitments and contingencies


Equity:


World Fuel shareholders' equity:


Preferred stock, $1.00 par value; 0.1 shares authorized, none issued


Common stock, $0.01 par value; 100.0 shares authorized, 63.0 and 62.9 issued and outstanding as of March 31, 2021 and December 31, 2020, respectively


0.6


0.6


Capital in excess of par value


210.8


204.6


Retained earnings


1,848.3


1,836.7


Accumulated other comprehensive loss


(120.3)


(132.6)


Total World Fuel shareholders' equity


1,939.5


1,909.3


Noncontrolling interest


3.5


3.6


Total equity


1,943.0


1,912.9


Total liabilities and equity


$

4,925.4


$

4,500.3


WORLD FUEL SERVICES CORPORATION

CONDENSED CONSOLIDATED STATEMENTS OF INCOME AND COMPREHENSIVE INCOME

(Unaudited – In millions, except per share data)


For the Three Months Ended


March 31,


2021


2020

Revenue


$

5,957.9


$

8,015.2


Cost of revenue


5,766.3


7,756.4


Gross profit


191.6


258.7


Operating expenses:


Compensation and employee benefits


92.5


102.5


General and administrative


59.4


83.7


Restructuring charges


2.1


1.7


154.0


187.9


Income from operations


37.6


70.8


Non-operating income (expenses), net:


Interest expense and other financing costs, net


(8.7)


(15.4)


Other income (expense), net


(1.2)


2.2


(10.0)


(13.2)


Income (loss) before income taxes


27.6


57.6


Provision for income taxes


8.8


16.0


Net income (loss) including noncontrolling interest


18.8


41.6


Net income (loss) attributable to noncontrolling interest


0.2


Net income (loss) attributable to World Fuel


$

18.9


$

41.4


Basic earnings per common share


$

0.30


$

0.64


Basic weighted average common shares


63.0


64.9


Diluted earnings per common share


$

0.30


$

0.63


Diluted weighted average common shares


63.6


65.4


Comprehensive income:


Net income (loss) including noncontrolling interest


$

18.8


$

41.6


Other comprehensive income (loss):


Foreign currency translation adjustments


(4.0)


(33.0)


Cash flow hedges, net of income tax expense of $5.6 and expense of $7.4 for the three months ended March 31, 2021 and 2020, respectively


16.4


21.7


Other comprehensive income (loss)


12.4


(11.3)


Comprehensive income (loss) including noncontrolling interest


31.2


30.4


Comprehensive income (loss) attributable to noncontrolling interest


Comprehensive income (loss) attributable to World Fuel


$

31.2


$

30.4


WORLD FUEL SERVICES CORPORATION

CONDENSED CONSOLIDATED STATEMENTS OF CASH FLOWS

(Unaudited - In millions)


For the Three Months Ended


March 31,


2021


2020

Cash flows from operating activities:


Net income (loss) including noncontrolling interest


$

18.8


$

41.6


Adjustments to reconcile net income including noncontrolling interest to net cash provided by operating activities:


Depreciation and amortization


19.8


21.8


Provision for credit losses


3.6


9.9


Share-based payment award compensation costs


8.7


(1.8)


Deferred income tax expense (benefit)


(6.8)


(11.7)


Foreign currency (gains) losses, net


(12.9)


(19.8)


Other


(5.5)


(40.9)


Changes in assets and liabilities, net of acquisitions and divestitures:


Accounts receivable, net


(438.8)


900.4


Inventories


11.0


245.3


Prepaid expenses


(3.0)


20.7


Short-term derivative assets, net


77.3


(189.3)


Other current assets


69.3


17.7


Cash collateral with counterparties


(4.4)


(36.9)


Other non-current assets


(4.0)


(29.5)


Accounts payable


394.3


(1,057.5)


Customer deposits


(22.8)


3.7


Accrued expenses and other current liabilities


0.8


101.5


Non-current income tax, net and other long-term liabilities


(1.8)


34.3


Total adjustments


84.6


(32.1)


Net cash provided by (used in) operating activities


103.4


9.5


Cash flows from investing activities:


Acquisition of business, net of cash acquired


(130.5)


Capital expenditures


(2.0)


(17.4)


Other investing activities, net


(0.6)


(1.1)


Net cash provided by (used in) investing activities


(2.7)


(149.0)


Cash flows from financing activities:


Borrowings of debt


0.2


1,732.0


Repayments of debt


(4.5)


(1,161.3)


Dividends paid on common stock


(6.1)


(6.5)


Repurchases of common stock


(55.6)


Other financing activities, net


(10.4)


(1.5)


Net cash provided by (used in) financing activities


(20.8)


507.0


Effect of exchange rate changes on cash and cash equivalents


(3.5)


(16.5)


Net increase (decrease) in cash and cash equivalents


76.5


351.0


Cash and cash equivalents, as of the beginning of the period


658.8


186.1


Cash and cash equivalents, as of the end of the period


$

735.3


$

537.0


WORLD FUEL SERVICES CORPORATION

RECONCILIATION OF GAAP TO NON-GAAP FINANCIAL MEASURES

(Unaudited - In millions, except per share data)


For the Three Months Ended


March 31,

Non-GAAP financial measures and reconciliation:


2021


2020

Net income (loss) attributable to World Fuel


$

18.9


$

41.4


Acquisition and divestiture related expenses


2.4


1.1


Restructuring charges


2.1


1.7


Income tax impacts


(2.7)


(0.6)


Adjusted net income (loss) attributable to World Fuel


$

20.7


$

43.6


Diluted earnings (loss) per common share


$

0.30


$

0.63


Acquisition and divestiture related expenses


0.04


0.02


Restructuring charges


0.03


0.03


Income tax impacts


(0.04)


(0.01)


Adjusted diluted earnings (loss) per common share


$

0.33


$

0.67


For the Three Months Ended


March 31,

Non-GAAP financial measures and reconciliation:


2021


2020

Income from operations


$

37.6


$

70.8


Depreciation and amortization


19.8


21.8


Acquisition and divestiture related expenses


2.4


1.1


Restructuring charges


2.1


1.7


Adjusted EBITDA (1)


$

61.9


$

95.4


(1)

The Company defines adjusted EBITDA as income from operations, excluding the impact of depreciation and amortization, and items that are considered to be non-operational and not representative of our core business, including those associated with acquisition and divestiture related expenses, asset impairments, and restructuring charges.

WORLD FUEL SERVICES CORPORATION

BUSINESS SEGMENTS INFORMATION

(Unaudited - In millions)


For the Three Months Ended


March 31,

Revenue:


2021


2020

Aviation segment


$

2,095.0


$

3,764.1


Land segment


2,188.2


2,106.0


Marine segment


1,674.7


2,145.0


$

5,957.9


$

8,015.2


Gross profit:


Aviation segment


$

76.7


$

93.2


Land segment


89.5


106.3


Marine segment


25.4


59.3


$

191.6


$

258.7


Income from operations:


Aviation segment


$

23.0


$

29.1


Land segment


32.8


25.7


Marine segment


6.4


33.9


62.1


88.6


Corporate overhead - unallocated


(24.5)


(17.8)


$

37.6


$

70.8


SALES VOLUME SUPPLEMENTAL INFORMATION

(Unaudited - In millions)


For the Three Months Ended


March 31,

Volume (Gallons):


2021


2020

Aviation Segment


1,143.4


1,844.7


Land Segment (1)


1,303.0


1,381.0


Marine Segment (2)


1,117.5


1,291.1


Consolidated Total


3,563.9


4,516.8


(1)

Includes gallons and gallon equivalents of British Thermal Units (BTU) for our natural gas sales and Kilowatt Hours (kWh) for our World Kinect power business.

(2)

Converted from metric tons to gallons at a rate of 264 gallons per metric ton. Marine segment metric tons was 4.2 for the three months ended March 31, 2021.


Contacts

World Fuel Services Corporation
Ira M Birns, 305-428-8000
Executive Vice President & Chief Financial Officer

Glenn Klevitz, 305-428-8000
Vice President, Treasurer & Investor Relations

  • GAAP 2021 first quarter EPS was $0.67 compared with $0.56 in 2020.
  • Xcel Energy reaffirms 2021 EPS earnings guidance of $2.90 to $3.00.

MINNEAPOLIS--(BUSINESS WIRE)--Xcel Energy Inc. (NASDAQ: XEL) today reported 2021 first quarter GAAP and ongoing earnings of $362 million, or $0.67 per share, compared with $295 million, or $0.56 per share in the same period in 2020.

Earnings reflect higher electric and natural gas margins, which more than offset additional depreciation, interest charges and less allowance for funds used during construction (AFUDC).

Xcel Energy had a strong first quarter and we are reaffirming our expectation to deliver earnings within our annual guidance range,” said Ben Fowke, chairman and CEO. “We are also pleased to have achieved a significant milestone, reducing carbon emission 51% from 2005 levels, bringing us more than halfway to our vision of delivering 100% carbon-free electricity to our customers by 2050.”

We recently proposed significant measures in Colorado that will transform the energy landscape and help the state continue its clean energy leadership. Our Colorado Clean Energy Plan adds more than 5,000 megawatts of renewable energy and accelerates the retirement of our coal plants. The plan will reduce carbon emissions 85% in Colorado and increase renewable energy to nearly 80% by 2030. To support this ambitious plan, we also proposed a significant transmission expansion that would add 560 miles of new lines to deliver renewable energy.”

At 9:00 a.m. CDT today, Xcel Energy will host a conference call to review financial results. To participate in the call, please dial in 5 to 10 minutes prior to the start and follow the operator’s instructions.

US Dial-In:

(888) 394-8218

International Dial-In:

(400) 120-9101

Conference ID:

7731118

The conference call also will be simultaneously broadcast and archived on Xcel Energy’s website at www.xcelenergy.com. To access the presentation, click on Investor Relations. If you are unable to participate in the live event, the call will be available for replay from 12:00 p.m. CDT on April 29 through 12:00 p.m. CDT on May 2.

Replay Numbers


US Dial-In:

(888) 203-1112

International Dial-In:

(719) 457-0820

Access Code:

7731118

Except for the historical statements contained in this report, the matters discussed herein are forward-looking statements that are subject to certain risks, uncertainties and assumptions. Such forward-looking statements, including the 2021 EPS guidance, long-term EPS and dividend growth rate objectives, future sales, future expenses, future tax rates, future operating performance, estimated base capital expenditures and financing plans, projected capital additions and forecasted annual revenue requirements with respect to rider filings, expected rate increases to customers, expectations and intentions regarding regulatory proceedings, and expected impact on our results of operations, financial condition and cash flows of resettlement calculations and credit losses relating to certain energy transactions, as well as assumptions and other statements are intended to be identified in this document by the words “anticipate,” “believe,” “could,” “estimate,” “expect,” “intend,” “may,” “objective,” “outlook,” “plan,” “project,” “possible,” “potential,” “should,” “will,” “would” and similar expressions. Actual results may vary materially. Forward-looking statements speak only as of the date they are made, and we expressly disclaim any obligation to update any forward-looking information. The following factors, in addition to those discussed in Xcel Energy’s Annual Report on Form 10-K for the fiscal year ended Dec. 31, 2020 and subsequent filings with the Securities and Exchange Commission, could cause actual results to differ materially from management expectations as suggested by such forward-looking information: uncertainty around the impacts and duration of the COVID-19 pandemic; operational safety, including our nuclear generation facilities; successful long-term operational planning; commodity risks associated with energy markets and production; rising energy prices and fuel costs; qualified employee work force and third-party contractor factors; ability to recover costs, changes in regulation and subsidiaries’ ability to recover costs from customers; reductions in our credit ratings and the cost of maintaining certain contractual relationships; general economic conditions, including inflation rates, monetary fluctuations and their impact on capital expenditures and the ability of Xcel Energy Inc. and its subsidiaries to obtain financing on favorable terms; availability or cost of capital; our customers’ and counterparties’ ability to pay their debts to us; assumptions and costs relating to funding our employee benefit plans and health care benefits; our subsidiaries’ ability to make dividend payments; tax laws; effects of geopolitical events, including war and acts of terrorism; cyber security threats and data security breaches; seasonal weather patterns; changes in environmental laws and regulations; climate change and other weather; natural disaster and resource depletion, including compliance with any accompanying legislative and regulatory changes; and costs of potential regulatory penalties.

This information is not given in connection with any
sale, offer for sale or offer to buy any security.

XCEL ENERGY INC. AND SUBSIDIARIES

CONSOLIDATED STATEMENTS OF INCOME (UNAUDITED)

(amounts in millions, except per share data)


Three Months Ended March 31


2021


2020

Operating revenues


Electric


$

2,870


$

2,203


Natural gas


647


583


Other


24


25


Total operating revenues


3,541


2,811


Operating expenses


Electric fuel and purchased power


1,386


797


Cost of natural gas sold and transported


299


285


Cost of sales — other


8


9


Operating and maintenance expenses


584


579


Conservation and demand side management expenses


73


74


Depreciation and amortization


521


463


Taxes (other than income taxes)


163


149


Total operating expenses


3,034


2,356


Operating income


507


455


Other income (expense), net


5


(11

)

Equity earnings of unconsolidated subsidiaries


14


11


Allowance for funds used during construction — equity


14


23


Interest charges and financing costs


Interest charges — includes other financing costs of $7 and $7, respectively


205


199


Allowance for funds used during construction — debt


(5

)


(10

)

Total interest charges and financing costs


200


189


Income before income taxes


340


289


Income tax benefit


(22

)


(6

)

Net income


$

362


$

295


Weighted average common shares outstanding:


Basic


538


526

Diluted


539


527


Earnings per average common share:


Basic


$

0.67


$

0.56


Diluted


0.67


0.56


XCEL ENERGY INC. AND SUBSIDIARIES
Notes to Investor Relations Earnings Release (Unaudited)

Due to the seasonality of Xcel Energy’s operating results, quarterly financial results are not an appropriate base from which to project annual results.

Non-GAAP Financial Measures

The following discussion includes financial information prepared in accordance with generally accepted accounting principles (GAAP), as well as certain non-GAAP financial measures such as ongoing return on equity (ROE), electric margin, natural gas margin, ongoing earnings and ongoing diluted EPS. Generally, a non-GAAP financial measure is a measure of a company’s financial performance, financial position or cash flows that excludes (or includes) amounts that are adjusted from measures calculated and presented in accordance with GAAP. Xcel Energy’s management uses non-GAAP measures for financial planning and analysis, for reporting of results to the Board of Directors, in determining performance-based compensation and communicating its earnings outlook to analysts and investors. Non-GAAP financial measures are intended to supplement investors’ understanding of our performance and should not be considered alternatives for financial measures presented in accordance with GAAP. These measures are discussed in more detail below and may not be comparable to other companies’ similarly titled non-GAAP financial measures.

Ongoing ROE

Ongoing ROE is calculated by dividing the net income or loss of Xcel Energy or each subsidiary, adjusted for certain nonrecurring items, by each entity’s average stockholder’s equity. We use these non-GAAP financial measures to evaluate and provide details of earnings results.

Electric and Natural Gas Margins

Electric margin is presented as electric revenues less electric fuel and purchased power expenses. Natural gas margin is presented as natural gas revenues less the cost of natural gas sold and transported. Expenses incurred for electric fuel and purchased power and the cost of natural gas are generally recovered through various regulatory recovery mechanisms. As a result, changes in these expenses are generally offset in operating revenues. Management believes electric and natural gas margins provide the most meaningful basis for evaluating our operations because they exclude the revenue impact of fluctuations in these expenses. These margins can be reconciled to operating income, a GAAP measure, by including other operating revenues, cost of sales - other, operating and maintenance (O&M) expenses, conservation and demand side management (DSM) expenses, depreciation and amortization and taxes (other than income taxes).

Earnings Adjusted for Certain Items (Ongoing Earnings and Ongoing Diluted EPS)

GAAP diluted EPS reflects the potential dilution that could occur if securities or other agreements to issue common stock (i.e., common stock equivalents) were settled. The weighted average number of potentially dilutive shares outstanding used to calculate Xcel Energy Inc.’s diluted EPS is calculated using the treasury stock method. Ongoing earnings reflect adjustments to GAAP earnings (net income) for certain items. Ongoing diluted EPS is calculated by dividing the net income or loss of each subsidiary, adjusted for certain items, by the weighted average fully diluted Xcel Energy Inc. common shares outstanding for the period. Ongoing diluted EPS for each subsidiary is calculated by dividing the net income or loss of such subsidiary, adjusted for certain items, by the weighted average fully diluted Xcel Energy Inc. common shares outstanding for the period.

We use these non-GAAP financial measures to evaluate and provide details of Xcel Energy’s core earnings and underlying performance. We believe these measurements are useful to investors to evaluate the actual and projected financial performance and contribution of our subsidiaries. For the three months ended March 31, 2021 and 2020, there were no such adjustments to GAAP earnings and therefore GAAP earnings equal ongoing earnings for these periods.

Note 1. Earnings Per Share Summary

Xcel Energy’s 2021 first quarter earnings were $0.67 per share compared to $0.56 per share in 2020, primarily reflecting higher electric and natural gas margins (driven by capital investment recovery and regulatory outcomes), which more than offset additional depreciation, interest charges, less AFUDC and declining sales primarily due to the impacts of COVID-19. First quarter earnings also reflect margin from proprietary commodity trading transactions, primarily entered into under Xcel Energy’s ordinary practices prior to the weather event. See Note 5 for further discussion.

Summarized diluted EPS for Xcel Energy:


Three Months Ended March 31

Diluted Earnings (Loss) Per Share


2021


2020

PSCo


$

0.31


$

0.24


NSP-Minnesota


0.24


0.20


SPS


0.11


0.08


NSP-Wisconsin


0.06


0.06


Equity earnings of unconsolidated subsidiaries


0.01


0.01


Regulated utility (a)


0.73


0.60


Xcel Energy Inc. and Other


(0.06

)


(0.04

)

Total (a)


$

0.67


$

0.56


(a) Amounts may not add due to rounding.

PSCo — Earnings increased $0.07 per share for the first quarter of 2021, reflecting higher natural gas and electric margins (primarily capital investment recovery and regulatory outcomes), partially offset by additional depreciation and taxes (other than income taxes).

NSP-Minnesota — Earnings increased $0.04 per share for the first quarter of 2021, reflecting higher electric margin (primarily capital investment recovery), partially offset by increased depreciation.

SPS — Earnings increased $0.03 per share for the first quarter of 2021, reflecting higher electric margin (regulatory outcomes in Texas and New Mexico), partially offset by increased depreciation.

NSP-Wisconsin — Earnings were flat for the first quarter of 2021.

Xcel Energy Inc. and Other — Primarily includes financing costs at the holding company.

Components significantly contributing to changes in 2021 EPS compared to 2020:

Diluted Earnings (Loss) Per Share


Three Months
Ended March 31

GAAP and ongoing diluted EPS - 2020


$

0.56


Components of change - 2021 vs. 2020


Higher electric margin


0.11


Higher natural gas margins


0.07


Lower ETR (a)


0.06


Higher other income (expense), net


0.02


Higher depreciation and amortization


(0.08

)

Lower AFUDC


(0.02

)

Higher interest charges


(0.01

)

Higher O&M


(0.01

)

Other, net


(0.03

)

GAAP and ongoing diluted EPS - 2021


$

0.67


(a) Includes production tax credits (PTCs) and plant regulatory amounts, which are primarily offset in electric margin.

Note 2. Regulated Utility Results

Estimated Impact of Temperature Changes on Regulated Earnings — Unusually hot summers or cold winters increase electric and natural gas sales, while mild weather reduces electric and natural gas sales. The estimated impact of weather on earnings is based on the number of customers, temperature variances, the amount of natural gas or electricity historically used per degree of temperature and excludes any incremental related operating expenses that could result due to storm activity or vegetation management requirements. As a result, weather deviations from normal levels can affect Xcel Energy’s financial performance.

Degree-day or Temperature-Humidity Index (THI) data is used to estimate amounts of energy required to maintain comfortable indoor temperature levels based on each day’s average temperature and humidity. Heating degree-days (HDD) is the measure of the variation in the weather based on the extent to which the average daily temperature falls below 65° Fahrenheit. Cooling degree-days (CDD) is the measure of the variation in the weather based on the extent to which the average daily temperature rises above 65° Fahrenheit. Each degree of temperature above 65° Fahrenheit is counted as one CDD, and each degree of temperature below 65° Fahrenheit is counted as one HDD. In Xcel Energy’s more humid service territories, a THI is used in place of CDD, which adds a humidity factor to CDD. HDD, CDD and THI are most likely to impact the usage of Xcel Energy’s residential and commercial customers. Industrial customers are less sensitive to weather. Typically, sales are not impacted in the first or fourth quarter due to THI or CDD.

Normal weather conditions are defined as either the 10, 20 or 30-year average of actual historical weather conditions. The historical period of time used in the calculation of normal weather differs by jurisdiction, based on regulatory practice. To calculate the impact of weather on demand, a demand factor is applied to the weather impact on sales. Extreme weather variations, windchill and cloud cover may not be reflected in weather-normalized estimates.

Percentage increase (decrease) in normal and actual HDD:


Three Months Ended March 31


2021 vs.
Normal


2020 vs.
Normal


2021 vs. 2020

HDD

1.3

%


(5.5)

%


6.5

%


Weather — Estimated impact of temperature variations on EPS compared with normal weather conditions:


Three Months Ended March 31


2021 vs.
Normal


2020 vs.
Normal


2021 vs. 2020

Retail electric

$


$

(0.011

)


$

0.011


Decoupling and sales true-up

0.002


0.006


(0.004

)

Electric total

$

0.002


$

(0.005

)


$

0.007


Firm natural gas

0.003


(0.007

)


0.010


Total

$

0.005


$

(0.012

)


$

0.017


Sales — Sales growth (decline) for actual and weather-normalized sales in 2021 compared to 2020:


Three Months Ended March 31


PSCo


NSP-Minnesota


SPS


NSP-Wisconsin


Xcel Energy

Actual (a)


Electric residential


6.3

%


5.1

%


8.8

%


4.7

%


6.0

%

Electric C&I


(4.8

)


(6.6

)


(7.1

)


(1.8

)


(5.8

)

Total retail electric sales


(1.0

)


(2.9

)


(4.3

)


0.2


(2.4

)

Firm natural gas sales


4.7


0.5


N/A


0.8


3.1


Three Months Ended March 31


PSCo


NSP-Minnesota


SPS


NSP-Wisconsin


Xcel Energy

Weather-Normalized (a)


Electric residential


4.9

%


4.5

%


3.8

%


2.9

%


4.4

%

Electric C&I


(5.1

)


(6.7

)


(7.3

)


(1.9

)


(6.0

)

Total retail electric sales


(1.7

)


(3.1

)


(5.4

)


(0.4

)


(3.0

)

Firm natural gas sales


(0.9

)


(1.3

)


N/A


(2.7

)


(1.2

)


Three Months Ended March 31 (2020 Leap Year Adjusted)


PSCo


NSP-Minnesota


SPS


NSP-Wisconsin


Xcel Energy

Weather-Normalized (a)


Electric residential


6.1

%


5.7

%


5.0

%


4.0

%


5.6

%

Electric C&I


(4.1

)


(5.6

)


(6.3

)


(0.8

)


(5.0

)

Total retail electric sales


(0.6

)


(2.0

)


(4.3

)


0.7


(1.9

)

Firm natural gas sales


0.2


(0.2

)


N/A


(1.5

)


(a) Higher residential sales and lower commercial and industrial (C&I) sales were primarily attributable to COVID-19.

Weather-normalized and leap-year adjusted electric sales growth (decline) — year-to-date (excluding leap day)

Each of our utility subsidiaries experienced higher residential sales and lower C&I sales as a result of COVID-19 beginning in March 2020. In addition, the following items impacted sales:

  • PSCo — Residential sales rose based on an increased number of customers and higher use per customer. The decline in C&I sales was primarily due to decreases in the manufacturing and service industries, partially offset by an increase in the energy sector.
  • NSP-Minnesota — Residential sales growth reflects higher use per customer and increased customer additions. The decline in C&I sales was primarily due to decreases within the manufacturing and service sectors.
  • SPS — Residential sales increased due to customer growth and higher use per customer. The decline in C&I sales was driven by decreases within the energy and manufacturing sectors.
  • NSP-Wisconsin — Residential sales growth was attributable to customer additions and higher use per customer. The decline in C&I sales was largely related to decreases in the energy and manufacturing industries, partially offset by an increase in the service sector.

Weather-normalized and leap-year adjusted natural gas sales growth (decline) — year-to-date (excluding leap day)

  • Natural gas sales primarily reflect lower customer use, offset by an increase in the number of customers.

Electric Margin — Electric revenues and fuel and purchased power expenses are impacted by fluctuations in the price of natural gas, coal and uranium. However, these price fluctuations have minimal impact on electric margin due to fuel recovery mechanisms that recover fuel expenses. In addition, electric customers receive a credit for PTCs generated, which reduced electric revenue and margin. See Note 5 for discussion on the impact of Winter Storm Uri.

Electric revenues and margin:


Three Months Ended March 31

(Millions of Dollars)


2021


2020

Electric revenues


$

2,870


$

2,203


Electric fuel and purchased power


(1,386

)


(797

)

Electric margin


$

1,484


$

1,406


Changes in electric margin:

(Millions of Dollars)


Three Months
Ended March 31,
2021 vs. 2020

Non-fuel riders


$

44


Regulatory rate outcomes (Colorado, Texas, New Mexico, Wisconsin and North Dakota)


44


Proprietary commodity trading, net of sharing (see Note 5)


27


Wholesale transmission revenue (net)


11


Estimated impact of weather (net of decoupling/sales true-up)


5


PTCs flowed back to customers (offset by lower ETR)


(37

)

Sales and demand (a)


(14

)

Other (net)


(2

)

Total increase in electric margin


$

78


(a) Sales excludes weather impact, net of decoupling/sales true-up, and demand is net of sales true-up.

Natural Gas Margin — Natural gas expense varies with changing sales and the cost of natural gas. However, fluctuations in the cost of natural gas has minimal impact on natural gas margin due to cost recovery mechanisms. See Note 5 for discussion on the impact of Winter Storm Uri.

Natural gas revenues and margin:


Three Months Ended March 31

(Millions of Dollars)


2021


2020

Natural gas revenues


$

647


$

583


Cost of natural gas sold and transported


(299

)


(285

)

Natural gas margin


$

348


$

298


Changes in natural gas margin:

(Millions of Dollars)


Three Months
Ended March 31,
2021 vs. 2020

Regulatory rate outcomes (Colorado)


$

40


Estimated impact of weather


7


Other (net)


3


Total increase in natural gas margin


$

50


O&M Expenses — O&M expenses increased $5 million, or 0.9%, for the first quarter of 2021. The increase was primarily due to expenses associated with new wind farms, software and infrastructure costs, compensation, damage prevention and storms, partially offset by continuous improvement initiatives.

Depreciation and Amortization — Depreciation and amortization increased $58 million, or 12.5%, for the first quarter of 2021. The increase was primarily driven by several wind farms going into service, as well as normal system expansion. In addition, 2021 depreciation expense increased as a result of implementation of new depreciation rates in Colorado, New Mexico and Texas.

Other Income (Expense) Other income (expense) increased $16 million for the first quarter of 2021, largely related to rabbi trust performance primarily offset in O&M expenses (compensation).

AFUDC, Equity and Debt — AFUDC decreased $14 million for the first quarter of 2021. Decrease was driven by various wind projects placed into service.

Interest Charges — Interest charges increased $6 million, or 3.0%, for the first quarter of 2021. The increase was largely attributable to higher debt levels to fund capital investments, partially offset by lower long-term and short-term interest rates.

Income Taxes Effective income tax rate:


Three Months Ended March 31


2021


2020


2021 vs 2020

Federal statutory rate


21.0

%


21.0

%


%

State tax (net of federal tax effect)


4.9


4.9


(Decreases) increases:


Wind PTCs


(24.6

)


(17.2

)


(7.4

)

Plant regulatory differences (a)


(6.1

)


(8.4

)


2.3


Other (net)


(1.7

)


(2.4

)


0.7


Effective income tax rate


(6.5

)%


(2.1

)%


(4.4

)%

(a) Regulatory differences for income tax primarily relate to the credit of excess deferred taxes to customers. Income tax benefits associated with the credit of excess deferred credits are generally offset by corresponding revenue reductions.

Income tax benefit increased $16 million for the first quarter of 2021. The increase was primarily driven by an increase in wind PTCs due to additional wind facilities going into service. Wind PTCs are credited to customers (recorded as a reduction to revenue) and do not have a material impact on net income. Impact of wind PTCs was partially offset by higher pretax earnings in 2021.

Note 3. Capital Structure, Liquidity, Financing and Credit Ratings

Xcel Energy’s capital structure:

(Millions of Dollars)


March 31, 2021


Percentage of Total
Capitalization


Dec. 31, 2020


Percentage of Total
Capitalization

Current portion of long-term debt


$

21


%


$

421


1

%

Short-term debt


1,477


4


584


2


Long-term debt


21,470


57


19,645


56


Total debt


22,968


61


20,650


59


Common equity


14,700


39


14,575


41


Total capitalization


$

37,668


100

%


$

35,225


100

%


Contacts

Paul Johnson, Vice President, Investor Relations, (612) 215-4535

For news media inquiries only, please call Xcel Energy Media Relations, (612) 215-5300

Xcel Energy website address: www.xcelenergy.com


Read full story here

KANSAS CITY, Mo.--(BUSINESS WIRE)--CorEnergy Infrastructure Trust, Inc. (NYSE: CORR, CORRPrA) ("CorEnergy" or the "Company") announced today that its Board of Directors declared a first quarter 2021 dividend of $0.05 per share for its common stock, consistent with the preceding quarter. The dividend is payable on May 28, 2021, to shareholders of record on May 14, 2021.


The Board of Directors also declared a cash dividend of $0.4609375 per depositary share for the Company’s 7.375% Series A Cumulative Redeemable Preferred Stock. The preferred stock dividend, which equates to an annual dividend payment of $1.84375 per depositary share, is payable on May 28, 2021, to shareholders of record on May 14, 2021.

The Company's Board of Directors also authorized the reinstatement of the operation of the Company's Dividend Reinvestment Plan ("DRIP"). The Board of Directors made this determination in light of the fact that the staff of the Securities and Exchange Commission has advised the Company that we can resume the use of our previously filed and effective shelf registration statements.

Additionally, the Company's Board of Directors authorized the declaration of dividends on the Company's 4.00% Series B Redeemable Convertible Preferred Securities ("Series B Preferred") and shares of the Company's 9.00% Series C Exchangeable Preferred Securities ("Series C Preferred") as if they had been outstanding, in accordance with the terms of the Crimson Midstream Holdings, LLC Agreement.

First Quarter 2021 Results Release Date

The Company also announced today that it will report earnings results for its first quarter, ended March 31, 2021, on May 10, 2021.

CorEnergy will host a conference call on Tuesday, May 11, 2021, at 2:00 p.m. Central Time to discuss its financial results. Please dial into the call at +1-201-689-8035 at least five minutes prior to the scheduled start time. The call will also be webcast in a listen-only format. A link to the webcast will be accessible at corenergy.reit.

A replay of the call will be available until 2:00 p.m. Central Time on June 11, 2021, by dialing +1-919-882-2331. The Conference ID is 40739. A replay of the conference call will also be available on the Company’s website.

About CorEnergy Infrastructure Trust, Inc.

CorEnergy Infrastructure Trust, Inc. (NYSE: CORR, CORRPrA) is a real estate investment trust that owns and operates or leases regulated natural gas transmission and distribution and crude oil gathering, storage and transmission pipelines and associated rights-of-way. For more information, please visit corenergy.reit.

Forward-Looking Statements

This press release contains certain statements that may include "forward-looking statements" within the meaning of Section 27A of the Securities Act of 1933 and Section 21E of the Securities Exchange Act of 1934. All statements, other than statements of historical fact, included herein are "forward-looking statements." Although CorEnergy believes that the expectations reflected in these forward-looking statements are reasonable, they do involve assumptions, risks and uncertainties, and these expectations may prove to be incorrect. Actual results could differ materially from those anticipated in these forward-looking statements as a result of a variety of factors, including those discussed in CorEnergy's reports that are filed with the Securities and Exchange Commission. You should not place undue reliance on these forward-looking statements, which speak only as of the date of this press release. Other than as required by law, CorEnergy does not assume a duty to update any forward-looking statement. In particular, any distribution paid in the future to our stockholders will depend on the actual performance of CorEnergy, its costs of leverage and other operating expenses and will be subject to the approval of CorEnergy's Board of Directors and compliance with leverage covenants.

Source: CorEnergy Infrastructure Trust, Inc.


Contacts

CorEnergy Infrastructure Trust, Inc.
Investor Relations
Debbie Hagen or Matt Kreps
877-699-CORR (2677)
This email address is being protected from spambots. You need JavaScript enabled to view it.

DULUTH, Minn.--(BUSINESS WIRE)--The ALLETE, Inc. (NYSE:ALE) board of directors has declared a quarterly dividend of 63 cents per share of common stock.


On an annual basis the dividend is equivalent to $2.52 per share, unchanged from the previous quarter.

The regular quarterly dividend is payable June 1 to common stock shareholders of record at the close of business May 14, 2021.

ALLETE Inc. is an energy company headquartered in Duluth, Minnesota. In addition to its electric utilities, Minnesota Power and Superior Water, Light and Power of Wisconsin, ALLETE owns ALLETE Clean Energy, based in Duluth; BNI Energy, based in Bismarck, N.D.; and has an 8 percent equity interest in the American Transmission Co. More information about ALLETE is available at www.allete.com. ALE-CORP

The statements contained in this release and statements that ALLETE may make orally in connection with this release that are not historical facts, are forward-looking statements. These forward-looking statements involve risks and uncertainties and investors are directed to the risks discussed in documents filed by ALLETE with the Securities and Exchange Commission.


Contacts

Investor Contact:
Vince Meyer
218-723-3952
This email address is being protected from spambots. You need JavaScript enabled to view it.

HOUSTON--(BUSINESS WIRE)--Noble Midstream Partners LP (NASDAQ: NBLX) (“Noble Midstream” or the “Partnership”) announced today that it expects to close the previously announced merger transaction with Chevron Corporation (“Chevron”) in mid-May. Under the terms of the merger agreement, at the closing, all of the publicly held common units representing limited partner interests in the Partnership will convert into the right to receive newly issued shares of Chevron common stock. As a result, Partnership unitholders are not expected to receive a quarterly distribution from the Partnership for the quarter ended March 31, 2021, and instead, unitholders are expected to receive a quarterly dividend, payable June 10, 2021, from Chevron for the quarter ended March 31, 2021, provided that such unitholders continue to hold the shares of Chevron common stock received in the merger on May 19, 2021, the record date for the Chevron quarterly dividend.

The Partnership expects to file its Form 10-Q for the quarter ended March 31, 2021 with the SEC in early May. Due to the anticipated timing of the closing of the merger, the Partnership will not host an earnings call for the quarter ended March 31, 2021, nor will it release a statement regarding earnings or hold an investor presentation.

About Noble Midstream

Noble Midstream is a master limited partnership originally formed by Noble Energy, Inc. and majority-owned by Chevron Corporation to own, operate, develop and acquire domestic midstream infrastructure assets. Noble Midstream currently provides crude oil, natural gas, and water-related midstream services and owns equity interests in oil pipelines in the DJ Basin in Colorado and the Delaware Basin in Texas. Noble Midstream strives to be the midstream provider and partner of choice for its safe operations, reliability, and strong relationships while enhancing value for all stakeholders. For more information, please visit www.nblmidstream.com.

Cautionary Statements

This news release contains certain “forward-looking statements” within the meaning of federal securities law. Words such as “anticipates”, “believes”, “expects”, “intends”, “will”, “should”, “may”, “estimates”, “strategy”, “objective” and similar expressions may be used to identify forward-looking statements. Forward-looking statements are not statements of historical fact and reflect the Partnership’s current views about future events. No assurances can be given that the forward-looking statements contained in this news release will occur as projected, and actual results may differ materially from those projected. Forward-looking statements are based on current expectations, estimates and assumptions that involve a number of risks and uncertainties that could cause actual results to differ materially from those projected. Among the important factors that could cause actual results to differ materially from those in the forward-looking statements are the realization of expected benefits of the proposed transaction to the Partnership’s unitholders and the anticipated consummation of the proposed transaction and the timing thereof. For further discussion of risks and uncertainties, you should refer to those described under “Risk Factors” and “Forward-Looking Statements” in the Partnership’s most recent Annual Report on Form 10-K and in other reports we file with the Securities and Exchange Commission (“SEC”). These reports are also available from the Partnership’s office or website, www.nblmidstream.com. Forward-looking statements are based on the estimates and opinions of management at the time the statements are made. Noble Midstream does not assume any obligation to update forward-looking statements should circumstances, management’s estimates, or opinions change.

No Offer or Solicitation

This press release is for informational purposes only and shall not constitute an offer to sell or the solicitation of an offer to buy any securities pursuant to the transaction or otherwise, nor shall there be any sale of securities in any jurisdiction in which the offer, solicitation or sale would be unlawful prior to the registration or qualification under the securities laws of any such jurisdiction. No offer of securities shall be made except by means of a prospectus meeting the requirements of Section 10 of the Securities Act of 1933, as amended.

Additional Information and Where You Can Find It

In connection with the proposed transaction, Chevron filed a registration statement on Form S-4, which included an information statement of Noble Midstream, with the U.S. Securities and Exchange Commission (“SEC”). The Registration Statement was declared effective by the SEC on April 13, 2021. INVESTORS AND SECURITYHOLDERS OF CHEVRON AND NOBLE MIDSTREAM ARE ADVISED TO CAREFULLY READ THE REGISTRATION STATEMENT AND INFORMATION STATEMENT, PROSPECTUS, AND OTHER RELEVANT DOCUMENTS (INCLUDING ALL AMENDMENTS AND SUPPLEMENTS THERETO) BECAUSE THEY CONTAIN IMPORTANT INFORMATION ABOUT THE TRANSACTION, THE PARTIES TO THE TRANSACTION AND THE RISKS ASSOCIATED WITH THE TRANSACTION. A definitive information statement has been mailed to securityholders of Noble Midstream. Investors and securityholders may obtain a free copy of such documents and other relevant documents filed by Chevron or Noble Midstream with the SEC from the SEC’s website at www.sec.gov. Securityholders and other interested parties are also able to obtain, without charge, a copy of such documents and other relevant documents from Chevron’s website at www.chevron.com under the “Investors” tab under the heading “SEC Filings” or from Noble Midstream’s website at www.nblmidstream.com under the “Investors” tab and the “SEC Filings” sub-tab.

Participants in the Solicitation

Chevron, Noble Midstream and their respective directors, executive officers and certain other members of management may be deemed to be participants in the solicitation of proxies and consents in respect of the transaction. Information about these persons is set forth in Chevron’s proxy statement relating to its 2021 Annual Meeting of Stockholders, which was filed with the SEC on April 8, 2021, and Noble Midstream’s Annual Report on Form 10-K for the year ended December 31, 2020, which was filed with the SEC on February 12, 2021, and subsequent statements of changes in beneficial ownership on file with the SEC. Securityholders and investors may obtain additional information regarding the interests of such persons, which may be different than those of the respective companies’ securityholders generally, by reading the consent solicitation statement prospectus statement, or other relevant documents regarding the transaction (if and when available), which may be filed with the SEC.


Contacts

Park Carrere
Investor Relations
(281) 872-3208
This email address is being protected from spambots. You need JavaScript enabled to view it.

BOISE, Idaho--(BUSINESS WIRE)--IDACORP, Inc. (NYSE: IDA) reported first quarter 2021 net income attributable to IDACORP of $44.8 million, or $0.89 per diluted share, compared with $37.5 million, or $0.74 per diluted share, in the first quarter of 2020.


“Our customer count grew 2.9% over the past twelve months and is accelerating," said IDACORP President and Chief Executive Officer Lisa Grow. “In March 2021 alone, our customer growth rate was 3.5%.

“This growth, combined with increased transmission-related revenues from higher rates and colder weather in the southwest U.S., more than offset a slight decrease in commercial customer sales related to the pandemic. Lower operations and maintenance expenses across the business also increased earnings this quarter.

"We expect robust customer growth to continue throughout 2021, as residential and business customers continue migrating to Idaho in search of our high quality-of-life and business-friendly environment."

IDACORP affirms its previously reported full-year 2021 earnings guidance to the range of $4.60 to $4.80 per diluted share and is also affirming that Idaho Power does not expect to utilize any of the additional tax credits available under its Idaho earnings support regulatory mechanism in 2021. This guidance assumes normal weather conditions over the balance of the year and includes assumed levels of impact from COVID-19 as described below, which also acknowledges circumstances could change and impact results going forward.

Performance Summary

A summary of financial highlights for the quarter ended March 31, 2021 and 2020 is as follows (in thousands, except per-share amounts):


Three months ended

March 31,


2021


2020

Net income attributable to IDACORP, Inc.


$

44,831


$

37,490


Average outstanding shares – diluted (000’s)


50,580


50,527


IDACORP, Inc. earnings per diluted share


$

0.89


$

0.74


The table below provides a reconciliation of net income attributable to IDACORP for the three months ended March 31, 2021, from the same period in 2020 (items are in millions and are before related income tax impact unless otherwise noted).


Three months
ended

Net income attributable to IDACORP, Inc. - March 31, 2020


$

37.5


Increase (decrease) in Idaho Power net income:


Customer growth, net of associated power supply costs and power cost adjustment mechanisms


3.7


Usage per retail customer, net of associated power supply costs and power cost adjustment mechanisms


(1.3

)


Idaho fixed cost adjustment (FCA) revenues


0.1


Retail revenues per megawatt-hour (MWh), net of associated power supply costs and power cost adjustment mechanisms


(0.4

)


Transmission wheeling-related revenues


4.1


Other operations and maintenance (O&M) expenses


4.2


Other changes in operating revenues and expenses, net


(0.8

)


Increase in Idaho Power operating income


9.6


Non-operating income and expenses


(0.5

)


Income tax expense


(1.5

)


Total increase in Idaho Power net income


7.6


Other IDACORP changes (net of tax)


(0.3

)


Net income attributable to IDACORP, Inc. - March 31, 2021


$

44.8


IDACORP's net income increased $7.3 million for the first quarter of 2021 compared with the first quarter of 2020, primarily due to higher net income at Idaho Power. Customer growth increased operating income by $3.7 million in the first quarter of 2021 compared with the first quarter of 2020, as the number of Idaho Power customers grew by approximately 16,700, or 2.9 percent, during the twelve months ended March 31, 2021. Lower sales volumes on a per-customer basis decreased operating income by $1.3 million in the first quarter of 2021 compared with the first quarter of 2020, as lower usage per commercial customer was mostly offset by higher usage per residential customer. A decrease of 2 percent in usage per commercial customer in the first quarter of 2021 compared with the mostly pre-pandemic first quarter of 2020 was partly due to the negative impacts of COVID-19 on commercial customers' operations. Residential customers used more energy for heating due to colder weather in Idaho Power's service area, which contributed to a 1 percent increase in usage per residential customer in the first quarter of 2021 compared with the first quarter of 2020.

During the first quarter of 2021, transmission wheeling-related revenues increased $4.1 million compared with the first quarter of 2020 due to an increase in wheeling volumes and an increase in Idaho Power's open access transmission tariff (OATT) rates. Colder winter weather in the southwest United States increased wheeling volumes in the first quarter of 2021 compared with the first quarter of 2020. Also, Idaho Power's OATT rates were approximately 10 percent higher in the first quarter of 2021 compared with the first quarter of 2020.

Other O&M expenses were $4.2 million lower in the first quarter of 2021 compared with the first quarter of 2020, partially due to a difference in the timing of cloud seeding activities and cost savings initiatives at the jointly-owned coal plants. The decrease was also due to the October 2020 closure of Idaho Power's jointly-owned coal plant in Boardman, Oregon. A regulatory mechanism facilitating the recovery of costs related to the closure of the Boardman plant also reduced operating revenues by a corresponding amount in the first quarter of 2021 compared with the first quarter of 2020. In addition, COVID-19-related decreases in employee travel and training costs reduced other O&M expenses in the first quarter of 2021 compared with the first quarter of 2020.

The increase in income tax expense for the first quarter of 2021, compared with the first quarter of 2020, was primarily due to greater 2021 pre-tax income.

2021 Annual Earnings Guidance and Key Operating and Financial Metrics

IDACORP is affirming its earnings guidance estimate for 2021. The 2021 guidance incorporates all of the key operating and financial assumptions listed in the table that follows (in millions, except per share amounts):


Current(1)


Previous(2)

IDACORP Earnings Guidance (per share)


No change


$ 4.60 – $ 4.80

Idaho Power Additional Amortization of ADITCs


No change


None

Idaho Power Operating & Maintenance Expense


No change


$ 345 – $ 355

Idaho Power Capital Expenditures, Excluding Allowance for Funds Used During Construction


No change


$ 320 – $ 330

Idaho Power Hydropower Generation (MWh)


5.5 – 7.5


6.0 – 8.0

(1) As of April 29, 2021.
(2) As of February 18, 2021, the date of filing IDACORP's and Idaho Power's Annual Report on Form 10-K for the year ended December 31, 2020.

To-date, Idaho Power has not experienced significant disruption to its business operations, critical supply-chain shortages, or major declines in customer usage related to COVID-19, with the exception of decreases in commercial and industrial customer usage. However, if circumstances associated with COVID-19 were to deteriorate more than Idaho Power anticipates in the company’s service area or nationally, Idaho Power could experience more substantial impacts, which could affect financial projections and results that are currently contemplated in the guidance range above. More detailed information on Idaho Power’s actions in response to COVID-19, as well as operational and financial risks associated with COVID-19, are described in IDACORP’s and Idaho Power’s Annual Report on Form 10-K filed on February 18, 2021, with the U.S. Securities and Exchange Commission, which is also available for review on IDACORP’s website at www.idacorpinc.com.

More detailed financial information is provided in IDACORP's Quarterly Report on Form 10-Q filed today with the U.S. Securities and Exchange Commission and posted to the IDACORP website at www.idacorpinc.com.

Web Cast / Conference Call

IDACORP will hold an analyst conference call today at 2:30 p.m. Mountain Time (4:30 p.m. Eastern Time). All parties interested in listening may do so through a live webcast on IDACORP's website (www.idacorpinc.com), or by calling (833) 759-1159 for listen-only mode. The passcode for the call is 5178488. The conference call logistics are also posted on IDACORP's website and will be included in IDACORP's earnings news release. Slides will be included during the conference call. To access the slide deck, register for the event just prior to the call at www.idacorpinc.com/investor-relations/earnings-center/default.aspx. A replay of the conference call will be available on the company's website for 12 months and will be available shortly after the call.

Background Information

IDACORP, Inc. (NYSE: IDA), Boise, Idaho-based and formed in 1998, is a holding company comprised of Idaho Power, a regulated electric utility; IDACORP Financial, a holder of affordable housing projects and other real estate investments; and Ida-West Energy, an operator of small hydroelectric generation projects that satisfy the requirements of the Public Utility Regulatory Policies Act of 1978. Idaho Power began operations in 1916 and employs approximately 2,000 people to serve a 24,000-square-mile service area in southern Idaho and eastern Oregon. Idaho Power’s goal of 100% clean energy by 2045 builds on its long history as a clean-energy leader providing reliable service at affordable prices. With 17 low-cost hydropower projects at the core of its diverse energy mix, Idaho Power’s more than 590,000 residential, business, and agricultural customers pay among the nation's lowest prices for electricity. To learn more about IDACORP or Idaho Power, visit www.idacorpinc.com or www.idahopower.com.

Forward-Looking Statements

In addition to the historical information contained in this press release, this press release contains (and oral communications made by IDACORP, Inc. and Idaho Power Company may contain) statements, including, without limitation, earnings guidance and estimated key operating and financial metrics, that relate to future events and expectations and, as such, constitute forward-looking statements within the meaning of the Private Securities Litigation Reform Act of 1995. Any statements that express, or involve discussions as to, expectations, beliefs, plans, objectives, outlook, assumptions, or future events or performance, often, but not always, through the use of words or phrases such as "anticipates," "believes," "continues," "could," "estimates," "expects," "guidance," "intends," "potential," "plans," "predicts," "projects or projected," "targets," or similar expressions, are not statements of historical facts and may be forward-looking. Forward-looking statements are not guarantees of future performance and involve estimates, assumptions, risks, and uncertainties. Actual results, performance, or outcomes may differ materially from the results discussed in the statements. In addition to any assumptions and other factors and matters referred to specifically in connection with such forward-looking statements, factors that could cause actual results or outcomes to differ materially from those contained in forward-looking statements include the following: (a) the effect of decisions by the Idaho and Oregon public utilities commissions and the Federal Energy Regulatory Commission that impact Idaho Power's ability to recover costs and earn a return on investment; (b) changes to or the elimination of Idaho Power's regulatory cost recovery mechanisms; (c) the impacts of the COVID-19 pandemic on the global and regional economy and on Idaho Power's employees, customers, contractors, and suppliers, including on loads and revenues, uncollectible accounts, transmission revenues, and other aspects of the companies' business; (d) changes in residential, commercial, and industrial growth and demographic patterns within Idaho Power's service area, and their associated impacts on loads and load growth, and the availability of regulatory mechanisms that allow for timely cost recovery through customer rates in the event of those changes; (e) abnormal or severe weather conditions (including conditions and events associated with climate change), wildfires, droughts, earthquakes, and other natural phenomena and natural disasters, which affect customer sales, hydropower generation levels, repair costs, service interruptions, liability for damage caused by utility property, and the availability and cost of fuel for generation plants or purchased power to serve customers; (f) advancement of self-generation, energy storage, energy efficiency, alternative energy sources, and other technologies that may reduce Idaho Power's sale or delivery of electric power or introduction of operational or cyber-security vulnerabilities to the power grid; (g) acts or threats of terrorist incidents, acts of war, social unrest, cyber-attacks, the companies' failure to secure data or to comply with privacy laws or regulations, physical security breaches, or the disruption or damage to the companies' business, operations, or reputation resulting from such events; (h) the expense and risks associated with capital expenditures for, and the permitting and construction of, utility infrastructure that Idaho Power may be unable to complete or may not be deemed prudent by regulators for cost recovery; (i) variable hydrological conditions and over-appropriation of surface and groundwater in the Snake River Basin, which may impact the amount of power generated by Idaho Power's hydropower facilities; (j) the ability of Idaho Power to acquire fuel, power, electrical equipment, and transmission capacity on reasonable terms, particularly in the event of unanticipated power demands, price volatility, lack of physical availability, transportation constraints, disruptions or delays in the supply chain, or a credit downgrade; (k) disruptions or outages of Idaho Power's generation or transmission systems or of any interconnected transmission systems which can result in liability for Idaho Power, increase power costs, and reduce revenues; (l) accidents, terrorist acts, fires (either affecting or caused by Idaho Power facilities or infrastructure), explosions, mechanical breakdowns, and other unplanned events that may occur while operating and maintaining assets, which can cause unplanned outages, reduce generating output, damage company assets, operations, or reputation, subject Idaho Power to third-party claims for property damage, personal injury, or loss of life, or result in the imposition of civil, criminal, and regulatory fines and penalties for which Idaho Power may have inadequate insurance coverage; (m) the increased purchased power costs and operational challenges associated with purchasing and integrating intermittent renewable energy sources into Idaho Power's resource portfolio; (n) failure to comply with state and federal laws, regulations, and orders, including new interpretations and enforcement initiatives by regulatory and oversight bodies, which may result in penalties and fines and increase the cost of compliance, and the cost of remediation; (o) changes in tax laws or related regulations or new interpretations of applicable laws by federal, state, or local taxing jurisdictions, and the availability of tax credits, and the tax rates payable by IDACORP shareholders on common stock dividends; (p) adoption of, changes in, and costs of compliance with laws, regulations, and policies relating to the environment, natural resources, and threatened and endangered species, and the ability to recover associated increased costs through rates; (q) the inability to obtain or cost of obtaining and complying with required governmental permits and approvals, licenses, rights-of-way, and siting for transmission and generation projects and hydropower facilities; (r) failure to comply with mandatory reliability and security requirements, which may result in penalties, reputational harm, and operational changes; (s) the impacts of economic conditions, including inflation, interest rates, supply costs, population growth or decline in Idaho Power's service area, changes in customer demand for electricity, revenue from sales of excess power, credit quality of counterparties and suppliers, and the collection of receivables; (t) the ability to obtain debt and equity financing or refinance existing debt when necessary and on favorable terms, which can be affected by factors such as credit ratings, volatility or disruptions in the financial markets, interest rate fluctuations, decisions by the Idaho or Oregon public utility commissions, and the companies' past or projected financial performance; (u) changes in the method for determining LIBOR and the potential replacement of LIBOR and the impact on interest rates for IDACORP's and Idaho Power's credit facilities; (v) the ability to enter into financial and physical commodity hedges with creditworthy counterparties to manage price and commodity risk for fuel, power, and transmission, and the failure of any such risk management and hedging strategies to work as intended; (w) changes in actuarial assumptions, changes in interest rates, increasing healthcare costs, and the actual and projected return on plan assets for pension and other post-retirement plans, which can affect future pension and other postretirement plan funding obligations, costs, and liabilities and the companies' cash flows; (x) the assumptions underlying the coal mine reclamation obligations at Bridger Coal Company and related funding and bonding requirements, and the remediation costs associated with planned exits from participation in Idaho Power's co-owned coal plants; (y) the ability to continue to pay dividends and achieve target-payout ratios based on financial performance and in light of credit rating considerations, contractual covenants and restrictions, and regulatory limitations; (z) Idaho Power's concentration in one industry and one region and the lack of diversification, and the resulting exposure to regional economic conditions and regional legislation and regulation; (aa) employee workforce factors, including the operational and financial costs of unionization or the attempt to unionize all or part of the companies' workforce, the impact of an aging workforce and retirements, the cost and ability to attract and retain skilled workers and third-party vendors, and the ability to adjust the labor cost structure when necessary; and (bb) adoption of or changes in accounting policies and principles, changes in accounting estimates, and new U.S. Securities and Exchange Commission or New York Stock Exchange requirements, or new interpretations of existing requirements. Any forward-looking statement speaks only as of the date on which such statement is made. New factors emerge from time to time and it is not possible for management to predict all such factors, nor can it assess the impact of any such factor on the business or the extent to which any factor, or combination of factors, may cause results to differ materially from those contained in any forward-looking statement. Readers should also review the risks and uncertainties listed in IDACORP, Inc.'s and Idaho Power Company's most recent Annual Report on Form 10-K and other reports the companies file with the U.S. Securities and Exchange Commission, including (but not limited to) Part I, Item 1A - “Risk Factors” in the Form 10-K and Management's Discussion and Analysis of Financial Condition and Results of Operations and the risks described therein from time to time. IDACORP and Idaho Power disclaim any obligation to update publicly any forward-looking information, whether in response to new information, future events, or otherwise, except as required by applicable law.


Contacts

Investor and Analyst Contact

Justin S. Forsberg
Director of Investor Relations & Treasury
Phone: (208) 388-2728
This email address is being protected from spambots. You need JavaScript enabled to view it.

Media Contact

Sven Berg
Corporate Communications
Phone: (208) 388-2905
This email address is being protected from spambots. You need JavaScript enabled to view it.

HOUSTON--(BUSINESS WIRE)--DXP Enterprises, Inc. (NASDAQ:DXPE), a leading products and service distributor that adds value and total cost savings solutions to MRO and OEM customers in virtually every industry, plans to issue a press release announcing its financial results for the first quarter ended March 31, 2021, on Friday, May 7th. The announcement will be released before the market opens. DXP will host a conference call, to be web cast live, on the Company’s website (www.dxpe.com) at 10:30 A.M. Central Time on that same day.


The call and an accompanying slide presentation will be on the "Investor Relations" section of DXP's website at www.dxpe.com. A replay of the webcast will be available shortly after the conclusion of the presentation.

DXP's earnings press release, the slides and other related presentation materials will be posted to the "Investor Relations" section of DXP's website under the subheading "Financial Information" after the market closes on the date prior to the earnings call and will remain available following the call.

Web participants are encouraged to go to the Company’s website (www.dxpe.com) at least 15 minutes prior to the start of the call to register, download and install any necessary audio software.

The Private Securities Litigation Reform Act of 1995 provides a “safe-harbor” for forward-looking statements. Certain information included in this press release (as well as information included in oral statements or other written statements made by or to be made by the Company) contains statements that are forward-looking. Such forward-looking information involves important risks and uncertainties that could significantly affect anticipated results in the future; and accordingly, such results may differ from those expressed in any forward-looking statement made by or on behalf of the Company. These risks and uncertainties include, but are not limited to; ability to obtain needed capital, dependence on existing management, leverage and debt service, domestic or global economic conditions, and changes in customer preferences and attitudes. For more information, review the Company's filings with the Securities and Exchange Commission.


Contacts

DXP Enterprises, Inc.
Kent Yee, 713-996-4700
Senior Vice President, CFO
www.dxpe.com

HAMILTON, Bermuda--(BUSINESS WIRE)--April 29, 2021 – Triton International Limited (NYSE: TRTN) ("Triton")


Highlights:

  • Net income attributable to common shareholders for the three months ended March 31, 2021 was $129.3 million or $1.92 per diluted share.
  • Adjusted net income was $128.7 million or $1.91 per diluted share, an increase of 105.4% from the first quarter of 2020 and 12.4% from the fourth quarter of 2020.
  • Trade volumes and container demand were exceptionally strong in the first quarter. Utilization increased 0.4% during the quarter to reach 99.3% as of March 31, 2021. Utilization was 99.4% as of April 23, 2021.
  • As of April 23, 2021, Triton has purchased $2.6 billion of new containers for delivery in 2021, most of which have already been committed to high value, long duration leases.
  • Triton’s corporate credit rating was upgraded to BBB- by S&P Global Ratings on March 30, 2021.
  • Triton completed an inaugural $600 million 2.05% senior secured investment grade bond offering on April 15, 2021.
  • Triton’s Board of Directors announced a quarterly dividend of $0.57 per common share payable on June 24, 2021 to shareholders of record as of June 10, 2021.

Financial Results

The following table summarizes Triton’s selected key financial information for the three months ended March 31, 2021, December 31, 2020, and March 31, 2020.


(in millions, except per share data)


Three Months Ended,


March 31, 2021


December 31, 2020


March 31, 2020

Total leasing revenues

$346.7


$337.3


$321.5


GAAP


Net income attributable to common shareholders

$129.3


$115.2


$67.2


Net income per share - Diluted

$1.92


$1.70


$0.94


Non-GAAP (1)


Adjusted net income

$128.7


$114.7


$67.1


Adjusted net income per share - Diluted

$1.91


$1.70


$0.93


Return on equity (2)

25.0

%


22.9

%


13.1

%


(1)

Refer to the "Use of Non-GAAP Financial Items" and "Non-GAAP Reconciliations of Adjusted Net Income" set forth below.

(2)

Refer to the “Calculation of Return on Equity” set forth below.

Operating Performance

"Triton achieved outstanding results in the first quarter of 2021," commented Brian M. Sondey, Chief Executive Officer of Triton. "We generated $1.91 of Adjusted earnings per share in the first quarter, an increase of more than 100% from the first quarter of 2020 and an increase of 12.4% from the fourth quarter of 2020. We also achieved an annualized Return on equity of 25.0%."

"Triton continues to benefit from very favorable market conditions. Trade volumes remain strong due to a shift in consumer spending from services and experiences to goods, and demand for containers has been boosted further by a variety of logistical challenges that have slowed the global movement of containers. Our utilization increased to 99.3% as of March 31, 2021 and currently stands at 99.4%. The strong demand for containers has also led to high new container prices and market lease rates. Container factories are currently quoting over $3,500 for a new 20’ dry container, and market lease rates for new containers are significantly higher than the average lease rates in our lease portfolio. Our average selling price for used dry containers jumped further in the first quarter, leading to an increase in our disposal gains from the fourth quarter of 2020 despite a significant decrease in disposal volumes."

"Triton is investing heavily in new containers to help our customers manage the strong increase in trade volumes. Our customers generally did not anticipate the rapid growth in trade that began in the second half of 2020, and all major shipping lines have needed to add significant numbers of containers. Shipping lines have been primarily relying on the leasing market to fulfill their container requirements, and Triton has secured a meaningful share of leasing transactions due to our industry-leading supply capability and our strong reputation for reliability. Triton has purchased approximately $2.6 billion of containers for delivery in 2021, with $0.7 billion accepted in the first quarter, and we have already pre-committed most of our purchased containers to high-value, long-duration leases. We estimate that our existing orders would translate to asset growth of close to 20% for Triton in 2021."

"Triton is highly focused on locking-in durable improvements to our business, profitability and cash flow. The average lease duration for our 2021 new dry container lease commitments is over 12 years, and we estimate that approximately 75% of the used containers we have supplied since last July have been leased on life-cycle leases, which keep the containers on-hire until our typical disposal age. The large block of attractively priced new leases and improved off-hire protections for our used containers will provide a strong foundation to our profitability and cash flow for years to come."

"Our balance sheet remains in great shape. Our leverage remains well below our typical historical range, and our profitability supports our high current growth rate with little impact on our leverage. In March 2021, our corporate credit rating was upgraded to BBB- by S&P, reflecting our strong market and financial position. In the first quarter, we issued $1.2 billion of ABS notes and in April 2021, we successfully completed an inaugural issuance of $600 million investment grade senior secured notes. These successful transactions, which further reduce our overall average borrowing costs, provide an attractive source of financing to support our customers and will contribute to the strong return on our 2021 container investment."

Outlook

Mr. Sondey continued, "Looking ahead, we have significant operational and financial momentum, and we expect to achieve outstanding profitability throughout 2021. Trade volumes remain strong, our container fleet is close to maximum utilization, and we have approximately 500,000 TEU of new containers pre-booked for pick-up in the second and third quarters. We anticipate some normalization of consumer spending patterns as COVID vaccination rates grow, but economists are generally projecting a strong bounce to global GDP in the second half of 2021, and we typically experience peak dry container demand in the third quarter as retailers stock up for the holiday season. We expect our Adjusted net income per share to hold fairly steady from the first to the second quarter of 2021. We expect our leasing margin will increase substantially due to a high volume of new container pick-ups, though we expect this to be mostly offset by lower disposal gains due to a very low volume of container off-hires and disposals. Overall, we expect our profitability, Return on equity and cash flow to remain at very high levels."

Dividends

Triton’s Board of Directors has approved and declared a $0.57 per share quarterly cash dividend on its issued and outstanding common shares, payable on June 24, 2021 to shareholders of record at the close of business on June 10, 2021.

The Company’s Board of Directors also approved and declared a cash dividend payable on June 15, 2021 to holders of record at the close of business on June 8, 2021 on its issued and outstanding preferred shares as follows:

Preferred Share Series


Dividend Rate


Dividend Per Share

Series A Preferred Shares (NYSE:TRTNPRA)


8.500%


$0.5312500

Series B Preferred Shares (NYSE:TRTNPRB)


8.000%


$0.5000000

Series C Preferred Shares (NYSE:TRTNPRC)


7.375%


$0.4609375

Series D Preferred Shares (NYSE:TRTNPRD)


6.875%


$0.4296875

Share Repurchase Program Update

Triton has repurchased over 13.9 million common shares since the inception of the program in August 2018. There were no share repurchases during the first quarter of 2021 and as of March 31, 2021, the Company had a total of $102.1 million remaining under the current authorization.

Investors’ Webcast

Triton will hold a Webcast at 8:30 a.m. (New York time) on Thursday, April 29, 2021 to discuss its first quarter results. To listen by phone, please dial 1-877-418-5277 (domestic) or 1-412-717-9592 (international) approximately 15 minutes prior to the start time and reference the Triton International Limited conference call. To access the live Webcast please visit Triton’s website at http://www.trtn.com. An archive of the Webcast will be available one hour after the live call.

About Triton International Limited

Triton International Limited is the world’s largest lessor of intermodal freight containers. With a container fleet of 6.5 million twenty-foot equivalent units ("TEU"), Triton’s global operations include acquisition, leasing, re-leasing and subsequent sale of multiple types of intermodal containers and chassis.

Utilization, Fleet, and Leasing Revenue Information

The following table summarizes the equipment fleet utilization for the periods indicated:


Quarter Ended


March 31, 2021


December 31, 2020


September 30, 2020


June 30, 2020


March 31, 2020

Average Utilization (1)

99.1

%


98.1

%


96.1

%


95.0

%


95.4

%

Ending Utilization (1)

99.3

%


98.9

%


97.4

%


94.8

%


95.3

%

(1)

Utilization is computed by dividing total units on lease (in CEU) by the total units in our fleet (in CEU), excluding new units not yet leased and off-hire units designated for sale.

The following table summarizes the equipment fleet as of March 31, 2021, December 31, 2020 and March 31, 2020 (in units, TEUs and CEUs):


Equipment Fleet in Units


Equipment Fleet in TEU


March 31, 2021


December 31, 2020


March 31, 2020


March 31, 2021


December 31, 2020


March 31, 2020

Dry

3,417,293


3,295,908


3,239,306


5,711,032


5,466,421


5,324,756


Refrigerated

232,550


227,519


225,026


450,087


439,956


434,263


Special

94,266


93,885


93,743


171,781


170,792


170,225


Tank

11,339


11,312


12,469


11,339


11,312


12,469


Chassis

24,078


24,781


24,319


43,858


45,188


44,828


Equipment leasing fleet

3,779,526


3,653,405


3,594,863


6,388,097


6,133,669


5,986,541


Equipment trading fleet

60,242


64,243


17,549


93,514


98,991


26,185


Total

3,839,768


3,717,648


3,612,412


6,481,611


6,232,660


6,012,726


Equipment in CEU(1)


March 31, 2021


December 31, 2020


March 31, 2020

Operating leases

6,892,129


6,649,350


6,474,701


Finance leases

297,168


295,784


338,242


Equipment trading fleet

92,570


98,420


35,632


Total

7,281,867


7,043,554


6,848,575


(1)

In the equipment fleet tables above, we have included total fleet count information based on CEU. CEU is a ratio used to convert the actual number of containers in our fleet to a figure based on the relative purchase prices of our various equipment types to that of a 20-foot dry container. For example, the CEU ratio for a 40-foot high cube dry container is 1.70, and a 40-foot high cube refrigerated container is 7.50. These factors may differ slightly from CEU ratios used by others in the industry.

The following table summarizes our leasing revenue for the periods indicated (in thousands):


Three Months Ended,


March 31, 2021


December 31, 2020


March 31, 2020

Operating leases


Per diem revenues

$

331,252


$

319,679


$

298,486


Fee and ancillary revenues

8,542


10,439


14,318


Total operating lease revenues

339,794


330,118


312,804


Finance leases

6,949


7,167


8,664


Total leasing revenues

$

346,743


$

337,285


$

321,468


Important Cautionary Information Regarding Forward-Looking Statements

Certain statements in this release, other than purely historical information, are "forward-looking statements" within the meaning of the Private Securities Litigation Reform Act of 1995, Section 27A of the Securities Act of 1933, as amended, and Section 21E of the Securities Exchange Act of 1934, as amended. Statements that include the words "expect," "intend," "plan," "believe," "project," "anticipate," "will," "may," "would" and similar statements of a future or forward-looking nature may be used to identify forward-looking statements. All forward-looking statements address matters that involve risks and uncertainties, many of which are beyond Triton’s control. Accordingly, there are or will be important factors that could cause actual results to differ materially from those indicated in such statements and, therefore, you should not place undue reliance on any such statements.

These factors include, without limitation, economic, business, competitive, market and regulatory conditions and the following: the impact of COVID-19 on our business and financial results; decreases in the demand for leased containers; decreases in market leasing rates for containers; difficulties in re-leasing containers after their initial fixed-term leases; our customers’ decisions to buy rather than lease containers; our dependence on a limited number of customers and suppliers; customer defaults; decreases in the selling prices of used containers; extensive competition in the container leasing industry; difficulties stemming from the international nature of our business; decreases in demand for international trade; disruption to our operations resulting from the political and economic policies of the United States and other countries, particularly China, including but not limited to, the impact of trade wars, duties and tariffs; disruption to our operations from failures of, or attacks on, our information technology systems; disruption to our operations as a result of natural disasters; compliance with laws and regulations related to economic and trade sanctions, security, anti-terrorism, environmental protection and corruption; our ability to obtain sufficient capital to support our growth; restrictions imposed by the terms of our debt agreements; changes in tax laws in, Bermuda, the United States and other countries and other risks and uncertainties, including those risk factors set forth in the section entitled "Risk Factors" in our Form 10-K filed with the Securities and Exchange Commission ("SEC"), on February 16, 2021, in any Form 10-Q filed or to be filed by Triton, and in other documents we file with the SEC from time to time.

The foregoing list of important factors should not be construed as exhaustive and should be read in conjunction with the other cautionary statements that are included herein and elsewhere. Any forward-looking statements made herein are qualified in their entirety by these cautionary statements, and there can be no assurance that the actual results or developments anticipated by us will be realized or, even if substantially realized, that they will have the expected consequences to, or effects on Triton or its business or operations. Except to the extent required by applicable law, we undertake no obligation to update publicly or revise any forward-looking statement, whether as a result of new information, future developments or otherwise.

-Financial Tables Follow-

TRITON INTERNATIONAL LIMITED

Consolidated Balance Sheets

(In thousands, except share data)

(Unaudited)


March 31, 2021


December 31, 2020

ASSETS:


Leasing equipment, net of accumulated depreciation of $3,497,805 and $3,370,652

$

9,198,780


$

8,630,696


Net investment in finance leases

271,347


282,131


Equipment held for sale

57,568


67,311


Revenue earning assets

9,527,695


8,980,138


Cash and cash equivalents

233,064


61,512


Restricted cash

153,272


90,484


Accounts receivable, net of allowances of $1,275 and $2,192

234,682


226,090


Goodwill

236,665


236,665


Lease intangibles, net of accumulated amortization of $269,355 and $264,791

29,102


33,666


Other assets

68,919


83,969


Fair value of derivative instruments

7,578


9


Total assets

$

10,490,977


$

9,712,533


LIABILITIES AND SHAREHOLDERS’ EQUITY:


Equipment purchases payable

$

342,357


$

191,777


Fair value of derivative instruments

68,545


128,872


Accounts payable and other accrued expenses

96,989


95,235


Net deferred income tax liability

342,071


327,431


Debt, net of unamortized costs of $53,446 and $42,747

6,916,697


6,403,270


Total liabilities

7,766,659


7,146,585


Shareholders’ equity:


Preferred shares, $0.01 par value, at liquidation preference

555,000


555,000


Common shares, $0.01 par value, 270,000,000 shares authorized, 81,273,334 and 81,151,723 shares issued, respectively

813


812


Undesignated shares, $0.01 par value, 7,800,000 and 7,800,000 shares authorized, respectively, no shares issued and outstanding


Treasury shares, at cost, 13,901,326 and 13,901,326 shares, respectively

(436,822

)


(436,822

)

Additional paid-in capital

902,891


905,323


Accumulated earnings

1,765,498


1,674,670


Accumulated other comprehensive income (loss)

(63,062

)


(133,035

)

Total shareholders’ equity

2,724,318


2,565,948


Total liabilities and shareholders’ equity

$

10,490,977


$

9,712,533


TRITON INTERNATIONAL LIMITED

Consolidated Statements of Operations

(In thousands, except per share amounts)

(Unaudited)


Three Months Ended March 31,


March 31, 2021


March 31, 2020

Leasing revenues:


Operating leases

$

339,794


$

312,804


Finance leases

6,949


8,664


Total leasing revenues

346,743


321,468


Equipment trading revenues

25,945


15,380


Equipment trading expenses

(17,804

)


(13,447

)

Trading margin

8,141


1,933


Net gain on sale of leasing equipment

21,967


4,077


Operating expenses:


Depreciation and amortization

143,307


132,695


Direct operating expenses

9,370


23,248


Administrative expenses

20,921


19,225


Provision (reversal) for doubtful accounts

(2,464

)


4,279


Total operating expenses

171,134


179,447


Operating income (loss)

205,717


148,031


Other expenses:


Interest and debt expense

54,623


69,002


Debt termination expense


31


Other (income) expense, net

(481

)


(3,584

)

Total other expenses

54,142


65,449


Income (loss) before income taxes

151,575


82,582


Income tax expense (benefit)

11,737


5,546


Net income (loss)

$

139,838


$

77,036


Less: dividend on preferred shares

10,513


9,825


Net income (loss) attributable to common shareholders

$

129,325


$

67,211


Net income per common share—Basic

$

1.93


$

0.94


Net income per common share—Diluted

$

1.92


$

0.94


Cash dividends paid per common share

$

0.57


$

0.52


Weighted average number of common shares outstanding—Basic

66,935


71,596


Dilutive restricted shares

282


202


Weighted average number of common shares outstanding—Diluted

67,217


71,798


TRITON INTERNATIONAL LIMITED

Consolidated Statements of Cash Flows

(In thousands)

(Unaudited)


Three Months Ended March 31,


March 31, 2021


March 31, 2020

Cash flows from operating activities:


Net income (loss)

$

139,838


$

77,036


Adjustments to reconcile net income (loss) to net cash provided by operating activities:


Depreciation and amortization

143,307


132,695


Amortization of deferred debt cost and other debt related amortization

1,142


3,595


Lease related amortization

4,857


7,054


Share-based compensation expense

1,715


1,605


Net (gain) loss on sale of leasing equipment

(21,967

)


(4,077

)

Unrealized (gain) loss on derivative instruments


297


Debt termination expense


31


Deferred income taxes

11,615


5,505


Changes in operating assets and liabilities:


Accounts receivable

(10,828

)


(3,775

)

Accounts payable and other accrued expenses

1,886


(15,111

)

Net equipment sold (purchased) for resale activity

1,579


1,435


Cash received (paid) for settlement of interest rate swaps

5,558


Cash collections on finance lease receivables, net of income earned

12,866


15,466


Other assets

9,420


(23,796

)

Net cash provided by (used in) operating activities

300,988


197,960


Cash flows from investing activities:


Purchases of leasing equipment and investments in finance leases

(579,211

)


(62,406

)

Proceeds from sale of equipment, net of selling costs

53,512


49,498


Other

15


(216

)

Net cash provided by (used in) investing activities

(525,684

)


(13,124

)

Cash flows from financing activities:


Issuance of preferred shares, net of underwriting discount


145,275


Purchases of treasury shares


(34,357

)

Redemption of common shares for withholding taxes

(4,146

)


(2,156

)

Debt issuance costs

(13,803

)


Borrowings under debt facilities

1,504,850


530,000


Payments under debt facilities and finance lease obligations

(979,199

)


(425,073

)

Dividends paid on preferred shares

(10,513

)


(9,395

)

Dividends paid on common shares

(38,153

)


(37,110

)

Other


(410

)

Net cash provided by (used in) financing activities

459,036


166,774


Net increase (decrease) in cash, cash equivalents and restricted cash

$

234,340


$

351,610


Cash, cash equivalents and restricted cash, beginning of period

151,996


168,972


Cash, cash equivalents and restricted cash, end of period

$

386,336


$

520,582


Supplemental disclosures:


Interest paid

$

42,133


$

53,795


Income taxes paid (refunded)

$

155


$

139


Right-of-use asset for leased property

$


$


Supplemental non-cash investing activities:


Equipment purchases payable

$

342,357


$

29,109


Use of Non-GAAP Financial Items

We use the terms "Adjusted net income" and Return on equity throughout this press release.

Adjusted net income and Return on equity are not items presented in accordance with U.S. GAAP and should not be considered as alternatives to, or more meaningful than, amounts determined in accordance with U.S. GAAP, including net income.

Adjusted net income is adjusted for certain items management believes are not representative of our operating performance. Adjusted net income is defined as net income attributable to common shareholders excluding debt termination expenses net of tax, unrealized gains and losses on derivative instruments net of tax, and foreign and other income tax adjustments.

We believe that Adjusted net income is useful to an investor in evaluating our operating performance because this item:

  • is widely used by securities analysts and investors to measure a company’s operating performance;
  • helps investors to more meaningfully evaluate and compare the results of our operations from period to period by removing the impact of our capital structure, our asset base and certain non-routine events which we do not expect to occur in the future; and
  • is used by our management for various purposes, including as measures of operating performance and liquidity, to assist in comparing performance from period to period on a consistent basis, in presentations to our board of directors concerning our financial performance and as a basis for strategic planning and forecasting.

We have provided a reconciliation of net income attributable to common shareholders, the most directly comparable U.S. GAAP measure, to Adjusted net income in the table below for the three months ended March 31, 2021, December 31, 2020, and March 31, 2020.

Additionally, the calculation for return on equity is adjusted annualized earnings divided by average shareholders’ equity. Management utilizes return on equity in evaluating how much profit the Company generates on the shareholders’ equity in the Company and believes it is useful for comparing the profitability of companies in the same industry.

TRITON INTERNATIONAL LIMITED

Non-GAAP Reconciliations of Adjusted Net Income

(In thousands, except per share amounts)


Three Months Ended,


March 31, 2021


December 31, 2020


March 31, 2020

Net income attributable to common shareholders

$

129,325


$

115,185


$

67,211


Add (subtract):


Unrealized loss (gain) on derivative instruments, net


270


Debt termination expense


358


24


State and other income tax adjustments


(866

)


Tax benefit from vesting of restricted shares

(643

)


(390

)

Adjusted net income

$

128,682


$

114,677


$

67,115


Adjusted net income per common share—Diluted

$

1.91


$

1.70


$

0.93


Weighted average number of common shares outstanding—Diluted

67,217


67,571


71,798


Contacts

Andrew Greenberg
Senior Vice President
Business Development & Investor Relations
(914) 697-2900


Read full story here

DAR ES SALAAM, Tanzania--(BUSINESS WIRE)--Recently, the second set of 1500hp geothermal drilling rig independently developed and manufactured by Shandong Kerui Petroleum & Gas Equipment Co., Ltd. was successfully delivered to Aruto Langano geothermal power station in central Ethiopia. As the first 50D mating drilling rig and first geothermal energy development project of Ethiopia Electric Power (as “EEP”), it is the largest investment in geothermal energy sector, and also a national project with great strategic significance supported by World Bank.

In this project, Kerui Petroleum & Gas provides two sets of 1500hp geothermal drilling rigs, drilling services, personnel training and related technology transfer and other one-stop comprehensive solutions to Ethiopia Electric Power company for the exploitation of 22 geothermal wells in Aluto Langano. The two sets of geothermal drilling rig delivered by this company are independently developed by itself. It has the advantages of automation and integration. It can meet the drilling requirements of petroleum, natural gas and geothermal resources, and adapt to the technological requirements of mud drilling, air drilling and foam drilling, and is equipped with logging, cementing, orientation, gas testing and other equipment.

Facing the severe epidemic situation in the world, Shandong Kerui Petroleum & Gas Equipment Co., Ltd. has successfully completed the commissioning and lifting of two sets of drilling equipment currently, and will officially start drilling soon.

Kerui Petroleum & Gas is an international comprehensive industrial group providing high-end oil equipment, oil and gas field technical services and EPC engineering services to the global oil and gas industry. At present, Kerui's marketing and service network has covered 57 countries and regions in the world, providing quality services and practical products for more than 8000 customers in more than 80 countries and regions.


Contacts

Jason Guo
Sales Director - Kenya/Tanzania
Tel: +254-79-957-4005 Kenya
+255-76-650-6239 Tanzania
SHANDONG KERUI PETROLEUM & GAS EQUIPMENT CO.,LTD

  • CenterPoint to receive $2.150 billion in cash, including recovery of approximately $425 million in cash of unrecovered storm-related incremental natural gas costs incurred in February 2021
  • Transaction represents a landmark valuation at 38.0x 2020 earnings and 2.5x 2020 year-end rate base
  • Sale proceeds will allow CenterPoint to recycle capital to fund its industry-leading 10% planned compound annual rate base growth
  • Sale will not impact company’s targeted 6% - 8% annual utility non-GAAP EPS growth rate
  • Sale demonstrates significantly higher market value for natural gas infrastructure assets, including CenterPoint’s remaining gas businesses

HOUSTON--(BUSINESS WIRE)--CenterPoint Energy, Inc. (NYSE: CNP) (“CenterPoint”) today announced the sale of its Arkansas and Oklahoma natural gas LDC assets to Summit Utilities for $2.150 billion in cash, including recovery of approximately $425 million in cash of unrecovered storm-related incremental natural gas costs incurred in February 2021, subject to true-up at transaction close. The assets include approximately 17,000 miles of main pipeline in Arkansas, Oklahoma, and Texarkana serving more than half a million customers residing in high-quality regulatory jurisdictions.


The proceeds of $1.725 billion in cash, after recovery of approximately $425 million in cash unrecovered storm costs, represents a 2.5x multiple of 2020 rate base and a 38.0x multiple of 2020 earnings. The transaction is anticipated to close by the end of 2021, subject to customary closing conditions, including Hart-Scott Rodino antitrust clearance and state regulatory approvals.

CenterPoint President and CEO Dave Lesar said, “I could not be more excited to share this announcement today. Summit Utilities is a seasoned operator of utility assets in the region and the ideal company to acquire these assets. We are excited that Summit has existing businesses in Arkansas and Oklahoma, which will facilitate the transition process for our employees and customers. Summit has an industry track record of being a high-quality operator and we are confident they will continue to provide safe, reliable, and low-cost natural gas service to our customers in Arkansas and Oklahoma.”

Lesar added, “This transaction reflects the hard work and determination of everyone on the CenterPoint team. This valuation represents a landmark multiple for the LDC space and is a clear testament of the premium utility assets in these two jurisdictions. These assets are a proven integral part of the energy supplies in the states in which they operate. The solid customer demand for reliable and efficient distribution of natural gas was only solidified by the recent winter storm events. We believe the price paid for these assets demonstrates that the market is significantly undervaluing the remainder of our natural gas businesses.”

The announcement demonstrates not only our ability to efficiently recycle capital across our utility footprint, but also our ability to execute on our commitments to our shareholders. As outlined in our December 2020 Investor Day, our commitments include delivering annualized utility earnings per share growth of 6% - 8% and growing our rate base at a 10% compound annual growth rate. The ability to efficiently redeploy this capital and the eventual exit of the midstream investments will have no impact on our targeted 6% - 8% annualized earnings per share growth rate. Further, we will also be eliminating the Oklahoma and Arkansas storm-related incremental natural gas cost from our balance sheet,” said Lesar.

We look forward to announcing our first quarter of 2021 financial results during our earnings call on May 6,” he said.

J.P. Morgan Securities LLC. and RBC Capital Markets, LLC. served as CenterPoint Energy’s financial advisors. Baker Botts L.L.P. served as CenterPoint Energy’s legal advisors.

About CenterPoint Energy, Inc.

As the only investor-owned electric and gas utility based in Texas, CenterPoint Energy, Inc. (NYSE: CNP) is an energy delivery company with electric transmission and distribution, power generation and natural gas distribution operations that serve more than 7 million metered customers in Arkansas, Indiana, Louisiana, Minnesota, Mississippi, Ohio, Oklahoma and Texas. As of December 31, 2020, the company owned approximately $33 billion in assets and also owned 53.7 percent of the common units representing limited partner interests in Enable Midstream Partners, LP, a publicly traded master limited partnership that owns, operates and develops strategically located natural gas and crude oil infrastructure assets. With approximately 9,500 employees, CenterPoint Energy and its predecessor companies have been in business for more than 150 years. For more information, visit CenterPointEnergy.com.

About Summit Utilities, Inc.

Summit Utilities, Inc. (Summit) owns natural gas distribution and transmission subsidiaries that operate in Arkansas, Colorado, Maine, Missouri, and Oklahoma. The company provides safe, clean and affordable natural gas to businesses and residents in five states through Colorado Natural Gas, Inc., Summit Natural Gas of Missouri, Inc., Summit Natural Gas of Maine, Inc. and Arkansas Oklahoma Gas Corporation. Each of Summit’s subsidiaries constructs and installs natural gas distribution systems with the goal of supporting economic development by providing clean-burning, safe and reliable natural gas to residential and commercial customers through exceptional customer service and commitment to community. Overall, Summit entities serve approximately 100,000 customers and operate more than 5,400 miles of pipeline in Arkansas, Colorado, Maine, Missouri and Oklahoma.

Use of Non-GAAP Measures

As included in this press release, our utility growth target of 6-8% is based on a non-GAAP utility earnings per share (“Utility EPS”), which is not a generally accepted accounting principles (“GAAP”) financial measure. This non-GAAP EPS based utility growth rate has been previously referenced by the CenterPoint Energy as the guidance-based growth rate. Generally, a non-GAAP financial measure is a numerical measure of a company’s historical or future financial performance that excludes or includes amounts that are not normally excluded or included in the most directly comparable GAAP financial measure. The Utility EPS reflects dilution and earnings as if the Company’s Series B Preferred Stock converted on their mandatory conversion date. Utility EPS considers assumptions for certain significant variables that may impact earnings, such as customer growth and usage including normal weather, throughput, recovery of capital invested, effective tax rates, financing activities and related interest rates, regulatory and judicial proceedings. In addition, the Utility EPS assumes a continued re-opening of the economy in CenterPoint Energy’s service territories throughout 2021. To the extent actual results deviate from these assumptions, the Utility EPS may not be met and our projected annual Utility EPS growth rate range may change. Utility EPS includes an allocation of corporate overhead based upon our Utility segments relative earnings contribution. Corporate overhead consists primarily of interest expense, preferred stock dividend requirements and other items directly attributable to the parent along with associated income taxes, and considers certain significant variables that may impact earnings. Utility EPS excludes (a) earnings or losses from the change in value of the Company’s 2.0% Zero-Premium Exchangeable Subordinated Notes due 2029 (“ZENS”) and related securities, (b) certain expenses associated with merger integration, and (c) Midstream Investments, including income from the Enable preferred units and a corresponding amount of debt in addition to an associated allocation of corporate overhead based on relative earnings contribution. Utility EPS also does not include other potential impacts, such as changes in accounting standards, impairments or unusual items, which could have a material impact on GAAP reported results for the applicable guidance period. CenterPoint Energy is unable to present a quantitative reconciliation of forward-looking Utility EPS because changes in the value of ZENS and related securities, future impairments and other unusual items are not estimable as they are highly variable and difficult to predict due to various factors outside of management’s control. Management evaluates CenterPoint Energy’s financial performance in part based on Utility EPS. Management believes that presenting this non-GAAP financial measure enhances an investor’s understanding of CenterPoint Energy’s overall financial performance by providing them with an additional meaningful and relevant comparison of current and anticipated future results across periods. The adjustments made in this non-GAAP financial measure exclude items that Management believes does not most accurately reflect the Company’s fundamental business performance. CenterPoint Energy’s Utility EPS non-GAAP financial measure should be considered as a supplement to, and not as a substitute for, or superior to, diluted earnings per share, which is the most directly comparable GAAP financial measure. This non-GAAP financial measure also may be different than non-GAAP financial measures used by other companies.

Forward-Looking Statements

The statements in this press release contain “forward-looking statements” within the meaning of Section 27A of the Securities Act of 1933 and Section 21E of the Securities Exchange Act of 1934. All statements other than statements of historical fact included in this press release are forward-looking statements made in good faith by us and are intended to qualify for the safe harbor from liability established by the Private Securities Litigation Reform Act of 1995. When used in this press release, the words “anticipate,” “believe,” “continue,” “could,” “estimate,” “expect,” “forecast,” “goal,” “intend,” “may,” “objective,” “plan,” “potential,” “predict,” “projection,” “should,” “target,” “will” or other similar words are intended to identify forward-looking statements. These forward-looking statements are based upon assumptions of management which are believed to be reasonable at the time made and are subject to significant risks and uncertainties. Actual events and results may differ materially from those expressed or implied by these forward-looking statements. Forward-looking statements include, but are not limited to, statements relating to the consideration CenterPoint Energy expects to receive, the timing of closing the transaction, long-term growth strategy and investment plan, capital deployment, rate base growth, and CenterPoint Energy’s guidance basis utility earnings per share and guidance basis utility earnings per share growth target. Each forward-looking statement contained in this press release speaks only as of the date of this release. Important factors that could cause actual results to differ materially from those indicated by the provided forward-looking information include risks and uncertainties relating to: (1) the timing of the expiration or termination of the Hart-Scott-Rodino waiting period and the receipt of any consents, waivers or approvals required to be obtained pursuant to applicable antitrust or regulatory laws, (2) the occurrence of any event, change or other circumstances that could give rise to the termination of the proposed transactions or could otherwise cause the failure of the proposed transactions to close, (3) the risk that a condition to the closing of the proposed transactions may not be satisfied, (4) the outcome of any legal proceedings, regulatory proceedings or enforcement matters that may be instituted relating to the proposed transactions, (5) the timing to consummate the proposed transactions, (6) disruption from the proposed transactions making it more difficult to maintain relationships with customers, employees, regulators or suppliers, (7) the diversion of management time and attention on the proposed transactions and (8) other factors discussed in CenterPoint Energy’s Annual Report on Form 10-K for the fiscal year ended December 31, 2020 and other reports CenterPoint Energy or its subsidiaries may file from time to time with the Securities and Exchange Commission (SEC).


Contacts

Media:
John Sousa

Phone: 713.659.2111

Investors:
Philip Holder
Jackie Richert

Phone: 713.207.6500

Offshore Source Logo

Offshore Source keeps you updated with relevant information concerning the Offshore Energy Sector.

Any views or opinions represented on this website belong solely to the author and do not represent those of the people, institutions or organizations that Offshore Source or collaborators may or may not have been associated with in a professional or personal capacity, unless explicitly stated.

Corporate Offices

Technology Systems Corporation
8502 SW Kansas Ave
Stuart, FL 34997

info@tscpublishing.com