Business Wire News

Closes Series A with Marc Benioff’s TIME Ventures, Microsoft Climate Innovation Fund and others

Benioff joins NCX Board of Directors

SAN FRANCISCO--(BUSINESS WIRE)--NCX, a venture-backed climate tech company, announced the creation of the largest forest carbon project (by acreage) in the continental United States. Previously known as SilviaTerra, NCX (Natural Capital Exchange) is a data-driven forest carbon marketplace sourcing high-quality forest carbon credits from American landowners of all sizes.


Microsoft, South Pole, and Shell Environmental Products1 are among the initial participating buyers purchasing carbon credits from NCX, upon listing in the Verra offset registry. Stretching across an area of 1.17 million acres, NCX’s first project included over 100 landowners across 10 states.

“NCX puts carbon on the same economic footing as timber,” said founder and CEO Zack Parisa. “We’ve combined satellite imagery, forest economics, and cutting-edge statistics to build a data-driven marketplace for landowners of all sizes. NCX identifies forested acres that are likely to be harvested and rewards landowners that keep them growing. It’s a solution that connects landowners with net-zero pioneers to create climate impact with unprecedented scale and transparency.”

“Demand for U.S. offsets is continuing to grow, particularly for nature-based solutions. NCX has found an innovative way to overcome the obstacles that have kept small landowners out of the offset market,” said South Pole’s Michael Malara, Senior Business Development & Account Manager, North America. “This solution will increase available offset projects in the U.S. and also make it possible over time for companies to support local offset projects, thus having an impact close to their operations.”

Investing In NCX’s Future

NCX recently raised $20 million in Series A financing led by TIME Ventures, the venture fund of Marc Benioff. Mr. Benioff will be joining the Board of Directors of NCX.

The Microsoft Climate Innovation Fund also invested, deepening NCX’s partnership with Microsoft. Previously, NCX worked with Microsoft AI for Earth to create the first-ever annually updated forest inventory of the United States, covering every acre of the U.S. and accounting for almost 92 billion trees. NCX’s seed investors, Union Square Ventures and Version One Ventures, also participated in the round.

Enrollment for the next NCX cycle is currently open and closes June 8, 2021. Interested landowners and carbon credit buyers should connect with an NCX representative to learn more.

1 Reference to Shell Environmental Products in this release refers to Shell Energy North America (US), L.P.

About NCX

NCX, previously known as SilviaTerra, is a trusted provider of high-quality forest carbon credits. Using an AI-powered forest Basemap, NCX connects American landowners with net-zero pioneers. Built on a decade of industry-leading precision forestry expertise, NCX takes a data-driven approach to democratizing forest carbon markets. Read more in our recent white paper.


Contacts

Media Contact:
Cheryl Sansonetti, Marketing Director
NCX
This email address is being protected from spambots. You need JavaScript enabled to view it.

Advent’s Materials Have Longer Lifetime and are Lower Cost Than Those of Ion Exchange Membranes

BOSTON--(BUSINESS WIRE)--Advent Technologies Holdings, Inc. (NASDAQ: ADN) (“Advent”) today reported that bookings and shipments of their materials for redox flow batteries (RFBs) in the first quarter of 2021 rose by 500 percent year-over-year. Advent’s materials apply to renewable energy storage and production, including the membrane electrode assemblies used in high temperature fuel cells.


Dr. Emory DeCastro, Advent Technologies Chief Technology Officer, commented: “Advent’s materials solve critical problems for flow batteries by making utility-scale energy storage devices cost effective. Our tremendous year-over-year increase not only represents the start of new supply agreements, but it is also our most significant contribution into commercial redox flow battery systems to date. The ability to provide increasing quantities of customer-specific components also reinforces our strategy of using Advent manufacturing processes at third party production facilities.”

Advent Materials for Redox Flow Batteries

Advent produces membranes and electrodes for flow battery chemistries that will enable long-term storage of excess power during off-peak periods, and it will address the asymmetry between the demand and supply of solar and wind-generated power. Advent’s membranes for RFBs offer a longer lifetime at a lower cost than typical ion exchange membranes.

Currently, with mass-production capabilities, Advent is developing low cost, high quality electrodes for the leading RFBs chemistries. New membranes from Advent’s participation in the Advanced Research Projects Agency–Energy (“ARPA-E”) program show great potential to lower costs and increase selectivity for the vanadium RFBs. These membranes demonstrate how Advent is able to engineer properties into critical materials for customers.

Benefits of Redox Flow Batteries

RFBs are considered a vital bridging technology for intermittent power generation from renewable sources such as wind and solar. They offer a viable alternative to Lithium-ion batteries (LIBs) for stationary energy storage, especially for extended operation. Since LIBs store all their energy in one package, this leads to some serious safety concerns – especially for the outbreak of highly combustive fires that need highly specialized equipment to contain. On the other hand, RFBs keep the energy in separate tanks that are easy to isolate in the case of a mishap.

RFBs can address a variety of markets that are not appropriate for LIBs. For example, in the case of RFBs, if more energy (kWh) is needed, bigger tanks can be built; and if more power (kW) is needed, a larger stack can be used without changing the tank size.

About Advent Technologies Holdings, Inc.

Advent Technologies Holdings, Inc. is a U.S. corporation that develops, manufactures, and assembles critical components for fuel cells and advanced energy systems in the renewable energy sector. Advent is headquartered in Boston, Massachusetts, with offices in the San Francisco Bay Area and Europe. With 120-plus patents (issued and pending) for its fuel cell technology, Advent holds the IP for next-gen high-temperature proton exchange membranes (HT-PEM) that enable various fuels to function at high temperatures under extreme conditions – offering a flexible ‘Any Fuel. Anywhere’ option for the automotive, maritime, aviation and power generation sectors. www.advent.energy

Cautionary Note Regarding Forward-Looking Statements

This press release includes forward-looking statements. These forward-looking statements generally can be identified by the use of words such as “anticipate,” “expect,” “plan,” “could,” “may,” “will,” “believe,” “estimate,” “forecast,” “goal,” “project,” and other words of similar meaning. These forward-looking statements address various matters including the Company’s plans and expectations with respect to Project White Dragon. Each forward-looking statement contained in this press release is subject to risks and uncertainties that could cause actual results to differ materially from those expressed or implied by such statement. Applicable risks and uncertainties include, among others, the Company’s ability to realize the benefits from the business combination; the Company’s ability to maintain the listing of the Company’s common stock on Nasdaq; future financial performance; public securities’ potential liquidity and trading; impact from the outcome of any known and unknown litigation; ability to forecast and maintain an adequate rate of revenue growth and appropriately plan its expenses; expectations regarding future expenditures; future mix of revenue and effect on gross margins; attraction and retention of qualified directors, officers, employees and key personnel; ability to compete effectively in a competitive industry; ability to protect and enhance our corporate reputation and brand; expectations concerning our relationships and actions with our technology partners and other third parties; impact from future regulatory, judicial and legislative changes to the industry; ability to locate and acquire complementary technologies or services and integrate those into the Company’s business; future arrangements with, or investments in, other entities or associations; and intense competition and competitive pressure from other companies worldwide in the industries in which the Company will operate; and the risks identified under the heading “Risk Factors” in our Annual Report on Form 10-K filed with the Securities and Exchange Commission on March 26, 2021, as well as the other information we file with the SEC. We caution investors not to place considerable reliance on the forward-looking statements contained in this press release. You are encouraged to read our filings with the SEC, available at www.sec.gov, for a discussion of these and other risks and uncertainties. The forward-looking statements in this press release speak only as of the date of this document, and we undertake no obligation to update or revise any of these statements. Our business is subject to substantial risks and uncertainties, including those referenced above. Investors, potential investors, and others should give careful consideration to these risks and uncertainties.


Contacts

Advent Technologies Holdings, Inc.
Elisabeth Maragoula
This email address is being protected from spambots. You need JavaScript enabled to view it.

Sloane & Company
Joe Germani / James Goldfarb
This email address is being protected from spambots. You need JavaScript enabled to view it. / This email address is being protected from spambots. You need JavaScript enabled to view it.

DAYTON, Ohio--(BUSINESS WIRE)--REX American Resources Corporation (NYSE: REX) (“REX” or “the Company”) today reported financial results for its fiscal 2021 first quarter (“Q1 ‘21”) ended April 30, 2021. REX management will host a conference call and webcast today at 11:00 a.m. ET.


Conference Call:

212/231-2911

Webcast / Replay URL:

www.rexamerican.com/Corp/Page4.aspx

The webcast will be available for replay for 30 days.

REX American Resources’ Q1 ‘21 results principally reflect its interests in six ethanol production facilities and its refined coal operation. The One Earth Energy, LLC (“One Earth”) and NuGen Energy, LLC (“NuGen”) ethanol production facilities are consolidated, as is the refined coal entity, while those of its four other ethanol plants are reported as equity in income of unconsolidated ethanol affiliates. The Company reports results for its two business segments as ethanol and by-products, and refined coal.

REX’s Q1 ‘21 net sales and revenue were $164.1 million, compared with $83.3 million in Q1 ‘20. The year-over-year net sales and revenue increase was primarily due to higher ethanol production levels as compared to the prior year levels, which were significantly impacted by the Covid-19 pandemic, as well as higher ethanol and dried distillers grains and modified distillers grains pricing. Primarily reflecting the revenue growth, offset in part by increased input corn pricing, Q1 ‘21 gross profit for the Company’s ethanol and by-products segment increased to $19.5 million, compared with a loss of $8.2 million in Q1 ‘20. As a result, the ethanol and by-products segment had income before income taxes of $11.1 million in Q1 ‘21, compared to a loss of $12.4 million in Q1 ‘20. The Company’s refined coal operation incurred a $1.7 million gross loss and a $1.8 million loss before income taxes in Q1 ‘21, compared to a $1.1 million gross loss and a loss before income taxes of $0.8 million in Q1 ‘20. REX reported Q1 ‘21 income before income taxes and non-controlling interests of $8.4 million, compared with a loss before income taxes and non-controlling interests of $13.7 million in the comparable year ago period. While the refined coal operation negatively impacted gross profit and income before income taxes, it contributed a tax benefit of $2.2 million and $1.0 million for Q1 ‘21 and Q1 ‘20, respectively.

Net income attributable to REX shareholders in Q1 ‘21 was $7.8 million, compared to a net loss of $7.6 million in Q1 ‘20. Q1 ‘21 basic and diluted net income per share attributable to REX common shareholders was $1.30, compared to a net loss per share of $1.21 in Q1 ‘20. Per share results in Q1 ‘21 and Q1 ‘20 are based on 6,010,000 and 6,304,000 diluted weighted average shares outstanding, respectively.

Segment Income Statement Data:


Three Months

Ended

($ in thousands)

April 30,


2021


2020


Net sales and revenue:


Ethanol & By-Products (1)

$

164,042


$

83,235


Refined coal (2) (3)


62


15


Total net sales and revenue

$

164,104


$

83,250


Gross profit (loss):


Ethanol & By-Products (1)

$

19,477


$

(8,223

)

Refined coal (2)


(1,675

)


(1,107

)

Total gross profit (loss)

$

17,802


$

(9,330

)


Income (loss) before income taxes:


Ethanol & By-Products (1)

$

11,082


$

(12,351

)

Refined coal (2)


(1,795

)


(847

)

Corporate and other


(860

)


(545

)

Total income (loss) before income taxes

$

8,427


$

(13,743

)

(Provision) benefit for income taxes:


Ethanol & By-Products

$

(2,436

)

$

4,161


Refined coal


2,195


959


Corporate and other


212


193


Total (provision) benefit for income taxes

$

(29

)

$

5,313


Net income (loss) attributable to REX common shareholders:


Ethanol & By-Products

$

7,952


$

(7,433

)

Refined coal


480


150


Corporate and other


(648

)


(352

)

Net income (loss) attributable to REX common shareholders

$

7,784


$

(7,635

)


(1)

Includes results attributable to non-controlling interests of approximately 24.5% for One Earth and approximately 1% for NuGen.


(2)

Includes results attributable to non-controlling interests of approximately 5%.


(3)

Refined coal sales are reported net of the cost of coal.

REX American Resources’ Chief Executive Officer, Zafar Rizvi, commented, “The operating environment in the first quarter of fiscal 2021 was markedly better than the challenging environment we experienced throughout most of fiscal 2020, with significant improvements to demand and pricing across our ethanol and by-products segments. With all of our high-quality plants in operation, we were able to leverage our strategic locations across the corn belt and healthy liquidity position to generate first quarter net income of $7.8 million and earnings per share of $1.30.”

Balance Sheet

At April 30, 2021, REX had cash and cash equivalents and short-term investments of $193.0 million, $45.9 million of which was at the parent company, and $147.1 million of which was at its consolidated production facilities. This compares with cash, cash equivalents and short-term investments at January 31, 2021, of $180.7 million, $48.2 million of which was at the parent company, and $132.5 million of which was at its consolidated ethanol production facilities.

The following table summarizes select data related to REX’s
consolidated alternative energy interests:


Three Months

Ended


April 30,


2021


2020

Average selling price per gallon of ethanol (net of hedging)

$

1.79

$

1.25

Average selling price per ton of dried distillers grains

$

208.92

$

145.64

Average selling price per pound of non-food grade corn oil

$

0.33

$

0.25

Average selling price per ton of modified distillers grains

$

71.54

$

65.82

Average cost per bushel of grain

$

5.16

$

3.93

Average cost of natural gas (per MmBtu)

$

3.18

$

3.93


Supplemental data related to REX’s ethanol interests:

REX American Resources Corporation
Ethanol Ownership Interests/Effective Annual Gallons Shipped as of April 30, 2021

(gallons in millions)


Entity

Trailing
Twelve Months
Gallons Shipped

Current

REX

Ownership Interest

REX’s Current Effective
Ownership of Trailing
Twelve Month
Gallons Shipped

One Earth Energy, LLC

Gibson City, IL

119.2

75.5%

90.0

NuGen Energy, LLC

Marion, SD

119.6

99.5%

119.0

Big River Resources West Burlington, LLC

West Burlington, IA

97.3

10.3%

10.0

Big River Resources Galva, LLC

Galva, IL

111.5

10.3%

11.5

Big River United Energy, LLC

Dyersville, IA

113.8

5.7%

6.5

Big River Resources Boyceville, LLC

Boyceville, WI

55.8

10.3%

5.7


Total

617.2

n/a

242.7

REX further announced today that it had filed additional supplemental proxy materials related to its Annual Shareholder Meeting to be held on June 16, 2021. The additional information related to the voting requirements of Proposal 3, in particular the treatment of abstentions and broker non-votes. Proposal 3, which is an amendment to the Amended Certificate of Incorporation to authorize a new class of Preferred Stock, requires the affirmative vote of holders of a majority of shares entitled to vote at the Annual Meeting. Therefore, abstentions and broker non-votes will have the effect of a vote against the proposal.

First Quarter Conference Call

REX will host a conference call at 11:00 a.m. ET today. Senior management will discuss the quarterly financial results and host a question-and-answer session. The dial in number for the audio conference call is 212/231-2911 (domestic and international callers).

Participants can also listen to a live webcast of the call on the Company’s website, www.rexamerican.com. A webcast replay will be available for 30 days following the live event.

About REX American Resources Corporation

REX American Resources has interests in six ethanol production facilities, which in aggregate shipped approximately 617 million gallons of ethanol over the twelve-month period ended April 30, 2021. REX’s effective ownership of the trailing twelve-month gallons shipped (for the twelve months ended January 31, 2021) by the ethanol production facilities in which it has ownership interests was approximately 243 million gallons. In addition, the Company acquired a refined coal operation in August 2017. Further information about REX is available at www.rexamerican.com.

This news announcement contains or may contain forward-looking statements within the meaning of the Private Securities Litigation Reform Act of 1995. Such statements can be identified by use of forward-looking terminology such as “may,” “expect,” “believe,” “estimate,” “anticipate” or “continue” or the negative thereof or other variations thereon or comparable terminology. Readers are cautioned that there are risks and uncertainties that could cause actual events or results to differ materially from those referred to in such forward-looking statements. These risks and uncertainties include the risk factors set forth from time to time in the Company’s filings with the Securities and Exchange Commission and include among other things: the effect of pandemics such as COVID-19 on the Company’s business operations, including impacts on supplies, demand, personnel and other factors, the impact of legislative and regulatory changes, the price volatility and availability of corn, distillers grains, ethanol, non-food grade corn oil, gasoline and natural gas, ethanol and refined coal plants operating efficiently and according to forecasts and projections, changes in the international, national or regional economies, weather, results of income tax audits, changes in income tax laws or regulations, the impact of U.S. foreign trade policy, changes in foreign currency exchange rates and the effects of terrorism or acts of war. The Company does not intend to update publicly any forward-looking statements except as required by law.

- statements of operations follow -


REX AMERICAN RESOURCES CORPORATION AND SUBSIDIARIES

Consolidated Statements of Operations

(in thousands, except per share amounts)

Unaudited


Three Months

Ended


April 30,


2021


2020


Net sales and revenue

$

164,104


$

83,250


Cost of sales


146,302


92,580


Gross profit (loss)


17,802


(9,330

)

Selling, general and administrative expenses


(9,988

)


(4,605

)

Equity in income (loss) of unconsolidated ethanol affiliates


570


(477

)

Interest and other income, net


43


669


Income (loss) before income taxes and

non-controlling interests


8,427


(13,743


)

(Provision) benefit for income taxes


(29

)


5,313


Net income (loss) including non-controlling interests


8,398


(8,430

)

Net (income) loss attributable to non-controlling interests


(614

)


795


Net income (loss) attributable to REX common shareholders

$

7,784


$

(7,635

)


Weighted average shares outstanding – basic and diluted


6,010


6,304


Basic and diluted net income (loss) per share attributable to REX common shareholders

$

1.30


($

1.21

)


- balance sheets follow -


REX AMERICAN RESOURCES CORPORATION AND SUBSIDIARIES

Consolidated Balance Sheets

(in thousands)

Unaudited

April 30,


January 31,

ASSETS


2021


2021


CURRENT ASSETS:


Cash and cash equivalents

$

157,105


$

144,501


Short-term investments


35,864


36,194


Restricted cash


1,717


1,657


Accounts receivable


27,557


19,713


Inventory


26,687


37,880


Refundable income taxes


6,020


6,020


Prepaid expenses and other


14,831


12,785


Total current assets


269,781


258,750


Property and equipment-net


149,067


153,186


Operating lease right-of-use assets


11,289


12,678


Deferred taxes and other assets


25,977


25,275


Equity method investment


30,026


29,456


TOTAL ASSETS

$

486,140


$

479,345


LIABILITIES AND EQUITY


CURRENT LIABILITIES:


Accounts payable – trade

$

15,808


$

16,907


Current operating lease liabilities


4,632


4,875


Accrued expenses and other current liabilities


9,185


8,955


Total current liabilities


29,625


30,737


LONG TERM LIABILITIES:


Deferred taxes


4,294


3,713


Long-term operating lease liabilities


6,327


7,439


Other long-term liabilities


278


273


Total long-term liabilities


10,899


11,425


COMMITMENTS AND CONTINGENCIES


EQUITY:


REX shareholders’ equity:


Common stock, 45,000 shares authorized, 29,853 shares issued at par


299


299


Paid in capital


149,144


149,110


Retained earnings


597,770


589,986


Treasury stock, 23,861 shares


(354,604

)


(354,612

)

Total REX shareholders’ equity


392,609


384,783


Non-controlling interests


53,007


52,400


Total equity


445,616


437,183


TOTAL LIABILITIES AND EQUITY

$

486,140


$

479,345


- statements of cash flows follow -


REX AMERICAN RESOURCES CORPORATION AND SUBSIDIARIES

Consolidated Statements of Cash Flows

(in thousands)

Unaudited


Three Months Ended


April 30,


2021


2020


CASH FLOWS FROM OPERATING ACTIVITIES:


Net income (loss)

$

8,398


$

(8,430

)

Adjustments to reconcile net income (loss) to net cash


provided by (used in) operating activities:


Depreciation


5,249


5,315


Amortization of operating lease right-of-use assets


1,389


1,347


(Income) loss from equity method investments


(570

)


477


Dividends received from equity method investments


-


2,005


Interest income from investments


(15

)


(125

)

Deferred income tax


20


(1,748

)

Stock based compensation expense


291


39


Gain on sale of property and equipment – net


(3

)


(3

)

Changes in assets and liabilities:


Accounts receivable


(7,844

)


10,197


Inventory


11,193


8,366


Other assets


(2,187

)


(3,759

)

Accounts payable-trade


(989

)


(11,934

)

Other liabilities


(1,369

)


(2,008

)

Net cash provided by (used in) operating activities


13,563


(261

)

CASH FLOWS FROM INVESTING ACTIVITIES:


Capital expenditures


(1,267

)


(4,700

)

Purchases of short-term investments


(25,930

)


(19,237

)

Sales of short-term investments


26,275


12,834


Other


30


(278

)

Net cash used in investing activities


(892

)


(11,381

)

CASH FLOWS FROM FINANCING ACTIVITIES:


Treasury stock acquired


-


(3,923

)

Payments to noncontrolling interests holders


(75

)


(35

)

Capital contributions from minority investor


68


10


Net cash used in financing activities


(7

)


(3,948

)

NET INCREASE (DECREASE) IN CASH, CASH EQUIVALENTS


AND RESTRICTED CASH


12,664


(15,590

)

CASH, CASH EQUIVALENTS AND RESTRICTED CASH-Beginning of period


146,158


180,771


CASH, CASH EQUIVALENTS AND RESTRICTED CASH-End of period

$

158,822


$

165,181


Non cash financing activities – Stock awards accrued

$

348


$

-


Non cash investing activities – Accrued capital expenditures

$

280


$

457


Operating lease right-of-use assets acquired and liabilities assumed


upon lease execution

$

-


$

1,863


Contacts

Douglas Bruggeman
Chief Financial Officer
(937) 276‑3931

Joseph Jaffoni, Norberto Aja
JCIR
(212) 835-8500
This email address is being protected from spambots. You need JavaScript enabled to view it.

TØNSBERG, Norway--(BUSINESS WIRE)--Kanfer Shipping AS (“Kanfer”), the Norway-based shipping company focusing on small-scale LNG sea transportation and LNG bunkering, today signed shipbuilding contract with China-based Taizhou Wuzhou Shipbuilding Industry Co. Ltd (“Taizhou”) for the construction of its first two small-scale LNG bunker and distribution ships with 6,000 cbm tank capacity each. Kanfer had signed an LOI with Taizhou in January earlier this year. The vessels are scheduled for delivery by second half 2023, with the option to build additional vessels.


“Taizhou has deep experience in building small-scale LNG carriers and Kanfer’s technological partner, CGR Arctic Marine AS, has worked closely for years with the yard. This relationship and their competitiveness have made Taizhou an ideal choice for construction of Kanfer’s 6,000 cbm capacity small-scale vessels,” says Founder and CEO Stig Hagen of Kanfer Shipping.

CGR’s concept design for these two LNG bunker and distribution ships including their specialized cargo and gas process plants, addresses the immediate industry need for more cost-efficient and environmentally friendly LNG bunkering. Key features include:

  • Mono-tank design, with simple arrangement and minimal boil-off
  • Pure gas electric power production combined with hybrid battery technology
  • Lowest possible environmental footprint
  • Extreme manoeuvrability with Azipull thrusters and bow thruster combined with joystick operation
  • 500 cbm MDO cargo tank

The above technical features allow for both capex and opex savings:

  • Reduced crew size
  • Lower operational and maintenance costs
  • Minimal boil-off
  • Significant capex savings due to LNG-fueled vs dual-fueled design

These savings result in lower day-rates for our customers while at the same time offering excellent functionality and clear environmental benefits.

Taizhou Yard has extensive experience with building gas carriers. CGR Founder, Capt. Bård Nordberg, has been leading the design & construction of 10 small-scale gas carriers at the shipyard, including several LNG vessels. Such extensive ship-building experience is unique in this space, and Kanfer is excited to leverage this.

“This announcement represents an important step for Kanfer in realizing its goal to provide cost-efficient and environmentally friendly bunker vessels. Having strong cooperation with blue-chip shipping companies and LNG terminal owners has positioned Kanfer to move forward today with these two new LNG bunkering vessels,” said Mr. Hagen.

“This is just the start”, continues Mr. Hagen. We will be building a large fleet of small- and medium-scale LNG distribution and bunkering ships. We see a rapidly expanding market for LNG bunker vessels as the world maritime industry continues to pivot towards its decarbonisation goals through LNG. The current very modest orderbook for new LNG bunkering vessels makes our decision well-timed, especially now that equivalent, new-built vessels to be delivered in 2022 and 2023 have already been chartered out. The need for the emergence of new LNG bunkering centres will indeed be critical as the trading pattern for gas-driven vessels will be global and very diversified. The existing hubs will also need to expand to cater for growing demand and for the requirement of different sizes of bunkering and distribution ships that Kanfer is in a position to build. This is one of the reasons why Kanfer is confident that the timing is advantageous. The designed for purpose vessels offers lower CAPEX as well as OPEX and will be a competitive LNG bunkering vessel in the market.”

For more information about Kanfer Shipping, visit: http://kanfershipping.com/home/

For more information about CGR Arctic Marine, visit: https://www.cgrmarine.com/


Contacts

MEDIA
Kanfer Shipping: Stig Anders Hagen, Tel: +47 413 599 80 or This email address is being protected from spambots. You need JavaScript enabled to view it..
CGR Arctic Marine AS: Bård Norberg, Tel: +47 913 18 441 or This email address is being protected from spambots. You need JavaScript enabled to view it.

AI Edge Controller enables energy companies to use machine learning to perform self-optimizing predictive maintenance in operations centers of industrial plants

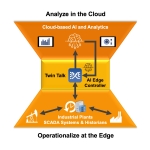
SAN DIEGO--(BUSINESS WIRE)--Today, Embassy of Things, Inc. (EOT) announced the full release of AI Edge Controller which enables the use of trained machine learning models to perform real-time predictions and anomaly detection at the edge of operation centers and uses closed-loop, event-response operational action to instantly avoid expensive downtime and increase production output.


“EOT is excited to deliver an essential breakthrough for making self-optimizing industrial plants a reality by closing the loop of analyzing operational data in the cloud and operationalizing AI insights at the edge in collaboration with AWS, Xecta, TensorIoT and CTG,” comments Matt Oberdorfer, CEO and President of EOT.

During the training phase of machine learning (ML) models, large data sets of sensors are needed to optimize their prediction quality. This requires significant compute and storage power which is only available in the cloud. However, the need for anomaly detection and self-optimization occurs at the operational edge where there is no compute, storage, or internet connection. EOT’s AI Edge Controller’s patent-pending technology serves as a bridge by delivering the rather small, trained ML models from the cloud to the edge. This is where EOT’s Twin Talk’s Operational Insight Engine streams real-time operational data through the trained ML models to instantly detect equipment abnormalities, diagnose issues, reduce false alerts, self-optimize production and avoid expensive downtime by acting before machine failures occur. To get started with AI Edge Controller and TwinTalk, visit: https://embassyofthings.com/ai-edge-controller.

“We are collaborating with EOT to leverage AI Edge Controller and TwinTalk as a part of the AWS production operations solution suite to support customers in their efforts to add incremental production, visualize and minimize rogue emissions and reduce lease operating expenses," says Sid Bhattacharya, Worldwide Head of Energy Solutions at Amazon Web Services. "EOT’s solution is a significant leap in operational technology modernization – it helps customers make business-critical decisions real-time as opposed to the traditional reactive approach.” AWS’s Production Monitoring and Surveillance solution is a Production Data Lake and Edge Software that liberates operational data from legacy SCADA and Historian infrastructure to deliver real-time production and equipment surveillance, GHG emissions monitoring, and predictive maintenance (https://aws.amazon.com/energy/solutions/production-monitoring-surveillance/).

TensorIoT is an EOT Strategic Alliance Partner delivering complete end-to-end products and solutions in IoT, data engineering, machine learning, and artificial intelligence (https://www.tensoriot.com/). "TensorIoT builds AWS Cloud-based solutions to derive valuable business insights from on-premises historian and SCADA system data," said Ravikumar Raghunathan, CEO of TensorIoT. "Working with EOT and integrating TwinTalk with our solutions expedites the process of bringing value to our customers. We are excited about AI Edge Controller's capability to leverage machine learning at the operator on-premise level."

CTG delivers digital solutions across the oil and gas industry that accelerate digital transformation (https://www.ctg.com/industries/oil-and-gas/). “CTG’s partnership with Embassy of Things reflects our ongoing commitment to deliver digital transformation to the energy sector,” said Barbara Locklair, Managing Director of CTG’s Energy Solutions. “CTG’s deep energy domain experience and IT technical expertise combined with EOT's technologies such as AI Edge Controller and TwinTalk is transforming the energy sector by reducing the carbon footprint, lowering costs, and increasing production.”

Xecta’s cloud-first digital platform utilizes a fusion of AI, domain physics, and modern computing to solve complex engineering problems related to operational optimization at scale that enable energy operators to create extraordinary operational and capital efficiency. “Our customers want to use the next generation of autonomous models that self-calibrate to real-time performance data from a multitude of sensory inputs to optimize asset performance as a whole,” says Sanjay Paranji, CEO at Xecta Digital Labs (https://xecta.com). “We are excited about EOT’s AI Edge Controller and Twin Talk’s Insight Engine. It’s a true milestone for implementing a cognitive twin, because it enables to automate, manage, deploy and use of cloud-trained AI models in closed-loop operation centers.”

About Embassy of Things

Embassy of Things Inc. (EOT) provides secure, scalable, and intelligent ETL++ and Operational Data Management Systems designed to liberate operational data from historians and SCADA systems for cloud analytics and using insights for enabling self-optimizing industrial plants. EOT is helping customers in energy, manufacturing and transportation to capitalize on production, asset and resource optimization and cost savings by enabling event-driven, real-time architectures in the cloud and operational intelligence at the edge. For more information, visit: https://www.embassyofthings.com.


Contacts

Becky Byrd
This email address is being protected from spambots. You need JavaScript enabled to view it.

DUBLIN--(BUSINESS WIRE)--#GLOMO--Taoglas® and LvLogics today announced that their industry-first, self-cleaning silo monitoring IoT solution for farmers, wood-pellet and biomass users, has been selected as one of the finalists in the “Best Mobile Innovation for Connected Economy” category for the prestigious 2021 Global Mobile (GLOMO) Awards. To be selected as a finalist for a GLOMO Award is one of the highest accolades in the entire digital industry and the award winners will be announced during Mobile World Congress in Barcelona, on Wednesday 30 June 2021 at 1pm - 2pm (CEST).


As technology continues to fuse the boundaries between physical and digital, the “Best Mobile Innovation for Connected Economy” award seeks to recognise the brands that are winning in creating services that are at the forefront of this digital shift.

Taoglas partnered with LvLogics to provide an industry-first, self-cleaning silo monitoring IoT solution for farmers, wood-pellet and biomass users. Taoglas is providing critical IoT infrastructure and technologies to enable the LvLogics monitoring solution, which provides accurate and reliable silo levels as-a-service to farmers, distributors and manufacturers of animal feeds, wood-pellets or any solids or semi-solids. The patented solution enables low-cost sensors to be used in dusty environments and solves the issue of work-force safety, constant maintenance, manual workflows and unreliability due to dust in an aggressive environment.

With the Taoglas and LvLogics solution, each silo monitoring customer has secure access to a unique platform that presents the data in an easy-to-understand format. Using the Taoglas EDGE™ IoT hardware enables a cost-effective short and long range wireless platform for IoT. Combined with Taoglas Insights™, this provides a scalable end-to-end solution for easy control, maintenance and secure management of many different connected devices, systems, instruments and appliances. The innovative solution utilizes a smart sensor in the silo that continuously measures the amount of stock remaining in the bin. Users can view the measurement from any device or receive an email alert when the level reaches a set threshold.

“Taoglas is honoured to be a finalist for one of the industry’s most influential awards. The GLOMO Awards showcase and celebrate the latest and greatest in mobile and digital industry, so we are thrilled that the Taoglas and LvLogics silo monitoring IoT solution has been recognised amongst some of the leading tech companies in the world,” said Ronan Quinlan, Co-CEO of Taoglas.

“LvLogics is delighted to be shortlisted in the 'Best Mobile Innovation for Connected Economy' category for the 2021 GLOMO Awards. The GLOMOs set the benchmark for rigorous, independent and expert judging so being shortlisted for this award further validates LvLogics and Taoglas’ ability to provide our customers with an instant IoT silo monitoring solution for greater efficiency, cost savings, safety, and sustainability,” said Barry Finnegan, CEO and Co-Founder, LvLogics.

Additionally, the sensor contains a self- cleaning mechanism with no moving parts which, combined with the Taoglas EDGE IoT platform, allows for years of maintenance-free service and provides real-time automation and insights.

See here for a demonstration of the monitoring platform or visit https://lvlogics.com/ for details on the self-cleaning smart sensor. For more information regarding the Taoglas® EDGE IoT hardware and software platform, visit https://www.taoglas.com/iot-solutions/. To read the case study, visit https://www.taoglas.com/silo-monitoring-with-smart-sensor-iot-solution/.

About Taoglas

Taoglas is a leading enabler of digital transformation using IoT from initial strategy definition to design, build, deployment and managed services. Our solutions combine high-performance RF design with advanced positioning, imaging, audio and artificial intelligence technologies for organizations solving critical problems using IoT. A nimble and efficient approach which mobilizes quickly makes Taoglas a trusted advisor helping customers regardless of where they are on their IoT journey. With world-class design, consultancy and engineering expertise, along with support and test centers globally, Taoglas delivers complex IoT solutions to market quickly and cost effectively. Taoglas has proven expertise globally across the transportation, connected healthcare, smart cities and smart building industries.

About LvLogics

LvLogics provides affordable solids monitoring solutions to the global market, by using the innovative, world first, sensor cleaning technology it has developed. It is focused on providing reliable remote levels, humidity and temperature data, at a cost-effective price point for all sorts of solids monitoring, including monitoring animal feed, biomass/pellets, bottle banks and pallets. LvLogics enables customers to solve problems that may have previously been out of reach due to cost or complexity. These solutions are deployed in many countries with global partners who provide support and customer care.


Contacts

Emma Walsh, Marcom & PR Manager, Taoglas. E: This email address is being protected from spambots. You need JavaScript enabled to view it., T: +353 (0)87 317 0897

With commitment to divest the small overlapping portion of lines with KCS, CN-KCS combination is now a fully end-to-end merger

Filing details why combination is pro-competitive and addresses each element of voting trust approval

MONTREAL & KANSAS CITY, Mo.--(BUSINESS WIRE)--CN (TSX: CNR) (NYSE: CNI) and Kansas City Southern (NYSE: KSU) (“KCS”) today announced that they have taken the next step on their path to combine to create the premier railway for the 21st century.


CN and KCS today jointly filed with the Surface Transportation Board (“STB”) a renewed motion for approval of its voting trust that outlines the case for approval of the voting trust to advance the CN-KCS merger that will enhance competition, spur economic growth and realize the benefits of a fully end-to-end transportation network across the continent. The filing highlights that the voting trust protects against premature control of KCS and protects KCS’ financial health, that CN remains financially sound, the substantial benefits to be gained from the transaction by customers and the nearly 1,100 stakeholders who have already supported the transaction.

As part of the application, CN is committing to divesting KCS’ 70-mile line between New Orleans and Baton Rouge, which is less than 0.7 percent of the approximately 27,000 route-miles the two companies operate. This commitment eliminates the sole area of overlap between the CN and KCS networks, thereby making the combination an end-to-end transaction. This commitment, plus CN’s multiple other pro-competitive commitments, including keeping existing gateways open on commercially reasonable terms, addresses any competitive concerns.

We believe our early commitment to eliminating the minimal rail overlap and to laying out the case for a CN-KCS combination should allow the STB to approve our voting trust. A trust is an essential step so KCS shareholders can receive the full value of their shares while the STB considers our case for a combined, end-to-end rail network and the significant public benefits of connecting the continent. This combination will promote growth and compete with the trucking industry for long-haul movements. It offers more choice for rail customers, port operators, employees, stakeholders and communities.”

- JJ Ruest, president and chief executive officer of CN

Combining KCS with CN is compelling for our customers, employees, shareholders and the local communities in which we operate. We urge the STB to fully consider the benefits of this combination, and to respect KCS’ judgment about its preferred merger partner, so that we can realize the tremendous public interest advantages of the CN-KCS partnership on behalf of our stakeholders, many of whom have expressed overwhelming support.”

- Patrick J. Ottensmeyer, president and chief executive officer of KCS

The Public Interest Benefits of a Combined CN-KCS Network

New single-line routes and commitment to keep gateways open for customers: A combined CN-KCS will reduce transit times and provide more reliable and timely service, with shorter equipment cycle times, making rail more competitive with truck and barge routes and single-line services offered by other railroads. It will also offer more cost-effective access to Southern markets in the United States and Mexico, accelerating USMCA’s economic benefits.

Specific supply chain benefits: The joint filing includes detailed maps illustrating benefits for six major market segments: (1) grain and grain byproducts; (2) intermodal; (3) importers, exporters and ocean carriers who rely on ports; (4) automobiles and automotive parts; (5) lumber and panel customers; and (6) plastic resins, liquefied petroleum gases and refined petroleum products.

Significant environmental benefits: Moving freight by rail instead of truck lowers greenhouse gas (GHG) emissions by up to 75 percent, on average. A single freight train can remove more than 300 trucks from the road, leading to a significant reduction in GHG emissions. For example, a daily CN-KCS double stack intermodal train from San Luis Potosi to Detroit would result in approximately 260,000 tons of CO2e emissions avoided per year.

Support across broad stakeholder network: CN has so far received well over 1,100 letters detailing the competitive benefits of the transaction including better service, more shipping options and streamlined routing from shippers and customers as well as from local governments, trade associations and business groups. Support from ports and logistics providers demonstrates the significant multi-modal benefits.

CN Application Satisfies Every Aspect of Voting Trust Approval Framework

No unlawful control. Under CN’s proposed voting trust, KCS would maintain complete independence. KCS will continue to be managed by its existing management and board of directors, with a trustee who is a former chief executive of KCS. KCS will remain intact and preserve its ability to pursue its independent business objectives. CN will have no influence over the day-to-day management or operation of KCS.

Public interest benefits. Approval of the voting trust will provide the STB the opportunity to review the substantial public interest benefits of the CN-KCS combination while ensuring KCS shareholders receive the full value of their shares. The CN-KCS combination will provide a safer, faster, cleaner and stronger rail option for customers, port authorities and communities. As reflected by over 1,100 letters supporting the combination, it will result not only in better service, more shipping options and streamlined routing, but also in substantial environmental benefits.

CN will remain financially strong. The Verified Statement of CN’s Chief Financial Officer, Ghislain Houle, included with the STB filing clearly demonstrates that the proposed transaction will not impair CN’s strong financial standing, and sets forth CN’s plan for rapidly paying down the debt it has secured to fund a portion of the KCS purchase. CN has a strong record of investing in its network to provide safe service and is dedicated to applying that same approach to the combined CN-KCS network. CN made its highest capital investments in 2018-2020 on record, which were focused on adding capacity to accommodate growth and resiliency, deploying technology to improve safety and productivity, and investing in railcars and locomotives to serve our customers.

No risk to competition. While the STB will have ample opportunity to review the competitive dynamics of the CN-KCS combination, CN’s commitment to address the approximately 70-mile overlap with KCS in Louisiana indicates that the CN-KCS combination is a vertical, end-to-end merger. An analysis by Bill Rennicke, a transportation executive and a consultant to railroads and motor carriers for more than 40 years, included with the filing addresses specific concerns about competition in Mississippi, finding that CN and KCS’ North/South lines in Mississippi are generally many miles apart and do not serve a single customer in common in this area.

Preserves KCS’ choice of superior partner. Approving CN’s proposed voting trust would ensure the realization of the public interest benefits of a CN-KCS partnership and allow KCS to continue to keep CN’s superior proposal.

The filing made with the STB, as well as additional information about CN’s pro-competitive combination with KCS, is available at www.ConnectedContinent.com.

About CN

CN is a world-class transportation leader and trade-enabler. Essential to the economy, to the customers, and to the communities it serves, CN safely transports more than 300 million tons of natural resources, manufactured products, and finished goods throughout North America every year. As the only railroad connecting Canada’s Eastern and Western coasts with the U.S. South through a 19,500-mile rail network, CN and its affiliates have been contributing to community prosperity and sustainable trade since 1919. CN is committed to programs supporting social responsibility and environmental stewardship.

About Kansas City Southern

Headquartered in Kansas City, Mo., Kansas City Southern (KCS) (NYSE: KSU) is a transportation holding company that has railroad investments in the U.S., Mexico and Panama. Its primary U.S. holding is The Kansas City Southern Railway Company, serving the central and south central U.S. Its international holdings include Kansas City Southern de Mexico, S.A. de C.V., serving northeastern and central Mexico and the port cities of Lázaro Cárdenas, Tampico and Veracruz, and a 50 percent interest in Panama Canal Railway Company, providing ocean-to-ocean freight and passenger service along the Panama Canal. KCS' North American rail holdings and strategic alliances with other North American rail partners are primary components of a unique railway system, linking the commercial and industrial centers of the U.S., Mexico and Canada. More information about KCS can be found at www.kcsouthern.com.

Forward Looking Statements

Certain statements included in this news release constitute “forward-looking statements” within the meaning of the United States Private Securities Litigation Reform Act of 1995 and under Canadian securities laws, including statements based on management’s assessment and assumptions and publicly available information with respect to KCS, regarding the proposed transaction between CN and KCS, the expected benefits of the proposed transaction and future opportunities for the combined company. By their nature, forward-looking statements involve risks, uncertainties and assumptions. CN cautions that its assumptions may not materialize and that current economic conditions render such assumptions, although reasonable at the time they were made, subject to greater uncertainty. Forward-looking statements may be identified by the use of terminology such as “believes,” “expects,” “anticipates,” “assumes,” “outlook,” “plans,” “targets,” or other similar words.

Forward-looking statements are not guarantees of future performance and involve risks, uncertainties and other factors which may cause actual results, performance or achievements of CN, or the combined company, to be materially different from the outlook or any future results, performance or achievements implied by such statements. Accordingly, readers are advised not to place undue reliance on forward-looking statements. Important risk factors that could affect the forward-looking statements in this news release include, but are not limited to: the outcome of the proposed transaction between CN and KCS; the parties’ ability to consummate the proposed transaction; the conditions to the completion of the proposed transaction; that the regulatory approvals required for the proposed transaction may not be obtained on the terms expected or on the anticipated schedule or at all; CN’s indebtedness, including the substantial indebtedness CN expects to incur and assume in connection with the proposed transaction and the need to generate sufficient cash flows to service and repay such debt; CN’s ability to meet expectations regarding the timing, completion and accounting and tax treatments of the proposed transaction; the possibility that CN may be unable to achieve expected synergies and operating efficiencies within the expected time-frames or at all and to successfully integrate KCS’ operations with those of CN; that such integration may be more difficult, time-consuming or costly than expected; that operating costs, customer loss and business disruption (including, without limitation, difficulties in maintaining relationships with employees, customers or suppliers) may be greater than expected following the proposed transaction or the public announcement of the proposed transaction; the retention of certain key employees of KCS may be difficult; the duration and effects of the COVID-19 pandemic, general economic and business conditions, particularly in the context of the COVID-19 pandemic; industry competition; inflation, currency and interest rate fluctuations; changes in fuel prices; legislative and/or regulatory developments; compliance with environmental laws and regulations; actions by regulators; the adverse impact of any termination or revocation by the Mexican government of KCS de México, S.A. de C.V.’s Concession; increases in maintenance and operating costs; security threats; reliance on technology and related cybersecurity risk; trade restrictions or other changes to international trade arrangements; transportation of hazardous materials; various events which could disrupt operations, including illegal blockades of rail networks, and natural events such as severe weather, droughts, fires, floods and earthquakes; climate change; labor negotiations and disruptions; environmental claims; uncertainties of investigations, proceedings or other types of claims and litigation; risks and liabilities arising from derailments; timing and completion of capital programs; and other risks detailed from time to time in reports filed by CN with securities regulators in Canada and the United States. Reference should also be made to Management’s Discussion and Analysis in CN’s annual and interim reports, Annual Information Form and Form 40-F, filed with Canadian and U.S. securities regulators and available on CN’s website, for a description of major risk factors relating to CN. Additional risks that may affect KCS’ results of operations appear in Part I, Item 1A “Risks Related to KCS’s Operations and Business” of KCS’ Annual Report on Form 10-K for the year ended December 31, 2020, and in KCS’ other filings with the U.S. Securities and Exchange Commission (“SEC”).

Forward-looking statements reflect information as of the date on which they are made. CN assumes no obligation to update or revise forward-looking statements to reflect future events, changes in circumstances, or changes in beliefs, unless required by applicable securities laws. In the event CN does update any forward-looking statement, no inference should be made that CN will make additional updates with respect to that statement, related matters, or any other forward-looking statement.

Non-GAAP Measures

CN reports its financial results in accordance with United States generally accepted accounting principles (GAAP). CN also uses non-GAAP measures in this news release that do not have any standardized meaning prescribed by GAAP. This news release also includes certain forward looking non-GAAP measures or discussions of such measures (EPS, Adjusted Diluted EPS, EBITDA and a leverage ratio being adjusted debt to adjusted EBITDA). It is not practicable to reconcile, without unreasonable efforts, these forward looking measures to the most comparable GAAP measures (diluted EPS, net income and long term debt to net income ratio, respectively), due to unknown variables and uncertainty related to future results. Please see note on Forward Looking Statements above for further discussion.

No Offer or Solicitation

This news release does not constitute an offer to sell or the solicitation of an offer to buy any securities or a solicitation of any vote or approval, nor shall there be any sale of securities in any jurisdiction in which such offer, solicitation or sale would be unlawful prior to registration or qualification under the securities laws of any such jurisdiction. No offer of securities shall be made except by means of a prospectus meeting the requirements of Section 10 of the Securities Act of 1933, as amended.

Additional Information and Where to Find It

In connection with the proposed transaction, CN will file with the SEC a registration statement on Form F-4 to register the shares to be issued in connection with the proposed transaction. The registration statement will include a preliminary proxy statement of KCS which, when finalized, will be sent to the stockholders of KCS seeking their approval of the merger-related proposals. This news release is not a substitute for the proxy statement or registration statement or other document CN and/or KCS may file with the SEC or applicable securities regulators in Canada in connection with the proposed transaction.

INVESTORS AND SECURITY HOLDERS ARE URGED TO READ THE PROXY STATEMENT(S), REGISTRATION STATEMENT(S), TENDER OFFER STATEMENT, PROSPECTUS AND ANY OTHER RELEVANT DOCUMENTS FILED WITH THE SEC OR APPLICABLE SECURITIES REGULATORS IN CANADA CAREFULLY IN THEIR ENTIRETY IF AND WHEN THEY BECOME AVAILABLE BECAUSE THEY WILL CONTAIN IMPORTANT INFORMATION ABOUT CN, KCS AND THE PROPOSED TRANSACTIONS. Any definitive proxy statement(s), registration statement or prospectus(es) and other documents filed by CN and KCS (if and when available) will be mailed to stockholders of CN and/or KCS, as applicable. Investors and security holders will be able to obtain copies of these documents (if and when available) and other documents filed with the SEC and applicable securities regulators in Canada by CN free of charge through at www.sec.gov and www.sedar.com. Copies of the documents filed by CN (if and when available) will also be made available free of charge by accessing CN’s website at www.CN.ca. Copies of the documents filed by KCS (if and when available) will also be made available free of charge at www.investors.kcsouthern.com, upon written request delivered to KCS at 427 West 12th Street, Kansas City, Missouri 64105, Attention: Corporate Secretary, or by calling KCS’s Corporate Secretary’s Office by telephone at 1-888-800-3690 or by email at This email address is being protected from spambots. You need JavaScript enabled to view it..

Participants

This news release is neither a solicitation of a proxy nor a substitute for any proxy statement or other filings that may be made with the SEC and applicable securities regulators in Canada. Nonetheless, CN, KCS, and certain of their directors and executive officers and other members of management and employees may be deemed to be participants in the solicitation of proxies in respect of the proposed transactions. Information about CN’s executive officers and directors is available in its 2021 Management Information Circular, dated March 9, 2021, as well as its 2020 Annual Report on Form 40-F filed with the SEC on February 1, 2021, in each case available on its website at www.CN.ca/investors/ and at www.sec.gov and www.sedar.com. Information about KCS’ directors and executive officers may be found on its website at www.kcsouthern.com and in its 2020 Annual Report on Form 10-K filed with the SEC on January 29, 2021, available at www.investors.kcsouthern.com and www.sec.gov. Additional information regarding the interests of such potential participants will be included in one or more registration statements, proxy statements, tender offer statements or other documents filed with the SEC and applicable securities regulators in Canada if and when they become available. These documents (if and when available) may be obtained free of charge from the SEC’s website at www.sec.gov and from www.sedar.com, as applicable.


Contacts

Media: CN
Canada
Mathieu Gaudreault
CN Media Relations & Public Affairs
(514) 249-4735
This email address is being protected from spambots. You need JavaScript enabled to view it.

Longview Communications & Public Affairs
Martin Cej
(403) 512-5730
This email address is being protected from spambots. You need JavaScript enabled to view it.

United States
Brunswick Group
Jonathan Doorley / Rebecca Kral
(917) 459-0419 / (917) 818-9002
This email address is being protected from spambots. You need JavaScript enabled to view it.

Media: KCS
C. Doniele Carlson
KCS Corporate Communications & Community Affairs
(816) 983-1372
This email address is being protected from spambots. You need JavaScript enabled to view it.

Joele Frank, Wilkinson Brimmer Katcher
Tim Lynch / Ed Trissel
(212) 355-4449

Investment Community: CN
Paul Butcher
Vice-President
Investor Relations
(514) 399-0052
This email address is being protected from spambots. You need JavaScript enabled to view it.

Investment Community: KCS
Ashley Thorne
Vice President
Investor Relations
(816) 983-1530
This email address is being protected from spambots. You need JavaScript enabled to view it.

MacKenzie Partners, Inc.
Dan Burch / Laurie Connell
(212) 929-5748 / (212) 378-7071

NORMAN, Okla.--(BUSINESS WIRE)--#CAISO--Power Costs, Inc. (PCI) is pleased to announce the successful April 1 transition of Turlock Irrigation District (TID) to the CAISO-operated Western Energy Imbalance Market (WEIM). With its go-live, TID becomes the eighth PCI client (after NVE, APS, PSE, PGE, PNM, LADWP, and SMUD) to successfully begin full participation in the WEIM.


TID leveraged PCI's secure, integrated, web-based cloud platform to manage WEIM business requirements for its Balancing Authority (B.A.) and trading operations. It selected PCI after a rigorous competitive process that, among many priorities, included forging a long-term partnership with an experienced, reliable software supplier that could help maximize the opportunities and benefits of joining the new market.

Some of the functionality available in PCI’s CAISO WEIM Platform for hydro-heavy participant portfolios includes:

  • Advanced bidding strategies to assist in managing complex, highly constrained hydro resources
  • Advanced Flex Ramp Forecasting supports balance-of-day and next-day trading decisions
  • Custom user homepages and workflow interfaces for specific groups (e.g., PRSC, EESC front office, etc.)

TID's Assistant General Manager of Power Supply Dan Severson stated, "WEIM participation is a significant achievement for us. PCI's deep WEIM experience, the diligent planning and execution by our staff, as well as the close collaboration between our teams were all critical elements in a seamless transition to go-live."

"The partnership between PCI and TID has been exemplary, and we are proud of the accomplishment of delivering another successful WEIM solution on-time and within budget," said PCI Vice President Jason Hebert.

PCI's CAISO WEIM Platform is a complete solution that provides benefits to market participants, including Transmission Service Providers (TSPs), EIM Entity Scheduling Coordinators (EESCs), Participating Resource Scheduling Coordinators (PRSCs), and Sub-entity Scheduling Coordinators (SESCs).

About Turlock Irrigation District (TID)

TID, located in Turlock, CA, was established in 1887 as a community-owned, not-for-profit irrigation, water, and electric utility. Since its formation as California's first irrigation district, TID's mission has been to deliver reliable, competitively priced services to highly satisfied customers while being excellent stewards of our invaluable natural resources. Learn more by visiting https://www.tid.org/.

About Power Costs, Inc. (PCI)

PCI is the leading provider of energy trading software, superior customer support, and value-added services for energy companies worldwide. Founded in 1992, PCI continues to refine and develop new solutions that meet the ever-evolving needs of its clients, including investor-owned, municipal, and cooperative utilities, renewable energy companies, energy marketers and traders, and independent power producers. PCI optimizes more than half the power generated in North America, and more than 60% of Fortune 500 Utilities in the U.S. are PCI customers. The firm is privately held and based in Norman (OK), with regional offices in Houston (TX), Raleigh (NC), and Mexico City, and Sydney (AUS). To learn more, please visit http://www.powercosts.com/.


Contacts

Stuart Wright
Power Costs, Inc. (PCI)
This email address is being protected from spambots. You need JavaScript enabled to view it.
303-917-3565

  • Company to detail priority areas of Ford+ plan for growth and value creation based on ‘always-on’ customer relationships and leadership in electric vehicles, connected services
  • Expects 40% of Ford global vehicle volume to be all-electric by 2030; raises planned electrification spending to $30+ billion by 2025, including development of IonBoost batteries
  • Announces creation of Ford Pro vehicle services and distribution business, fully dedicated to high productivity requirements of commercial and government customers

DEARBORN, Mich.--(BUSINESS WIRE)--Zero-emission electric vehicles and advanced connectivity are transforming commercial and personal transportation, and Ford is leading that revolution – with compelling services and platforms based on cutting-edge electrical architectures and battery technologies.


The company is applying innovation in those and other areas to stand up Ford Pro, making Ford the first auto manufacturer with a fully dedicated commercial vehicle services and distribution business.

And the underlying Ford+ plan for growth promises always-on benefits for customers – along with new ways for investors to think about how they value the company.

Those are expected to be primary takeaways Wednesday when Ford CEO Jim Farley and other senior leaders expand on the company’s customer-focused strategic ambitions and actions in a virtual meeting with financial analysts and other stakeholders.

The Ford event – themed “Delivering Ford+” – will open for registration at 9:15 a.m. EDT today and will start promptly at 9:30 a.m., with access and supporting material at shareholder.ford.com.

“I’m excited about what Ford+ means for our customers, who will get new and better experiences by pairing our iconic, world-class vehicles with connected technology that constantly gets better over time,” said Farley. “We will deliver lower costs, stronger loyalty and greater returns across all our customers.

“This is our biggest opportunity for growth and value creation since Henry Ford started to scale the Model T, and we’re grabbing it with both hands.”

Delivering Ford+

During the event, Farley will relate how Ford is breaking away from the transactional, build-and-sell business model that has typified the auto industry for decades. Instead, Ford+ is characterized by close, enduring customer relationships – enabled by the company’s foundational strengths, improving financial performance, and capabilities and investments in disruptive technologies.

At the core of those capabilities is Blue Oval Intelligence, Ford’s next-generation, cloud-based platform for integrating electrical, power distribution, computing and software systems in connected Ford and Lincoln vehicles.

Presentations will detail where, why and how the company is headed with fully electric vehicles, commercial solutions and connected services – and how customers will benefit. CFO John Lawler said Ford is allocating capital to those priority areas to produce value for customers and shareholders.

“We’re fueling Ford+ by further strengthening our core automotive operations and generating consistently healthy cash flow that will fund growth and create value,” said Lawler.

The company expects to deliver an 8% adjusted EBIT (earnings before interest and taxes) margin in 2023.1

Today’s event will address how Ford is:

Leading the Electrification Revolution

  • Accelerating investments and increasing planned total spending on electrification, including battery development, to more than $30 billion by 2025 – while deriving efficiencies from Ford’s flexible EV architecture and modular technologies.
  • Anticipating 40% of Ford’s global vehicle volume to be fully electric by 2030, including from:
    • Mustang Mach-E, which is bringing new customers to Ford – 70% of buyers, to date
    • The F-150 Lightning, an all-electric version of the world’s most popular pickup truck, which has amassed 70,000 customer reservations since it was unveiled one week ago, and
    • E-Transit commercial vans, which will be on the road later this year.
  • Investing in battery technology and equipping Ford to design, engineer and manufacture its own batteries, with key developments including:
    • Creating Ford Ion Park, a global center of battery excellence comprising more than 150 experts in battery chemistries, testing, manufacturing and value-chain management who will boost battery range and lower costs to customers and Ford
    • Vertically integrating battery technology with an extensive range of EV batteries – IonBoost lithium ion; IonBoost Pro lithium iron phosphate for commercial vehicles; and long-range, low-cost solid-state batteries based on Ford’s own engineering and know-how from Solid Power, in which the company holds an equity stake, and
    • Forming a joint venture, BlueOvalSK, with SK Innovation to manufacture battery cells and arrays at two plants in the U.S. for future Ford and Lincoln vehicles.

Creating a Business Dedicated to Commercial Customers

  • Establishing Ford Pro, a global vehicle services and distribution business within Ford devoted to commercial and government customers, and led by Ted Cannis, who's been named CEO and a corporate officer.
    • Cannis has been head of Ford’s North America CV business and previously managed the Team Edison EV development group.
  • Providing customers with greater value and higher productivity through:
    • The industry’s most comprehensive and flexible range of electric and internal-combustion commercial vehicles
    • Digital and physical services that can help optimize and maintain customer fleets
    • Public, depot and employee home charging of EVs for the next day’s work, and
    • Bundled financing of vehicles, services and charging.
  • Increasing the commercial market for hardware and adjacent and new services that’s addressable by Ford – with anticipated company revenue of $45 billion by 2025, up from $27 billion in 2019.

Connecting With Customers via Connected Services

  • Having about 1 million vehicles that are capable of receiving over-the-air system updates on the road by the end of this year, exceeding Tesla’s volume by July 2022, and scaling to 33 million OTA-enabled Ford and Lincoln vehicles by 2028.
  • Strengthening customer relationships with digitally enabled tools like Ford Pass and Lincoln Way, online ordering, simplified financing and renewal options, vehicle pick-up and delivery, and mobile repairs.
  • Extending digital lifestyles by fully integrating best-in-class technology from, e.g., Apple, Amazon, Google and Baidu.
  • Speeding detection and resolution of quality issues using connected data – helping to raise customer satisfaction and lower warranty costs.
  • Deploying distinctive connected functions like Ford’s BlueCruise driver-assist technologies, new features and upgraded software content, and EV charging to improve the user experience – and capitalize on what is projected to be a $20 billion market for such services by 2030.

1When Ford provides guidance for adjusted EBIT margin, it does not provide guidance for the most comparable GAAP measure because, as described in more detail in “Non-GAAP Financial Measures That Supplement GAAP Measures” in Ford’s Annual Reports on Form 10-K and Quarterly Reports on Form 10-Q, the GAAP measure includes items that are difficult to predict with reasonable certainty.

About Ford Motor Company

Ford Motor Company (NYSE: F) is a global company based in Dearborn, Michigan. The company designs, manufactures, markets and services a full line of Ford trucks, utility vehicles, and cars – increasingly including electrified versions – and Lincoln luxury vehicles; provides financial services through Ford Motor Credit Company; and is pursuing leadership positions in electrification; mobility solutions, including self-driving services; and connected vehicle services. Ford employs approximately 186,000 people worldwide. For more information regarding Ford, its products and Ford Motor Credit Company, please visit corporate.ford.com.

Cautionary Note on Forward-Looking Statements

Statements included or incorporated by reference herein may constitute “forward-looking statements” within the meaning of the Private Securities Litigation Reform Act of 1995. Forward-looking statements are based on expectations, forecasts, and assumptions by our management and involve a number of risks, uncertainties, and other factors that could cause actual results to differ materially from those stated, including, without limitation:

  • Ford and Ford Credit’s financial condition and results of operations have been and may continue to be adversely affected by public health issues, including epidemics or pandemics such as COVID-19;
  • Ford is highly dependent on its suppliers to deliver components in accordance with Ford’s production schedule, and a shortage of key components, such as semiconductors, can disrupt Ford’s production of vehicles;
  • Ford’s long-term competitiveness depends on the successful execution of its Plan;
  • Ford’s vehicles could be affected by defects that result in delays in new model launches, recall campaigns, or increased warranty costs;
  • Ford may not realize the anticipated benefits of existing or pending strategic alliances, joint ventures, acquisitions, divestitures, or new business strategies;
  • Operational systems, security systems, and vehicles could be affected by cyber incidents and other disruptions;
  • Ford’s production, as well as Ford’s suppliers’ production, could be disrupted by labor issues, natural or man-made disasters, financial distress, production difficulties, or other factors;
  • Ford’s ability to maintain a competitive cost structure could be affected by labor or other constraints;
  • Ford’s ability to attract and retain talented, diverse, and highly skilled employees is critical to its success and competitiveness;
  • Ford’s new and existing products and mobility services are subject to market acceptance and face significant competition from existing and new entrants in the automotive and mobility industries;
  • Ford’s results are dependent on sales of larger, more profitable vehicles, particularly in the United States;
  • With a global footprint, Ford’s results could be adversely affected by economic, geopolitical, protectionist trade policies, or other events, including tariffs;
  • Industry sales volume in any of Ford’s key markets can be volatile and could decline if there is a financial crisis, recession, or significant geopolitical event;
  • Ford may face increased price competition or a reduction in demand for its products resulting from industry excess capacity, currency fluctuations, competitive actions, or other factors;
  • Fluctuations in commodity prices, foreign currency exchange rates, interest rates, and market value of Ford or Ford Credit’s investments can have a significant effect on results;
  • Ford and Ford Credit’s access to debt, securitization, or derivative markets around the world at competitive rates or in sufficient amounts could be affected by credit rating downgrades, market volatility, market disruption, regulatory requirements, or other factors;
  • Ford’s receipt of government incentives could be subject to reduction, termination, or clawback;
  • Ford Credit could experience higher-than-expected credit losses, lower-than-anticipated residual values, or higher-than-expected return volumes for leased vehicles;
  • Economic and demographic experience for pension and other postretirement benefit plans (e.g., discount rates or investment returns) could be worse than Ford has assumed;
  • Pension and other postretirement liabilities could adversely affect Ford’s liquidity and financial condition;
  • Ford could experience unusual or significant litigation, governmental investigations, or adverse publicity arising out of alleged defects in products, perceived environmental impacts, or otherwise;
  • Ford may need to substantially modify its product plans to comply with safety, emissions, fuel economy, autonomous vehicle, and other regulations;
  • Ford and Ford Credit could be affected by the continued development of more stringent privacy, data use, and data protection laws and regulations as well as consumers’ heightened expectations to safeguard their personal information; and
  • Ford Credit could be subject to new or increased credit regulations, consumer protection regulations, or other regulations.

We cannot be certain that any expectation, forecast, or assumption made in preparing forward-looking statements will prove accurate, or that any projection will be realized. It is to be expected that there may be differences between projected and actual results. Our forward-looking statements speak only as of the date of their initial issuance, and we do not undertake any obligation to update or revise publicly any forward-looking statement, whether as a result of new information, future events, or otherwise. For additional discussion, see “Item 1A. Risk Factors” in our Annual Report on Form 10-K for the year ended December 31, 2020, as updated by subsequent Quarterly Reports on Form 10-Q and Current Reports on Form 8-K.


Contacts

Media
T.R. Reid
1.313.319.6683
This email address is being protected from spambots. You need JavaScript enabled to view it.

Equity Investment Community
Lynn Antipas Tyson
1.914.485.1150
This email address is being protected from spambots. You need JavaScript enabled to view it.

Fixed Income Investment Community
Karen Rocoff
1.313.621.0965
This email address is being protected from spambots. You need JavaScript enabled to view it.

Shareholder Inquiries
1.800.555.5259 or
1.313.845.8540
This email address is being protected from spambots. You need JavaScript enabled to view it.

BELLINGHAM, Wash.--(BUSINESS WIRE)--#PVsolar--Second paragraph, second sentence of release should read: In the 2021 PVEL report released today, Silfab earned top ratings in key testing categories: Thermal Cycling (x 600 cycles), Damp Heat (x 2000 hours), and PID Performance (instead of In the 2021 PVEL report released today, Silfab earned top ratings in four key testing categories: Thermal Cycling (x 600 cycles), Damp Heat (x 2000 hours), Mechanical Stress Sequence, and PAN Performance).


The updated release reads:

SILFAB SOLAR MODULES SECURE “TOP PERFORMER” RATING FOR PVEL 2021 SCORECARD

Silfab Solar, North America’s leading PV manufacturer, earned a “top performer” rating under the rigorous PV Evolution Labs testing, the company announced today.

This was the third year in a row that Silfab earned PVEL top performer awards. In the 2021 PVEL report released today, Silfab earned top ratings in key testing categories: Thermal Cycling (x 600 cycles), Damp Heat (x 2000 hours), and PID Performance. Silfab has been perfecting PV module technology and manufacturing processes for 40 years.

“Businesses, consumers and clean energy companies rely on the best power performance and superior durability from their PV modules. Silfab Solar has consistently delivered the most advanced, reliable products because of our ongoing commitment to the best engineering, leading-edge designs and strict production benchmarks,” said Paolo Maccario, Silfab President and CEO. “Independent and very rigorous testing verifies that Silfab Solar is delivering the best solar for North America.”

“As PVEL continues to be the benchmark for independent module testing, data and reports that guide strategic procurement, minimize technology risk, and provide critical information to the solar industry, we continue to experience significant technology advances for modules and it is great to see a growing North American-based manufacturer continue to excel in our testing environment,” said Tristan Erion-Lorico, Head of PV Module Business, PV Evolution Labs. “Congratulations to Silfab Solar.”

Demand for Silfab’s complete suite of PV modules also is requiring ongoing expansion of all production lines. Silfab is increasing capacity while utilizing some of the largest, highly automated manufacturing plants in North America and continuing to incorporate break-through technologies developed through exclusive alliances with global innovators.

To see the full product line, visit www.silfabsolar.com.

About Silfab Solar

Silfab Solar is the North American leader in the design, development and manufacture of ultra-high-efficiency, premium quality PV modules. Silfab leverages 40 years of solar experience and best-in-class technologies to produce the highest-rated solar modules from facilities in the state of Washington and Toronto, Canada. Each facility features multiple automated ISO 9001-2015 quality certified production lines utilizing just-in-time manufacturing to deliver Buy American approved PV modules specifically designed for and dedicated to the North American market. www.silfabsolar.com


Contacts

Silfab Solar
Geoff Atkins
Email: This email address is being protected from spambots. You need JavaScript enabled to view it.
Tel: +1-905-255-2501 Ext. 737
www.silfabsolar.com

NuScale Power and Grant County Public Utility District (Grant PUD) will work together to examine NuScale’s advanced nuclear technology’s ability to deliver an affordable and reliable clean energy future to central Washington

PORTLAND, Ore.--(BUSINESS WIRE)--Today, NuScale Power and Grant County Public Utility District (Grant PUD) announced the signing of a memorandum of understanding (MOU) to evaluate the deployment of NuScale’s advanced nuclear technology in Central Washington. The agreement underscores the increasing demand for innovative small modular reactors (SMRs) to provide communities with reliable and affordable clean energy.


Based in Ephrata, Washington, Grant PUD is a public electric utility with the capacity to generate more than 2,100 megawatts of renewable, carbon-free energy for the Northwest at its hydropower plants. The utility also serves 40,000 retail customers in Grant County, which includes an expanding industrial sector. Grant PUD is a forward-thinking leader in managing and securing affordable, reliable, clean energy for its customers.

“We are proud to partner with an experienced, pioneering utility that has brought reliable, low-cost power to its people by investing in innovative, sustainable energy projects,” said John Hopkins, NuScale Power Chairman and Chief Executive Officer. “As interest in our small modular reactors (SMRs) grows, we welcome this opportunity to emphasize how NuScale’s safer and smarter technology can be the reliable and affordable clean energy solution that communities like Grant County and others across America need.”

“Grant PUD is very excited to be in partnership with NuScale to explore the development of one of its small modular reactor nuclear plants,” said Kevin Nordt, Grant PUD Chief Executive Officer. “NuScale’s dedication to innovation and safety fit well with Grant PUD’s values. We are excited to work towards making nuclear power a key part of a carbon free future in the Pacific Northwest.”

Under this MOU, the two parties will work together to support Grant PUD’s due diligence process in evaluating reliable, carbon-free energy solutions. The deployment of NuScale’s Nuclear Regulatory Commission (NRC)-approved design will support meeting the demands of Grant PUD’s customers and the desired commercial operation timeline with acceptable and affordable cost certainty.

Built upon existing light-water nuclear reactor technology, NuScale’s game-changing small modular reactors (SMRs) design is second-to-none in safety performance, power generation flexibility, and overall performance. Presented during the U.S. NRC Design Certification process, NuScale’s plant design demonstrated its Triple Crown For Nuclear Plant Safety™, meaning reactors will safely shut down and self-cool indefinitely with no need for operator or computer action, AC or DC power, or the addition of water. NuScale’s power plant design is scalable in 77 megawatts electric (MWe) increments up to 924 megawatts (MWe). Modules can be added incrementally as regional load demands increase, offering the customer a new level of flexibility and reduced financial risk. This flexibility also allows for seamless integration with intermittent sources of power utilizing exceptional load following capabilities. These qualities align well with Grant PUD’s long-term objective of providing its customers with reliable, carbon-free energy and are a driving force in the initiation of the due diligence process in order to investigate the applicability of the NuScale technology in Central Washington.

About NuScale Power

NuScale Power has developed a new modular light water reactor nuclear power plant to supply energy for electrical generation, district heating, desalination, and other process heat applications. This groundbreaking small modular reactor (SMR) design features a fully factory-fabricated NuScale Power Module™ capable of generating 77 MW of electricity using a safer, smaller, and scalable version of pressurized water reactor technology. NuScale's scalable design—power plants that can house up to four, six, or 12 individual power modules—offers the benefits of carbon-free energy and reduces the financial commitments associated with gigawatt-sized nuclear facilities. The majority investor in NuScale is Fluor Corporation, a global engineering, procurement, and construction company with a 60-year history in commercial nuclear power.

NuScale is headquartered in Portland, OR and has offices in Corvallis, OR; Rockville, MD; Charlotte, NC; Richland, WA; and London, UK. Follow us on Twitter: @NuScale_Power, Facebook: NuScale Power, LLC, LinkedIn: NuScale-Power, and Instagram: nuscale_power. NuScale has a new logo, brand, and website. Watch the short video.

About Grant County PUD

Established by local residents over 80 years ago and based in Ephrata, Washington, Grant PUD generates and delivers energy to millions of customers throughout the Pacific Northwest, and serves more than 40,000 retail power customers in Grant County. For more information visit www.grantpud.org or follow us on Facebook and Twitter.


Contacts

Diane Hughes, Vice President, Marketing & Communications, NuScale Power
This email address is being protected from spambots. You need JavaScript enabled to view it.
(C) (503) 270-9329

Grant PUD Public Affairs
This email address is being protected from spambots. You need JavaScript enabled to view it.
(509) 754-5035

Urges Company to Conduct Meeting Fairly and Proceed Timely with Taking the Vote

SAN FRANCISCO--(BUSINESS WIRE)--Engine No. 1, which has nominated four highly qualified, independent director candidates to the Exxon Mobil Corporation (NYSE: XOM) (“ExxonMobil” or the “Company”) Board of Directors (the “Board”) in connection with the 2021 Annual Meeting of Shareholders, today issued the following statement:


In seeking to delay the closing of the polls, ExxonMobil is using corporate machinery for its own purpose rather than that of shareholders and avoiding the election of individuals with the transformative energy experience required to position the Company for long-term success in a changing world. Shareholders should not be fooled by ExxonMobil’s last-ditch attempt to stave off much-needed board change in response to significant shareholder pressure and the prospect of losing a proxy contest. Shareholders have spoken. ExxonMobil should accept the result, take the vote and move forward.”

Additional information regarding Engine No. 1’s campaign to Reenergize Exxon may be found at www.ReenergizeXOM.com.

About Engine No. 1

Engine No. 1 is an investment firm purpose-built to create long-term value by driving positive impact through active ownership. The firm also will invest in public and private companies through multiple strategies. For more information, please visit: www.Engine1.com.


Contacts

Media:
Gasthalter & Co.
Jonathan Gasthalter/Amanda Klein
212-257-4170
This email address is being protected from spambots. You need JavaScript enabled to view it.

Investor:
Innisfree M&A Incorporated
Scott Winter/Gabrielle Wolf
212-750-5833

LEMONT, Ill.--(BUSINESS WIRE)--A study conducted by researchers at the U.S. Department of Energy’s Argonne National Laboratory reveals that the use of corn ethanol is reducing the carbon footprint and diminishing greenhouse gases.


The study, recently published in Biofuels Bioproducts and Biorefining, analyzes corn ethanol production in the United States from 2005 to 2019, when production more than quadrupled. Scientists assessed corn ethanol’s greenhouse gas (GHG) emission intensity (sometimes known as carbon intensity, or CI) during that period and found a 23 percent reduction in CI.

Corn ethanol production increased over the period, from 1.6 to 15 billion gallons (6.1 to 57 billion liters). Supportive biofuel policies—such as the Environmental Protection Agency’s Renewable Fuel Standard and California’s Low-Carbon Fuel Standard—helped generate the increase. Both of those federal and state programs evaluate the life-cycle GHG emissions of fuel production pathways to calculate the benefits of using renewable fuels.

To assess emissions, scientists use a process called life-cycle analysis, or LCA—the standard method for comparing relative GHG emission impacts among different fuel production pathways.

“Since the late 1990s, LCA studies have demonstrated the GHG emission reduction benefits of corn ethanol as a gasoline alternative,” noted Argonne senior scientist Michael Wang. “This new study shows the continuous downtrend of corn ethanol GHG emissions.”

“The corn ethanol production pathway—both in terms of corn farming and biorefineries—has evolved greatly since 2005,” observed Argonne analyst Uisung Lee, first author of the study. Lee pointed out that the study relied on comprehensive statistics of corn farming from the U.S. Department of Agriculture and of corn ethanol production from industry benchmark data.

Hoyoung Kwon, a coauthor, stated that U.S. corn grain yields improved by 15 percent, reaching 168 bushels per acre despite fertilizer inputs remaining constant and resulting in a decreased intensity in fertilizer input per bushel of corn harvested: reductions of 7 percent in nitrogen use and 18 percent in potash use.

May Wu, another co-author, added that ethanol yields increased 6.5 percent, with a 24 percent reduction in ethanol plant energy use.

“With the increased total volume and the reduced CI values of corn ethanol between 2005 and 2019, corn ethanol has resulted in a total GHG reduction of more than 500 million tons between 2005 and 2019,” Wang emphasized. “For the United States, biofuels like corn ethanol can play a critical role in reducing our carbon footprint.”

Full story here.


Contacts

Christopher J. Kramer
Head of Media Relations
Argonne National Laboratory
Office: 630.252.5580
This email address is being protected from spambots. You need JavaScript enabled to view it.

DUBLIN--(BUSINESS WIRE)--The "Maritime Information Market: Global Industry Trends, Share, Size, Growth, Opportunity and Forecast 2021-2026" report has been added to ResearchAndMarkets.com's offering.


The global maritime information market exhibited moderate growth during 2015-2020. Looking forward, the global maritime information market is expected to grow at a CAGR of around 6% during 2021-2026.

Maritime navigation has been used since centuries for trade, traveling and security purposes. The advent of digital transformation in marine navigation has aided users in gathering crucial information about the activities undertaken on ports and water bodies. Maritime information solutions assist vessels in adapting to the dynamic sea conditions by monitoring several parameters, which enable users and organizations to take better operational as well as strategic decisions. Besides this, they are associated with advantages such as enhancing the overall productivity and safety, along with ensuring efficiency in marine operations. As a result, these solutions are being employed for acquiring data about the ownership, movements, specifications and commercial activities of naval vessels.

As maritime information solutions play a vital role in ensuring an economy's security, they are widely used by governing authorities around the world. These solutions help nations in minimizing maritime threats such as human trafficking, terrorist attacks, environmental destruction and illegal seaborne immigration.

Moreover, on account of the liberalization of world trade, there has been a significant increase in the number of ships that traverse the oceans which, in turn, is strengthening the demand for these solutions. Apart from this, the International Maritime Organization (IMO) has recently implemented stringent laws, making it compulsory for all vessels to be deployed with Automatic Identification System (AIS) in order to monitor maritime traffic and avoid collision with other ships. Further, manufacturers are financing in research and development activities to attain accurate signal detection from naval vessels.

Companies Mentioned

  • Inmarsat
  • L3 Technologies
  • ORBCOMM
  • Raytheon Company
  • Thales Group
  • exactEarth
  • Iridium Communications

Key Questions Answered in This Report:

  • How has the global maritime information market performed so far and how will it perform in the coming years?
  • What are the key regional markets in the global maritime information industry?
  • What has been the imapct of COVID-19 on the global maritime information market?
  • What is the breakup of the market based on the application?
  • What is the breakup of the market based on the end-user?
  • What are the various stages in the value chain of the global maritime information industry?
  • What are the key driving factors and challenges in the global maritime information industry?
  • What is the structure of the global maritime information industry and who are the key players?
  • What is the degree of competition in the global maritime information industry?

Key Topics Covered:

1 Preface

2 Scope and Methodology

3 Executive Summary

4 Introduction

4.1 Overview

4.2 Key Industry Trends

5 Global Maritime Information Market

5.1 Market Overview

5.2 Market Performance

5.3 Impact of COVID-19

5.4 Market Breakup by Application

5.5 Market Breakup by End-User

5.6 Market Breakup by Region

5.7 Market Forecast

6 Market Breakup by Application

7 Market Breakup by End-User

8 Market Breakup by Region

9 SWOT Analysis

10 Value Chain Analysis

11 Porter's Five Forces Analysis

12 Price Analysis

13 Competitive Landscape

13.1 Market Structure

13.2 Key Players

13.3 Profiles of Key Players

For more information about this report visit https://www.researchandmarkets.com/r/47rv3q


Contacts

ResearchAndMarkets.com
Laura Wood, Senior Press Manager
This email address is being protected from spambots. You need JavaScript enabled to view it.

For E.S.T Office Hours Call 1-917-300-0470
For U.S./CAN Toll Free Call 1-800-526-8630
For GMT Office Hours Call +353-1-416-8900

DUBLIN--(BUSINESS WIRE)--The "Viscosity Reducing Agents Market - Growth, Trends, COVID-19 Impact, and Forecasts (2021 - 2026)" report has been added to ResearchAndMarkets.com's offering.


The market for viscosity reducing agents is expected to grow at a CAGR of about 5% globally during the forecast period.

Companies Mentioned

  • Alberta Treating Chemicals LTD.
  • ARKEMA Group
  • Baker Hughes Company
  • BASF SE
  • BYK-CHEMIE GMBH
  • CHINAFLOC
  • Ecolab
  • Innospec
  • LiquidPower Specialty Products Inc.
  • NuGenTecx
  • Oil Flux
  • Qflo
  • The Lubrizol Corporation

Key Market Trends

Growing Demand from the Oil & Gas Industry

  • Viscosity reducing agents are widely used in oil & gas industries and is expected to grow rapidly during the forecast period.
  • Viscosity reducing agents are often referred to as drag reducing agents in oil & gas industries, they improve the flow by reducing the frictional energy losses by decreasing the turbulence in the pipeline during crude oil transportation, and processing.
  • Moreover, they are long-chain hydrocarbons that decrease the pressure drop for the same flow rate and thereby increase the pipeline flow using the same amount of energy.
  • Viscosity reducing agents help in the free-flowing of crude oil products, finished products, asphalt-crude, aqueous systems, and multiphase systems. The global petroleum and other petroleum-based liquids are at 100.75 million barrels per day in 2019 from 99.97 million barrels per day in 2018, which shows an increase of about 284.7 million barrels per year and is expected to grow during the forecast period.
  • However, due to unprecedented conditions arisen due to the COVID-19 outbreak the consumption of oil & gas will be down by at least 5 million barrels per day due to lockdown in various countries and shut down of travel, tourism, e-commerce, and restaurants are likely to affect the consumption in 2020.
  • The growing urbanization and increasing demand for petroleum-based products are expected to drive the market for the viscosity reducing agents during the forecast period.

Asia-Pacific Region to Dominate the Market

  • The Asia-Pacific region is expected to dominate the market for viscosity reducing agents during the forecast period due to an increase in demand from countries like China and India.
  • The growing crude-oil consumption in countries like India and China is expected to drive the market during the forecast period. Globally, India is the third-largest consumer of crude oil and petroleum products after China and the United States, with the second-largest refinery in Asia after China. The Indian petroleum import value is about USD 112 billion in 2019 with a 27% growth from the financial year 2018. The growing consumption from the transportation sector, and liquified petroleum gas from residential and commercial complexes are expected to drive the market.
  • In China, crude oil consumption is at 14.5 million barrels per day in 2019 from about 13.5 million barrels per day in 2018. In addition to that, China's refinery capacity is increased by 1 million barrels per day in 2019. The growing consumption in China is expected to drive the market.
  • In paints & coatings, the dispersing agents deflocculates solids, thereby reducing the viscosity of dispersion and increasing the loading of dispersed powder material. The dispersing phase is the most energy consuming stage and dispersing agents help in increasing stability and optimize energy consumption. The growing paints and coatings are expected to drive the market.
  • The aforementioned factors, coupled with government support, are contributing to the increasing demand for viscosity reducing agents market in the Asia-Pacific during the forecast period.

Key Topics Covered:

1 INTRODUCTION

2 RESEARCH METHODOLOGY

3 EXECUTIVE SUMMARY

4 MARKET DYNAMICS

4.1 Drivers

4.1.1 Growing Demand From the Oil & Gas Industry

4.1.2 Other Drivers

4.2 Restraints

4.2.1 Stringent Environmental Regulations

4.2.2 Unfavourable Conditions Arising Due to the COVID-19 Outbreak

4.3 Industry Value Chain Analysis

4.4 Porters Five Forces Analysis

4.4.1 Bargaining Power of Suppliers

4.4.2 Bargaining Power of Consumers

4.4.3 Threat of New Entrants

4.4.4 Threat of Substitute Products and Services

4.4.5 Degree of Competition

5 MARKET SEGMENTATION

5.1 Type

5.2 End-user Industry

5.3 Geography

6 COMPETITIVE LANDSCAPE

6.1 Mergers & Acquisitions, Joint Ventures, Collaborations, and Agreements

6.2 Market Share Analysis

6.3 Strategies Adopted by Leading Players

6.4 Company Profiles

7 MARKET OPPORTUNITIES AND FUTURE TRENDS

7.1 Growing Demand Due from Emerging Economies

For more information about this report visit https://www.researchandmarkets.com/r/upbcw


Contacts

ResearchAndMarkets.com
Laura Wood, Senior Press Manager
This email address is being protected from spambots. You need JavaScript enabled to view it.
For E.S.T Office Hours Call 1-917-300-0470
For U.S./CAN Toll Free Call 1-800-526-8630
For GMT Office Hours Call +353-1-416-8900

SAN RAMON, Calif.--(BUSINESS WIRE)--Chevron Corporation (NYSE: CVX) today provided an overview of the company’s business priorities and outlook at its annual stockholders meeting, held virtually to provide convenient access for all stockholders and eliminate public health concerns around the COVID-19 pandemic, as well as the significant costs associated with holding an in-person meeting.


For the past year, Chevron’s portfolio showed resilience, adjusting to extreme market conditions to balance short-term cashflow with preserving long-term value.

“Chevron has navigated through the challenges of the last year better than most in our industry,” said Michael Wirth, Chevron’s chairman and CEO. “We're optimistic about the future as we work to deliver higher returns and lower carbon.”

Chevron is taking action to reduce the carbon intensity of its operations and assets, increase the use of renewables and offsets in support of its business, and invest in low-carbon technologies to enable commercial solutions.

Wirth told stockholders about three core elements of Chevron’s business strategy: consistency, preparation and adaptability.

“Consistent values, because the world changes, but our foundation doesn't. Staying prepared, because our business has cycles, and adaptive, because we live in a dynamic world.”

Chevron’s financial priorities remain consistent. First, protect the dividend, which is on track for the 34th consecutive year with an increase in annual dividend payout per share. Second, invest at a lower reinvestment rate because of vastly improved capital efficiency. Third, preserve the balance sheet, which led the industry before the pandemic and continues to do so today. Finally, when the first three priorities are met, Chevron has a track record of repurchasing shares, as it has done in 13 of the last 17 years.

“We're a company you can count on in good times and in tough ones,” Wirth said.

The preliminary results from the meeting can be accessed online at chevron.com. Final voting results will be posted in the same location after they have been reported on a Form 8-K, which will be filed with the U.S. Securities and Exchange Commission. Specific information about the proposals before Chevron stockholders this year may be found in the “Investors” section of the company’s website under “Stockholder Services – Annual Meeting Materials.”

Chevron is one of the world’s leading integrated energy companies. We believe affordable, reliable and ever-cleaner energy is essential to achieving a more prosperous and sustainable world. Chevron produces crude oil and natural gas; manufactures transportation fuels, lubricants, petrochemicals and additives; and develops technologies that enhance our business and the industry. To advance a lower-carbon future, we are focused on cost efficiently lowering our carbon intensity, increasing renewables and offsets in support of our business, and investing in low-carbon technologies that enable commercial solutions. More information about Chevron is available at www.chevron.com.

NOTICE

As used in this news release, the term “Chevron” and such terms as “the company,” “the corporation,” “our,” “we,” “us” and “its” may refer to Chevron Corporation, one or more of its consolidated subsidiaries, or to all of them taken as a whole. All of these terms are used for convenience only and are not intended as a precise description of any of the separate companies, each of which manages its own affairs.

Please visit Chevron’s website and Investor Relations page at www.chevron.com and www.chevron.com/investors, LinkedIn: www.linkedin.com/company/chevron, Twitter: @Chevron, Facebook: www.facebook.com/chevron, and Instagram: www.instagram.com/chevron, where Chevron often discloses important information about the company, its business, and its results of operations.

CAUTIONARY STATEMENTS RELEVANT TO FORWARD-LOOKING INFORMATION FOR THE PURPOSE OF “SAFE HARBOR” PROVISIONS OF THE PRIVATE SECURITIES LITIGATION REFORM ACT OF 1995

This news release contains forward-looking statements relating to Chevron’s operations that are based on management's current expectations, estimates and projections about the petroleum, chemicals and other energy-related industries. Words or phrases such as “anticipates,” “expects,” “intends,” “plans,” “targets,” “advances,” “commits,” “forecasts,” “projects,” “believes,” “approaches,” “seeks,” “schedules,” “estimates,” “positions,” “pursues,” “may,” “can,” “could,” “should,” “will,” “budgets,” “outlook,” “trends,” “guidance,” “focus,” “on track,” “goals,” “objectives,” “strategies,” “opportunities,” “poised,” “potential” and similar expressions are intended to identify such forward-looking statements. These statements are not guarantees of future performance and are subject to certain risks, uncertainties and other factors, many of which are beyond the company’s control and are difficult to predict. Therefore, actual outcomes and results may differ materially from what is expressed or forecasted in such forward-looking statements. The reader should not place undue reliance on these forward-looking statements, which speak only as of the date of this news release. Unless legally required, Chevron undertakes no obligation to update publicly any forward-looking statements, whether as a result of new information, future events or otherwise.

Among the important factors that could cause actual results to differ materially from those in the forward-looking statements are: changing crude oil and natural gas prices and demand for our products, and production curtailments due to market conditions; crude oil production quotas or other actions that might be imposed by the Organization of Petroleum Exporting Countries and other producing countries; public health crises, such as pandemics (including coronavirus (COVID-19)) and epidemics, and any related government policies and actions; changing economic, regulatory and political environments in the various countries in which the company operates; general domestic and international economic and political conditions; changing refining, marketing and chemicals margins; the company’s ability to realize anticipated cost savings, expenditure reductions and efficiencies associated with enterprise transformation initiatives; actions of competitors or regulators; timing of exploration expenses; timing of crude oil liftings; the competitiveness of alternate-energy sources or product substitutes; technological developments; the results of operations and financial condition of the company’s suppliers, vendors, partners and equity affiliates, particularly during extended periods of low prices for crude oil and natural gas during the COVID-19 pandemic; the inability or failure of the company’s joint-venture partners to fund their share of operations and development activities; the potential failure to achieve expected net production from existing and future crude oil and natural gas development projects; potential delays in the development, construction or start-up of planned projects; the potential disruption or interruption of the company’s operations due to war, accidents, political events, civil unrest, severe weather, cyber threats, terrorist acts, or other natural or human causes beyond the company’s control; the potential liability for remedial actions or assessments under existing or future environmental regulations and litigation; significant operational, investment or product changes required by existing or future environmental statutes and regulations, including international agreements and national or regional legislation and regulatory measures to limit or reduce greenhouse gas emissions; the potential liability resulting from pending or future litigation; the company's ability to achieve the anticipated benefits from the acquisition of Noble Energy, Inc.; the company’s future acquisitions or dispositions of assets or shares or the delay or failure of such transactions to close based on required closing conditions; the potential for gains and losses from asset dispositions or impairments; government mandated sales, divestitures, recapitalizations, industry-specific taxes, tariffs, sanctions, changes in fiscal terms or restrictions on scope of company operations; foreign currency movements compared with the U.S. dollar; material reductions in corporate liquidity and access to debt markets; the receipt of required Board authorizations to pay future dividends; the effects of changed accounting rules under generally accepted accounting principles promulgated by rule-setting bodies; the company’s ability to identify and mitigate the risks and hazards inherent in operating in the global energy industry; and the factors set forth under the heading “Risk Factors” on pages 18 through 23 of the company's 2020 Annual Report on Form 10-K and in other subsequent filings with the U.S. Securities and Exchange Commission. Other unpredictable or unknown factors not discussed in this news release could also have material adverse effects on forward-looking statements.


Contacts

Sean Comey -- +1 925-842-5509


Leader in decarbonization planning assessed a range of zero-carbon generation projects for SMUD in detailed utility analysis


OVERLAND PARK, Kan.--(BUSINESS WIRE)--Zero-carbon technologies, including carbon capture, energy storage, hydrogen, solar and wind, will allow the Sacramento Municipal Utility District (SMUD) to achieve its goals of zero-carbon emissions in its electricity supply by 2030, finds a recent analysis by decarbonization solutions leader Black & Veatch.

The 2030 Zero Carbon Plan was completed to help the public utility inform its customers and other key stakeholders as to how SMUD will address its goal of eliminating 100-percent of greenhouse gas emissions from all electric generation by 2030. Black & Veatch performed an assessment of zero carbon technologies that included biomass and biogas; carbon sequestration and storage; geothermal energy; long-duration energy storage; onshore and offshore wind; renewable hydrogen and solar PV that will accelerate the energy transition for SMUD’s more than 1.5 million customers.

“Climate change is a critical issue threatening our world, but it’s more than that for us,” said Valentino Tiangco, biomass program lead at SMUD. “Air quality in Sacramento is among the worst in the country. Our Plan will contribute to improving both air quality and greenhouse gas emissions. To support the analyses, we selected Black & Veatch to assess zero-carbon technologies that could provide the sustainability and resilience we need to achieve this aggressive and highly necessary goal.”

The study analyzed the full range of zero-carbon technologies currently available to determine the metrics for potential procurement. The report also evaluated the cost-effectiveness and performance characteristics for each technology; assessed its technical and economic feasibility; estimated the Levelized Cost of Energy (LCOEs); evaluated issues and challenges for the development of each project; and identified and determined the necessary input required for production cost models and scenario analysis.

Other key takeaways from the report include:

  • All the studied technologies are expected to be commercially available for SMUD’s use by 2030.
  • Solar and onshore wind are the lowest cost of energy options on a levelized basis.
  • Due to anticipated advancements in technology, long-duration energy storage – defined as 48 hours to 168 hours of storage – becomes significantly more economical towards the end of the study period. The same can be said for hydrogen.

“Drawing on our deep experience and expertise across an integrated portfolio of power generation, transmission and distribution technologies, our team was able to evaluate a range of options to model the analysis,” said Dave Hallowell, Senior Vice President and leader of Black & Veatch’s Global Renewable Energy business line. “Armed with this information, SMUD can advance towards achieving its zero-carbon goals.”

The report is available for download on the SMUD website.

Editor’s Notes:

  • In 2017, the Smart Electric Power Alliance selected Black & Veatch to conduct an in-depth study detailing SMUD’s efforts to create an integrated distributed energy resources (DER) planning process. The report found that consumers could outspend utilities in the adoption of solar, storage, electric vehicles and other DER, making it essential for utilities to track and integrate DER into their planning processes to benefit their customers and the grid.

About Black & Veatch
Black & Veatch is an employee-owned global engineering, procurement, consulting and construction company with a more than 100-year track record of innovation in sustainable infrastructure. Since 1915, we have helped our clients improve the lives of people around the world by addressing the resilience and reliability of our most important infrastructure assets. Our revenues in 2020 exceeded US$3.0 billion. Follow us on www.bv.com and on social media.

About SMUD
As the nation’s sixth-largest community-owned electric service provider, SMUD has been providing low-cost, reliable electricity for about 70 years to Sacramento County and small adjoining portions of Placer and Yolo Counties. SMUD is a recognized industry leader and award winner for its innovative energy efficiency programs, renewable power technologies, and for its sustainable solutions for a healthier environment. SMUD’s power mix is about 50 percent non-carbon emitting. For more information, visit smud.org.


Contacts

Media Contact Information:
MELINA VISSAT | +1 303-256-4065 P | +1 617-595-8009 M | This email address is being protected from spambots. You need JavaScript enabled to view it.
24-HOUR MEDIA HOTLINE | +1 866-496-9149

Delivers Strong, Broad-Based Growth

Raising Full-Year Outlook on Continued Company Momentum

Highlights:


  • Revenue of $1.525 billion represents an increase of 23% reported growth year-over-year, up 19% on a core(1) basis.
  • GAAP net income of $216 million, or 70 cents per share.
  • Non-GAAP(2) net income of $299 million, or 97 cents per share.
  • Completed the Resolution Bioscience acquisition.
  • Full-year guidance raised with revenue now expected to be in the range of $6.15 billion to $6.21 billion and non-GAAP(3) earnings per share (EPS) of $4.09 to $4.14.
  • Third-quarter revenue expected to be in the range of $1.51 billion to $1.54 billion with non-GAAP(3) EPS of 97 cents to 99 cents.

SANTA CLARA, Calif.--(BUSINESS WIRE)--$A #Agilent--Agilent Technologies Inc. (NYSE: A) today reported revenue of $1.525 billion for the second quarter ended April 30, 2021, an increase of 23% compared to the second quarter of 2020 and up 19% on a core(1) basis.

Second-quarter GAAP net income was $216 million, or 70 cents per share. This compares with $101 million, or 32 cents per share, in the second quarter of fiscal year 2020. Non-GAAP(2) net income was $299 million, or 97 cents per share compared with $223 million, or 71 cents per share, during the second quarter a year ago.

“The Agilent team delivered an exceptional quarter, exceeding our revenue and earnings expectations as our growth momentum continues,” said Mike McMullen, Agilent president and CEO. “Our very strong growth is broad-based across all end-markets, geographies and business groups. These results reflect our relentless customer focus, innovative solutions, and excellent operational execution. Due to our strong-second quarter performance and expected continued momentum, we are raising our revenue and earnings outlook for the full year.

“We also welcomed the Resolution Bioscience team to Agilent in Q2, continuing our investment in high-growth markets as part of our ‘build and buy’ growth strategy.”

Financial Highlights

Life Sciences and Applied Markets Group

Second-quarter revenue of $674 million from Agilent’s Life Sciences and Applied Markets Group (LSAG) increased 28% year-over-year and was up 25% on a core(1) basis. LSAG’s operating margin was 22.9%.

Agilent CrossLab Group

Second-quarter revenue of $536 million from the Agilent CrossLab Group (ACG) increased 19% year-over-year and was up 15% on a core(1) basis. ACG’s operating margin was 26.3%.

Diagnostics and Genomics Group

Second-quarter revenue of $315 million from Agilent’s Diagnostics and Genomics Group (DGG) increased 20% year-over-year and was up 16% on a core(1) basis. DGG’s operating margin was 21.9%.

Full-Year and Third-Quarter Outlook

Agilent has increased its outlook and now expects revenue in the range of $6.15 billion to $6.21 billion for fiscal year 2021. Fiscal year 2021 non-GAAP(3) earnings guidance has also increased to a range of $4.09 to $4.14 per share.

Agilent expects third-quarter 2021 revenue in the range of $1.51 billion to $1.54 billion, with non-GAAP(3) earnings expected to be in the range of 97 to 99 cents per share.

The outlook is based on currency-exchange rates as of April 30, 2021.

Conference Call

Agilent’s management will present additional details regarding the company’s second-quarter 2021 financial results on a conference call with investors today at 1:30 p.m. PST. This event will be broadcast live online in listen-only mode. To listen to the webcast, select the “Q2 2021 Agilent Technologies Inc. Earnings Conference Call” link in the “News & Events -- Events” portion of the Investor Relations section of the Agilent website. The webcast will remain on the company site for 90 days.

About Agilent Technologies

Agilent Technologies Inc. (NYSE: A) is a global leader in life sciences, diagnostics, and applied chemical markets, delivering insight and innovation toward improving the quality of life. Agilent instruments, software, services, solutions, and people provide trusted answers to customers' most challenging questions. The company generated revenue of $5.34 billion in fiscal year 2020 and employs 16,400 people worldwide. Information about Agilent is available at www.agilent.com. To receive the latest Agilent news, please subscribe to the Agilent Newsroom. Follow Agilent on LinkedIn, Twitter, and Facebook.

Forward-Looking Statements

This news release contains forward-looking statements as defined in the Securities Exchange Act of 1934 and is subject to the safe harbors created therein. The forward-looking statements contained herein include, but are not limited to, information regarding Agilent’s growth prospects and strategy, business, financial results, revenue and non-GAAP earnings guidance for the third quarter and full fiscal year 2021 and future amortization of intangibles. These forward-looking statements involve risks and uncertainties that could cause Agilent’s results to differ materially from management’s current expectations. Such risks and uncertainties include, but are not limited to, unforeseen changes in the strength of Agilent’s customers’ businesses; unforeseen changes in the demand for current and new products, technologies, and services; unforeseen changes in the currency markets; customer purchasing decisions and timing, and the risk that Agilent is not able to realize the savings expected from integration and restructuring activities. In addition, other risks that Agilent faces in running its operations include the ability to execute successfully through business cycles; the ability to meet and achieve the benefits of its cost-reduction goals and otherwise successfully adapt its cost structures to continuing changes in business conditions; ongoing competitive, pricing and gross-margin pressures; the risk that its cost-cutting initiatives will impair its ability to develop products and remain competitive and to operate effectively; the impact of geopolitical uncertainties and global economic conditions on its operations, its markets and its ability to conduct business; the ability to improve asset performance to adapt to changes in demand; the ability of its supply chain to adapt to changes in demand; the ability to successfully introduce new products at the right time, price and mix; the ability of Agilent to successfully integrate recent acquisitions; the ability of Agilent to successfully comply with certain complex regulations; the adverse impacts of and risks posed by the COVID-19 pandemic and other risks detailed in Agilent’s filings with the Securities and Exchange Commission, including its quarterly report on Form 10-Q for the quarter ended January 31, 2021. Forward-looking statements are based on the beliefs and assumptions of Agilent’s management and on currently available information. Agilent undertakes no responsibility to publicly update or revise any forward-looking statement.

(1) Core revenue growth excludes the impact of currency and acquisitions and divestitures within the past 12 months. Core revenue is a non-GAAP measure. A reconciliation between Q2 FY21 GAAP revenue and core revenue is set forth on page 6 of the attached tables along with additional information regarding the use of this non-GAAP measure.

(2) Non-GAAP net income and non-GAAP earnings per share primarily exclude the impacts of non-cash asset impairments, intangibles amortization, transformational initiatives, acquisition and integration costs, loss on extinguishment of debt and business exit and divestiture costs. Agilent also excludes any tax benefits or expenses that are not directly related to ongoing operations and which are either isolated or are not expected to occur again with any regularity or predictability. A reconciliation between non-GAAP net income and GAAP net income is set forth on page 4 of the attached tables along with additional information regarding the use of this non-GAAP measure.

(3) Non-GAAP earnings per share as projected for Q3 FY21 and full fiscal year 2021 exclude primarily the impacts of non-cash intangibles amortization, transformational initiatives and acquisition and integration costs. Agilent also excludes any tax benefits or expenses that are not directly related to ongoing operations and which are either isolated or are not expected to occur again with any regularity or predictability. Most of these excluded amounts pertain to events that have not yet occurred and are not currently possible to estimate with a reasonable degree of accuracy and could differ materially. Therefore, no reconciliation to GAAP amounts has been provided. Future amortization of intangibles is expected to be approximately $49 million per quarter.

AGILENT TECHNOLOGIES, INC.
CONDENSED CONSOLIDATED STATEMENT OF OPERATIONS
(In millions, except per share amounts)
(Unaudited)
PRELIMINARY


Three Months Ended


Six Months Ended

April 30,


April 30,

2021


2020


2021


2020

 
Net revenue

$

1,525


$

1,238


$

3,073


$

2,595


Costs and expenses:
Cost of products and services


708


581


1,418


1,215


Research and development


109


197


212


301


Selling, general and administrative


420


358


827


762


Total costs and expenses


1,237


1,136


2,457


2,278


Income from operations


288


102


616


317


Interest income


1


3


1


6


Interest expense


(20

)


(20

)


(39

)


(40

)

Other income (expense), net


4


36


7


57


Income before taxes


273


121


585


340


Provision for income taxes


57


20


81


42


Net income

$

216


$

101


$

504


$

298


Net income per share:
Basic

$

0.71


$

0.33


$

1.65


$

0.96


Diluted

$

0.70


$

0.32


$

1.64


$

0.95


Weighted average shares used in computing net income per share:
Basic

304

309

305

310

Diluted


307


312


308


313


The preliminary income statement is estimated based on our current information.
 
 
Page 1
AGILENT TECHNOLOGIES, INC.
CONDENSED CONSOLIDATED BALANCE SHEET
(In millions, except par value and share amounts)
(Unaudited)
PRELIMINARY
 
 
April 30, October 31,

2021

2020

ASSETS
 
Current assets:
Cash and cash equivalents

$

1,380


$

1,441


Accounts receivable, net


1,075


1,038


Inventory


791


720


Other current assets


268


216


Total current assets


3,514


3,415


Property, plant and equipment, net


884


845


Goodwill and other intangible assets, net


5,059


4,433


Long-term investments


188


158


Other assets


753


776


Total assets

$

10,398


$

9,627


LIABILITIES AND EQUITY
 
Current liabilities:
Accounts payable

$

423


$

354


Employee compensation and benefits


386


367


Deferred revenue


429


386


Short-term debt


205


75


Other accrued liabilities


315


285


Total current liabilities


1,758


1,467


Long-term debt


2,727


2,284


Retirement and post-retirement benefits


377


389


Other long-term liabilities


726


614


Total liabilities


5,588


4,754


Total Equity:
Stockholders' equity:
Preferred stock; $0.01 par value; 125 million shares authorized; none issued and outstanding


Common stock; $0.01 par value, 2 billion shares authorized; 303 million shares at April 30, 2021 and 306 million shares at October 31, 2020, issued and outstanding


3


3


Additional paid-in-capital


5,271


5,311


Retained earnings (accumulated deficit)


(12

)


81


Accumulated other comprehensive loss


(452

)


(522

)

Total stockholders' equity


4,810


4,873


Total liabilities and stockholders' equity

$

10,398


$

9,627


The preliminary balance sheet is estimated based on our current information.
 
 
Page 2
AGILENT TECHNOLOGIES, INC.
CONDENSED CONSOLIDATED STATEMENT OF CASH FLOWS
(In millions)
(Unaudited)
PRELIMINARY
 
 
Six Months Ended
April 30, April 30,

2021

2020

Cash flows from operating activities:
Net income

$

504


$

298


Adjustments to reconcile net income to net cash provided by operating activities:
Depreciation and amortization


153


155


Share-based compensation


66


44


Excess and obsolete inventory related charges


14


9


Loss on extinguishment of debt


17


Asset impairment charges


2


99


Unrealized gain on equity securities, net


(11

)


(27

)

Other non-cash expenses, net


2


3


Changes in assets and liabilities:
Accounts receivable, net


(17

)


25


Inventory


(80

)


(85

)

Accounts payable


51


(10

)

Employee compensation and benefits


(3

)


(50

)

Other assets and liabilities


12


(207

)

Net cash provided by operating activities (a)


710


254


Cash flows from investing activities:
Investments in property, plant and equipment


(72

)


(67

)

Acquisition of businesses and intangible assets, net of cash acquired


(547

)


Payment to acquire fair value investments


(8

)


(18

)

Payment in exchange for convertible note


(2

)


(3

)

Net cash used in investing activities


(629

)


(88

)

 
Cash flows from financing activities:
Issuance of common stock under employee stock plans


26


32


Payment of taxes related to net share settlement of equity awards


(73

)


(33

)

Issuance of senior notes


848


Debt issuance costs


(7

)


Payment of dividends


(118

)


(111

)

Repayment of senior notes


(417

)


Proceeds from commercial paper


1,232


Repayment of commercial paper


(1,102

)


Proceeds from credit facility


798


Repayment of credit facility


(713

)

Repayment of finance lease


(4

)

Treasury stock repurchases


(539

)


(186

)

Net cash used in financing activities


(150

)


(217

)

 
Effect of exchange rate movements


9


(8

)

 
Net decrease in cash, cash equivalents and restricted cash


(60

)


(59

)

 
Cash, cash equivalents and restricted cash at beginning of period


1,447


1,388


Cash, cash equivalents and restricted cash at end of period

$

1,387


$

1,329


Reconciliation of cash, cash equivalents and restricted cash to the condensed consolidated balance sheet:
 
Cash and cash equivalents

$

1,380


$

1,324


Restricted cash, included in other assets


7


5


Total cash, cash equivalents and restricted cash

$

1,387


$

1,329


(a) Cash payments included in operating activities:
 
Income tax payments (refunds), net

$

116


$

286


Interest payments

$

36


$

39


The preliminary cash flow is estimated based on our current information.
 
 
Page 3
AGILENT TECHNOLOGIES, INC.
NON-GAAP NET INCOME AND DILUTED EPS RECONCILIATIONS
(In millions, except per share amounts)
(Unaudited)
PRELIMINARY


Three Months Ended


Six Months Ended

April 30,


April 30,

2021

Diluted
EPS


2020

Diluted
EPS


2021

Diluted
EPS


2020

Diluted
EPS

 
GAAP net income

$

216


$

0.70


$

101


$

0.32


$

504


$

1.64


$

298


$

0.95


Non-GAAP adjustments:
Asset impairments


2


0.01


99


0.32


2


0.01


99


0.32


Intangible amortization


46


0.15


46


0.15


90


0.29


94


0.30


Transformational initiatives


9


0.03


15


0.05


20


0.06


28


0.09


Acquisition and integration costs


13


0.04


11


0.03


22


0.07


24


0.08


Loss on extinguishment of debt


12


0.04


17


0.06


Business exit and divestiture costs


3


0.01


4


0.01


Other


(8

)


(0.03

)


(29

)


(0.09

)


(5

)


(0.02

)


(23

)


(0.08

)

Adjustment for taxes (a)


6


0.02


(20

)


(0.07

)


(27

)


(0.09

)


(45

)


(0.14

)

Non-GAAP net income

$

299


$

0.97


$

223


$

0.71


$

627


$

2.03


$

475


$

1.52


(a) The adjustment for taxes excludes tax expense (benefits) that management believes are not directly related to ongoing operations and which are either isolated or cannot be expected to occur again with any regularity or predictability. For the three and six months ended April 30, 2021, management used a non-GAAP effective tax rate of 14.75%. For the three and six months ended April 30, 2020, management used a non-GAAP effective tax rate of 15.50%.
 
We provide non-GAAP net income and non-GAAP net income per share amounts in order to provide meaningful supplemental information regarding our operational performance and our prospects for the future. These supplemental measures exclude, among other things, charges related to asset impairments, amortization of intangibles, transformational initiatives, acquisition and integration costs, loss on extinguishment of debt and business exit and divestiture costs.
Asset impairments include assets that have been written down to their fair value.
Transformational initiatives include expenses associated with targeted cost reduction activities such as manufacturing transfers including costs to move manufacturing, small site consolidations, legal entity and other business reorganizations, insourcing or outsourcing of activities. Such costs may include move and relocation costs, one-time termination benefits and other one-time reorganization costs. Included in this category are also expenses associated with company programs to transform our product lifecycle management (PLM) system, human resources and financial systems.
Acquisition and integration costs include all incremental expenses incurred to effect a business combination. Such acquisition costs may include advisory, legal, accounting, valuation, and other professional or consulting fees. Such integration costs may include expenses directly related to integration of business and facility operations, the transfer of assets and intellectual property, information technology systems and infrastructure and other employee-related costs.
Loss on extinguishment of debt relates to the net loss recorded on the redemption of $100 million of the $400 million outstanding 3.2% 2022 senior notes due on October 1, 2022, called on December 22, 2020 and settled on January 21, 2021 and the net loss recorded on the redemption of the remaining $300 million called on March 5, 2021 and settled on April 5, 2021.
Business exit and divestiture costs include costs associated with business divestitures.
Other includes certain legal costs and settlements, net unrealized gains related to our equity securities and acceleration of share-based compensation expense in addition to other miscellaneous adjustments.
 
Our management uses non-GAAP measures to evaluate the performance of our core businesses, to estimate future core performance and to compensate employees. Since management finds this measure to be useful, we believe that our investors benefit from seeing our results “through the eyes” of management in addition to seeing our GAAP results. This information facilitates our management’s internal comparisons to our historical operating results as well as to the operating results of our competitors.
 
Our management recognizes that items such as amortization of intangibles can have a material impact on our cash flows and/or our net income. Our GAAP financial statements including our statement of cash flows portray those effects. Although we believe it is useful for investors to see core performance free of special items, investors should understand that the excluded items are actual expenses that may impact the cash available to us for other uses. To gain a complete picture of all effects on the company’s profit and loss from any and all events, management does (and investors should) rely upon the GAAP income statement. The non-GAAP numbers focus instead upon the core business of the company, which is only a subset, albeit a critical one, of the company’s performance.
 
Readers are reminded that non-GAAP numbers are merely a supplement to, and not a replacement for, GAAP financial measures. They should be read in conjunction with the GAAP financial measures. It should be noted as well that our non-GAAP information may be different from the non-GAAP information provided by other companies.
 
The preliminary non-GAAP net income and diluted EPS reconciliation is estimated based on our current information.
 
Page 4
AGILENT TECHNOLOGIES, INC.
SEGMENT INFORMATION
(In millions, except where noted)
(Unaudited)
PRELIMINARY
 
 
Quarter-over-Quarter
 
Life Sciences and Applied Markets Group
Q2'21 Q2'20
Revenue

$

674


$

526


Gross Margin, %


59.4

%


58.1

%

Income from Operations

$

154


$

98


Operating margin, %


22.9

%


18.7

%


Diagnostics and Genomics Group
Q2'21 Q2'20
Revenue

$

315


$

263


Gross Margin, %


53.4

%


55.1

%

Income from Operations

$

69


$

57


Operating margin, %


21.9

%


21.6

%


Agilent CrossLab Group
Q2'21 Q2'20
Revenue

$

536


$

449


Gross Margin, %


51.6

%


52.5

%

Income from Operations

$

141


$

122


Operating margin, %


26.3

%


27.2

%


Income from operations reflect the results of our reportable segments under Agilent's management reporting system which are not necessarily in conformity with GAAP financial measures. Income from operations of our reporting segments exclude, among other things, charges related to asset impairments, amortization of intangibles, transformational initiatives, acquisition and integration costs and business exit and divestiture costs.
 
Readers are reminded that non-GAAP numbers are merely a supplement to, and not a replacement for, GAAP financial measures. They should be read in conjunction with the GAAP financial measures. It should be noted as well that our non-GAAP information may be different from the non-GAAP information provided by other companies.
 
The preliminary segment information is estimated based on our current information.
 
 
Page 5
AGILENT TECHNOLOGIES, INC.
RECONCILIATIONS OF REVENUE BY SEGMENT
EXCLUDING ACQUISITIONS, DIVESTITURES AND THE IMPACT OF CURRENCY ADJUSTMENTS (CORE)
(in millions)
(Unaudited)
PRELIMINARY
 
Year-over-Year
 
GAAP
Year-over-Year
GAAP Revenue by Segment Q2'21 Q2'20 % Change
 
Life Sciences and Applied Markets Group

$

674

$

526

28%

Diagnostics and Genomics Group


315


263

20%

Agilent CrossLab Group


536


449

19%

Agilent

$

1,525

$

1,238

23%


Non-GAAP
(excluding Acquisitions & Divestitures)
Year-over-Year
at Constant Currency (a)
Year-over-Year Year-over-Year Percentage Point Impact from Currency Current Quarter Currency
Impact (b)
Non GAAP Revenue by Segment Q2'21 Q2'20 % Change % Change
 
Life Sciences and Applied Markets Group

$

674

$

526

28%

25%

3 ppts

$

18


Diagnostics and Genomics Group


315


263

20%

16%

4 ppts


9


Agilent CrossLab Group


536


449

19%

15%

4 ppts


21


Agilent (Core)

$

1,525

$

1,238

23%

19%

4 ppts

$

48


We compare the year-over-year change in revenue excluding the effect of recent acquisitions and divestitures and foreign currency rate fluctuations to assess the performance of our underlying business.
 
(a) The constant currency year-over-year growth percentage is calculated by recalculating all periods in the comparison period at the foreign currency exchange rates used for accounting during the last month of the current quarter and then using those revised values to calculate the year-over-year percentage change.
 
(b) The dollar impact from the current quarter currency impact is equal to the total year-over-year dollar change less the constant currency year-over-year change.
 
The preliminary reconciliation of GAAP revenue adjusted for recent acquisitions and divestitures and impact of currency is estimated based on our current information.
 
 
Page 6


Contacts

Investor Contact:
Ruben DiRado
+1 408-345-8971
This email address is being protected from spambots. You need JavaScript enabled to view it.

Media Contact:
Tom Beermann
+1 408-553-2914
This email address is being protected from spambots. You need JavaScript enabled to view it.

Six Out of Seven Government Approvals Have Been Obtained

ORANGE, Conn.--(BUSINESS WIRE)--AVANGRID, Inc. (NYSE: AGR), a leading sustainable energy company, announced today that it has received Nuclear Regulatory Commission (NRC) approval for its proposed PNM Resources, Inc. (NYSE: PNMR) merger. NRC approval represents the sixth governmental approval. The only remaining approval is from the New Mexico Public Regulation Commission (NMPRC). The other governmental entities that have approved the merger are:


  • Hart-Scott-Rodino Antitrust Clearance – January 20, 2021
  • Committee on Foreign Investment – February 1, 2021
  • Federal Communications Commission – March 10, 2021
  • Federal Energy Regulatory Commission – April 20, 2021
  • Public Utility Commission of Texas – May 13, 2021

“This merger brings many benefits to customers and communities in New Mexico and we are encouraged by the continued approvals,” said Dennis V. Arriola, CEO of AVANGRID. “We look forward to working with PNM and the people of New Mexico to spur economic growth and accelerate the clean energy transformation.”

To date, a majority of the parties (thirteen in total) that have intervened in the NMPRC proceeding have either signed or are seeking to add their signatures to the stipulation filed to resolve the issues in the NMPRC proceeding. The customer benefits in the stipulation include:

  • $50 million in customer rate credits over three years;
  • $6 million in COVID arrearages relief for customers;
  • $15 million for low-income customer energy-efficiency assistance; and
  • $2 million to bring electricity to low-income, remote customers.

The stipulation includes additional economic development for New Mexico:

  • 150 new full-time jobs over three years that will remain no less than five years thereafter;
  • $7.5 million in additional economic development funds;
  • $12.5 million in economic development contributions to community groups in the Four Corners region over five years ($2.5 million/year);
  • Improvements to the energy transition displaced worker assistance fund relating to the closure of the San Juan Generating Station; and
  • Free access to streetlighting poles for local governments for wireless internet access for 3 years.

The NMPRC hearing examiner is expected to hold a conference among parties on May 28.

About AVANGRID: AVANGRID, Inc. (NYSE: AGR) aspires to be the leading sustainable energy company in the United States. Headquartered in Orange, CT with approximately $38 billion in assets and operations in 24 U.S. states, AVANGRID has two primary lines of business: Avangrid Networks and Avangrid Renewables. Avangrid Networks owns and operates eight electric and natural gas utilities, serving more than 3.3 million customers in New York and New England. Avangrid Renewables owns and operates a portfolio of renewable energy generation facilities across the United States. AVANGRID employs approximately 7,000 people and has been recognized by Forbes and Just Capital as one of the 2021 JUST 100 companies – a list of America’s best corporate citizens – and was ranked number one within the utility sector for its commitment to the environment and the communities it serves. The company supports the U.N.’s Sustainable Development Goals and was named among the World’s Most Ethical Companies in 2021 for the third consecutive year by the Ethisphere Institute. For more information, visit www.avangrid.com.

Forward-Looking Statements

Certain statements made in this press release for AVANGRID that relate to future events or expectations, developments, projections, estimates, intentions, goals, targets, and strategies are made pursuant to the Private Securities Litigation Reform Act of 1995. All statements contained in this Press Release that do not relate to matters of historical fact should be considered forward-looking statements, and are generally identified by words such as “may,” “will,” “would,” “can,” “expect(s),” “intend(s),” “anticipate(s),” “estimate(s),” “believe(s),” “future,” “could,” “should,” “plan(s),” “aim(s),” “assume(s)”, “project(s)”, “target(s)”), “forecast(s)”, “seek(s)” and or the negative of such terms or other variations on such terms, comparable terminology or similar expressions. These forward-looking statements generally include statements regarding the potential transaction between AVANGRID and PNM Resources, including any statements regarding the expected timetable for completing the potential merger, the ability to complete the potential merger, the expected benefits of the potential merger, projected financial information, future opportunities, and any other statements regarding AVANGRID’s and PNM Resources’ future expectations, beliefs, plans, objectives, results of operations, financial condition and cash flows, or future events or performance. Readers are cautioned that all forward-looking statements are based upon current reasonable beliefs, expectations and assumptions. AVANGRID assumes any obligation to update this information. Because actual results may differ materially from those expressed or implied by these forward-looking statements, AVANGRID cautions readers not to place undue reliance on these statements.

AVANGRID’s business, financial condition, cash flow, and operating results are influenced by many factors, which are often beyond its control, that can cause actual results to differ from those expressed or implied by the forward-looking statements. For a discussion of risk factors and other important factors affecting forward-looking statements, please see AVANGRID’s Form 10-K and Form 10-Q filings and the information filed on Avangrid’s Forms 8-K with the Securities and Exchange Commission (the “SEC”) as well as its subsequent SEC filings, and the risks and uncertainties related to the proposed merger with PNM Resources, including, but not limited to: the expected timing and likelihood of completion of the pending merger, including the timing, receipt and terms and conditions of any required governmental and regulatory approvals of the pending merger that could reduce anticipated benefits or cause the parties to abandon the transaction, the failure by AVANGRID to obtain the necessary financing arrangement set forth in commitment letter received in connection with the Merger, the occurrence of any event, change or other circumstances that could give rise to the termination of the merger agreement, the risk that the parties may not be able to satisfy the conditions to the proposed Merger in a timely manner or at all, risks related to disruption of management time from ongoing business operations due to the proposed Merger, and the risk that the proposed transaction and its announcement could have an adverse effect on the ability of PNM Resources to retain and hire key personnel and maintain relationships with its customers and suppliers, and on its operating results and businesses generally. Other unpredictable or unknown factors not discussed in this communication could also have material adverse effects on forward looking statements. Readers are cautioned not to place undue reliance on these forward-looking statements that speak only as of the date hereof.


Contacts

Media:
Joanie Griffin, 505-261-4444
This email address is being protected from spambots. You need JavaScript enabled to view it.
Athena Hernandez, 203-231-2146
This email address is being protected from spambots. You need JavaScript enabled to view it.

Investors:
Patricia Cosgel, 203-499-2624
This email address is being protected from spambots. You need JavaScript enabled to view it.

DAVIDSON, N.C.--(BUSINESS WIRE)--Curtiss-Wright Corporation (NYSE: CW) today announced that it has been awarded contracts valued in excess of $130 million to provide propulsion valves, pumps and advanced instrumentation and control systems for the U.S. Navy’s Virginia-class nuclear powered attack submarine, Columbia-class submarine and Ford-class aircraft carrier programs. The awards were received from Bechtel Plant Machinery, Inc. (BPMI) and General Dynamics Electric Boat to support ship construction, spare parts and submarine back-fit procurements.


“Curtiss-Wright is pleased to have been awarded these important naval defense contracts, building upon our long-standing relationship with the U.S. Nuclear Navy and reflecting our ongoing support of these critical naval defense platforms, which continue to receive strong Congressional support,” said Lynn M. Bamford, President and CEO of Curtiss-Wright Corporation. “We look forward to delivering the most advanced, reliable and vital technologies and remain well-positioned to benefit from the continued expansion of our U.S. naval fleet.”

Curtiss-Wright is performing this work at its facilities in New York and Pennsylvania within the Company’s Defense Electronics and Naval & Power Segments. Engineering and manufacturing have commenced and will continue through 2025.

For over 60 years, Curtiss-Wright has ensured safe, reliable operations by supplying innovative, high-performance products for every nuclear submarine and aircraft carrier commissioned by the U.S. Navy. In addition, Curtiss-Wright technologies, such as power-dense motors and enhanced valve designs, enable more efficient operations, reduce manpower and cost, and increase safety. For more information on Curtiss-Wright’s Defense Electronics Segment and Naval & Power Segment products for the U.S. Navy, please visit www.cwdefense.com or www.curtisswright.com/organization/naval-power/, respectively.

About Curtiss-Wright Corporation

Curtiss-Wright Corporation (NYSE:CW) is a global innovative company that delivers highly engineered, critical function products and services to the commercial, industrial, defense and energy markets. Building on the heritage of Glenn Curtiss and the Wright brothers, Curtiss-Wright has a long tradition of providing reliable solutions through trusted customer relationships. The company employs approximately 8,200 people worldwide. For more information, visit www.curtisswright.com.

This press release contains forward-looking statements made pursuant to the Safe Harbor provisions of the Private Securities Litigation Reform Act of 1995. Such statements, including statements relating to Curtiss-Wright Corporation's expectations of future performance of our pump and valve products, the continued relationship with an existing customer, the continued funding of these programs by the U.S. Navy, the successful implementation of our products into these naval defense programs, the overall success of these naval defense programs and future opportunities associated with these programs, are not considered historical facts and are considered forward-looking statements under the federal securities laws. Such forward-looking statements are subject to certain risks and uncertainties that could cause actual results to differ materially from those expressed or implied. Readers are cautioned not to place undue reliance on these forward-looking statements, which speak only as of the date hereof. Such risks and uncertainties include, but are not limited to: a reduction in anticipated orders; an economic downturn; changes in competitive marketplace and/or customer requirements; a change in US and Foreign government spending; an inability to perform customer contracts at anticipated cost levels; and other factors that generally affect the business of aerospace, defense contracting, marine, electronics and industrial companies. Please refer to the Company's current SEC filings under the Securities Exchange Act of 1934, as amended, for further information.


Contacts

Jim Ryan
(704) 869-4621
This email address is being protected from spambots. You need JavaScript enabled to view it.

Offshore Source Logo

Offshore Source keeps you updated with relevant information concerning the Offshore Energy Sector.

Any views or opinions represented on this website belong solely to the author and do not represent those of the people, institutions or organizations that Offshore Source or collaborators may or may not have been associated with in a professional or personal capacity, unless explicitly stated.

Corporate Offices

Technology Systems Corporation
8502 SW Kansas Ave
Stuart, FL 34997

info@tscpublishing.com