Business Wire News

HOUSTON--(BUSINESS WIRE)--Consolidated Asset Management Services (CAMS), a fully-integrated service provider for owners of energy and infrastructure assets, announced today that it has been awarded contracts by affiliates of ArcLight Capital Partners, LLC (ArcLight) to provide operations and maintenance (O&M) and asset management services for power generating assets representing over 10 gigawatts (GW) of capacity.


The facilities are well diversified across markets, technology and fuel type and will allow for the integration of intermittent renewable resources over the coming years.

“We are excited to manage and operate this fleet of energy assets that provide reliable power throughout the U.S.,” said CAMS Chief Operating Officer Greg Bobrow. “We have an extensive and successful track record of providing sustainable, value-added services for owners of energy infrastructure assets and are pleased to be involved with these portfolios that also have the ability to support the transition to renewable sources of generation.”

ArcLight is a leading private equity firm focused on energy and energy transition infrastructure. An ArcLight spokesperson noted that the acquisitions of the portfolios required a collaborative effort and were substantial milestones for ArcLight and CAMS.

“We want to highlight the support, leadership and coordination the CAMS team provided through each phase of the process,” the spokesperson said. “From due diligence to the early stages of our ownership, CAMS has been helpful, responsive and very strong on the transition and operational leadership. CAMS was a critical team member in successfully completing these acquisitions.”

CAMS has experience managing and operating hundreds of conventional and renewable power generation assets with over 51 GW of generating capacity. The company has been awarded 75 industry best practice awards since 2013 and has $20 billion of assets under management.

About CAMS

CAMS is a privately held company providing Operations and Maintenance (O&M), Asset Management, Environmental, Social, and Governance (ESG), and Optimization services for energy and infrastructure assets. Our founding principle is to add value through superior management and operation of our clients’ energy infrastructure assets. To this end, we empower our employees to pursue creative and sustainable business practices in the field and at our corporate office that contribute to operational excellence, financial performance, a safe workplace, and a better community and environment. We do not take this responsibility lightly: We treat the assets with which we are entrusted as our own. For additional information, visit www.camstex.com.


Contacts

Corporate Communications
Deanna Werner
713.358.9736 | This email address is being protected from spambots. You need JavaScript enabled to view it.

This year’s Symposium is a forum to learn from those paving the way for the continued viability of nuclear power through work digitalization

SAN FRANCISCO--(BUSINESS WIRE)--NextAxiom, the creator of technology enabling digitalization of all work performed within an organization, will host the inaugural Dynamic Work Execution Symposium at The Cosmopolitan in Las Vegas from March 31-April 1.


The majority of Symposium participants will be from the nuclear industry, where modernization of plant operations is business critical and application of the significant advancements to maximize the operational efficiencies and reduce costs through technology is driving change. Attendees, spanning Department of Energy researchers to heads of business and IT from some of the country’s largest nuclear operators, will gather to collaborate on how technology is being used to ensure the continued viability of nuclear power through the digitalization of work with computer-guided instructions, forms, and workflows.

Presenters from nuclear organizations will share first-hand experiences on the benefits, business justification, and lessons learned from the implementation of innovative technologies – such as Dynamic Instructions (formerly known as Computer based Procedures) and Integrated Smart Forms – to help guide attendees forward and make work digitalization a reality across the entire industry.

Session topics include:

  • Innovation and Digital Transformation for Sustainable Operations
  • End State and Business Case for Work Digitalization
  • Implementation Experiences: multiple utilities will discuss their Business Cases, Implementation Approaches, Lessons Learned and Next Steps
  • Panel discussion on Approaches, Options and Trade-Offs
  • Transitioning from Paper-Centric to a Digitalized Paradigm
  • The Scope and Components of Dynamic Work Digitalization
  • The Art of the Possible

“Collaboration is strong within the nuclear industry and learning from each other is essential as we collectively work to solve challenges that hold the sector back from its full potential,” said Ash Massoudi, CEO and co-founder of NextAxiom. “We are excited to be able to finally gather again in-person and continue propelling the industry forward so nuclear can expand its role in the clean energy mix as a viable and reliable source of power.”

The intention for this year’s Symposium is to serve as the charter for a Special Interest Group (SIG) focused on Dynamic Work Execution that is managed by the Nuclear Industry Peers themselves. A leading nuclear energy facility operator has already signed on to host the 2023 Dynamic Work Execution Symposium.

To learn more and register for the 2022 Symposium, please visit here soon as space is limited: https://nextaxiom.com/symposium.

About NextAxiom

NextAxiom is a proven leader in nuclear with over a decade of experience enabling operators to increase profitability, streamline operations, and expand the industry’s carbon-free energy contributions. Its flagship software technology, the Dynamic Work Execution Platform (DWEP), transforms nuclear plant paper and legacy processes into digitalized work processes to support improved performance, decrease production costs, and make nuclear power more profitable to produce. With DWEP, nuclear plants realize reduced labor costs and time spent per process, enhanced data, predictive insights, automated and actionable intelligence, and more. To learn more about how NextAxiom makes Digitalized Work a reality and transforms how all work is performed, go to https://nextaxiom.com/.


Contacts

Media:
Katie Conroy
This email address is being protected from spambots. You need JavaScript enabled to view it.

Export Development Canada, Royal Bank of Canada and The Toronto-Dominion Bank join Evok Innovations’ second fund as limited partners (LPs) alongside returning LPs Suncor Energy and Cenovus Energy


VANCOUVER, British Columbia--(BUSINESS WIRE)--Evok Innovations (Evok), a venture firm committed to developing and deploying cutting-edge clean energy technology, today announced a first close of its $300 million Fund II, with half the capital committed by a group of strategic investors.

Fund II includes significant participation by Export Development Canada (EDC), Royal Bank of Canada (RBC) and The Toronto-Dominion Bank (TD), alongside returning investors Suncor and Cenovus.

The fund will target early-stage investments across North America in key industrial decarbonization verticals, including carbon capture use and storage (CCUS), low-carbon fuels, clean energy and grid innovations, mobility, and advanced materials and circularity.

Launched in 2016 through a partnership between Suncor, Cenovus and the BC Cleantech CEO Alliance, Evok’s inaugural $100 million CAD fund aimed to accelerate the development of critical energy transition technologies across North America. The fund has made 16 investments in critical decarbonization technologies ranging from clean hydrogen and carbon-to-value to long-duration energy storage.

“We are pleased to have our founding investors returning to participate in our second fund, which we see as a testament to our approach and their confidence in our ability to drive large-scale industrial decarbonization while generating market-leading returns,” said Marty Reed, Founding Partner of Evok. “Alongside our returning investors, the addition of EDC, RBC and TD will bring new strategic strength to our fund.”

Many of Evok’s portfolio companies from the first fund have been recognized for their impact. One such example is Twelve, an innovative company developing carbon transformation technologies. Twelve was recently named one of Fast Company’s three most innovative companies in the world, and the first in the energy sector. Several companies in the portfolio, including Twelve and Quidnet Energy, a long-duration energy storage company, have recently signed major commercial contracts that signal strong market demand for viable decarbonization solutions.

Evok Fund II is led by Mike Biddle, Naynika Chaubey, Jane Kearns and Marty Reed, entrepreneurs and climate investors with decades of experience scaling cleantech companies.

“As a founding partner of Evok Fund I, Suncor is pleased to continue working alongside Cenovus on our joint commitment to fund innovation in the low carbon technology space,” said Kris Smith, Executive Vice President - Downstream, Suncor. “Major drivers of Evok’s success to date include their leadership’s experience in low carbon technology, their ability to collaborate with industry, and their capacity to partner closely with founders as they de-risk and scale their technologies.”

To date, Evok’s portfolio companies have raised more than $500 million CAD to scale and commercialize their technologies, from investors including Breakthrough Energy Ventures, Microsoft, OGCI, Capricorn, MIT’s The Engine, and DCVC.

“Evok’s team has the technical expertise and network to scale-up the development of technologies supporting the energy transition across North America,” said Carl Burlock, EDC’s Executive Vice-President and Chief Business Officer. “EDC is pleased to be a major investor in this fund as part of our climate change commitments to support technologies which will reduce carbon emissions.”

About Evok Innovations

Founded in 2016, Evok Innovations (Evok) was built around a mission of protecting the environment and strengthening the economy. Driven by global momentum toward a net zero future, Evok has established itself as a leader in industrial innovation and decarbonization, including next-generation sectors such as hydrogen and carbon capture.

Building on our legacy, Evok continues to accelerate the energy transition with our team of technologists, company builders and investors. Please visit evokinnovations.com.

About EDC

Export Development Canada (EDC) is a financial Crown corporation dedicated to helping Canadian companies of all sizes succeed on the world stage. As international risk experts, we equip Canadian companies with the tools they need – the trade knowledge, financing solutions, equity, insurance, and connections – to grow their business with confidence. Underlying all our support is a commitment to sustainable and responsible business.

For more information and to learn how we can help your company please visit edc.ca.

About Royal Bank of Canada

Royal Bank of Canada is a global financial institution with a purpose-driven, principles-led approach to delivering leading performance. Our success comes from the 88,000+ employees who leverage their imaginations and insights to bring our vision, values and strategy to life so we can help our clients thrive and communities prosper. As Canada's biggest bank, and one of the largest in the world based on market capitalization, we have a diversified business model with a focus on innovation and providing exceptional experiences to our 17 million clients in Canada, the U.S. and 27 other countries. Learn more at rbc.com.

We are proud to support a broad range of community initiatives through donations, community investments and employee volunteer activities. See how at rbc.com/community-social-impact/.

About TD Bank Group

The Toronto-Dominion Bank and its subsidiaries are collectively known as TD Bank Group ("TD" or the "Bank"). TD is the fifth largest bank in North America by assets and serves more than 26 million customers in three key businesses operating in a number of locations in financial centers around the globe: Canadian Retail, including TD Canada Trust, TD Auto Finance Canada, TD Wealth (Canada), TD Direct Investing, and TD Insurance; U.S. Retail, including TD Bank, America's Most Convenient Bank®, TD Auto Finance U.S., TD Wealth (U.S.), and an investment in The Charles Schwab Corporation; and Wholesale Banking, including TD Securities. TD also ranks among the world's leading online financial services firms, with more than 15 million active online and mobile customers. TD had CDN$1.8 trillion in assets on January 31, 2022. The Toronto-Dominion Bank trades under the symbol "TD" on the Toronto and New York Stock Exchanges. For more information, please visit td.com.

About Cenovus Energy

Cenovus Energy Inc. is an integrated energy company with oil and natural gas production operations in Canada and the Asia Pacific region, and upgrading, refining and marketing operations in Canada and the United States. The company is focused on managing its assets in a safe, innovative and cost-efficient manner, integrating environmental, social and governance considerations into its business plans. Cenovus common shares and warrants are listed on the Toronto and New York stock exchanges, and the company’s preferred shares are listed on the Toronto Stock Exchange. For more information, please visit cenovus.com.

About Suncor Energy

Suncor Energy is Canada’s leading integrated energy company. Suncor’s operations include oil sands development. production and upgrading, offshore oil and gas production, petroleum refining in Canada and the U.S. and the company’s Petro‑Canada retail and wholesale distribution networks, including Canada’s Electric Highway, a coast-to-coast network of fast-charging EV stations. Suncor is developing petroleum resources while advancing the transition to a low-emissions future through investment in power, renewable fuels and hydrogen. Suncor also conducts energy trading activities focused principally on the marketing and trading of crude oil, natural gas, byproducts, refined products and power. Suncor has been recognized for its performance and transparent reporting on the Dow Jones Sustainability index, FTSE4Good and CDP.

Suncor’s common shares (symbol: SU) are listed on the Toronto and New York stock exchanges.

For more information, please visit suncor.com.


Contacts

Mark Firmani
This email address is being protected from spambots. You need JavaScript enabled to view it.

HOUSTON--(BUSINESS WIRE)--Permianville Royalty Trust (NYSE: PVL) (the “Trust”) today announced that its Annual Report on Form 10-K for the year ended December 31, 2021 was with the SEC on March 25, 2022. The Annual Report on Form 10-K is available in the “SEC Filings” section of the Trust’s website at www.permianvilleroyaltytrust.com, as well as on the SEC’s website at www.sec.gov. Trust unitholders have the ability to request a printed copy of the Annual Report on Form 10-K, which contains the Trust’s audited financial statements, free of charge (via first class mail) by sending a written request to Permianville Royalty Trust, The Bank of New York Mellon Trust Company, N.A., 601 Travis Street, 16th Floor, Houston, TX 77002.


Contacts

Permianville Royalty Trust
The Bank of New York Mellon Trust Company, N.A., as Trustee
Sarah Newell 1 (512) 236-6555

NEW YORK--(BUSINESS WIRE)--Today, Capgemini announced a multi-year-long engagement with Wharton’s Venture Lab to identify and mitigate energy transition and sustainability challenges as part of the Snider Consulting Center. This initiative brings together undergraduate and graduate students at the University of Pennsylvania with experts from Capgemini’s Energy and Utilities unit. The groups will explore sustainability solutions across cloud technology, analytics, and intelligent operations and how to expand greenhouse gas reduction initiatives.


Capgemini’s work with Snider Consulting marks the first engagement with Wharton’s entrepreneurship center. As part of the collaboration, students will work with Capgemini solution architects to identify sustainability challenges across numerous global organizations and create a supporting solutions roadmap based on interviews with Penn alumni and Capgemini clients. The joint roadmap will outline approaches to improving data in sustainability reporting, operationalizing IT, and enhancing cybersecurity measures in shared energy grids through IoT, AI, and cloud technology.

As the entrepreneurship and innovation hub for the University of Pennsylvania, we are excited to share our knowledge, skills, and entrepreneurial spirit with Capgemini,” said Trang Pham, Executive Director at Venture Lab.Our engagement with Capgemini will allow our students to join the global race to create green business practices, and opens the door to new sustainability programs and partners. We look forward to this collaboration and moving towards a more sustainable future for all.”

Venture Lab is the entrepreneurship center at the Wharton School that serves all students and alumni across the University of Pennsylvania who are interested in entrepreneurship and innovation. It provides entrepreneurial tools, programs, and funding to turn innovative concepts into scalable, sustainable businesses and brings entrepreneurial development to existing companies. Snider Consulting offers students the opportunity to build their consulting skillset through engagements supported by professional advising teams.

Capgemini is proud to work with Venture Lab as we look at shaping the next chapter of sustainability and energy transition initiatives. This engagement has great potential to provide insights on opportunities and priorities across the energy and utility sectors,” said Elfije Lemaitre, Head of Energy and Utilities at Capgemini Americas. “We are looking forward to implementing this knowledge exchange program with the staff and students at Wharton’s Venture Lab.”

About Capgemini

Capgemini is a global leader in partnering with companies to transform and manage their business by harnessing the power of technology. The Group is guided everyday by its purpose of unleashing human energy through technology for an inclusive and sustainable future. It is a responsible and diverse organization of over 325,000 team members in more than 50 countries. With its strong 55-year heritage and deep industry expertise, Capgemini is trusted by its clients to address the entire breadth of their business needs, from strategy and design to operations, fueled by the fast evolving and innovative world of cloud, data, AI, connectivity, software, digital engineering and platforms. The Group reported in 2021 global revenues of €18 billion.

Get The Future You Want | www.capgemini.com


Contacts

Elizabeth Renehan
Tel.: 203-803-9287
E-mail: This email address is being protected from spambots. You need JavaScript enabled to view it.

– Record full year revenue of $21.0 million, increased 131% year-over-year
– Record full year sales of 146 zero-emission vehicles, increased 103% year-over-year
– Record fourth quarter revenue of $4.2 million, increased 13% year-over-year
– Announced GM partnership to strengthen our chassis supply
– Announced today a partnership with Forest River for factory-certified Lightning repower powertrains supporting over 50,000 eligible Forest River Shuttle buses and Vans currently on the road

LOVELAND, Colo.--(BUSINESS WIRE)--Lightning eMotors, Inc. (“Lightning eMotors”, “Lightning”, or the “Company”), a leading provider of zero-emission powertrains and medium-duty and specialty commercial electric vehicles for fleets, today announced consolidated results for the fourth quarter and full year ending December 31, 2021.

“The fourth quarter capped a transformational year for Lightning, as we strengthened the company by announcing new strategic OEM partnerships, increasing our sales pipeline, expanding our factory capacity, shipping new products, and adding strong executives to the leadership team,” said Tim Reeser, CEO of Lightning eMotors. “We believe we have more zero-emission Class 3-6 commercial vehicles on the road than any other US OEM, as we continued to deliver vehicles under our key contracts with Forest River and Collins Bus, among others. We shipped our first Class A double deck motorcoach, which we announced as a new product in the fourth quarter. Recently we announced key partnerships with General Motors, CATL, and Winnebago. Further, we received our first orders for electric ambulances from our agreement with REV Group announced last year. The fact that so many industry-leading commercial vehicle OEMs are choosing to partner with us validates our model and product leadership position, and the repeat customer orders we are seeing from major fleets following initial evaluations speaks to their belief in our staying power.”

Reeser continued, “Actions we took last year to address supply chain challenges around battery supply have mitigated much of the risk we faced in 2021. Chassis supply chain uncertainties that started in the summer of 2021 remain and are a key challenge now in 2022. Our engineering and supply chain teams have again taken strategic actions to help mitigate this risk. We announced the development of our own Lightning eChassis, and we entered into a partnership with General Motors. These actions and partnerships should begin to alleviate chassis-related supply constraints later in 2022 and into 2023. Moreover, our team has directed additional resources toward repower opportunities, leading to the partnership we announced today with Forest River to provide factory-certified Lightning repower powertrains to support over 50,000 eligible Forest River Shuttles buses that are on the road today. We believe we are well positioned to capture many of the commercial vehicle EV repower opportunities that have sprung up with the lack of available new commercial vehicle chassis. Lightning is the only OEM today to offer powertrains to replace ICE and EV powertrains in school buses, shuttle buses, transit buses, and motorcoaches.”

Key Company Highlights

We continue to develop relationships and partnerships with leading vocational vehicle OEMs and suppliers:

Lightning eMotors is a leading zero-emission commercial fleet vehicle and powertrain manufacturer, with over 1.3 million miles of zero-emission commercial vehicle road experience. Lightning provides zero-emission solutions (both Battery Electric and Fuel Cell Electric) for commercial fleets, including Class 3-5 cargo and passenger vehicles, school buses, Class 5-6 work trucks, and Class 7 city buses and motorcoaches. Lightning eMotors’ ongoing focus has been on providing a broad range of premium zero-emission vehicle and powertrain platforms and charging solutions to help fleets reduce emissions, improve energy efficiency, and lower costs.

Fourth Quarter 2021 Financial Results

Fourth quarter revenue was $4.2 million, compared to $3.7 million for the prior-year period, an increase of 13% year-over-year.

Net income was $22.2 million, compared to net loss of $13.4 million during the prior year. The change in net income was primarily due to a $40.0 million gain from the non-cash change in the fair value of the earnout liability. Diluted net earnings per share was $0.28, compared to a loss of $0.42 in the prior-year period.

Adjusted EBITDA was -$15.9 million, compared to -$5.1 million during the same period in the prior year. Adjusted net loss was $20.0 million, compared to $6.9 million during the same period in the prior year. Adjusted EBITDA and adjusted net loss are non-GAAP measures. See explanatory language and reconciliation to the GAAP measures below.

2021 Annual Financial Results

Revenue was $21.0 million in 2021, compared to $9.1 million in 2020, an increase of 131% year-over-year.

Net loss was $100.8 million, compared to net loss of $37.7 million during the prior year. Basic and diluted net loss per share were $1.67, compared to $1.25 in the prior-year period.

Adjusted EBITDA was -$38.8 million, compared to -$13.2 million during the prior year. Adjusted net loss was $53.0 million, compared to $16.5 million in 2020.

We ended the quarter with $168.5 million in cash and cash equivalents on the balance sheet.

The Q4 and full year information reflects our preliminary unaudited results and is based on the information available as of the date of this announcement. The audit may require adjustments which could result in changes to the Company’s unaudited financial results included in this press release.

Order Backlog and Awarded Orders

As of March 14, 2022, the Company had an order backlog—including full vehicles, powertrain systems to be sold directly to customers, and charging systems—of approximately 1,500 units valued at $169.3 million.

The Company’s sales pipeline remains strong at $1.5 billion and is expected to grow further due to strengthening forces driving commercial fleet electrification and a larger sales force. We expect the 2021 Federal Infrastructure Bill funding programs to begin to solidify over the next two quarters, resulting in over $10 billion in new funding for medium and heavy duty commercial electric vehicles, driving customer demand for Lightning products and services.

Guidance

We continue to experience supply chain challenges involving chassis and other key components. Delays associated with any of these components may impact the timing of revenue. Fortunately, our customers remain supportive, and we have not seen any order cancellations due to delivery timing. Based on current business conditions, the Company expects:

  • First quarter revenue to be in the range of $5.0 million to $6.0 million. Approximately $7 million of potential Q1 revenue has been pushed into future quarters due to supply constraints, principally chassis.
  • First quarter vehicle and powertrain sales to be in the range of 65 units to 75 units
  • First quarter adjusted EBITDA to be in the range of -$15 million to -$17 million
  • Quarterly revenue to grow sequentially throughout 2022 as supply chain issues are managed and incremental revenue is realized from non-chassis-dependent products such as repowers and Lightning Energy

Webcast and Conference Call Information

Company management will host a webcast and conference call on March 28, 2022, at 4:30 p.m. Eastern Time, to discuss the Company's financial results.

Interested investors and other parties can listen to a webcast of the live conference call and access the Company’s fourth quarter update presentation by logging onto the Investor Relations section of the Company's website at https://ir.lightningemotors.com/.

The conference call can be accessed live over the phone by dialing 1-877-407-6910 (domestic) or +1-201-689-8731 (international).

About Lightning eMotors

Lightning eMotors has been providing specialized and sustainable fleet solutions since 2009, deploying complete zero emission vehicle solutions for commercial fleets since 2018 – including Class 3 cargo and passenger vans and ambulances, Class 4 and 5 cargo vans and shuttle buses, Class 6 work trucks and school buses, Class 7 city buses, and Class A motorcoaches. The Lightning eMotors’ team designs, engineers, customizes, and manufactures ZEVs to support the wide array of fleet customer needs, with a full suite of control software, telematics, analytics, and charging solutions to simplify the buying and ownership experience and maximize uptime and energy efficiency. To learn more, visit https://lightningemotors.com.

Forward-Looking Statements

This press release contains forward-looking statements within the meaning of U.S. federal securities laws. Such forward-looking statements include, but are not limited to, statements regarding the financial statements of Lightning eMotors (including guidance), its product and customer developments, its expectations, hopes, beliefs, intentions, plans, prospects or strategies regarding the future revenues and expenses, its expectations regarding the availability and timing of components and supplies and the business plans of Lightning eMotors’ management team. Any statements contained herein that are not statements of historical fact may be deemed to be forward-looking statements. In addition, any statements that refer to projections, forecasts or other characterizations of future events or circumstances, including any underlying assumptions, are forward-looking statements. The words “anticipate,” “believe,” “continue,” “could,” “estimate,” “expect,” “intends,” “may,” “might,” “plan,” “possible,” “potential,” “predict,” “project,” “should,” “would” and similar expressions may identify forward-looking statements, but the absence of these words does not mean that a statement is not forward-looking. The forward-looking statements contained in this press release are based on certain assumptions and analyses made by the management of Lightning eMotors considering their respective experience and perception of historical trends, current conditions and expected future developments and their potential effects on Lightning eMotors as well as other factors they believe are appropriate in the circumstances. There can be no assurance that future developments affecting Lightning eMotors will be those anticipated. These forward-looking statements contained in this press release are subject to known and unknown risks, uncertainties, assumptions and other factors that may cause actual results or outcomes to be materially different from any future results or outcomes expressed or implied by the forward-looking statements. These risks, uncertainties, assumptions and other factors include, but are not limited to: (i) those related to our operations and business and financial performance; (ii) our ability to have access to an adequate supply of motors, chassis and other critical components for our vehicles on the timeline we expect (iii) our ability to attract and retain customers; (iv) backlog amounts and sales pipeline that may not result in actual revenue or be indicative of future revenues or sales; (v) our ability to up-sell and cross-sell to customers; (vi) the success of our customers' development programs which will drive future revenues; (vii) our ability to execute on our business strategy; (viii) our ability to compete effectively; (ix) our ability to manage growth, scale up infrastructure and manage increased headcount; (x) the ability of the Company to maintain the New York Stock Exchange’s listing standards, (xi) potential business and supply chain disruptions, including those related to physical security threats, information technology or cyber-attacks, epidemics, pandemics, sanctions, political unrest, war, terrorism or natural disasters; (xii) macroeconomic factors, including current global and regional market conditions, commodity prices, inflation and deflation; (xiii) federal, state, and local laws, regulations and government incentives, particularly those related to the commercial electric vehicle market; (xiv) the volatility in the price of our securities due to a variety of factors, including changes in the competitive industries in which the Company operates, variations in operating performance across competitors, changes in laws and regulations affecting the Company’s business and changes in the capital structure; (xv) planned and potential business or asset acquisitions or combinations; (xvi) the size and growth of the markets in which we operate; (xvii) the mix of products utilized by the Company’s customers and such customers’ needs for these products; (xviii) market acceptance of new product offerings; and (xix) our funding and liquidity plans. Moreover, we operate in a competitive and rapidly changing environment, and new risks may emerge from time to time. You should not put undue reliance on any forward-looking statements. Forward-looking statements should not be read as a guarantee of future performance or results and will not necessarily be accurate indications of the times at, or by, which such performance or results will be achieved, if at all. Should one or more of these risks or uncertainties materialize or should any of the assumptions being made prove incorrect, actual results may vary in material respects from those projected in these forward-looking statements. We undertake no obligation to update or revise any forward-looking statements, whether because of new information, future events or otherwise, except as may be required under applicable securities laws.

Lightning eMotors, Inc.

Consolidated Statements of Operations

(in thousands, except share and per share data)

(Unaudited)


Three Months Ended December 31,


Year Ended December 31,


2021


2020


2021


2020


Revenues


$

4,221


$

3,720


$

20,992


$

9,088


Cost of revenues


6,901


4,874


26,293


11,087


Gross loss


(2,680

)


(1,154

)


(5,301

)


(1,999

)

Operating expenses


Research and development


875


567


3,089


1,309


Selling, general and administrative


13,606


3,478


42,851


10,451


Total operating expenses


14,481


4,045


45,940


11,760


Loss from operations


(17,161

)


(5,199

)


(51,241

)


(13,759

)

Other (income) expense, net


Interest expense


3,833


1,741


13,367


2,983


Inducement expense


Loss from change in fair value of warrant liabilities


704


6,472


28,812


20,835


(Gain) loss from change in fair value of derivative liability


(3,949

)


5,341


(Gain) loss from change in fair value of earnout liability


(39,981

)


4,183


Gain on extinguishment of debt


(2,194

)


Other expense (income), net


46


(31

)


19


76


Total other (income) expense, net


(39,347

)


8,182


49,528


23,894


Net Income (Loss)


$

22,186


$

(13,381

)


$

(100,769

)


$

(37,653

)

Net income (loss) per share basic


$

0.30


$

(0.42

)


$

(1.67

)


$

(1.25

)

Net income (loss) per share diluted


$

0.28


$

(0.42

)


$

(1.67

)


$

(1.25

)

Weighted-average shares outstanding, basic


74,984,051


31,585,159


60,260,156


30,095,634


Weighted-average shares outstanding, diluted


78,311,597


31,585,159


60,260,156


30,095,634


Lightning eMotors, Inc.

Consolidated Balance Sheets

(in thousands, except shares)


December 31,


December 31,


2021


2020


Assets


Current assets


Cash and cash equivalents


$

168,538


$

460


Accounts receivable, net of allowance of $3,349 and $0 as of December 31, 2021 and 2020, respectively


9,172


4,122


Inventories


14,621


5,743


Prepaid expenses and other current assets


7,067


3,999


Total current assets


199,398


14,324


Property and equipment, net


4,891


2,615


Operating lease right-of-use asset, net


8,742


7,881


Other assets


379


45


Total assets


$

213,410


$

24,865


Liabilities and stockholders’ equity (deficit)


Current liabilities


Accounts payable


$

6,021


$

2,599


Accrued expenses and other current liabilities


5,045


2,944


Warrant liability


2,185


21,155


Current portion of long-term debt


7,954


Current portion of long-term debt - related party


6,225


Current portion of operating lease obligation


1,166


1,769


Total current liabilities


14,417


42,646


Long-term debt, net of debt discount


63,768


Long-term debt, net of current portion and debt discount - related party


1,649


Operating lease obligation, net of current portion


9,260


7,265


Derivative liability


17,418


Earnout liability


83,144


Other long-term liabilities


191


Total liabilities


188,198


51,560


Stockholders’ equity (deficit)


Preferred stock, par value $.0001, 1,000,000 shares authorized no shares issued and outstanding as of December 31, 2021 and December 31, 2020


Common stock, par value $.0001, 250,000,000 shares authorized as of December 31, 2021 and December 31, 2020; 75,062,642 and 32,949,507 shares issued and outstanding as of December 31, 2021 and December 31, 2020, respectively


8


3


Additional paid-in capital


206,768


54,097


Accumulated deficit


(181,564

)


(80,795

)

Total stockholders’ equity (deficit)


25,212


(26,695

)

Total liabilities and stockholders’ equity (deficit)


$

213,410


$

24,865


Lightning eMotors, Inc.

Consolidated Statements of Cash Flows

(in thousands, except shares)


Three Months Ended


Year Ended


December 31,


December 31,


2021


2020


2021


2020


Cash flows from operating activities


Net income (loss)


$

22,186


$

(13,381

)


$

(100,769

)


$

(37,653

)

Adjustments to reconcile net loss to net cash used in operating activities:


Depreciation and amortization


269


99


874


362


Provision for doubtful accounts


3,207


3,349


Provision for inventory obsolescence and write-downs


917


261


917


261


Loss on disposal of fixed asset


48


39


Gain on extinguishment of debt


(2,194

)


Change in fair value of warrant liability


704


6,472


28,812


20,835


Change in fair value of earnout liability


(39,981

)


4,183


Change in fair value of derivative liability


(3,949

)


5,341


Stock-based compensation


993


15


2,538


275


Amortization of debt discount


2,072


1,319


6,670


1,789


Non-cash impact of operating lease right-of-use asset


(462

)


459


991


1,254


Issuance of common stock warrants for services performed


433


Other non-cash expenses


1


165


Changes in operating assets and liabilities:


Accounts receivable


(309

)


(77

)


(8,399

)


(3,016

)

Inventories


(4,777

)


(1,064

)


(9,795

)


(2,017

)

Prepaid expenses and other assets


131


(1,426

)


(6,380

)


(1,621

)

Accounts payable


2,285


1,209


3,578


1,442


Accrued expenses and other liabilities


(1,179

)


1,580


4,005


1,698


Net cash used in operating activities


(17,845

)


(4,533

)


(65,807

)


(16,226

)

Cash flows from investing activities


Purchase of property and equipment


(924

)


(712

)


(3,244

)


(2,013

)

Proceeds from disposal of property and equipment


46


55


Net cash used in investing activities


(878

)


(712

)


(3,189

)


(2,013

)

Cash flows from financing activities


Proceeds from convertible notes payable, net of issuance costs paid


300


95,000


9,679


Proceeds from Business combination and PIPE Financing, net of issuance costs paid


142,796


Proceeds from facility borrowings


7,000


1,000


Repayments of facility borrowings


(11,500

)


Proceeds as part of a redemption of convertible notes payable and Series C redeemable convertible preferred stock and warrants


3,000


Proceeds from the exercise of Series C redeemable convertible preferred warrants


3,100


Proceeds from exercise of common warrants


157


Proceeds from issuance of Series C convertible preferred stock and preferred stock warrants


3,225


Proceeds for the exercise of Series C redeemable convertible preferred warrants


500


500


Payments on finance lease obligations


(38

)


(54

)


(88

)

Proceeds from exercise of stock options


23


42


575


86


Net cash provided by financing activities


23


804


237,074


17,402


Net increase in cash


(18,700

)


(4,441

)


168,078


(837

)

Cash - Beginning of year


187,238


460


1,297


Cash - End of period


$

168,538


$

(4,441

)


$

168,538


$

460


Supplemental cash flow information - Cash paid for interest


$

3,686


$

223


$

6,245


$

864


Significant noncash transactions


Earnout liability at inception


$


$


$

78,960


$


Warrant liability at inception


1,253


Derivative liability at inception


17,063


Conversion of short-term convertible notes for common stock


9,679


Conversion of convertible notes for common stock


10,089


Conversion of warrant liabilities for common stock


37,580


Conversion of convertible notes payable into Series C redeemable convertible preferred stock


3,000


Finance lease right-of-use asset in exchange for a lease liability


208


208


Non-GAAP Financial Measures

In addition to our results determined in accordance with GAAP, we believe the following non-GAAP measures are useful in evaluating our operational performance. We use the following non-GAAP financial information among other operational metrics to evaluate our ongoing operations and for internal planning and forecasting purposes. We believe that non-GAAP financial information, when taken collectively, may be helpful to investors in assessing our operating performance.

EBITDA, Adjusted EBITDA and Adjusted Net Loss

EBITDA is defined as net income (loss) before depreciation and amortization and interest expense. Adjusted EBITDA is defined as net income (loss) before depreciation and amortization, interest expense, stock-based compensation, gains or losses related to the change in fair value of warrant, derivative and earnout share liabilities, gains or losses on extinguishment of debt and other non-recurring costs determined by management, such as Business Combination related expenses. Adjusted net loss is defined as net income (loss) adjusted for stock-based compensation expense, gains or losses related to the change in fair value of warrant, derivative and earnout share liabilities, gains or losses on extinguishment of debt and certain other non-recurring costs determined by management, such as Business Combination related expenses.


Contacts

Investor Relations Contact:
Brian Smith
(800) 223-0740
This email address is being protected from spambots. You need JavaScript enabled to view it.

Media Relations Contact:
Nick Bettis
(800) 223-0740
This email address is being protected from spambots. You need JavaScript enabled to view it.


Read full story here

WASHINGTON & BRUSSELS--(BUSINESS WIRE)--EIG, a leading institutional investor to the global energy and infrastructure sectors, and Fluxys, a leading energy infrastructure company, today announced that they jointly will acquire an 80% equity stake in GNL Quintero S.A. (“Quintero”), the largest liquefied natural gas (LNG) regasification terminal in Chile, from Enagas Chile SpA and affiliates of OMERS Infrastructure. Terms of the transaction were not disclosed.


Quintero is a key energy infrastructure business supporting Chile’s decarbonization strategy with a bridging fuel that allows for the reconciliation of economic growth with the uptake of renewables and the phasing out of coal. Operational since 2009, Quintero is the largest terminal for receiving and unloading LNG in Chile, as well as for its storage and regasification capacities. The terminal benefits from its strategic location in Quintero Bay, supplying a diversified base of customers in central Chile across residential, commercial, industrial, transportation and power generation sectors. The terminal owns 75% of the country´s LNG regasification capacity and in 2021, 67% of the total natural gas imports (both LNG and pipeline imports) arrived in Chile through this strategic asset. With a daily regasification capacity of 15 million m3, an LNG storage capacity of 334,000 m3 and 2,500 m3 per day of truck loading capacity, the terminal is a reliable supplier of natural gas that contributes to Chile’s energy diversification and security.

Chile has world-class solar and wind resources and a RES capacity equivalent to 4% of total global energy demand. The country is aiming to become one of the world’s three largest green hydrogen producers with plans to install 200 GW of renewable power by 2040 to produce green hydrogen. Chile already has signed several agreements to promote the export of green hydrogen, among others with the Belgian ports of Antwerp/Zeebrugge, Germany, the Port of Rotterdam and South Korea.

The acquisition builds on EIG’s presence in the Chilean market, where the firm owns Cerro Dominador, a groundbreaking solar complex that combines a 100MW photovoltaic (PV) plant with a 110MW concentrated solar power (CSP) plant. The PV plant has been operational since 2017 and the CSP plant was successfully synchronized with Chile’s electricity grid in April 2021. EIG also is a partner in AME S.p.A, a Chile-based project developer and independent power producer. AME co-owns Generadora Metropolitana, the fifth largest electricity generation company in Chile, as well as HIF Global, a leader in the hydrogen and e-fuels sector, with a series of commercial-scale projects in development and expected to reach construction over the next several years.

For Fluxys, the partnership is a forward-looking investment creating a foothold in another country in Latin America where the energy transition stands high on the government agenda. With its abundant solar and wind resources, Chile aims to produce the world’s cheapest green hydrogen. The Belgian Hydrogen Import Coalition with Fluxys as partner has affirmed the competitiveness and feasibility of a green molecule supply chain from Chile to Europe and Belgium.

“We are thrilled by the opportunity to invest in Quintero, a company that aligns perfectly with our focus on strategic, high-quality infrastructure that is critical to the region it serves and yields attractive, contracted cash flows,” said R. Blair Thomas, EIG’s Chairman and CEO. “We are pleased to be partnering again with Fluxys, a world-class operational partner, to help Quintero support Chile’s energy needs and transition goals with reliable energy. Quintero’s strong presence in natural gas infrastructure serves as an attractive launching point to expand its presence in related and adjacent sectors, including storage, truck loading and regasification, as well as to develop production capacity for green hydrogen, where Quintero has significant potential to be a domestic leader in the nascent industry.”

“With 3 LNG terminals in Europe, our ambition to invest outside Europe and to become the transporter of new energy carriers, Quintero is a perfect fit with our strategy for growth in view of the low carbon future”, said Pascal De Buck, Fluxys’ Managing Director and CEO. “We want to deploy and expand our industrial expertise worldwide and are excited to partner with EIG as leading global energy infrastructure investor already intensively involved in energy transition projects in Chile. Our partnership in Quintero brings Fluxys closer to hydrogen developments in Chile and supports the import of hydrogen in Belgium. We are looking forward to collaborating and developing new opportunities with Quintero’s management and workforce.”

The transaction is expected to close in the second half of 2022, subject to customary closing conditions, including any required merger control and related regulatory approvals.

Citigroup Global Markets Inc. acted as financial advisor to EIG and Fluxys in connection with the transaction. White & Case LLP served as EIG’s legal advisor and Linklaters LLP served as Fluxys’ legal advisor.

About EIG

EIG is a leading institutional investor to the global energy and infrastructure sectors with $23.0 billion under management as of December 31, 2021. EIG specializes in private investments in energy and energy-related infrastructure on a global basis. During its 40-year history, EIG has committed $39.7 billion to the energy sector through 379 projects or companies in 38 countries on six continents. EIG’s clients include many of the leading pension plans, insurance companies, endowments, foundations and sovereign wealth funds in the U.S., Asia and Europe. EIG is headquartered in Washington, D.C. with offices in Houston, London, Sydney, Rio de Janeiro, Hong Kong and Seoul. For additional information, please visit www.eigpartners.com.

About Fluxys

Headquartered in Belgium, Fluxys is a fully independent energy infrastructure group with 1,300 employees active in gas transmission & storage and liquefied natural gas terminalling. Through its associated companies across the world, Fluxys operates 12,000 kilometers of pipeline and liquefied natural gas terminals totaling a yearly regasification capacity of 29 billion cubic meters. Among Fluxys’ subsidiaries is Euronext listed Fluxys Belgium, owner and operator of the infrastructure for gas transmission & storage and liquefied natural gas terminalling in Belgium.

As a purpose-led company, Fluxys, together with its stakeholders, contributes to a better society by shaping a bright energy future. Building on the unique assets of gas infrastructure and its commercial and technical expertise, Fluxys is committed to transport hydrogen, biomethane or any other carbon-neutral energy carrier as well as CO2, accommodating the capture, usage and storage of the latter. www.fluxys.com.


Contacts

Media Contacts

EIG
Sard Verbinnen & Co.
Kelly Kimberly / Brandon Messina
+1 212-687-8080
This email address is being protected from spambots. You need JavaScript enabled to view it.

Fluxys Media Contact
Laurent Remy
+32 2 282 74 50
This email address is being protected from spambots. You need JavaScript enabled to view it.

HOUSTON--(BUSINESS WIRE)--Murphy Oil Corporation (NYSE: MUR) today announced that drilling has concluded at the Cutthroat-1 exploration well in block SEAL-M-428 in the Sergipe-Alagoas Basin offshore Brazil.


While the presence of hydrocarbons was not found, the partner group will continue to integrate the exploration well data into its regional subsurface interpretation efforts in order to better understand the exploration potential of its deepwater blocks located in the Sergipe-Alagoas Basin.

Cutthroat-1 is located nearly 90 kilometers offshore Brazil and was drilled in 3,094 meters of water by the Seadrill West Saturn drillship. It is one of multiple prospects that the partner group has mapped in the Sergipe-Alagoas Basin.

ExxonMobil is the operator and holds 50% working interest in 9 offshore SEAL blocks that spans over 6,800 square kilometers. Enauta Energia S.A. holds 30% working interest and Murphy Oil Corporation holds 20% working interest in the partnership.

ABOUT MURPHY OIL CORPORATION

As an independent oil and natural gas exploration and production company, Murphy Oil Corporation believes in providing energy that empowers people by doing right always, staying with it and thinking beyond possible. Murphy challenges the norm, taps into its strong legacy and uses its foresight and financial discipline to deliver inspired energy solutions. Murphy sees a future where it is an industry leader who is positively impacting lives for the next 100 years and beyond. Additional information can be found on the company’s website at www.murphyoilcorp.com.

FORWARD-LOOKING STATEMENTS

This news release contains forward-looking statements within the meaning of the Private Securities Litigation Reform Act of 1995. Forward-looking statements are generally identified through the inclusion of words such as “aim”, “anticipate”, “believe”, “drive”, “estimate”, “expect”, “expressed confidence”, “forecast”, “future”, “goal”, “guidance”, “intend”, “may”, “objective”, “outlook”, “plan”, “position”, “potential”, “project”, “seek”, “should”, “strategy”, “target”, “will” or variations of such words and other similar expressions. These statements, which express management’s current views concerning future events or results, are subject to inherent risks and uncertainties. Factors that could cause one or more of these future events or results not to occur as implied by any forward-looking statement include, but are not limited to: macro conditions in the oil and gas industry, including supply/demand levels, actions taken by major oil exporters and the resulting impacts on commodity prices; increased volatility or deterioration in the success rate of our exploration programs or in our ability to maintain production rates and replace reserves; reduced customer demand for our products due to environmental, regulatory, technological or other reasons; adverse foreign exchange movements; political and regulatory instability in the markets where we do business; the impact on our operations or market of health pandemics such as COVID-19 and related government responses; other natural hazards impacting our operations or markets; any other deterioration in our business, markets or prospects; any failure to obtain necessary regulatory approvals; any inability to service or refinance our outstanding debt or to access debt markets at acceptable prices; or adverse developments in the U.S. or global capital markets, credit markets or economies in general. For further discussion of factors that could cause one or more of these future events or results not to occur as implied by any forward-looking statement, see “Risk Factors” in our most recent Annual Report on Form 10-K filed with the U.S. Securities and Exchange Commission (“SEC”) and any subsequent Quarterly Report on Form 10-Q or Current Report on Form 8-K that we file, available from the SEC’s website and from Murphy Oil Corporation’s website at http://ir.murphyoilcorp.com. Murphy Oil Corporation undertakes no duty to publicly update or revise any forward-looking statements.


Contacts

Investor Contacts:
Kelly Whitley, This email address is being protected from spambots. You need JavaScript enabled to view it., 281-675-9107
Megan Larson, This email address is being protected from spambots. You need JavaScript enabled to view it., 281-675-9470

ChargePoint will work with Gatik to establish electric vehicle charging infrastructure and integrated services for Gatik’s customers in the U.S. and Canadian markets

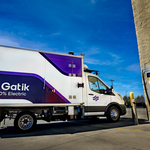
CAMPBELL,Calif. & MOUNTAIN VIEW, Calif.--(BUSINESS WIRE)--ChargePoint (NYSE: CHPT), a leading electric vehicle (EV) charging network, and Gatik today announced a strategic partnership to develop an electric ecosystem for autonomous vehicles designed to maximize sustainability, operational efficiency and economics for ChargePoint and Gatik’s customers across North America. Through the partnership, infrastructure and integrated services will play a significant role in helping to decarbonize the B2B short-haul logistics sector and will offer a simple and seamless solution to help Gatik and ChargePoint’s customers meet their corporate sustainability goals.


“Our partnership with Gatik will help more fleets to realize their e-mobility and decarbonization goals,” said Rich Mohr, Vice President, Fleet at ChargePoint. “ChargePoint has proven experience across multiple customer applications and use cases. Together, ChargePoint and Gatik will provide industry-leading infrastructure and technologies for forward-thinking fleets.”

“Gatik’s autonomous electric fleet is uniquely positioned to increase efficiency and reliability across the supply chain’s middle mile, and drive sustainability across critical operational metrics for our customers,” said Arjun Narang, Co-founder and CTO at Gatik. “Our partnership with ChargePoint will ensure that we’re not only meeting intensifying demand for our product offering and service, but offering our customers access to national charging infrastructure and a wealth of technical advantages to support them in meeting their corporate sustainability goals.”

Customers transporting goods in Gatik’s autonomous electric fleet will have access to ChargePoint’s expertise in site design, interoperability validation, and lower investment costs. Gatik will also have access to a nationwide charging network and fleet-specific software that provides telematics intelligence configurable to each customer’s operations, as well as modular charging hardware to minimize upfront costs by reducing required electrical capacity. This strategic electric ecosystem collaboration for the middle mile will play a key role in the electrified logistics sector.

Powered by ChargePoint’s scalable and reliable charging technology, Gatik launched its first autonomous electric box trucks with Walmart in 2021, a groundbreaking solution offering hyper-efficient goods movement, significant emissions reductions and impactful savings on fuel and powertrain maintenance costs. As the retail, E-commerce and logistics sectors look to decrease their carbon footprints, demand for Gatik’s product offering among national retail and E-Commerce giants has soared, leading to rapid expansion of ChargePoint’s infrastructure at Gatik’s vehicle depots and customer locations across existing and emerging markets.

With consumer expectations for real-time access to goods increasing faster than the most confident predictions, there has been an influx of freight-moving vehicles added to North America’s roads. This has made sustainability both a collective challenge and a collective responsibility for leaders in the logistics industry to contend with. Gatik’s partnership with ChargePoint ensures customers have access to Gatik’s class 3-6 autonomous electric fleet and ChargePoint’s charging infrastructure and integrated services to support a cleaner, more efficient and sustainable logistics sector.

About Gatik

Gatik, the leader in autonomous middle mile logistics, delivers goods safely and efficiently using its fleet of light and medium duty trucks. The company focuses on short-haul, B2B logistics for Fortune 500 retailers and in 2021 launched the world’s first fully driverless commercial delivery service with Walmart. Gatik’s Class 3-6 autonomous box trucks are commercially deployed in multiple markets including Texas, Arkansas, Louisiana and Ontario. Gatik has raised a total of $114.5 million and is backed by Koch Disruptive Technologies, Innovation Endeavors, Wittington Ventures and others, and partnered with industry leaders including Ryder, Goodyear and Isuzu. Founded in 2017 by veterans of the autonomous technology industry, the company has offices in Mountain View and Toronto. Gatik was recognized on the 2021 Forbes AI 50 list and as a World Economic Forum Technology Pioneer.

About ChargePoint

ChargePoint is creating a new fueling network to move people and goods on electricity. Since 2007, ChargePoint has been committed to making it easy for businesses and drivers to go electric with one of the largest EV charging networks and a comprehensive portfolio of charging solutions. ChargePoint’s cloud subscription platform and software-defined charging hardware are designed to include options for every charging scenario from home and multifamily to workplace, parking, hospitality, retail and transport fleets of all types. Today, one ChargePoint account provides access to hundreds-of-thousands of places to charge in North America and Europe. To date, more than 105 million charging sessions have been delivered, with drivers plugging into the ChargePoint network every two seconds or less. For more information, visit the ChargePoint pressroom, the ChargePoint Investor Relations site, or contact ChargePoint’s North American European press offices or Investor Relations.


Contacts

Jennifer Bowcock VP, Communications
408-768-8221
This email address is being protected from spambots. You need JavaScript enabled to view it.

Patrick Hamer, VP, Capital Markets and Investor Relations
610-914-5190
This email address is being protected from spambots. You need JavaScript enabled to view it.

Richard Steiner, Gatik
650-282-3076
This email address is being protected from spambots. You need JavaScript enabled to view it.

Susan Donahue, Skyya for Gatik
646-454-9378
This email address is being protected from spambots. You need JavaScript enabled to view it.

 Company raises $32 million in private placement
Trading under “PEGY” on the Nasdaq Capital Market to begin March 29, 2022

MINNETONKA, Minn.--(BUSINESS WIRE)--Communications Systems, Inc. (Nasdaq: JCS) (the “Company” or “Pineapple Energy”) today announced the closing of its merger with Pineapple Energy LLC. In connection with the closing, the Company changed its name to “Pineapple Holdings, Inc.” on March 28, 2022 and its common stock is expected to trade on the Nasdaq Capital Market under the new symbol “PEGY” on Tuesday, March 29, 2022.


Immediately prior to the merger, Pineapple Energy completed its acquisition of two Hawaiian solar companies, Hawaii Energy Connection, LLC and E-Gear, LLC. Following the merger, Pineapple Energy operates a portfolio of brands including Hawaii Energy Connection, E-Gear, Sungevity, and Horizon Solar Power that provide homeowners with an end-to-end product offering spanning solar, battery storage, and grid services.

Immediately following the completion of the merger, the Company completed its previously announced private placement of Series A preferred stock and warrants to institutional investors resulting in gross proceeds to the Company of $32.0 million.

Roger Lacey, Chair of the Board, commented, “We are thrilled to have completed this merger and we extend a warm welcome to our new board members, Marilyn Adler, Tom Holland, Scott Honour, and Kyle Udseth. As we move forward, we have confidence that Pineapple Energy will capitalize on the compelling financial and environmental benefits of residential solar, as well as the strong drive among homeowners and small businesses to increase their energy independence and transition away from fossil fuels.”

Kyle Udseth, who was appointed as Chief Executive Officer of the Company in connection with the merger, commented, “With the closing completed, we are excited to get to work building the nation’s leading residential energy management company. We believe that Pineapple Energy is well positioned as a platform for our national consolidation strategy and there are attractive acquisition opportunities among leading independent solar, storage and energy management companies. The merger and financing provide Pineapple Energy with enhanced resources to pursue its growth and acquisition strategy.”

Scott Honour, Managing Partner of Northern Pacific Group, which through its investment funds was Pineapple Energy LLC’s largest shareholder, added, “We believe U.S. Energy policy is undergoing a sea change before our eyes. Pineapple Energy has the talent and experience to take advantage of these trends to create a nationwide trusted energy partner to households and small businesses. As a member of the Pineapple Energy board, I look forward to leveraging our collective dealmaking and industry expertise to support the Pineapple Energy M&A strategy.”

As previously announced, Company shareholders of record as of the close of business on Friday, March 25, 2022 will receive one contractual non-transferable Contingent Value Right (CVR) per share of Company common stock held, which will entitle the CVR holder to a portion of the proceeds of dispositions of the Company’s pre-merger assets after the effective time of the merger. No ex-dividend date is applicable to the CVRs because they are non-transferrable. The CVRs are issued only in book entry.

Immediately prior to the merger, the Company had 2,429,341 shares of common stock outstanding. Immediately following the merger, the Company had 7,435,586 shares of common stock outstanding. Accordingly, the pre-merger Company shareholders own approximately 32.7% of the Company’s common stock outstanding immediately following the effective time of the merger and the pre-merger Pineapple Energy LLC unit holders own approximately 67.3% of the Company’s common stock outstanding immediately following the effective time of the merger.

On a fully-diluted basis taking into account the closing of the merger and the private placement, the pre-merger Company shareholders own approximately 20.0% of the Company’s stock, the pre-merger Pineapple Energy LLC unit holders own approximately 41.2% of the Company’s stock, and the private placement investors own approximately 38.8% of the Company’s stock.

About Pineapple Holdings, Inc.

Pineapple Holdings, Inc., which does business as Pineapple Energy (f/k/a Communications Systems, Inc.) (Nasdaq: PEGY), is focused on growing leading local and regional solar, storage, and energy services companies nationwide. Our vision is to power the energy transition through grass-roots growth of solar electricity paired with battery storage. Our portfolio of brands, Hawaii Energy Connection, E-Gear, Sungevity and Horizon Solar Power, provide homeowners and small businesses with an end-to-end product offering spanning solar, battery storage, and grid services.

Forward Looking Statements

This press release includes certain forward-looking statements within the meaning of the Private Securities Litigation Reform Act of 1995, including statements regarding future financial performance, future growth, and future acquisitions. These statements are based on Pineapple Energy’s current expectations or beliefs and are subject to uncertainty and changes in circumstances. Actual results may vary materially from those expressed or implied by the statements here due to changes in economic, business, competitive or regulatory factors, and other risks and uncertainties, including those described in “Risks Related to the Combined Company Following Consummation of the Merger” in Item 1A of the Company’s Form 10-K for the fiscal year ended December 31, 2021 filed with the Securities and Exchange Commission on March 14, 2022 and other factors set forth in the company’s filings with the Securities and Exchange Commission. The forward-looking statements in this press release speak only as of the date of this press release. Pineapple Energy does not undertake any obligation to update or revise these forward-looking statements for any reason, except as required by law.


Contacts

 For Pineapple Holdings, Inc.

Kyle Udseth
Chief Executive Officer
+1 (952) 582-6460
This email address is being protected from spambots. You need JavaScript enabled to view it.

Mark D. Fandrich
Chief Financial Officer
+1 (952) 582-6416
This email address is being protected from spambots. You need JavaScript enabled to view it.

The Equity Group Inc.
Lena Cati
Senior Vice President
+1 (212) 836-9611
This email address is being protected from spambots. You need JavaScript enabled to view it.

Second Exploration Success in 2022

QUITO, Ecuador--(BUSINESS WIRE)--GeoPark Limited (“GeoPark” or the “Company”) (NYSE: GPRK), a leading independent Latin American oil and gas explorer, operator and consolidator today announced its second hydrocarbon discovery in 2022 in the Perico block (GeoPark non-operated, 50% WI) in Ecuador.


On January 28, 2022, the operator spudded the Tui 1 exploration well, located approximately 7 kilometers south from the Jandaya oil field, discovered in January. The Tui 1 well was drilled and completed to a total depth of 10,975 feet. Production tests in the Basal Tena formation currently show a production rate of 1,240 barrels of oil per day of 27 degrees API with a 1% water cut, after five days of testing. The complete testing program is underway and additional production history will be required to determine stabilized flow rates of the well and the extent of the reservoir.

Current gross light oil production in the Perico block from the two discoveries is approximately 2,000 barrels of oil per day and is already being delivered to a nearby access point on Ecuador’s main pipeline system for sale to export markets.

GeoPark and its partner Frontera Energy Corporation are currently evaluating subsequent activities in the Perico block, including a potential development drilling plan for both the Jandaya and Tui fields.

Additional exploration activities are budgeted to continue in Ecuador during 2022 in the Espejo Block (GeoPark operated, 50% WI) with the ongoing acquisition of 60 sq km of 3D seismic, to be followed by the drilling of the first Espejo block exploration well, expected to spud in the second half of 2022.

The Espejo and Perico blocks are attractive, low-risk exploration blocks located in the Sucumbios Province in the Oriente basin in northeastern Ecuador. The blocks were acquired in the 2019 Intracampos bid round at no upfront cost in exchange for certain drilling commitments and 3D seismic acquisition. They are adjacent to multiple discoveries and prolific producing fields and have access to existing infrastructure with spare capacity and a well-developed service industry.

These activities are part of GeoPark’s self-funded 2022 capital expenditures program of $160-180 million that targets drilling 40-48 gross wells, including an extensive exploration drilling program targeting high-potential, short-cycle and near-field projects on big proven acreage adjacent to GeoPark’s core Llanos 34 block (GeoPark operated, 45% WI) in Colombia plus other exploration targets in Colombia and Ecuador1. On the CPO-5 block (GeoPark non-operated, 30% WI), the Indico 5 well has just been completed with testing expected in the next 5-10 days. Subsequently, the drilling rig is moving to spud the Urraca exploration prospect, the first exploration target of the CPO-5 block in 2022.

James F. Park, Chief Executive Officer of GeoPark, said: “Congratulations to GeoPark’s oil finding team for another exploration success in a region where we see substantial opportunity for expansion and growth. This new discovery in Ecuador – which is already on production and being marketed – represents the type of low risk, quick tie-in, high potential, and profitable exploration projects that we have been consistently adding to our in-house opportunity portfolio over the last years and which provide GeoPark with a reliable and attractive short and medium-term growth fairway. This is the second consecutive exploration success of our busy 2022 work program which targets 15-20 exploration wells, none of which are currently considered in our production or financial guidance for the year.”

NOTICE

Additional information about GeoPark can be found in the “Investor Support” section on the website at www.geo-park.com.

Rounding amounts and percentages: Certain amounts and percentages included in this press release have been rounded for ease of presentation. Percentage figures included in this press release have not in all cases been calculated based on such rounded figures but based on such amounts prior to rounding. For this reason, certain percentage amounts in this press release may vary from those obtained by performing the same calculations using the figures in the financial statements. In addition, certain other amounts that appear in this press release may not sum due to rounding.

CAUTIONARY STATEMENTS RELEVANT TO FORWARD-LOOKING INFORMATION

This press release contains statements that constitute forward-looking statements. Many of the forward- looking statements contained in this press release can be identified using forward-looking words such as ‘‘anticipate,’’ ‘‘believe,’’ ‘‘could,’’ ‘‘expect,’’ ‘‘should,’’ ‘‘plan,’’ ‘‘intend,’’ ‘‘will,’’ ‘‘estimate’’ and ‘‘potential,’’ among others.

Forward-looking statements that appear in a number of places in this press release include, but are not limited to, statements regarding the intent, belief or current expectations regarding various matters, including the expected production rates, production growth, expected schedule or development plan, economic recovery, payback timing, IRR, drilling activities, demand for oil and gas, oil and gas prices, our capital expenditures plan and work program and investment guidelines. Forward-looking statements are based on management’s beliefs and assumptions, and on information currently available to the management. Such statements are subject to risks and uncertainties, and actual results may differ materially from those expressed or implied in the forward-looking statements due to various factors. Oil and gas production figures included in this release are stated before the effect of royalties paid in kind, consumption, and losses, except when specified.

Forward-looking statements speak only as of the date they are made, and the Company does not undertake any obligation to update them considering new information or future developments or to release publicly any revisions to these statements to reflect later events or circumstances, or to reflect the occurrence of unanticipated events. For a discussion of the risks facing the Company which could affect whether these forward-looking statements are realized, see filings with the U.S. Securities and Exchange Commission.

Readers are cautioned that the exploration resources disclosed in this press release are not necessarily indicative of long-term performance or of ultimate recovery. Unrisked prospective resources are not risked for change of development or chance of discovery. If a discovery is made, there is no certainty that it will be developed or, if it is developed, there is no certainty as to the timing of such development. There is no certainty that any portion of the prospective resources will be discovered. If discovered, there is no certainty that it will be commercially viable to produce any portion of the resources. Prospective resource volumes are presented as unrisked.

________________
1 Please refer to the release published on November 10, 2021 for further details.


Contacts

INVESTORS:

Stacy Steimel
Shareholder Value Director
T: +562 2242 9600
This email address is being protected from spambots. You need JavaScript enabled to view it.

Miguel Bello
Market Access Director
T: +562 2242 9600
This email address is being protected from spambots. You need JavaScript enabled to view it.

Diego Gully
Investor Relations Director
T: +5411 4312 9400
This email address is being protected from spambots. You need JavaScript enabled to view it.

MEDIA:

Communications Department
This email address is being protected from spambots. You need JavaScript enabled to view it.

PASADENA, Calif.--(BUSINESS WIRE)--$HLGN #ArtificialIntelligence--Heliogen, Inc. (“Heliogen” or the “Company”) (NYSE: HLGN), a leading provider of AI-enabled concentrated solar energy, today announced full year 2021 financial and operational results.


Full-Year 2021 Highlights

  • Finalized $39 million U.S. Department of Energy award for deployment of AI-enabled concentrated solar technology
  • Completed first field test of autonomous robots designed to reduce installation and maintenance costs
  • Announced start of equipment procurement for first commercial-scale facility collaboration with Woodside Energy to deploy Heliogen’s power technology
  • Held successful demonstration of green hydrogen production using the Company’s core concentrated solar technology in partnership with Bloom Energy
  • Closed business combination with Athena Technology Acquisition Corp. (“Athena”); began trading on the NYSE on December 31, 2021

Recent Highlights

  • Began site preparation and setup for first full-scale manufacturing facility in Long Beach, California
  • Awarded exclusive lease rights to Brenda Solar Energy Zone by the U.S. Bureau of Land Management for the purposes of green hydrogen production

Executive Commentary

“Our mission is bold but simple,” said Bill Gross, Founder and Chief Executive Officer of Heliogen. “We aim to decarbonize heavy industry, using artificial intelligence, scalable, repeatable manufacturing techniques, and the power of the sun. Our patented closed-loop tracking system for our mirrors will allow us to generate temperatures up to 1,000 degrees Celsius, and efficiently store that heat to create industrial process steam, power and green hydrogen – without the intermittency problems of other renewable energy sources.”

Heliogen Progress in 2021 Continues into 2022

During 2021, Heliogen launched negotiations regarding deployment of its AI-enabled solar energy systems, and began engineering work on one of its first commercial scale facilities. The Company also continued to develop its infrastructure and set the foundation for its commercial-scale operations, to support its prospective project pipeline.

“The past year has been transformational in many ways for Heliogen,” said Mr. Gross. “We debuted on the New York Stock Exchange at the end of the year and, on the commercial side our company announced commercial relationships with Rio Tinto and Woodside Energy, two of the world’s largest resources firms, and partnered with Bloom Energy for the successful demonstration scale production of green hydrogen. We also finalized a cooperative agreement with the Department of Energy for the deployment of our new concentrated solar thermal energy technology. In addition, we expanded our manufacturing and operational capabilities, announcing a successful field test of our ICARUS autonomous robot which we designed with the goal of reducing installation and maintenance costs for our facilities.”

“As you can tell, the team at Heliogen has been busy,” continued Gross. “We intend to carry this momentum through 2022 and have already begun the initial work on our Long Beach manufacturing facility, as well as our green hydrogen production facility in the Brenda Solar Energy Zone in Arizona. Having made exceptional progress in 2021 toward our goals, we are excited about what the future holds for Heliogen.”

Full-Year 2021 Financial and Operational Results

For the full year 2021, Heliogen reported total revenue of $8.8 million, total operating expenses of $43.9 million and net loss of $142.2 million. The company’s net loss was driven primarily by non-cash, remeasurement impacts of $93.6 million related to our legacy SAFE instruments and warrants prior to and through the date of closing of the business combination with Athena and share-based compensation expense of $11.4 million. The Company’s Adjusted EBITDA, which excludes these and other impacts, was negative $32.1 million for full year 2021.

As of December 31, 2021, the Company had approximately $190.1 million in cash and cash equivalents and $32.3 million of available-for-sale investments, for a total of over $222.4 million available to fund its future scaling and development efforts. Heliogen currently has no material debt outstanding.

2022 Guidance

For full-year 2022, Heliogen expects to have between two and three modules contracted and is introducing revenue guidance of $20 - $25 million. The Company believes this metric of modules contracted is the most useful indicator of the demand for Heliogen’s products and technology at this stage in its lifecycle. Over time, it expects these contracts to be converted to revenue as the projects are installed, although there is no assurance as to the time period for such conversion.

Conference Call Information

The Heliogen management team will host a conference call to discuss its full year 2021 financial results on Tuesday, March 29, 2022, at 8:30 a.m. Eastern Time. The call can be accessed via a live webcast accessible on the Events & Presentations page in the Investor Relations section of Heliogen’s website at www.heliogen.com. The call can also be accessed live via telephone by dialing 877-407-0789 (201-689-8562 for international callers) and referencing Heliogen.

An archive of the webcast will also be available shortly after the call on the Investor Relations section of Heliogen’s website and will remain available for twelve months.

About Heliogen

Heliogen is a renewable energy technology company focused on eliminating the need for fossil fuels in heavy industry and powering a sustainable future. The company’s AI-enabled, modular concentrated solar technology aims to cost-effectively deliver near 24/7 carbon-free energy in the form of heat, power, or green hydrogen fuel at scale – for the first time in history. Heliogen was created at Idealab, the leading technology incubator founded by Bill Gross in 1996. For more information about Heliogen, please visit Heliogen.com

Use of Non-GAAP Financial Information

Management uses certain financial measures, including EBITDA and Adjusted EBITDA, to evaluate our financial and operating performance that are calculated and presented on the basis of methodologies other than in accordance with GAAP. We believe these non-GAAP financial measures are useful to investors and analysts to assess our ongoing financial performance because, when reconciled to their most comparable GAAP financial measures, they provide improved comparability between periods through the exclusion of certain items that we believe are not indicative of our core operating performance, enhances the overall understanding of past financial performance and future prospects, and that may obscure our underlying business results and trends. These measures should not be considered a substitute for, or superior to, measures of financial performance prepared in accordance with GAAP, and our calculations thereof may not be comparable to similarly titled measures reported by other companies. Please see the accompanying tables for reconciliations of the following non-GAAP financial measures for Heliogen’s current and historical results: EBITDA and Adjusted EBITDA.

Forward-Looking Statements

This press release contains certain forward-looking statements within the meaning of Section 27A of the Securities Act of 1933, as amended, and Section 21E of the Securities Exchange Act of 1934, as amended. Statements that are not historical in nature, including the words “anticipate,” “expect,” “suggests,” “plan,” “believe,” “intend,” “estimates,” “targets,” “projects,” “should,” “could,” “would,” “may,” “will,” “forecast” and other similar expressions are intended to identify forward-looking statements. These forward-looking statements include, but are not limited to, statements regarding our guidance for full-year 2022, the development of our manufacturing and green hydrogen production facilities and future growth opportunities. Forward-looking statements are predictions, projections and other statements about future events that are based on current expectations and assumptions and, as a result, are subject to risks and uncertainties. Many factors could cause actual future events to differ materially from the forward-looking statements in this press release, including but not limited to: (i) our financial and business performance, including risk of uncertainty in our financial projections and business metrics and any underlying assumptions thereunder; (ii) our ability to execute our business model, including market acceptance of our planned products and services and achieving sufficient production volumes at acceptable quality levels and prices; (iii) our ability to access sources of capital to finance operations, growth and future capital requirements; (iv) our ability to maintain and enhance our products and brand, and to attract and retain customers; (v) our ability to scale in a cost-effective manner; (vi) changes in applicable laws or regulations; (vii) the ongoing impacts of the COVID-19 pandemic and the potential impacts of Russia’s invasion of Ukraine on our business; (viii) developments and projections relating to our competitors and industry; (ix) our ability to access sources of capital to finance operations, growth and future capital requirements; and (x) our ability to protect our intellectual property. You should carefully consider the foregoing factors and the other risks and uncertainties described in the “Risk Factors” section in the prospectus filed with the SEC pursuant to Rule 424(b), dated December 3, 2021 and in our Annual Report on Form 10-K that will be filed for the annual period ended December 31, 2021 and other documents filed by the Company from time to time with the SEC. These filings identify and address other important risks and uncertainties that could cause actual events and results to differ materially from those contained in the forward-looking statements. Forward-looking statements speak only as of the date they are made. Readers are cautioned not to put undue reliance on forward-looking statements, and Heliogen assumes no obligation and does not intend to update or revise these forward-looking statements, whether as a result of new information, future events, or otherwise.

Heliogen, Inc.

($ in thousands, except share data)

Condensed Consolidated Balance Sheets

(unaudited)


December 31,


2021


2020

ASSETS


Cash and cash equivalents


$

190,081


$

18,334


Investments, available-for-sale


32,332


Other current assets


4,770


241


Total current assets


227,183


18,575


Non-current assets


30,265


1,187


Total assets


$

257,448


$

19,762


LIABILITIES, CONVERTIBLE PREFERRED STOCK AND SHAREHOLDERS’ EQUITY (DEFICIT)


Trade payables


$

4,645


$

307


Contract liabilities


513


Contract loss provisions


5,180


Other current liabilities


6,974


849


Total current liabilities


17,312


1,156


Long-term liabilities


30,861


536


Total liabilities


48,173


1,692


Convertible preferred stock


45,932


Shareholders’ equity (deficit)


209,275


(27,862

)

Total liabilities, convertible preferred stock, and shareholders’ equity (deficit)


$

257,448


$

19,762


Heliogen, Inc.

Condensed Consolidated Statements of Operations and Comprehensive Loss

($ in thousands, except per share and share data)

(unaudited)


Years ended December 31,


2021


2020

Revenue


$

8,804


$

200


Cost of revenue


13,688


417


Gross loss


(4,884

)


(217

)


Operating expenses:


Selling, general, and administrative


30,386


3,713


Research and development


13,478


3,583


Total operating expenses


43,864


7,296


Operating loss


(48,748

)


(7,513

)


Interest income (expense)


634


(3

)

SAFE instruments remeasurement


(86,907

)


Warrant remeasurement


(6,651

)


(7

)

Other (expense) income, net


(517

)


86


Net loss before taxes


(142,189

)


(7,437

)

Provision for income taxes


(2

)


Net loss


(142,191

)


(7,437

)

Other comprehensive income (loss), net of taxes


Unrealized losses on available-for-sale securities


(17

)


Cumulative translation adjustment


13


Total comprehensive loss


$

(142,195

)


$

(7,437

)


Loss per share – Basic and Diluted


$

(11.88

)


$

(0.93

)


Weighted average number of shares outstanding – Diluted


11,970,550


7,978,512


Non-GAAP Financial Measures

EBITDA represents consolidated net loss before (i) interest (income) expense, net, (ii) income tax expense (benefit) and (iii) depreciation and amortization expense.

Adjusted EBITDA represents EBITDA adjusted for certain significant non-cash items and items that management believes are not attributable to or indicative of our on-going operations or that may obscure our underlying results and trends.

The following reconciles net loss to EBITDA and Adjusted EBITDA for the periods as shown:


Years ended December 31,

$ in thousands


2021


2020

Net loss


$

(142,191

)


$

(7,437

)

Adjustments


Interest (income) expense, net


(634

)


3


Provision for income taxes


2


Depreciation and amortization


562


139


EBITDA


$

(142,261

)


$

(7,295

)

Adjustments


SAFE instruments remeasurement


86,907


Warrant remeasurement


6,651


7


Share-based compensation


11,380


278


Provision for contract losses, net


5,180


Adjusted EBITDA


$

(32,143

)


$

(7,010

)


Contacts

Heliogen Media Contact:
Cory Ziskind
ICR, Inc.
This email address is being protected from spambots. You need JavaScript enabled to view it.

Heliogen Investor Contact
Caldwell Bailey
ICR, Inc.
This email address is being protected from spambots. You need JavaScript enabled to view it.

SAN JOSE, Calif.--(BUSINESS WIRE)--Impossible Mining announces the completion of key technology milestones as they endeavor to become the world’s first sustainable mining company.


Impossible Mining (YC W2022):

  • Reveals its robotic collection system
  • Announces partnership with global leader Boskalis to explore the integration of its robotics with vessel operations for selective harvesting of nodules in the Cook Islands
  • POLITICO highlights Impossible Mining’s entry to the seabed mining debate
  • Signs USD500M+ in Letters of Intent from battery manufacturers

IM is shaping a multi-trillion dollar industry with critical technology that would allow the responsible harvesting of EV metals. Their approach to seabed mining is a timely and exacting move to unite industry and disparate nations as we plan for a future without fossil fuels.

“We are showing the world that a nimble innovator like Impossible Mining can make big changes in the mining industry. By partnering with global leaders like Boskalis, we are paving the way to widespread uptake of our technology that will disrupt the mining industry on both land and underwater - making it more sustainable, more economic, and more secure,” said Oliver Gunasekara, CEO & Co-Founder of Impossible Mining.

“At Boskalis, we know that innovation and disruption are critical to the growth of our company. We are excited to work with Impossible Mining as they develop a transformational approach to sustainable seabed mining,” said Sander Steenbrink, General Manager Corporate Innovation, Research & Development at Boskalis.

“Demonstrating that our robotics manipulator can deliver the throughput required for economic production, while also preserving the seafloor ecosystem, answers the major question our competitors raise about the viability of selective harvesting. We are well on the way to showing that no longer does mineral production have to come at the cost of sustainability,” said Renee Grogan, Chief Sustainability Officer & Co-Founder Impossible Mining.

Robotic arm test tank video

https://youtu.be/UrL18h0XRFw

Animation visualization video

https://youtu.be/gFYyWKXysXE


Contacts

Marco Larsen
M: 646.812.4444

- MOU to supply large-scale CO2 compression equipment for world’s largest carbon capture and storage project -

MONTREAL--(BUSINESS WIRE)--Xebec Adsorption Inc. (TSX: XBC) (“Xebec”), a global provider of sustainable gas technologies, is pleased to announce today that it has signed a Memorandum of Understanding (“MOU”) with Iowa-based SCS Carbon Removal LLC, a subsidiary of Summit Carbon Solutions. The MOU supports the negotiation of an order in excess of USD$100 million (CAD$126 million) for 51 carbon dioxide (CO2) reciprocating compression packages to be completed by the end of Q3 2023. This equipment will be used for Summit Carbon Solutions’ proposed carbon capture and sequestration project, which will be the largest in the world if approved. The MOU is an expression of interest and there is no certainty that the negotiations will lead to a final binding order. This agreement showcases both Xebec’s expanding technology portfolio for carbon capture and sequestration, as well as the rapidly expanding customer base for Xebec’s sustainable gas technologies.


The equipment will be manufactured at Xebec Systems USA’s (formerly UECompression, or UEC) Colorado facility. Xebec is also working closely with the customer and major suppliers to manage cash flows and supply chain risks associated with the project.

“Summit Carbon Solutions is pleased to partner with Xebec as we continue to advance our carbon capture and storage project that will open new economic opportunities for ethanol producers and maintain a strong marketplace for corn growers,” said James Powell, COO of Summit Carbon Solutions. “Xebec shares our commitment both to safety and to utilizing innovation to decarbonize critical industries like ethanol production.”

“Xebec is delighted to be involved as a key supplier to Summit Carbon Solutions’ project, which aims to make a material impact in CO2 emissions reductions in the Midwest for agriculture and industry,” stated Jim Vounassis, President and CEO of Xebec Adsorption Inc. “Our U.S. manufacturing capabilities and carbon capture activities are seeing increasing demand, and we are excited to be involved as a long-term partner with Summit Carbon Solutions. As the world aims to decarbonize, we expect the need for carbon capture and sequestration solutions to accelerate, and Xebec is well positioned to provide CO2 purification, capture, liquefaction, and compression technologies,” he added.

Xebec expands compression expertise into CO2 capture and sequestration with the transformative Midwest Carbon Express project

To date, Xebec has demonstrated its compression leadership in renewable natural gas (“RNG”), hydrogen and industrial gases through its subsidiaries Applied Compression Systems (ACS), Xebec Systems USA, and HyGear. Xebec’s compression equipment is typically needed to process sustainable gases to achieve desired operating parameters. For example, Xebec’s compression equipment has been deployed in landfills, at dairy farms for virtual RNG transport, hydrogen production and processing, refueling stations, on-site hydrogen supply and other industrial gas applications. The MOU announced today provides meaningful exposure to CO2 capture and sequestration through Midwest Carbon Express.

Summit Carbon Solutions’ carbon capture and storage project is a USD4.5 billion CO2 capture, pipeline, and sequestration infrastructure project which includes CO2 capture facilities from ethanol plants and industry, associated pipelines and pump stations in Iowa, Nebraska, South Dakota, Minnesota, and North Dakota, as well as Class VI sequestration wells in North Dakota. The project is expected to be the largest CO2 sequestration project in the world when commissioned with a 12 million tons of CO2 per year capacity, equivalent to removing 2.6 million vehicles from our roads annually.

Xebec to Host Live Investor Webinar for First Investor Day in Colorado

An investor webinar will be held tomorrow on Tuesday, March 29, 2022, at 11:00 AM MDT (1:00 PM EDT) for Xebec’s first investor day. The event will showcase the company’s worldwide capabilities, disruptive clean technologies for sustainable gases, and the multi-year strategic plan to enable the successful execution of its many growth opportunities.

Register here: https://app.livestorm.co/xebec-adsorption-inc/2022-investor-day

Related links:
https://www.summitcarbonsolutions.com/
https://www.xebecinc.com

About Summit Carbon Solutions

Summit Carbon Solutions seeks to lower greenhouse gas emissions by connecting industrial facilities via strategic infrastructure to store carbon dioxide safely and permanently in the Midwestern United States. For more information, visit: www.SummitCarbonSolutions.com.

About Xebec Adsorption Inc.

Xebec is a global provider of clean energy solutions for renewable and low carbon gases used in energy, mobility and industrial applications. The company specializes in deploying a portfolio of proprietary technologies for the distributed production of hydrogen, renewable natural gas, oxygen and nitrogen. By focusing on environmentally responsible gas generation, Xebec has helped thousands of customers around the world reduce their carbon footprints and operating costs. Headquartered in Québec, Canada, Xebec has a worldwide presence with nine manufacturing facilities, seventeen Cleantech Service Centers and four sales offices spanning over four continents. Xebec trades on the Toronto Stock Exchange under the symbol (TSX: XBC). For more information, xebecinc.com.

Cautionary Statement

This press release contains forward-looking statements within the meaning of applicable Canadian securities law. These statements relate to future events or future performance and reflect the expectation of Management regarding the growth, results of operations, performance and business prospects and opportunities of the Corporation or its industry. Forward-looking statements typically contain words such as “believes”, “expects”, “anticipates”, “continues”, “could”, “indicates”, “plans”, “will”, “intends”, “may”, “projects”, “schedules”, “would” or similar expressions suggesting future outcomes or events, although not all forward-looking statements contain these identifying words. Examples of such statements include, but are not limited to, statements concerning: (i) the certainty of an order for 51 CO2 compression package being place; (ii) the completion of the order by the end of Q3 2023; (iii) the value of the order; (iv) that the whole project will be commissioned; and (v) the carbon sequestration capacity as noted in this press release.

These statements are neither promises nor guarantees but involve known and unknown risks and uncertainties that may cause the Company’s actual results, level of activity or performance to be materially different from any future results, levels of activity or performance expressed in or implied by these forward-looking statements. These risks include, generally, risks related to the ability of the Corporation to execute its strategy, operating results, purchasing third party supplies for key materials and components in a timely and cost effective basis, industry and products, technology, competition, ability to attract and retain qualified personnel, ability to manage successfully the anticipated expansion of our operations, the economy, the sufficiency of insurance and other factors which are discussed in greater details in the most recent quarterly management discussion ana analysis (“MD&A”) and in the Annual Information Form of the Corporation filed on SEDAR at www.sedar.com.

Forward-looking statements contained herein are based on a number of assumptions believed by the Corporation to be reasonable as at the date of this press release, including, without limitations, assumptions about trends in certain market segments, the economic climate generally, the pace and outcome of technological development, the identity and expected actions of competitors and customers, the value of the Canadian dollar and of foreign currency fluctuations, interest rates, the anticipated margins under new contracts awards, the state of the Corporation’s current backlog, the regulatory environment, and the procurement of key material and components of products. If these assumptions prove to be inaccurate, the Corporation’s actual results may differ materially from those expressed or implied in the forward-looking statements. The forward-looking statements contained herein are made as of the date of this press release and are expressly qualified in their entirety by this cautionary statement. Except to the extent required by law, the Company undertakes no obligation to publicly update or revise any forward-looking statements contained herein. Readers should not place undue reliance on forward looking statements.


Contacts

Investor Relations:
Xebec Adsorption Inc.
Brandon Chow, Director, Investor Relations
This email address is being protected from spambots. You need JavaScript enabled to view it.
+1 450.979.8700 ext. 5762

BURLINGTON, Ontario--(BUSINESS WIRE)--Anaergia Inc. (“Anaergia” or the “Company“) (TSX: ANRG), a company that offers integrated waste-to-value solutions to reduce greenhouse gases by cost-effectively turning organic waste into renewable natural gas, fertilizer, and water, today announced its financial results for the three-month and the twelve-month periods ended December 31, 2021. All financial results are reported in Canadian dollars unless otherwise stated. Management of Anaergia notes that these results are being released against the backdrop of dramatic changes that have taken place in energy markets in a few short weeks. In management’s view, energy security will become a dominant force for years to come, and this new reality will have dramatic consequences for Anaergia and other international renewable energy supply companies.


Anaergia’s fourth quarter shows higher revenues compared to the same quarter in 2020. We did, however, post a lower gross profit due to cost overruns related to atypical issues with the winding down of a large legacy capital sales project in the Netherlands.

Overall, I’m pleased to report that Anaergia saw a healthy 20% increase in revenues year over year. This was slightly less than we anticipated due to slower ramp-up of volumes at our Rialto Bioenergy Facility (“RBF”) and to global supply chain issues related to the COVID-19 pandemic, both of which are temporary. All indications are that volumes at RBF will accelerate during the year,” said Anaergia’s Chairman and CEO, Andrew Benedek. “I am also happy to note that our Revenue Backlog1 rose to $4.6 billion from $3.5 billion at the end of the third quarter. This was primarily due to the addition of the build-own-operate (“BOO”) project in Tønder, Denmark.

Anaergia’s portfolio of 13 BOO facilities, operating or under construction across North America and Europe, as well as recent development agreements signed, underscore Anaergia’s global leadership position in large-scale RNG production from solid waste, wastewater, and agri-food sectors,” added Dr. Benedek.

Management of Anaergia believes that in Europe, the tight natural gas markets and the tail winds from the European Union’s resolve to achieve natural gas independence from Russia, present an historic opportunity for Anaergia. This is because European BOO projects are expected to be more profitable than originally anticipated and the number of new opportunities for capital sales and investment is expected to increase dramatically.

As we had previously indicated, assuming a natural gas price in Europe of US$26 /MMBTU, (as forecasted for 2022 by the International Energy Agency, before the current conflict in Ukraine), which is well below the average market price of the last six months, the estimated annualized EBITDA for our seven plants that are starting their ramp-ups during the second quarter of this year would increase from an initially forecasted total of approximately $58 million to approximately $97 million. In addition, the certificates associated with the environmental attributes of RNG are also expected to increase, however, this upside is not included in our forecasted EBITDA increase.

Business Highlights

North America

As noted, during 2021, Anaergia saw a slower-than-anticipated ramp up in volumes of organic waste shipped to the RBF in California because of conditions unique to this facility.

Furthermore, RBF is seeing a ramp up in its waste volumes with gradually increasing feedstock supply from the OREX™ line operated by Waste Management Inc. In addition, a second OREX™ line with Universal Waste Systems Inc. is to be installed this summer and a third OREX™ line is being manufactured for this market and is expected to be operating in late 2022, which will all add to feedstock supply for the RBF. Operating at full capacity, these three OREX™ lines would generate enough feedstock to exceed the capacity of RBF. RBF is continuing to store the RNG that it produces in the gas grid, and sales of this RNG are expected to commence during the fourth quarter of 2022, after final registration under the federal Renewable Identification Number (RIN) and state Low Carbon Fuel Standard (LCFS) programs.

Also in California, operations recently commenced at the SoCal Biomethane facility located at the City of Victorville’s wastewater treatment plant, where RNG is being produced and injected into the natural gas pipeline system.

Construction has commenced at the Rhode Island Bioenergy Facility, which was acquired subsequent to Anaergia’s initial public offering (the “IPO”). Construction activity is underway to convert this plant’s renewable energy output from combined heat and power to RNG, which will be injected into the pipeline of a major utility, under the terms of a 20-year offtake agreement. This construction activity is expected to be completed by mid-2023.

At the Charlotte Bioenergy Facility in North Carolina, also acquired post-IPO, construction is expected to start later this year to convert this plant’s renewable energy output to renewable natural gas (RNG) for pipeline injection, with a similar offtake arrangement in place to that of the Rhode Island Bioenergy Facility.

Together, the Rhode Island and Charlotte facilities, which are owned and operated by Anaergia, account for approximately $670 million of the Company’s revenue backlog.

In addition to the project development agreement for the Kent County Sustainability Park announced in March 2022, Anaergia recently entered into an exclusive development agreement with a 20-year lease to develop a food waste-to-RNG and biosolids-to-fertilizer facility, similar in size to RBF, at the Victor Valley Water Reclamation Authority. This is part of an expansion of the successful partnership and is expected to serve the growing need for organic waste diversion and sustainable biosolids management in Southern California.

Europe

In Italy, construction of six BOO facilities is continuing, with the first two of these facilities expected to be commissioned in the second quarter of this year. It is anticipated that all six of these facilities will have started operations by the end of 2022.

In Tønder, Denmark, construction continues on what is expected to be one of the largest anaerobic digestion-to-RNG plants in the world. The project is to start generating revenue from RNG sales in the fourth quarter of 2022, although construction activity at this site is to continue until the third quarter of 2023.

Fiscal 2021 Financial Results

Financial highlights:

  • Revenues for the fourth quarter rose to $50.2 million from $39.9 million during the same period of the previous year. Revenues increased to $153.6 million for fiscal 2021 from $128.0 million in the prior year. The increases were driven primarily by activity in Europe.
  • Gross Profit for the fourth quarter decreased by 36% from the same period in the prior year. The drop is chiefly driven by cost overruns in a large, legacy capital sale project that is in the process of winding down. Gross Profit increased to $31.6 million for fiscal 2021 from $28.6 million in the previous year.
  • Net Loss for the fourth quarter increased to $7.8 million when compared to $1.6 million for the same period the previous year, while the net loss for the year decreased to $9.4 million when compared to $16.8 million for the same period the prior year.
  • Adjusted EBITDA2 for the fourth quarter decreased to break-even from $1.6 million in the fourth quarter of the previous year. Adjusted EBITDA increased to $5.0 million for fiscal 2021 from $3.1 million for the prior year.

Three months ended:

31-Dec-21

31-Dec-20

% Change

(In millions of Canadian dollars)


Revenue

50.2

39.9

26%

Gross profit

6.3

9.9

-36%

Gross profit %

13%

25%


Income (loss) from operations

(2.6)

(2.6)


Net loss

(7.8)

(1.6)


Adjusted EBITDA

0.0

1.6


Twelve months ended:

31-Dec-21

31-Dec-20

% Change

(In millions of Canadian dollars)


Revenue

153.6

128.0

20%

Gross profit

31.6

28.6

11%

Gross profit %

21%

22%


Loss from operations

(8.1)

(4.4)


Net loss

(9.4)

(16.8)


Adjusted EBITDA

5.0

3.1


Statement of


Financial Position

31-Dec-21

31-Dec-20

(In millions of Canadian dollars)


Total Assets

703.9


452.2

Total Liabilities

367.3


326.4

Equity

336.6


125.8

For a more detailed discussion of Anaergia’s results for the three-month and twelve-month periods ended December 31, 2021, please see the Company’s financial statements and management’s discussion & analysis, which are available at https://www.anaergia.com/investor-relations and on the Company’s SEDAR page at www.sedar.com.

Fiscal 2022 and Fiscal 2023 Guidance Update

Despite the significant incremental growth in project bookings, we are revising our Fiscal 2022 and Fiscal 2023 guidance disclosed in our supplemented base PREP prospectus, dated June 18, 2021, as result of the slower than expected ramp up at the RBF and project execution delays caused by short-term supply chain issues. We still expect a healthy year of growth in Fiscal 2022, with an over 50% increase in revenues relative to Fiscal 2021 and Adjusted EBITDA of over 10% of Fiscal 2022 revenues. For Fiscal 2023, management also expects lower than initially anticipated revenues but expects that Adjusted EBITDA will be within our previous guidance.

For more information, including management’s assumptions relating to the foregoing guidance, please refer to the Company’s management’s discussion and analysis of financial condition and results of operations for the three-month and twelve-month periods ended December 31, 2022, which is available on SEDAR at www.sedar.com.

Non-IFRS Measures

This press release makes reference to certain non-IFRS measures. These measures are not recognized measures under IFRS and do not have a standardized meaning prescribed by IFRS and are therefore unlikely to be comparable to similar measures presented by other companies. Rather, these measures are provided as additional information to complement IFRS measures by providing further understanding of our results of operations from management’s perspective. Accordingly, these measures should not be considered in isolation or as a substitute for analysis of our financial information reported under IFRS. We use non-IFRS measures to provide investors with supplemental measures. Management also uses non-IFRS measures internally in order to facilitate operating performance comparisons from period to period, prepare annual operating budgets and assess our ability to meet our future debt service, capital expenditure and working capital requirements. Management believes these non-IFRS measures and industry metrics are important supplemental measures of operating performance because they eliminate items that have less bearing on operating performance and highlight trends in the core business that may not otherwise be apparent when relying solely on IFRS financial measures. Management believes such measures allow for assessment of our operating performance and financial condition on a basis that is more consistent and comparable between reporting periods. We also believe that securities analysts, investors and other interested parties frequently use non-IFRS measures in the evaluation of issuers.

Definitions of non-IFRS measures and industry metrics used in this press release are provided below. A reconciliation of the non-IFRS measures used in this press release to the most comparable IFRS measure can be found below under “Reconciliation of Non-IFRS Measures”.

Adjusted EBITDA” is defined as net earnings before finance costs, taxes and depreciation and amortization adjusted for our normalized proportionate interest in our BOO assets and one-time or non-recurring items, stock-based compensation expense, asset impairment charges and write downs, gains and losses for equity-accounted investees, foreign exchange gains or losses, restructuring costs, ERP customization and configuration costs, litigation and other claims settlements, gains and losses resulting from changes in certain balance sheet valuations (such as derivatives and warrants), acquisition costs and costs related to our initial public offering, including estimated incremental auditing and professional services costs incurred in connection with our initial public offering. For further details, refer to “Reconciliation of Non-IFRS Measures” below.

Revenue Backlog” is defined as the balance of unrecognized, undiscounted, consolidated revenues from signed contracts in our capital sales and services segments and from our BOO assets that are operational, under construction or financially closed over their remaining useful life. We have conservatively modelled for only 20 years of revenue out of the useful life of the BOO assets.

Conference Call and Webcast

A conference call to review the Company’s results for the fourth quarter of 2021 will take place at 11:00 a.m. (ET) on Monday March 28, 2022, hosted by Chief Executive Officer Andrew Benedek, Chief Operating Officer Yaniv Scherson and Chief Financial Officer Hani Kaissi. An accompanying slide presentation will be posted to the Investor Relations section of our website shortly before the call.

To participate in the call please sign up to receive your personal event-joining details at the following pre-registration link:

To listen to the webcast live:

The webcast will be archived and will be available in the Investor Relations section of our website following the call.

About Anaergia

Anaergia was created to eliminate a major source of greenhouse gases by cost effectively turning organic waste into RNG, fertilizer and water, using proprietary technologies. With a proven track record from delivering world leading projects on four continents, Anaergia is uniquely positioned to provide end-to-end solutions for extracting organics from waste, implementing high efficiency anaerobic digestion, upgrading biogas, producing fertilizer and cleaning water. Our customers are in the municipal solid waste, municipal wastewater, agriculture, and food processing industries. In each of these markets Anaergia has built many successful plants including some of the largest in the world. Anaergia owns and operates some of the plants it builds, and it also operates plants that are owned by its customers.

For further information please see: www.anaergia.com

Forward-Looking Statements

This news release may contain forward-looking information within the meaning of applicable securities legislation, which reflects the Company’s current expectations regarding future events. Forward-looking information is based on a number of assumptions and is subject to a number of risks and uncertainties, many of which are beyond the Company’s control. Such risks and uncertainties include, but are not limited to, the factors discussed under “Risk Factors” in the Company’s annual information form dated March 28, 2022 for the fiscal year ended December 31, 2021. Actual results could differ materially from those projected herein. Anaergia does not undertake any obligation to update such forward-looking information, whether as a result of new information, future events or otherwise, except as expressly required under applicable securities laws.

Reconciliation of Non-IFRS Financial Measures

Three months ended:


31-Dec-21


31-Dec-20

(In thousands of Canadian dollars)


Net income (loss)


(7,791

)


(1,550

)

Finance costs


307


(312

)

Depreciation and amortization


982


1,650


Income tax expense


3,769


546


EBITDA


(2,733

)


334


Share-based compensation expense


134


123


Net gain on Fibracast deconsolidation


-


-


(Gain) loss on RBF embedded derivative


(2,160

)


(9,040

)

Stock warrant valuation (gain) loss


-


6,643


Share of loss in equity accounted investees


2,190


1,000


Provision for customer claim


-


-


Other (gains) losses


1,496


400


ERP customization and configuration costs


1,675


-


Costs related to the Offering


(192

)


-


Project development write offs


-


2,418


Foreign exchange (gain) loss


(432

)


351


Adjusted EBITDA


(22

)


1,575


Twelve months ended:


31-Dec-21


31-Dec-20

(In thousands of Canadian dollars)


Net income (loss)


(9,382

)


(16,821

)

Finance costs


(917

)


2,158


Depreciation and amortization


3,354


3,128


Income tax expense


3,066


4,869


EBITDA


(3,879

)


(6,666

)


Share-based compensation expense


539


660


Net gain on Fibracast deconsolidation


(2,346

)


(654

)

(Gain) loss on RBF embedded derivative


(5,673

)


(12,152

)

Gain on warrant forfeitures


(615

)


-


Stock warrant valuation (gain) loss


914


8,387


Share of loss in equity accounted investees


4,819


3,941


Provision for customer claim


3,473


-


Other (gains) losses


1,740


979


ERP customization and configuration costs


3,171


1,300


Costs related to the Offering


4,140


-


Project Development write offs


-


2,418


Foreign exchange (gain) loss


(1,248

)


4,873


Adjusted EBITDA


5,035


3,086


Source: Anaergia, Inc.

________________________
1 See “Non-IFRS Measures and Industry Metrics” below.
2 “Adjusted EBITDA” is a non-IFRS measure.


Contacts

For media relations please contact: Melissa Bailey, Director, Marketing & Corporate Communications, This email address is being protected from spambots. You need JavaScript enabled to view it.
For investor relations please contact: This email address is being protected from spambots. You need JavaScript enabled to view it.

The Green Solutions appoints Black & Veatch to study the generation and storage of green hydrogen and green ammonia in Vietnam


SINGAPORE--(BUSINESS WIRE)--Black & Veatch and The Green Solutions (TGS) have signed a Memorandum of Understanding (MoU) to advance the production and supply of green hydrogen and green ammonia in Vietnam.

Specializing in renewable energy project development, manufacturing and services, TGS leads efforts to harness green energy in Vietnam for the manufacture of green hydrogen and green ammonia. Black & Veatch, a global leader in hydrogen energy development, brings its vast expertise in clean energy technologies and ammonia processing to the project team.

“The Green Solutions is committed to applying the most advanced technologies in the field of renewable energy in Vietnam. Partnering with Black & Veatch will allow us to adapt global best practices to Asia’s requirements and contribute to the region’s zero-carbon future,” said Winnie Huynh, Founder & CEO, TGS.

Hydrogen can be used for power generation, energy storage and advanced transportation solutions. While ammonia, which can be liquified for storage and shipment globally, can be used in multiple energy-intensive industries to produce electricity or other green chemicals.

Under the MoU, Black & Veatch and TGS are targeting to produce 180,000 tons of green ammonia and 30,000 tons of green hydrogen per year to support regional decarbonization efforts.

TGS has appointed Black & Veatch to study the production and storage of green hydrogen in Vietnam utilizing solar or wind power supplied through the grid. The study also includes development of a green ammonia production plant as well as plant configuration and technology review, technology evolution risk and tentative mitigation, conceptual design, order of magnitude cost estimates, and levelized cost calculations. Augustus Global Investments will provide the initial development funding for the project.

“Given our 80-year history working with hydrogen and ammonia production in the fertilizer industry, we bring expertise in all stages of hydrogen infrastructure projects – from technical advisory services and design through operations. As an early mover in serving clients across the hydrogen and ammonia value chains, Black & Veatch is eager to partner with sustainability-focused companies like The Green Solutions as we pursue our shared passion for decarbonizing energy in Asia by broadening the use of green hydrogen and green ammonia,” said Narsingh Chaudhary, Executive Vice President & Managing Director, Asia Pacific, Black & Veatch.

“Augustus integrates environmental, social and corporate governance (ESG) factors in our investment and portfolio management processes. We are pleased to support forward-thinking businesses like The Green Solutions and Black & Veatch as they work to realize Asia’s decarbonization ambitions,” said Fadi Krikor, Founder & CEO, Augustus Global Investments.

The MoU responds to Asia’s optimism for green fuels such as hydrogen and ammonia. According to Black & Veatch’s 2022 Asia Electric Report, 73 percent of respondents believe that hydrogen will help meet carbon emissions goals beyond 10 years from now – more than any other technology. In addition, the report also reveals that 46 percent think it will take off as a clean and affordable alternative to gas generation by 2030.

As a global engineering, procurement, consulting, and construction partner, Black & Veatch has strong experience in the development of renewable energy and natural gas feedstocks; water treatment for industrial applications; hydrogen generation and purification; hydrogen compression, handling and power generation; and selection of cost-effective storage technology.

Click here to download a supporting image.

Editor’s Notes:

  • Black & Veatch has been selected as Owner’s Engineer by Intermountain Power Agency (IPA) for the Intermountain Power Project Renewal Project (IPPRP), which marks one of the earliest installations of combustion turbine technology designed to use a high percentage of green hydrogen.
  • Black & Veatch provided conceptual design and conducted a cost assessment for the integration of gaseous hydrogen from nearby industrial facilities as a combustion fuel into the Long Ridge Energy Terminal 485-MW combined cycle GE 7HA.02 advanced class power plant.
  • Black & Veatch has been selected by Enegix Energy to perform a feasibility study to support the development of the world’s largest green hydrogen plant. The facility is targeting production of more than 600 million kilograms of green hydrogen annually.

About Black & Veatch

Black & Veatch is a 100-percent employee-owned global engineering, procurement, consulting and construction company with a more than 100-year track record of innovation in sustainable infrastructure. Since 1915, we have helped our clients improve the lives of people around the world by addressing the resilience and reliability of our most important infrastructure assets. Our revenues in 2021 exceeded US$3.3 billion. Follow us on www.bv.com and on social media.


Contacts

EMILY CHIA | +65 6335 6623 P | +65 9875 8907 M | This email address is being protected from spambots. You need JavaScript enabled to view it.
24-HOUR MEDIA HOTLINE | +1 855-999-5991

HAMILTON, Bermuda--(BUSINESS WIRE)--OIL held its March 2022 Board Meeting on Tuesday, March 22nd and its 2022 AGM by virtual means on Thursday, March 24th.


During the Board meeting, the directors approved the Company’s 2021 financial statements, discussed the execution progress of the 5 year Strategic Plan and approved the payment of a $350 million dividend on or before June 30th, 2022 for shareholders of record on March 22nd, 2022.

During the AGM, the Shareholders approved a broadened Definition for Energy Operations that adds biochemicals, biofuels, renewable fuels, hydrogen and carbon capture and/or sequestration to OIL’s existing Energy Operations definition. They also elected a new Board of Directors who will serve for a year ending at the March 2023 AGM.

After the AGM, the newly elected Board met and elected John Weisner as Chair of the Board and Robert Wondolleck as Deputy Chair.

Over the past 12 months, OIL welcomed five new shareholders to the mutual – North West Redwater Partnership, Formosa Plastics, Edison International, Los Angeles Department of Water & Power and CEZ.

For 2021, OIL recorded a $266.0 million underwriting profit. After factoring in net investment gains and administrative expenses, OIL’s net profit for the year was $667.5 million. For additional information about OIL’s 2021 financial results, please visit www.oil.bm to view our audited financial statements.

Bertil Olsson, President and CEO, explained, “The Board decided to authorize the $350 million dividend after carefully reviewing the company’s multi-year Capital Management Plan and while considering future capital needs that may come out of its Strategic Plan which was finalized in December 2021.”

George Hutchings, Senior Vice President and COO commented, “the strong performance in 2021 and the robust capital position of the company has enabled us to once again return a significant amount of capital to our shareholders and demonstrate the superior value of the OIL model.”

For more information about OIL’s property coverages and related value go to www.oil.bm.

Oil Insurance Limited (OIL) insures over $3.6 trillion of global energy assets for more than sixty members with per occurrence property limits up to $450 million totaling more than $22 billion in total A rated property capacity. Members are medium to large sized public and private energy companies with at least $1 billion in physical property assets and an investment grade rating or equivalent. Products/coverage offered include Property (Physical Damage), Windstorm (excluding Offshore GOM), Non Gradual Pollution, Control of Well, Removal of Wreck, Terrorism, Cyber, Construction and Cargo. The industry sectors that OIL protects include Offshore and Onshore Exploration & Production, Refining and Marketing, Petrochemicals, Mining, Pipelines, Electric Utilities, Solar, Offshore and Onshore Wind, Offshore and Onshore Carbon Capture, Hydrogen, Biochemicals/BioFuels/Renewable Fuels, Electrical Storage and other related energy business sectors.

Further inquiries regarding this press release should be directed to George Hutchings, SVP & COO at This email address is being protected from spambots. You need JavaScript enabled to view it. or +1 (441) 295-0905.


Contacts

George Hutchings, SVP & COO
This email address is being protected from spambots. You need JavaScript enabled to view it.
+1 (441) 295-0905

HOUSTON--(BUSINESS WIRE)--CenterPoint Energy, Inc. (NYSE: CNP) or “CenterPoint” continues to execute on its long-term strategic plan of becoming a pure-play regulated utility, with an improved business risk profile and strengthened balance sheet, to benefit both its customers and investors.


The company today announced it has entirely exited its midstream interest with the sale of its Energy Transfer (“ET”) holdings, including its remaining 51 million ET common units and all its ET Series G preferred units.

Including the previously announced transactions, CenterPoint monetized its ownership in ET common units at an approximate 20% premium on an aggregated basis to the ET common unit price when the merger between ET and Enable Midstream Partners, LP (“Enable”) was announced on February 12, 2021. The company fully exited the stake within four months of merger close. The net proceeds will be used to pay down associated debt and taxes from the transaction.

Additionally, Moody’s Investors Service, Inc. recently revised the CenterPoint Energy, Inc. downgrade threshold of cash flow from operations (pre-working capital) to debt ratio to 13% from 14%. The agency noted the company’s recent credit strengths, including improving business risk profile with the exit of the midstream business, its characterization of the company as diverse group of regulated utilities operating in credit supportive regulatory environments, and good economic and regulatory diversity across the company’s service territories.

“As committed, we have taken decisive actions to align our interests more closely with those of our customers and our investors, including refocusing on our core regulated utility businesses. We are committed to delivering on our strategic plan, which includes more than $40 billion of capital investments in our utility footprint over our 10-year financial plan, as well as 8% non-GAAP EPS growth annually through 2024 and the mid-to-high end of 6-8% annual growth of non-GAAP EPS thereafter through 2030. As we extend our track record of meeting and exceeding expectations, we believe our accelerated exit from midstream well ahead of our goal of year-end 2022 demonstrates that we are a management team that is committed to becoming a premium utility with industry-leading growth,” said President and CEO Dave Lesar.

Lesar continued, “We believe that these actions to improve our business risk profile and strengthen our balance sheet, coupled with investments in our pure-play regulated business and efficient recycling of capital, position us firmly on that path. Our long-term strategy also supports a transition to a cleaner energy future that will benefit our customers and our investors.”

About CenterPoint Energy, Inc.

As the only investor owned electric and gas utility based in Texas, CenterPoint Energy, Inc. (NYSE: CNP) is an energy delivery company with electric transmission and distribution, power generation and natural gas distribution operations that serve more than 7 million metered customers in Indiana, Louisiana, Minnesota, Mississippi, Ohio and Texas. As of December 31, 2021, the company owned approximately $38 billion in assets. With approximately 9,400 employees, CenterPoint Energy and its predecessor companies have been in business for more than 150 years. For more information, visit CenterPointEnergy.com.

Earnings Outlook

As included in this press release, non-GAAP diluted earnings per share (“non-GAAP EPS”) is not a generally accepted accounting principles (“GAAP”) financial measure. Generally, a non-GAAP financial measure is a numerical measure of a company’s historical or future financial performance that excludes or includes amounts that are not normally excluded or included in the most directly comparable GAAP financial measure.

Non-GAAP EPS includes net income from the company’s Electric and Natural Gas segments, as well as after tax Corporate and Other operating income and an allocation of corporate overhead based upon Electric’s and Natural Gas’s relative earnings contribution. Corporate overhead consists primarily of interest expense, preferred stock dividend requirements, and other items directly attributable to the parent along with the associated income taxes.

  • Non-GAAP EPS guidance excludes:
    • Earnings or losses from the change in value of CenterPoint Energy’s 2.0% Zero-Premium Exchangeable Subordinated Notes due 2029 (“ZENS”) and related securities;
    • Gain and impact, including related expenses, associated with Arkansas and Oklahoma gas LDC sales; and
    • Income and expense related to ownership and disposal of ET common and Series G preferred units, and a corresponding amount of debt related to the units.

In providing this guidance, CenterPoint Energy does not consider the items noted above and other potential impacts such as changes in accounting standards, impairments or other unusual items, which could have a material impact on GAAP reported results for the applicable guidance period. The non-GAAP EPS guidance range also considers assumptions for certain significant variables that may impact earnings, such as customer growth and usage including normal weather, throughput, recovery of capital invested, effective tax rates, financing activities and related interest rates, and regulatory and judicial proceedings. To the extent actual results deviate from these assumptions, the non-GAAP EPS guidance range may not be met or the projected annual non-GAAP EPS growth rate may change. CenterPoint Energy is unable to present a quantitative reconciliation of forward-looking non-GAAP diluted earnings per share because changes in the value of ZENS and related securities, future impairments, and other unusual items are not estimable and are difficult to predict due to various factors outside of management’s control. Management evaluates CenterPoint Energy’s financial performance in part based on non-GAAP earnings per share. Management believes that presenting this non-GAAP financial measure enhances an investor’s understanding of CenterPoint Energy’s overall financial performance by providing them with an additional meaningful and relevant comparison of current and anticipated future results across periods. The adjustments made in this non-GAAP financial measure excludes items that Management believes do not most accurately reflect the company’s fundamental business performance. CenterPoint Energy’s non-GAAP diluted earnings per share measures should be considered as a supplement to, and not as a substitute for, or superior to, diluted earnings per share, which respectively are the most directly comparable GAAP financial measure. This non-GAAP financial measure also may be different than non-GAAP financial measures used by other companies.

Forward-looking Statements

This news release includes forward-looking statements within the meaning of the Private Securities Litigation Reform Act of 1995. When used in this news release, the words "anticipate," "believe," "continue," "could," "estimate," "expect," "forecast," "goal," "intend," "may," "objective," "plan," "potential," "predict," "projection," "should," "target," "will" or other similar words are intended to identify forward-looking statements. These forward-looking statements are based upon assumptions of management which are believed to be reasonable at the time made and are subject to significant risks and uncertainties. Actual events and results may differ materially from those expressed or implied by these forward-looking statements. Any statements in this news release regarding capital investments, future earnings and guidance, including long-term growth rate, future financial performance and results of operations, including with respect to regulatory actions and recoverability of capital investments, and any other statements that are not historical facts are forward-looking statements. Each forward-looking statement contained in this news release speaks only as of the date of this release.

Important factors that could cause actual results to differ materially from those indicated by the provided forward-looking information include, but are not limited to, risks and uncertainties relating to: (1) CenterPoint Energy’s potential business strategies and strategic initiatives, restructurings, joint ventures and acquisitions or dispositions of assets or businesses, including the completed sale of our Natural Gas businesses in Arkansas and Oklahoma and the exit from midstream, which we cannot assure you will have the anticipated benefits to us; (2) industrial, commercial and residential growth in CenterPoint Energy’s service territories and changes in market demand; (3) CenterPoint Energy's ability to fund and invest planned capital, and timely and appropriate rate actions that allow recovery of costs and a reasonable return on investment, including those related to Indiana Electric’s generation transition plan as part of its more recent IRP; (4) financial market and general economic conditions, including access to debt and equity capital and the effect on sales, prices and costs; (5) continued disruptions to the global supply chain; (6) actions by credit rating agencies, including any potential downgrades to credit ratings; (7) the timing and impact of regulatory proceedings and actions and legal proceedings, including those related to Houston Electric’s mobile generation leases; (8) legislative decisions, including tax and developments related to the environment such as global climate change, air emissions, carbon, waste water discharges and the handling of coal combustion residuals, among others, and CenterPoint Energy’s Net Zero targets; (9) the impact of the COVID-19 pandemic; (10) the recording of impairment charges; (11) weather variations and CenterPoint Energy’s ability to mitigate weather impacts, including impacts from the February 2021 winter storm event; (12) changes in business plans; (13) CenterPoint Energy’s ability to execute on its initiatives, targets and goals, including its Net Zero emission goals and operations and maintenance goals; and (14) other factors discussed CenterPoint Energy’s Annual Report on Form 10-K for the fiscal year ended December 31, 2021, including in the “Risk Factors” and “Cautionary Statement Regarding Forward-Looking Information” sections of such report, and other reports CenterPoint Energy or its subsidiaries may file from time to time with the Securities and Exchange Commission.


Contacts

Media:
Communications
This email address is being protected from spambots. You need JavaScript enabled to view it.
Investors:
Jackie Richert
Phone 713.207.6500

AUSTIN, Texas--(BUSINESS WIRE)--Atwell, LLC is pleased to promote Larry Cole to Project Manager in our real estate and land development division. Based in Atwell’s Austin, TX office, Larry will be responsible for managing project coordination and execution, developing project objectives, guiding his team’s deliverables, providing quality control, maintaining project budgets and schedules, and managing and developing client relationships.


With over 30 years of experience in the surveying field, Larry brings tremendous technical and industry leadership to the firm, as well as a diverse project portfolio ranging from residential and commercial developments to transmission lines and wind farms, as well as marine surveying. Prior to Atwell, he worked nearly 10 years as Chief of Crews where he managed survey crews and regularly updated clients for subdivision projects throughout Texas. At Atwell, whether he is performing transmission line surveying for a 256-mile line in West Texas for Oncor or working on wind farms in West Texas for Sun Electric staking location of turbines, Larry’s experience has proved him invaluable to his team and clients through all project types and phases.

“Larry’s management skills and experience on land development projects, along with his expertise in power and energy makes him an excellent leader for our team,” said Atwell Vice President Todd Janssen. “He brings the industry knowledge, expertise, and responsiveness necessary to meet our clients’ needs and help expand our growing professional services.”

Atwell, LLC is a national consulting, engineering, and construction services firm with technical professionals located across the country. Creating innovative solutions for clients in industries such as real estate and land development, power and energy, and oil and gas, Atwell provides comprehensive turnkey services including land and right-of-way support, planning, landscape architecture, engineering, land surveying, environmental compliance and permitting, and project and program management.


Contacts

Timothy Augustine, Senior Vice President
ATWELL, LLC
248.447.2005
This email address is being protected from spambots. You need JavaScript enabled to view it.

HOUSTON--(BUSINESS WIRE)--USD Partners LP (NYSE: USDP) (the “Partnership”) today announced it has entered into an agreement to acquire entities owning the Hardisty South terminal assets (“Hardisty South”) from USD Group LLC (“USDG” or the “Sponsor”), exchange the Sponsor’s economic general partner interest in the Partnership (“GP Interest”) for a non-economic GP Interest and eliminate the Sponsor’s incentive distribution rights (“IDRs”) in the Partnership for total consideration of $75 million in cash and approximately 5.75 million common units (the “Transaction”). The cash portion of the Transaction is expected to be funded with borrowings under the Partnership’s $275 million senior secured credit facility.


Transaction Highlights

  • Increases size, scale and growth capacity of the Partnership’s asset base
  • Expected to provide double-digit accretion to the Partnership’s Distributable Cash Flow per Unit in 2023, improving the potential for Distribution Per Unit growth
  • Supports Management’s focus on delivering sustainable, long-term Distributable Cash Flow to the Partnership’s unitholders by improving contract profile tenor, anchored by a long-term contract with ConocoPhillips
  • Optimizes operational and commercial synergies of Hardisty Terminal and consolidates benefits of blue-chip Diluent Recovery Unit (“DRU”) asset growth at the MLP for the benefit of all Partnership unitholders
  • Elimination of IDRs and economic GP Interest simplifies the Partnership’s financial structure and better aligns the interests of its unitholders with our Sponsor, who will continue to own a substantial number of common units post-transaction

“We are pleased to announce that the Partnership is acquiring Hardisty South from USDG and simplifying its financial structure by eliminating its IDRs and economic GP Interest. As we have previously stated, we are very focused on maintaining our momentum in 2022 as we continue to see opportunities for our DRUbit™ by Rail™ network to provide safer and more economic benefits to our customers,” said Dan Borgen, the Partnership’s Chief Executive Officer. “The acquisition of Hardisty South is expected to provide the Partnership with a growth platform by which it can realize the accretion and additional long-term commitments that our DRUbit™ by Rail™ network is able to provide. Simplifying the Partnership’s structure is critical to our growth strategy, and we look forward to sharing more details about our growth opportunities in the future.”

“We are excited to announce this accretive set of transactions at the Partnership,” said Adam Altsuler, the Partnership’s Chief Financial Officer. “Based on our estimates for future heavy crude oil production in Western Canada and the current availability of egress alternatives, we are expecting double digit accretion to the Partnership’s Distributable Cash Flow starting in 2023, as a result of the Transaction. This estimated accretion is based on an estimated annual Net Cash Provided by Operating Activities and Adjusted EBITDA contribution of between $14 and $18 million in 2023.”

Estimated Closing

  • The Transaction is expected to close during the second quarter of 2022, subject to receipt of required consents
  • Post-closing, USDG will hold a non-economic GP interest in the Partnership and approximately 17.3 million common units, representing approximately 52% of the total outstanding units in the Partnership
  • The Transaction was approved by the Board of Directors of the general partner of the Partnership based on the approval and recommendation of its Conflicts Committee, which consists entirely of independent directors

Advisors

The Conflicts Committee engaged Jefferies LLC as its financial advisor and Sidley Austin LLP as its legal advisor. The Sponsor engaged Tudor, Pickering, Holt & Co. as its financial advisor and Gibson, Dunn & Crutcher LLP as its legal advisor.

About USD Partners LP

USD Partners LP is a fee-based, growth-oriented master limited partnership formed in 2014 by USDG to acquire, develop and operate midstream infrastructure and complementary logistics solutions for crude oil, biofuels and other energy-related products. The Partnership generates substantially all of its operating cash flows from multi-year, take-or-pay contracts with primarily investment grade customers, including major integrated oil companies and refiners. The Partnership’s principal assets include a network of crude oil terminals that facilitate the transportation of heavy crude oil from Western Canada to key demand centers across North America. The Partnership’s operations include railcar loading and unloading, storage and blending in on-site tanks, inbound and outbound pipeline connectivity, truck transloading, as well as other related logistics services. In addition, the Partnership provides customers with leased railcars and fleet services to facilitate the transportation of liquid hydrocarbons and biofuels by rail. For additional information, please visit www.usdp.com.

About USDG

USDG and its affiliates, which own the general partner of USD Partners LP, are engaged in designing, developing, owning, and managing large-scale multi-modal logistics centers and energy-related infrastructure across North America. USDG solutions create flexible market access for customers in significant growth areas and key demand centers, including Western Canada, the U.S. Gulf Coast and Mexico. Among other projects, USDG is currently pursuing the development of a premier energy logistics terminal on the Houston Ship Channel with capacity for substantial tank storage, multiple docks (including barge and deepwater), inbound and outbound pipeline connectivity, as well as a rail terminal with unit train capabilities. For additional information, please visit www.usdg.com. Information on websites referenced in this release is not part of this release.

Adjusted EBITDA

The Partnership defines Adjusted EBITDA as Net Cash Provided by Operating Activities adjusted for changes in working capital items, interest, income taxes, foreign currency transaction gains and losses, and other items which do not affect the underlying cash flows produced by the Partnership’s businesses. Adjusted EBITDA is a non-GAAP, supplemental financial measure used by management and external users of the Partnership’s financial statements, such as investors and commercial banks, to assess:

  • the Partnership’s liquidity and the ability of the Partnership’s businesses to produce sufficient cash flows to make distributions to the Partnership’s unitholders; and
  • the Partnership’s ability to incur and service debt and fund capital expenditures.

The Partnership believes that the presentation of Adjusted EBITDA in this press release provides information that enhances an investor's understanding of the Partnership’s ability to generate cash for payment of distributions and other purposes. The GAAP measure most directly comparable to Adjusted EBITDA is Net Cash Provided by Operating Activities. Adjusted EBITDA should not be considered an alternative to Net Cash Provided by Operating Activities or any other measure of liquidity presented in accordance with GAAP. Adjusted EBITDA exclude some, but not all, items that affect Net Cash Provided by Operating Activities and this measure may vary among other companies. Due to the uncertainty and inherent difficulty of predicting the occurrence and future impact of certain items, which could be significant, the Partnership is unable to provide a quantitative reconciliation of the estimated future Adjusted EBITDA contribution from Hardisty South to Net Cash Provided by Operating Activities.

Distributable Cash Flow

The Partnership defines Distributable Cash Flow, or DCF, as Adjusted EBITDA less net cash paid for interest, income taxes and maintenance capital expenditures. DCF does not reflect changes in working capital balances. DCF is a non-GAAP, supplemental financial measure used by management and by external users of the Partnership’s financial statements, such as investors and commercial banks, to assess:

  • the amount of cash available for making distributions to the Partnership’s unitholders;
  • the excess cash flow being retained for use in enhancing the Partnership’s existing business; and
  • the sustainability of the Partnership’s current distribution rate per unit.

Cautionary Note Regarding Forward-Looking Statements

This press release contains forward-looking statements within the meaning of U.S. federal securities laws, including statements with respect to the timing and benefits of the transaction, future financial results, growth, closing of the transaction, and performance of assets. Words and phrases such as “expect,” “plan,” “intent,” “believes,” “projects,” “begin,” “anticipates,” “able,” “subject to” and similar expressions are used to identify such forward-looking statements. However, the absence of these words does not mean that a statement is not forward-looking. Forward-looking statements relating to the Partnership are based on management’s expectations, estimates and projections about the Partnership, its interests, USD’s projects and the energy industry in general on the date this press release was issued. These statements are not guarantees of future performance and involve certain risks, uncertainties and assumptions that are difficult to predict. Therefore, actual outcomes and results may differ materially from what is expressed or forecast in such forward-looking statements. Factors that could cause actual results or events to differ materially from those described in the forward-looking statements include the impact of the novel coronavirus (COVID-19) pandemic and related economic impact and changes in general economic conditions and commodity prices, as well as those factors set forth under the heading “Risk Factors” and elsewhere in the Partnership’s most recent Annual Report on Form 10-K and in the Partnership’s subsequent filings with the Securities and Exchange Commission (many of which may be amplified by the COVID-19 pandemic and the significant volatility in demand for, and fluctuations in the prices of, crude oil, natural gas and natural gas liquids). The Partnership is under no obligation (and expressly disclaims any such obligation) to update or alter its forward-looking statements, whether as a result of new information, future events or otherwise, except as required by law.


Contacts

Adam Altsuler
Executive Vice President, Chief Financial Officer
(281) 291-3995
This email address is being protected from spambots. You need JavaScript enabled to view it.

Jennifer Waller
Senior Director, Financial Reporting & Investor Relations
(281) 991-8383
This email address is being protected from spambots. You need JavaScript enabled to view it.

Offshore Source Logo

Offshore Source keeps you updated with relevant information concerning the Offshore Energy Sector.

Any views or opinions represented on this website belong solely to the author and do not represent those of the people, institutions or organizations that Offshore Source or collaborators may or may not have been associated with in a professional or personal capacity, unless explicitly stated.

Corporate Offices

Technology Systems Corporation
8502 SW Kansas Ave
Stuart, FL 34997

info@tscpublishing.com