Business Wire News

CALGARY, Alberta--(BUSINESS WIRE)--Imperial Oil Limited (TSE: IMO, NYSE American: IMO) announced today the terms of its substantial issuer bid (the “Offer”) pursuant to which the company will offer to purchase for cancellation up to $2,500,000,000 of its common shares (the “Shares”). Subject to obtaining certain exemptive relief under applicable securities laws in Canada and the United States, the Offer will proceed by way of a modified Dutch auction that includes the ability for shareholders to participate via a proportionate tender. The modified Dutch auction procedure will have a tender price range from $62.00 per Share to $78.00 per Share. All amounts are in Canadian dollars.


The Offer is expected to commence on May 6, 2022 and remain open for acceptance until 5:00 p.m. (Calgary time) on June 10, 2022, unless withdrawn, extended or varied by Imperial.

The Offer will be for up to approximately 6 percent of Imperial’s total number of issued and outstanding Shares (based on a purchase price equal to the minimum purchase price per Share and 669,143,714 Shares issued and outstanding as at the close of business on May 2, 2022).

Exxon Mobil Corporation (“ExxonMobil”), Imperial’s majority shareholder, has advised Imperial that it will make a proportionate tender in connection with the Offer in order to maintain its proportionate Share ownership at approximately 69.6 percent following completion of the Offer.

Holders of Shares wishing to tender to the Offer may do so pursuant to: (i) auction tenders in which the tendering shareholders specify the number of Shares being tendered at a specified price of not less than $62.00 per Share and not more than $78.00 per Share in increments of $0.25 per Share; (ii) purchase price tenders in which they will not specify a price per Share, but will rather agree to have a specified number of Shares purchased at the Purchase Price, as defined below; or (iii) proportionate tenders in which they will agree to sell, at the Purchase Price, a number of Shares that will result in them maintaining their proportionate Share ownership in Imperial following completion of the Offer. Shareholders who validly tender Shares without specifying the method in which they are tendering their Shares, or who make an invalid proportionate tender, including by tendering an insufficient number of Shares, will be deemed to have made a purchase price tender. For purposes of determining the Purchase Price, shareholders who make, or who are deemed to have made, a purchase price tender will be deemed to have tendered their Shares at the minimum price of $62.00 per Share.

The purchase price to be paid by Imperial for each validly deposited Share taken up by the company (the “Purchase Price”) will be determined upon expiry of the Offer and will be based on the number of Shares validly deposited pursuant to auction tenders and purchase price tenders, and prices specified by shareholders making auction tenders. As a result, Imperial’s shareholders who tender their Shares (other than ExxonMobil and shareholders who make proportionate tenders) will set the Purchase Price for the Offer. The Purchase Price will be the lowest price (which will not be less than $62.00 per Share and not more than $78.00 per Share) that enables the company to purchase Shares up to the maximum amount available for auction tenders and purchase price tenders, determined in accordance with the terms of the Offer. Shares deposited at or below the Purchase Price as finally determined by Imperial will be purchased at such Purchase Price. Shares that will not be taken up in connection with the Offer, including Shares deposited pursuant to auction tenders at prices above the Purchase Price, will be returned to the shareholders.

If the aggregate purchase price for Shares validly tendered pursuant to auction tenders and purchase price tenders is greater than the amount available for auction tenders and purchase price tenders (after taking into consideration the proportionate tenders), Imperial will purchase Shares from the shareholders who made purchase price tenders or tendered at or below the Purchase Price as finally determined by Imperial on a pro rata basis, except that “odd lot” holders (shareholders who own fewer than 100 Shares) will not be subject to proration.

Imperial expects to mail the formal offer to purchase, issuer bid circular, letter of transmittal, notice of guaranteed delivery and other related documents (collectively, the “Offer Documents”) containing the terms and conditions of the Offer, instructions for tendering Shares, and the factors considered by Imperial, its Special Committee and its Board of Directors in determining to approve the Offer, among other considerations, on or about May 6, 2022. The Offer Documents will be filed with the applicable securities regulators in Canada and the United States and will be available free of charge on SEDAR at www.sedar.com and on EDGAR at www.sec.gov. Shareholders should carefully read the Offer Documents prior to making a decision with respect to the Offer.

The Offer will not be conditional upon any minimum number of Shares being tendered. The Offer will, however, be subject to other conditions described in the Offer Documents and Imperial will reserve the right, subject to applicable laws, to withdraw, extend or vary the Offer, if, at any time prior to the payment for deposited Shares, certain events occur.

Imperial’s Board of Directors has approved the making of the Offer and the price range for the purchase of Shares thereunder upon the recommendation of its Special Committee. However, none of Imperial, its Special Committee, its Board of Directors, the dealer manager or the depositary makes any recommendation to any shareholder as to whether to deposit or refrain from depositing Shares under the Offer. Shareholders are urged to evaluate carefully all information in the Offer, consult their own financial, legal, investment and tax advisors and make their own decisions whether to deposit Shares under the Offer, how many Shares to deposit, whether to deposit Shares pursuant to the same tender option or different tender options and whether to specify a price or prices and, if so, at what price or prices to deposit such Shares.

The Offer referred to in this news release has not yet commenced. This news release is for informational purposes only and does not constitute an offer to buy or the solicitation of an offer to sell Shares. An offer to buy the Shares will only be made pursuant to Offer Documents to be filed with the applicable securities regulators in Canada and the United States which remains subject to obtaining the necessary exemptive relief under applicable securities laws in Canada and the United States. The Offer will be optional for all shareholders, who will be free to choose whether to participate, how many Shares to tender and, in the case of auction tenders, at what price to tender within the specified range. Any shareholder who does not deposit any Shares (or whose Shares are not repurchased under the Offer) will realize a proportionate increase in equity interest in Imperial, to the extent that Shares are purchased under the Offer.

Imperial has retained RBC Capital Markets to act as financial advisor and dealer manager in connection with the Offer and Computershare Investor Services Inc. (“Computershare”) to act as depositary. Any questions or requests for information may be directed to Computershare at 1 (800) 564-6253 (Toll Free within North America) or 1 (514) 982-7555 (outside North America) or to RBC Capital Markets as dealer manager for the Offer at This email address is being protected from spambots. You need JavaScript enabled to view it..

Imperial is one of Canada’s largest integrated oil companies. It is active in all phases of the petroleum industry in Canada, including the exploration for, and production and sale of, crude oil and natural gas. In Canada, it is a major producer of crude oil, the largest petroleum refiner and a leading marketer of petroleum products. It is also a major producer of petrochemicals. The company’s operations are conducted in three main segments: Upstream, Downstream and Chemical.

Source: Imperial

Cautionary statement: Statements of future events or conditions in this release, including projections, expectations and estimates are forward-looking statements. Forward-looking statements can be identified by words such as believe, anticipate, intend, propose, plan, expect, future, continue, likely, may, should, will and similar references to future periods. Forward-looking statements in this release include, but are not limited to, references to the aggregate amount of Shares to be purchased for cancellation under the Offer; the structure of the bid including a modified Dutch auction procedure and proportionate tender; the terms and conditions and tender price range; timing for mailing the Offer Documents, commencement and expiration; and ExxonMobil’s intent to make a proportionate tender.

Forward-looking statements are based on the company's current expectations, estimates, projections and assumptions at the time the statements are made. Actual future financial and operating results, including expectations and assumptions concerning demand growth and energy source, supply and mix; commodity prices, foreign exchange rates and general market conditions; production rates, growth and mix; project plans, timing, costs, technical evaluations and capacities, and the company’s ability to effectively execute on these plans and operate its assets; that the necessary exemptive relief to proceed with the Offer under applicable securities laws in the United States and Canada will be received on the timeline anticipated; ExxonMobil making a proportionate tender in connection with the Offer; progression of COVID-19 and its impacts on Imperial’s ability to operate its assets; applicable laws and government policies, including restrictions in response to COVID-19; and capital and environmental expenditures could differ materially depending on a number of factors. These factors include global, regional or local changes in supply and demand for oil, natural gas, and petroleum and petrochemical products and resulting price, differential and margin impacts, including foreign government action with respect to supply levels and prices and the impact of COVID-19 on demand; the receipt, in a timely manner, of regulatory approvals; availability and allocation of capital; unanticipated technical or operational difficulties; operational hazards and risks; availability and performance of third-party service providers, including in light of restrictions related to COVID-19; management effectiveness and disaster response preparedness, including business continuity plans in response to COVID-19; currency exchange rates; political or regulatory events, including changes in law or government policy in response to COVID-19; general economic conditions; and other factors discussed in Item 1A risk factors and Item 7 management’s discussion and analysis of financial condition and results of operations of Imperial Oil Limited’s most recent annual report on Form 10-K and subsequent interim reports on Form 10-Q.

Forward-looking statements are not guarantees of future performance and involve a number of risks and uncertainties, some that are similar to other oil and gas companies and some that are unique to Imperial Oil Limited. Imperial’s actual results may differ materially from those expressed or implied by its forward-looking statements and readers are cautioned not to place undue reliance on them. Imperial undertakes no obligation to update any forward-looking statements contained herein, except as required by applicable law.

After more than a century, Imperial continues to be an industry leader in applying technology and innovation to responsibly develop Canada’s energy resources. As Canada’s largest petroleum refiner, a major producer of crude oil, a key petrochemical producer and a leading fuels marketer from coast to coast, our company remains committed to high standards across all areas of our business.

Source: Imperial


Contacts

Investor Relations
(587) 476-4743

Media Relations
(587) 476-7010

HOUSTON--(BUSINESS WIRE)--ConocoPhillips (NYSE: COP) today announced that Tim Leach, previously executive vice president, Lower 48, has become advisor to the chief executive officer, effective May 1, 2022. In addition to his new role, Leach will continue serving as a member of the company’s board of directors.


In conjunction with this change, the company also announced that Jack Harper, previously president, Permian for ConocoPhillips, and former president of Concho Resources, has assumed the role of executive vice president, Lower 48 and joined the ConocoPhillips executive leadership team, effective May 1, 2022. Harper has more than 25 years of experience leading operations, finance, corporate planning/strategy, capital markets and business development functions.

“Tim is an industry visionary who founded Concho in 2004 and grew it into one of the Permian’s largest and best-run producers. He has been instrumental in guiding our Lower 48 organization and driving value from the Concho transaction,” said Ryan Lance, ConocoPhillips chairman and chief executive officer. “He and I share a similar philosophy for this industry, and I am pleased that we will continue benefiting from his significant experience and strategic relationships in his new role and as a member of the board of directors. I am also pleased to welcome Jack to our executive leadership team. He is a proven leader who will ensure that our Lower 48 organization does its part in delivering on the company’s Triple Mandate of meeting energy transition pathway demand, generating competitive returns on and of capital and achieving our net-zero emissions ambition.”

“We ushered in a new era of energy leadership with the strategic combination of the ConocoPhillips and Concho assets, operations and teams. I am so proud of what we have accomplished thus far and look forward to continuing to work with Ryan to deliver value for ConocoPhillips,” said Leach. “I have also had the pleasure of working with Jack for close to 20 years. He brings tremendous experience and a true passion for this business, and I look forward to seeing Jack continue driving efficiency and value across the company’s low cost of supply Lower 48 business.”

--- # # # ---

About ConocoPhillips

ConocoPhillips is one of the world’s leading exploration and production companies based on both production and reserves, with a globally diversified asset portfolio. Headquartered in Houston, Texas, ConocoPhillips had operations and activities in 14 countries, $91 billion of total assets and approximately 9,900 employees at Dec. 31, 2021. Production including Libya averaged 1,567 thousand barrels of oil equivalent per day for the 12 months ended Dec. 31, 2021, and proved reserves were 6.1 billion barrels of oil equivalent as of Dec. 31, 2021. For more information, go to www.conocophillips.com.

CAUTIONARY STATEMENT FOR THE PURPOSES OF THE "SAFE HARBOR" PROVISIONS OF THE PRIVATE SECURITIES LITIGATION REFORM ACT OF 1995

This news release contains forward-looking statements as defined under the federal securities laws. Forward-looking statements relate to future events, plans and anticipated results of operations, business strategies, and other aspects of our operations or operating results. Words and phrases such as “anticipate,” “estimate,” “believe,” “budget,” “continue,” “could,” “intend,” “may,” “plan,” “potential,” “predict,” “seek,” “should,” “will,” “would,” “expect,” “objective,” “projection,” “forecast,” “goal,” “guidance,” “outlook,” “effort,” “target” and other similar words can be used to identify forward-looking statements. However, the absence of these words does not mean that the statements are not forward-looking. Where, in any forward-looking statement, the company expresses an expectation or belief as to future results, such expectation or belief is expressed in good faith and believed to be reasonable at the time such forward-looking statement is made. However, these statements are not guarantees of future performance and involve certain risks, uncertainties and other factors beyond our control. Therefore, actual outcomes and results may differ materially from what is expressed or forecast in the forward-looking statements. Factors that could cause actual results or events to differ materially from what is presented include the impact of public health crises, including pandemics (such as COVID-19) and epidemics and any related company or government policies or actions; global and regional changes in the demand, supply, prices, differentials or other market conditions affecting oil and gas, including changes resulting from any ongoing military conflict, including the conflict between Russia and Ukraine and the global response to it, or from a public health crisis or from the imposition or lifting of crude oil production quotas or other actions that might be imposed by OPEC and other producing countries and the resulting company or third-party actions in response to such changes; changes in commodity prices, including a prolonged decline in these prices relative to historical or future expected levels; insufficient liquidity or other factors, such as those listed herein, that could impact our ability to repurchase shares and declare and pay dividends such that we suspend our share repurchase program and reduce, suspend, or totally eliminate dividend payments in the future, whether variable or fixed; changes in expected levels of oil and gas reserves or production; potential failures or delays in achieving expected reserve or production levels from existing and future oil and gas developments, including due to operating hazards, drilling risks or unsuccessful exploratory activities; unexpected cost increases or technical difficulties in constructing, maintaining or modifying company facilities; legislative and regulatory initiatives addressing global climate change or other environmental concerns; investment in and development of competing or alternative energy sources; disruptions or interruptions impacting the transportation for our oil and gas production; international monetary conditions and exchange rate fluctuations; changes in international trade relationships, including the imposition of trade restrictions or tariffs on any materials or products (such as aluminum and steel) used in the operation of our business, including any sanctions imposed as a result of any ongoing military conflict, including the conflict between Russia and Ukraine; our ability to collect payments when due under our settlement agreement with PDVSA; our ability to collect payments from the government of Venezuela as ordered by the ICSID; our ability to liquidate the common stock issued to us by Cenovus Energy Inc. at prices we deem acceptable, or at all; our ability to complete any announced or any future dispositions or acquisitions on time, if at all; the possibility that regulatory approvals for any announced or any future dispositions or acquisitions will not be received on a timely basis, if at all, or that such approvals may require modification to the terms of the transactions or our remaining business; business disruptions following the acquisition of assets from Shell (the “Shell Acquisition”) or any other announced or any future dispositions or acquisitions, including the diversion of management time and attention; the ability to deploy net proceeds from our announced or any future dispositions in the manner and timeframe we anticipate, if at all; potential liability for remedial actions under existing or future environmental regulations; potential liability resulting from pending or future litigation, including litigation related directly or indirectly to our transaction with Concho Resources Inc.; the impact of competition and consolidation in the oil and gas industry; limited access to capital or significantly higher cost of capital related to illiquidity or uncertainty in the domestic or international financial markets; general domestic and international economic and political conditions or developments, including as a result of any ongoing military conflict, including the conflict between Russia and Ukraine; the ability to successfully integrate the assets from the Shell Acquisition or achieve the anticipated benefits from the transaction; unanticipated difficulties or expenditures relating to the Shell Acquisition; changes in fiscal regime or tax, environmental and other laws applicable to our business; and disruptions resulting from accidents, extraordinary weather events, civil unrest, political events, war, terrorism, cyber attacks or information technology failures, constraints or disruptions; and other economic, business, competitive and/or regulatory factors affecting our business generally as set forth in our filings with the Securities and Exchange Commission. Unless legally required, ConocoPhillips expressly disclaims any obligation to update any forward-looking statements, whether as a result of new information, future events or otherwise.


Contacts

Dennis Nuss (media)
281-293-1149
This email address is being protected from spambots. You need JavaScript enabled to view it.

Investor Relations
281-293-5000
This email address is being protected from spambots. You need JavaScript enabled to view it.

HAMILTON, Bermuda--(BUSINESS WIRE)--Valaris Limited (NYSE: VAL) (“Valaris” or the “Company”) today issued a quarterly Fleet Status Report that provides the current status of the Company’s fleet of offshore drilling rigs along with certain contract information for these assets. The Fleet Status Report can be found on the “Investors” section of the Company’s website www.valaris.com.


About Valaris Limited

Valaris Limited (NYSE: VAL) is the industry leader in offshore drilling services across all water depths and geographies. Operating a high-quality rig fleet of ultra-deepwater drillships, versatile semisubmersibles and modern shallow-water jackups, Valaris has experience operating in nearly every major offshore basin. Valaris maintains an unwavering commitment to safety, operational excellence, and customer satisfaction, with a focus on technology and innovation. Valaris Limited is a Bermuda exempted company (Bermuda No. 56245). To learn more, visit our website at www.valaris.com.

Cautionary Statements

Statements contained in this press release that are not historical facts are forward-looking statements within the meaning of Section 27A of the Securities Act of 1933, as amended, and Section 21E of the Securities Exchange Act of 1934, as amended. Forward-looking statements include words or phrases such as "anticipate," "believe," "estimate," "expect," "intend," “likely,” "plan," "project," "could," "may," "might," “should,” “will” and similar words. The forward-looking statements contained in this press release are subject to numerous risks, uncertainties and assumptions that may cause actual results to vary materially from those indicated, including the COVID-19 outbreak and global pandemic and the related public health measures implemented by governments worldwide; the cancellation, suspension, renegotiation or termination of drilling contracts and programs, including drilling contracts which grant the customer termination rights if final investment decision (FID) is not received with respect to projects for which the drilling rig is contracted; oil and natural gas price volatility, customer demand for drilling rigs; downtime and other risks associated with offshore rig operations; severe weather or hurricanes; changes in worldwide rig supply, competition and technology; risks inherent to shipyard rig reactivation, upgrade, repair or maintenance; our ability to enter into, and the terms of, future drilling contracts; suitability of rigs for future contracts; governmental regulatory, legislative and permitting requirements affecting drilling operations; our ability to obtain financing, fund capital expenditures and pursue other business opportunities; the effects of our emergence from bankruptcy on the Company's business, relationships, comparability of our financial results and ability to access financing sources; actions taken by regulatory authorities or other third parties, including related to the COVID-19 global pandemic; increased scrutiny of Environmental, Social and Governance (“ESG”) practices and reporting responsibilities; changes in customer strategy; future levels of offshore drilling activity; governmental action, civil unrest and political and economic uncertainties; terrorism, piracy and military action; environmental or other liabilities, risks or losses; debt agreement restrictions that may limit our liquidity and flexibility; failure to satisfy our debt obligations; and cybersecurity risks and threats. In addition to the numerous factors described above, you should also carefully read and consider “Item 1A. Risk Factors” in Part I and “Item 7. Management’s Discussion and Analysis of Financial Condition and Results of Operations” in Part II of our most recent annual report on Form 10-K, which is available on the Securities and Exchange Commission’s website at www.sec.gov or on the Investor Relations section of our website at www.valaris.com. Each forward-looking statement speaks only as of the date of the particular statement and we undertake no obligation to update or revise any forward-looking statements, except as required by law.


Contacts

Investor & Media Contact:
Tim Richardson
Director - Investor Relations
+1-713-979-4619

TULSA, Okla.--(BUSINESS WIRE)--Francis Energy, LLC (Francis Energy), the owner and operator of the nation’s first comprehensive statewide network of electric vehicle (EV) fast charging infrastructure, announced today an equity investment in the company by Alliance Resource Partners, L.P. (NASDAQ: ARLP). The investment brings together two Tulsa-based American success stories to help change the way Americans drive for generations to come.


ARLP Chairman, President and Chief Executive Officer Joseph W. Craft III said of today’s announcement, “The growth of the electric vehicle market in the United States is undeniable and the need to buildout EV charging infrastructure to support this growth is critical. We view our investment with Francis Energy as an important step in ARLP’s participation in this next generation energy platform.”

Mr. Craft added, “The Francis Energy team has demonstrated their ability to successfully develop a business model deploying EV charging sites that can be scaled across the nation. We believe ARLP’s relationships with utilities, industrial customers and federal and state governments, along with our technology and manufacturing capabilities will accelerate Francis Energy’s deployment of this critical infrastructure. We are excited to be a part of this historic endeavor.”

Under the agreement, the Francis Energy executive team will continue its day-to-day management of the company and, as a significant minority shareholder, ARLP will hold a seat on the Francis Energy board of directors.

Francis Energy Founder and Chief Executive Officer David Jankowsky noted, “Having a strategic partner like Alliance Resource Partners will help Francis Energy expand our buildout of a public EV fast-charging network that reaches beyond the Midwest and into the eastern United States.”

Mr. Jankowsky added, “Alliance Resource Partners is one of the preeminent diversified public energy companies in the U.S. and its support of Francis Energy reinforces our position as a leader in transforming transportation.”

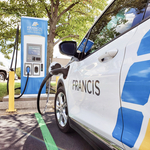
Francis Energy has built the first in the nation comprehensive statewide network of fast chargers across the state of Oklahoma with stations virtually every 50 miles. The Oklahoma network ensures rural areas, tribal lands, and underserved communities have reliable access to EV charging stations and serves as a successful model in building a public charging network across middle America. The company won competitive state grants earlier this year in Missouri and Kansas to build new charging stations along heavily traveled interstate highways.

Francis Energy recently announced partnerships to expand its national charging network with two fuel and convenience store operators ─ Fuel Maxx, in the Houston metro area, and Wally’s, at a new charging center located outside St. Louis. Francis is currently expanding its fast-charging network into 35 states.

Francis Energy was advised by Perella Weinberg Partners and Skadden, Arps, Slate, Meagher & Flom.

ARLP was advised by Rose, Grasch, Camenisch & Mains.

About Francis Energy, LLC

Francis Energy's mission is to create regional networks of public access electric vehicle charging equipment in order to encourage and support the widespread adoption of electric vehicles. Its business strategy is to develop, construct, and operate electric vehicle ("EV") charging infrastructure projects in under-served rural and urban markets throughout the Midwest. Francis has a track record of success in developing and constructing EV charging infrastructure, including building and operating one of the largest EV charging networks in the USA. For more information, visit https://francisenergy.com

About Alliance Resource Partners, L.P.

ARLP is a diversified energy company that is currently the second largest coal producer in the eastern United States. ARLP also generates royalty income from mineral interests it owns in strategic coal, oil & gas producing regions in the United States. In addition, ARLP is positioning itself as an energy provider for the future by leveraging its core technology and operating competencies to make strategic investments in the fast-growing energy and infrastructure transition.

News, unit prices and additional information about ARLP, including filings with the Securities and Exchange Commission are available at http://www.arlp.com. For more information, contact the investor relations department of ARLP at (918) 295-7674 or via e-mail at This email address is being protected from spambots. You need JavaScript enabled to view it..


Contacts

For Francis Energy contact Tom Alexander 202-262-4284
For Alliance Resource Partners, L.P. contact Brian L. Cantrell 918-295-7673

Continued Strong Operational Performance – 99% Revenue Efficiency in 1Q 2022
Four Floater Reactivation Projects in Progress for Contracts Expected to Commence in 2Q 2022
Drillship VALARIS DS-12 Awarded Contract Offshore West Africa
Jackups VALARIS 113 and 114 Sold for a Total of $125 Million

HAMILTON, Bermuda--(BUSINESS WIRE)--Valaris Limited (NYSE: VAL) ("Valaris" or the "Company") today reported first quarter 2022 results.


President and Chief Executive Officer Anton Dibowitz said, “The heart of our business, and our primary focus every day, is on delivering safe, reliable and efficient operations to our customers. I would like to thank the Valaris team for continuing to deliver the strong performance that our customers have come to expect from us, achieving 99% revenue efficiency during the first quarter.”

Dibowitz commented, “We are currently in the midst of a transitional period as we incur reactivation costs to put three drillships and one semisubmersible back to work on long-term contracts. I am proud of the progress that the entire Valaris team has made in executing these major projects concurrently, particularly considering the ongoing pandemic, personnel and global supply chain challenges. VALARIS DPS-1 recently returned to work, and we continue to expect that all four floaters will be on contract by the middle of the year with financial results expected to improve meaningfully as these reactivations are completed.”

Dibowitz added, “Very recently, we were awarded a contract with a major operator offshore Angola and the Republic of Congo for drillship VALARIS DS-12. The operating rate for this contract, which is expected to take place during the first quarter 2023, is at a level not seen in the past seven years for drillship work offshore West Africa, providing further evidence of the improvement in floater day rates across geographies.”

Dibowitz concluded, “We continue to take a rational approach to fleet management, including regularly assessing our fleet for retirement and divestiture candidates. In this regard, we recently sold two jackups, VALARIS 113 and 114, to ADES for a total of $125 million, a value which is highly accretive to our shareholders. Each of these rigs had been stacked for more than six years and would have required meaningful capital to reactivate.”

First Quarter Review

Revenues increased to $318 million in the first quarter 2022 from $306 million in the fourth quarter 2021. Excluding reimbursable items, revenues increased to $291 million in the first quarter from $283 million in the fourth quarter primarily due to higher utilization for the jackup fleet and higher average day rates for the other segment, partially offset by lower utilization for the floater fleet.

Contract drilling expense increased to $331 million in the first quarter 2022 from $286 million in the fourth quarter 2021. Excluding reimbursable items, contract drilling expense increased to $305 million in the first quarter from $264 million in the fourth quarter, primarily due to higher rig reactivation costs, which increased to $62 million in the first quarter from $37 million in the fourth quarter, as we prepare four floaters for long-term contracts that are expected to commence in the second quarter. The remaining variance was due to higher personnel costs, higher repair and maintenance costs and higher mobilization costs.

Depreciation expense decreased to $23 million in the first quarter 2022 from $25 million in the fourth quarter 2021. General and administrative expense increased marginally to $19 million in the first quarter 2022 from $18 million in the fourth quarter 2021.

Other income decreased to $9 million in the first quarter 2022 from $21 million in the fourth quarter 2021. First quarter other income included a gain on sale of assets of $2 million related to the sale of jackup VALARIS 67 compared to a $21 million gain on sale of assets related to the sale of jackups VALARIS 22, 37 and 142 in the fourth quarter. The remaining variance is primarily due to lower reorganization-related professional fees in the first quarter as compared to the fourth quarter.

Tax benefit decreased to $1 million in the first quarter 2022 from $31 million in the fourth quarter 2021. The first quarter tax provision included $15 million of discrete tax benefit primarily related to a reduction in liabilities for unrecognized tax benefits associated with tax positions taken in prior years. The fourth quarter tax provision included $30 million of discrete tax benefit primarily related to a reduction in liabilities for unrecognized tax benefits associated with tax positions taken in prior years and deferred tax benefits associated with Swiss tax reform. Adjusted for discrete items, tax expense of $14 million in the first quarter compared to a tax benefit of $1 million in the fourth quarter. The increase in tax expense is primarily due to changes in the relative components of our earnings generated in tax jurisdictions with higher tax rates compared to the prior quarter, and to a reduction in deferred tax valuation allowances in the prior quarter.

Net loss was $40 million in the first quarter 2022 compared to net income of $28 million in the fourth quarter 2021. Adjusted EBITDA decreased to negative $31 million in the first quarter from $3 million in the fourth quarter. Adjusted EBITDAR decreased to $31 million in the first quarter from $40 million in the fourth quarter.

Segment Review

Floaters

Floater revenues decreased marginally to $100 million in the first quarter 2022 from $101 million in the fourth quarter 2021. Excluding reimbursable items, revenues decreased to $87 million in the first quarter from $93 million in the fourth quarter. The sequential quarter decline was primarily due to semisubmersible VALARIS DPS-5 being out of service for most of the first quarter while undergoing a five-year special survey prior to starting the first of several new contracts. This was partially offset by higher utilization and average day rates for the drillship fleet.

Contract drilling expense increased to $148 million in the first quarter 2022 from $114 million in the fourth quarter 2021. Excluding reimbursable items, contract drilling expense increased to $135 million in the first quarter from $106 million in the fourth quarter. The sequential quarter increase was primarily due to higher rig reactivation costs, which increased to $61 million in the first quarter from $34 million in the fourth quarter, as we prepared drillships VALARIS DS-4, DS-9 and DS-16 as well as semisubmersible VALARIS DPS-1 for new long-term contracts. Included within first quarter reactivation costs is approximately $4 million related to minor damage arising from an incident involving VALARIS DS-16, which broke free from its moorings during gale force winds. We also incurred repair and maintenance costs in the first quarter on semisubmersible VALARIS DPS-5 while the rig was in the shipyard undergoing a five-year special survey.

Jackups

Jackup revenues increased to $181 million in the first quarter 2022 from $172 million in the fourth quarter 2021. Excluding reimbursable items, revenues increased to $170 million in the first quarter from $160 million in the fourth quarter. The sequential quarter increase was primarily due to higher utilization on VALARIS 249, 117, 144 and Norway, each of which commenced new contracts either in the first quarter or late in the fourth quarter. This was partially offset by idle time between contracts for VALARIS Viking and 107.

Contract drilling expense increased to $139 million in the first quarter 2022 from $128 million in the fourth quarter 2021. Excluding reimbursable items, contract drilling expense increased to $129 million in the first quarter from $117 million in the fourth quarter. The sequential quarter increase was primarily due to higher costs resulting from more operating days across the jackup fleet in the first quarter and higher mobilization costs primarily related to VALARIS 144.

ARO Drilling

Revenues increased to $111 million in the first quarter 2022 from $105 million in the fourth quarter 2021 primarily due to higher utilization and the addition of VALARIS 140 to the leased rig fleet late in the first quarter. Contract drilling expense decreased to $84 million in the first quarter from $89 million in the fourth quarter. Operating income was $5 million in the first quarter compared to an operating loss of $6 million in the fourth quarter. EBITDA was $22 million in the first quarter compared to $11 million in the fourth quarter.

Other

Revenues increased to $38 million in the first quarter 2022 from $33 million in the fourth quarter 2021 primarily due to higher day rates for managed rigs Mad Dog and Thunder Horse, which were each awarded two-year contract extensions, effective from late January. Contract drilling expense increased marginally to $16 million in the first quarter from $15 million in the fourth quarter. Operating income increased to $22 million in the first quarter from $16 million in the fourth quarter. EBITDA increased to $23 million in the first quarter from $17 million in the fourth quarter.


First Quarter


Floaters


Jackups


ARO


Other


Reconciling Items


Consolidated Total

(in millions of $, except %)

Q1
2022

Q4
2021

Chg


Q1
2022

Q4
2021

Chg


Q1
2022

Q4
2021

Chg


Q1
2022

Q4
2021

Chg


Q1
2022

Q4
2021


Q1
2022

Q4
2021

Chg


Revenues

99.7


100.5


(1

)%


180.7

172.3

5

%


111.3

105.4


6

%


38.0

32.7

16

%


(111.3

)

(105.4

)


318.4


305.5


4

%

Operating expenses


Contract drilling

147.6


113.8


30

%


139.2

128.0

9

%


84.2

88.9


(5

)%


15.5

15.4

1

%


(55.2

)

(60.6

)


331.3


285.5


16

%

Depreciation

12.2


11.7


4

%


9.1

12.1

(25

)%


16.5

17.7


(7

)%


0.9

1.1

(18

)%


(16.2

)

(17.5

)


22.5


25.1


(10

)%

General and admin.


%


%


5.2

5.1


2

%


%


13.6


13.2


18.8


18.3


3

%

Equity in earnings (losses) of ARO


%


%


%


%


4.3


(1.3

)


4.3


(1.3

)

nm


Operating income (loss)

(60.1

)

(25.0

)

140

%


32.4

32.2

1

%


5.4

(6.3

)

nm


21.6

16.2

33

%


(49.2

)

(41.8

)


(49.9

)

(24.7

)

102

%


Net income (loss)

(60.0

)

(25.4

)

136

%


34.7

52.8

(34

)%


1.4

(10.0

)

nm


21.6

16.2

33

%


(37.5

)

(5.9

)


(39.8

)

27.7


nm


Adjusted EBITDA

(48.7

)

(12.9

)

278

%


43.0

44.4

(3

)%


21.9

11.4


92

%


22.6

17.3

31

%


(69.7

)

(57.5

)


(30.9

)

2.7


nm


Adjusted EBITDAR

12.2


20.9


(42

)%


43.6

47.7

(9

)%


21.9

11.4


92

%


22.6

17.4

30

%


(69.7

)

(57.5

)


30.6


39.9


(23

)%

Fresh Start Accounting

Valaris emerged from Chapter 11 bankruptcy protection on April 30, 2021 (the "Effective Date"). Upon emergence, Valaris applied fresh start accounting which resulted in Valaris becoming a new reporting entity for accounting and financial reporting. Accordingly, our financial statements and notes after the Effective Date are not comparable to our financial statements and notes prior to that date. As required by GAAP, results for the second quarter must be presented separately for the predecessor period from April 1, 2021, through April 30, 2021 (the "Predecessor" period) and the successor period from May 1, 2021, through June 30, 2021 (the "Successor" period). However, the Company has combined certain results of the Predecessor and Successor periods ("Combined" results) as non-GAAP measures to compare the combined second quarter with other quarters since we believe it provides the most meaningful basis to analyze our results. The Predecessor and Successor results for the second quarter are more fully discussed in our quarterly report on Form 10-Q for the period ended June 30, 2021 filed with the SEC on August 3, 2021.

As previously announced, Valaris will hold its first quarter 2022 earnings conference call at 9:00 a.m. CT (10:00 a.m. ET) on Tuesday, May 3, 2022. An updated investor presentation will be available on the Valaris website after the call.

About Valaris Limited

Valaris Limited (NYSE: VAL) is the industry leader in offshore drilling services across all water depths and geographies. Operating a high-quality rig fleet of ultra-deepwater drillships, versatile semisubmersibles, and modern shallow-water jackups, Valaris has experience operating in nearly every major offshore basin. Valaris maintains an unwavering commitment to safety, operational excellence, and customer satisfaction, with a focus on technology and innovation. Valaris Limited is a Bermuda exempted company. To learn more, visit the Valaris website at www.valaris.com.

Forward-Looking Statements

Statements contained in this press release that are not historical facts are forward-looking statements within the meaning of Section 27A of the Securities Act of 1933, as amended, and Section 21E of the Securities Exchange Act of 1934, as amended. Forward-looking statements include words or phrases such as "anticipate," "believe," "estimate," "expect," "intend," "likely," "plan," "project," "could," "may," "might," "should," "will" and similar words and specifically include statements regarding expected financial performance; expected utilization, day rates, revenues, operating expenses, rig commitments and availability, cash flows, contract status, terms and duration, contract backlog, capital expenditures, insurance, financing and funding; the effect, impact, potential duration and other implications of the ongoing COVID-19 pandemic; impact of our emergence from bankruptcy; the offshore drilling market, including supply and demand, customer drilling programs, stacking of rigs, effects of new rigs on the market and effect of the volatility of commodity prices; expected work commitments, awards and contracts; letters of intent; scheduled delivery dates for rigs; performance of our joint venture with Saudi Aramco; the timing of delivery, mobilization, contract commencement, availability, relocation or other movement of rigs; future rig reactivations; expected divestitures of assets; general market, business and industry conditions, trends and outlook; general political conditions, including political tensions, conflicts and war (such as the ongoing conflict in Ukraine); future operations; increasing regulatory complexity; the outcome of tax disputes; assessments and settlements; and expense management. The forward-looking statements contained in this press release are subject to numerous risks, uncertainties and assumptions that may cause actual results to vary materially from those indicated, including the COVID-19 outbreak and global pandemic and the related public health measures implemented by governments worldwide, which may, among other things, impact our ability to staff rigs and rotate crews; cancellation, suspension, renegotiation or termination of drilling contracts and programs, including drilling contracts which grant the customer termination right if FID is not received with respect to projects for which the drilling rig is contracted; potential additional asset impairments; failure to satisfy our debt obligations; our ability to obtain financing, service our debt, fund capital expenditures and pursue other business opportunities; adequacy of sources of liquidity for us and our customers; the effects of our emergence from bankruptcy on the Company's business, relationships, comparability of our financial results and ability to access financing sources; actions by regulatory authorities, or other third parties; actions by our security holders; commodity price fluctuations and volatility, customer demand, new rig supply, downtime and other risks associated with offshore rig operations; severe weather or hurricanes; changes in worldwide rig supply and demand, competition and technology; consumer preferences for alternative fuels; increased scrutiny of our Environmental, Social and Governance ("ESG") practices and reporting responsibilities; changes in customer strategy; future levels of offshore drilling activity; governmental action, civil unrest and political and economic uncertainties; terrorism, piracy and military action; risks inherent to shipyard rig reactivation, upgrade, repair, maintenance or enhancement; our ability to enter into, and the terms of, future drilling contracts; suitability of rigs for future contracts; the cancellation of letters of intent or letters of award or any failure to execute definitive contracts following announcements of letters of intent, letters of award or other expected work commitments; the outcome of litigation, legal proceedings, investigations or other claims or contract disputes; governmental regulatory, legislative and permitting requirements affecting drilling operations; our ability to attract and retain skilled personnel on commercially reasonable terms; environmental or other liabilities, risks or losses; debt restrictions that may limit our liquidity and flexibility; and cybersecurity risks and threats. In addition to the numerous factors described above, you should also carefully read and consider "Item 1A. Risk Factors" in Part I and "Item 7. Management’s Discussion and Analysis of Financial Condition and Results of Operations" in Part II of our most recent annual report on Form 10-K, which is available on the SEC’s website at www.sec.gov or on the Investor Relations section of our website at www.valaris.com. Each forward-looking statement speaks only as of the date of the particular statement, and we undertake no obligation to update or revise any forward-looking statements, except as required by law.


VALARIS LIMITED AND SUBSIDIARIES
CONSOLIDATED STATEMENTS OF OPERATIONS
(In millions, except per share amounts)


Three Months Ended


Successor


Combined
(Non-GAAP) (1)


Predecessor


March 31,
2022


December 31,
2021


September 30,
2021


June 30,
2021


March 31,
2021

OPERATING REVENUES

$

318.4


$

305.5


$

326.7


$

293.1


$

307.1


OPERATING EXPENSES


Contract drilling (exclusive of depreciation)


331.3


285.5


274.6


258.8


253.6


Loss on impairment


756.5


Depreciation


22.5


25.1


24.4


54.1


122.1


General and administrative


18.8


18.3


27.2


19.1


24.3


Total operating expenses


372.6


328.9


326.2


332.0


1,156.5


EQUITY IN EARNINGS (LOSSES) OF ARO


4.3


(1.3

)


2.6


6.0


1.9


OPERATING INCOME (LOSS)


(49.9

)


(24.7

)


3.1


(32.9

)


(847.5

)


OTHER INCOME (EXPENSE)


Interest income


10.9


11.0


9.7


8.8


2.6


Interest expense, net (Unrecognized contractual interest expense for debt subject to compromise was $32.6 million and $100.3 million for the three months ended June 30, 2021 and March 31, 2021, respectively)


(11.5

)


(11.7

)


(11.3

)


(9.1

)


(1.3

)

Reorganization items, net


(1.0

)


(4.9

)


(6.5

)


(3,536.5

)


(52.2

)

Other, net


11.0


27.0


5.5


9.0


22.5


9.4


21.4


(2.6

)


(3,527.8

)


(28.4

)


INCOME (LOSS) BEFORE INCOME TAXES


(40.5

)


(3.3

)


0.5


(3,560.7

)


(875.9

)


PROVISION (BENEFIT) FOR INCOME TAXES


(0.7

)


(31.0

)


53.3


(0.4

)


31.7


NET INCOME (LOSS)


(39.8

)


27.7


(52.8

)


(3,560.3

)


(907.6

)


NET (INCOME) LOSS ATTRIBUTABLE TO NONCONTROLLING INTERESTS


1.2


(1.7

)


(2.9

)


(2.4

)


NET INCOME (LOSS) ATTRIBUTABLE TO VALARIS

$

(38.6

)


$

27.7


$

(54.5

)


$

(3,563.2

)


$

(910.0

)


INCOME (LOSS) PER SHARE - BASIC AND DILUTED

$

(0.51

)


$

0.37


$

(0.73

)


n/m


$

(4.56

)

WEIGHTED-AVERAGE SHARES OUTSTANDING - BASIC AND DILUTED


75.0


75.0


75.0


n/m


199.6


(1)

Represents the combined results of operations for the two-months ended June 30, 2021 (Successor) and the one-month ended April 30, 2021 (Predecessor).


VALARIS LIMITED AND SUBSIDIARIES
CONSOLIDATED BALANCE SHEETS
(In millions)


Successor


Predecessor


March 31,
2022

December 31,
2021

September 30,
2021

June 30,
2021


March 31,
2021

ASSETS


CURRENT ASSETS


Cash and cash equivalents

$

578.2


$

608.7


$

620.8


$

608.8


$

291.7


Restricted cash


30.0


35.9


33.9


53.1


17.1


Accounts receivable, net


439.3


444.2


455.8


436.1


449.8


Other current assets


125.7


117.8


117.0


119.7


366.4


Total current assets

$

1,173.2


$

1,206.6


$

1,227.5


$

1,217.7


$

1,125.0


PROPERTY AND EQUIPMENT, NET


930.2


890.9


892.3


897.8


10,083.9


LONG-TERM NOTES RECEIVABLE FROM ARO


256.8


249.1


241.3


234.3


442.7


INVESTMENT IN ARO


90.9


86.6


87.9


85.4


122.8


OTHER ASSETS


186.6


176.0


153.5


166.5


172.5


$

2,637.7


$

2,609.2


$

2,602.5


$

2,601.7


$

11,946.9


LIABILITIES AND SHAREHOLDERS' EQUITY


CURRENT LIABILITIES


Accounts payable - trade

$

311.2


$

225.8


$

203.0


$

183.9


$

176.8


Accrued liabilities and other


212.1


196.2


223.8


212.7


290.6


Total current liabilities

$

523.3


$

422.0


$

426.8


$

396.6


$

467.4


LONG-TERM DEBT


545.5


545.3


545.1


544.8


OTHER LIABILITIES


544.8


581.1


591.3


569.8


704.6


TOTAL LIABILITIES NOT SUBJECT TO COMPROMISE


1,613.6


1,548.4


1,563.2


1,511.2


1,172.0


LIABILITIES SUBJECT TO COMPROMISE


7,313.7


TOTAL EQUITY


1,024.1


1,060.8


1,039.3


1,090.5


3,461.2


$

2,637.7


$

2,609.2


$

2,602.5


$

2,601.7


$

11,946.9


VALARIS LIMITED AND SUBSIDIARIES
CONSOLIDATED STATEMENTS OF CASH FLOWS
(In millions)


Three Months Ended


Successor


Combined
(Non-GAAP) (1)


Predecessor


March 31,
2022

December 31,
2021

September 30,
2021


June 30,
2021


March 31,
2021

OPERATING ACTIVITIES


Net income (loss)

$

(39.8

)

$

27.7


$

(52.8

)


$

(3,560.3

)


$

(907.6

)

Adjustments to reconcile net loss to net cash provided by (used in) operating activities:


Depreciation expense


22.5


25.1


24.4


54.1


122.1


Accretion of discount on shareholder note


(7.7

)


(7.9

)


(6.9

)


(6.0

)


Equity in losses (earnings) of ARO


(4.3

)


1.3


(2.6

)


(6.0

)


(1.9

)

Net periodic pension and retiree medical income


(4.0

)


(2.6

)


(3.7

)


(3.8

)


(4.0

)

Share-based compensation expense


3.4


2.7


1.6


1.0


3.8


Gain on asset disposals


(2.5

)


(21.0

)


(0.3

)


(4.5

)


(1.4

)

Amortization, net


1.6


(0.5

)


3.1


(0.5

)


(4.6

)

Deferred income tax expense (benefit)


(0.6

)


(22.5

)


0.1


(18.0

)


0.9


Amortization of debt issuance cost


0.2


0.2


(0.1

)


0.4


Loss on impairment


756.5


Non-cash reorganization items, net


3,487.3


Other


0.3


0.2


1.3


5.8


Changes in operating assets and liabilities


32.5


(9.0

)


45.0


21.9


20.9


Contributions to pension plans and other post-retirement benefits


(0.8

)


(1.0

)


(1.1

)


(0.9

)


(22.2

)

Net cash provided by (used in) operating activities

$

0.5


$

(7.2

)

$

6.9


$

(34.0

)


$

(31.7

)


INVESTING ACTIVITIES


Additions to property and equipment

$

(38.5

)

$

(26.5

)

$

(15.6

)


$

(10.8

)


$

(6.0

)

Net proceeds from disposition of assets


1.3


23.6


1.3


26.6


3.7


Net cash provided by (used in) investing activities

$

(37.2

)

$

(2.9

)

$

(14.3

)


$

15.8


$

(2.3

)


FINANCING ACTIVITIES


Issuance of first lien notes

$


$


$


$

520.0


$


Payments to Predecessor creditors


(129.9

)


Other


(1.4

)


Net cash provided by financing activities

$


$


$


$

388.7


$


Effect of exchange rate changes on cash and cash equivalents

$

0.3


$


$

0.2


$

(0.3

)


$

(0.1

)


INCREASE (DECREASE) IN CASH AND CASH EQUIVALENTS AND RESTRICTED CASH

$

(36.4

)

$

(10.1

)

$

(7.2

)


$

370.2


$

(34.1

)

CASH AND CASH EQUIVALENTS AND RESTRICTED CASH, BEGINNING OF PERIOD


644.6


654.7


661.9


291.7


325.8


CASH AND CASH EQUIVALENTS AND RESTRICTED CASH, END OF PERIOD

$

608.2


$

644.6


$

654.7


$

661.9


$

291.7


Contacts

Investor & Media Contact:
Tim Richardson
Director - Investor Relations
+1-713-979-4619


Read full story here

Partnership Accelerates Ubiquitous Energy’s Discovery and Deployment of New Transparent Solar Materials Using Artificial Intelligence

REDWOOD CITY, Calif.--(BUSINESS WIRE)--Ubiquitous Energy, a next-generation technology company that provides truly transparent solar products, has announced a long-term partnership with Citrine Informatics, the leading artificial intelligence service provider for materials development. Ubiquitous Energy will utilize the Citrine Platform for AI-driven materials discovery, accelerating the discovery and deployment of its proprietary transparent solar materials.


Urgent climate change imperatives, disruptive geopolitical realities, and shifting consumer trends have coalesced to create surging demand for renewable energy sources, and solar power is at the forefront of this movement.

Ubiquitous Energy is the world leader in transparent solar technology. To further advance its competitive edge, the company continues to develop new, more efficient transparent solar materials at the molecular level. This requires the company’s scientists and engineers to think differently and use cutting-edge technology to accelerate research.

“We are exploring a near-infinite space of new material possibilities, so we need the ability to rapidly identify and assess the most promising materials. Citrine’s artificial intelligence platform allows us to do that,” said Miles Barr, Ubiquitous Energy co-founder and CTO. “By systematically incorporating artificial intelligence into our discovery and development process, we have already reduced the development time for new materials by over 50%, accelerating the time to market for future generations of our transparent solar materials.”

The announcement follows Ubiquitous Energy launching and implementing the Citrine Platform for transparent solar materials in 2021. The effort was made possible by close collaboration between the two companies, which put in place an AI-driven new materials development workflow around Ubiquitous Energy’s proprietary semiconductor materials. The initial success paved the way for the companies to enter a long-term partnership agreement.

“It’s exciting to see the platform being used by pioneering startups as well as large multinationals. In each case, the value of AI-driven R&D is clear and transformational,” said Citrine Informatics CEO Greg Mulholland. “Citrine’s mission is to enable a greener, more efficient world by accelerating the development and deployment of next-generation materials and chemicals, like those being pioneered by Ubiquitous Energy. This project achieves this in a very direct way.”

About Ubiquitous Energy

Headquartered in Silicon Valley, Ubiquitous Energy is a next-generation technology company that provides energy-efficient, transparent solar windows to both commercial and residential customers. A world leader in transparent photovoltaics, its award-winning technology was born from some of the world’s most prestigious university labs and is the world’s only truly transparent solar product. UE Power™ is a solar coating that integrates into standard windows without sacrificing beauty, design or vision, with endless possibilities for future applications. For more information please visit us at https://ubiquitous.energy/ or connect with us via Facebook, Twitter, or LinkedIn.

About Citrine Informatics

Citrine Informatics is the award-winning materials informatics platform for data-driven materials and chemicals development. It won the 2017 World Materials Forum Start-up Challenge, the 2018 AI Breakthrough award as the “Best AI-based Solution for Manufacturing,” and 2020-2021 Cleantech 100 honors. The Citrine Platform combines smart materials data infrastructure and AI, which accelerates development of cutting-edge materials, facilitates product portfolio optimization, and codifies research IP, enabling its reuse and preventing its loss. Citrine’s customers include Panasonic, Michelin, LANXESS, and some of the biggest and most respected names in the materials and chemicals industry in Asia, North America, and Europe. Find out more at citrine.io.


Contacts

Press Inquiries:
Kathy Berardi
JMG Public Relations
678-644-4122
This email address is being protected from spambots. You need JavaScript enabled to view it.

ATLANTA--(BUSINESS WIRE)--Williams Industrial Services Group Inc. (NYSE American: WLMS), an infrastructure and maintenance services company, will release financial results for the first quarter ended March 31, 2022 after the financial markets close on May 12, 2022. Management will host a conference call and webcast the next morning to discuss these results; a question-and-answer session will follow.

First Quarter 2022 Conference Call

May 13, 2022

10:00 a.m. Eastern Time

Phone: (201) 493-6780

Internet webcast link and accompanying slide presentation: http://ir.wisgrp.com/

An audio replay of the earnings call will be available later that day by dialing 412-317-6671 and entering conference ID 13728732. Alternatively, the webcast replay can be accessed at http://ir.wisgrp.com/.

About Williams Industrial Services Group

Williams Industrial Services Group Inc. has been safely helping plant owners and operators enhance asset value for more than 50 years. The Company provides a broad range of building, maintenance and support services to infrastructure customers in the energy, power and industrial end markets. Williams’ mission is to be the preferred provider of construction, maintenance, and specialty services through commitment to superior safety performance, focus on innovation, and dedication to delivering unsurpassed value to its customers. Additional information can be found at www.wisgrp.com.


Contacts

Investor Contact:
Chris Witty
Darrow Associates
646-345-0998
This email address is being protected from spambots. You need JavaScript enabled to view it.

MISSISSAUGA, Ontario--(BUSINESS WIRE)--Schneider Electric, the leader in the digital transformation of energy management and automation, reports its first-quarter results for the start of the second year of its 2021-2025 sustainability program, confirming its continued focus on advancing towards its mid-term ESG commitments.


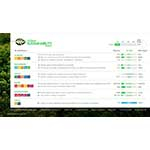
With its Schneider Sustainability Impact (SSI) dashboard, the company tracks and discloses quarterly progress to meet concrete targets related to climate, resources, trust, equal opportunities, generations, and local communities. Q1 2022 results are on track towards end year objective of 4.70 out of 10, with a compiled score of 4.00.

“I’m pleased with the progress made since the start of the year and how we’ve maintained our focus on sustainability despite complex and challenging social and market dynamics,” said Gwenaelle Avice-Huet, Schneider Electric’s Chief Strategy and Sustainability Officer, who recently took over from Olivier Blum, now Executive Vice President Energy Management. “It is with confidence and energy that I start my tenure as CSSO for this uniquely committed company that does not shy away from its purpose and always applies its experience and expertise to create more global and local impacts.”

First-quarter sustainability highlights

  • Schneider Electric’s EcoStruxure™ solutions helped customers and suppliers make significant decarbonization progress, and reduce their CO2 emissions by 358 million tonnes since 2018. It also extended its climate strategy partnerships with Plastic Omnium and NSG Group.
  • In partnership with the Solar Impulse Foundation, Schneider Electric hosted a three-month exhibition at its flagship Intencity building in Grenoble, France, entitled 1000+ Solutions for Cities, where hundreds of visitors were able to discover and learn more about concrete and available solutions for sustainable urban environments.
  • Schneider Electric now only uses recycled cardboard in all its distribution centers in India, China and Europe, and is progressing on green materials by joining the industry-led initiative ResponsibleSteel to ensure that the steel contained in its products comes from responsible sourcing and production and reduces their environmental footprint.
  • Schneider Electric also launched a pilot project with over 100 strategic suppliers to help set up its decent work program that will be rolled-out later this year.
  • New major partnerships launched in this first quarter in India and South America will help to accelerate and train more people in energy management.
  • Schneider Electric, with the support of its Foundation and the individual contributions of thousands of employees, raised over €2M in donations to directly support Ukrainian colleagues and their families affected by the crisis.
  • Schneider Electric also donated equipment worth €4M to help restore essential energy supplies in Ukraine and the Schneider Electric Foundation continues to work with local NGOs in support of the local community.

Find more details in the first-quarter 2022 report of Schneider’s Sustainability Impact program, including the progress dashboard:

Recent sustainability awards and recognition

Read about Schneider Electric’s first-quarter 2022 revenues and in dedicated sustainability reports on Climate, Resources, People, Trust, and Social Impact.

Understand Schneider Electric’s Environmental, Social and Governance (ESG) performance:

About Schneider Electric

Schneider’s purpose is to empower all to make the most of our energy and resources, bridging progress and sustainability for all. We call this Life Is On.

Our mission is to be your digital partner for Sustainability and Efficiency.

We drive digital transformation by integrating world-leading process and energy technologies, end-point to cloud connecting products, controls, software and services, across the entire lifecycle, enabling integrated company management, for homes, buildings, data centers, infrastructure and industries.

We are the most local of global companies. We are advocates of open standards and partnership ecosystems that are passionate about our shared Meaningful Purpose, Inclusive and Empowered values.

https://www.se.com/ca/en/

Discover Life Is On Follow us on: Twitter Facebook LinkedIn YouTube Instagram Blog

Discover the newest perspectives shaping sustainability, electricity 4.0, and next generation automation on Schneider Electric Insights

Hashtags: #Sustainability, #ESG, #Impactcompany


Contacts

Media Relations
Edelman on behalf of Schneider Electric
Juan Pablo Guerrero
Phone: +1 416 875 7173
Email: This email address is being protected from spambots. You need JavaScript enabled to view it.

HOUSTON--(BUSINESS WIRE)--Halliburton Company (NYSE: HAL) today announced senior executive leadership changes as part of its robust succession management process. Effective immediately, Lance Loeffler, executive vice president and chief financial officer (CFO) will assume the role of senior vice president of the Company’s Middle East North Africa (MENA) region.


“Lance has done a fantastic job serving as Halliburton CFO and has played an instrumental role in our Company’s success and financial growth,” said Jeff Miller, chairman, president, and CEO of Halliburton. “It’s now time to expand his leadership development and provide him with an opportunity to strengthen his operational experience by leading our MENA region and working directly with our customers.”

Halliburton Executive Vice President, Global Business Lines, and Chief Health, Safety & Environment Officer Eric Carre will assume the role of CFO. Carre is a proven executive leader in the Halliburton organization and was a key architect of the Company’s capital efficiency strategy. He has an MBA in Finance from the University of Wisconsin-Madison, a master’s degree in mechanical engineering from Université Libre de Bruxelles in Belgium and brings more than 30 years of Halliburton experience to the position.

“Despite the transition in leadership, our financial strategy remains unchanged. Eric provides continuity as we execute on our five strategic priorities in order to deliver industry-leading returns and strong free cash flow for our shareholders,” said Miller. “We believe Eric’s wealth of operational experience, clear understanding of our returns-focused strategy, and strong relationship with our Board of Directors and executive management team will serve Halliburton well as he leads our Finance organization.”

“We are excited for these dynamic leaders to take on the challenges of their new roles. Today’s announcements reflect our deep bench strength of talent, and each of these leaders represent proven strategic thinking, strong execution, and a dedicated commitment to our value proposition – to collaborate and engineer solutions to maximize asset value for our customers,” added Miller.

ABOUT HALLIBURTON

Founded in 1919, Halliburton is one of the world's largest providers of products and services to the energy industry. With more than 40,000 employees, representing 130 nationalities in more than 70 countries, the company helps its customers maximize value throughout the lifecycle of the reservoir – from locating hydrocarbons and managing geological data, to drilling and formation evaluation, well construction and completion, and optimizing production throughout the life of the asset. Visit the Company’s website at www.halliburton.com. Connect with Halliburton on Facebook, Twitter, LinkedIn, Instagram and YouTube.


Contacts

For Investors:
David Coleman
Halliburton, Investor Relations
This email address is being protected from spambots. You need JavaScript enabled to view it.
281-871-2688

For Media:
Emily Mir
Halliburton, Public Relations
This email address is being protected from spambots. You need JavaScript enabled to view it.
281-871-2601

Richard Palmer, Chief Executive Officer

LOS ANGELES--(BUSINESS WIRE)--Global Clean Energy Holdings, Inc. (OTCQB: GCEH) has issued the following Letter to Shareholders providing an update on the company’s vertically integrated farm-to-fuel businesses, including recent acquisitions, partnerships, and strategic vision for future growth.


Chief Executive Officer’s letter to shareholders

Global Clean Energy (GCEH) has effectively advanced our transformational goals in a period marked by an ongoing multidimensional global pandemic, anthropogenic climate change, and geopolitical instability. Our average share price from 2019 to 2021 has increased nearly 750% all ahead of revenue generation that will come from the operation of our Bakersfield Renewable Fuels Refinery, which will begin producing in the coming months.

GCEH has been successful during these challenging times because we know that to truly have an impact on climate change, we need to do so responsibly without impacting food security. In order to succeed, energy transition businesses need to be environmentally sustainable, socially sustainable, and also economically sustainable. GCEH is one of the few energy transition businesses that legitimately accomplishes all three. Starting with our nonfood camelina feedstocks, we have built the pathway for continued growth as we invest in our Upstream, Midstream, and Downstream businesses. Our operating model — Simple Strategy, Strategic Implementation, and driving Impactful Solutions — helps to ensure we will be a global leader in the production of ultra-low carbon sustainable fuels needed to reduce dependence on petroleum, and reduce the impacts of climate change and food security.

When we founded this company, it was with the realization that to have a tangible impact, we need to take big steps. Global Clean Energy is taking big steps. As shareholders, you are already aware that our innovative, nonfood, vertically integrated, farm-to-fuel business model sets us apart from our peers. Our structure allows us to manage every step of the renewable fuel production business — from science to seed and farm to fuel — lowering the carbon emissions associated with renewable fuels and streamlining processes to ensure greater efficiencies every step of the way. From our upstream model of using both classic breeding and cutting-edge scientific techniques, like genome editing to increase yields in our proprietary camelina varieties, to our downstream operations that produce ultra-low carbon renewable fuels at our Bakersfield Renewable Fuels Refinery — we are continuing to strategically identify and enter into partnerships and asset acquisitions that will advance GCEH’s successful growth trajectory. Below I will outline the steps we’ve taken this past year, our platform for scalable growth, and the plans we have to achieve GCEH’s vision of producing the most sustainable, least carbon intense, lowest cost fuel possible without impacting food security or causing land use change.

Simple Strategy

Intertwined with our vertically integrated farm-to-fuel model, is our focus on ensuring scalable growth, doing more with less, and having the greatest impact. Many have noted that the single largest constraint to the growth of renewable fuels is the unmet supply of sustainable feedstocks to meet future market demand. By acquiring companies that add value to our production platform, strategically building assets across the value chain to reduce cost and increase margins, and expanding globally through strategic partnerships, our team is doing our part and making great strides toward meeting the global feedstock deficit responsibly. This buy, build, expand strategy is evidenced in our company’s growth this past year.

Strategic Implementation

​​Global Clean Energy is focused on the future when investing in and developing advantaged assets and intellectual property. By establishing a robust upstream platform that our future growth will be based on, we will be self-sustaining and capital-light. In 2021 we made great strides in advancing this platform.

Upstream

Acquisition of Camelina Company Espana - Significantly bolstering our upstream operations, Global Clean Energy acquired Camelina Company Espana (CCE), the largest camelina supplier in Europe. This acquisition successfully brings GCEH’s upstream model into the global marketplace. Through this purchase we significantly expanded our intellectual property portfolio and agriculture support capabilities, allowing us to further expand our camelina business into Europe and South America. It allows us to scale our deployment platform through strategic partnerships covering thousands of farmers and tens of millions of fallow acres in these markets.

Acquisition of Agribody Technologies (ATI) - Purchasing ATI allowed us to speed up the global development of novel non-GMO camelina varieties using advanced plant science technologies. ATI holds 15 issued U.S. patents for bioengineering key genetic switches (gene editing). We have also expanded our in-house resources to further speed up the breeding process for enhanced traits by utilizing the power of genomics.

Acquisition of Entira, Inc. - By acquiring this agribusiness, consultancy, and marketing firm, which we partnered with for years, we gained in-house expertise for our U.S. camelina agronomy team by supporting its efforts in grower development, education, and support. Through this strategic acquisition, we bolstered our U.S. camelina production strategy and expanded our camelina development program.

Relocation of Upstream Business Headquarters - Our upstream growth isn’t limited to acquisitions. We also relocated our upstream business headquarters, Sustainable Oils, to a state-of-the-art complex in Great Falls, Montana. From this existing agricultural facility, complete with labs and local agricultural support personnel, we can better service our farmers across the Northern Plains, Pacific Northwest and throughout the Midwest.

Midstream

Grain storage facility construction - Our midstream growth this year was bolstered with our acquisition of a 42-acre parcel of land located adjacent to a CHS shuttle train loading facility in Harve, Montana, where we plan to construct 600,000 bushels of grain processing and storage. By reducing the need for intermediaries in our midstream operations, we keep costs down and ensure the quality and reliability of the camelina feedstock delivered to our downstream operation in Bakersfield, California. Moving forward, we plan to build four additional camelina aggregation points as well as other storage infrastructure co-located with existing shuttle train facilities to further streamline midstream logistics.

Downstream

ExxonMobil Strategic Relationship - Perhaps our most significant growth this year came through expanding our strategic relationship with Exxon Mobil Corporation and its affiliates (“ExxonMobil”), which invested $125M in our business, further validating our vertical farm-to-fuel strategy. The investment is in addition to existing long-term supply agreements in which ExxonMobil has committed to purchasing up to 210 million gallons (5 million barrels) per year of renewable diesel from our Bakersfield Renewable Fuels Refinery. ExxonMobil’s investment ensures a lasting relationship that will accelerate our nonfood camelina production in key growing regions, and expand efforts to help reduce greenhouse gas emissions in the transportation sector.

Impactful Solutions

There is no doubt that renewable fuels have environmental, social, and economic benefits. They help reduce transportation-related carbon emissions by burning cleanly and acting as a drop-in replacement for traditional petroleum-based fuels. Their expanded use reduces our reliance on foreign oil imports and will contribute to improving air quality. By converting our sustainably produced camelina oil to drop-in renewable fuels, we are reducing pressure on food land and competition for scarce water resources, positively impacting global food security. The only thing holding further market expansion back is the unmet demand for sustainable, nonfood-based feedstocks. GCEH recognizes this and is poised to be a major disruptor in this market for years to come.

As we look to the future, it is with an eye on leveraging our platform for rapid, responsible, and scalable growth. We see enormous potential in our upstream asset portfolio due to the limited capital necessary to scale the business in target regions and the growing demand for ultra-low carbon intensity, nonfood feedstocks. Given changing environmental policies and global unrest, immense potential exists for exponential growth in this sector. Global Clean Energy’ proprietary camelina feedstocks – the only varieties in the world currently qualifying for California’s strict Low Carbon Fuel Standard – will lead the way in this burgeoning market thanks to our continued focus on upstream investments.

We would not have been able to achieve the foregoing without the extraordinary efforts and commitments of our employees. I cannot thank them enough. And thank you for your support of our company and the trust you have placed in our vision. Together we will continue to positively impact the future and ensure that renewable fuels deliver on their promise of sustainability.

Watch us grow!

Richard Palmer
Chief Executive Officer
Global Clean Energy Holdings, Inc.

About Global Clean Energy

Global Clean Energy Holdings, Inc. (OTCQB:GCEH) is a vertically integrated renewable fuels business that is focused on reducing carbon emissions sustainably through our proprietary camelina varieties – delivering among the lowest carbon intensity renewable fuel in the marketplace. GCEH’s strategy since its inception has been to control the full integration of the renewable fuels supply chain from science to seed and farm to fuel. We aim to operate the development, production, processing, and transportation of feedstocks to the refining and production of renewable fuels. We process our proprietary nonfood feedstock in our Bakersfield, California renewable fuels refinery, yielding a renewable diesel that is chemically identical to petroleum diesel, but with 80+ percent lower carbon emissions. Our proprietary camelina varieties are the only renewable feedstock on the market certified for both the U.S. EPA’s Renewable Fuel Standard and California’s Low Carbon Fuel Standard. More information can be found at www.gceholdings.com.

Forward-Looking Statements

All statements in this communication other than statements of historical fact are “forward-looking statements” for purposes of federal and state securities laws, including any statements of the plans, strategies and objectives for future operations, profitability, strategic value creation, risk profile and investment strategies, and any statements regarding future economic conditions or performance, and the expected financial and operational results of Global Clean Energy Holdings, Inc. Although we believe the expectations reflected in our forward-looking statements are reasonable, actual results could differ materially from those projected or assumed in any of our forward-looking statements. Important factors that could cause our actual results, performance and achievements, or industry results to differ materially from estimates or projections contained in our forward-looking statements include, but are not limited to, the following: our ability to complete and effectively produce renewable diesel at our renewable fuels refinery, and once operational, producing fuel at the expected rate and cost as anticipated; ensuring adequate supply of camelina or other comparable feedstock; successfully supplying our refinery with camelina or similar feedstock and converting it into renewable fuels; being able to store and transport feedstock and downstream renewable fuels; obtaining and maintaining regulatory approvals and certifications for our renewable fuels to ensure compliance in local and global markets; continued demand and growth for renewable fuels; the ability to produce renewable diesel that is completely fungible with petroleum-based diesel; expanding the capabilities of our refinery site to maximize profitability; our ability to comply with the terms of our credit facilities and production agreements; successfully integrating acquired companies and expanding operations overseas in parallel with our US-based operations; managing all aspects of a complex vertically integrated supply and production strategy, and overcoming circumstances that often are out of our control such as weather, transportation, production delays and ultimately, ultimate demand for our product; as well as other additional risks and factors that could cause actual results to differ materially from our forward-looking statements set forth in our reports filed with the Securities and Exchange Commission. Any forward-looking statements are made as of the date hereof. We do not intend, and undertake no obligation, to update any forward-looking statement.

Important factors that could cause actual results, developments and business decisions to differ materially from forward-looking statements are described in the sections titled “Risk Factors” in our filings with the Securities and Exchange Commission, including our most recent Annual Report on Form 10-K, Quarterly Reports on Form 10-Q, and Current Reports on Form 8-K.


Contacts

Amanda Parsons DeRosier
562-233-5146
This email address is being protected from spambots. You need JavaScript enabled to view it.

SOLON, Ohio--(BUSINESS WIRE)--Energy Focus, Inc. (NASDAQ:EFOI), a leader in sustainable, energy-efficient lighting and control systems and ultraviolet-c light disinfection (“UVCD”) products for the commercial, military maritime and consumer markets, will announce its financial results for its first quarter ended March 31, 2022, prior to the market open on May 12th. Energy Focus will hold a conference call that day at 11:00 a.m. ET to discuss the results.

You can access the live conference call by dialing the following phone numbers:

Toll-free 1-877-451-6152 or
International 1-201-389-0879
Conference ID# 13729243

The conference call will be simultaneously webcast. To listen to the webcast, log on to it at: https://services.choruscall.com/mediaframe/webcast.html?webcastid=Sps65iJv. The webcast will be available at this link through May 26, 2022. Financial information presented on the call, including the earnings press release, will be available on the investors section of Energy Focus’ website, investors.energyfocus.com.

About Energy Focus:

Energy Focus is an industry-leading innovator of sustainable light-emitting diode (“LED”) lighting and lighting control technologies and solutions, as well as UV-C Disinfection technologies and solutions. As the creator of the first flicker-free LED lamps, Energy Focus develops high quality LED lighting products and controls that provide extensive energy and maintenance savings, as well as aesthetics, safety, health and sustainability benefits over conventional lighting. Our EnFocus™ lighting control platform enables existing and new buildings to provide quality, convenient and affordable, dimmable and color-tunable, circadian and human-centric lighting capabilities. In addition, our patent-pending UVCD technologies and products, aim to provide effective, reliable and affordable UVCD solutions for buildings, facilities and homes. Energy Focus’ customers include U.S. and U.S. ally navies, U.S. federal, state and local governments, healthcare and educational institutions, as well as Fortune 500 companies. Since 2007, Energy Focus has installed approximately 900,000 lighting products across the U.S. Navy fleet, including tubular LEDs, waterline security lights, explosion-proof globes and berth lights, saving more than five million gallons of fuel and 300,000 man-hours in lighting maintenance annually. Energy Focus is headquartered in Solon, Ohio. For more information, visit our website at www.energyfocus.com.


Contacts

Investor Contact:
Hayden IR
Brett Maas
646-536-7331
This email address is being protected from spambots. You need JavaScript enabled to view it.

  • Gerber will be responsible for growing Schneider Electric’s microgrid business in North America, including go-to-market strategies for emerging market segments
  • Her unique experience in driving solution adoption and consulting will support customers on their sustainability and resilience journeys

BOSTON--(BUSINESS WIRE)--#AccessToEnergy--Schneider Electric, the leader in the digital transformation of energy management and automation, today announced the appointment of Jana Gerber as President, Microgrid North America.


In this role, Gerber will be responsible for growing the commercial microgrid business in the region and supporting customers in their sustainability and resilience journeys. With a strong background in a variety of customer-facing capacities, she will oversee our North American go-to-market strategies and delivery.

"With more than 300 microgrid installations to date, we are on a mission to build a more decarbonized and digital world where more electricity sources are from renewables like microgrids,” said Annette Clayton, CEO, Schneider Electric North America. “These efforts require a skilled and innovative leader, which is exactly why Jana is uniquely positioned to take the business into the next phase of growth.”

With over two decades of experience at Schneider Electric, Gerber brings a deep knowledge of customer pain points and understanding around collaborative work across the organization. Her expertise in sustainability consulting services and strategic account management allows her to deliver tailored services for new and existing customers, with a particular focus on leading electrification efforts to build more resilient and sustainable operations for customers.

Dallas-based Gerber serves as a Board Member for the Association of Medical Facility Professionals North Texas Chapter and is a Go Red Executive Leadership Team and Circle of Red Member for the Dallas Chapter of the American Heart Association.

Jana graduated from Washington State University with a B.S. in Civil Engineering.

About Schneider Electric

Schneider’s purpose is to empower all to make the most of our energy and resources, bridging progress and sustainability for all. We call this Life Is On. Our mission is to be your digital partner for Sustainability and Efficiency.

We drive digital transformation by integrating world-leading process and energy technologies, end-point to cloud connecting products, controls, software and services, across the entire lifecycle, enabling integrated company management, for homes, buildings, data centers, infrastructure and industries.

We are the most local of global companies. We are advocates of open standards and partnership ecosystems that are passionate about our shared Meaningful Purpose, Inclusive and Empowered values. www.se.com

Discover Life Is On  Follow us on:  TwitterFacebookLinkedInYouTubeInstagramBlog

Hashtags: #Microgrid #LifeIsOn #AccessToEnergy #SchneiderElectric


Contacts

Schneider Electric Media Relations – Vicki True; 774-613-1158; This email address is being protected from spambots. You need JavaScript enabled to view it.
PR agency for Schneider Electric – Lexie Janney; 540-520-3042; This email address is being protected from spambots. You need JavaScript enabled to view it.

Highly experienced energy executive with demonstrated track record of leading teams and diversified platforms across E&P, Midstream Gathering & Processing

Fully aligned with Civitas’ founding principles of creating compelling value for all stakeholders

Interim CEO Benjamin Dell to continue as Civitas’ Chairman

DENVER--(BUSINESS WIRE)--Civitas Resources, Inc. (NYSE: CIVI) (“Civitas” or the “Company”), today named Chris Doyle its next President and Chief Executive Officer, effective May 2, 2022.


Mr. Doyle has over 25 years of domestic and international experience in Exploration and Production (“E&P”) and Midstream Gathering and Processing – having set the foundation for his career with over two decades at Anadarko Petroleum and Chesapeake Energy. He joins Civitas after serving as President and CEO of Primexx Energy Partners and leading a comprehensive transformation of the privately held Delaware Basin company. From 2016 to 2020, Mr. Doyle served as President and CEO of Olympus Energy, a privately held energy company with upstream and midstream assets in the Appalachian Basin. At both companies, Mr. Doyle helped create a culture anchored on operational excellence, accountability, transparency, and leading ESG performance.

Ben Dell, Civitas Chairman and interim CEO, said: “I am very pleased to welcome Chris to Civitas. The Board of Directors and I believe that his experience, judgment, and perspective will be instrumental as we continue to thoughtfully grow the Civitas platform with a clear objective of becoming a national leader among peers, while advancing the principles of the new E&P business model. At Civitas, we have always embraced bold ambitions, and under Chris’ leadership, we will continue working tirelessly to create compelling value for all stakeholders.”

Mr. Doyle said: “I have admired Civitas’ rapid emergence as a leader in the E&P space as it focused on strengthening alignment with shareholders, generating significant free cash, and leading responsible energy development in Colorado as the state’s first carbon neutral energy producer. I am particularly excited to join the Company at this stage of its evolution and growth trajectory, and I look forward to working closely with the entire Civitas team and all of our stakeholders to create lasting value.”

Civitas initiated a national search for its next CEO in February of this year. The search committee, comprised of members of its Board of Directors and advised by an executive search firm, sought to identify a new CEO who would further the Company’s core principles of executing on its prudent reinvestment strategy, returning meaningful cash to shareholders while maintaining a peer-leading balance sheet, realizing value creation via consolidation, and exhibiting continued ESG leadership. Following an extensive process, the Board unanimously agreed that Mr. Doyle was the right leader to help Civitas meet its significant potential.

About Civitas Resources, Inc.

Civitas Resources, Inc. is Colorado’s first carbon neutral oil & gas producer and is focused on developing and producing crude oil, natural gas and natural gas liquids in Colorado’s Denver-Julesburg Basin. The Company is committed to pursuing compelling economic returns and cash flow while delivering best-in-class cost leadership and capital efficiency. Civitas is dedicated to safety, environmental responsibility, and implementing industry leading practices to create a positive local impact. For more information about Civitas, please visit www.civitasresources.com.

Forward-looking Statements

This press release contains forward-looking statements within the meaning of the federal securities laws. For a description of factors that may cause Civitas’ actual results, performance or expectations to differ from any forward-looking statements, please review the information under the heading “Risk Factors” included in Item 1A of Civitas’ 2021 Annual Report on Form 10-K and other documents of Civitas’ on file with the Securities and Exchange Commission. Any forward-looking statements made in this press release are qualified by these cautionary statements, and there can be no assurance that the actual results or developments anticipated by Civitas will be realized or, even if substantially realized, that they will have the expected consequences to, or effects on, Civitas or its business or operations. Except as required by law, Civitas undertakes no obligation to update publicly or revise any forward-looking statement, whether as a result of new information, future developments or otherwise. We caution you that actual outcomes and results may differ materially from what is expressed, implied or forecasted by Civitas’ forward-looking statements.


Contacts

Investor Relations:
John Wren, This email address is being protected from spambots. You need JavaScript enabled to view it.

Media:
Brian Cain, This email address is being protected from spambots. You need JavaScript enabled to view it.

Webcast and Conference Call Scheduled for 4:30PM ET

MACON, Ga.--(BUSINESS WIRE)--Blue Bird Corporation (Nasdaq: BLBD), the leader in electric and cleaner-emission school buses, will release its fiscal 2022 second quarter financial results on May 12, 2022.


The public is invited to attend an audio webcast in which Blue Bird executives Matthew Stevenson, President and CEO, and Razvan Radulescu, CFO, will discuss results. This webcast will take place at 4:30PM ET on May 12, 2022. A slide presentation will be available to support the webcast.

  • The webcast of the presentation will be available on the Investor Relations portion of Blue Bird’s website at http://investors.blue-bird.com. Please click on the link in the Events box in the lower right corner of the Blue Bird Investor Relations landing page to access the webcast.
  • Participants desiring audio only or to ask questions during the Q&A portion of the call should dial 1-844-826-3035 or 1-412-317-5195.

A replay of the webcast will be available approximately two hours after the call concludes via the same link on Blue Bird’s website.

About Blue Bird Corporation

Blue Bird (NASDAQ: BLBD) is recognized as a technology leader and innovator of school buses since its founding in 1927. Our dedicated team members design, engineer and manufacture school buses with a singular focus on safety, reliability, and durability. Blue Bird buses carry the most precious cargo in the world – the majority of 25 million children twice a day – making us the most trusted brand in the industry. The company is the proven leader in low- and zero-emission school buses with more than 20,000 propane, natural gas, and electric powered buses in operation today. Blue Bird is transforming the student transportation industry through cleaner energy solutions. For more information on Blue Bird's complete product and service portfolio, visit www.blue-bird.com. For Blue Bird's line of emission-free electric buses, visit www.bluebirdelectricbus.com.


Contacts

Mark Benfield
Blue Bird Corporation
(478)822-2315
This email address is being protected from spambots. You need JavaScript enabled to view it.

Lewis’ Leadership Spans Over 36 Years of Distinguished Military Service

TULSA, Okla.--(BUSINESS WIRE)--Empire Petroleum (NYSE American: EP) ("Empire" or the "Company"), an oil and gas company with current producing assets in Texas, Louisiana, North Dakota, Montana and New Mexico, announced today the appointment of Vice Admiral Andrew Lewis as Board Member, effective immediately. Vice Admiral Lewis replaces Anthony Kamin, who has served Empire as a Director since December 2016 and recently as Co-Chairman of the Board.

Vice Admiral Andrew Lewis was raised in Los Altos, California, and is a 1985 graduate of the U.S. Naval Academy. He was designated a Naval Aviator in April 1987 and has flown over 100 combat missions, accumulating over 5,300 flight hours and 1,100 carrier landings.

Lewis previously served as the Deputy Chief of Naval Operations for Operations, Plans and Strategy, vice director for Operations, and director of Fleet Training at Fleet Forces Command. His command tours included Carrier Strike Group 12, Naval Strike and Air Warfare Center, Carrier Air Wing (CVW) 3, Strike Fighter Squadron (VFA) 106, and Strike Fighter Squadron (VFA) 15. In 2018, Lewis was named Commander of the U.S. Second Fleet and NATO Joint Force Command Norfolk.

Following retirement from a 36-year military career in 2021, Lewis joined Business Executives for National Security. As Senior Vice President of Policy and Projects, Vice Admiral Lewis has worked collaboratively with business executives and leaders in the federal government’s national security enterprise to apply best business practices in addressing the nation’s most pressing security challenges.

“The entire Board is thrilled to have Vice Admiral Lewis join us. His experience re-establishing the Second Fleet in 2018 has been said to have been the military equivalent of establishing two successful startup companies responsible for maritime security in the Atlantic and into the Arctic. His experience should prove invaluable to our Board,” said Tommy Pritchard, Chief Executive Officer.

“We want to thank Tony for being an integral part of the Company since 2016. He has been instrumental in the company’s tremendous growth and we truly appreciate his leadership. We wish Tony the very best in his future endeavors,” said Mike Morrisett, President. “I also want to extend a warm welcome to Vice-Admiral Lewis as a new member of the Board of Directors.”

About Empire Petroleum

Empire Petroleum Corporation is a publicly traded, Tulsa-based oil and gas company with current producing assets in Texas, Louisiana, North Dakota, Montana and New Mexico. Management is focused on targeted acquisitions of proved developed assets with synergies with its existing portfolio of wells. More information about Empire can be found at www.empirepetrocorp.com.

Safe Harbor Statement

This release contains forward-looking statements within the meaning of Section 27A of the Securities Act of 1933 and Section 21E of the Securities Exchange Act of 1934. Forward-looking statements involve a wide variety of risks and uncertainties, and include, without limitations, statements with respect to the Company’s estimates, strategy and prospects. Such statements are subject to certain risks and uncertainties which are disclosed in the Company’s reports filed with the SEC, including its Form 10-K for the fiscal year ended December 31, 2021, and its other filings with the SEC. Readers and investors are cautioned that the Company’s actual results may differ materially from those described in the forward-looking statements due to a number of factors, including, but not limited to, the Company’s ability to acquire productive oil and/or gas properties or to successfully drill and complete oil and/or gas wells on such properties, general economic conditions both domestically and abroad, and other risks and uncertainties related to the conduct of business by the Company.


Contacts

Empire:
Tommy Pritchard, CEO
Mike Morrisett, President
539-444-8002

Investor Relations:
Stephanie Prince
PCG Advisory
(646) 863-6341

EUCLID, Ohio--(BUSINESS WIRE)--#completiontools--Terves today announced that it has obtained a significant patent infringement, validity and lost profits judgment of over $700,000 against competitor Ecometal, Inc. and Nick Yuan over Terves’ patented TervAlloy dissolvable metal used by the fracking industry.


In Terves’ patent lawsuit in the U.S. District Court for the Northern District of Ohio, the Court ruled that Ecometal Inc., and Nick Yuan infringe both of Terves’s patents, U.S. Patent Nos. 10,329,653 and 10,689,740, and that those patents are valid.

A jury then awarded Terves lost profits of more than $700,000. In rendering that lost profit verdict, the jury determined that there are no available, alternate and non-infringing alternatives to Terves’s patented TervAlloy products.

At trial, Mr. Yuan testified under oath that Ecometal has stopped all shipments of any infringing material as of March 28, 2022 and that neither he nor his company Ecometal will ship any infringing material into the United States.

Terves’ CEO, Andrew Sherman states “Terves is pleased that the Court analyzed the law and facts to confirm that Ecometal and Mr. Yuan infringe, that Terves’ patents are valid. Also, the jury listened to all of the evidence closely and agreed with what we were seeking – lost profits damages based on the harm caused by that infringement.”

About Terves

Terves is the technology and cost leader in the development, manufacturing and sale of Engineered Response™ smart materials for the oil and gas industry. Terves’ intelligent materials sense and respond to their local wellbore environment to “do more”, such as dissolve, change dimensions, generate force or heat, destroy chemicals or bacteria, bond together, or solubilize and disperse based on change in time, temperature, pressure, PH, electrostatic charge, or other change in the local environment.

Terves is the leading manufacturer of dissolvable metals and dissolvable elastomers that are used for making frac balls, plugs, slips, seals and several other components used in oil and gas well completion and production; and have been used for completing tens of thousands of stages in North America, Europe, South America, Asia and MENA regions.

Join our Contact List:
<Get our press releases, newsletters and updates delivered to your email inbox>


Contacts

Anupam Ghildyal
This email address is being protected from spambots. You need JavaScript enabled to view it.

The company enters the PJM and New York electricity markets with the addition of 31.5 MW of baseload capacity from two run-of-river hydroelectric facilities on the Allegheny River


BURLINGTON, Mass.--(BUSINESS WIRE)--FirstLight Power, a leading clean provider of renewable energy and energy storage resources, today announced the company has acquired two Western Pennsylvania hydroelectric facilities from H2O Power, a leading owner and operator of hydroelectric facilities in Ontario, Canada. Located on the Allegheny River and totaling 31.5 MW of baseload capacity, Allegheny 8 and Allegheny 9 are two run-of-river hydroelectric facilities that have provided a source of reliable, clean energy to the region for over three decades. Currently, the facilities are providing their hydropower to the New York market under a long-term power purchase agreement with New York State Electric and Gas Company (NYSEG). With the strategic acquisition, FirstLight continued the growth of the company’s clean energy portfolio while expanding its footprint into the PJM and New York electricity markets.

“With several strategic partnerships and acquisitions, 2022 has been an exciting year of growth for FirstLight, and we are pleased to now be able to directly deliver clean energy to New Yorkers on a daily basis through our acquisition of the Allegheny hydroelectric facilities,” said Alicia Barton, President and CEO of FirstLight. “We are also excited to welcome the Allegheny Hydro employees to our talented FirstLight team who collectively possess vast experience operating renewable and storage assets – both of which will be vital as we continue our expansion into new markets across North America.”

Situated approximately nine miles apart on the Allegheny River, the 13.6 MW Allegheny 8 project and 17.9 MW Allegheny 9 project are run-of-river hydroelectric stations located with existing federal lock and dam facilities operated by the US Army Corps of Engineers. The stations currently provide clean electricity to New York along a 40-mile transmission corridor, which is also part of the acquisition. As part of the transaction, which was completed on May 1, 2022, FirstLight will add five members of the Allegheny Hydro operations team.

The Allegheny acquisition follows several strategic partnerships that have further solidified FirstLight as a leading owner and operator of critical energy storage and renewable energy assets. In February, FirstLight announced a new partnership in Connecticut to advance new hybrid renewable energy projects across the state and the company was part a successful investment consortium that secured a lease in the recent New York Bight Offshore Wind auction. In March, the company announced a strategic partnership with Borrego to develop new solar and storage generation at FirstLight’s existing hydropower facilities in Massachusetts and Connecticut. These collaborations will advance the company’s commitment to help accelerate the Northeast’s path to a fully decarbonized electric grid.

About FirstLight Power

FirstLight Power (FirstLight) is a leading clean power producer, developer, and energy storage company serving North America. With a diversified portfolio that includes over 1,400 megawatts of operating renewable energy and energy storage technologies, FirstLight specializes in hybrid solutions that pair hydroelectric, pumped-hydro storage, utility-scale solar, large-scale battery, and offshore wind assets. The company’s mission is to accelerate the decarbonization of the electric grid by supporting the development, operation, and integration of renewable energy and storage solutions to advance an electric system that is clean, reliable, affordable, and equitable. Based in Burlington, MA, with operating offices in Northfield, MA and New Milford, CT, FirstLight is a steward of more than 14,000 acres and hundreds of miles of shoreline along some of the most beautiful rivers and lakes in the Northeast. To learn more, visit www.firstlightpower.com.


Contacts

Len Greene, Head of Government Affairs & Communications
Cell: 203-232-7267, Email: This email address is being protected from spambots. You need JavaScript enabled to view it.

Travis Small, Slowey McManus Communications
Cell: 617-538-9041, Email: This email address is being protected from spambots. You need JavaScript enabled to view it.

MACON, Ga.--(BUSINESS WIRE)--Blue Bird Corporation (Nasdaq: BLBD), the leader in electric and low-emission school buses, applauds the 2022 Clean School Bus Rebate Program recently announced by the U.S. Environmental Protection Agency (EPA) as a critical step to putting student and community health first in student transportation. The program earmarks $500 million for the replacement of diesel-powered school buses with zero and low emission school buses. The funds will also assist school districts and other eligible participants to establish the required clean energy infrastructure.


The 2022 Clean School Bus Rebate Program is part of the Bipartisan Infrastructure Law (BIL) which provides a total of $5 billion over five years for clean school bus transportation. The program is designed to reduce air pollution and protect student and community health. It also aims to lower harmful greenhouse gas emissions which contribute to the existential threat of climate change.

The EPA's Clean School Bus Rebate Program provides prioritized support to school districts in low income, rural or tribal communities across the United States. The agency enables school districts to replace their diesel-powered school buses with zero or low emission school buses powered by electricity, propane, or natural gas.

“As the leader in electric and low-emission school buses, Blue Bird is delighted to help turn the EPA's grand vision of clean student transportation into reality,” said Matthew Stevenson, president and CEO, Blue Bird Corporation. “The Clean School Bus Rebate Program will benefit kids and communities across all 50 U.S. states. It's great news especially for underserved communities. Students from low-income areas are disproportionately impacted by diesel pollution from school buses, since 60 percent of students from low-income families ride the bus to school. Clean energy transportation means cleaner air to breathe.”

The EPA plans to accept online applications for three months starting in early May and notify applicants by October 2022. Selected school districts and other eligible participants are required to order the buses and supporting infrastructure by April 2023 to qualify for the rebates. Blue Bird subject matter experts are well-equipped to assist members of its dealer network and school districts to apply for program funds. Interested parties can contact Blue Bird specialists via This email address is being protected from spambots. You need JavaScript enabled to view it..

Blue Bird is the only U.S.-owned and operated school bus manufacturer in the United States. The company builds a full range of electric school buses which can carry a maximum of 84 passengers for up to 120 miles on a single charge. Depending on the charging infrastructure, the buses take between three and eight hours to recharge fully.

Apart from the benefits for student health and the environment, shifting to electric school buses can lead to significant cost saving opportunities long-term. Select Blue Bird customers reported fuel costs of up to 49 cents per mile for their diesel buses, compared to an average 14 cents per mile in energy costs for electric buses.

In addition, Blue Bird offers a comprehensive portfolio of low emission propane and natural gas-powered school buses. The company remains the proven clean transportation leader with more than 20,000 propane, natural gas, and electric-powered buses in operation today. Blue Bird manufactures its school buses in Fort Valley, Ga. The shift to clean transportation helps sustain approx. 2,000 well-paying manufacturing jobs. Blue Bird continues to ramp up production and fortify its supply chain to meet the increasing demand for zero and low emission school buses.

About Blue Bird Corporation

Blue Bird (NASDAQ: BLBD) is recognized as a technology leader and innovator of school buses since its founding in 1927. Our dedicated team members design, engineer and manufacture school buses with a singular focus on safety, reliability, and durability. Blue Bird buses carry the most precious cargo in the world – the majority of 25 million children twice a day – making us the most trusted brand in the industry. The company is the proven leader in low- and zero-emission school buses with more than 20,000 propane, natural gas, and electric powered buses in operation today. Blue Bird is transforming the student transportation industry through cleaner energy solutions. For more information on Blue Bird's complete product and service portfolio, visit www.blue-bird.com. For Blue Bird's line of emission-free electric buses, visit www.bluebirdelectricbus.com.


Contacts

Julianne Barclay
TSN Communications
M: +1.267.934.5340
E: This email address is being protected from spambots. You need JavaScript enabled to view it.

LIBERTY LAKE, Wash.--(BUSINESS WIRE)--Itron, Inc. (NASDAQ:ITRI) announced today financial results for its first quarter ended March 31, 2022. Key results for the quarter include (compared with the first quarter of 2021):


  • Revenue of $475 million, compared with $520 million;
  • Gross margin of 28.4%; compared with 32.2%;
  • GAAP net income of $1 million, compared with $13 million;
  • GAAP diluted earnings per share (EPS) of $0.02, compared with $0.30;
  • Non-GAAP diluted EPS of $0.11, compared with $0.52;
  • Adjusted EBITDA of $19 million, compared with $50 million;
  • Free cash flow of $2 million compared with $39 million; and
  • Total backlog of $3.9 billion, compared with $3.4 billion.

"In the first quarter of 2022, customer demand remained strong with a focus on our Networked Solutions and Outcomes offerings. While we continue to be impacted by the current supply constraints and an inflationary environment, we remain focused on driving our strategy forward," said Tom Deitrich, Itron's president and chief executive officer.

Summary of First Quarter Consolidated Financial Results
(All comparisons made are against the prior year period unless otherwise noted)

Revenue
Total first quarter revenue decreased 9% to $475 million, or 6%, excluding the impact of changes in foreign currency exchange rates. The decrease was due to the impact of component constraints limiting our ability to meet customer demand.

Device Solutions revenue declined 19%, and Networked Solutions and Outcomes revenue each decreased 3%.

Gross Margin
Consolidated company gross margin of 28.4% decreased 380 basis points from the prior year, primarily due to higher component costs and manufacturing inefficiencies related to component shortages.

Operating Expenses and Operating Income
GAAP operating expenses of $128 million decreased $8 million from the prior year, primarily due to lower restructuring, amortization and product development expenses. Non-GAAP operating expenses of $126 million decreased $2 million from the prior year primarily due to lower product development expenses.

GAAP operating income of $7 million was $24 million lower than the prior year and non-GAAP operating income of $9 million was $30 million lower than last year. The decreases were due to lower gross profit.

Net Income and Earnings per Share
Net income attributable to Itron, Inc. for the quarter was $1 million, or $0.02 per diluted share, compared with $13 million, or $0.30 per diluted share in 2021. The decrease was driven by lower GAAP operating income.

Non-GAAP net income, which excludes certain charges including amortization of intangible assets, amortization of debt placement fees, debt extinguishment, restructuring, loss on sale of business, acquisition and integration, and the income tax effect of those adjustments, was $5 million, or $0.11 per diluted share, compared with $22 million, or $0.52 per diluted share, in 2021. The lower year over year results were primarily due to lower non-GAAP operating income.

Cash Flow

Net cash provided by operating activities was $8 million in the first quarter compared with $50 million in the same quarter of 2021. Free cash flow was $2 million in the first quarter compared with $39 million in the prior year. The year over year decrease in cash flow was primarily due to higher variable compensation payments in the current period.

Other Measures

Total backlog was $3.9 billion and 12-month backlog was $1.6 billion, compared with $3.4 billion and $1.3 billion, respectively, in the prior year. Bookings in the quarter totaled $417 million.

Earnings Conference Call

Itron will host a conference call to discuss the financial results and guidance contained in this release at 10 a.m. EDT on May 2, 2022. The call will be webcast in a listen-only mode. Webcast information and conference call materials will be made available 10 minutes before the start of the call and will be accessible on Itron’s website at http://investors.itron.com/events.cfm. A replay of the audio webcast will be made available at http://investors.itron.com/events.cfm. A telephone replay of the conference call will be available through May 7, 2022. To access the telephone replay, dial 888-203-1112 or 719-457-0820 and enter passcode 3063181.

About Itron

Itron® enables utilities and cities to safely, securely and reliably deliver critical infrastructure services to communities in more than 100 countries. Our portfolio of smart networks, software, services, meters and sensors helps our customers better manage electricity, gas and water resources for the people they serve. By working with our customers to ensure their success, we help improve the quality of life, ensure the safety and promote the well-being of millions of people around the globe. Itron is dedicated to creating a more resourceful world. Join us: www.itron.com.

Itron® is a registered trademark of Itron, Inc. All third-party trademarks are property of their respective owners and any usage herein does not suggest or imply any relationship between Itron and the third party unless expressly stated.

Cautionary Note Regarding Forward Looking Statements

This release contains, and our officers and representatives may from time to time make, "forward-looking statements" within the meaning of the safe harbor provisions of the U.S. Private Securities Litigation Reform Act of 1995. Forward-looking statements are neither historical factors nor assurances of future performance. These statements are based on our expectations about, among others, revenues, operations, financial performance, earnings, liquidity, earnings per share, cash flows and restructuring activities including headcount reductions and other cost savings initiatives. This document reflects our current strategy, plans and expectations and is based on information currently available as of the date of this release. When we use words such as "expect", "intend", "anticipate", "believe", "plan", "goal", "seek", "project", "estimate", "future", "strategy", "objective", "may", "likely", "should", "will", "will continue", and similar expressions, including related to future periods, they are intended to identify forward-looking statements. Forward-looking statements rely on a number of assumptions and estimates. Although we believe the estimates and assumptions upon which these forward-looking statements are based are reasonable, any of these estimates or assumptions could prove to be inaccurate and the forward-looking statements based on these estimates and assumptions could be incorrect. Our operations involve risks and uncertainties, many of which are outside our control, and any one of which, or a combination of which, could materially affect our results of operations and whether the forward-looking statements ultimately prove to be correct. Actual results and trends in the future may differ materially from those suggested or implied by the forward-looking statements depending on a variety of factors. Therefore, you should not rely on any of these forward-looking statements. Some of the factors that we believe could affect our results include our ability to execute on our restructuring plans, our ability to achieve estimated cost savings, the rate and timing of customer demand for our products, rescheduling of current customer orders, changes in estimated liabilities for product warranties, adverse impacts of litigation, changes in laws and regulations, our dependence on new product development and intellectual property, future acquisitions, changes in estimates for stock-based and bonus compensation, increasing volatility in foreign exchange rates, international business risks, uncertainties caused by adverse economic conditions, including, without limitation those resulting from extraordinary events or circumstances such as the COVID-19 pandemic and other factors that are more fully described in Part I, Item 1A: Risk Factors included in our 2021 Annual Report and other reports on file with the SEC. We undertake no obligation to update or revise any forward-looking statement, whether written or oral.

Non-GAAP Financial Information

To supplement our consolidated financial statements, which are prepared in accordance with accounting principles generally accepted in the United States (GAAP), we use certain adjusted or non-GAAP financial measures, including non-GAAP operating expense, non-GAAP operating income, non-GAAP net income, non-GAAP diluted earnings per share (EPS), adjusted EBITDA, adjusted EBITDA margin, constant currency, and free cash flow. We provide these non-GAAP financial measures because we believe they provide greater transparency and represent supplemental information used by management in its financial and operational decision making. We exclude certain costs in our non-GAAP financial measures as we believe the net result is a measure of our core business. We believe these measures facilitate operating performance comparisons from period to period by eliminating potential differences caused by the existence and timing of certain expense items that would not otherwise be apparent on a GAAP basis. Non-GAAP performance measures should be considered in addition to, and not as a substitute for, results prepared in accordance with GAAP. We strongly encourage investors and shareholders to review our financial statements and publicly-filed reports in their entirety and not to rely on any single financial measure. Our non-GAAP financial measures may be different from those reported by other companies.

ITRON, INC.

CONSOLIDATED STATEMENTS OF OPERATIONS


(Unaudited, in thousands, except per share data)


Three Months Ended March 31,


2022


2021

Revenues


Product revenues

$

399,810


$

442,804


Service revenues


75,521


76,770


Total revenues


475,331


519,574


Cost of revenues


Product cost of revenues


294,820


307,691


Service cost of revenues


45,287


44,839


Total cost of revenues


340,107


352,530


Gross profit


135,224


167,044


Operating expenses


Sales, general and administrative


76,401


75,992


Research and development


49,596


51,727


Amortization of intangible assets


6,553


8,973


Restructuring


(6,366

)


(1,980

)

Loss on sale of business


2,221


1,392


Total operating expenses


128,405


136,104


Operating income


6,819


30,940


Other income (expense)


Interest income


217


542


Interest expense


(1,592

)


(10,475

)

Other income (expense), net


(689

)


(2,766

)

Total other income (expense)


(2,064

)


(12,699

)


Income before income taxes


4,755


18,241


Income tax provision


(3,859

)


(4,661

)

Net income


896


13,580


Net income (loss) attributable to noncontrolling interests


(10

)


977


Net income attributable to Itron, Inc.

$

906


$

12,603


Net income per common share - Basic

$

0.02


$

0.30


Net income per common share - Diluted

$

0.02


$

0.30


Weighted average common shares outstanding - Basic


45,018


41,526


Weighted average common shares outstanding - Diluted


45,240


41,964


ITRON, INC.

SEGMENT INFORMATION


(Unaudited, in thousands)


Three Months Ended March 31,


2022


2021

Product revenues


Device Solutions

$

137,886


$

170,331


Networked Solutions


249,268


258,703


Outcomes


12,656


13,770


Total Company

$

399,810


$

442,804


Service revenues


Device Solutions

$

1,679


$

2,450


Networked Solutions


29,552


29,611


Outcomes


44,290


44,709


Total Company

$

75,521


$

76,770


Total revenues


Device Solutions

$

139,565


$

172,781


Networked Solutions


278,820


288,314


Outcomes


56,946


58,479


Total Company

$

475,331


$

519,574


Gross profit


Device Solutions

$

21,806


$

32,296


Networked Solutions


91,351


112,759


Outcomes


22,067


21,989


Total Company

$

135,224


$

167,044


Operating income (loss)


Device Solutions

$

11,578


$

21,701


Networked Solutions


61,007


79,291


Outcomes


8,341


10,336


Corporate unallocated


(74,107

)


(80,388

)

Total Company

$

6,819


$

30,940


ITRON, INC.

CONSOLIDATED BALANCE SHEETS


(Unaudited, in thousands)

March 31, 2022


December 31, 2021

ASSETS


Current assets


Cash and cash equivalents

$

203,997


$

162,579


Accounts receivable, net


303,250


298,459


Inventories


171,259


165,799


Other current assets


114,021


123,092


Total current assets


792,527


749,929


Property, plant, and equipment, net


157,244


163,184


Deferred tax assets, net


186,133


181,472


Other long-term assets


43,883


42,178


Operating lease right-of-use assets, net


62,627


65,523


Intangible assets, net


85,514


92,529


Goodwill


1,091,888


1,098,975


Total assets

$

2,419,816


$

2,393,790


LIABILITIES AND EQUITY


Current liabilities


Accounts payable

$

203,475


$

193,129


Other current liabilities


56,409


81,253


Wages and benefits payable


86,650


113,532


Taxes payable


18,576


12,208


Current portion of warranty


17,651


18,406


Unearned revenue


118,807


82,816


Total current liabilities


501,568


501,344


Long-term debt, net


450,795


450,228


Long-term warranty


13,184


13,616


Pension benefit obligation


81,932


87,863


Deferred tax liabilities, net


1,956


2,000


Operating lease liabilities


54,333


57,314


Other long-term obligations


129,296


138,666


Total liabilities


1,233,064


1,251,031


Equity


Common stock


1,770,057


1,779,775


Accumulated other comprehensive loss, net


(95,283

)


(148,098

)

Accumulated deficit


(514,694

)


(515,600

)

Total Itron, Inc. shareholders' equity


1,160,080


1,116,077


Noncontrolling interests


26,672


26,682


Total equity


1,186,752


1,142,759


Total liabilities and equity

$

2,419,816


$

2,393,790


ITRON, INC.

CONSOLIDATED STATEMENTS OF CASH FLOWS


(Unaudited, in thousands)

Three Months Ended March 31,


2022


2021

Operating activities


Net income

$

896


$

13,580


Adjustments to reconcile net income to net cash provided by operating activities:


Depreciation and amortization of intangible assets


16,837


21,810


Non-cash operating lease expense


4,113


4,330


Stock-based compensation


6,127


6,498


Amortization of prepaid debt fees


839


2,695


Deferred taxes, net


(4,362

)


2,109


Loss on sale of business


2,221


1,392


Restructuring, non-cash


390


(45

)

Other adjustments, net


137


391


Changes in operating assets and liabilities, net of acquisition and sale of business:


Accounts receivable


(8,816

)


(2,078

)

Inventories


(6,345

)


9,008


Other current assets


(11,899

)


15,692


Other long-term assets


(2,887

)


(7,627

)

Accounts payable, other current liabilities, and taxes payable


14,065


(26,978

)

Wages and benefits payable


(26,185

)


5,458


Unearned revenue


35,320


18,050


Warranty


(928

)


(1,382

)

Other operating, net


(11,932

)


(12,948

)

Net cash provided by operating activities


7,591


49,955


Investing activities


Net proceeds related to the sale of business


55,933


2,842


Acquisitions of property, plant, and equipment


(5,369

)


(11,412

)

Business acquisitions, net of cash and cash equivalents acquired


23


Other investing, net


362


2,764


Net cash provided (used) in investing activities


50,949


(5,806

)


Financing activities


Proceeds from borrowings


460,000


Payments on debt


(475,000

)

Issuance of common stock


784


2,238


Proceeds from common stock offering


389,419


Proceeds from sale of warrants


45,349


Purchases of convertible note hedge contracts


(84,139

)

Repurchase of common stock


(16,972

)


Prepaid debt fees


(695

)


(11,722

)

Other financing, net


(222

)


(1,564

)

Net cash (used in) provided by financing activities


(17,105

)


324,581


Effect of foreign exchange rate changes on cash and cash equivalents


(17

)


(1,071

)

Increase in cash and cash equivalents


41,418


367,659


Cash and cash equivalents at beginning of period


162,579


206,933


Cash and cash equivalents at end of period

$

203,997


$

574,592


About Non-GAAP Financial Measures

To supplement our consolidated financial statements, which are prepared in accordance with GAAP, we use certain non-GAAP financial measures, including non-GAAP operating expense, non-GAAP operating income, non-GAAP net income, non-GAAP diluted EPS, adjusted EBITDA, free cash flow, and constant currency. The presentation of this financial information is not intended to be considered in isolation or as a substitute for, or superior to, the financial information prepared and presented in accordance with GAAP, and other companies may define such measures differently. For a reconciliation of each non-GAAP measure to the most comparable financial measure prepared and presented in accordance with GAAP, please see the table captioned Reconciliations of Non-GAAP Financial Measures to the Most Directly Comparable GAAP Financial Measures.

We use these non-GAAP financial measures for financial and operational decision making and/or as a means for determining executive compensation. Management believes that these non-GAAP financial measures provide meaningful supplemental information regarding our performance and ability to service debt by excluding certain expenses that may not be indicative of our recurring core operating results. These non-GAAP financial measures facilitate management's internal comparisons to our historical performance, as well as comparisons to our competitors' operating results. Our executive compensation plans exclude non-cash charges related to amortization of intangibles and certain discrete cash and non-cash charges, such as acquisition and integration related expenses, loss on sale of business, or restructuring charges. We believe that both management and investors benefit from referring to these non-GAAP financial measures in assessing our performance and when planning, forecasting and analyzing future periods. We believe these non-GAAP financial measures are useful to investors because they provide greater transparency with respect to key metrics used by management in its financial and operational decision making and because they are used by our institutional investors and the analyst community to analyze the health of our business.

Non-GAAP operating expenses and non-GAAP operating income – We define non-GAAP operating expenses as operating expenses excluding certain expenses related to the amortization of intangible assets, restructuring, loss on sale of business, and acquisition and integration. We define non-GAAP operating income as operating income excluding the expenses related to the amortization of intangible assets, restructuring, loss on sale of business, and acquisition and integration. Acquisition and integration related expenses include costs, which are incurred to affect and integrate business combinations, such as professional fees, certain employee retention and salaries related to integration, severances, contract terminations, travel costs related to knowledge transfer, system conversion costs, and asset impairment charges. We consider these non-GAAP financial measures to be useful metrics for management and investors because they exclude the effect of expenses that are related to acquisitions and restructuring projects. By excluding these expenses, we believe that it is easier for management and investors to compare our financial results over multiple periods and analyze trends in our operations. For example, in certain periods, expenses related to amortization of intangible assets may decrease, which would improve GAAP operating margins, yet the improvement in GAAP operating margins due to this lower expense is not necessarily reflective of an improvement in our core business. There are some limitations related to the use of non-GAAP operating expenses and non-GAAP operating income versus operating expenses and operating income calculated in accordance with GAAP. We compensate for these limitations by providing specific information about the GAAP amounts excluded from non-GAAP operating expense and non-GAAP operating income and evaluating non-GAAP operating expense and non-GAAP operating income together with GAAP operating expense and operating income.

Non-GAAP net income and non-GAAP diluted EPS – We define non-GAAP net income as net income (loss) attributable to Itron, Inc. excluding the expenses associated with amortization of intangible assets, amortization of debt placement fees, debt extinguishment, restructuring, loss on sale of business, acquisition and integration, and the tax effect of excluding these expenses. We define non-GAAP diluted EPS as non-GAAP net income divided by diluted weighted-average shares outstanding during the period calculated on a GAAP basis and then reduced to reflect the anti-dilutive impact of the convertible note hedge transaction entered into in connection with the 0% Convertible Notes due 2026 issued in March 2021. We consider these financial measures to be useful metrics for management and investors for the same reasons that we use non-GAAP operating income. The same limitations described above regarding our use of non-GAAP operating income apply to our use of non-GAAP net income and non-GAAP diluted EPS. We compensate for these limitations by providing specific information regarding the GAAP amounts excluded from these non-GAAP measures and evaluating non-GAAP net income and non-GAAP diluted EPS together with GAAP net income attributable to Itron, Inc. and GAAP diluted EPS.

For interim periods the budgeted annual effective tax rate (AETR) is used, adjusted for any discrete items, as defined in Accounting Standards Codification (ASC) 740 - Income Taxes. The budgeted AETR is determined at the beginning of the fiscal year. The AETR is revised throughout the year based on changes to our full-year forecast. If the revised AETR increases or decreases by 200 basis points or more from the budgeted AETR due to changes in the full-year forecast during the year, the revised AETR is used in place of the budgeted AETR beginning with the quarter the 200 basis point threshold is exceeded and going forward for all subsequent interim quarters in the year. We continue to assess the AETR based on latest forecast throughout the year and use the most recent AETR anytime it increases or decreases by 200 basis points or more from the prior interim period.

Adjusted EBITDA – We define adjusted EBITDA as net income (loss) (a) minus interest income, (b) plus interest expense, depreciation and amortization, debt extinguishment, restructuring, loss on sale of business, acquisition and integration, and (c) excluding income tax provision or benefit. Management uses adjusted EBITDA as a performance measure for executive compensation. A limitation to using adjusted EBITDA is that it does not represent the total increase or decrease in the cash balance for the period and the measure includes some non-cash items and excludes other non-cash items. Additionally, the items that we exclude in our calculation of adjusted EBITDA may differ from the items that our peer companies exclude when they report their results. We compensate for these limitations by providing a reconciliation of this measure to GAAP net income (loss).

Free cash flow – We define free cash flow as net cash provided by operating activities less cash used for acquisitions of property, plant and equipment. We believe free cash flow provides investors with a relevant measure of liquidity and a useful basis for assessing our ability to fund our operations and repay our debt.


Contacts

Itron, Inc.
Kenneth P. Gianella
Vice President, Investor Relations
(669) 770-4643

David Means
Director, Investor Relations
(737) 242-8448

Rebecca Hussey
Manager, Investor Relations
(509) 891-3574


Read full story here

BLACKWOOD, N.J.--(BUSINESS WIRE)--The GivePower Foundation and Vision Solar became partners in 2021; through their partnership, a percentage from every Vision Solar installation is donated to GivePower to fund solar energy project solutions for developing regions of the world. GivePower Foundation organizes trek retreats for their partners to allow them to experience firsthand the impact of their donations. In May, YTD we donated over $223,000.


Vision Solar participated in their first GivePower trek in Shuluwou in Colombia's indigenous capital, a remote village in northeast Colombia. Eight Vision Solar employees and two executives took part in the life-changing trek. Mike Eden (CRO), and Faraz Khan (CFO), were the two executives who attended the first trek to Colombia. Vision Solar installed solar energy solutions in village homes, schools, and community buildings. With these new clean energy solutions, education and livelihood can be advanced further.

“We were a team of 10 from Vision Solar who worked and lived with this community for 5 days. It has been a humbling experience to see this community thrive living in the harsh conditions of a desert. Yesterday night when they all saw power and light for the first time, it put smiles on the faces of the elderly, young, and kids. They now have access to TV, computers, and refrigeration for food security!” - Faraz Khan, CFO

"To be able to impact lives is something I have always strived to do. Vision Solar has donated and installed a solar system and batteries that will provide a community that has never seen power with electricity." - Mike Eden, CRO

“Anyone can donate money to a charity but it was a feeling like nothing else to actually put in the physical labor necessary to create solar energy solutions in the village.” - Derek M. - Vision Solar Employee

Being in the solar industry it was very rewarding to see and experience the humanitarian applications of solar energy, and to give sustainable power to a community in need! - Macy G. - Vision Solar Employee

“When the light went on, it was just very exciting to see that it's just gonna really change their lives.” - Joey P., District Sales Manager, Vision Solar

For any inquiries regarding this press release, please feel free to contact John Czelusniak at This email address is being protected from spambots. You need JavaScript enabled to view it.

About Vision Solar:

Vision Solar is one of the fastest growing solar energy companies in the United States. Their full-service renewable energy company installs solar services for residential homes nationwide. Over the past three years, Vision Solar has grossed over $200+ million in revenue, with significant increase in projected growth to produce 1500+ high-quality Green Jobs by 2022. To learn more, visit: https://www.visionsolar.com

About GivePower:

GivePower is a 501 non-profit organization that develops clean water and energy systems in communities across the world. GivePower has installed 2,650 solar power installations in villages across 17 different countries and in underdeveloped areas of the United States. To learn more, visit https://www.givepower.org


Contacts

John Czelusniak
This email address is being protected from spambots. You need JavaScript enabled to view it.
Vision Solar LLC

Offshore Source Logo

Offshore Source keeps you updated with relevant information concerning the Offshore Energy Sector.

Any views or opinions represented on this website belong solely to the author and do not represent those of the people, institutions or organizations that Offshore Source or collaborators may or may not have been associated with in a professional or personal capacity, unless explicitly stated.

Corporate Offices

Technology Systems Corporation
8502 SW Kansas Ave
Stuart, FL 34997

info@tscpublishing.com