Business Wire News

  • Company increases 2022 full-year earnings guidance to $5.60 - $6.00 per diluted share
  • Demand for railcars remains strong across all regions
  • Investment volume was $314.1 million in the second quarter and totaled $684.5 million year to date


CHICAGO--(BUSINESS WIRE)--GATX Corporation (NYSE:GATX) today reported 2022 second-quarter net income of $2.6 million, or $0.07 per diluted share, compared to net income of $5.5 million, or $0.15 per diluted share, in the second quarter of 2021. The 2022 second-quarter results include net negative impacts of $35.9 million, or $1.00 per diluted share, from Tax Adjustments and Other Items. The most significant item was an impairment charge associated with the Company’s planned sale of its five remaining marine vessels.

Net income for the first six months of 2022 was $78.4 million, or $2.18 per diluted share, compared to $42.0 million, or $1.17 per diluted share, in the prior year period. The 2022 year-to-date results include net negative impacts of $44.4 million, or $1.23 per diluted share, from Tax Adjustments and Other Items. The 2021 second-quarter and year-to-date results included net negative impacts of $43.1 million, or $1.20 per diluted share, from Tax Adjustments and Other Items. Details related to these items are provided in the attached Supplemental Information under Tax Adjustments and Other Items.

"Despite ongoing macroeconomic uncertainty, the operating environment remains strong across our global railcar leasing markets," said Robert C. Lyons, president and chief executive officer of GATX. "Rail North America’s fleet utilization was 99.4% at the end of the second quarter and our renewal success rate was 87.7%. Demand for the majority of railcar types in our fleet remains robust, and absolute lease rates increased sequentially for the eighth consecutive quarter. The renewal lease rate change of GATX’s Lease Price Index was positive 18.3% for the quarter, with an average renewal term of 34 months. In this environment, our commercial team remains focused on improving lease rates while beginning to increase lease terms on many car types.

"Rail International performed well as we continued to experience increases in renewal lease rates. GATX Rail Europe and GATX Rail India expanded their fleets during the quarter while also achieving virtually full fleet utilization at quarter end. In Portfolio Management, the Rolls-Royce and Partners Finance affiliates performed as expected in the second quarter."

Mr. Lyons concluded, "Year-to-date investment volume was nearly $685 million, and we continue to take delivery of new railcars to meet customer demand worldwide. Based on current strength in the global rail markets and a robust secondary market for railcars, we are increasing our 2022 full-year earnings expectations to be in the range of $5.60 to $6.00 per diluted share, excluding any impact from Tax Adjustments and Other Items."

RAIL NORTH AMERICA

Rail North America reported segment profit of $53.1 million in the second quarter of 2022, compared to $77.6 million in the second quarter of 2021. Lower second-quarter segment profit was driven by lower gains on asset dispositions, partially offset by lower maintenance expense. Year to date 2022, Rail North America reported segment profit of $173.5 million, compared to $143.3 million in the same period of 2021. Higher 2022 year-to-date results were predominantly driven by higher gains on asset dispositions.

At June 30, 2022, Rail North America’s wholly owned fleet was comprised of approximately 111,600 cars, including approximately 10,300 boxcars. The following fleet statistics and performance discussion exclude the boxcar fleet.

Fleet utilization was 99.4% at the end of the second quarter, compared to 99.3% at the end of the prior quarter and 98.5% at the end of the second quarter of 2021. During the second quarter, the renewal lease rate change of the GATX Lease Price Index (LPI) was positive 18.3%. This compares to positive 9.3% in the prior quarter and negative 6.7% in the second quarter of 2021. The average lease renewal term for all cars included in the LPI during the second quarter was 34 months, compared to 30 months in the prior quarter and 29 months in the second quarter of 2021. Rail North America’s investment volume during the second quarter of 2022 was $253.7 million.

Additional fleet statistics, including information on the boxcar fleet, and macroeconomic data related to Rail North America’s business are provided on the last page of this press release.

RAIL INTERNATIONAL

Rail International’s segment profit was $28.3 million in the second quarter of 2022, compared to $27.3 million in the second quarter of 2021. Year to date 2022, Rail International reported segment profit of $53.2 million, compared to $49.1 million for the same period of 2021. Results in the comparative periods were favorably impacted by more railcars on lease and negatively impacted by changes in foreign currency exchange rates.

At June 30, 2022, GATX Rail Europe’s (GRE) fleet consisted of approximately 27,500 cars. Utilization was 99.9%, compared to 99.0% at the end of the prior quarter and 98.4% at the end of the second quarter of 2021. Additional fleet statistics for GRE are provided on the last page of this press release.

PORTFOLIO MANAGEMENT

Portfolio Management reported segment loss of $15.7 million in the second quarter of 2022, compared to segment profit of $12.2 million in the second quarter of 2021. Year to date 2022, segment loss was $19.6 million, compared to segment profit of $18.3 million for the same period of 2021.

Second-quarter 2022 segment results include an impairment charge of $31.5 million associated with the planned divestiture of five specialized gas vessels. These vessels represent the last assets of a legacy business activity that is not core to GATX operations. Additionally, year-to-date 2022 segment results include a net impairment charge associated with three aircraft spare engines in Russia that the Rolls-Royce and Partners Finance affiliates (RRPF) do not expect to recover, of which GATX’s share is $15.3 million. Excluding these impacts, second-quarter and year-to-date 2022 segment results increased relative to a year ago. Higher second-quarter 2022 segment results were primarily due to higher share of affiliates’ earnings from RRPF. Higher year-to-date 2022 segment results were driven by stronger marine operating results and higher share of affiliates’ earnings from RRPF.

COMPANY DESCRIPTION

At GATX Corporation (NYSE:GATX), we empower our customers to propel the world forward. GATX leases transportation assets including railcars, aircraft spare engines and tank containers to customers worldwide. Our mission is to provide innovative, unparalleled service that enables our customers to transport what matters safely and sustainably while championing the well-being of our employees and communities. GATX has been headquartered in Chicago, Illinois since its founding in 1898.

TELECONFERENCE INFORMATION

GATX Corporation will host a teleconference to discuss 2022 second-quarter results. Call details are as follows:

Thursday, July 21, 2022
11 a.m. Eastern Time
Domestic Dial-In: 1-800-289-0720
International Dial-In: 1-323-701-0160
Replay: 1-888-203-1112 or 1-719-457-0820 / Access Code: 4208735

Call-in details, a copy of this press release and real-time audio access are available at www.gatx.com. Please access the call 15 minutes prior to the start time. A replay will be available on the same site starting at 2 p.m. (Eastern Time), July 21, 2022.

AVAILABILITY OF INFORMATION ON GATX’S WEBSITE

Investors and others should note that GATX routinely announces material information to investors and the marketplace using SEC filings, press releases, public conference calls, webcasts and the GATX Investor Relations website. While not all of the information that the Company posts to the GATX Investor Relations website is of a material nature, some information could be deemed to be material. Accordingly, the Company encourages investors, the media and others interested in GATX to review the information that it shares on www.gatx.com under the “Investor Relations” tab.

FORWARD-LOOKING STATEMENTS

Statements in this Earnings Release not based on historical facts are “forward-looking statements” within the meaning of the Private Securities Litigation Reform Act of 1995 and, accordingly, involve known and unknown risks and uncertainties that are difficult to predict and could cause our actual results, performance, or achievements to differ materially from those discussed. These include statements as to our future expectations, beliefs, plans, strategies, objectives, events, conditions, financial performance, prospects, or future events. In some cases, forward-looking statements can be identified by the use of words such as “may,” “could,” “expect,” “intend,” “plan,” “seek,” “anticipate,” “believe,” “estimate,” “predict,” “potential,” “outlook,” “continue,” “likely,” “will,” “would”, and similar words and phrases. Forward-looking statements are necessarily based on estimates and assumptions that, while considered reasonable by us and our management, are inherently uncertain. Accordingly, you should not place undue reliance on forward-looking statements, which speak only as of the date they are made, and are not guarantees of future performance. We do not undertake any obligation to publicly update or revise these forward-looking statements.

The following factors, in addition to those discussed in our other filings with the SEC, including our Form 10-K for the year ended December 31, 2021, could cause actual results to differ materially from our current expectations expressed in forward-looking statements:

  • the duration and effects of the global COVID-19 pandemic and any mandated pandemic mitigation requirements, including adverse impacts on our business, personnel, operations, commercial activity, supply chain, the demand for our transportation assets, the value of our assets, our liquidity, and macroeconomic conditions
  • exposure to damages, fines, criminal and civil penalties, and reputational harm arising from a negative outcome in litigation, including claims arising from an accident involving our transportation assets
  • inability to maintain our transportation assets on lease at satisfactory rates due to oversupply of assets in the market or other changes in supply and demand
  • a significant decline in customer demand for our transportation assets or services, including as a result of:
    • weak macroeconomic conditions
    • weak market conditions in our customers’ businesses
    • adverse changes in the price of, or demand for, commodities
    • changes in railroad operations, efficiency, pricing and service offerings, including those related to "precision scheduled railroading"
    • changes in, or disruptions to, supply chains
    • availability of pipelines, trucks, and other alternative modes of transportation
    • changes in conditions affecting the aviation industry, including reduced demand for air travel, geographic exposure and customer concentrations
    • other operational or commercial needs or decisions of our customers
    • customers’ desire to buy, rather than lease, our transportation assets
  • higher costs associated with increased assignments of our transportation assets following non-renewal of leases, customer defaults, and compliance maintenance programs or other maintenance initiatives
  • events having an adverse impact on assets, customers, or regions where we have a concentrated investment exposure
  • financial and operational risks associated with long-term purchase commitments for transportation assets
  • reduced opportunities to generate asset remarketing income


  • inability to successfully consummate and manage ongoing acquisition and divestiture activities
  • reliance on Rolls-Royce in connection with our aircraft spare engine leasing businesses, and the risks that certain factors that adversely affect Rolls-Royce could have an adverse effect on our businesses
  • fluctuations in foreign exchange rates
  • inflation and deflation
  • failure to successfully negotiate collective bargaining agreements with the unions representing a substantial portion of our employees
  • asset impairment charges we may be required to recognize
  • deterioration of conditions in the capital markets, reductions in our credit ratings, or increases in our financing costs
  • changes in banks’ inter-lending rate reporting practices and the phasing out of LIBOR
  • competitive factors in our primary markets, including competitors with significantly lower costs of capital
  • risks related to our international operations and expansion into new geographic markets, including laws, regulations, tariffs, taxes, treaties or trade barriers affecting our activities in the countries where we do business
  • changes in, or failure to comply with, laws, rules, and regulations
  • U.S. and global political conditions, including the ongoing military action between Russia and Ukraine
  • inability to obtain cost-effective insurance
  • environmental liabilities and remediation costs
  • potential obsolescence of our assets
  • inadequate allowances to cover credit losses in our portfolio
  • operational, functional and regulatory risks associated with severe weather events, climate change and natural disasters
  • inability to maintain and secure our information technology infrastructure from cybersecurity threats and related disruption of our business
  • changes in assumptions, increases in funding requirements or investment losses in our pension and post-retirement plans
  • inability to maintain effective internal control over financial reporting and disclosure controls and procedures


GATX CORPORATION AND SUBSIDIARIES

CONDENSED CONSOLIDATED STATEMENTS OF INCOME (UNAUDITED)

(In millions, except per share data)


Three Months Ended

June 30


Six Months Ended

June 30


2022


2021


2022


2021


Revenues


Lease revenue

$

284.9


$

287.6


$

568.2


$

568.2


Marine operating revenue


5.2


5.1


11.4


8.7


Other revenue


22.6


24.4


49.7


46.0


Total Revenues


312.7


317.1


629.3


622.9


Expenses


Maintenance expense


70.8


76.6


145.4


150.9


Marine operating expense


3.9


5.5


8.1


10.1


Depreciation expense


90.0


91.5


179.5


180.1


Operating lease expense


9.0


10.2


18.1


21.1


Other operating expense


9.3


11.4


20.0


21.6


Selling, general and administrative expense


47.9


47.8


95.1


94.9


Total Expenses


230.9


243.0


466.2


478.7


Other Income (Expense)


Net (loss) gain on asset dispositions


(24.2

)


34.7


49.5


57.2


Interest expense, net


(51.9

)


(50.0

)


(103.1

)


(103.6

)

Other expense


(11.3

)


(8.1

)


(13.3

)


(9.4

)

Income before Income Taxes and Share of Affiliates’ Earnings


(5.6

)


50.7


96.2


88.4


Income taxes


(2.7

)


(13.6

)


(25.1

)


(22.0

)

Share of affiliates’ earnings (losses), net of taxes


10.9


(31.6

)


7.3


(24.4

)

Net Income

$

2.6


$

5.5


$

78.4


$

42.0


Share Data


Basic earnings per share

$

0.07


$

0.16


$

2.21


$

1.19


Average number of common shares


35.5


35.4


35.5


35.3


Diluted earnings per share

$

0.07


$

0.15


$

2.18


$

1.17


Average number of common shares and common share equivalents


36.0


36.0


36.0


35.9


Dividends declared per common share

$

0.52


$

0.50


$

1.04


$

1.00


GATX CORPORATION AND SUBSIDIARIES

CONDENSED CONSOLIDATED BALANCE SHEETS (UNAUDITED)

(In millions)


June 30


December 31


2022


2021


Assets


Cash and Cash Equivalents

$

180.3


$

344.3


Restricted Cash


0.2


0.2


Receivables


Rent and other receivables


68.4


69.8


Finance leases (as lessor)


103.1


100.2


Less: allowance for losses


(6.2

)


(6.2

)


165.3


163.8


Operating Assets and Facilities


11,200.7


11,163.6


Less: allowance for depreciation


(3,309.8

)


(3,378.8

)


7,890.9


7,784.8


Lease Assets (as lessee)


Right-of-use assets, net of accumulated depreciation


254.4


270.7


Finance leases, net of accumulated depreciation


1.5


254.4


272.2


Investments in Affiliated Companies


596.5


588.4


Goodwill


115.3


123.0


Other Assets ($73.8 million and $3.8 million related to assets held for sale)


321.3


265.0


Total Assets

$

9,524.2


$

9,541.7


Liabilities and Shareholders’ Equity


Accounts Payable and Accrued Expenses

$

166.5


$

215.8


Debt


Commercial paper and borrowings under bank credit facilities


20.0


18.1


Recourse


5,964.4


5,887.5


5,984.4


5,905.6


Lease Obligations (as lessee)


Operating leases


266.7


286.2


Finance leases


1.5


266.7


287.7


Deferred Income Taxes


1,005.8


1,001.0


Other Liabilities


119.3


112.4


Total Liabilities


7,542.7


7,522.5


Total Shareholders’ Equity


1,981.5


2,019.2


Total Liabilities and Shareholders’ Equity

$

9,524.2


$

9,541.7


GATX CORPORATION AND SUBSIDIARIES

SEGMENT DATA (UNAUDITED)

Three Months Ended June 30, 2022

(In millions)


Rail

North America


Rail
International


Portfolio
Management


Other


GATX
Consolidated

Revenues


Lease revenue

$

203.0


$

66.5


$

8.2


$

7.2


$

284.9


Marine operating revenue


5.2


5.2


Other revenue


18.8


1.9


0.1


1.8


22.6


Total Revenues


221.8


68.4


13.5


9.0


312.7


Expenses


Maintenance expense


57.8


12.2


0.8


70.8


Marine operating expense


3.9


3.9


Depreciation expense


64.9


17.2


4.9


3.0


90.0


Operating lease expense


9.0


9.0


Other operating expense


5.9


2.1


0.6


0.7


9.3


Total Expenses


137.6


31.5


9.4


4.5


183.0


Other Income (Expense)


Net gain (loss) on asset dispositions


5.1


1.4


(30.8

)


0.1


(24.2

)

Interest expense, net


(34.9

)


(11.1

)


(4.6

)


(1.3

)


(51.9

)

Other (expense) income


(1.3

)


1.1


(11.1

)


(11.3

)

Share of affiliates’ pre-tax earnings


15.6


15.6


Segment profit (loss)

$

53.1


$

28.3


$

(15.7

)


$

(7.8

)


$

57.9


Less:


Selling, general and administrative expense


47.9


Income taxes (includes $4.7 related to affiliates’ earnings)


7.4


Net income

$

2.6


Selected Data:


Investment volume

$

253.7


$

48.8


$


$

11.6


$

314.1


Net Gain on Asset Dispositions


Asset Remarketing Income:


Net gains on disposition of owned assets

$

1.2


$

0.3


$


$

0.1


$

1.6


Residual sharing income


0.1


0.7


0.8


Non-remarketing net gains (1)


3.8


1.1


4.9


Asset impairments


(31.5

)


(31.5

)


$

5.1


$

1.4


$

(30.8

)


$

0.1


$

(24.2

)

__________

(1) Includes net gains (losses) from scrapping of railcars.

GATX CORPORATION AND SUBSIDIARIES

SEGMENT DATA (UNAUDITED)

Three Months Ended June 30, 2021

(In millions)


Rail

North America


Rail
International


Portfolio
Management


Other


GATX
Consolidated

Revenues


Lease revenue

$

204.2


$

69.0


$

8.3


$

6.1


$

287.6


Marine operating revenue


5.1


5.1


Other revenue


19.2


2.7


0.2


2.3


24.4


Total Revenues


223.4


71.7


13.6


8.4


317.1


Expenses


Maintenance expense


61.5


14.2


0.9


76.6


Marine operating expense


5.5


5.5


Depreciation expense


65.2


18.4


5.0


2.9


91.5


Operating lease expense


10.2


10.2


Other operating expense


8.4


1.7


0.4


0.9


11.4


Total Expenses


145.3


34.3


10.9


4.7


195.2


Other Income (Expense)


Net gain on asset dispositions


33.1


0.8


0.5


0.3


34.7


Interest expense, net


(32.6

)


(11.1

)


(4.4

)


(1.9

)


(50.0

)

Other (expense) income


(1.0

)


0.2


(7.3

)


(8.1

)

Share of affiliates’ pre-tax earnings


13.4


13.4


Segment profit (loss)

$

77.6


$

27.3


$

12.2


$

(5.2

)


$

111.9


Less:


Selling, general and administrative expense


47.8


Income taxes (includes $45.0 related to affiliates’ earnings)


58.6


Net income

$

5.5


Selected Data:


Investment volume

$

106.4


$

40.8


$

0.5


$

6.2


$

153.9


Net Gain on Asset Dispositions


Asset Remarketing Income:


Net gains on disposition of owned assets

$

31.5


$

0.4


$


$

0.3


$

32.2


Residual sharing income


0.5


0.5


1.0


Non-remarketing net gains (1)


1.1


0.4


1.5


$

33.1


$

0.8


$

0.5


$

0.3


$

34.7


__________

(1) Includes net gains (losses) from scrapping of railcars.

GATX CORPORATION AND SUBSIDIARIES

SEGMENT DATA (UNAUDITED)

Six Months Ended June 30, 2022

(In millions)


Rail

North America


Rail
International


Portfolio
Management


Other


GATX
Consolidated

Revenues


Lease revenue

$

403.7


$

134.1


$

16.5


$

13.9


$

568.2


Marine operating revenue


11.4


11.4


Other revenue


41.8


4.2


0.1


3.6


49.7


Total Revenues


445.5


138.3


28.0


17.5


629.3


Expenses


Maintenance expense


117.7


26.2


1.5


145.4


Marine operating expense


8.1


8.1


Depreciation expense


128.4


35.2


9.9


6.0


179.5


Operating lease expense


18.1


18.1


Other operating expense


13.2


4.5


1.1


1.2


20.0


Total Expenses


277.4


65.9


19.1


8.7


371.1


Other Income (Expense)


Net gain (loss) on asset dispositions


76.7


2.4


(29.9

)


0.3


49.5


Interest expense, net


(69.3

)


(22.3

)


(9.3

)


(2.2

)


(103.1

)

Other (expense) income


(2.0

)


0.7


(0.1

)


(11.9

)


(13.3

)

Share of affiliates’ pre-tax earnings


10.8


10.8


Segment profit (loss)

$

173.5


$

53.2


$

(19.6

)


$

(5.0

)


$

202.1


Less:


Selling, general and administrative expense


95.1


Income taxes (includes $3.5 related to affiliates’ earnings)


28.6


Net income

$

78.4


Selected Data:


Investment volume

$

534.1


$

127.7


$


$

22.7


$

684.5


Net Gain on Asset Dispositions


Asset Remarketing Income:


Net gains on disposition of owned assets

$

65.6


$

0.7


$


$

0.2


$

66.5


Residual sharing income


2.1


1.6


3.7


Non-remarketing net gains (1)


9.0


1.7


0.1


10.8


Asset impairments


(31.5

)


(31.5

)


$

76.7


$

2.4


$

(29.9

)


$

0.3


$

49.5


__________

(1) Includes net gains (losses) from scrapping of railcars.

GATX CORPORATION AND SUBSIDIARIES

SEGMENT DATA (UNAUDITED)

Six Months Ended June 30, 2021

(In millions)


Rail

North America


Rail
International


Portfolio
Management


Other


GATX
Consolidated

Revenues


Lease revenue

$

411.0


$

135.9


$

11.6


$

9.7


$

568.2


Marine operating revenue


8.7


8.7


Other revenue


37.0


5.2


0.4


3.4


46.0


Total Revenues


448.0


141.1


20.7


13.1


622.9


Expenses


Maintenance expense


119.9


29.6


1.4


150.9


Marine operating expense


10.1


10.1


Depreciation expense


130.9


36.7


7.7


4.8


180.1


Operating lease expense


21.1


21.1


Other operating expense


16.0


3.7


0.6


1.3


21.6


Total Expenses


287.9


70.0


18.4


7.5


383.8


Other Income (Expense)


Net gain on asset dispositions


54.6


1.1


1.1


0.4


57.2


Interest expense, net


(69.6

)


(23.3

)


(7.5

)


(3.2

)


(103.6

)

Other (expense) income


(1.8

)


0.2


(7.8

)


(9.4

)

Share of affiliates’ pre-tax earnings


22.4


22.4


Segment profit (loss)

$

143.3


$

49.1


$

18.3


$

(5.0

)


$

205.7


Less:


Selling, general and administrative expense


94.9


Income taxes (includes $46.8 related to affiliates’ earnings)


68.8


Net income

$

42.0


Selected Data:


Investment volume

$

215.5


$

85.2


$

353.0


$

9.7


$

663.4


Net Gain on Asset Dispositions


Asset Remarketing Income:


Net gains on disposition of owned assets

$

47.8


$

0.4


$


$

0.3


$

48.5


Residual sharing income


0.6


1.1


1.7


Non-remarketing net gains (1)


6.2


0.7


0.1


7.0


$

54.6


$

1.1


$

1.1


$

0.4


$

57.2


__________

(1) Includes net gains (losses) from scrapping of railcars.


Contacts

GATX Corporation
Shari Hellerman
Senior Director
Investor Relations, ESG, and External Communications
312-621-4285
This email address is being protected from spambots. You need JavaScript enabled to view it.


Read full story here

Innovative automated solution packages a variety of small products five times faster than manual packaging and delivers up to 50% cost reduction in materials

CONCORD TOWNSHIP, Ohio--(BUSINESS WIRE)--Ranpak Holdings Corp. (“Ranpak”) (NYSE: PACK), a global leader of environmentally sustainable, paper-based packaging solutions for e-commerce and industrial supply chains, today announced the global launch of the Flap’it!TM solution, a highly efficient machine that automates the packing of a variety of small products.


The Flap’it! solution automatically adapts to the height of the item and secures the product in place with inner-flaps and integrated cushioning bumpers at the corners. This ensures that products are protected during shipment, significantly reducing costs, damage and product returns. The system is run by a single operator and can easily be moved around the facility; additionally, it includes a number of safety features and has a small physical footprint. Flap’it! can pack up to 540 packages per hour, nine packages per minute – five times faster than manual packing. The machine is integrated with labeling solutions for in-line application of shipping labels and because it uses blanks to form the packages, Flap’it! eliminates the need to store multiple box sizes in inventory. Once received, packages are easy for the recipient to open, with no need for knives, scissors, or other tools. Small parcels can be delivered via traditional mail.

“The global launch of Flap’it! is the latest example of how Ranpak is strategically investing in innovative automated packaging solutions to deliver cost-savings, efficiency gains and sustainability benefits to our customers,” said Omar Asali, Chairman & Chief Executive Officer of Ranpak. “We are pleased to add Flap’it! to our growing portfolio of sustainable automated packaging solutions to help our customers improve their supply chain performance, lower their labor and materials costs, and reduce their environmental impact.”

The Flap’it! solution is ideal for e-commerce and logistics operations such as, B2C sellers of books, photobooks, personalized gifts, music, games, art and small electronics; and for B2B operations shipping smaller spare parts. B2C sellers of some beauty and personal care products will also find this packing solution highly valuable. Flap’it! easily fits into a typical pick-then-pack process and can package products with a maximum height of 80 mm (3.15 inches). It is easy to use, requires minimal operator training, and can deliver up to 50% cost reduction in packaging material with no corrugated waste. It also offers a higher quality unboxing experience when compared to pillow bags.

One early Flap’it! customer is CEWE, the Germany-based leading photo service in Europe, shipping more than six million photobooks per year. By implementing multiple Flap’it! units, CEWE has been able to reduce the number of temporary workers hired during peak periods and has automated 30% of its total packing operation, reducing delivery time to the end customer and improving pack quality by providing greater protection of goods shipped.

For additional information about Flap’it!, please visit https://www.ranpak.com/automated-solutions/flapit/. For information about other innovative, paper-based packaging solutions from Ranpak, please visit www.ranpak.com.

About Ranpak

Founded in 1972, Ranpak's goal was to create the first environmentally responsible system to protect products during shipment. Ranpak’s mission is to deliver sustainable packaging solutions that help improve supply chain performance and costs, reduce environmental impact, and support a variety of growing business needs globally. The development and improvement of materials, systems and total solution concepts have earned Ranpak a reputation as an innovative leader in e-commerce and industrial supply chain solutions. Ranpak is headquartered in Concord Township, Ohio and has approximately 850 employees. Additional information about Ranpak can be found on its website: https://www.ranpak.com.


Contacts

Investor Inquiries:
Bill Drew
This email address is being protected from spambots. You need JavaScript enabled to view it.

US Media Inquiries:
Cory Ziskind
ICR 646-277-1232
This email address is being protected from spambots. You need JavaScript enabled to view it.

EMEA Media Inquiries:
Monika Dürr
duomedia
+49(0)6104 944895
This email address is being protected from spambots. You need JavaScript enabled to view it.

AUSTIN, Texas--(BUSINESS WIRE)--$ITI #IoT--Iteris, Inc. (NASDAQ: ITI), the world’s trusted technology ecosystem for smart mobility infrastructure management, today announced that it will conduct a conference call on Thursday, August 4 at 4:30 p.m. Eastern time (1:30 p.m. Pacific time) to discuss its financial results for the fiscal first quarter ended June 30, 2022. The financial results will be issued in a press release prior to the call.


Iteris president and CEO Joe Bergera and CFO Douglas Groves will host the call, followed by a question and answer period.

Date: Thursday, August 4, 2022
Time: 4:30 p.m. Eastern time (1:30 p.m. Pacific time)
Toll-free dial-in number: +1 877-545-0320
International dial-in number: +1 973-528-0002
Participant Access Code: 512955

If joining by phone, please call the conference telephone number 5-10 minutes prior to the start time and ask to join the Iteris earnings call. An operator will register your name and organization. If you have any difficulty connecting with the conference call, please contact MKR Investor Relations at 1-213-277-5550.

To listen to the live webcast or view the press release, please visit the investor relations section of the Iteris website at www.iteris.com.

During the question and answer period, management will take questions live from covering sell-side analysts, as well as answer select questions submitted to the company in advance of the call. If you would like to submit a question in advance, please do so before 5 p.m. Eastern time (2 p.m. Pacific time) on August 3, 2022 by emailing Iteris investor relations at This email address is being protected from spambots. You need JavaScript enabled to view it..

A telephone replay of the conference call will be available approximately two hours following the end of the call and will remain available for one week. To access the replay dial +1-877-481-4010 (US and Canada Toll Free), +1 919-882-2331 (International) and enter replay passcode 46154.

About Iteris, Inc.

Iteris is the world’s trusted technology ecosystem for smart mobility infrastructure management. Delivered through Iteris’ ClearMobility Platform, our cloud-enabled end-to-end solutions monitor, visualize and optimize mobility infrastructure around the world, and help bridge legacy technology silos to unlock the future of transportation. That’s why more than 10,000 public agencies and private-sector enterprises focused on mobility rely on Iteris every day. Visit www.iteris.com for more information, and join the conversation on Twitter, LinkedIn and Facebook.


Contacts

Iteris Contact
Douglas Groves
Senior Vice President and Chief Financial Officer
Tel: (949) 270-9643
Email: This email address is being protected from spambots. You need JavaScript enabled to view it.

Investor Relations
MKR Investor Relations, Inc.
Todd Kehrli
Tel: (213) 277-5550
Email: This email address is being protected from spambots. You need JavaScript enabled to view it.

DUBLIN--(BUSINESS WIRE)--The "Global Simulators Market by Application (Commercial Training, Military Training), Solution (Products, Services), Platform (Airborne, Land, Maritime), Technique (Live, Virtual & Constructive, Synthetic Environment, Gaming), Type, and Region - Forecast to 2027" report has been added to ResearchAndMarkets.com's offering.


The Global Simulators Market is projected to grow from USD 25.5 billion in 2022 to USD 34.9 billion by 2027, at a CAGR of 6.5% from 2022 to 2027.

Some of the factors fueling the market's growth include acceptance of virtual pilot training to ensure aviation safety. Developments of simulators for unmanned aerial systems are anticipated to open several growth opportunities during the forecast period.

The maritime segment accounts for the largest market size in the platform segment during the forecast period

Based on platform, the simulators market has been segmented into airborne, land, and maritime. Key players operating in the simulators market are focused on developing advanced simulators to explore new market opportunities in airborne, land, and maritime applications.

The services segment is projected to grow at the highest CAGR during the forecast period

Based on the solution, the simulators market has been segmented into products and services. The services segment includes services that simulator developers and OEMs provide to efficiently maintain and operate installed simulator hardware and software. The breakdown of simulators during any operation can cause significant losses for simulator operators. All paid aftermarket services offered by OEMs to simulator operators have been considered in this segment. There is a growing need for such services, which is expected to boost the segment's growth.

Asia Pacific is expected to account for the largest share in 2021

The Simulators industry has been studied for North America, Europe, Asia Pacific, Middle East, and Rest of the World. Asia Pacific is estimated to account for the largest share of the Simulators market in 2021. The rise in air traffic passenger, ship orders, and commercial vehicle licenses is a significant factor contributing to the market growth in the Asia Pacific region.

The report provides insights on the following pointers:

  • Market Penetration: Comprehensive information on Simulators offered by the top players in the market
  • Product Development/Innovation: Detailed insights on upcoming technologies, research & development activities, and new product & service launches in the Simulators market
  • Market Development: Comprehensive information about lucrative markets - the report analyzes the Simulators market across varied regions
  • Market Diversification: Exhaustive information about new products& services, untapped geographies, recent developments, and investments in the Simulators market
  • Competitive Assessment: In-depth assessment of market shares, growth strategies and service offerings of leading players in the Simulators market

Key Topics Covered:

1 Introduction

2 Research Methodology

3 Executive Summary

4 Premium Insights

5 Market Overview

6 Industry Trends

7 Simulators Market, by Solution

8 Simulators Market, by Platform

9 Simulators Market, by Type

10 Simulators Market, by Application

11 Simulators Market, by Technique

12 Regional Analysis

13 Competitive Landscape

14 Company Profiles

Companies Mentioned

  • Airbus SAS
  • ARI Simulation
  • Avion Group
  • AVT Simulation
  • Bohemia Interactive Simulations
  • CAE Inc.
  • ECA Group
  • Elite Simulation Solutions
  • FlightSafety International
  • Frasca International, Inc.
  • Indra Sistemas SA
  • Kongsberg Maritime
  • L3Harris Technologies
  • Oktal Sydac
  • Precision Flight Controls, Inc.
  • Raytheon Technologies
  • Rheinmetall AG
  • Saab AB
  • Simcom Aviation Training
  • ST Engineering
  • Thales SA
  • The Boeing Company
  • TruSimulation + Training Inc.
  • Virtra
  • VSTEP BV

For more information about this report visit https://www.researchandmarkets.com/r/x2qrox


Contacts

ResearchAndMarkets.com
Laura Wood, Senior Press Manager
This email address is being protected from spambots. You need JavaScript enabled to view it.
For E.S.T Office Hours Call 1-917-300-0470
For U.S./CAN Toll Free Call 1-800-526-8630
For GMT Office Hours Call +353-1-416-8900

NEW YORK--(BUSINESS WIRE)--White Oak Global Advisors LLC (“White Oak”) announced today it acted as the lead arranger for a $130 million senior secured term loan to Trecora Resources ("Trecora"), a Texas-based provider of petrochemicals, petrochemical manufacturing products and specialty waxes. Proceeds from the loan were used to consummate a take-private transaction by Balmoral Funds (”Balmoral”). Balmoral is a $1.5 billion AUM private equity firm managing committed funds, based in Los Angeles, CA.


“Trecora has built a strong business through delivering high-quality products and reliable service to its valued customers for more than 50 years,” said Albert Brandano, Director at White Oak. “We are proud to support the next chapter of Trecora’s growth as a private company in partnership with Balmoral.”

“We are enthusiastic about the opportunity to support Trecora’s next phase of growth. Over the years, Trecora’s success has been enabled by growing with its customers and we look forward to continuing that in the future,” said Richard Levernier, Vice President at Balmoral. “This represents Balmoral’s second acquisition with White Oak this year and we are excited about continuing to collaborate on forthcoming investments.”

About White Oak Global Advisors

White Oak Global Advisors, LLC (“WOGA”) is a leading alternative debt manager specializing in originating and providing financing solutions to facilitate the growth, refinancing and recapitalization of small and medium enterprises. Together with its financing affiliates, WOGA provides over twenty lending products to the market, including term, asset-based, and equipment loans, to all sectors of the economy. Since its inception in 2007, WOGA and its affiliates have deployed over $10 billion across its product lines, utilizing a disciplined investment process that focuses on delivering risk-adjusted investment returns to investors while establishing long-term partnerships with our borrowers. More information can be found at www.whiteoaksf.com.

About Balmoral Funds, LLC

Balmoral is a Los Angeles, CA-based private equity fund that was founded in 2005. Balmoral’s objective is to be the financial partner of choice for entrepreneurial and successful C-suite executives and operating advisors creating transformative, revitalizing change in the businesses they co-invest in together. Balmoral has approximately $1.5 billion of assets under management. Balmoral typically invests in companies that have revenues between $30 to $500 million and require equity investments of $10 to $100 million, with the capability of investing an additional $100 million or more in particularly compelling opportunities.

About Trecora Resources

Trecora owns and operates a specialty petrochemicals facility specializing in high purity hydrocarbons and other petrochemical manufacturing and a specialty wax facility, both located in Texas, and provides custom processing services at both facilities.


Contacts

Spencer Tait
Prosek Partners (on behalf of White Oak Global Advisors)
This email address is being protected from spambots. You need JavaScript enabled to view it.

DUBLIN--(BUSINESS WIRE)--The "Monoethylene Glycol Market: Global Industry Analysis, Trends, Market Size, and Forecasts up to 2028" report has been added to ResearchAndMarkets.com's offering.


The report predicts the global monoethylene glycol market to grow with a CAGR of 6% over the forecast period from 2022-2028.

The report on the global monoethylene glycol market provides qualitative and quantitative analysis for the period from 2020 to 2028. The study on monoethylene glycol market covers the analysis of the leading geographies such as North America, Europe, Asia-Pacific, and RoW for the period of 2020 to 2028.

The report on monoethylene glycol market is a comprehensive study and presentation of drivers, restraints, opportunities, demand factors, market size, forecasts, and trends in the global monoethylene glycol market over the period of 2020 to 2028. Moreover, the report is a collective presentation of primary and secondary research findings.

Porter's five forces model in the report provides insights into the competitive rivalry, supplier and buyer positions in the market and opportunities for the new entrants in the global monoethylene glycol market over the period of 2020 to 2028. Further, Growth Matrix gave in the report brings an insight into the investment areas that existing or new market players can consider.

What does this Report Deliver?

  • Comprehensive analysis of the global as well as regional markets of the monoethylene glycol market.
  • Complete coverage of all the segments in the monoethylene glycol market to analyze the trends, developments in the global market and forecast of market size up to 2028.
  • Comprehensive analysis of the companies operating in the global monoethylene glycol market. The company profile includes analysis of product portfolio, revenue, SWOT analysis and latest developments of the company.
  • Growth Matrix presents an analysis of the product segments and geographies that market players should focus to invest, consolidate, expand and/or diversify

Report Findings

Drivers

  • Increasing demand of mono ethylene glycol in end use industries
  • Rapid urbanization and changing lifestyle of consumers

Restraints

  • Fluctuation in prices of raw materials

Opportunities

  • Increasing R&D of ecofriendly alternatives

Company Profiles

  • Nouryon
  • BASF SE
  • Dow
  • LyondellBasell Industries Holdings B.V.
  • Royal Dutch Shell PLC
  • Reliance Industries Limited
  • Exxonmobil Corportion
  • Zhenhai Refining & Chemicals
  • Akzonobel
  • SABIC

Key Topics Covered:

1. Preface

1.1. Report Description

1.2. Research Methods

1.3. Research Approaches

2. Executive Summary

2.1. Monoethylene Glycol Market Highlights

2.2. Monoethylene Glycol Market Projection

2.3. Monoethylene Glycol Market Regional Highlights

3. Global Monoethylene Glycol Market Overview

3.1. Introduction

3.2. Market Dynamics

3.2.1. Drivers

3.2.2. Restraints

3.2.3. Opportunities

3.3. Analysis of COVID-19 impact on the Monoethylene Glycol Market

3.4. Porter's Five Forces Analysis

3.5. Growth Matrix Analysis

3.5.1. Growth Matrix Analysis by Grades

3.5.2. Growth Matrix Analysis by End-user

3.5.3. Growth Matrix Analysis by Region

3.6. Value Chain Analysis of Monoethylene Glycol Market

4. Monoethylene Glycol Market Macro Indicator Analysis

5. Global Monoethylene Glycol Market by Grades

5.1. Polyester Grade

5.2. Antifreeze Grade

5.3. Industrial Grade

5.4. Low-conductivity Grade

6. Global Monoethylene Glycol Market by End-user

6.1. Textile

6.2. Packaging

6.3. Plastic

6.4. Automotive and Transportation

6.5. Other End-user Industries

7. Global Monoethylene Glycol Market by Region 2022-2028

7.1. North America

7.1.1. North America Monoethylene Glycol Market by Grades

7.1.2. North America Monoethylene Glycol Market by End-user

7.1.3. North America Monoethylene Glycol Market by Country

7.2. Europe

7.3. Asia-Pacific

7.4. RoW

8. Company Profiles and Competitive Landscape

8.1. Competitive Landscape in the Global Monoethylene Glycol Market

8.2. Companies Profiled

For more information about this report visit https://www.researchandmarkets.com/r/74922k


Contacts

ResearchAndMarkets.com
Laura Wood, Senior Press Manager
This email address is being protected from spambots. You need JavaScript enabled to view it.

For E.S.T Office Hours Call 1-917-300-0470
For U.S./CAN Toll Free Call 1-800-526-8630
For GMT Office Hours Call +353-1-416-8900

SAN FRANCISCO--(BUSINESS WIRE)--Planet Labs PBC (NYSE: PL), a leading provider of daily data and insights about Earth, today announced a new contract with the National Oceanic and Atmospheric Administration (NOAA). The organization is leveraging Planet’s PlanetScope and SkySat products to evaluate oil spills, track marine debris, detect vessels, and identify large marine mammals like whales.


In 2004, Hurricane Ivan caused severe damage in the Gulf of Mexico, including the collapse and sinking of an oil platform. Crude oil from this platform continued to leak for over a decade, in what would become the longest running oil spill in United States history. NOAA began tracking the region with government-provided satellite data to generate reports on the situation. In 2018, NOAA reached out to Planet to explore how having a perspective of change on a near-daily basis around the platform could help inform their work.

“With rapidly changing activity in the ocean - from increasingly severe storms to growing industrial demands - I’m so glad that NOAA is able to use our datasets to continue their vital efforts to protect coastal communities and ecosystems from hazards like oil spills and illegal fishing,” said Planet Federal’s Vice President Jon Powers.

Using PlanetScope imagery which provides near-daily imagery at 3 m resolution, NOAA set up an Area of Interest (AOI) around the leaking oil platform and received timely imagery of the region, supporting their evaluations of the quantity of oil leaking into the surrounding environment. These updates were shared within their Marine Pollution Surveillance Report. Following this work, NOAA expanded their work with Planet, and today they observe a large region covering approximately 35,000 sq km in the Gulf of Mexico.

By having this frequent perspective, NOAA monitors a number of platforms, looking to identify oil spills early on. This near-daily data helps NOAA’s audiences stay informed on oil spills in the region. Their regular reports on the oil platforms are distributed to a community including the Bureau of Ocean Energy Management (BOEM) and the Bureau of Safety and Environmental Enforcement (BSEE), which are integral government departments that support regulations and enforcement for environmental protection and oceanic activities.

“Working with Planet, NOAA gets a more complete and frequent stream of information about the status of our oceanic and coastal world. Planet's high-cadence imaging helps us identify and track potential oil spills, and with tasking capabilities, we've advanced our situational awareness for vessel monitoring or marine debris,” said Jerome Fisher, Physical Scientist at NOAA.

NOAA also leverages Planet’s tasking capabilities with SkySat’s 50 cm resolution imagery to gain deeper situational awareness of activities happening in sea waters. For example, with oil spills, they are able to identify details of operational facilities and delineate oil spread with greater accuracy. SkySat also enables them to identify illegal fishing vessels operating in “no-go” or marine protected areas where fishing and traversing is prohibited due to potentially vulnerable coral reef communities. These tasking efforts have also been used by NOAA to monitor large humpback whale migrations and identify beached marine mammals.

SkySat imagery is also being evaluated by NOAA analysts for its ability to show marine debris, either at sea or in rivers. Its high resolution makes it a good candidate for debris detection in situations where other satellite imagery would not be effective.

About Planet

Planet is a leading provider of global, daily satellite imagery and geospatial solutions. Planet is driven by a mission to image the world every day, and make change visible, accessible and actionable. Founded in 2010 by three NASA scientists, Planet designs, builds, and operates the largest Earth observation fleet of imaging satellites, capturing over 30 TB of data per day. Planet provides mission-critical data, advanced insights, and software solutions to over 800 customers, comprising the world’s leading agriculture, forestry, intelligence, education and finance companies and government agencies, enabling users to simply and effectively derive unique value from satellite imagery. Planet is a public benefit corporation trading on the New York Stock Exchange as PL. To learn more visit www.planet.com and follow us on Twitter.


Contacts

Planet Press
Claire Bentley
This email address is being protected from spambots. You need JavaScript enabled to view it.

Planet Investor Relations
Chris Genualdi, Cleo Palmer-Poroner
This email address is being protected from spambots. You need JavaScript enabled to view it.

DUBLIN--(BUSINESS WIRE)--The "Boat Repairing Global Market Report 2022" report has been added to ResearchAndMarkets.com's offering.


This report provides strategists, marketers and senior management with the critical information they need to assess the global boat repairing market as it emerges from the COVID-19 shut down.

The global boat repairing market is expected to grow from $4.96 billion in 2021 to $5.56 billion in 2022 at a compound annual growth rate (CAGR) of 12.1%. The market is expected to grow to $8.42 billion in 2026 at a compound annual growth rate (CAGR) of 10.9%.

Companies Mentioned

  • Brunswick
  • Riviera
  • Holyhead Boatyard
  • Ancasta International Boat Sales
  • Survitec Survival Craft
  • Daewoo Shipbuilding & Marine Engineering
  • Hyundai Heavy Industries
  • Mitsubishi Heavy Industries
  • Samsung Heavy Industries
  • General Dynamics

Reasons to Purchase

  • Gain a truly global perspective with the most comprehensive report available on this market covering 12+ geographies
  • Understand how the market is being affected by the coronavirus and how it is likely to emerge and grow as the impact of the virus abates
  • Create regional and country strategies on the basis of local data and analysis
  • Identify growth segments for investment
  • Outperform competitors using forecast data and the drivers and trends shaping the market
  • Understand customers based on the latest market research findings
  • Benchmark performance against key competitors
  • Utilize the relationships between key data sets for superior strategizing
  • Suitable for supporting your internal and external presentations with reliable high quality data and analysis

The boat repairing market consists of sales of boat repairing and related services by entities (organizations, sole traders, and partnerships) that operate shipyards or boatyards. Only goods and services traded between entities or sold to end consumers are included.

The main types in the boat repairing market are recreational boats, commercial boats, military boats, other types. Recreational boats refer to the boats that are used for recreational purposes. The various propulsion include motorboats, sailboats. These use services such as collision damage, fire damage, submergence, groundings, and transport damage.

Asia Pacific was the largest region in the boat repairing market in 2021. North America was the second-largest region in the boat repairing market. The regions covered in this report are Asia-Pacific, Western Europe, Eastern Europe, North America, South America, the Middle East, Africa.

The increasing demand for recreational boats is anticipated to boost the demand for the boat-building market. Recreational boating is a popular leisure activity across the globe. Many people participate in recreational boating activities such as water skiing, fishing, and travel.

For instance, in 2021, The National Marine Manufacturers Association (NMMA), representing North American recreational boat, engine, and marine accessory producers, reports that retail unit sales of new powerboats in the U.S. grew last year by approximately 12 percent compared to 2019. More than 310,000 new powerboats were sold in 2020, which levels the recreational boating industry. The surge in recreational boating is likely to contribute to the demand for the boat repair market.

The maritime industry that includes shipping, boating, and sailing activities is one of the industries that has been majorly impacted due to the spread of the COVID-19 disease. This epidemic has halted boating repair and related activities due to the shutdown of facilities. All commercial and marine recreational activity and personal pleasure boats have also been suspended to control the spread of the coronavirus.

According to the Willis Towers Watson insights, over 3 billion citizens have been under lockdown resulting in a slowdown of economic activity and sinking of the global economy by -3.0%. The delay in re-establishing the supply chain networks and logistics capabilities will impact the boat building and repairing industry.

Robots are used for performing many activities in the maritime industry, from cleaning and maintenance to full-on driverless craft, to reduce the risk for humans and to increase the efficiency of the process. For instance, the Robotic Hull Bio-Inspired Underwater Grooming Tool, also called the Hull BUG, is a small robot that attaches to the underside of a vessel to clean the surface.

According to the Sea Robotics estimates, 5% of fuel efficiency from regular cleanings saves about $15 billion per year in fuel costs and reduces 1 billion tons of greenhouse gas emissions. Robots are expected to offer green and eco-friendly benefits. Therefore, advanced robotics that is influencing maritime operations is a key trend in the maritime industry.

Key Topics Covered:

1. Executive Summary

2. Boat Repairing Market Characteristics

3. Boat Repairing Market Trends And Strategies

4. Impact Of COVID-19 On Boat Repairing

5. Boat Repairing Market Size And Growth

5.1. Global Boat Repairing Historic Market, 2016-2021, $ Billion

5.1.1. Drivers Of The Market

5.1.2. Restraints On The Market

5.2. Global Boat Repairing Forecast Market, 2021-2026F, 2031F, $ Billion

5.2.1. Drivers Of The Market

5.2.2. Restraints On the Market

6. Boat Repairing Market Segmentation

6.1. Global Boat Repairing Market, Segmentation By Type, Historic and Forecast, 2016-2021, 2021-2026F, 2031F, $ Billion

6.2. Global Boat Repairing Market, Segmentation By Propulsion, Historic and Forecast, 2016-2021, 2021-2026F, 2031F, $ Billion

6.3. Global Boat Repairing Market, Segmentation By Services, Historic and Forecast, 2016-2021, 2021-2026F, 2031F, $ Billion

7. Boat Repairing Market Regional And Country Analysis

7.1. Global Boat Repairing Market, Split By Region, Historic and Forecast, 2016-2021, 2021-2026F, 2031F, $ Billion

7.2. Global Boat Repairing Market, Split By Country, Historic and Forecast, 2016-2021, 2021-2026F, 2031F, $ Billion

For more information about this report visit https://www.researchandmarkets.com/r/f2yzjj


Contacts

ResearchAndMarkets.com
Laura Wood, Senior Press Manager
This email address is being protected from spambots. You need JavaScript enabled to view it.

For E.S.T Office Hours Call 1-917-300-0470
For U.S./CAN Toll Free Call 1-800-526-8630
For GMT Office Hours Call +353-1-416-8900

Collaboration demonstrates Volta’s unique ability to maximize value for urban communities by offering accessible public charging, subsidized by advertising-enabled EV charging stations

Partnership expands the reach of the Volta Media™ Network within the number one ranked New York, NY DMA

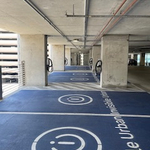
SAN FRANCISCO--(BUSINESS WIRE)--Volta Inc. (NYSE: VLTA), an industry-leading electric vehicle (“EV”) charging network powering vehicles and commerce, today announced its partnership with the City of Hoboken to install 25 conveniently located public EV charging stalls for the City’s residents, annual visitors, and commuters over the next 18 months. The addition of the new Volta charging stalls will more than double the number of public EV charging ports available in Hoboken, and Volta and the City of Hoboken may partner to bring even more chargers to the area in the future. The collaboration is a model for how EV charging infrastructure can be efficiently deployed within densely populated urban areas to maximize economic, health, and climate benefits.

Volta goes beyond charging as the only EV charging company that directly integrates an eye-catching digital media network into its public charging stations, capturing consumers’ attention as they shop and dine at local businesses and walk to entertainment venues, work, and home. Adding 25 new Volta charging stalls and 50 digital media screens in Hoboken expands Volta Media Network’s impressions by nearly 20 percent within the New York, NY designated market area (DMA), unlocking additional reach within the most highly ranked DMA for Volta’s advertising customers. This network also spurs local economic activity for Hoboken businesses by influencing shoppers’ behaviors with contextually relevant, large-format messages. City officials will also utilize Volta’s screens, providing a large-format communications platform that reaches key constituents and visitors.


The digital advertising screens featured on Volta charging stations can generate media revenue immediately upon installation, enabling Volta to offset the development and construction costs to charging partners, including the City of Hoboken. Volta’s media model benefits drivers in Hoboken as well by providing lower cost EV charging. More affordable charging prices encourage higher utilization rates and help ensure every dollar invested in building this critical infrastructure is maximized.

An accessible and public electric vehicle charging network is an essential component of achieving Hoboken’s Climate Action Plan and becoming carbon neutral by 2050,” said Mayor of the City of Hoboken Ravi S. Bhalla. “Through this partnership with Volta, no matter where a resident lives in Hoboken, they will be within a five-minute walk of a charger, making it easier to own an electric or plug-in hybrid car. I look forward to cutting the ribbon on the first 25 stalls in the new year, which will have no impact on the municipal budget.”

Introducing these new EV charging stalls directly supports Hoboken’s climate and sustainability goals. The City released its Climate Action Plan in 2019, which revealed transportation was responsible for 31 percent of the community’s greenhouse gas (GHG) emissions—the second largest contributor behind commercial real estate. Since then, the City has installed 22 public EV charging ports and has focused on making itself EV friendly by establishing favorable zoning, ordinances, community education, and more. Supporting the transition to EVs within Hoboken also has significant health and economic benefits for residents, commuters, and visitors. Per Volta’s data planning tools, Hoboken will avoid up to 2,250 tons of carbon pollution, a key source of asthma and other respiratory health problems, through increased EV adoption through 2024. Supporting the switch from gasoline to electric-provided miles is also expected to save drivers in Hoboken up to $1.2 million at the gas pump each year.1

Volta leveraged its PredictEV™ platform to identify the specific locations within Hoboken where charging stations would be most utilized by drivers. PredictEV analyzes disparate data sources, including local mobility, demographic, commercial, and site-specific data, to provide a high-fidelity plan for EV infrastructure deployment over 20 years. Insights provided by PredictEV include expected EV adoption, optimal charging locations, the right mix of charging infrastructure, and corresponding societal benefits such as CO2 mitigation, air quality improvement, and improved health outcomes. This software is already used by electric utilities and is licensed by states to create data-driven, equitable EV infrastructure plans that maximize public investment in alignment with Infrastructure Investment and Jobs Act’s (IIJA) mandates.

Over 80 percent of Americans live in urban areas, many of whom lack access to at-home EV charging. Public charging networks in densely populated areas are essential to moving away from fossil fuels and addressing climate change,” says John Stuckey, Vice President of Public Network Development at Volta. “We’re pleased to partner with the vibrant City of Hoboken to provide this essential service, and to do so at no cost to the City.”

Our partnership with the City of Hoboken is an extension of Volta’s Charging for All initiative, our commitment to investing in more accessible, equitable, and affordable public charging – especially in dense communities where home charging isn’t an option,” said Kevin Samy, Head of Policy and Climate Strategy at Volta. “Volta’s media-enabled chargers generate the most value per charger in the industry, allowing us to increase charging availability, accelerate EV adoption, and create the shortest pathway to electric mobility for all.”

About Volta

Volta Inc. (NYSE: VLTA) is an industry-leading electric vehicle ("EV") charging and media company. Volta's unique network of charging stations powers vehicles and drives business growth while accelerating a clean energy future. Volta delivers value to site partners, brands, and consumers by installing charging stations that feature large-format digital advertising screens located steps away from the entrances of popular commercial locations. Retailers can attract and influence foot traffic, advertisers can precisely target audiences, and EV drivers can charge their vehicles seamlessly as they go about their daily routines. Volta's extensive network leverages its proprietary PredictEV™ platform, which uses sophisticated behavioral science and machine learning technology to help commercial property owners, cities, and electric utilities plan EV infrastructure intelligently, efficiently, and equitably. To learn more, visit www.voltacharging.com.

Forward-Looking Statements

This press release includes forward-looking statements, which are subject to the "safe harbor" provisions of the U.S. Private Securities Litigation Reform Act of 1995. These statements may be identified by words such as "feel,” “believes,” expects,” “estimates,” “projects,” “intends,” “should,” “is to be,” or the negative of such terms, or other comparable terminology and include, among other things, statements regarding Volta’s strategy and other future events that involve risks and uncertainties. Such forward-looking statements are not guarantees of future performance and are subject to risks and uncertainties, which could cause actual results to differ materially from the forward-looking statements contained herein due to many factors, including, but not limited to: intense competition faced by Volta in the EV charging market and in its content activities; the possibility that Volta is not able to build on and develop strong relationships with real estate and retail partners to build out its charging network and content partners to expand its content sales activities; market conditions, including seasonality, that may impact the demand for EVs and EV charging stations or content on Volta’s digital displays; risks, cost overruns and delays associated with construction and installation of Volta’s charging stations; risks associated with any future expansion by Volta into additional international markets; cost increases, delays or new or increased taxation or other restrictions on the availability or cost of electricity; rapid technological change in the EV industry may require Volta to continue to develop new products and product innovations, which it may not be able to do successfully or without significant cost; the risk that Volta’s shift to including a pay-for-use charging business model and the requirement of mobile check-ins adversely impacts Volta’s ability to retain driver interest, content partners and site hosts; the ability of Volta's new management team to successfully integrate into Volta and execute on Volta's business strategy; the EV market may not continue to grow as expected; and the ability to protect its intellectual property rights; and those risk factors discussed in Volta’s Annual Report on Form 10-K for the year ended December 31, 2021, Volta's Form 10-Q for the quarter ended March 31, 2022, filed with the Securities and Exchange Commission (the “SEC”) on May 13, 2022, and other Quarterly Reports on Form 10-Q, and other reports and documents Volta files from time to time with the SEC. Any forward-looking statements speak only as of the date on which they are made, and Volta undertakes no obligation to update any forward-looking statement to reflect events or circumstances after the date of this press release.

1 Data collected to determine cost savings from avoided gas fees is calculated using Volta’s proprietary PredictEV software, the US EPA’s published greenhouse gas equivalencies calculator, and the average gas price of gas stations located in Hoboken on July 15, 2022. These calculations are good faith estimates made using assumptions that are based on current industry and other government and societal data available to Volta, which may be updated from time to time.


Contacts

Volta Inc.
Jette Speights
This email address is being protected from spambots. You need JavaScript enabled to view it.

City of Hoboken
Marilyn Baer
This email address is being protected from spambots. You need JavaScript enabled to view it.

DUBLIN--(BUSINESS WIRE)--The "Enhanced Oil Recovery Market Size, Share & Trends Analysis Report By Technology (Thermal, CO2 Injection, Chemical), By Application (Onshore, Offshore), By Region, And Segment Forecasts, 2022 - 2030" report has been added to ResearchAndMarkets.com's offering.


The global enhanced oil recovery market size is expected to reach USD 76.78 billion by 2030 and is expected to expand at a CAGR of 7.8% from 2022 to 2030.

A growing number of aging wells witnessing declining production rates, coupled with rising government investment in research and development activities, is likely to drive the market for enhanced oil recovery (EOR) over the forecast period.

Increasing technological advancements are enabling E&P companies to revive old wells and thus attain optimum production. This trend is estimated to positively influence the EOR industry landscape. The increasing number of mature wells and significant investment in R&D activities for new technology development by various market players to improve the oil recovery process are expected to fuel the growth of the industry.

Industry participants enter into several strategic collaborations, mergers & acquisitions, and joint ventures in order to expand their foothold across various regional markets and develop economic technologies. The technologies used in EOR are mostly in-housed by the companies. To further reduce the overall operational costs, market players procure raw materials such as nitrogen, carbon dioxide, polymer, and others from small-scale regional players.

The COVID-19 pandemic has severely disrupted the oil and gas market with drastically plummeting oil prices resulting in delayed drilling projects. The demand for crude oil is anticipated to drop further due to reduced industrial activity and transport due to COVID-19. These factors are expected to negatively affect the growth of the market in the near future.

Enhanced Oil Recovery Market Report Highlights

  • The thermal technology segment occupied the largest revenue share in 2021. Thermal technology lowers the oil viscosity and increases its mobility ratio, thereby enhancing the oil recovery process
  • The CO2 injection technology segment is anticipated to be the fastest-growing segment over the forecast period owing to its eco-friendly nature of reducing carbon emissions by utilizing the emissions for refineries and coal-based power plants
  • The onshore application segment occupied the largest revenue share in 2021 owing to the significant presence of onshore exploration and production projects across the world, along with lower conventional extraction costs for onshore oilfields
  • North America accounted for the largest revenue share in 2021 owing to the presence of a large number of existing and new EOR projects under operation across the region in countries such as the U.S. and Canada
  • Asia Pacific is expected to witness the fastest growth over the forecast period owing to the rise in EOR activities expected in Asian countries such as China, Malaysia, Indonesia, and India

Market Dynamics

Market Driver Analysis

  • Increasing Number of Matured Wells
  • Investment in R&D for Developing New Resources

Market Restraint Analysis

  • Fluctuation in Oil Prices

Business Environment Analysis: Enhanced Oil Recovery Market

  • Industry Analysis - Porter's
  • PESTEL Analysis

Impact of Covid-19 on Enhanced Oil Recovery Market

Company Profiles

  • ExxonMobil Corporation
  • BP plc
  • Total SA
  • China Petroleum & Chemical Corporation
  • Royal Dutch Shell plc
  • Chevron Corporation
  • Petroleo Brasileiro S.A.
  • LUKOIL
  • Cenovus Energy, Inc.
  • Equinor ASA

For more information about this report visit https://www.researchandmarkets.com/r/i9nrbx


Contacts

ResearchAndMarkets.com
Laura Wood, Senior Press Manager
This email address is being protected from spambots. You need JavaScript enabled to view it.

For E.S.T Office Hours Call 1-917-300-0470
For U.S./CAN Toll Free Call 1-800-526-8630
For GMT Office Hours Call +353-1-416-8900

Company Joins AWS Partner Network to Provide Customers with Industrial Cybersecurity Solution to Ensure Reliable Electricity and Fuel Supplies


  • Siemens Energy joins the AWS Partner Network as a Technology Partner to provide customers with industrial cybersecurity, analytics, and storage solutions
  • Siemens Energy’s AI-driven Managed Detection & Response (MDR) solution is a first of a kind security offering available in AWS Marketplace built for energy and utilities, by an integrated energy technology company focused across the entire energy value chain
  • MDR’s monitoring and detection insights provide scalable protection against disruptive cyberattacks in the energy sector using innovative artificial intelligence

WASHINGTON--(BUSINESS WIRE)--Siemens Energy Inc, one of the world’s leading energy technology companies, announces it is joining the Amazon Web Services (AWS) Partner Network (APN), a global community of partners that leverage programs, expertise, and resources to build, market, and sell customer offerings.

This expanded relationship includes listing Siemens Energy’s Managed Detection and Response (MDR) industrial cyber security solution in AWS Marketplace, a digital catalog that makes it easy for customers to find, compare, and immediately start using the software and services that run on AWS. This MDR security offering in AWS Marketplace is built for energy and utilities, by an integrated energy technology company focused across the entire energy value chain. As energy companies strive to protect physical infrastructure from escalating cyber threats, Siemens Energy’s MDR on AWS reduces the cost and technical barriers to achieving strong, fast, comprehensive cyber defense.

Expanding access to state-of-the-art cybersecurity is essential to ensuring reliable electricity and fuel supplies. Cyber risks to infrastructure are escalating amid the ongoing transition toward renewable and low-carbon energy sources and the accompanying expansion of digital devices in the energy sector. Siemens Energy’s MDR will help customers leverage analytics to secure their infrastructure while reducing costs, improving efficacy, and reducing emissions.

Siemens Energy’s industrial monitoring and detection solution defends critical infrastructure against cyberattacks, helping protect communities around the world from supply chain disruptions. AWS’s capabilities allow MDR’s technology to quickly collect and analyze large volumes of data to monitor for cyber threats, giving energy sector chief information security officers (CISOs) the power to detect and uncover attacks before they execute.

Secure cloud capabilities that can integrate digital applications and leverage sensitive data – such as real-time monitoring and detection – add an important and cost-effective tool to the defensive arsenal for CISOs and industrial security analysts.

“The energy transition relies on seamlessly connecting physical assets with digital technologies to foster innovation, reduce emissions, and improve efficiency, but this future depends on strong cybersecurity across the whole supply chain,” said Leo Simonovich, Vice President and Global Head of Industrial Cyber, Siemens Energy. “Siemens Energy’s AI-driven industrial cyber monitoring and detection platform is purpose-built to help CISOs identify, prevent, and mitigate cyber threats to the energy sector’s digital business model. Energy companies at every scale can now access and integrate advanced cyber threat detection across their operating environment, leveraging AWS’s secure cloud platform to build and defend the foundation of a digital energy ecosystem.”

“Cloud is accelerating innovation across the energy value chain and a key enabler to more resilient energy infrastructure,” said Jeff Miers, Director of Partners and Alliances, Energy & Utilities Business Unit at AWS. “With the convergence we are seeing across operational technology (OT) and information technology, we are excited to expand our relationship with Siemens Energy through the AWS Partner Network to provide OT cybersecurity solutions purpose built for the energy and utilities market.”

To learn more, please visit the AWS Marketplace listing for Siemens Energy Managed Detection & Response.

This press release and a press picture / press pictures / further material is available at https://press.siemens-energy.com/na/

Follow us on Twitter at: www.twitter.com/siemens_energy

Siemens Energy is one of the world’s leading energy technology companies. The company works with its customers and partners on energy systems for the future, thus supporting the transition to a more sustainable world. With its portfolio of products, solutions and services, Siemens Energy covers almost the entire energy value chain – from power generation and transmission to storage. The portfolio includes conventional and renewable energy technology, such as gas and steam turbines, hybrid power plants operated with hydrogen, and power generators and transformers. More than 50 percent of the portfolio has already been decarbonized. A majority stake in the listed company Siemens Gamesa Renewable Energy (SGRE) makes Siemens Energy a global market leader for renewable energies. An estimated one-sixth of the electricity generated worldwide is based on technologies from Siemens Energy. Siemens Energy employs around 91,000 people worldwide in more than 90 countries and generated revenue of €28.5 billion in fiscal year 2021. www.siemens-energy.com.


Contacts

Stacia Licona
+1 (281) 721-3402
This email address is being protected from spambots. You need JavaScript enabled to view it.

DUBLIN--(BUSINESS WIRE)--The "Bulk Liquid Global Market Report 2022: By End Use By Properties" report has been added to ResearchAndMarkets.com's offering.


The global bulk liquids market is expected to grow from $50.65 billion in 2021 to $55.31 billion in 2022 at a compound annual growth rate (CAGR) of 9.2%. The market is expected to grow to $75.17 billion in 2026 at a compound annual growth rate (CAGR) of 8%.

Major players in the bulk liquids trucking market are Tankstar USA, Kenan Advantage Group Inc, Foodliner, Quality Distribution, Trimac Transportation Services, Heniff Transportation Systems, A&R Logistics, Superior Bulk Logistics, Groendyke Transport, and Ruan.

The bulk liquids trucking market consists of sales of bulk liquids trucking services and related goods by entities (organizations, sole traders, and partnerships) that provide over-the-road transportation of bulk liquids. Only goods and services traded between entities or sold to end consumers are included.

The main types in the bulk liquids trucking market are edible liquids and non-edible liquids. Edible liquids are anything liquid and edible that is safe for human consumption. The market is segmented by properties into flammable and non-flammable and by end-use into chemical, dairy, beverages, and others.

Asia Pacific was the largest region in the abulk liquids trucking market in 2021. North America was the second largest region in the bulk liquids trucking market. The regions covered in this report are Asia-Pacific, Western Europe, Eastern Europe, North America, South America, Middle East, and Africa.

Increasing production and consumption of chemicals drives the demand for the bulk liquids transportation market. According to the American Chemical Council, tons of products are supplied to the chemicals industry through rail, truck, waterborne modes, and pipelines According to the Eurostat statistics released in 2020, the production and consumption of hazardous chemicals in the EU stood at 230 million tons. Therefore, high production and consumption of chemicals and related products are projected to generate high demand for bulk liquids trucking transportation and subsequently fuel the growth of the market.

The driver shortage is one of the major factors restricting the growth of the bulk liquid trucking market. According to the American Trucking Associations report of 2019, there is a need for 60,000 more commercial drivers to keep America's trucking industry moving. The report also suggests that the industry needs to hire an average of 110,000 drivers per year to meet both increasing demands for new truck drivers and to replace retiring drivers. The severe scarcity of drivers is negatively impacting the growth of the bulk liquid trucking market.

Electronic Logging Devices (ELD) are increasingly being adopted by the trucking industry to regulate the working hours of truck drivers. An electronic logging device is a technology used by drivers of commercial motor vehicles (CMVs) to automatically record driving time and Hours of service (HOS) records, capture data on the vehicle's engine, movement, and miles driven. Increased digitization and the use of telematics technology are also boosting growth in the market.

Key Topics Covered:

1. Executive Summary

2. Bulk Liquid Market Characteristics

3. Bulk Liquid Market Trends And Strategies

4. Impact Of COVID-19 On Bulk Liquid

5. Bulk Liquid Market Size And Growth

5.1. Global Bulk Liquid Historic Market, 2016-2021, $ Billion

5.1.1. Drivers Of The Market

5.1.2. Restraints On The Market

5.2. Global Bulk Liquid Forecast Market, 2021-2026F, 2031F, $ Billion

5.2.1. Drivers Of The Market

5.2.2. Restraints On the Market

6. Bulk Liquid Market Segmentation

6.1. Global Bulk Liquid Market, Segmentation By Liquid Type, Historic and Forecast, 2016-2021, 2021-2026F, 2031F, $ Billion

  • Edible liquids
  • Non-edible liquids 

6.2. Global Bulk Liquid Market, Segmentation By End Use, Historic and Forecast, 2016-2021, 2021-2026F, 2031F, $ Billion

  • Chemical
  • Dairy
  • Beverages
  • Other End Users

6.3. Global Bulk Liquid Market, Segmentation By Properties , Historic and Forecast, 2016-2021, 2021-2026F, 2031F, $ Billion

  • Flammable
  • Non-flammable

7. Bulk Liquid Market Regional And Country Analysis

7.1. Global Bulk Liquid Market, Split By Region, Historic and Forecast, 2016-2021, 2021-2026F, 2031F, $ Billion

7.2. Global Bulk Liquid Market, Split By Country, Historic and Forecast, 2016-2021, 2021-2026F, 2031F, $ Billion

Companies Mentioned

  • Tankstar USA
  • Kenan Advantage Group Inc.
  • Foodliner
  • Quality Distribution
  • Trimac Transportation Services
  • Heniff Transportation Systems
  • A&R Logistics
  • Superior Bulk Logistics
  • Groendyke Transport
  • Ruan
  • Dupre Logistics
  • Eagle Transport Corp.
  • Martin Transport Inc.
  • Florida Rock & Tank Lines
  • Coastal Transport Co.
  • Apex Logistics
  • Cliff Viessman Inc.
  • J&M Tank Lines Inc.
  • Andrews Logistics
  • Grammer Industries
  • CCC Transportation/ CTL Transportation
  • Prime Inc.
  • CLI Transport
  • Transportes Auto Tanques Ochoa
  • Herman R. Ewell Inc.
  • Solar Transport
  • Service Transport Co.
  • Tidewater Transit Co.
  • Schilli Corp.
  • Liquid Trucking

For more information about this report visit https://www.researchandmarkets.com/r/rtq2p3


Contacts

ResearchAndMarkets.com
Laura Wood, Senior Press Manager
This email address is being protected from spambots. You need JavaScript enabled to view it.

For E.S.T. Office Hours Call 1-917-300-0470
For U.S./CAN Toll Free Call 1-800-526-8630
For GMT Office Hours Call +353-1-416-8900

A leading-edge solution to provide clean energy for the community and to bring sustainability to their larger society.

NAGOYA, Japan--(BUSINESS WIRE)--#Biz4SDGs--GomunoInaki, a Japanese global trading company with R&D functions that specializes in supplying rubber/plastic goods to automotive, housing, home appliances, office infrastructure, and medical industries, installed a Smartflower at their headquarters in Nagoya, Japan in March 2022. The Smartflower, an aesthetically beautiful yet efficient and innovative solar product, was chosen by GomunoInaki to act as a symbol of their support for the United Nations’ Sustainable Development Goals, and with the hopes that more companies across Japan will see the need to adopt sustainable energy solutions.


As a respected company with over a century of history and experience, GomunoInaki believes in being an innovator and holds its community and environment in high regard. Part of its corporate motto reads, “By respecting innovation and change, we face the challenges of tomorrow”. The investment GomunoInaki has made in its first Smartflower displays its willingness to tackle the myriad of environmental and sustainable challenges that our society face and is a bold contribution to the United Nations’ 2030 Agenda for Sustainable Development.

"We are very happy to have the Smartflower installed at our site,” said Kimiyasu Kimura, Senior Director of GomunoInaki Co., Ltd., adding, “This charming and appealing Smartflower will act as a symbol of our commitment toward energy conservation and incorporation of reusable energy source to reach carbon neutrality by 2025.”

“It is our great pleasure to serve GomunoInaki with SmartFlower Solar, a very iconic symbol for SDGs. I am quite confident that the Smartflower at GomunoInaki will tell surrounding communities the great value of zero-carbon society as well as self-sustainable renewable energy,” said Kaoru Usami, Representing Director of BWCP.

Manufactured and produced by Boston-based company SmartFlower Solar, the Smartflower is a cutting-edge solar product that employs a multitude of intelligent features to combine efficiency and beauty into one sustainable product. The core brilliance of the Smartflower is in its dual-axis tracking system. At sunrise, Smartflower opens its panels to the optimal 90° angle to the sun and follows the sun's path across the sky, producing up to 40% more energy than stationary solar panels. SmartFlower Solar has installed thousands of Smartflowers worldwide, with notable clients like Adidas, Nike, Siemens, Carlsberg, and Vodafone.

“We are honored to add GomunoInaki to our global roster of blue-chip corporations. Their decision to install the Smartflower in front of their corporate headquarters is one of their visible commitments to sustainability and will also inspire and educate their customers, suppliers, and employees to incorporate sustainability initiatives in their operations and daily lives,” said Jim Gordon, CEO of SmartFlower Solar.

About GomunoInaki

GomunoInaki made its debut in 1919 as Inaki-Shoten, a distributor of industrial rubber products, in Japan and have strived through for over a century supplying automotive and other industries with rubber/plastic products. Being traditional and respecting long built relationship with customers, suppliers and the community, while maintaining flexibility and meeting the fast-changing society’s needs, the company has grown into a global trading company with R&D functions and now has 18 subsidiaries in 10 countries around the word. Learn more at https://www.inaki.co.jp/.

About SmartFlower Solar

SmartFlower Solar is based in Boston, Massachusetts, and manufactures and markets the revolutionary and patented Smartflower solar energy system. Its product platform consists of the Smartflower, Smartflower +Plus – which has an integrated battery storage component – and the Smartflower EV which is a solar powered electric vehicle charger. The company sells its products globally to a wide range of residential, commercial, and institutional energy users searching for iconic design and optimal solar and energy storage solutions. Learn more at www.smartflower.com.

About Blue Wave Capital Partners

Blue Wave Capital Partners (“BWCP”), representing Smartflower Solar in Japan, has been in the power and energy industry over the past decades. BWCP has a wide variety of network relationships with many industry leaders in Japan as well as in the US, being involved in project development, construction management, operation and maintenance as well as project finance arrangement for many different kinds of a power generating facility. BWCP’s mission is to contribute to a sustainable growth society with zero-carbon and environmentally friendly best available technology.


Contacts

Press:
For all inquiries regarding SmartFlower Solar, please contact Jim Gordon, at This email address is being protected from spambots. You need JavaScript enabled to view it..
For more information about Smartflower, visit smartflower.com.

MILWAUKEE--(BUSINESS WIRE)--Zurn Elkay Water Solutions Corporation (NYSE: ZWS) announced today that its Board of Directors declared a quarterly common stock dividend of $0.07 per share payable in cash on September 7, 2022 to stockholders of record as of August 19, 2022.


“The dividend we declared today more than doubles the initial quarterly dividend we started with as a pure play water solutions business. With the transformation to Zurn Elkay Water Solutions our Board of Directors has increased the dividend to reflect our continued commitment to delivering shareholder value,” said Todd A. Adams, Chairman and Chief Executive Officer. “Our robust cash flow, strong financial characteristics and low leverage supports our ability to consistently pay a dividend while continuing to invest in our core business to drive organic growth as well as to execute strategic acquisitions.”

About Zurn Elkay Water Solutions

Headquartered in Milwaukee, Wisconsin, Zurn Elkay Water Solutions is a growth-oriented, pure-play water business that designs, procures, manufactures, and markets what we believe is the broadest sustainable product portfolio of solutions to improve health, human safety, and the environment. The Zurn Elkay product portfolio includes professional grade water control and safety, water distribution and drainage, drinking water, finish plumbing, hygienic, environmental and site works products for public and private spaces. Visits www.zurn-elkay.com for additional information about the Company.

Forward-Looking Statements

Information in this release may involve outlook, expectations, beliefs, plans, intentions, strategies or other statements regarding the future, which are forward-looking statements. These forward-looking statements involve risks and uncertainties. All forward-looking statements included in this release are based upon information available to Zurn Elkay Water Solutions Corporation as of the date of the release, and Zurn Elkay Water Solutions Corporation assumes no obligation to update any such forward-looking statements. The statements in this release are not guarantees of future performance, and actual results could differ materially from current expectations. Numerous factors could cause or contribute to such differences. Please refer to “Risk Factors” and “Cautionary Notice Regarding Forward-Looking Statements” in the Company’s Form 10-K for the period ended December 31, 2021 as well as the Company’s annual, quarterly and current reports filed on Forms 10-K, 10-Q and 8-K from time to time with the SEC for a further discussion of the factors and risks associated with the business.


Contacts

Investor Relations:
Dave Pauli, Vice President – Investor Relations
414-223-7770

Media Relations Zurn:
Angela Hersil, Director – Corporate Communications
855-480-5050
414-808-0199
This email address is being protected from spambots. You need JavaScript enabled to view it.

BOSTON--(BUSINESS WIRE)--American Tower Corporation (NYSE: AMT) today announced the release of its 2021 sustainability report. The report outlines the Company’s sustainability strategy which is built upon three core pillars—Environment, Social and Governance (ESG)—and provides a comprehensive overview of the actions the Company is taking as it strives to meet its objectives in these critical areas.


Through a dedicated focus on its sustainability strategy and commitment to positively impacting customers, employees, stockholders, suppliers and its served communities, American Tower continues to make strong advancements within each of its ESG pillars. The report highlights this progress against key quantitative and qualitative sustainability goals, including science-based greenhouse gas (GHG) emissions reduction targets and advancements on diversity, equity and inclusion.

Tom Bartlett, American Tower’s President and Chief Executive Officer, stated, “Our sustainability program is grounded in our strategic priorities to foster a more equitable culture for our employees, improve our operational efficiencies, support the needs of our customers, uphold ethics and integrity at every level of the organization and engage with our local communities. Steadfast commitment to these key priorities will be integral to our continued success, especially as we continue to grow our business in this technology-driven era.”

Key highlights from the 2021 report include:

  • Adopted science-based GHG emissions reduction targets, approved by the Science Based Targets initiative, reflecting the goals set forth in the 2015 Paris Agreement and the Company’s efforts to limit future global warming to well below two degrees Celsius above pre-industrial levels
  • Achieved 78% of the Company’s 2025 second-generation renewable energy goal by expanding its portfolio to include 58MW of solar capacity installed at almost 11,000 sites
  • Established American Tower’s 308th Digital Community, achieving over 15% progress toward the Company’s goal of establishing 2,000 Digital Communities by the end of 2026
  • Distributed nearly $6 million to communities globally through workplace giving and matching programs, volunteer events, disaster-relief donations and financial contributions from the American Tower Foundation
  • Became a signatory to the United Nations (UN) Global Compact and the UN’s Women’s Empowerment Principles in early 2022, reinforcing the Company’s continued commitment to promoting and maintaining an ethical, diverse and inclusive culture

For more information on American Tower’s sustainability program and to view the Company’s 2021 Sustainability Report, please visit the “Sustainability” section of the Company’s website at www.americantower.com/sustainability.

About American Tower

American Tower, one of the largest global REITs, is a leading independent owner, operator and developer of multitenant communications real estate with a portfolio of approximately 221,000 communications sites and a highly interconnected footprint of U.S. data center facilities. For more information about American Tower, please visit www.americantower.com.

Cautionary Language Regarding Forward-Looking Statements

This press release contains “forward-looking statements” concerning the Company’s goals, beliefs, expectations, strategies, objectives, plans, future operating results and underlying assumptions and other statements that are not necessarily based on historical facts. Actual results may differ materially from those indicated in the Company’s forward-looking statements as a result of various factors, including those factors set forth in Item 1A of its Form 10-K for the year ended December 31, 2021 under the caption “Risk Factors.” The Company undertakes no obligation to update the information contained in this press release to reflect subsequently occurring events or circumstances.


Contacts

ATC:
Adam Smith
Senior Vice President, Investor Relations
Telephone: (617) 375-7500

The start-up’s first deployment represents 5% of the total U.S. market

NEW YORK--(BUSINESS WIRE)--Invisible Urban Charging (“IUC”) announced today that it is rolling out more than 6,000 chargers for electric vehicles (“EV”) into the State of Florida. Once fully deployed, IUC will have doubled the number of EV chargers in the State, making it the largest EV charger operator in Florida.


Starting with an iconic building in central Orlando, IUC is working closely with Lincoln Property Company, one of the largest private U.S. property developers and a leader in sustainable building design, to deploy EV chargers to its new mixed-use tower – Truist Plaza at Church Street Station. IUC partners with major property owners to provide on-site EV charging at scale in high numbers, helping to meet an increasing demand that is expected to require 3.5 million chargers by 2030.

"EV charger infrastructure is a critical piece of the puzzle that will accelerate the shift to electric transport,” said Nigel Broomhall, Co-Founder and Chief Executive Officer of IUC. “By rolling out high volumes of EV chargers, we encourage more people to drive electric sooner. We expect our rollout will also help add high-paying local jobs, and more EVs will improve air quality, make Florida cities quieter and cleaner, reduce the dependance on foreign oil, and assist in help reduce the impacts of climate change.”

“Lincoln Property Company of Florida, Inc. is deeply committed to ESG and driving towards a Net Zero Carbon initiative, including in those properties where we provide management services for our building owners and partners like Church Street Station. We firmly believe providing ESG enabled technology is a critical component of ‘partnering with our tenants’ by affording them the platform to recruit and retain high-quality talent which, in turn, results in increased ROI / bottom line,” said Scott Stahley, Executive Vice President at Lincoln Property Company of Florida. “EV chargers are certainly one part of this solution set, and IUC is one of the best resources that gives us ultimate flexibility in how we deploy and apply these enhancements for the benefit of our tenants and building owners alike. We are seeing increased demand for these types of solutions as a byproduct of regulatory requirements and customer requests. Lincoln strives to create a competitive advantage against the market via both ESG and overall cutting-edge technology. In this regard, the EV solution provided by IUC aligns perfectly with present and future market demand as we move into the next phases of Church Street Station.”

IUC was founded in 2019 in New Zealand with the mission to accelerate the world’s transition to electric transportation. Jones Lang LaSalle, a global leader in property development and management, serves as installation partner, along with a nationwide installation capability through its network of electrical contractors, logistics, and signage partners.

“The partnership with IUC and Lincoln properties is in alignment with Jones Lang LaSalle’s goals in sustainability and supports our global initiatives to build a better world through real estate,” said Brian Terrell, Senior Managing Director for JLL.

Added Eileen Murray, a strategic advisor to IUC and former co-CEO of Bridgewater Associates, “IUC is about driving solutions that can have a massive positive impact through scale. The application of ESG principles is very real in IUC. They have a diverse team that’s focused on delivering an infrastructure for EVs that makes access to chargers easier for everyone.”

About Invisible Urban Charging

Invisible Urban Charging was founded in 2019 as a complete “electric vehicle charging solution as a service” provider, working with major property owners across the globe to drive the electrification of transportation and to make an impact. IUC is an end-to-end EV solution, using their capital to deploy high volumes of EV chargers to customer sites for a flat monthly fee. For more information, please visit our website at www.iucharging.com.


Contacts

Media Contact
This email address is being protected from spambots. You need JavaScript enabled to view it.


Nuclear fusion company has consulted with the White House and secured patents, top scientists, and DOE buy-in regarding clean and attainable Earth-bound energy

AUSTIN, Texas--(BUSINESS WIRE)--Focused Energy, the German American fusion startup whose investors include Prime Movers Lab, Alex Rodriguez, Marc Lore, and Tony Florence of New Enterprise Associates, is celebrating the progress it has made toward an inexhaustible clean energy source in the past year.


The company’s anniversary comes just ahead of the one-year commemoration of the breakthrough at the Lawrence Livermore National Lab in California last August, in which a tiny pellet of deuterium and tritium released more energy than it absorbed from the laser energy used to spark the fusion ignition reaction. In just one year, it has become clear not only that fusion is viable, but that modern lasers provide the most realistic direction for the commercial use of this energy source.

"Fusion is one of the most exciting challenges of our time, and we’re so proud to be leading the charge in terms of viability for successful ignition and commercialization with the best team out there," said Thomas Forner, co-founder and CEO of Focused Energy. “There’s more that can be done with fusion technology, as well, from increasing the safety of fission reactors to detecting hidden land mines. The work we’re doing is crucial in terms of the climate crisis, but also stands to benefit society in unexpected ways”

“I joined Focused Energy because I want to see fusion energy happen and I think I can help Focused Energy do that,” said Debra Callahan, Fusion Power Associates Leadership Award recipient and incoming Scientific Director at Focused Energy. “Focused Energy is assembling an excellent team and I want to be part of it.”

Looking ahead, the company’s mission is to increase the energy output from that ignition many times over. To achieve this, Focused Energy has spent the past year shoring up its technological, personnel, and industry credentials and capabilities:

  1. Technology advancements: Focused Energy has developed many technologies currently in experimental use. These include laser amplifiers, target positioning robots and novel diagnostics for the experiments. The target laboratory in Darmstadt, ownership of which was recently transferred from the TU to Focused Energy, is also already producing targets. The lab is considered one of the world's leading and was co-founded by Todd Ditmire and Markus Roth.
  2. Hire of top scientists: Many top scientists from Lawrence Livermore National Labs (LLNL) are now at Focused Energy. These include former director Bill Goldstein, Prav Patel, one of LLNL's chief scientists, and most recently Debra Callahan, a leading expert in simulation and modeling of the fusion targets who designed the laser shot that made the breakthrough in laser fusion last year. Two of Focused Energy's founders, Todd Ditmire and Markus Roth, were instrumental in developing the laser systems in Livermore. Ditmire also developed the more modern, more powerful laser at the renowned ELI Laser Center in Prague.
  3. Industry recognition: Focused Energy has already been recognized by the U.S. Department of Energy as one of the top potential partners for a public-private partnership. The company was also included in the White House‘s Fusion Summit in March 2022.

What’s next for fusion energy

In autumn 2022, a first experiment will take place at the ELI Laser Center in Prague using Focused Energy's laser technology to generate high repetition rate plasmas for fusion experiments. This marks another milestone on the road to bringing solar energy to Earth.

Focused Energy is also currently developing the technology for a pilot plant together with renowned companies. This will be built by the end of the decade and will serve as a "proof of concept" for the unique laser ignition approach to controlled nuclear fusion.

Industry and manufacturing relationships include Schott, which will build the special glasses and Zeiss will build the special optics; Merck will supply raw materials and special chemicals for target production, and Heraeus will coat the targets with precious metals.

Starting in the mid-2030s, the first commercial power plants will generate inexpensive electricity from the fusion of hydrogen into helium.

For more information about the status of fusion energy and other commercial applications of laser technology, visit https://www.focused-energy.world/

About Focused Energy

Focused Energy is a German American company spun off from the Technical University of Darmstadt in 2021 that will enable safe, clean, and virtually inexhaustible energy production through laser-based nuclear fusion in just a few years. The young company is based in Darmstadt and in Austin/Texas and employs the best minds from relevant research institutes and universities in Europe and the USA. Focused Energy uses the experience of its founders gained over the past 30 years in fusion research, coupled with the speed of a young German American company and private investment, to bring laser-based fusion to market and satisfy the world's hunger for energy.


Contacts

RLYL
Maija McManus
Email: This email address is being protected from spambots. You need JavaScript enabled to view it.
Phone: + 1 617 413 7841

PITTSBURGH--(BUSINESS WIRE)--Alcoa Corporation (NYSE: AA) today reported second quarter 2022 financial results that included an 11 percent sequential increase in revenue and strong cash flow that enabled stock buybacks and the payment of cash dividends.


Second Quarter Highlights

  • Revenue increased sequentially to $3.6 billion, primarily due to improved shipments and higher pricing
  • Net income increased sequentially to $549 million, or $2.95 per share
  • Adjusted net income of $496 million, or $2.67 per share
  • Adjusted EBITDA excluding special items of $913 million
  • Cash balance of $1.6 billion at quarter end
  • Strong cash flows; increased capital returns with $275 million of common stock repurchased and $19 million in cash dividends
  • Improved the Company’s revolving credit facility with terms that provide more flexibility to execute on Alcoa’s strategies

“We had a strong first half of 2022 with nearly $2 billion in Adjusted EBITDA and cash flows that have enabled more buybacks under our existing stock repurchase program as well as continued quarterly dividend payments,” said Alcoa President and CEO Roy Harvey. “We have returned more than $380 million so far this year to our investors, and today we announced an additional $500 million authorization for future stock repurchases.

“As we progress into the remainder of this volatile year, we remain focused on our strategic priorities and our vision to reinvent the aluminum industry for a sustainable future,” Harvey said.

Financial Results

M, except per share amounts

2Q22

1Q22

2Q21

Revenue

$3,644

$3,293

$2,833

Net income attributable to Alcoa Corporation

$549

$469

$309

Earnings per share attributable to Alcoa Corporation

$2.95

$2.49

$1.63

Adjusted net income

$496

$577

$281

Adjusted earnings per share

$2.67

$3.06

$1.49

Adjusted EBITDA excluding special items

$913

$1,072

$618

Second Quarter 2022 Results

  • Revenue: On a sequential basis, the Company’s total third-party revenue increased 11 percent, driven primarily by improved shipments in Alumina and Aluminum. In Alumina, third-party revenue increased 26 percent sequentially with the average realized alumina price improving 18 percent to $442 per metric ton. In the Aluminum segment, revenue increased 6 percent with higher shipments and regional premiums. The Company’s average realized third-party price per metric ton of aluminum was $3,864 in the second quarter.

  • Shipments: Outbound transportation logistics improved in the second quarter with greater availability of railcars and vessels, positively influencing Alumina and Aluminum. In Alumina, third-party shipments increased 7 percent sequentially. In Aluminum, shipments of commodity grade aluminum were up 9 percent sequentially, and value add products increased 3 percent.

  • Production: In the second quarter, Alumina produced 3.23 million metric tons, and Aluminum produced 499,000 metric tons, largely consistent with the first quarter output.

  • Net income attributable to Alcoa Corporation improved to $549 million, or $2.95 per share, from the first quarter’s net income of $469 million, or $2.49 per share. The second quarter GAAP net income in comparison to first quarter includes several notable items:
    • Reversal of valuation allowances on Brazil value added taxes (VAT) recorded as $83 million in restructuring and other charges and $46 million in cost of goods sold. With the restart of the Alumar smelter in Brazil and its first metal sales in June 2022, the Company regained the ability to monetize state VAT credits that were fully reserved in 2018 and will be recovered in coming years with future domestic metal sales.
    • Absence of first quarter restructuring charges of $125 million.
    • Mark-to-market gains of $106 million related to energy contracts.
    • Charge of $39 million to cost of goods sold for estimates of expected work on impoundments in Brazil.
    • Higher tax and noncontrolling interest impacts on above items of $115 million.
  • Adjusted net income was $496 million, or $2.67 per share, excluding the impact from net special items of $53 million of income. Notable special items include restructuring and other reversals of $75 million net, primarily related to the Brazil VAT item discussed above, a net favorable change of $106 million in mark-to-market energy derivative instruments, costs of $25 million related to the restart process at the Alumar smelter in Brazil and of modest capacity at the Portland Aluminium smelter in Australia, and tax and noncontrolling interest impacts on above items of $98 million.

  • Adjusted EBITDA excluding special items decreased 15 percent sequentially to $913 million, primarily on lower metal prices late in the second quarter and higher costs for raw materials, energy, and production.

  • Cash: Alcoa ended the quarter with cash on hand of $1.6 billion. Cash provided from operations was $536 million. Cash used for financing activities was $349 million, primarily related to $275 million in share repurchases, $19 million in cash dividends on common stock, and $46 million in net distributions to noncontrolling interest. Cash used for investing activities was $93 million, which includes $107 million of capital expenditures and $10 million of proceeds from the April 30, 2022 sale of Alcoa’s entire ownership interest in the Mineração Rio do Norte (MRN) bauxite mine.

  • Working capital: The Company reported 43 days working capital, a sequential improvement of six days. Inventory days improved by four days with higher shipments in the second quarter. The decrease in accounts receivable of three days reflects the lower metal pricing late in the quarter. The accounts payable balance increased sequentially but reduced on a days basis by one day with higher sales in the second quarter.

Strategic actions:

  • Returns to stockholders: In the first half of 2022, the Company returned $387 million of capital to stockholders through $37 million in cash dividends and $350 million in share repurchases. In July 2022, the Company announced an additional $500 million share repurchase program; $150 million remained available for share repurchases at the end of the second quarter from a prior authorization.

  • Revolving credit facility: On June 29, the Company announced that it successfully amended and restated its revolving credit facility (the "Facility") from $1.5 billion to $1.25 billion and extended the maturity date from November 2023 to June 2027. The Facility, which has not been drawn, includes terms that provide improved flexibility to execute on Alcoa's long-term strategies. Among other improvements, the Facility removes prior restrictions on both share repurchases and the payment of dividends. It released the prior collateral package, based on the Company maintaining specific credit ratings. Reaffirming the Company's commitment to its strategic priority to Advance Sustainably, the Facility now includes metrics on greenhouse gas intensity in the Alumina and Aluminum segments and the percentage of renewable energy consumption for smelters in the Aluminum segment.

  • San Ciprián alumina refinery: In July, the refinery reduced its daily production rate to help offset some of the financial impact from rising natural gas prices in Spain. The refinery has experienced a significant increase in natural gas costs, climbing from approximately $45 per ton of alumina produced in early 2021 to more than $215 per ton in the second quarter 2022. The refinery, which has an annual capacity of 1.5 million metric tons per year, has reduced up to 15 percent of its capacity, moving to average production of approximately 4,000 metric tons per day.

  • Aluminum updates: On July 1, the Company announced that one of its three operating potlines at the Warrick smelter in Indiana was curtailed due to operational challenges, which stem from workforce shortages in the region.

    Separately, the planned restart of the full smelting capacity at the Alumar smelter in São Luís, Brazil is now scheduled to be complete in the first quarter of 2023. The smelter is owned by Alcoa and South32 Limited. Alcoa owns 268,000 metric tons of the site’s 447,000 metric tons of capacity, and the Company announced in September 2021 that it would restart its share of the capacity.

    The Company announced in June that it has started a project to increase the Mosjoen, Norway site’s nameplate capacity by 14,000 metric tons per year (mtpy). The work on improved electrical infrastructure, which will boost efficiency and output, is expected to increase the Norway site’s capacity to 214,000 mtpy by the end of 2026.

    Alcoa announced in July that its Deschambault smelter in Quebec, Canada will be adding additional casting capability to produce standard ingots, supplementing the site’s larger T-bar ingots. It is being developed to support customer needs for foundry alloys, which are used in a variety of automotive applications.

2022 Outlook

The Company expects total Aluminum segment shipments to remain unchanged from the prior forecast, ranging between 2.5 and 2.6 million metric tons in 2022.

In Alumina, the Company has decreased its 2022 projection for shipments to range between 13.6 and 13.8 million metric tons, a reduction of 0.6 million metric tons from the prior forecast primarily due to the lower shipments in the first half of 2022.

In Bauxite, the Company has decreased its 2022 projection for annual bauxite shipments to range between 44.0 and 45.0 million dry metric tons, a change of 2 million dry metric tons from the prior projection due to continuing disruptions in the Atlantic bauxite market and lower demand from refineries in the first half of 2022.

For the third quarter of 2022, Alcoa expects higher sequential profitability in the Bauxite segment with increased shipments, as refinery demand improves in the third quarter. In Alumina and Aluminum, shipments are expected to increase but will not fully offset higher costs for energy and raw materials.

The Company anticipates an approximately $20 million negative impact to net income in the third quarter as a result of the Warrick line curtailment. The decrease in production volume at the San Ciprián refinery reduces the impact of the continuing rise in natural gas prices but is not expected to improve net income significantly on a sequential basis.

Based on current alumina and aluminum market conditions, the Company expects third quarter tax expense to approximate $100 million to $110 million, which may vary with market conditions and jurisdictional profitability.

Conference Call

Alcoa will hold its quarterly conference call at 5:00 p.m. Eastern Daylight Time (EDT) on Wednesday, July 20, 2022, to present second quarter 2022 financial results and discuss the business, developments, and market conditions.

The call will be webcast via the Company’s homepage on www.alcoa.com. Presentation materials for the call will be available for viewing on the same website at approximately 4:15 p.m. EDT on July 20, 2022. Call information and related details are available under the “Investors” section of www.alcoa.com.

About Alcoa Corporation

Alcoa (NYSE: AA) is a global industry leader in bauxite, alumina and aluminum products with a vision to reinvent the aluminum industry for a sustainable future. Our purpose is to turn raw potential into real progress, underpinned by Alcoa Values that encompass integrity, operating excellence, care for people and courageous leadership. Since developing the process that made aluminum an affordable and vital part of modern life, our talented Alcoans have developed breakthrough innovations and best practices that have led to improved safety, sustainability, efficiency, and stronger communities wherever we operate.

Discover more by visiting www.alcoa.com. Follow us on our social media channels: Facebook, Instagram, Twitter, YouTube and LinkedIn.

The Company does not incorporate the information contained on, or accessible through, such websites into this press release.

Dissemination of Company Information

Alcoa intends to make future announcements regarding company developments and financial performance through its website, www.alcoa.com, as well as through press releases, filings with the Securities and Exchange Commission, conference calls and webcasts.

Forward-Looking Statements

This news release contains statements that relate to future events and expectations and as such constitute forward-looking statements within the meaning of the Private Securities Litigation Reform Act of 1995. Forward-looking statements include those containing such words as “aims,” “ambition,” “anticipates,” “believes,” “could,” “develop,” “endeavors,” “estimates,” “expects,” “forecasts,” “goal,” “intends,” “may,” “outlook,” “potential,” “plans,” “projects,” “reach,” “seeks,” “sees,” “should,” “strive,” “targets,” “will,” “working,” “would,” or other words of similar meaning. All statements by Alcoa Corporation that reflect expectations, assumptions or projections about the future, other than statements of historical fact, are forward-looking statements, including, without limitation, forecasts concerning global demand growth for bauxite, alumina, and aluminum, and supply/demand balances; statements, projections or forecasts of future or targeted financial results, or operating or sustainability performance (including our ability to execute on strategies related to environmental, social and governance matters); statements about strategies, outlook, and business and financial prospects; and statements about capital allocation and return of capital. These statements reflect beliefs and assumptions that are based on Alcoa Corporation’s perception of historical trends, current conditions, and expected future developments, as well as other factors that management believes are appropriate in the circumstances. Forward-looking statements are not guarantees of future performance and are subject to known and unknown risks, uncertainties, and changes in circumstances that are difficult to predict. Although Alcoa Corporation believes that the expectations reflected in any forward-looking statements are based on reasonable assumptions, it can give no assurance that these expectations will be attained and it is possible that actual results may differ materially from those indicated by these forward-looking statements due to a variety of risks and uncertainties. Such risks and uncertainties include, but are not limited to: (a) current and potential future impacts to the global economy and our industry, business and financial condition caused by various worldwide or macroeconomic events, such as the COVID-19 pandemic and the ongoing conflict between Russia and Ukraine, and related regulatory developments; (b) material adverse changes in aluminum industry conditions, including global supply and demand conditions and fluctuations in London Metal Exchange-based prices and premiums, as applicable, for primary aluminum and other products, and fluctuations in indexed-based and spot prices for alumina; (c) changes in global economic and financial market conditions generally, such as inflation and interest rate increases, and which may also affect Alcoa Corporation’s ability to obtain credit or financing upon acceptable terms or at all; (d) unfavorable changes in the markets served by Alcoa Corporation; (e) the impact of changes in foreign currency exchange and tax rates on costs and results; (f) increases in energy or raw material costs, or uncertainty of or disruption to energy or raw materials supply, and to the supply chain including logistics; (g) the inability to execute on strategies related to or achieve improvement in profitability and margins, cost savings, cash generation, revenue growth, fiscal discipline, environmental- and social-related goals and targets (including due to delays in scientific and technological developments), or strengthening of competitiveness and operations anticipated from portfolio actions, operational and productivity improvements, technology advancements, and other initiatives; (h) the inability to realize expected benefits, in each case as planned and by targeted completion dates, from acquisitions, divestitures, restructuring activities, facility closures, curtailments, restarts, expansions, or joint ventures; (i) political, economic, trade, legal, public health and safety, and regulatory risks in the countries in which Alcoa Corporation operates or sells products; (j) labor disputes and/or work stoppages and strikes; (k) the outcome of contingencies, including legal and tax proceedings, government or regulatory investigations, and environmental remediation; (l) the impact of cyberattacks and potential information technology or data security breaches; (m) risks associated with long-term debt obligations; (n) the timing and amount of future cash dividends and share repurchases; (o) declines in the discount rates used to measure pension and other postretirement benefit liabilities or lower-than-expected investment returns on pension assets, or unfavorable changes in laws or regulations that govern pension plan funding; and, (p) the other risk factors discussed in Part I Item 1A of Alcoa Corporation’s Annual Report on Form 10-K for the fiscal year ended December 31, 2021, the Quarterly Report on Form 10-Q for the quarter ended March 31, 2022, and other reports filed by Alcoa Corporation with the U.S. Securities and Exchange Commission. Alcoa Corporation disclaims any obligation to update publicly any forward-looking statements, whether in response to new information, future events or otherwise, except as required by applicable law. Market projections are subject to the risks described above and other risks in the market.

Non-GAAP Financial Measures

Some of the information included in this release is derived from Alcoa Corporation’s consolidated financial information but is not presented in Alcoa Corporation’s financial statements prepared in accordance with accounting principles generally accepted in the United States of America (GAAP). Certain of these data are considered “non-GAAP financial measures” under SEC regulations. Alcoa Corporation believes that the presentation of non-GAAP financial measures is useful to investors because such measures provide both additional information about the operating performance of Alcoa Corporation and insight on the ability of Alcoa Corporation to meet its financial obligations by adjusting the most directly comparable GAAP financial measure for the impact of, among others, “special items” as defined by the Company, non-cash items in nature, and/or nonoperating expense or income items. The presentation of non-GAAP financial measures is not intended to be a substitute for, and should not be considered in isolation from, the financial measures reported in accordance with GAAP. Reconciliations to the most directly comparable GAAP financial measures and management’s rationale for the use of the non-GAAP financial measures can be found in the schedules to this release.

Alcoa Corporation and subsidiaries

Statement of Consolidated Operations (unaudited)

(dollars in millions, except per-share amounts)


Quarter Ended


June 30,

2022

March 31,

2022

June 30,

2021

Sales

$

3,644


$

3,293


$

2,833


Cost of goods sold (exclusive of expenses below)


2,767


2,181


2,156


Selling, general administrative, and other expenses


52


44


54


Research and development expenses


7


9


6


Provision for depreciation, depletion, and amortization


161


160


161


Restructuring and other charges, net


(75

)


125


33


Interest expense


30


25


67


Other income, net


(206

)


(14

)


(105

)

Total costs and expenses


2,736


2,530


2,372


Income before income taxes


908


763


461


Provision for income taxes


234


210


111


Net income


674


553


350


Less: Net income attributable to noncontrolling interest


125


84


41


NET INCOME ATTRIBUTABLE TO ALCOA CORPORATION

$

549


$

469


$

309


EARNINGS PER SHARE ATTRIBUTABLE TO ALCOA CORPORATION COMMON SHAREHOLDERS:


Basic:


Net income

$

3.01


$

2.54


$

1.66


Average number of shares


182,499,574


184,550,123


186,705,311


Diluted:


Net income

$

2.95


$

2.49


$

1.63


Average number of shares


186,068,663


188,536,773


190,195,453


Alcoa Corporation and subsidiaries

Statement of Consolidated Operations (unaudited)

(dollars in millions, except per-share amounts)


Six Months Ended


June 30,

2022

June 30,

2021

Sales

$

6,937


$

5,703


Cost of goods sold (exclusive of expenses below)


4,948


4,448


Selling, general administrative, and other expenses


96


106


Research and development expenses


16


13


Provision for depreciation, depletion, and amortization


321


343


Restructuring and other charges, net


50


40


Interest expense


55


109


Other income, net


(220

)


(129

)

Total costs and expenses


5,266


4,930


Income before income taxes


1,671


773


Provision for income taxes


444


204


Net income


1,227


569


Less: Net income attributable to noncontrolling interest


209


85


NET INCOME ATTRIBUTABLE TO ALCOA CORPORATION

$

1,018


$

484


EARNINGS PER SHARE ATTRIBUTABLE TO ALCOA CORPORATION COMMON SHAREHOLDERS:


Basic:


Net income

$

5.55


$

2.60


Average number of shares


183,489,221


186,473,781


Diluted:


Net income

$

5.44


$

2.56


Average number of shares


187,282,228


189,497,440


Common stock outstanding at the end of the period


179,921,896


186,855,060


Alcoa Corporation and subsidiaries

Consolidated Balance Sheet (unaudited)

(in millions)


June 30,

2022

December 31,

2021

ASSETS


Current assets:


Cash and cash equivalents

$

1,638


$

1,814


Receivables from customers


898


757


Other receivables


124


127


Inventories


2,556


1,956


Fair value of derivative instruments


224


14


Prepaid expenses and other current assets(1)


423


358


Total current assets


5,863


5,026


Properties, plants, and equipment


19,647


19,753


Less: accumulated depreciation, depletion, and amortization


13,190


13,130


Properties, plants, and equipment, net


6,457


6,623


Investments


1,238


1,199


Deferred income taxes


445


506


Fair value of derivative instruments


15


7


Other noncurrent assets(2)


1,691


1,664


Total assets

$

15,709


$

15,025


LIABILITIES


Current liabilities:


Accounts payable, trade

$

1,752


$

1,674


Accrued compensation and retirement costs


341


383


Taxes, including income taxes


343


374


Fair value of derivative instruments


232


274


Other current liabilities


567


517


Long-term debt due within one year


1


1


Total current liabilities


3,236


3,223


Long-term debt, less amount due within one year


1,725


1,726


Accrued pension benefits


369


417


Accrued other postretirement benefits


626


650


Asset retirement obligations


634


622


Environmental remediation


254


265


Fair value of derivative instruments


867


1,048


Noncurrent income taxes


204


191


Other noncurrent liabilities and deferred credits


502


599


Total liabilities


8,417


8,741


EQUITY


Alcoa Corporation shareholders’ equity:


Common stock


2


2


Additional capital


9,313


9,577


Retained earnings (deficit)


606


(315

)

Accumulated other comprehensive loss


(4,255

)


(4,592

)

Total Alcoa Corporation shareholders’ equity


5,666


4,672


Noncontrolling interest


1,626


1,612


Total equity


7,292


6,284


Total liabilities and equity

$

15,709


$

15,025


(1)

This line item includes $42 and $4 of restricted cash at June 30, 2022 and December 31, 2021, respectively.

(2)

This line item includes $68 and $106 of noncurrent restricted cash at June 30, 2022 and December 31, 2021, respectively.


Contacts

Investor Contact:
James Dwyer
+1 412 992 5450
This email address is being protected from spambots. You need JavaScript enabled to view it.

Media Contact:
Jim Beck
+1 412 315 2909
This email address is being protected from spambots. You need JavaScript enabled to view it.


Read full story here

  • Schneider Electric awarded five recognitions at the Greek Energy Mastering Awards, including Energy Efficient Solution of the Year
  • The latest SF6-free solution, SM AirSeT, powered by pure air, enables industries and utilities to reduce environmental impact and optimize maintenance and operations
  • The availability and reliable performance of these long-awaited clean technologies make the EU’s recently revised F-gas regulation timely and achievable

MISSISSAUGA, Ontario--(BUSINESS WIRE)--Schneider Electric, the leader in the digital transformation of energy management and automation, has been recognized at the Greek Energy Mastering Awards 2022 with the award for Energy Efficient Solution of the Year.


The Greek Energy Mastering Awards 2022 recognizes best practices in responsible use of energy as it strives towards a sustainable energy future. Winners are chosen based on their ability to mobilize customers to continuously improve their energy and environmental performance, including increasing energy efficiency and reducing operating costs.

Energy Efficient Solution of the Year was awarded to Schneider Electric for the successful solutions and partnerships developed by the company in order to achieve the most effective energy management and improve the energy efficiency of the infrastructure of cities (Smart Cities).

In the category ‘Energy Efficient & Saving Products, Technologies, and Services’ Schneider Electric won distinction for its medium voltage, SF6-free switchgear SM AirSeT. The award was due to its contribution to the reduction of operating costs of consumers and ability to support a sustainable environment. The green and digital MV switchgear operates with the new SF6-free MV technology that uses pure air and vacuum innovation to eliminate the need for the most potent greenhouse gas in the electricity grid and electrical networks in buildings.

Schneider Electric continues its mission to help organizations achieve net-zero through innovative, green products. SM AirSeT is the green and digital secondary AIS MV equipment designed especially for commercial and industrial buildings and critical infrastructure. The technology has been successfully piloted at numerous electric utilities, across infrastructure and buildings, by customers such as E.ON in Sweden, GreenAlp in France, EEC Engie in New Caledonia and Azienda Trasporti Milanesi in Italy.

Delivering on the promise of building a full portfolio of SF6-free offers, SM AirSeT belongs to Schneider’s range of SF6-free MV switchgear, which also includes RM AirSeT – a secondary gas-insulated (GIS) Ring Main Unit (RMU) for grid operators; and GM AirSeT – a primary GIS for more demanding applications.

Schneider’s success at the Greek Energy Mastering Awards highlights that the availability and reliable high-performance of these long-awaited clean technologies make the EU’s current F-gas policy revision effort timely and achievable. If adopted in the future, a revised European policy restricting the use of SF6 would represent a key milestone in the sprint to successfully address European climate goals as the window on a +1.5°C future rapidly closes. SM AirSeT is proven ready for that opportunity.

About Schneider Electric

Schneider’s purpose is to empower all to make the most of our energy and resources, bridging progress and sustainability for all. We call this Life Is On.

Our mission is to be your digital partner for Sustainability and Efficiency.

We drive digital transformation by integrating world-leading process and energy technologies, end-point to cloud connecting products, controls, software and services, across the entire lifecycle, enabling integrated company management, for homes, buildings, data centers, infrastructure and industries.

We are the most local of global companies. We are advocates of open standards and partnership ecosystems that are passionate about our shared Meaningful Purpose, Inclusive and Empowered values.

https://www.se.com/ca/en/

Discover Life Is On Follow us on: Twitter | Facebook | LinkedIn | YouTube | Instagram | Blog

Discover the newest perspectives shaping sustainability, electricity 4.0, and next generation automation on Schneider Electric Insights

Related resources:

Hashtags: #PressRelease #SF6free #InnovationIsInTheAir


Contacts

Media Relations - Edelman on behalf of Schneider Electric, Juan Pablo Guerrero, Phone: +1 416 875 7173, Email: This email address is being protected from spambots. You need JavaScript enabled to view it.

ORANGE, Conn.--(BUSINESS WIRE)--Today AVANGRID, Inc. (NYSE:AGR) announced that its Board of Directors declared a quarterly dividend of $0.44 per share on its Common Stock. This dividend is payable October 3, 2022 to shareholders of record at the close of business on September 2, 2022.


About AVANGRID: AVANGRID, Inc. (NYSE: AGR) aspires to be the leading sustainable energy company in the United States. Headquartered in Orange, CT with approximately $40 billion in assets and operations in 24 U.S. states, AVANGRID has two primary lines of business: Avangrid Networks and Avangrid Renewables. Avangrid Networks owns and operates eight electric and natural gas utilities, serving more than 3.3 million customers in New York and New England. Avangrid Renewables owns and operates a portfolio of renewable energy generation facilities across the United States. AVANGRID employs approximately 7,000 people and has been recognized by JUST Capital in 2021 and 2022 as one of the JUST 100 companies – a ranking of America’s best corporate citizens. In 2022, AVANGRID ranked second within the utility sector for its commitment to the environment and the communities it serves. The company supports the U.N.’s Sustainable Development Goals and was named among the World’s Most Ethical Companies in 2022 for the fourth consecutive year by the Ethisphere Institute. For more information, visit www.avangrid.com.


Contacts

Investor :
Alvaro Ortega
This email address is being protected from spambots. You need JavaScript enabled to view it.
207.629.7412

Offshore Source Logo

Offshore Source keeps you updated with relevant information concerning the Offshore Energy Sector.

Any views or opinions represented on this website belong solely to the author and do not represent those of the people, institutions or organizations that Offshore Source or collaborators may or may not have been associated with in a professional or personal capacity, unless explicitly stated.

Corporate Offices

Technology Systems Corporation
8502 SW Kansas Ave
Stuart, FL 34997

info@tscpublishing.com