Business Wire News

DUBLIN--(BUSINESS WIRE)--The "Tire Recycling Downstream Products Market Intelligence Report - Global Forecast to 2027" report has been added to ResearchAndMarkets.com's offering.


The Global Tire Recycling Downstream Products Market is projected to reach USD 5,582.14 million by 2027 from USD 4,539.27 million in 2021, at a CAGR of 3.50% during the forecast period.

In this report, the years 2019 and 2020 are considered as historical years, 2021 as the base year, 2022 as the estimated year, and years from 2023 to 2027 are considered as the forecast period.

The report on tire recycling downstream products identifies key attributes about the customer to define the potential market and identify different needs across the industry.

Understanding the potential customer group's economies and geographies can help gain business acumen for better strategic decision-making. This market coverage across different industry verticals reveals the hidden truth about the players' strategies in different verticals and helps the organization decide target audience.

This report gives you the composite view of sub-markets coupled with comprehensive industry coverage and provides you with the right way of accounting factors such as norms & regulations, culture, to make right coverage strategy for your market plan.

Key Findings

  • The Americas Tire Recycling Downstream Products Market size was estimated at USD 1,140.10 million in 2021, is expected to reach USD 1,180.06 million in 2022, and is projected to grow at a CAGR of 3.56% to reach USD 1,406.71 million by 2027.
  • The Asia-Pacific Tire Recycling Downstream Products Market size was estimated at USD 1,690.15 million in 2021, is expected to reach USD 1,756.85 million in 2022, and is projected to grow at a CAGR of 3.70% to reach USD 2,102.88 million by 2027.
  • The Europe, Middle East & Africa Tire Recycling Downstream Products Market size was estimated at USD 1,709.01 million in 2021, is expected to reach USD 1,753.50 million in 2022, and is projected to grow at a CAGR of 3.26% to reach USD 2,072.55 million by 2027.

Company Usability Profiles:

  • Bridgestone Corporation
  • Cabot Corporation
  • Continental AG
  • Emanuel Tire, LLC
  • Genan Holding A/S
  • Georgia Tire Recovery
  • Himadri Chemicals & Industries Ltd.
  • L & S Tire Company
  • Liberty Tire Recycling
  • Michelin Group
  • OCI Company Ltd.
  • Orion Engineered Carbons S.A.
  • Phillips Carbon Black Limited
  • Pyrum Innovations AG
  • Ralson Goodluck Carbon Pvt. Ltd.
  • Renelux Group
  • Robert Weibold GmbH
  • Tire Disposal & Recycling Inc.
  • Triveni Turbines
  • Tyre Recycling Solutions SA
  • Vitol SA
  • Wuxi ShredWell Recycling Technology Co., Ltd

Market Segmentation & Coverage:

Recycling Technique:

  • Pyrolysis
  • Shredding

Product:

  • Rubber Mulch
  • Rubber Powder
  • Tire-derived Aggregates
  • Tire-derived Fuel

End-User:

  • Cement Manufacturing
  • Construction & Infrastructure
  • Electric Utility Boilers
  • Pulp & Paper Mills
  • Sports Complexes & Playgrounds
  • Tires & Rubber

Region:

  • Americas
    • Argentina
    • Brazil
    • Canada
    • Mexico
    • United States
      • Arizona
      • California
      • Colorado
      • Georgia
      • Massachusetts
      • New Jersey
      • New Mexico
      • North Carolina
      • Virginia
      • Washington
  • Asia-Pacific
    • Australia
    • China
    • India
    • Indonesia
    • Japan
    • Malaysia
    • Philippines
    • Singapore
    • South Korea
    • Taiwan
    • Thailand
  • Europe, Middle East & Africa
    • France
    • Germany
    • Italy
    • Netherlands
    • Qatar
    • Russia
    • Saudi Arabia
    • South Africa
    • Spain
    • United Arab Emirates
    • United Kingdom

For more information about this report visit https://www.researchandmarkets.com/r/bd07wx


Contacts

ResearchAndMarkets.com
Laura Wood, Senior Press Manager
This email address is being protected from spambots. You need JavaScript enabled to view it.
For E.S.T Office Hours Call 1-917-300-0470
For U.S./CAN Toll Free Call 1-800-526-8630
For GMT Office Hours Call +353-1-416-8900

Sycuan has partnered with PowerFlex to install 45 Electric Vehicle (EV) charging stations and a Battery Energy Storage System (BESS)

SAN DIEGO--(BUSINESS WIRE)--Sycuan Casino Resort today announced the addition of low-carbon technologies at its iconic casino location in San Diego. The project includes 40 Level 2 chargers, 5 DC fast chargers (DCFC), and a 250 kilowatt (kW)/560 kilowatt-hour (kWh) battery energy storage system (BESS) in progress. This project supports California’s goals of achieving five million zero-emission vehicles on the road by 2030 and 250,000 electric vehicle charging stations by 2025. Additionally, a project of this size is estimated to deliver approximately 490,000 electric miles, which is equivalent to saving 22,000 gallons of gas each year and thereby avoiding 431,000 pounds of greenhouse gas emissions annually.


This project is just another step the organization has taken in an effort to support a sustainable future. In 2008, Sycuan formed a volunteer group of dedicated team members called The Sycuan Green Team, that leads the charge to educate and promote their mission to reduce, reuse and recycle. Over the years, The Sycuan Green Team has hosted Earth Day events, organized E-Waste collection drives and partnered with local nonprofit I Love a Clean San Diego for several cleanup events throughout the San Diego community. Additionally, Sycuan actively works with a recycling company to divert as much of its waste stream as possible to reduce the impact on the environment.

To complete this project, Sycuan partnered with PowerFlex, a national provider of intelligent onsite clean energy solutions. The EV chargers are integrated into a network that utilizes PowerFlex’s patented Adaptive Load Management (ALM) technology—software that dynamically balances the total system load by controlling the output of individual chargers in real-time to mitigate peak energy spikes. By utilizing ALM, the project can accommodate a greater number of chargers than could otherwise be supported by the existing utility infrastructure. Through this project, Sycuan is helping achieve California’s rapid transition to electric vehicles without overtaxing the grid.

The BESS and EV charging stations are managed and co-optimized by PowerFlex X, software and hardware that provides real-time insights and intelligent control over the onsite energy systems. By integrating the battery energy storage system with the DCFCs, Sycuan can avoid high demand charges from the surge in electricity consumption that fast chargers bring. The BESS can further reduce costs and carbon emissions by powering the chargers with cheaper energy stored in the battery instead of expensive on-peak grid power.

“We are very excited to partner with PowerFlex to provide our guests with additional EV charging options at our casino resort,” said Rob Cinelli, general manager at Sycuan Casino Resort. “As we continue to see more and more people adopt this technology, it was important for us to stay ahead of the curve and provide this free amenity for our guests and team members. We remain committed in finding ways to help reduce our environmental impact and in the future, we have plans to install additional charging stations enterprise-wide.”

“We applaud Sycuan’s continued efforts towards sustainability,” said Steve Morris, Executive Director at I Love A Clean San Diego. “Sycuan’s community support extends beyond their facilities, mobilizing volunteers at cleanup events across the region and by sponsoring this year’s Coastal Cleanup Day.”

“We are proud to work with Sycuan to equip their historic location with technology to make their operations more sustainable,” said Raphael Declercq, CEO of PowerFlex. “The unique ability of our software to co-optimize storage and EV charging will help sustain California’s growing EV charging demand and increase Sycuan’s onsite energy resiliency. They are taking an important step to support the state’s air quality and climate change targets.”

About Sycuan Casino Resort:

Sycuan Casino Resort began as a humble Bingo Palace in 1983. Now more than 38 years later, it has become a community landmark and one of San Diego’s premier casino and resort destinations. Sycuan’s newly expanded AAA Four Diamond-rated property includes a 12-story hotel tower with over 300 guest rooms and 57 luxury suites. Guests can enjoy a wide range of onsite amenities including a variety of restaurants and bars from fast-casual to fine dining, meeting and event space, a full-service spa, fitness center and a state-of-the-art outdoor pool deck with two pools, a lazy river and swim-up bar. Sycuan also boasts an expansive casino floor with more than 2,300 slot machines and 54 table games in a variety of gaming options. Sycuan is open 24 hours a day, seven days a week. For more information, please visit www.sycuan.com, Facebook: @sycuancasinoresort, Instagram: @sycuan_casinoresort, Twitter: @sycuancasino and LinkedIn: company/sycuancasinoresort or call 619-445-6002.

About PowerFlex:

PowerFlex, an EDF Renewables company, is a leading national provider of intelligent onsite energy solutions that support carbon-free electrification and transportation. The Company delivers integrated solar, storage, EV charging, and microgrid systems to businesses and organizations. As a single full-service provider, PowerFlex customizes clean technology solutions to help clients achieve their energy and sustainability goals. Through the comprehensive PowerFlex X platform, PowerFlex leverages patented smart software to control, monitor, and optimize a client's distributed energy resources to reduce cost and maximize return on investment. For more information, visit www.powerflex.com. Connect with us on LinkedIn, YouTube, and Twitter.


Contacts

Media Contact:
Stephanie Lacsa
Sycuan Casino Resort
619-445-6002 x1130
This email address is being protected from spambots. You need JavaScript enabled to view it.

Emily Lau
PowerFlex
This email address is being protected from spambots. You need JavaScript enabled to view it.

ITASCA, Ill.--(BUSINESS WIRE)--SEKO Logistics (SEKO), a leading global logistics provider, launched the latest version of SEKO Live to ensure seamless installations and reduce the risk of returns through instant ‘one touch’ communications with off-site product experts. This launch delivers their client’s specialist, technical and customer service support straight to the doors of consumers who are buying big and bulky items.


Home deliveries of goods such as recreational and exercise equipment, furniture, and white goods are at an all-time high, but a sale is only complete once the customer is completely happy to take delivery of the product they have purchased. In the US alone, returns cost retailers over $760 billion annually in lost sales and add significantly to their carbon footprint, often because their customers can’t get timely information or product assistance to finalize a delivery and installation.

With SEKO Live, it removes this revenue and reputational risk for retailers. It gives SEKO’s last mile delivery specialists and consumers quick and direct access to product technicians and exception management specialists located within SEKO’s own Control Tower operations and network operations centers or to a retailers’ own product and customer service teams. Web or app-based and configurable to each retailer’s requirements, including a retailer branded interface, SEKO Live enables customers to instantly share, stream and connect with central resources during product installation or self-installation to quickly resolve questions or concerns raised by the end-user.

“In most cases, home deliveries of big and bulky items are completed exactly as planned, but if a customer has questions or uncertainties about their purchase, the time window to save the sale and prevent a return can be literally minutes,” said James Gagne, SEKO’s President & CEO. “SEKO Live is a scalable, low-cost solution that maximizes the customer experience and minimizes lost sales by connecting customers with the real-time expert advice and customer service support they need. This not only protects the sale, but it also avoids the risk of damaging reviews that could negatively impact sales.”

For consumers with quality or technical questions about products, SEKO Live’s one-touch B2C solution offers fast, technical advice and takes decision-making away from in-field staff, enabling a retailer’s central management to be in control to maintain the customer experience and avoid aborted transactions.

“SEKO Live finds solutions faster by taking a collaborative approach. It takes a retailer’s technical product knowledge and business prowess out to a customer in the field but through SEKO’s own last mile delivery experts,” said Mike Powell, SEKO’s Chief Technology Officer. “One-touch calls are pre-routed, so customers never get held up in a queue and bypass any automated customer service steps or chatbots. They quickly receive the answers they need, such as how to fit pedals to the exercise bike they’ve purchased. This is the right-first-time response consumers want. Statistics show that 96% of customers will leave if they experience poor customer service and 80.2% of online shoppers will return an item if they believe it is damaged or broken. SEKO Live enables retailers and consumers to resolve issues while the product is still at the delivery address.”

SEKO Live is activated by simply pressing on the embedded link or button, instantly connecting customers to the right support. Its innovative features include:

  • Conversations are livestreamed and supported with two-way messenger communications using the Pro Text Translate Tool to convert each party’s text into their home language.
  • Users can instantly livestream to provide visibility to central management, wherever they’re located.
  • The streaming service allows multiple users to accept calls, connecting customers with technical, installation, warranty and after-sales support to quickly escalate and resolve any delivery issues.
  • High quality video streaming, photos and audio guarantees clear and precise communication, and can be stored for quality, auditing and warranty purposes.
  • Key call data such as time, date, location, user, operator, duration, chat, video and photos are recorded, as well as custom data tags to help with customer service analysis - all of which can be exported via API or file transfer, showing full visibility of the order journey.

“Last mile is more than just delivery. It’s the communication ahead of the delivery, the actual physical appointment and the delivery of items inside the home, plus everything post-delivery. SEKO Logistics supports every phase of the user journey - from customer experience to delivery and installation, protecting the sale and driving customer lifetime value. SEKO Live is for retailers that want their customers to feel heard and appreciated,” said Powell.

SEKO Live is available to retailers through a simple installation, with full integration and user training achievable within 7-10 days.

To learn more about SEKO Logistics, visit: sekologistics.com.

About SEKO Logistics

Built on nearly 50 years of logistics expertise, SEKO Logistics is the no-nonsense global end-to-end logistics partner – from shipper to consumer. SEKO delivers client-first service, expert reliability and tech-driven shipping solutions that turn customers’ supply chains into a competitive advantage. With over 150 offices in more than 40 countries, SEKO helps you move at the speed of commerce. Learn more at sekologistics.com.


Contacts

Haley Hartmann
This email address is being protected from spambots. You need JavaScript enabled to view it.
815-382-1415

Second quarter fiscal 2023 revenue of $108 million exceeds top-end of quarterly guidance; ChargePoint re-affirms annual guidance 

  • Revenue grew 93% year-over-year as the Company posted its first $100 million quarter
  • GAAP and Non-GAAP gross margin improved 2 percentage points quarter-over-quarter
  • ChargePoint guides to third quarter fiscal 2023 revenue of $125-$135 million and confirms full-year revenue guidance of $450 million to $500 million

CAMPBELL, Calif.--(BUSINESS WIRE)--ChargePoint Holdings, Inc. (NYSE:CHPT) (“ChargePoint”), a leading electric vehicle (EV) charging network, today reported results for its second quarter of fiscal 2023 ended July 31, 2022.


“ChargePoint delivered another strong quarter, with continued growth across all verticals and geographies,” said Pasquale Romano, President and CEO of ChargePoint. “We continue to execute on our strategy, as demand continues to grow for our portfolio of industry-leading charging solutions for every vertical and in both North America and Europe.”

Second Quarter Fiscal 2023 Financial Overview

  • Revenue. For the second quarter, revenue was $108.3 million, up 93% from $56.1 million in the prior year’s same quarter. Networked charging systems revenue for the second quarter was $84.1 million, up 106% from $40.9 million in the prior year’s same quarter and subscription revenue was $20.2 million, up 68% from $12.1 million in the prior year’s same quarter.
  • Gross Margin. Second quarter GAAP gross margin was 17%, down from 19% in the prior year's same quarter primarily due to supply chain disruptions, which affected both cost and supply availability as well as increasing new product introduction and transition costs. Second quarter non-GAAP gross margin, which primarily excludes stock-based compensation expense and amortization from acquired intangible assets, improved sequentially to 19%, but was down from 23% in the prior year's same quarter due to the same factors.
  • Net Income/Loss. Second quarter GAAP net loss was $92.7 million, as compared to $84.9 million in the prior year's same quarter. Non-GAAP pre-tax net loss in the second quarter, which excludes $26.4 million in stock-based compensation expense, $3.0 million amortization expense from acquired intangible assets and other items, was $62.3 million as compared to $40.3 million in the prior year's same quarter.
  • Liquidity. As of July 31, 2022, cash and short term investments on the balance sheet were $471.9 million.
  • Shares Outstanding. As of July 31, 2022, there were approximately 339 million shares of common stock outstanding.

For a reconciliation of GAAP to non-GAAP results, please see the tables below.

Third Quarter and Full Year Guidance

For the third fiscal quarter ending October 31, 2022, ChargePoint expects revenue of $125 million to $135 million. At the midpoint, this represents an anticipated increase of 100% as compared to the prior year’s same quarter.

For the full fiscal year ending January 31, 2023, ChargePoint continues to expect:

  • Revenue of $450 million to $500 million. At the midpoint, this represents an anticipated increase of 96% as compared to the prior year
  • Non-GAAP gross margin of 22% to 26%
  • Non-GAAP operating expenses of $350 million to $370 million. At the midpoint, this represents an anticipated increase of 50% as compared to the prior year

Guidance for non-GAAP financial measures excludes amortization expense of acquired intangible assets, stock-based compensation expense, acquisition earn-out-related payroll tax expense, and non-recurring costs and professional services fees related to acquisitions and security offerings. ChargePoint is not able to present a reconciliation of its non-GAAP financial guidance to the corresponding GAAP measures because certain items that impact these measures are uncertain or out of its control, or cannot be reasonably predicted, including stock-based compensation expense, without unreasonable effort. The actual amounts of such reconciling items will have a significant impact on ChargePoint's GAAP gross margin and GAAP operating expenses.

Conference Call Information

ChargePoint will host a webcast today at 1:30 p.m. Pacific / 4:30 p.m. Eastern to review its second quarter fiscal 2023 financial results and its outlook for the third quarter of and full year fiscal 2023.

Investors may access the webcast, supplemental financial information and investor presentation at ChargePoint’s investor relations website (investors.chargepoint.com) under the “Events and Presentations” section. A replay will be available three hours after the conclusion of the webcast and archived for one year.

About ChargePoint

ChargePoint is creating a new fueling network to move people and goods on electricity. Since 2007, ChargePoint has been committed to making it easy for businesses and drivers to go electric with one of the largest EV charging networks and a comprehensive portfolio of charging solutions. The ChargePoint cloud subscription platform and software-defined charging hardware are designed to include options for every charging scenario from home and multifamily to workplace, parking, hospitality, retail and transport fleets of all types. Today, one ChargePoint account provides access to hundreds-of-thousands of places to charge in North America and Europe. To date, more than 123 million charging sessions have been delivered, with drivers plugging into the ChargePoint network on average every second. For more information, visit the ChargePoint pressroom, the ChargePoint Investor Relations site, or contact the ChargePoint North American or European press offices or This email address is being protected from spambots. You need JavaScript enabled to view it..

Forward-Looking Statements

This press release contains forward-looking statements that involve risks, uncertainties, and assumptions including statements regarding our financial outlook for the third fiscal quarter and fiscal year ending January 31, 2023. There are a significant number of factors that could cause actual results to differ materially from the statements made in this press release, including: the impact of the ongoing COVID-19 pandemic, geopolitical events including the Russian invasion of Ukraine, macroeconomic trends including changes in inflation or interest rates, or other events beyond our control on the overall economy, our business and those of our customers and suppliers, including due to supply chain disruptions, component shortages and expense increases; our limited operating history as a public company; our ability as an organization to successfully acquire and integrate other companies, products or technologies in a successful manner; our dependence on widespread acceptance and adoption of EVs and increased installation of charging stations; our current dependence on sales of charging stations for most of our revenues; overall demand for EV charging and the potential for reduced demand for EVs if governmental rebates, tax credits and other financial incentives are reduced, modified or eliminated or governmental mandates to increase the use of EVs or decrease the use of vehicles powered by fossil fuels, either directly or indirectly through mandated limits on carbon emissions, are reduced, modified or eliminated; supply chain interruptions, delays and expense increases may adversely affect our sales, revenue and gross margins; unexpected delays in new product introductions; our ability to expand our operations and market share in Europe; the need to attract additional fleet operators as customers; potential adverse effects on our revenue and gross margins due to supply chain disruptions, component shortages and related expense increases or if customers increasingly claim clean energy credits and, as a result, they are no longer available to be claimed by us; the effects of competition; risks related to our dependence on our intellectual property; and the risk that our technology could have undetected defects or errors. Additional risks and uncertainties that could affect our financial results are included under the captions “Risk Factors” and “Management’s Discussion and Analysis of Financial Condition and Results of Operations” in our Form 10-Q filed with the Securities and Exchange Commission (the “SEC”) on June 7, 2022, which is available on our website at investors.chargepoint.com and on the SEC’s website at www.sec.gov. Additional information will also be set forth in other filings that we make with the SEC from time to time. All forward-looking statements in this press release are based on information available to us as of the date hereof, and we do not assume any obligation to update the forward-looking statements provided to reflect events that occur or circumstances that exist after the date on which they were made, except as required by applicable law.

Use of Non-GAAP Financial Measures

ChargePoint has provided in this press release financial information that has not been prepared in accordance with generally accepted accounting principles in the United States (“GAAP”). ChargePoint uses these non-GAAP financial measures internally in analyzing its financial results and believes that the use of these non-GAAP financial measures is useful to investors to evaluate ongoing operating results and trends, and in comparing ChargePoint’s financial results with other companies in its industry as well other technology companies, many of which present similar non-GAAP financial measures.

The presentation of these non-GAAP financial measures is not meant to be considered in isolation or as a substitute for comparable GAAP financial measures and should be read only in conjunction with ChargePoint’s consolidated financial statements prepared in accordance with GAAP. A reconciliation of ChargePoint’s historical non-GAAP financial measures to their most directly comparable GAAP measures has been provided in the financial statement tables included in this press release, and investors are encouraged to review these reconciliations.

Non-GAAP Gross Profit (Gross Margin). ChargePoint defines non-GAAP gross profit as gross profit excluding amortization expense of acquired intangible assets and stock-based compensation expense. Non-GAAP gross margin is non-GAAP gross profit as a percentage of revenue.

Non-GAAP Cost of Revenue and Operating Expenses (includes Non-GAAP research and development, Non-GAAP sales and marketing and Non-GAAP general and administrative). ChargePoint defines Non-GAAP cost of revenue and operating expenses as cost of revenue and operating expenses excluding amortization expense of acquired intangible assets, stock-based compensation expense, earn-out-related payroll tax expense, and non-recurring costs and professional services fees associated with acquisitions and registration filings, and non-cash charges related to tax liabilities.

Non-GAAP Net Loss. ChargePoint defines non-GAAP net loss as net income (loss) excluding amortization expense of acquired intangible assets, stock-based compensation expense and the associated stock-based payroll tax expense, earn-out-related payroll tax expense, offering costs allocated to warrant liabilities, non-recurring costs and professional services fees associated with acquisitions and registration filings, and non-cash charges related to the revaluation of warrants, tax liabilities, earn-out liabilities, and other financial instruments. These amounts do not reflect the impact of any related tax effects. Non-GAAP pre-tax net loss is non-GAAP net loss adjusted for provision for income taxes.

Investors are cautioned that there are a number of limitations associated with the use of non-GAAP financial measures to analyze financial results and trends. In particular, many of the adjustments to ChargePoint’s GAAP financial measures reflect the exclusion of items that are recurring and will be reflected in its financial results for the foreseeable future, such as stock-based compensation, which is an important part of ChargePoint’s employees’ compensation and impacts hiring, retention and performance. Furthermore, these non-GAAP financial measures are not based on any standardized methodology prescribed by GAAP, and the components that ChargePoint excludes in its calculation of non-GAAP financial measures may differ from the components that other companies exclude when they report their non-GAAP results. ChargePoint compensates for these limitations by providing specific information regarding the GAAP amounts excluded from these non-GAAP financial measures. In the future, ChargePoint may also exclude other expenses it determines do not reflect the performance of ChargePoint’s operating results.

CHPT-IR

ChargePoint Holdings, Inc.

PRELIMINARY CONDENSED CONSOLIDATED STATEMENTS OF OPERATIONS

(In thousands, except per share amounts; unaudited)


Three Months Ended
July 31,


Six Months Ended
July 31,


2022


2021


2022


2021


Revenue


Networked charging systems

$

84,148


$

40,874


$

143,699


$

67,674


Subscriptions


20,244


12,082


37,890


22,906


Other


3,900


3,165


8,336


6,051


Total revenue


108,292


56,121


189,925


96,631


Cost of revenue


Networked charging systems


74,352


35,384


130,618


59,126


Subscriptions


13,278


7,830


23,905


13,470


Other


2,509


2,130


5,142


4,041


Total cost of revenue


90,139


45,344


159,665


76,637


Gross profit


18,153


10,777


30,260


19,994


Operating expenses


Research and development


51,804


40,410


100,105


65,784


Sales and marketing


33,873


21,923


66,460


37,897


General and administrative


22,846


22,732


43,893


37,199


Total operating expenses


108,523


85,065


210,458


140,880


Loss from operations


(90,370

)


(74,288

)


(180,198

)


(120,886

)

Interest income


1,460


25


1,566


47


Interest expense


(2,928

)


(3,862

)


(1,499

)

Change in fair value of redeemable convertible preferred stock warrant liability


9,237


Change in fair value of assumed common stock warrant liabilities


(10,421

)


(24

)


33,340


Change in fair value of contingent earnout liability


84,420


Transaction costs expensed


(7,031

)

Other expense, net


(1,254

)


(189

)


(1,702

)


(174

)

Net loss before income taxes


(93,092

)


(84,873

)


(184,220

)


(2,546

)

Provision for income taxes


(392

)


65


(2,254

)


103


Net loss

$

(92,700

)


$

(84,938

)


$

(181,966

)


$

(2,649

)

Cumulative undeclared dividends on redeemable convertible preferred stock


(4,292

)

Deemed dividends attributable to vested option holders


(51,855

)

Deemed dividends attributable to common stock warrants holders


(110,635

)

Net loss attributable to common stockholders, basic

$

(92,700

)


$

(84,938

)


$

(181,966

)


$

(169,431

)

Gain attributable to earnout shares issued


(84,420

)

Change in fair value of dilutive warrants


(7,427

)


(53,540

)

Net loss attributable to common stockholders, diluted

$

(92,700

)


$

(92,365

)


$

(181,966

)


$

(307,391

)

Net loss per share - Basic

$

(0.28

)


$

(0.27

)


$

(0.54

)


$

(0.64

)

Net loss per share - Diluted

$

(0.28

)


$

(0.29

)


$

(0.54

)


$

(1.12

)

Weighted average shares outstanding - Basic


336,813,555


312,227,526


335,736,772


266,197,482


Weighted average shares outstanding - Diluted


336,813,555


313,602,100


335,736,772


275,577,000


ChargePoint Holdings, Inc.

PRELIMINARY CONDENSED CONSOLIDATED BALANCE SHEETS

(In thousands, unaudited)


July 31, 2022


January 31, 2022

Assets


Current assets:


Cash and cash equivalents

$

187,662


$

315,235


Restricted cash


400


400


Short-term investments


283,880


Accounts receivable, net


109,922


75,939


Inventories


53,420


35,879


Prepaid expenses and other current assets


44,902


36,603


Total current assets


680,186


464,056


Property and equipment, net


36,699


34,593


Intangible assets, net


94,482


107,209


Operating lease right-of-use assets


22,571


25,535


Goodwill


205,580


218,484


Other assets


6,512


6,020


Total assets

$

1,046,030


$

855,897


Liabilities and Stockholders' Equity


Current liabilities:


Accounts payable

$

45,145


$

27,576


Accrued and other current liabilities


110,096


84,328


Deferred revenue


83,529


77,142


Total current liabilities


238,770


189,046


Deferred revenue, noncurrent


84,052


69,666


Debt, noncurrent


294,334


Operating lease liabilities


22,727


25,370


Deferred tax liabilities


13,383


17,697


Other long-term liabilities


1,075


7,104


Total liabilities


654,341


308,883


Stockholders' equity (deficit):


Common stock


34


33


Additional paid-in capital


1,414,301


1,366,855


Accumulated other comprehensive loss


(29,025

)


(8,219

)

Accumulated deficit


(993,621

)


(811,655

)

Total stockholders' equity


391,689


547,014


Total liabilities and stockholders' equity

$

1,046,030


$

855,897


ChargePoint Holdings, Inc.

PRELIMINARY CONDENSED CONSOLIDATED STATEMENTS OF CASH FLOWS

(In thousands, unaudited)


Six Months Ended
July 31,


2022


2021


Cash flows from operating activities


Net loss

$

(181,966

)


$

(2,649

)

Adjustments to reconcile net loss to net cash used in operating activities:


Depreciation and amortization


12,476


5,576


Non-cash operating lease cost


2,451


1,963


Stock-based compensation


41,946


35,870


Amortization of deferred contract acquisition costs


1,118


829


Change in fair value of redeemable convertible preferred stock warrant liability


(9,237

)

Change in fair value of common stock warrant liabilities


24


(33,340

)

Change in fair value of contingent earnout liabilities


(84,420

)

Transaction costs expensed


7,031


Other


4,991


1,236


Changes in operating assets and liabilities, net of effect of acquisitions:


Accounts receivable, net


(36,178

)


(7,657

)

Inventories


(18,239

)


5,620


Prepaid expenses and other assets


(9,964

)


(9,325

)

Operating lease liabilities


(2,465

)


(953

)

Accounts payable


14,907


9,293


Accrued and other liabilities


16,454


3,027


Deferred revenue


20,773


15,938


Net cash used in operating activities


(133,672

)


(61,198

)

Cash flows from investing activities


Purchases of property and equipment


(8,872

)


(7,788

)

Purchases of short term investments


(284,835

)


Cash paid for acquisitions, net of cash acquired


(2,756

)


Net cash used in investing activities


(296,463

)


(7,788

)

Cash flows from financing activities


Proceeds from the exercise of public warrants


117,598


Merger and PIPE financing


511,646


Payments of transaction costs related to Merger


(32,468

)

Payment of tax withholding obligations on settlement of earnout shares


(20,894

)

Proceeds from issuance of debt securities, net of discount and issuance costs


293,972


Repayment of borrowings


(36,051

)

Proceeds from the issuance of common stock under employee equity plans, net of tax withholding


5,419


1,759


Change in driver funds and amounts due to customers


4,238


Net cash provided by financing activities


303,629


541,590


Effect of exchange rate changes on cash, cash equivalents, and restricted cash


(1,067

)


(6

)

Net increase in cash, cash equivalents, and restricted cash


(127,573

)


472,598


Cash, cash equivalents, and restricted cash at beginning of period


315,635


145,891


Cash, cash equivalents, and restricted cash at end of period

$

188,062


$

618,489


ChargePoint Holdings, Inc.

RECONCILIATION OF GAAP TO NON-GAAP FINANCIAL MEASURES

(In thousands, unaudited)


Three Months Ended
July 31, 2022


Three Months Ended
July 31, 2021


Six

Months Ended
July 31, 2022


Six

Months Ended
July 31, 2021

Cost of Revenue:


GAAP cost of revenue


$

90,139


$

45,344


$

159,665


$

76,637


Stock-based compensation expense


(1,341

)


(2,164

)


(2,126

)


(2,188

)


Amortization of intangible assets


(748

)


(1,368

)


Non-GAAP cost of revenue


$

88,050


$

43,180


$

156,171


$

74,449


Non-GAAP gross profit (gross margin as a percentage of revenue)


$

20,242


19

%


$

12,941


23

%


$

33,754


18

%


$

22,182


23

%


Operating Expenses:


GAAP research and development


$

51,804


$

40,410


$

100,105


$

65,784


Stock-based compensation expense


(11,420

)


(13,682

)


(17,398

)


(14,357

)


Earn-out-related taxes (1)


(12

)


(358

)


Acquisition-related costs (2)


(86

)


(86

)


Cost related to registration filings


(80

)


(80

)


Non-GAAP research and development (as a percentage of revenue)


$

40,384


37

%


$

26,550


47

%


$

82,707


44

%


$

50,902


53

%


GAAP sales and marketing


$

33,873


$

21,923


$

66,460


$

37,897


Stock-based compensation expense


(5,285

)


(4,169

)


(7,831

)


(4,766

)


Earn-out-related taxes (1)


(6

)


(424

)


Acquisition-related costs (2)


(43

)


(43

)


Cost related to registration filings


(40

)


(40

)


Amortization of intangible assets


(2,207

)


(4,448

)


Non-GAAP sales and marketing (as a percentage of revenue)


$

26,381


24

%


$

17,665


31

%


$

54,182


29

%


$

32,624


34

%


GAAP general and administrative


$

22,846


$

22,732


$

43,893


$

37,199


Stock-based compensation expense


(8,373

)


(8,278

)


(14,591

)


(14,558

)


Earn-out-related taxes (1)


(378

)


(713

)


Acquisition-related costs (2)


(2,683

)


(1,011

)


(2,683

)


Cost related to registration filings


(473

)


(2,503

)


(473

)


(2,503

)


Tax exposures


(990

)


(990

)


Non-GAAP general and administrative (as a percentage of revenue)


$

13,010


12

%


$

8,890


16

%


$

26,828


14

%


$

16,742


17

%


Non-GAAP Operating Expenses (as a percentage of revenue)


$

79,775


74

%


$

53,105


95

%


$

163,717


86

%


$

100,269


104

%


Net Loss:


GAAP net loss


$

(92,700

)


$

(84,938

)


$

(181,966

)


$

(2,649

)


Stock-based compensation expense


26,419


28,293


41,946


35,869


Earn-out-related taxes (1)


396


1,495


Acquisition-related costs (2)


2,812


1,011


2,812


Cost related to registration filings


473


2,623


473


2,623


Tax exposures


990


990


Amortization of intangible assets


2,955


5,816


Change in fair value of preferred stock warrant liability


(9,237

)


Change in fair value of assumed common stock warrant liability


10,421


24


(33,340

)


Change in fair value of contingent earn-out liability


(84,420

)


Offering costs allocated to warrant liabilities


7,031


Non-GAAP net loss (as a percentage of revenue)


$

(61,863

)


(57

) %


$

(40,393

)


(72

) %


$

(131,706

)


(69

) %


$

(79,816

)


(83

) %

Provision for income taxes


(392

)


65


(2,254

)


103


Non-GAAP pre-tax net loss (as a percentage of revenue)


$

(62,255

)


(57

) %


$

(40,328

)


(72

) %


$

(133,960

)


(71

) %


$

(79,714

)


(82

) %

(1)

Consists of employment taxes paid related to shares issued as part of the earnout.

(2)

Consists of professional services fees related to acquisitions.


Contacts

Investor Relations
Patrick Hamer
VP, Capital Markets and Investor Relations
This email address is being protected from spambots. You need JavaScript enabled to view it.

Press
AJ Gosselin
Director, Corporate Communications
This email address is being protected from spambots. You need JavaScript enabled to view it.


Read full story here

NEW YORK--(BUSINESS WIRE)--Hess Corporation (NYSE: HES) announced today that John Hess, Chief Executive Officer, will present at the Barclays CEO Energy-Power Conference in New York on September 8, 2022 at 8:00 a.m. Eastern Time.


A live audio webcast and a replay of the discussion will be accessible via Hess Corporation’s website.

Hess Corporation is a leading global independent energy company engaged in the exploration and production of crude oil and natural gas. More information on Hess Corporation is available at https://www.hess.com/.

Cautionary Statements

This presentation will contain projections and other forward-looking statements within the meaning of Section 27A of the Securities Act of 1933 and Section 21E of the Securities Exchange Act of 1934. These projections and statements reflect the company’s current views with respect to future events and financial performance. No assurances can be given, however, that these events will occur or that these projections will be achieved, and actual results could differ materially from those projected as a result of certain risk factors. A discussion of these risk factors is included in the company’s periodic reports filed with the Securities and Exchange Commission.


Contacts

Investor contact:
Jay Wilson
(212) 536-8940
This email address is being protected from spambots. You need JavaScript enabled to view it.

Media contact:
Lorrie Hecker
(212) 536-8250
This email address is being protected from spambots. You need JavaScript enabled to view it.

BETHESDA, Md.--(BUSINESS WIRE)--Enviva Inc. (NYSE: EVA) (“Enviva”) today announced that members of its management team will attend and meet with investors, in person, at the upcoming Barclays CEO Energy-Power Conference on Tuesday, September 6, 2022, in New York.

To view and download the presentation materials being used at this event, please visit ir.envivabiomass.com.

About Enviva

Enviva Inc. (NYSE: EVA) is the world’s largest producer of industrial wood pellets, a renewable and sustainable energy source produced by aggregating a natural resource, wood fiber, and processing it into a transportable form, wood pellets. Enviva owns and operates ten plants with a combined production capacity of approximately 6.2 million metric tons per year in Virginia, North Carolina, South Carolina, Georgia, Florida, and Mississippi, and is constructing its 11th plant, which will be located in Epes, Alabama. Enviva sells most of its wood pellets through long-term, take-or-pay off-take contracts with primarily creditworthy customers in the United Kingdom, the European Union, and Japan, helping to accelerate the energy transition and to decarbonize hard-to-abate sectors like steel, cement, lime, chemicals, and aviation fuels. Enviva exports its wood pellets to global markets through its deep-water marine terminals at the Port of Chesapeake, Virginia, the Port of Wilmington, North Carolina, and the Port of Pascagoula, Mississippi, and from third-party deep-water marine terminals in Savannah, Georgia, Mobile, Alabama, and Panama City, Florida.

To learn more about Enviva please visit our website at www.envivabiomass.com. Follow Enviva on social media @Enviva.


Contacts

Kate Walsh
Vice President, Investor Relations
+1 240-482-3856
This email address is being protected from spambots. You need JavaScript enabled to view it.

Simple Ways to Reduce Energy Use During Hours When Grid Demand Peaks

OAKLAND, Calif.--(BUSINESS WIRE)--It looks like tomorrow Thursday (September 1) will kick off a week of above normal temperatures throughout Northern and Central California.

As part of our ongoing series, Simple Ways to Save Energy, Pacific Gas and Electric Company (PG&E) is helping customers prepare for the incoming excessive heat wave by sharing ways to reduce energy bills and stay safe.

During the summer especially during times of prolonged extreme heat, the air conditioner can account for as much as half of residential energy usage. This is the time to take simple steps to improve efficiency, every small action can add up when it comes to reducing energy and helping ease the strain on the grid during crucial hours.

Energy Savings Tips

Here are easy ways to lower AC costs and still stay cool indoors during the prolonged heat.

  • Adjust thermostat to 78 degrees or higher, after cooling the home to below-normal levels in the morning. Turn it off when away from the home.

  • Replace filters monthly
    Dirty air filters make the air conditioner work harder to circulate the air. Clean and/or replace air filters monthly to improve energy efficiency and reduce costs.

  • Close shades in the afternoon
    Sunlight passing through windows heats the home and makes the air conditioner work harder. Customers can block this heat by keeping blinds or drapes closed on sunny days.

  • Avoid using the oven. Instead, cook on the stove, use a microwave or grill outside.

  • Enroll in PG&E’s new program, Power Saver Rewards. The free, voluntary program rewards participants for temporarily reducing energy use when demand is high. By conserving energy during Power Saver Rewards events coinciding with Flex Alerts customers earn $2 for each kilowatt-hour (kWh) of energy saved. It’s easy to enroll and get rewarded for reducing energy use.

PG&E funds the operation of existing county- or city-run cooling centers throughout the state. These centers help fill a critical need for those who might not have the financial means to cool and shelter themselves from very hot and prolonged temperatures.

To find a Cooling Center near you, call your local city or county government, or call PG&E’s toll-free Cooling Center locator line at 1-877-474-3266 or visit pge.com/coolingcenters.

Customers can also enroll in free programs including Bill Forecast Alerts, and Budget Billing to spread energy costs evenly throughout the year.

Additionally, eligible customers may be able to sign up for income-qualified programs offering a monthly discount including the California Alternative Rates for Energy (CARE) and the Family Electric Rate Assistance (FERA) Programs. Some customers may also qualify for the Energy Saving Assistance Program offering free improvements to make the home more efficient, safe and comfortable.

If the elevated heat leads to outages, PG&E has a plan to address any issues that come from the high temperatures and crews monitoring the situation are ready to respond.

PG&E’s plan includes closely monitoring grid conditions and having restoration and repair crews ready to immediately respond to potential heat-related outages. We encourage customers to be prepared, stay cool and hydrated and practice safety by developing an emergency plan and checking in on neighbors.

Outage safety tips

And here are ways for customers to stay safe if outages occur:

  • Have flashlights, radios, and fresh batteries ready. Use battery-operated flashlights, not candles, which pose a fire hazard.
  • Unplug or turn off all electric and heat-producing appliances (e.g., air conditioners, washers and dryers, ovens, stoves, irons) to avoid overloading circuits. Overloaded circuits can be a fire hazard once power is restored.
  • Leave a single lamp on to alert you when power returns.
  • Keep refrigerator and freezer doors closed, and place extra containers of ice inside to preserve food. A full freezer will remain colder longer.
  • Keep important numbers (e.g., hospital, fire department, police, friends, relatives) near the phone.

Although we do not anticipate initiating any Public Safety Power Shutoff events over the next seven days, being prepared remains important. For more tips on how to stay safe and save energy this summer, visit pge.com/summer.

About PG&E

Pacific Gas and Electric Company, a subsidiary of PG&E Corporation (NYSE:PCG), is a combined natural gas and electric utility serving more than 16 million people across 70,000 square miles in Northern and Central California. For more information, visit pge.com and pge.com/news.


Contacts

MEDIA RELATIONS:
415-973-5930

PORTLAND, Maine--(BUSINESS WIRE)--The following is a statement from AVANGRID:


This unanimous decision by the Law Court is a victory for clean energy expansion, transmission development, and decarbonization efforts in Maine, New England and across the country.

It is time to move away from the status quo fossil fuel companies who will undoubtedly continue their fight to maintain a stranglehold on the New England energy market. These companies have fought this clean energy project in every legal manner possible, filing challenge after challenge in a desperate effort to hold onto their share of the market. Maine’s highest court has rejected their latest challenge as unconstitutional. The NECEC is good for Maine, bringing hundreds of jobs and hundreds of millions of dollars of investment into the state at no cost to Maine. It will deliver lower energy prices in Maine and New England and help protect against the wild fluctuations in price that Mainers who are dependent on fossil fuels are now experiencing. The project will also help us meet our bold emission reduction goals by removing more than 3 million metric tons of carbon from our atmosphere, the equivalent of removing 700,000 cars from the road.

We are pleased with this outcome as we move Maine to a cleaner energy future.

About AVANGRID: AVANGRID, Inc. (NYSE: AGR) aspires to be the leading sustainable energy company in the United States. Headquartered in Orange, CT with approximately $40 billion in assets and operations in 24 U.S. states, AVANGRID has two primary lines of business: Avangrid Networks and Avangrid Renewables. Avangrid Networks owns and operates eight electric and natural gas utilities, serving more than 3.3 million customers in New York and New England. Avangrid Renewables owns and operates a portfolio of renewable energy generation facilities across the United States. AVANGRID employs more than 7,000 people and has been recognized by JUST Capital in 2021 and 2022 as one of the JUST 100 companies – a ranking of America’s best corporate citizens. In 2022, AVANGRID ranked second within the utility sector for its commitment to the environment and the communities it serves. The company supports the U.N.’s Sustainable Development Goals and was named among the World’s Most Ethical Companies in 2022 for the fourth consecutive year by the Ethisphere Institute. AVANGRID is a member of the group of companies controlled by Iberdrola, S.A. For more information, visit www.avangrid.com.

About Iberdrola: Iberdrola is one of the world's biggest energy companies and a leader in renewables, spearheading the energy transition to a low carbon economy. The group supplies energy to almost 100 million people in dozens of countries. With a focus on renewable energy, smart networks and smart solutions for customers, Iberdrola’s main markets include Europe (Spain, the United Kingdom, Portugal, France, Germany, Italy and Greece), the United States, Brazil, Mexico and Australia. The company is also present in growth markets such as Japan, Taiwan, Ireland, Sweden and Poland, among others.

With a workforce of nearly 40,000 and assets in excess of €141.7 billion, the company posted revenues of €39 billion and a net profit of over €3.9 billion in 2021. Across the world, Iberdrola helps to support 400,000 jobs across its supply chain, with annual procurement of €12.2 billion. A benchmark in the fight against climate change, Iberdrola has invested more than €130 billion over the past two decades to help build a sustainable energy model, based on sound environmental, social and governance (ESG) principles.


Contacts

MEDIA:
Sarah Warren
This email address is being protected from spambots. You need JavaScript enabled to view it.
585-794-9253

DUBLIN--(BUSINESS WIRE)--The "Global Solar Shading Systems Market (2022-2027) by Product, Geometry, Mechanism, Material, Geography, Competitive Analysis and the Impact of Covid-19 with Ansoff Analysis" report has been added to ResearchAndMarkets.com's offering.


The Global Solar Shading Systems Market is estimated to be USD 16.56 Bn in 2022 and is expected to reach USD 20.01 Bn by 2027, growing at a CAGR of 3.86%.

Market dynamics are forces that impact the prices and behaviors of the stakeholders. These forces create pricing signals which result from the changes in the supply and demand curves for a given product or service. Forces of Market Dynamics may be related to macro-economic and micro-economic factors.

There are dynamic market forces other than price, demand, and supply. Human emotions can also drive decisions, influence the market, and create price signals. As the market dynamics impact the supply and demand curves, decision-makers aim to determine the best way to use various financial tools to stem various strategies for speeding the growth and reducing the risks.

Competitive Quadrant

The report includes Competitive Quadrant, a proprietary tool to analyze and evaluate the position of companies based on their Industry Position score and Market Performance score. The tool uses various factors for categorizing the players into four categories. Some of these factors considered for analysis are financial performance over the last 3 years, growth strategies, innovation score, new product launches, investments, growth in market share, etc.

Ansoff Analysis

The report presents a detailed Ansoff matrix analysis for the Global Solar Shading Systems Market. Ansoff Matrix, also known as Product/Market Expansion Grid, is a strategic tool used to design strategies for the growth of the company. The matrix can be used to evaluate approaches in four strategies viz. Market Development, Market Penetration, Product Development and Diversification. The matrix is also used for risk analysis to understand the risk involved with each approach. The analyst analyses the Global Solar Shading Systems Market using the Ansoff Matrix to provide the best approaches a company can take to improve its market position. Based on the SWOT analysis conducted on the industry and industry players, the analyst has devised suitable strategies for market growth.

Why buy this report?

  • The report offers a comprehensive evaluation of the Global Solar Shading Systems Market. The report includes in-depth qualitative analysis, verifiable data from authentic sources, and projections about market size. The projections are calculated using proven research methodologies.
  • The report has been compiled through extensive primary and secondary research. The primary research is done through interviews, surveys, and observation of renowned personnel in the industry.
  • The report includes an in-depth market analysis using Porter's 5 forces model and the Ansoff Matrix. In addition, the impact of Covid-19 on the market is also featured in the report.
  • The report also includes the regulatory scenario in the industry, which will help you make a well-informed decision. The report discusses major regulatory bodies and major rules and regulations imposed on this sector across various geographies.
  • The report also contains the competitive analysis using Positioning Quadrants, the analyst's Proprietary competitive positioning tool.

Market Dynamics

Drivers

  • Increase in Spending On Home Remodeling and Retrofitting Activities
  • Expansion of Living Space and Protection from Sun
  • Need for Beautification of the Building
  • Developments in Fabric Material

Restraints

  • Unreliability in Harsh Weather Conditions
  • Expensive Pricing and Installation of Motorized Solar Shading System

Opportunities

  • Technological Innovations in Its Mechanism
  • Rise in Smart City Projects Worldwide and Promising Prospects of the Service Industry

Challenges

  • Weather Changes

Market Segmentation

The Global Solar Shading Systems Market is segmented based on Product, Geometry, Mechanism, Material, and Geography.

  • By Product, the market is classified into Blinds, Shades, Louvers, and Textiles.
  • By Geometry, the market is classified into Horizontal, Vertical, and Egg-Crate.
  • By Mechanism, the market is classified into Fixed, Manual, and Motorized.
  • By Material, the market is classified into Metal, Glass, Wood, and Others.
  • By Geography, the market is classified into Americas, Europe, Middle-East & Africa and Asia-Pacific.

Companies Mentioned

  • Coltgroup
  • Comhan Holland
  • Construction Specialties
  • Draper
  • Duco
  • Duco Ventilation
  • GLASSCON
  • Hunter Douglas
  • Insolroll
  • InSync Solar Shades
  • Kawneer
  • LINAK
  • Lutron
  • Skyco Shading Systems
  • Springs Window Fashions
  • SWFcontract
  • Thermosash
  • Unicel Architectural
  • WAREMA Renkhoff

For more information about this report visit https://www.researchandmarkets.com/r/8tore8


Contacts

ResearchAndMarkets.com
Laura Wood, Senior Press Manager
This email address is being protected from spambots. You need JavaScript enabled to view it.

For E.S.T Office Hours Call 1-917-300-0470
For U.S./CAN Toll Free Call 1-800-526-8630
For GMT Office Hours Call +353-1-416-8900

DALLAS--(BUSINESS WIRE)--Leeward Renewable Energy Operations, LLC (“LREO”) today announced that it has posted to its secure investor relations site key operating and financial results for the second quarter 2022, and that it will hold an investor conference call on September 9, 2022, at 10:00 a.m. CDT. Investors who hold LREO’s 4.250% Senior Notes due in 2029, prospective investors, broker-dealers, and securities analysts are welcome to access the investor call.


Details to access the investor call will be posted to LREO’s secure investor data site.

For information on how to access the site, visit https://www.leewardenergy.com/request-access/ or contact Investor Relations at This email address is being protected from spambots. You need JavaScript enabled to view it..

About Leeward Renewable Energy Operations, LLC

Leeward Renewable Energy (LRE) is a leading renewable energy company that owns and operates a portfolio of 24 renewable energy facilities across nine states totaling approximately 2,500 megawatts of generating capacity. LRE is actively developing and contracting new wind, solar, and energy storage projects in energy markets across the U.S., with 1.9 gigawatts contracted and 20 gigawatts under development and construction spanning over 100 projects. LRE is a portfolio company of OMERS Infrastructure, an investment arm of OMERS, one of Canada’s largest defined benefit pension plans with C$121 billion in net assets (as at December 31, 2021). For more information, visit www.leewardenergy.com.


Contacts

Kelly Kimberly
FGS Global
713.822.7538
This email address is being protected from spambots. You need JavaScript enabled to view it.

HOUSTON--(BUSINESS WIRE)--Enterprise Products Partners L.P. (NYSE: EPD) today announced that its 2021 Schedule K-3, reflecting items of international tax relevance, are available online. Unitholders may access the information at www.taxpackagesupport.com/enterprise.


A limited number of Enterprise investors, primarily foreign unitholders, those computing a foreign tax credit on their tax return and certain corporate and/or partnership unitholders, may need the detailed information disclosed on Schedule K-3 for their specific reporting requirements. To the extent Schedule K-3 is applicable to federal income tax return filing needs, unitholders are encouraged to review the information contained on this form and refer to the appropriate federal laws or consult with their tax advisor.

Enterprise is not planning to mail copies of the Schedule K-3 to investors. To receive an electronic copy of the Schedule K-3 via email, unitholders may call Tax Package Support toll-free at (800) 599-9985 weekdays between 8 a.m. and 5 p.m. CT.

Enterprise Products Partners L.P. is one of the largest publicly traded partnerships and a leading North American provider of midstream energy services to producers and consumers of natural gas, NGLs, crude oil, refined products and petrochemicals. Services include: natural gas gathering, treating, processing, transportation and storage; NGL transportation, fractionation, storage and marine terminals; crude oil gathering, transportation, storage and marine terminals; petrochemical and refined products production, transportation, storage, and marine terminals and related services; and a marine transportation business that operates on key U.S. inland and intracoastal waterway systems. The partnership’s assets include more than 50,000 miles of pipelines; over 260 million barrels of storage capacity for NGLs, crude oil, refined products and petrochemicals; and 14 billion cubic feet of natural gas storage capacity. Please visit www.enterpriseproducts.com for more information.


Contacts

Randy Burkhalter, Investor Relations, (713) 381-6812 or (866) 230-0745, This email address is being protected from spambots. You need JavaScript enabled to view it.
Rick Rainey, Media Relations (713) 381-3635, This email address is being protected from spambots. You need JavaScript enabled to view it.

Top solar developers account for over 125 GW of operational, under-construction, and awarded projects

AUSTIN, Texas--(BUSINESS WIRE)--#PV--Mercom Capital Group, a global clean energy communications, research, and consulting firm, released a new report announcing the 2021 top global large-scale solar PV developers covering the period from July 2020 to June 2021.


With 4.95 GW of operational projects, Italian-based Enel Green Power emerged as the leading solar PV developer worldwide by operational capacity, followed closely by India-based Adani Green Energy (4.91 GW), with France-based Engie (3.47 GW) ranking third.

In terms of under construction and awarded capacity, Canadian Solar was first among global developers with 22.2 GW, followed by Lightsource bp with 20.9 GW.

With a total capacity of 23.6 GW, Lightsource bp emerged as the top solar PV developer in the world based on operational, under construction, and awarded (contracted) projects, followed closely by Canadian Solar with 23.5 GW. Brookfield Renewables ranked third with 19.5 GW.

In developing this global report, a key criterion for qualification was developers with projects in at least two countries.

The top developers include several renewable energy arms of industrial and power conglomerates, subsidiaries of asset management companies, and pure-play renewable and solar companies. They hailed from all around the world, including the United Kingdom, Canada, the United States, India, Italy, Norway, France, and Germany.

The top 10 developers account for over 125 GW of operational, under-construction, and awarded (contracted) solar projects. For under-construction and awarded projects, the top large-scale solar developers accounted for almost 100 GW.

There were significant changes in the top 10 list compared to the previous year due to some large M&A deals in the industry, with gigawatt-scale portfolios changing hands. According to Mercom’s 2020 Solar Funding and M&A Report, about 40 GW of projects changed hands in calendar year 2020. During the reporting period of July 2020 to June 2021, over 64 GW of projects were acquired across the globe.

Of the top 10 global solar developers, the Asia-Pacific (APAC) region made up about 24% of developers' capacity; North America at about 18%; and Europe, the Middle East, and Africa (EMEA) at about 20%. Approximately 38% of projects were sited in Latin America.

A significant number of installations and under-construction projects by the top developers were in Latin America. Countries such as Brazil, Mexico, Chile, and Argentina have good solar resources, and are seeing declining prices, and favorable policies.

“Despite lockdowns, labor shortages, and supply chain issues associated with the COVID-19 pandemic, top solar developers overcame these challenges and continued to expand in mature and emerging markets at an unprecedented pace,” said Raj Prabhu, CEO of Mercom Capital Group.

The full report, 2021 Leading Global Large-Scale Solar PV Developers, is available here.

About Mercom Capital Group

Mercom Capital Group is a global communications, research, and consulting firm focused on clean energy. Mercom produces funding and market intelligence reports covering Solar and Battery Storage/Smart Grid/Efficiency. Mercom advises cleantech companies on new market entry, custom market intelligence, and strategic decision-making. https://www.mercomcapital.com.


Contacts

Wendy Prabhu
This email address is being protected from spambots. You need JavaScript enabled to view it.

Goats will clear grass and brush under power lines to support sustainable, reliable energy

CHICAGO--(BUSINESS WIRE)--Nearly a dozen of ComEd’s four-legged employees are celebrating their last week of summer by participating in a small boat goat parade along the Chicago River, before they head off to clear brush under hard-to-reach power lines in Matthiessen State Park in LaSalle County, Ill. Ten goats will spend today cruising the Chicago River, while increasing awareness around ComEd’s goat vegetation management program.


ComEd is excited to bring the goats back to Chicago this year to highlight one of the innovative and sustainable ways we help ensure families and businesses throughout northern Illinois have reliable power,” said Gil Quiniones, CEO at ComEd. “This event provides our hardworking goats with a much-needed celebration and fun opportunity to engage with the customers they serve.”

The goats will cruise down the river in five boats, with an additional boat carrying members of the ComEd team, between the City Winery Chicago Dock, Michigan Avenue Bridge and Wolf Point on Wednesday, Aug. 31, from 12 to 3 p.m.

This marks the second consecutive year of ComEd’s goats visiting the Chicago River. In July 2021, goats cruised along the Chicago River as they took a break from clearing vegetation in Pekin, Ill.

Each summer since 2019, over 200 goats have supported ComEd in clearing vegetation in places that are difficult to access. The goats play a critical role in helping ComEd avoid outages and service disruptions due to overgrown vegetation near power lines. Among its benefits, the program drives maximum efficiency of this work, cutting the cost and time by more than half, while also reducing safety risks for workers and air emissions from fuel-burning equipment.

To learn more about the goats, visit ComEd.com/Goats and check out ComEd’s Facebook, Twitter, and Instagram.

ComEd is a unit of Chicago-based Exelon Corporation (NASDAQ: EXC), a Fortune 200 energy company with approximately 10 million electricity and natural gas customers – the largest number of customers in the U.S. ComEd powers the lives of more than 4 million customers across northern Illinois, or 70 percent of the state’s population. For more information visit ComEd.com and connect with the company on Facebook, Twitter, Instagram and YouTube.


Contacts

ComEd Media Relations
312-394-3500

The partnership with Akaysha marks Powin's official entry into Australia’s Energy Market

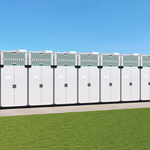
MELBOURNE, Australia & PORTLAND, Ore.--(BUSINESS WIRE)--Powin LLC (Powin) a global energy storage platform provider, and Akaysha Energy, a leading Australian battery storage developer announced today a partnership framework agreement where Powin is to deploy over 1.7GWh of energy storage systems over the next two years.


This partnership with Akaysha represents Powin’s entry into one of the largest and most sophisticated energy markets in the world. As Australia continues to decommission fossil fuel power plants and invest further in renewable power, energy storage is critical in maintaining grid reliability while keeping energy prices low.

With more than 3 GWh of energy storage capacity in its portfolio, Akaysha was recently acquired by a fund managed by BlackRock Real Assets’ Climate Infrastructure business. BlackRock Real Assets recently announced its intent to commit more than AU$1 billion (US$700 million) of capital to support Akaysha’s development of battery storage assets in Australia.

It is critical to have a diverse competitive landscape in the Australian ESS market. Powin’s vertically integrated and flexible business model reduces project cost and risk by having multiple trusted cell suppliers, proprietary software, and an in-house power plant controller,” said Akaysha Energy’s Managing Director, Nick Carter.

Akaysha partnered with Powin for the performance, reliability and safety capabilities of their Stack product line and StackOS control system. Utilizing their StackOS advanced power plant controller, Powin’s engineering team and Akaysha have been working closely for several months and are well advanced in the grid interconnection process including the Generator Performance Standard mandated by Australia's grid operator required to enter the market and interconnect generation to the Australian grid on initial projects.

This partnership is a key milestone as we expand our footprint globally and invest in new regions,” said Powin’s CEO, Geoff Brown. “Powin has spent the last decade developing our product in order to bring the benefits of clean and reliable electricity to the entire world. We are thrilled to partner with Akaysha Energy on this project due to their unrivaled knowledge of the Australian energy market and their team’s extensive track record of bringing jobs and critical infrastructure to help Australia meet their net zero targets.”

On July 12, 2022, the U.S. and Australia signed the Australia – United States Net-Zero Technology Acceleration Partnership to accelerate the development and deployment of zero-emissions technology that reduces greenhouse gas emissions and supercharges economic growth. The U.S. and Australia have a shared goal to reach net-zero carbon emissions by 2050. Both countries have recognized the integral role energy storage will play in reducing emissions by accelerating the adoption of renewables and improving grid reliability.

About Powin, LLC (Powin):
Powin is a global leader in the design and manufacture of safe and scalable energy storage solutions. Our innovative and cost-effective hardware and software are revolutionizing the way energy is generated, transmitted, and distributed, helping the world achieve decarbonization objectives. Powin has delivered over 2,500 MWh of BESS in over 8 different countries and has a contracted pipeline to supply over 10,000 MWh of energy storage systems globally over the next three years. To learn more, please visit www.powin.com.

About Akaysha Energy (Akaysha)
Akaysha Energy brings together market leading experience in energy markets, technology, development, asset management and capital markets for end-to-end development of Battery Energy Storage Systems (BESS) and renewables projects in Australia and across the APAC region. For additional information on Akaysha Energy, please visit www.akayshaenergy.com.au.


Contacts

Amy Silber
This email address is being protected from spambots. You need JavaScript enabled to view it.

This largest U.S. CTV order to date bolsters AWT’s fleet to support growth, service and lower emissions to support the U.S. offshore wind market

QUONSET POINT, R.I.--(BUSINESS WIRE)--Atlantic Wind Transfers (AWT), the first US offshore wind farm support company, has ordered six Crew Transfer Vessels (CTV) designed by UK-based based Chartwell Marine. AWT currently owns and operates two crew transfer vessels servicing the Block Island Wind Farm since 2016 and Coastal Virginia since December 2020.


AWT’s order comprises six CTVs to be constructed by St. John’s Ship Building Inc. at its shipyard in Palatka, Florida. The first two vessels are expected to be delivered in Summer 2023 and January 2024 respectively, with four further builds in the pipeline. The vessels will be the first US-built CTVs to be compliant with the US Environmental Protection Agency’s Tier 4 regulations, which rank among the most stringent emissions rules for marine engines in the world.

Through its continued partnership with Chartwell Marine, AWT demonstrates its commitment to the growth of the US offshore wind market. AWT’s seven years of operating experience in US offshore wind brings an impeccable safety track record while logging over 6,600 TP connections and 25,000 personnel transfers.

Charles A. Donadio Jr., Founder of AWT, said: “We’re pleased to strengthen our pioneering status in delivering another first for the US offshore wind sector with these new Tier IV vessel orders. Our goal is to build the most reliable, multi-purpose Jones-Act CTV fleet in the U.S., and provide our clients with cutting edge technology while lowering our carbon footprint and meeting all Jones Act and USCG Regulations. This investment will enable us to have crew transfer vessels available for charter to support the demand over the next several years.

“Our experience has proven our vessel model works for both the shipyard construction phase with on-time deliveries, and in-service uptime reliability for installation support and long-term O&M. Chartwell is our go-to when it comes to CTV designs which are operating in multiple international markets. We see our partnership with both Chartwell and St. John’s Ship Building as a key cornerstone in our strategy to build the capability and capacity of AWT to support the future growth of the offshore wind industry.”

Jeff Bukoski, President of the shipyard stated that “St. Johns Ship Building is excited to be working with Charlie Donadio and to be part of Atlantic Wind Transfers’ successful CTV operation and their extensive planned new vessel construction program. Working with highly experienced European naval architects such as Chartwell Marine, this effort further solidifies our position as a leading supplier of Jones Act compliant CTVs for the offshore wind industry. We know that our skilled workers also appreciate the additional opportunity to showcase their high-quality craftmanship.”

About Atlantic Wind Transfers:

Atlantic Wind Transfer’s corporate headquarters is located in Quonset Point, Rhode Island. AWT’s mission is to provide the most reliable purpose-built U.S. Jones-Act Compliant USCG Certified offshore wind service vessels for the U.S. market. AWT offers fully qualified trained crew along with an experienced marine management team that provides an efficient service within a safe environment, forming long-term partnerships that make offshore installations and O&M a reliable success.

Visit: https://www.atlanticwindtransfers.com to learn more.


Contacts

This email address is being protected from spambots. You need JavaScript enabled to view it.

KAWASAKI, Japan--(BUSINESS WIRE)--Toshiba Electronic Devices & Storage Corporation ("Toshiba") has expanded its lineup of smart gate driver photocouplers, the isolated gate driver with overcurrent protection for a power device, either a MOSFET or IGBT. The new device, “TLP5222,” a 2.5A output smart gate driver photocoupler, has a built-in automatic recovery function from protective operation. Shipments start today.


TLP5222 constantly monitors the drain-source voltage (VDS)[1] or collector-emitter voltage (VCE)[2] of the power device that it drives. Built-in overcurrent detection and a protective function detect any rise in VDS or VCE, the result of overcurrent generated in the power device, and gently turn it off.

The new photocoupler also has a built-in automatic recovery function that resets the product to normal operation 25.5μs (typ.) after protective operation is triggered. This simplifies sequence setting in the controller. It also incorporates an isolated FAULT status feedback function that transmits a fault signal to the controller when overcurrent is detected, and an active Miller clamp function that prevents upper and lower power devices from being short-circuited[3], helping to simplify design and reduce external circuits.

Housed in an SO16L package that ensures creepage and clearance distances of 8mm (min), TLP5222 can also be used in equipment requiring high insulation performance. In addition, with its wide rated operating temperature range of between -40°C and 110°C, it is suitable for various applications in harsh thermal environments such as photovoltaic power generation systems and uninterruptible power supplies (UPSs). 

The lineup also includes TLP5212, TLP5214A and TLP5214, which do not have a built-in automatic recovery function but reset to their normal operation by a signal input to their LED, allowing users to select the right products for use conditions.

Notes:
[1] For a power MOSFET
[2] For an IGBT
[3] A failure phenomenon where Miller current during switching generates noise or malfunction of the power device that turns on the upper or lower power devices.

Applications

  • MOSFET/IGBT gate drive
  • Industrial inverters and AC Servos
  • Inverters for renewable energy (Photovoltaic (PV) inverters, etc.)
  • Switching power supplies (UPS, etc.)

Features

  • Built-in automatic recovery function from protective operation
  • Peak output current rating: IOPH/IOPL=±2.5A
  • Built-in protection functions such as overcurrent detection, isolated fault status feedback, and active Miller clamp
  • An SO16L package that ensures creepage and clearance distances of 8mm (min)

Main Specifications

(Unless otherwise specified, @Ta=-40°C to 110°C)

Part number

TLP5222

Package

Name

SO16L

Size (mm)

10.3 x 10 (typ.)

t : 2.3 (max)

Absolute

maximum

ratings

Operating temperature Topr (°C)

-40 to 110

Peak output current IOPH/IOPL (A)

±2.5

Recommended operation conditions

Output side total supply voltage (VCC2−VEE) (V)

15 to 30

FAULT feedback IC supply voltage VCC1 (V)

2.7 to 5.5

Electrical characteristics

Supply current ICC2H, ICC2L max (mA)

5

Threshold input current (L/H) IFLH max (mA)

6.0

DESAT threshold voltage VDESAT typ. (V)

6.6

Switching characteristics

Propagation delay time tpHL, tpLH max (ns)

250

DESAT input mute time tDESAT(MUTE) typ. (μs)

25.5

Common-mode transient immunity

CMH, CML min (kV/μs)

@Ta=25°C, CF=Open

±25

@Ta=25°C, CF=1nF

±50

Isolation characteristics

Isolation voltage BVS min (Vrms)

@Ta=25°C

5000

Sample Check & Availability

Buy Online

Follow the link below for more on the new product.
TLP5222

Follow the link below for applications on Toshiba’s smart gate driver photocouplers.
Smart Gate Driver Photocoupler TLP5214A/TLP5214/TLP5212/TLP5222 Application Note -Introduction-
Smart Gate Driver Photocoupler TLP5214A/TLP5214/TLP5212/TLP5222 Application Note -Advanced edition-

Follow the link below for more on Toshiba’s isolators/solid state relays.
Isolators/Solid State Relays

To check availability of the new products at online distributors, visit:
TLP5222
Buy Online

* Company names, product names, and service names may be trademarks of their respective companies.
* Information in this document, including product prices and specifications, content of services and contact information, is current on the date of the announcement but is subject to change without prior notice.

About Toshiba Electronic Devices & Storage Corporation

Toshiba Electronic Devices & Storage Corporation, a leading supplier of advanced semiconductor and storage solutions, draws on over half a century of experience and innovation to offer customers and business partners outstanding discrete semiconductors, system LSIs and HDD products.
The company's 23,000 employees around the world share a determination to maximize product value, and promote close collaboration with customers in the co-creation of value and new markets. With annual sales now surpassing 850-billion yen (US$7.5 billion), Toshiba Electronic Devices & Storage Corporation looks forward to building and to contributing to a better future for people everywhere.
Find out more at https://toshiba.semicon-storage.com/ap-en/top.html


Contacts

Customer Inquiries:
Optoelectronic Device Sales & Marketing Dept.
Tel: +81-44-548-2218
Contact Us

Media Inquiries:
Chiaki Nagasawa
Digital Marketing Department
Toshiba Electronic Devices & Storage Corporation
Mail: This email address is being protected from spambots. You need JavaScript enabled to view it.

STOCKHOLM--(BUSINESS WIRE)--#LetsSolveWater--Annabelle M. Rayson from Canada receives the prestigious 2022 Stockholm Junior Water Prize for her research on how to treat and prevent harmful algae blooms. HRH Crown Princess Victoria of Sweden announced the winner during a ceremony at World Water Week in Stockholm.


Harmful algae blooms plague aquatic ecosystems around the world. They impact water quality and ecosystem diversity, cause dead zones, and cost the fishing and tourism industries millions of dollars.

Rayson’s father, a commercial fisherman, could no longer fish in certain areas due to harmful algae blooms, so she undertook research to find a method to treat and prevent them.

Rayson learned the concept of biomanipulation, and which species of zooplankton was best to treat and prevent algae blooms. For this, she was announced as winner of Stockholm Junior Water Prize, an international competition where students between the ages of 15 and 20 present solutions to major water challenges.

Speaking on winning the prize, Rayson said: “It’s an absolute honour to be here with so many other brilliant young people, representing all the small-town little girls out there, dreaming of her own microscope and lab coat. Hey girls, we can still make it.”

The Jury noted that “the winning entry has a potential solution for a multi-faceted global problem. It is not just an issue for human health, but it also affects water courses and the species that live within them. Of the challenges we face in terms of public health, many are intimately intertwined with water quality, and the winner – dedicated, passionate and creative – has conducted extensive, bio-inspired research to address this pervasive issue.”

The winner was presented with her prize during an award ceremony at World Water Week by HRH Crown Princess Victoria of Sweden, the Prize’s Official Patron.

The Diploma of Excellence was awarded to Laura Nedel Drebes and Camily Pereira dos Santos from Brazil, for addressing the issue of period poverty – the inaccessibility to sanitary pads – with their development of sustainable and affordable sanitary pads from industrial by-products.

The People’s Choice Award went to Mishal Faraz from United Arab Emirates, completing the all-female line-up of winners.

The Stockholm Junior Water Prize has been organized every year since 1997 by the Stockholm International Water Institute, SIWI, with Xylem as Founding Partner.

“All Stockholm Junior Water Prize participants show passion and ingenuity that is truly inspiring and an important contribution towards a better future and a more water-wise world. Stockholm Junior Water Prize is a wonderful opportunity to celebrate these contributions,” said Torgny Holmgren, Executive Director at Stockholm International Water Institute.

Patrick Decker, President and CEO of Xylem, added: “On behalf of more than 17,000 Xylem colleagues around the world, I applaud all Stockholm Junior Water Prize 2022 participants, bringing their passion and their innovation to solve the world’s major water challenges. These students inspire us by embodying what’s possible when innovators from around the world come together – with bold ideas and conviction – to solve water.”

For more information: www.siwi.org/prizes


Contacts

Andreas Karlsson
Press Manager
Stockholm International Water Institute
Email: This email address is being protected from spambots. You need JavaScript enabled to view it.
Mobile: +46 (0) 720 50 60 04

Complementary geographic coverage, technology and engineering capabilities will deliver leading performance and integration in a growing offshore market

HOUSTON--(BUSINESS WIRE)--Regulatory News:


Schlumberger, Aker Solutions and Subsea 7 today announced an agreement to form a joint venture to drive innovation and efficiency in subsea production by helping customers unlock reserves and reduce cycle time. The agreement will bring together a portfolio of innovative technologies such as subsea gas compression, all-electric subsea production systems and other electrification capabilities that help customers meet their decarbonization goals.

The proposed joint venture will combine Schlumberger’s and Aker Solutions’ subsea businesses, which include deep reservoir domain and engineering design expertise, an extensive field-proven subsea production and processing technology portfolio, world-class manufacturing scale and capabilities, and a comprehensive suite of life-of-field solutions for customers all over the world. Subsea 7 will be an equity partner in the new joint venture.

“As investment in the offshore market—particularly in deepwater—continues to increase, our customers will benefit from enhanced services that leverage digital and technological innovation to drive improved subsea asset performance while increasing energy efficiency and reducing CO2 emissions,” said Schlumberger Chief Executive Officer Olivier Le Peuch. “We look forward to collaborating with both Aker Solutions and our subsea integration partner Subsea 7 on this new venture.”

“Aker Solutions, Schlumberger and Subsea 7 are complementary businesses, both in terms of products and services, as well as customers and geographical presence. Furthermore, Schlumberger shares our commitment to innovation, such as deploying digital solutions and decarbonization technologies,” said Øyvind Eriksen, President and Chief Executive Officer of Aker ASA.

Upon closing of the proposed transaction, the existing Subsea Integration Alliance (SIA) between Schlumberger and Subsea 7, will be amended so that the new joint venture will assume Schlumberger’s role in the Alliance, which will be renewed for a ten-year term.

“We are excited to build on our highly successful alliance with Schlumberger and partnership with Aker Solutions. This new joint venture is a critical step as we collaborate on integrated subsea projects that drive maximum value for our customers,” said Subsea 7 Chief Executive Officer John Evans.

In addition to contributing its subsea business to the joint venture, at closing Schlumberger will issue to Aker Solutions shares of Schlumberger common stock valued at USD 306.5 million in a private placement. Concurrently, Subsea 7 will purchase its 10% interest in exchange for USD 306.5 million in cash to Aker Solutions. The joint venture also will issue a promissory note to Aker Solutions for USD 87.5 million. At closing of the joint venture, Schlumberger will own 70%, with Aker Solutions owning 20% and Subsea 7 owning 10%. The transaction is subject to regulatory approvals and other customary closing conditions and is expected to close in the second half of 2023.

More information on the proposed transaction is available on Schlumberger’s investor relations website, which can be accessed at https://investorcenter.slb.com/.

About Schlumberger

Schlumberger (SLB: NYSE) is a technology company that partners with customers to access energy. Our people, representing over 160 nationalities, are providing leading digital solutions and deploying innovative technologies to enable performance and sustainability for the global energy industry. With expertise in more than 120 countries, Schlumberger collaborates to create technology that unlocks access to energy for the benefit of all.

Find out more at www.slb.com.

About Aker Solutions

Aker Solutions delivers integrated solutions, products and services to the global energy industry. We enable low-carbon oil and gas production and develop renewable solutions to meet future energy needs. By combining innovative digital solutions and predictable project execution we accelerate the transition to sustainable energy production. Aker Solutions employs approximately 14,000 people in more than 20 countries.

Find out more at www.akersolutions.com.

About Subsea 7

Subsea 7 is a global leader in the delivery of offshore projects and services for the energy industry. Subsea 7 makes offshore energy transition possible through the continuous evolution of lower-carbon oil and gas and by enabling the growth of renewables and emerging energy.

Find out more at www.subsea7.com.

Cautionary Statement Regarding Forward-Looking Statements

This press release contains “forward-looking statements” within the meaning of Section 27A of the Securities Act of 1933, as amended, and Section 21E of the Securities Exchange Act of 1934, as amended. The opinions, forecasts and projections regarding the expected benefits of the proposed transaction; the expected timing of the completion of the transaction; the parties’ ability to complete the transaction considering the various regulatory approvals and other closing conditions; future opportunities for the joint venture and its products and services; and any other statements regarding the parties’ or the joint venture’s future expectations, beliefs, plans, objectives, financial conditions, assumptions or future events or performance, are forward-looking statements within the meaning of the federal securities laws. These statements are subject to, among other things, satisfaction of the closing conditions to the proposed transaction, the risk that the proposed transaction does not occur, negative effects from the pendency of the proposed transaction, the ability to realize expected benefits from the proposed transaction, the timing to consummate the proposed transaction, and (as to Schlumberger) other risk factors contained in Schlumberger’s most recent Forms 10-K and other filings with the SEC available at the SEC’s Internet site (http://www.sec.gov). Actual results may differ materially from those expected, estimated or projected. Forward-looking statements speak only as of the date they are made, and the parties undertake no obligation to publicly update or revise any of them in light of new information, future events or otherwise.


Contacts

Media
Josh Byerly – Vice President of Communications, Schlumberger
Moira Duff – Director of External Communication, Schlumberger
Tel: +1 (713) 375-3407
This email address is being protected from spambots. You need JavaScript enabled to view it.

Torbjorn Andersen – Vice President of External Communications, Aker Solutions
Tel: +47 928 85 542

Julie Taylor – Head of Group Communications, Subsea 7
Tel: +44 1224 526270
This email address is being protected from spambots. You need JavaScript enabled to view it.

Investors
Ndubuisi Maduemezia – Vice President of Investor Relations, Schlumberger
Joy V. Domingo – Director of Investor Relations, Schlumberger
Tel: +1 (713) 375-3535
This email address is being protected from spambots. You need JavaScript enabled to view it.

Fredrik Berge – Vice President of Investor Relations, Aker Solutions
Tel: +47 450 32 090
This email address is being protected from spambots. You need JavaScript enabled to view it.

Katherine Tonks – Investor Relations Director, Subsea 7
Tel: +44 20 8210 5568
This email address is being protected from spambots. You need JavaScript enabled to view it.

Scammers used mobile payment apps to bilk families and businesses out of nearly $25,000 in July 2022

CHICAGO--(BUSINESS WIRE)--When temperatures rise or fall to extremes, and electricity use increases, ComEd and the Better Business Bureau (BBB) have observed scammers taking advantage of these conditions to bilk customers out of their hard-earned money.

In July 2022, following a stretch of extreme heat during the first five weeks of summer, ComEd received nearly 280 reports of scams from customers, which is significantly higher than the 80 reports received in July 2021. In addition to the increase in reported incidents in July, the amount of money customers reportedly lost to successful scams rose dramatically to nearly $25,000. This compares to approximately $4,000 lost to scams in July 2021.

At ComEd, the safety and security of our customers is among our most-important goals. That is why we constantly monitor trends and share what we learn to help individuals identify unscrupulous activity,” said Melissa Washington, ComEd’s chief customer officer and senior vice president of customer operations. “ComEd will never call a customer and demand immediate payment – particularly with a cash card, cryptocurrency or mobile payment app.”

Based on reported incidents, scammers contact ComEd customers by phone, although some contacts can be made by text or email, demanding payment to a particular account under the threat of immediate service disconnection. The imposter will instruct the customer to use a mobile payment app, such as Cash App, QuickPay, Venmo or Zelle, which often have higher transaction limits than pre-paid cash cards. In some instances, the scammer will falsely claim not to have received a payment so the victim transfers money two or three times.

Our research shows scammers are more successful if they can scare victims or create a sense of urgency. Unfortunately, energy impostor scams have both of these traits,” said Steve J. Bernas, president and CEO of the Better Business Bureau serving Chicago and Northern Illinois. “The BBB hears from consumers and business owners who felt they need to act fast, or their power would be cut. Scammers will demand payment fast and, usually, tell their victims to send money in an unconventional form of payment. We always urge people to contact the company directly to verify the call is real. Also, to help protect the community, we ask anyone who has been approached by a scammer to please report them to the BBB Scamtracker, even if they didn't lose money.”

Tips to help identify scams

1. ComEd will never call or come to a customer’s home or business to:

  • Ask for direct payment with a prepaid cash card, cryptocurrency such as Bitcoin, or third-party payment app like Cash App, QuickPay, Venmo or Zelle.
  • Demand immediate payment.
  • Ask for a ComEd account number or other personal information, such as a Social Security number, driver’s license number or bank information.

2. To identify an actual ComEd employee or communication, remember:

  • All ComEd field employees wear a uniform with the ComEd logo and visibly display a company ID badge with the logo and employee’s name. ComEd recently changed its logo, so you may continue to see the former ComEd logo on uniforms, badges and vehicles until it is phased out.
  • Check the name on email or websites and make sure they match the name and address of the company you do business with. Look for misspellings or slight alterations.
  • Make a call to verify the suspected email or website is from a trusted source. Use a phone number from your personal business records or the company’s official website and not the number provided in the email.

ComEd urges anyone who believes they have been a target or victim of a scam to call ComEd at 1-800-EDISON1 (1-800-334-7661). To learn more visit ComEd.com/Scams.

Any customer experiencing a hardship or difficulty with their electric bill should call ComEd immediately at 1-800-334-7661 (1-800-EDISON1), Monday through Friday from 7 a.m. to 7 p.m. to determine which programs may be available to help with past-due balances. For more information, visit ComEd.com/PaymentAssistance.

ComEd is a unit of Chicago-based Exelon Corporation (NASDAQ: EXC), a Fortune 200 energy company with approximately 10 million electricity and natural gas customers – the largest number of customers in the U.S. ComEd powers the lives of more than 4 million customers across northern Illinois, or 70 percent of the state’s population. For more information visit ComEd.com and with the company on Facebook, Twitter, Instagram and YouTube.

BBB of Chicago and Northern Illinois is a nonprofit organization that has served both consumers and trustworthy businesses for over 95 years and is a part of the IABBB. We help protect consumers from scams and provide a free database for consumers to see business ratings and reviews to find businesses they can trust. We connect consumers with businesses they can trust. The International Association of Better Business Bureaus (IABBB) is the network hub for BBBs in the US, Canada and Mexico. Like BBBs, IABBB is dedicated to fostering honest and responsive relationships between businesses and consumers – instilling consumer confidence and advancing a trustworthy marketplace for all. Please visit BBB.org for more information.


Contacts

ComEd Media Relations
312-394-3500

Complementary geographic coverage, technology and engineering capabilities will deliver leading performance and integration in a growing offshore market

HOUSTON--(BUSINESS WIRE)--Schlumberger, Aker Solutions and Subsea 7 today announced an agreement to form a joint venture to drive innovation and efficiency in subsea production by helping customers unlock reserves and reduce cycle time. The agreement will bring together a portfolio of innovative technologies such as subsea gas compression, all-electric subsea production systems and other electrification capabilities that help customers meet their decarbonization goals.


The proposed joint venture will combine Schlumberger’s and Aker Solutions’ subsea businesses, which include deep reservoir domain and engineering design expertise, an extensive field-proven subsea production and processing technology portfolio, world-class manufacturing scale and capabilities, and a comprehensive suite of life-of-field solutions for customers all over the world. Subsea 7 will be an equity partner in the new joint venture.

“As investment in the offshore market—particularly in deepwater—continues to increase, our customers will benefit from enhanced services that leverage digital and technological innovation to drive improved subsea asset performance while increasing energy efficiency and reducing CO2 emissions,” said Schlumberger Chief Executive Officer Olivier Le Peuch. “We look forward to collaborating with both Aker Solutions and our subsea integration partner Subsea 7 on this new venture.”

“Aker Solutions, Schlumberger and Subsea 7 are complementary businesses, both in terms of products and services, as well as customers and geographical presence. Furthermore, Schlumberger shares our commitment to innovation, such as deploying digital solutions and decarbonization technologies,” said Øyvind Eriksen, President and Chief Executive Officer of Aker ASA.

Upon closing of the proposed transaction, the existing Subsea Integration Alliance (SIA) between Schlumberger and Subsea 7, will be amended so that the new joint venture will assume Schlumberger’s role in the Alliance, which will be renewed for a ten-year term.

“We are excited to build on our highly successful alliance with Schlumberger and partnership with Aker Solutions. This new joint venture is a critical step as we collaborate on integrated subsea projects that drive maximum value for our customers,” said Subsea 7 Chief Executive Officer John Evans.

In addition to contributing its subsea business to the joint venture, at closing Schlumberger will issue to Aker Solutions shares of Schlumberger common stock valued at USD 306.5 million in a private placement. Concurrently, Subsea 7 will purchase its 10% interest in exchange for USD 306.5 million in cash to Aker Solutions. The joint venture also will issue a promissory note to Aker Solutions for USD 87.5 million. At closing of the joint venture, Schlumberger will own 70%, with Aker Solutions owning 20% and Subsea 7 owning 10%. The transaction is subject to regulatory approvals and other customary closing conditions and is expected to close in the second half of 2023.

More information on the proposed transaction is available on Schlumberger’s investor relations website, which can be accessed at https://investorcenter.slb.com/.

About Schlumberger

Schlumberger (SLB: NYSE) is a technology company that partners with customers to access energy. Our people, representing over 160 nationalities, are providing leading digital solutions and deploying innovative technologies to enable performance and sustainability for the global energy industry. With expertise in more than 120 countries, Schlumberger collaborates to create technology that unlocks access to energy for the benefit of all.

Find out more at www.slb.com.

About Aker Solutions

Aker Solutions delivers integrated solutions, products and services to the global energy industry. We enable low-carbon oil and gas production and develop renewable solutions to meet future energy needs. By combining innovative digital solutions and predictable project execution we accelerate the transition to sustainable energy production. Aker Solutions employs approximately 14,000 people in more than 20 countries.

Find out more at www.akersolutions.com.

About Subsea 7

Subsea 7 is a global leader in the delivery of offshore projects and services for the energy industry. Subsea 7 makes offshore energy transition possible through the continuous evolution of lower-carbon oil and gas and by enabling the growth of renewables and emerging energy.

Find out more at www.subsea7.com.

Cautionary Statement Regarding Forward-Looking Statements

This press release contains “forward-looking statements” within the meaning of Section 27A of the Securities Act of 1933, as amended, and Section 21E of the Securities Exchange Act of 1934, as amended. The opinions, forecasts and projections regarding the expected benefits of the proposed transaction; the expected timing of the completion of the transaction; the parties’ ability to complete the transaction considering the various regulatory approvals and other closing conditions; future opportunities for the joint venture and its products and services; and any other statements regarding the parties’ or the joint venture’s future expectations, beliefs, plans, objectives, financial conditions, assumptions or future events or performance, are forward-looking statements within the meaning of the federal securities laws. These statements are subject to, among other things, satisfaction of the closing conditions to the proposed transaction, the risk that the proposed transaction does not occur, negative effects from the pendency of the proposed transaction, the ability to realize expected benefits from the proposed transaction, the timing to consummate the proposed transaction, and (as to Schlumberger) other risk factors contained in Schlumberger’s most recent Forms 10-K and other filings with the SEC available at the SEC’s Internet site (http://www.sec.gov). Actual results may differ materially from those expected, estimated or projected. Forward-looking statements speak only as of the date they are made, and the parties undertake no obligation to publicly update or revise any of them in light of new information, future events or otherwise.


Contacts

Media
Josh Byerly – Vice President of Communications, Schlumberger
Moira Duff – Director of External Communication, Schlumberger
Tel: +1 (713) 375-3407
This email address is being protected from spambots. You need JavaScript enabled to view it.

Torbjorn Andersen – Vice President of External Communications, Aker Solutions
Tel: +47 928 85 542

Julie Taylor – Head of Group Communications, Subsea 7
Tel: +44 1224 526270
This email address is being protected from spambots. You need JavaScript enabled to view it.

Investors
Ndubuisi Maduemezia – Vice President of Investor Relations, Schlumberger
Joy V. Domingo – Director of Investor Relations, Schlumberger
Tel: +1 (713) 375-3535
This email address is being protected from spambots. You need JavaScript enabled to view it.

Fredrik Berge – Vice President of Investor Relations, Aker Solutions
Tel: +47 450 32 090
This email address is being protected from spambots. You need JavaScript enabled to view it.

Katherine Tonks – Investor Relations Director, Subsea 7
Tel: +44 20 8210 5568
This email address is being protected from spambots. You need JavaScript enabled to view it.

Offshore Source Logo

Offshore Source keeps you updated with relevant information concerning the Offshore Energy Sector.

Any views or opinions represented on this website belong solely to the author and do not represent those of the people, institutions or organizations that Offshore Source or collaborators may or may not have been associated with in a professional or personal capacity, unless explicitly stated.

Corporate Offices

Technology Systems Corporation
8502 SW Kansas Ave
Stuart, FL 34997

info@tscpublishing.com