Business Wire News

Dr. Horne possesses more than 30 years of domestic and international experience managing the development and commercialization of advanced energy storage systems

Dr. Horne to accelerate Energy Vault’s development of complementary energy storage solutions to Energy Vault’s existing technologies portfolio

LUGANO, Switzerland & WESTLAKE VILLAGE, Calif.--(BUSINESS WIRE)--Energy Vault Holdings, Inc. (NYSE: NRGV) ("Energy Vault"), a leader in sustainable, grid-scale energy storage solutions, today announced the appointment of Craig Horne, Ph.D., as Vice President, Advanced Energy Storage Development. Dr. Horne will be based in Energy Vault’s U.S. headquarters in Westlake Village, Calif.


Dr. Horne began working with energy storage technologies more than 30 years ago and joins Energy Vault with deep domestic and international experience. Over multiple decades, Dr. Horne managed the development and commercialization of advanced energy storage systems, as well as materials, processes, and diagnostic methods for energy, electronics, and telecom applications.

In response to a fast-moving market requesting more sophisticated storage solutions, Dr. Horne will be responsible for the expansion of Energy Vault’s portfolio of energy storage solutions that complement the company's current offerings, supporting early-stage research at the company, and supporting commercial activities involving the current solution offerings.

“We are privileged to have Craig join as a leader of Energy Vault. Craig brings extensive experience to Energy Vault with a proven track record in leadership roles across a unique set of storage industry segments, including technology and product development, project integration and project execution,” said Marco Terruzzin, Chief Commercial and Product Officer, Energy Vault. “Dr. Horne will be responsible for driving new technologies and solutions to market that address customer demand for a wide range of storage requirements, while further enhancing our current portfolio.”

Dr. Horne’s appointment further demonstrates Energy Vault’s successful rapid execution of the Energy Vault Solutions (EVS) technology-neutral integration and software strategy, introduced in Q4 2021, to provide customers with the most flexible and cost-effective energy storage solutions regardless of the underlying storage and generation technology. EVS leverages the most advanced software architecture, cyber security protocols, and optimization algorithms to enable the secure integration and orchestration of multiple energy assets under a multitude of use cases.

As recently announced, Energy Vault through its EVS offering, signed three EPC contracts for a total of 495 MWh with Jupiter Power and Wellhead Electric. This includes a 100 MW (200 MWh) battery energy storage system in Fort Stockton, Texas to provide Fast Frequency Response and energy support to the ERCOT market, a 10 MW (20 MWh) system in Carpinteria, California for Resource Adequacy in the CAISO market as well as energy resiliency in a disaster-prone, transmission-vulnerable stretch of the Southern California coastline, and a 68.8 MW (275.2 MWh), in Stanton, California, to meet critical power needs for southern California.

“I am delighted to join the Energy Vault team and am especially excited to capitalize on my thirty years working with battery technologies, the last seven of which have been spent in the system integration, EPC, and owner/IPP sectors of the industry to bring additional breakthrough storage solutions to the market,” said Dr. Craig Horne, Vice President, Advanced Energy Storage Development, Energy Vault. “It recently became clear to me just how drastic the limitations are related to how far incumbent lithium-ion based solutions can go in satisfying the accelerating demand for energy storage. With the shift to intermittent renewable energy assets, the power sector needs a diverse set of economically competitive energy storage technologies for long-duration applications. In addition, the competition for Li-ion batteries from the transportation sector has increased prices and squeezed supply. These market forces have created an unprecedented opportunity to accelerate the development of alternative energy storage technologies for stationary energy applications. I believe Energy Vault’s strategy to create multiple solutions that satisfy the wide range of requirements across the spectrum of storage projects is best positioned to capitalize on this opportunity and enable a renewable world.”

Immediately prior to joining Energy Vault, Dr. Horne served as Managing Director of Energy Storage at Wellhead Electric Corporation, a leading developer and operator of innovative energy generation and energy storage facilities. Prior to his role at Wellhead Electric Corporation, Dr. Horne held senior leadership energy storage roles with Swinerton Renewable Energy, RES Group and EnerVault, which he co-founded and served as Chairman, CEO and Chief Strategy Officer. Dr. Horne also served six years on the Board of the Energy Storage Association (now American Clean Power), including Chairman from 2018-2019, and two years on the Board of the California Energy Storage Alliance. Fifteen of his 22 awarded U.S. patents are in the fields of batteries, fuel cells, and grid storage.

Dr. Horne holds a Ph.D. in Materials Science & Mineral Engineering from University of California, Berkeley, an M.S. in Materials Science & Engineering from University of California, Los Angeles, and a B.S. with high honors in Materials Science & Engineering from University of Florida, Gainesville.

About Energy Vault

Energy Vault develops and deploys sustainable energy storage solutions designed to transform the world’s approach to utility-scale energy storage in realizing decarbonization while maintaining grid resiliency. The company’s proprietary gravity-based energy storage technology, battery storage technology, and energy storage management and integration platform are intended to help utilities, independent power producers and large industrial energy users significantly reduce their levelized cost of energy while maintaining power reliability. Utilizing eco-friendly materials with the ability to integrate waste materials for beneficial re-use, Energy Vault is facilitating the shift to a circular economy while accelerating the clean energy transition for its customers. For additional information, please visit: www.energyvault.com.

Forward-Looking Statements

This press release contains forward-looking statements that involve risks, uncertainties, and assumptions including statements regarding Energy Vault’s future expansion, deployments and capabilities. There are a significant number of factors that could cause actual results to differ materially from the statements made in this press release, including: risks related to the deployment of Energy Vault’s energy management software the projects announced in this press release, risks related to Energy Vault’s ability to supply equipment, engineering, procurement, construction and balance of plant services for the projects announced in this press release, the fact that the project is the first such deployment for Energy Vault and as a result, there could be unforeseen issues with the system, the ability to meet milestones in order to receive payments, unforeseen delays in the projects announced in this press release, whether these projects will be constructed on time or whether they will operate as planned, developments and changes in the general market, the continuing impact of COVID-19, political, economic, and business conditions, and the impact of competing technologies on demand for battery powered projects. Additional risks and uncertainties that could affect our financial results are included under the captions "Risk Factors" and "Management's Discussion and Analysis of Financial Condition and Results of Operations" in the Quarterly Report on Form 10-Q for the quarter ended June 30, 2022, filed with the SEC on August 8, 2022, which is available on our website at investors.energyvault.com and on the SEC's website at www.sec.gov. Additional information will also be set forth in other filings that we make with the SEC from time to time. All forward-looking statements in this press release are based on information available to us as of the date hereof, and we do not assume any obligation to update the forward-looking statements provided to reflect events that occur or circumstances that exist after the date on which they were made, except as required by applicable law.


Contacts

Energy Vault

Investors
This email address is being protected from spambots. You need JavaScript enabled to view it.

Media
This email address is being protected from spambots. You need JavaScript enabled to view it.

MIAMI--(BUSINESS WIRE)--World Fuel Services Corporation (NYSE:INT) announced today that its board of directors has approved a 17% increase to its quarterly cash dividend to $0.14 per share, which will be payable on October 7, 2022 to shareholders of record on September 23, 2022.


“Today’s announcement is a reflection of our confidence in the rapidly evolving growth opportunities of our business and related cash generation,” said Ira M. Birns, executive vice president and chief financial officer. “Our disciplined approach to capital allocation demonstrates our commitment to generating long-term value for our shareholders.”

About World Fuel Services Corporation

Headquartered in Miami, Florida, World Fuel Services is a global energy management company involved in providing energy procurement and related services, as well as transaction and payment management solutions to commercial and industrial customers, principally in the aviation, marine and land transportation industries. World Fuel Services also offers natural gas and electricity, as well as energy advisory services, including programs for sustainability solutions and renewable energy alternatives. World Fuel Services sells fuel and delivers services to its clients at more than 8,000 locations in more than 200 countries and territories worldwide.

For more information, visit www.wfscorp.com.


Contacts

Ira M. Birns
Executive Vice President & Chief Financial Officer
or
Glenn Klevitz
Vice President, Treasurer and Investor Relations
(305) 428-8000
This email address is being protected from spambots. You need JavaScript enabled to view it.

  • The new Lithium Balance n3-BMS from Sensata Technologies comes functional safety certified off-the-shelf, significantly reducing the time to market and costs associated with the ISO 26262 certification process.
  • The battery management system is ideal for applications with power up to 1000 volts/2000 amps and features a unique software structure that allows developers to customize the BMS with their own code and algorithms while maintaining ASIL C certification.
  • Sensata will debut the Lithium Balance n3-BMS in booth #2817 at the Battery Show North America from September 13 – 15 in Novi, Michigan.

SWINDON, England--(BUSINESS WIRE)--$ST #BMS--Sensata Technologies (NYSE: ST), today announced it will debut a new Battery Management System (BMS), the Lithium Balance n3-BMS, for high voltage applications at the Battery Show North America from September 13 – 15 in Novi, Michigan in booth# 2817.


The Lithium Balance n3-BMS is ideal for applications with power up to 1000 volts/2000 amps, especially for battery makers and manufacturers of electric trucks, buses, and other heavy commercial vehicles. The demand for ISO 26262 certified components is on the rise as battery packers and electric commercial vehicle OEMs prioritize functional safety in their platforms while striving for faster time-to-market. However, the ISO 26262 certification process is complex, costly and can take years to complete. An off-the-shelf, Automotive Safety Integrity Level (ASIL C) certified solution like the Lithium Balance n3-BMS can reduce the development time and associated costs.

The unique layered software structure of the n3-BMS provides customers with the option to customize the battery management system with their own code and algorithms without impacting the ASIL C certification. The BMS software architecture consists of a “Base Software Layer” (BSW) and an “External Software Layer” (ESW) which are connected by an open API link layer. Since all the safety-critical functionalities of the BMS are in the BSW layer of the software, developers are free to implement their own software code and algorithms in the ESW without any risk to the ISO 26262 certification of the system.

Both the Lithium Balance n3-BMS and its previous generation, the n-BMS, are distributed systems that consist of up to 30 Cell Monitoring Units (CMUs) for monitoring individual cells and a Master Control Unit (MCU), which consolidates the information and controls the battery functions. The n-BMS’ MCU is fully compatible with the n3-BMS’ CMUs, so it is easy to upgrade from n-BMS to n3-BMS with the replacement of a single PCB board in a battery system of any size. For developers currently working on next generation, heavy electric vehicles that expect the need for an ISO 26262 certified system in the future, this provides a convenient and cost-effective pathway to achieve an ASIL C certified BMS with a simple upgrade (available early 2023).

Additional key features of the n3-BMS include:

  • Up to 1000V / 2000A
  • 24 – 360 cells in series
  • 3 CAN ports

For a preview of Sensata Technologies new functional safety certified Lithium Balance n3-bms, which will be available in early 2023, for electric trucks, buses and material handling equipment, visit www.sensata.com/products/battery-management-systems.

In addition to the new Lithium Balance n3-BMS, Sensata will showcase critical solutions that make energy systems safer, cleaner, more efficient and connected, such as contactors, fuses, IVTs and IMDs, in booth# 2817 at the Battery Show North America from September 13 – 15 in Novi, Michigan.

About Sensata Technologies

Sensata Technologies is a global industrial technology company striving to create a cleaner, more efficient, electrified and connected world. Through its broad portfolio of sensors, electrical protection components and sensor-rich solutions which create valuable business insights, Sensata helps its customers address increasingly complex engineering and operating performance requirements. With more than 21,000 employees and global operations in 13 countries, Sensata serves customers in the automotive, heavy vehicle & off-road, industrial, and aerospace markets. Learn more at www.sensata.com and follow Sensata on LinkedIn, Facebook and Twitter.


Contacts

Investor:
Jacob Sayer
+1 (508) 236-1666
This email address is being protected from spambots. You need JavaScript enabled to view it.

Media
Leila Beardsmore
+1 (805) 452-2165
This email address is being protected from spambots. You need JavaScript enabled to view it.

DUBLIN--(BUSINESS WIRE)--The "Global Electric Vehicle Supply Equipment Market (2022-2027) by Installation Type, Charging Type, Provider, Geography, Competitive Analysis and the Impact of Covid-19 with Ansoff Analysis" report has been added to ResearchAndMarkets.com's offering.


The Global Electric Vehicle Supply Equipment Market is estimated to be USD 6.94 Bn in 2022 and is expected to reach USD 21.32 Bn by 2027, growing at a CAGR of 25.16%.

Market dynamics are forces that impact the prices and behaviors of the Global Electric Vehicle Supply Equipment Market stakeholders. These forces create pricing signals which result from the changes in the supply and demand curves for a given product or service. Forces of Market Dynamics may be related to macro-economic and micro-economic factors.

There are dynamic market forces other than price, demand, and supply. Human emotions can also drive decisions, influence the market, and create price signals. As the market dynamics impact the supply and demand curves, decision-makers aim to determine the best way to use various financial tools to stem various strategies for speeding the growth and reducing the risks.

Competitive Quadrant

The report includes Competitive Quadrant, a proprietary tool to analyze and evaluate the position of companies based on their Industry Position score and Market Performance score. The tool uses various factors for categorizing the players into four categories. Some of these factors considered for analysis are financial performance over the last 3 years, growth strategies, innovation score, new product launches, investments, growth in market share, etc.

Ansoff Analysis

The report presents a detailed Ansoff matrix analysis for the Global Electric Vehicle Supply Equipment Market. Ansoff Matrix, also known as Product/Market Expansion Grid, is a strategic tool used to design strategies for the growth of the company. The matrix can be used to evaluate approaches in four strategies viz. Market Development, Market Penetration, Product Development and Diversification.

The matrix is also used for risk analysis to understand the risk involved with each approach. The analyst analyses the Global Electric Vehicle Supply Equipment Market using the Ansoff Matrix to provide the best approaches a company can take to improve its market position. Based on the SWOT analysis conducted on the industry and industry players, the analyst has devised suitable strategies for market growth.

Why buy this report?

  • The report offers a comprehensive evaluation of the Global Electric Vehicle Supply Equipment Market. The report includes in-depth qualitative analysis, verifiable data from authentic sources, and projections about market size. The projections are calculated using proven research methodologies.
  • The report has been compiled through extensive primary and secondary research. The primary research is done through interviews, surveys, and observation of renowned personnel in the industry.
  • The report includes an in-depth market analysis using Porter's 5 forces model and the Ansoff Matrix. In addition, the impact of Covid-19 on the market is also featured in the report.
  • The report also includes the regulatory scenario in the industry, which will help you make a well-informed decision. The report discusses major regulatory bodies and major rules and regulations imposed on this sector across various geographies.
  • The report also contains the competitive analysis using Positioning Quadrants, the analyst's Proprietary competitive positioning tool.

Market Dynamics

Drivers

  • Heavy Investments from Automakers In Electric Vehicles
  • Increasing Demand for Charging Stations/Docks
  • Favorable Government Policies and Subsidies

Restraints

  • High Cost of Electric Vehicle
  • Stringent Guidelines for Installation of Charging Stations

Opportunities

  • Use of Vehicle-To-Grid Electric Vehicle Charging Stations
  • Electric Vehicle Charging Stations Powered by Renewable Energy

Challenges

  • Lack of Standardization of Charging Infrastructure

Market Segmentation

The Global Electric Vehicle Supply Equipment Market is segmented based on Installation Type, Charging Type, Provider, and Geography.

  • By Installation Type, the market is classified into Fixed Charger and Portable Charger.
  • By Charging Type, the market is classified into Level 1, Level 2, and Level 3.
  • By Provider, the market is classified into Aftermarket and OEM.
  • By Geography, the market is classified into Americas, Europe, Middle-East & Africa and Asia-Pacific.

Companies Mentioned

  • ABB Ltd.
  • AeroVironment Inc.
  • BP International Ltd.
  • BTC Power
  • BYD Auto Co. Ltd.
  • ChargePoint, Inc.
  • Circontrol SA
  • COMECA Group
  • ClipperCreek, Inc.
  • Delta Electronics, Inc.
  • DBT Group
  • Eaton Corp.
  • Ecotap BV
  • EFACEC Power Solutions SGPS, SA
  • Ekoenergetyka-Polska Sp. z.o.o.
  • Engie SA
  • EVBox
  • Evotec SE
  • Heliox
  • Leviton Manufacturing Company Inc.
  • Mass-Tech Controls Pvt. Ltd.
  • Magenta Group
  • Mitsubishi Electric Corp.
  • Phihong USA Corp.
  • Robert Bosch GmbH
  • Schneider Electric SE
  • Siemens Ag
  • SK Signet
  • P2 Power Solutions Pvt. Ltd.
  • Tesla Inc.
  • Tritium Pty Ltd.
  • Webasto SE
  • Yazaki Corp

For more information about this report visit https://www.researchandmarkets.com/r/h2a5ya


Contacts

ResearchAndMarkets.com
Laura Wood, Senior Press Manager
This email address is being protected from spambots. You need JavaScript enabled to view it.

For E.S.T Office Hours Call 1-917-300-0470
For U.S./ CAN Toll Free Call 1-800-526-8630
For GMT Office Hours Call +353-1-416-8900

Over 60% of Bright Power properties located in DAC territories; improves ability to bring energy efficiency to those that need it most

NEW YORK--(BUSINESS WIRE)--#decarbonize--Bright Power, Inc. today announces its strong support for creation of the Disadvantaged Community (DAC) designation in New York State as defined by the Climate Justice Working Group (CJWG). These are communities that suffer from negative public health effects, environmental pollution, impacts of climate change, and possess certain socioeconomic criteria, or comprise high-concentrations of low- and moderate- income households.*


These identified disadvantaged communities will now directly benefit from state funding and incentive programs as NY works towards its emissions reduction goals. While the utilities and NYSERDA offer excellent programs for low income housing, Bright Power believes the DAC-specific funding will be an opportunity to help expand incentives to underserved sectors, such as naturally-occurring affordable housing and commercial businesses serving low income communities.

Bright Power is heavily focused on improving properties located in DACs. New York State has identified 1,721 DAC’s across the state and more than 60% of the properties that Bright Power works with are in these locations.

Three of Bright Power’s recently completed projects - Chestnut Commons, Vital Brookdale and Whitney Young Manor - are all located in DAC territory and Harlem River Houses, a NYCHA RAD conversion that will be started soon, is also located in DAC territory.

“For over 17 years, Bright Power has worked tirelessly to serve low income housing in New York, California, and across the country. Over 60% of our clients are located within the draft DAC territory, and our efforts to serve these properties would not have been possible without the many incentive programs designed to meet the needs of low income housing,” said Amanda Clevinger, Policy and Programs Manager, Bright Power. “Bright Power is supportive of the DAC process - it will ensure that subsidies get to the people that need it most. We’ve found that specialized incentives for low income communities are essential not only for deeply affordable projects, but for moderately affordable ones too.”

“We look forward to being able to extend our energy management services to more low income communities, providing them with healthy environments that are more comfortable living spaces and better for the planet,” said Jeff Perlman, Founder and CEO, Bright Power. “We are very impressed New York State is undertaking the most ambitious effort in the U.S. to meet the challenge of climate change and we are honored to support the initiative.”

More information about Bright Power can be found at www.brightpower.com.

*https://climate.ny.gov/Our-Climate-Act/Disadvantaged-Communities-Criteria

About Bright Power

Bright Power -- the premier provider of energy and water management services and trusted advisor for real estate owners, investors, and operators -- brings seventeen years of experience in renewable energy, energy efficiency, project management, and energy analysis to the industry. Bright Power provides strategic energy and water solutions to building owners and operators across the nation, specializing in multifamily apartment buildings. Bright Power has worked with almost 2 million units that cover over 2 billion square feet.


Contacts

For press inquiries:
Stephanie Driscoll
Chameleon Collective
781.535.8489
This email address is being protected from spambots. You need JavaScript enabled to view it.

HOUSTON--(BUSINESS WIRE)--Black Stone Minerals, L.P. (NYSE: BSM) (“Black Stone,” “BSM,” or “the Company”) announced that as of today its 2021 Schedule K-3 (reporting items of international tax relevance to its partners) is available on line at www.taxpackagesupport.com/BSM.


A limited number of unitholders (primarily foreign unitholders, unitholders computing a foreign tax credit on their tax return and certain corporate and/or partnership unit holders) may need the detailed information disclosed on Schedule K-3 for their specific reporting requirements. To the extent Schedule K‐3 is applicable to your federal income tax return filing needs, we encourage you to review the information contained on this form and refer to the appropriate federal laws and guidance or consult with your tax advisor.

To receive an electronic copy of the Schedule K-3 via email, unitholders may call Tax Package Support toll free at 855-839-3087.

About Black Stone Minerals, L.P.

Black Stone Minerals is one of the largest owners of oil and natural gas mineral interests in the United States. The Company owns mineral interests and royalty interests in 41 states in the continental United States. Black Stone believes its large, diversified asset base and long-lived, non-cost-bearing mineral and royalty interests provide for stable to growing production and reserves over time, allowing the majority of generated cash flow to be distributed to unitholders.


Contacts

Black Stone Minerals, L.P. Contacts

Jeff Wood
President and Chief Financial Officer

Evan Kiefer
Vice President, Finance and Investor Relations
Telephone: (713) 445-3200
This email address is being protected from spambots. You need JavaScript enabled to view it.

DUBLIN--(BUSINESS WIRE)--The "Biomass Gasification Market: Global Industry Trends, Share, Size, Growth, Opportunity and Forecast 2022-2027" report has been added to ResearchAndMarkets.com's offering.


The global biomass gasification market size reached US$ 105 Billion in 2021. Looking forward, the publisher expects the market to reach US$ 153.1 Billion by 2027, exhibiting a CAGR of 6.49% during 2021-2027. Keeping in mind the uncertainties of COVID-19, we are continuously tracking and evaluating the direct as well as the indirect influence of the pandemic. These insights are included in the report as a major market contributor.

Biomass gasification refers to a technology pathway that utilizes a controlled process to transform biomass into hydrogen and carbon monoxide (CO) by using oxygen, heat, carbon dioxide (CO2) and steam. The energy released through the process can be used for preparing food, generating electricity, heating and transportation.

As compared to traditional gas-powered systems, biomass gasifiers offer an optimum decentralized energy source at an affordable cost. Other than this, the integration of biomass gasification with steam and gas turbines offers an efficient, clean and modern biomass system for the production of electricity and heat. The rapid depletion of fossil fuels and the abundant availability of biomass is currently driving the market toward growth.

Biomass Gasification Market Trends:

The Increasing rural electrification rate, particularly in developing countries, has escalated the demand for decentralized electricity generation, which is majorly driving the global biomass gasification market toward growth.

Besides this, the widespread acceptance of these systems for waste processing as a replacement of conventional techniques, such as incineration and landfill, is further fueling the market growth. Moreover, the leading market players and governments of various nations have been consistently investing in the development of advanced technologies, which is contributing to the market growth.

For instance, the United States Depart of Energy (USDOE) is developing innovative and flexible modular designs through the Gasification Systems Program. This aids in the conversion of different types of US domestic coal blends, waste plastics, and municipal solid waste (MSW) into clean synthesis gas. Furthermore, the rising development and commercialization of small- to large-scale biomass gasification systems combined with power generation equipment is positively influencing the market across the globe.

Key Market Segmentation:

Breakup by Source:

  • Solid Biomass
  • Biogas
  • Municipal Waste
  • Liquid Biomass

Breakup by Region:

  • North America
  • Europe
  • Asia Pacific
  • Latin America
  • Middle East and Africa

Key Topics Covered:

1 Preface

2 Scope and Methodology

3 Executive Summary

4 Introduction

5 Global Power Generation Industry

6 Global Biomass Gasification Industry

6.1 Market Overview

6.2 Market Performance

6.2.1 Production Volume Trends

6.2.2 Value Trends

6.3 Impact of COVID-19

6.4 Price Analysis

6.4.1 Key Price Indicators

6.4.2 Price Structure

6.4.2 Price Trends

6.5 Market Breakup by Region

6.6 Market Breakup by Source

6.7 Market Forecast

6.8 SWOT Analysis

6.8.1 Overview

6.8.2 Strengths

6.8.3 Weaknesses

6.8.4 Opportunities

6.8.5 Threats

6.9 Value Chain Analysis

6.9.1 Feedstock Procurement

6.9.2 Wood Pellet Production

6.9.3 Distribution

6.9.4 Pellet Combustion and Value Conversion

6.10 Porter's Five Forces Analysis

6.10.1 Overview

6.10.2 Bargaining Power of Buyers

6.10.3 Bargaining Power of Suppliers

6.10.4 Degree of Competition

6.10.5 Threat of New Entrants

6.10.6 Threat of Substitutes

6.11 Key Market Drivers and Success Factors

7 Biomass Gasification Market: Performance of Key Regions

8 Biomass Gasification Market: Market Breakup by Source

8.1 Solid Biomass

8.1.1 Market Trends

8.1.2 Market Forecast

8.2 Biogas

8.2.1 Market Trends

8.2.2 Market Forecast

8.3 Municipal Waste

8.3.1 Market Trends

8.3.2 Market Forecast

8.4 Liquid Biomass

8.4.1 Market Trends

8.4.2 Market Forecast

9 Competitive Landscape

9.1 Market Structure

9.2 Production Capacities of Key Players

10 Biomass Gasification Process

10.1 Overview

10.2 Detailed Process Flow

10.3 Various Types of Unit Operations Involved

10.4 Mass Balance and Raw Material Requirements

11 Project Details, Requirements and Costs Involved

11.1 Land Requirements and Expenditures

11.2 Construction Requirements and Expenditures

11.3 Plant Machinery

11.4 Machinery Pictures

11.5 Raw Material Requirements and Expenditures

11.6 Raw Material and Final Product Pictures

11.7 Utility Requirements and Expenditures

11.8 Manpower Requirements and Expenditures

11.9 Other Capital Investments

12 Loans and Financial Assistance

13 Project Economics

13.1 Capital Cost of the Project

13.2 Techno-Economic Parameters

13.3 Product Pricing and Margins Across Various Levels of the Supply Chain

13.4 Taxation and Depreciation

13.5 Income Projections

13.6 Expenditure Projections

13.7 Financial Analysis

13.8 Profit Analysis

14 Key Player Profiles

For more information about this report visit https://www.researchandmarkets.com/r/ppei43


Contacts

ResearchAndMarkets.com
Laura Wood, Senior Press Manager
This email address is being protected from spambots. You need JavaScript enabled to view it.
For E.S.T Office Hours Call 1-917-300-0470
For U.S./ CAN Toll Free Call 1-800-526-8630
For GMT Office Hours Call +353-1-416-8900

Clean Energy Leaders to Provide Strategic Guidance, Insight and Ambassadorship

HOUSTON--(BUSINESS WIRE)--Pickering Energy Partners, a Houston-based energy financial services and investment firm, is pleased to announce the appointment of the PEP Energy Transition Advisory Board. The board brings together energy leaders with years of industry experience, including clean energy and decarbonization-minded leaders. PEP’s Energy Transition Advisory Board is an important development in the growth of the firm’s Energy Transition practice.


Jason Martinez, who leads the PEP Investment Banking practice shares, “I am excited to have the board’s influential perspectives on our team who is dedicated to creating a true centre of excellence for the industry’s capital raising and investing needs. We have brought together a world-class group, including energy transition investors, company executives, clean and enabling technology experts, and policy thought leaders to benefit our clients. The board’s knowledge and experience will provide a boost in our continued goal to transform the future of energy.”

Led by Dan Pickering, PEP Chief Investment Officer, the PEP Energy Transition Advisory Board includes:

  • Andrejka Bernatova, Chief Executive Officer, ESGEN Acquisition Corporation
  • Meg Gentle, Executive Director, HIF Global
  • David Heikkinen, Executive Vice President, CarbonVert
  • C. Kay McCall, Chairman of the Renewable Energy Alliance Houston
  • Brook Papau, Chief Executive Officer, Orennia
  • Nick Tiller, Investor and Founder, Sustainable America

Bringing this board together is a natural next step as we continue to evaluate opportunities and deals not only for their return to shareholders, but also their ability to tangibly lead to a carbon-free future. Our team’s track record in energy deals is bar none. I cannot think of a better qualified team to advise on high growth energy sectors,” adds Walker Moody, President of PEP.

The PEP Energy Transition Advisory Board will provide strategic guidance on legacy industry trends and the potential impacts of regulatory and macroeconomic changes. Their insights will be used by the PEP team when evaluating capital raising partners, investment opportunities, and engaging strategic consulting clients. Additionally, the Board will create tangible value for PEP and its clients by acting as an ambassador to the firm. The Energy Transition Advisory Board is a non-paid volunteer position.

About PEP

Pickering Energy Partners (PEP) is an energy focused financial services platform. Our expertise spans decades across the entire energy landscape. We’ve deployed over $16 billion across all energy sub-sectors. We are, at our core, trusted energy advisors, investors, and partners alongside our clients. Headquartered in Houston, Texas, PEP delivers an experienced, opportunistic team that aims to provide guidance and long-term value for clients while having a positive impact on the companies and communities that PEP invests in. For more information, please visit www.PickeringEnergyPartners.com

Pickering Energy Partners LP (“PEP”) is an SEC Registered Investment Advisor. Affiliated PEP Advisory LLC (“PEP BD”) is a registered broker-dealer, member FINRA/SIPC.


Contacts

Jennifer Petree / Tina Tallant
This email address is being protected from spambots. You need JavaScript enabled to view it.
+1.713.269.3776

MELBOURNE, Australia--(BUSINESS WIRE)--Hansen Technologies (ASX:HSN) is pleased to announce a new multi-year agreement with Novel Energy Solutions, Minnesota’s leading solar energy provider for businesses, municipalities, non-profit organisations and farmers.

Under the terms of the agreement, Novel Energy Solutions will be able to leverage all the benefits of Hansen’s Community Solar Solution. This entails a Novel-branded customer acquisition portal, customer & utility transaction management, dashboards and reporting suite.

Community Solar is now seen as a viable alternative for consumers and businesses that want renewable and affordable clean energy. Novel Energy Solutions were in need of an integrated, consolidated and scalable platform to grow their business, as well as to track and report data. Constraints with their current customer management platforms were restricting their ability to grow. Hansen for Community Solar is a solution that solves the management and operational challenges of solar assets by providing a foundation of systems, people and processes – while ensuring that the business has control of data, the customer experience, brand and commercial strategy.

Cliff Kaehler, Founder and Chief Executive Officer, Novel Energy Solutions, commented: “With Novel Energy Solutions in a major expansionary phase and in need of best-of-breed supporting software solutions that are both highly scalable and secure, we found a like-minded partner in Hansen. We have watched them conceptualise and roll out specific solutions for Community Solar players in the United States and are pleased with the results. With their global expertise and knowledge of the Community Solar market, we are extremely confident that they will be able to seamlessly support our business priorities in the years to come.”

John May, Division President, Energy and Utilities at Hansen, commented: “There is no doubt that the future will be one built on renewables and from what we see, solar power is only set to see more coast-to-coast growth in the years to come. As the industry continues to pivot towards solar power and other sustainable energy sources, the Hansen team are well-equipped to provide the solutions and expertise necessary for Community Solar providers to monetise new market opportunities and enable access to clean energy for communities across the United States.”

For further information about Hansen Technologies, please visit www.hansencx.com.

About Hansen Technologies
Hansen Technologies (ASX: HSN) is a leading global provider of software and services to the energy, water and communications industries. With its award-winning software portfolio, Hansen serves 600+ customers in over 80 countries, helping them to create, sell, and deliver new products and services, manage and analyse customer data, and control critical revenue management and customer support processes.
For more information, visit www.hansencx.com

About Novel Energy Solutions
Based in Minnesota, Novel Energy Solutions is a vertically-integrated solar EPC and long-term owner. Founded in 2012 by a fifth-generation Minnesota family farmer, Novel began focusing solely on Minnesota and now has ongoing and completed projects from coast-to-coast, having completed over 100MW of solar projects. They are currently expanding to other states.
For more information, visit https://novelenergy.biz/


Contacts

Adnan Bashir
Senior Manager, Global Corporate Communications
Hansen Technologies
+1 647-204-0999

Project will generate low-carbon energy to meet the consumption of over 1,200 U.S. McDonald’s restaurants

SAN DIEGO--(BUSINESS WIRE)--EDF Renewables North America today announced a 15-year virtual power purchase agreement (VPPA) with McDonald’s Corp (NYSE: MCD). The 255 MWac / 332 MWdc Apollo Solar project will help McDonald’s to meet its sustainability goals and advance its commitment to climate action. Apollo Solar, located in Texas, is expected to begin delivery of low carbon electricity in June 2024.


Approximately 300 jobs are expected to be created during the 2023-2024 construction phase with more than $30 million generated in new tax revenue over the operating life for taxing entities. Apollo Solar will produce clean energy while minimizing impacts to wildlife, habitat, and other environmental resources.

“We applaud McDonald’s for taking action on climate change and are honored to partner with them to address their restaurant electricity carbon footprint,” said Matt McCluskey, Vice President Development, South Central Region for EDF Renewables. “Through the purchase of clean energy from Apollo Solar, McDonald's will be able to reduce GHG emissions in support of their sustainability goals while the project construction phase will provide the local community with a boost to the economy through job creation, local spending with vendors, and an expanded tax base.”

McCluskey continued, “It’s been a great pleasure to work with a counterparty such as McDonald’s who is willing to provide the flexibility needed to bring the Apollo Solar Project to fruition during these uncertain times for the solar industry. EDF Renewables is committed to continuing its successful partnerships with corporate and industrial customers who have emerged as large buyers of renewable energy.”

“We are thrilled to add EDF Renewables and the Apollo Solar project to our U.S. renewable energy portfolio as part of our continued commitment to climate action,” said Elaine Strunk, Sr. Director Global Sustainability, McDonald’s. “Apollo Solar plays a significant role in our science-based emissions reduction target for 2030 and brings a considerable amount of new renewable generation to the grid. Together with EDF Renewables, this project furthers our shared goal of making a more sustainable planet for generations to come.”

Strunk added: “Importantly, McDonald's has a responsibility to foster positive impact in the local communities it serves, and we are excited about the meaningful economic opportunities Apollo Solar will help create for those living in the area.”

Walid Norris, Vice President, Client Solutions for CustomerFirst Renewables said, “Corporate demand for clean energy has remained strong despite the supply chain issues troubling the solar market. The McDonald’s team was determined through their use of innovative contracting structures to execute a major solar procurement that would significantly reduce their greenhouse gas emissions, and they found a great partner with EDF Renewables. We are proud to have supported them in this effort and congratulate all parties involved for reaching this exciting outcome.”

Once complete, the project is expected to generate 619,000 MWh of low-carbon energy annually, enough to meet the consumption of over 1,200 U.S. McDonald’s restaurants1. This is equivalent to avoiding over 439,000 metric tons of carbon (CO₂) emissions annually which represents the greenhouse gas emissions from over 95,000 passenger vehicles driven over the course of one year2.

EDF Renewables, one of the largest renewable developers in North America, is committed to providing solutions to meet our customer’s carbon-reduction goals. With 35 years of experience and 24 gigawatts of wind, solar, and storage projects developed, EDF Renewables provides integrated energy solutions from grid-scale power to electric vehicle charging.

1 According to the average electricity consumption of a U.S. McDonald’s restaurant in 2021.
2 According to U.S. EPA Greenhouse Gas Equivalencies calculations and typical transmission assumptions.

EDF Renewables North America is a market leading independent power producer and service provider with 35 years of expertise in renewable energy. The Company delivers grid-scale power: wind (onshore and offshore), solar photovoltaic, and storage projects; distribution-scale power: solar and storage; asset optimization: technical, operational, and commercial expertise to maximize performance of generating projects, and onsite solutions, through the Company’s PowerFlex subsidiary, offering a full suite of onsite energy solutions for commercial and industrial customers: solar, storage, EV charging, energy management systems, and microgrids. EDF Renewables’ North American portfolio consists of 24 GW of developed projects and 13 GW under service contracts. EDF Renewables North America is a subsidiary of EDF Renewables, the dedicated renewable energy affiliate of the EDF Group. For more information visit: www.edf-re.com. Connect with us on LinkedIn, Facebook and Twitter.


Contacts

Sandi Briner, +1 858-521-3525
This email address is being protected from spambots. You need JavaScript enabled to view it.

FuelStar helps people save up to 40% on gas by showing them how to drive more efficiently

CAMBRIDGE, Mass.--(BUSINESS WIRE)--Cambridge Mobile Telematics (CMT), the world’s largest telematics service provider, today announced the official launch of FuelStar, a new app that helps consumers save up to 40%* on gas by showing them how to drive more efficiently. FuelStar analyzes driving patterns that consume gas faster — such as rapid acceleration, speeding, and hard braking — and teaches people how to make small changes in their driving habits to help them save money at the gas pump.


With high gas prices around the country, Americans are hurting at the pump. Inflation has increased costs across the board. A potential recession has pushed many Americans to cut costs. Many have already made changes — recent studies have shown that Americans are driving less, carpooling more, and using alternative modes of transportation to combat rising gas prices.

“We saw that people across the country were struggling with high gas prices and wanted to create a solution to help ease the burden,” said Rafi Finegold, Senior Vice President of Product for CMT. “FuelStar was born out of the idea that by making small changes to driving behavior, people can dramatically reduce how often they need to buy gas – and those savings add up. The mom who spends $240 a month to fill up her Honda Accord once a week could save $95** on her monthly gas bill with help from FuelStar.”

FuelStar introduces innovations to a market that has traditionally helped consumers save at the pump by telling them which gas stations have the cheapest prices. FuelStar uses physics-based smartphone sensor data to predict gas consumption by analyzing a person’s driving behaviors and matching it with their vehicle’s make, model, and year in real-time. FuelStar deploys on-phone data processing to provide optional real-time audio alerts for inefficient driving, helping drivers save even more. The app also delivers personalized, data-driven recommendations for how a driver should modify their driving behaviors to save. The result is a new app experience that provides insights into driving habits and gas savings that have never been available to the public before.

To date, over 20 million people have used CMT's technology, which powers safe driving programs for 21 of the top 25 auto insurers in the US, and for major automakers, wireless providers, safety companies, and rideshare providers. In its pursuit to make the world’s roads and drivers safer, CMT offers a growing suite of free consumer apps like FuelStar and Openroad, a crash assistance app that detects car crashes and sends emergency help.

Consumers can use FuelStar with the peace of mind that their privacy is protected. In keeping with CMT's privacy-first approach, FuelStar only uses the data collected to power the services provided. CMT does not and will not sell or share a user’s personal information — including location data — with third parties.

FuelStar is available today for free on Apple’s App Store. Download it here. To learn more about FuelStar, visit www.getfuelstar.com.

About Cambridge Mobile Telematics

Cambridge Mobile Telematics (CMT) is the world’s largest telematics service provider. Its mission is to make the world’s roads and drivers safer. The company’s AI-driven platform, DriveWell®, gathers sensor data from millions of IoT devices — including smartphones, proprietary Tags, connected vehicles, dash cams, and third-party devices — and fuses them with contextual data to create a unified view of vehicle and driver behavior. Companies from personal and commercial auto insurance, automotive, rideshare, smart cities, wireless, financial services, and family safety industries use insights from CMT’s platform to power their risk assessment, safety, claims, and driver improvement programs. Headquartered in Cambridge, MA, with offices in Budapest, Chennai, Seattle, and Tokyo, CMT serves millions of people through 80 programs in 18 countries, including 21 of the top 25 US auto insurers.

* Savings estimates are based on gas mileage calculations from FuelEconomy.gov.
** Based on AAA’s $3.716 national gas average September 12, 2022 for a 2022 Honda Accord.


Contacts

Media :
Cambridge Mobile Telematics
Matt Fiorentino
This email address is being protected from spambots. You need JavaScript enabled to view it.

SHIFT Communications
Marisa Steck
This email address is being protected from spambots. You need JavaScript enabled to view it.

AUSTIN, Texas--(BUSINESS WIRE)--Invisible Urban Charging (“IUC”) announced today that it is partnering with EV Charging of Arizona to roll out 13,980 chargers for electric vehicles (“EV”) into the State of Arizona, increasing its total number of EV chargers seven times. Arizona has more than 40,000 registered electric vehicles, according to a June 2022 report from the U.S. Department of Energy.


Installation will commence in Q1 2023. EV Charging of Arizona is managed by developer S3 Biotech, which is developing several sites in Arizona with a focus on creating “Smart City” facilities, including a new state-of-the-art medical campus in Maricopa. Jones Lang Lasalle (“JLL”), a global leader in property development and management, serves as installation partner, along with a nationwide installation capability through its network of electrical contractors, logistics, and signage partners.

“IUC is proud to be working with S3 Biotech to get ahead of the growing demand from staff and visitors to their development in the City of Maricopa, and also to other cities in the great state of Arizona,” said Nigel Broomhall, Co-Founder and Chief Executive Officer of IUC. “More EV chargers help reduce range anxiety and encourage more Americans to drive electric, something that is good for everyone’s long term health, and ultimately their wallets. Next-generation facilities like those that S3 Biotech is developing attract businesses and employees that want to move to electric and having chargers on-site makes these campuses highly attractive places to work.”

“JLL is pleased to expand our relationship with IUC and begin our partnership with S3 Biotech on the progressive projects,” said Ken Demske, Managing Director, Project Development Services for JLL. “We look forward to building a greener future and supporting IUC, S3 Biotech, and the State of Arizona.”

IUC was founded in 2019 with the mission to accelerate the transition to electric transportation. IUC partners with major property owners to provide on-site EV charging at scale in high numbers, helping to achieve the 3.5 million chargers expected to be required by 2030. With more than 6,000 EV chargers going into Florida and now 13,980 into Arizona, IUC will be deploying nearly 20,000 EV chargers over the next 12-18 months, helping remove range anxiety for EV drivers in both states, so that more Americans can make the shift to an EV.

About Invisible Urban Charging

Invisible Urban Charging was founded in 2019 as a complete “electric vehicle charging solution as a service” provider, working with major property owners across the globe to drive the electrification of transportation and to make an impact. Headquartered in Austin, Texas, IUC is an end-to-end EV solution to deploy high volumes of EV chargers to customer sites for a flat monthly fee. For more information, please visit our website at www.iucharging.com.


Contacts

Media
This email address is being protected from spambots. You need JavaScript enabled to view it.

New ultra-low powered cellular router solution powered by AirLink OS enables next-generation networking capabilities for industry 4.0 applications

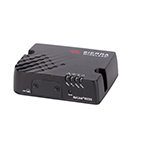
VANCOUVER, British Columbia--(BUSINESS WIRE)--Sierra Wireless (NASDAQ: SWIR) (TSX: SW), a world leading IoT solutions provider, today announced the AirLink® RX55 LTE cellular router solution to bring advanced networking capabilities to the Industrial IoT (IIoT) and deliver intelligence securely at the edge for mission-critical applications on both public and private networks.


Optimized for Industrial IoT and Industry 4.0 Adoption

The new AirLink® RX55 cellular router solution provides ultra-low power consumption, which combined with its wide operating voltage, makes it ideal for solar or battery powered remote monitoring installations. Its’ compact, rugged design is built to withstand harsh conditions and with edge intelligence capabilities, the router’s future-proof design enables applications including grid modernization, smart city, automation and remote machine and sensor monitoring.

The AirLink RX55’s design along with its’ ultra-low power, ethernet and dual-serial port makes it ideal for use in both fixed and mobile industrial applications including power and water utilities, oil fields, pipelines, mines, agriculture, manufacturing, waste management, private networking and SCADA applications.

“For IT/OT Managers who need to connect, manage and gain intelligence from critical assets in extremely harsh or distributed environments, the RX55 family of industrial cellular routers enables edge intelligence through secure IIoT/Industry 4.0 deployments,” said Tom Mueller, VP of Product Management, Sierra Wireless. “Unlike other products on the market, the ultra-low power and rugged RX55 not only supports advanced network designs, but also enables new edge applications through container support, with centralized remote management services. This makes it perfect for industrial IoT customers looking for a future-proof solution for connecting remote fixed assets in challenging environments.”

“Enabling IIoT for a smarter grid requires flexible computing technologies that can power wide-ranging applications - from protocols such as OpenFMB™ for messaging and interoperability to light-weight distributed intelligence at the edge," says Mr. Dileep Rudran, VP of Product Management for the OpenDSO™ platform at Open Energy Solutions, Inc. "With the new AirLink® RX55 router, Sierra Wireless has further expanded its broad portfolio of edge technologies for modernizing grid operations."

“Sierra Wireless has been an active contributor in the Open Field Message Bus (OpenFMB) users group for its open-source data models, interoperability testing procedures, and foundational use-case,” said Dr. Stuart Laval, Chair, UCA OpenFMB users group. “With the edge computing capabilities of their router solution, distributed intelligence applications can be run to help enable secure device-to-device communications between grid automation and Distributed Energy Resource (DER) systems. I look forward to seeing these capabilities demonstrated again with other early adopters at next month’s UCA OpenFMB interoperability PlugFest event.”

Multi-Band Network Support for Global Public and Private Networks

The RX55 solution delivers multi-band, world-wide support providing extensive public network coverage and best-in-class private networking coverage. The router supports Band 71 as well as most private networking bands including CBRS Band 48 in the U.S., and private Band 42 and Band 43 in Europe.

Modern Networking Capabilities for Always-On, Secure Connectivity

The AirLink® RX55 solution includes AirLink Complete, which provides remote management of the solution via the AirLink Management System (ALMS), a cloud-based management platform, and 24/7 technical support to quickly and remotely detect, diagnose and troubleshoot issues. Managed by ALMS, the RX55 router leverages Sierra Wireless’ next-generation web-based multi-network router operating system, AirLink OS. With its flexible WAN routing capabilities, AirLink OS enables industrial customers to create multiple concurrent data sessions through a new multi-APN solution. This multi-APN allows the separation of different traffic types, for example separating network management traffic from SCADA traffic.

AirLink OS seamlessly integrates with the ALMS management platform to manage these features remotely and securely. Further, AirLink OS delivers industry-leading end-to-end security capabilities including multi-layered device-to-cloud security with unique cryptographic keys that connect the router to ALMS, VPN for secure transport, secure firmware updates and use of the Wi-Fi Protected Access 3 (WPA-3) protocol.

Industrial IoT Market Set to Expand

The global Industrial IoT market value in 2022 was estimated at $321.81 billion USD and is expected to expand at a compound annual growth rate (CAGR) of 23.1% from 2022 to 2030, with revenue forecasted at approximately $1.69 trillion USD in 2030, according to a market analysis report by Grand View Research. Key market drivers include improved ROI, productivity and quality improvements, leveraging new technology such as edge computing, and following the Industry 4.0 roadmap.

Availability

Sierra Wireless’ AirLink® RX55 LTE cellular router solution is expected to be available commercially in Q4 of 2022.

For more information, visit: https://www.sierrawireless.com/router-solutions/rx55/, or download the new eBook: AirLink® RX55 – Tackling Industrial IoT Challenges.

To contact the Sierra Wireless Sales Desk, call +1 877-687-7795 or visit http://www.sierrawireless.com/sales.

Note to editors:

To view and download images of Sierra Wireless products, visit https://www.sierrawireless.com/company/image-gallery/

About Sierra Wireless

Sierra Wireless (NASDAQ: SWIR) (TSX: SW) is a world leading IoT solutions provider that combines devices, network services, and software to unlock value in the connected economy. Companies globally are adopting 4G, 5G, and LPWA solutions to improve operational efficiency, create better customer experiences, improve their business models, and create new revenue streams. Sierra Wireless works with its customers to develop the right industry-specific solution for their IoT deployments, whether this is an integrated solution to help connect edge devices to the cloud, a software/API service to manage processes with billions of connected assets, or a platform to extract real-time data to improve business decisions. With more than 25 years of cellular IoT experience, Sierra Wireless is the global partner customers trust to deliver them their next IoT solution. For more information, visit www.sierrawireless.com.

Connect with Sierra Wireless on the IoT Blog at http://www.sierrawireless.com/iot-blog, on Twitter at @SierraWireless, on LinkedIn at https://www.linkedin.com/company/sierra-wireless and on YouTube at https://www.youtube.com/SierraWireless.

“Sierra Wireless” is a registered trademark of Sierra Wireless, Inc. “AirLink” is a registered trademark of Sierra Wireless America, Inc. Other product or service names mentioned herein may be the trademarks of their respective owners.

Forward Looking Statements

This press release contains forward-looking statements. When used in this press release, the words "plan", "expect", "believe", and similar expressions generally identify forward-looking statements. These statements reflect our current expectations but involve risks and uncertainties. These statements may relate to, among other things: plans and timing for the introduction or enhancement of our products and services, future market conditions, supply conditions, channel and end customer demand conditions, revenues, gross margins, operating expenses, profits, and other expectations, intentions, and plans that are not historical fact. These statements are subject to numerous risks and uncertainties surrounding our business and the markets we operate in, including, but not limited to, changes in technology and market conditions and our ability to implement our strategy and successfully develop, manufacture and supply new products and services. A further discussion of the risks and uncertainties facing Sierra Wireless are discussed in its Annual Information Form and Management’s Discussion and Analysis of Financial Condition and Results of Operations, which may be found on SEDAR at www.sedar.com and on EDGAR at www.sec.gov and in Sierra Wireless’ other regulatory filings with the Securities and Exchange Commission in the United States and the provincial securities commissions in Canada. Due to these many risks and uncertainties we cannot assure you that the forward-looking statements contained in this press release will be realized. Except as may be required by applicable securities laws, Sierra Wireless assumes no obligation to publicly update or revise any forward-looking statements made herein or otherwise, whether as a result of new information, future events or otherwise.


Contacts

Louise Matich
Sierra Wireless
Media Relations
This email address is being protected from spambots. You need JavaScript enabled to view it.

Sean Fallis
Sierra Wireless
Investor Relations
This email address is being protected from spambots. You need JavaScript enabled to view it.

DUBLIN--(BUSINESS WIRE)--The "Poland Construction Equipment Market - Strategic Assessment & Forecast 2022-2028" report has been added to ResearchAndMarkets.com's offering.


The Poland construction equipment market share by units is expected to reach 43,683 by 2028. Polish government investment in infrastructure development projects and European Union funding under the recovery & resilience program are some prominent factors that will drive the growth of Poland's construction equipment during the forecast period (2022-2028).

Key Highlights of the Market

  • The Earthmoving segment has the country's largest construction equipment market share. The excavators held the largest share in the earthmoving segment in 2021. The surge in civil engineering & housing projects in 2021 is expected to support the demand for excavators.
  • Growth in solar energy projects under the national plan of energy & climate is expected to positively impact the demand for mini excavators & cranes in the country market. Mini excavators have gained a good market share in Poland, challenging the dominance of backhoe loaders. Mini excavators are compact and operate in confined places in the urban part of cities across the country. The demand is expected to grow sharply due to various renovation projects of the residential and commercial buildings across the country.
  • A surge in housing projects in the country, and housing building permits increased by 8% in 2021. In 2021, residential construction grew strongly by 10% in Poland. In the public sector, tremendous growth is witnessed in health & education buildings. The increase in housing projects is expected to drive the demand for cranes, excavators & aerial platforms in the market.
  • Construction equipment rental companies account for Poland's major market share as the country has one of the largest construction markets in Europe. The rental companies are expected to have a higher demand than the non-rental companies.
  • In terms of end-users, the construction industry is expected to generate the highest demand. This is primarily due to the Poland Recovery & Resilience program, which is anticipated to dominate the Poland construction equipment market during the forecast period.

Some of the significant under-construction infrastructure projects include:

  • Expressway Borki Wielkie to Elk
  • Expressway Koszalin to Szczecinek
  • Warsaw Data Center Campus 48MW
  • Towarowa Residential Complex
  • Gustoryn to Wronow Gas Pipeline
  • Mokotow Residential Complex
  • Zamosc Residential Community
  • Adoption of Automation Technology & Green Hydrogen Fuel Technology in Construction Equipment
  • Poland is experiencing severe labor shortages in construction, manufacturing, and mining industries because of the COVID-19 outbreak. Because of the workforce shortage, new construction equipment with advanced technologies is highly demanded to improve worker efficiency and reduce labor dependency. Hitachi, for instance, has introduced wheel loaders and excavators with automation, smart operating technology, and the ConSite Hitachi Comprehensive Machine Management support system.
  • Companies are introducing green hydrogen fuel technology to replace conventional fuel-powered equipment. Demand for construction equipment equipped with green hydrogen fuel technology is expected to grow in the country as the Polish government aims to reduce fossil fuel dependency by 2030. Major OEMs in the country, such as Caterpillar, are developing construction equipment that has green hydrogen technology.

Government Initiatives

  • Growth in Infrastructure & Renewable Energy Projects In 2021
  • The Polish government increased infrastructure investment to improve economic activities to subdue the negative impact of COVID-19 on the economy. $44.6 billion investment was allocated for developing roads & railways across the country. In addition, the European Union granted $39 billion under Recovery & Resilience Plan (2021-2026). The funds were planned to direct the development of digital transformation & clean energy production.
  • The government invested $735 million in 2021 for various solar & wind energy projects across the country. The country witnessed an increase in the number of solar projects for achieving the target of 7.8GW of solar capacity by 2030 under the National Plan for Energy & Climate. Government initiatives such as auction schemes & incentives for rooftop installation of Solar cells are expected to drive the growth of the renewable energy industry in the country. By 2027, the government aims to increase offshore wind power generation capacity by 6 GW.

Key Vendors

  • Caterpillar
  • Volvo Construction Equipment
  • Liebherr
  • XCMG
  • JCB
  • Komatsu
  • Manitou
  • Hyundai Construction Equipment
  • Wacker Neuson
  • CNH Industrial

Other Prominent Vendors

  • Hitachi Construction Equipment
  • LiuGong
  • Fayat
  • Tur Poland
  • Huss Mach

Distributors Profiles

  • Warynski Trade Sp. o.o.
  • M&M Polska
  • DENISON
  • Toolmex Truck
  • EWPA Sp. Z o. o.
  • Biuro Handlowe Ruda Sp. z o. o. Sp. k.

Key Questions Answered

1. What is the Growth Rate of Poland Construction Equipment Market?

2. How Big Will Be the Poland Construction Equipment Market Size by 2028?

3. Who Are the Key Players in the Poland Construction Machinery Market?

4. How Many Units of Construction Equipment Will Be Sold in 2028?

Key Topics Covered:

Section 1 - Introduction

  • Market Snapshot
  • Executive Summary

Section 2 - the Market Overview

  • Economic Scenario, Foreign Direct Investment

Section 3 - Poland Construction Equipment (Type & Application)

Section 4 - Market Dynamics

  • Market Drivers, Restraints, Trends, Key Economic Regions in Brazil, Advantage Brazil, FDI in Brazil, Import/Export Trend Analysis, Supply Chain, Covid-19 Impact

Section 5 - Technology Development

  • Advent of New Technology

Section 6 - Competitive Landscape

Section 7 - Quantitative Summary

Section 8 - Report Summary

  • Key Insights
  • Abbreviations
  • List of Graphs
  • List of Tables

Section 9 - Report Scope & Definition

  • Research Methodology
  • Market Definition, Inclusion & Exclusion

For more information about this report visit https://www.researchandmarkets.com/r/h8nxwq


Contacts

ResearchAndMarkets.com
Laura Wood, Senior Press Manager
This email address is being protected from spambots. You need JavaScript enabled to view it.

For E.S.T Office Hours Call 1-917-300-0470
For U.S./ CAN Toll Free Call 1-800-526-8630
For GMT Office Hours Call +353-1-416-8900

The partnership answers the global crypto mining communities’ demand for sustainable options to offset carbon emissions produced from mining operations

CHICAGO--(BUSINESS WIRE)--#BlockFills--BlockFills, a fast-growing global digital asset trading and financial technology company, announced its partnership with Isla Verde Capital to offer the global Bitcoin mining community and the broader crypto industry with carbon emissions offsets and Renewable Energy Credits (RECs). Isla Verde Capital is a global firm specializing in renewable energy and environmental attribute markets, and helps firms access renewable energy attribute markets such as carbon offsets, RECs, and IRECs for their environmental goals and commitments, including Bitcoin mining.


The new offering will solve a crucial challenge for mining enterprises, especially those that are publicly traded, to minimize or eliminate their mining operational carbon footprint. With this partnership, BlockFills and Isla Verde Capital directly answers this demand by offering one of the first environmentally sustainable Bitcoin Mining solutions for the North American and global mining community.

“Isla Verde Capital has proven to be a thoughtful and ambitious partner alongside BlockFills to help resolve a growing crypto mining industry challenge--miners are seeking sustainable solutions to their challenges in the energy industry, while also fighting public scrutiny over their consumption and carbon footprint,” said Neil Van Huis, BlockFills Partner and Director. “This partnership provides smart and sustainable options for them. Our commitment remains supporting qualified North American and global mining companies with market access, products, and services that they and other professionals and institutions demand in an ever-expanding market segment.”

BlockFills has provided strategic support for miners in North America and across the world since the firm’s founding in 2018. Miners have partnered with BlockFills to access BlockFills Pool, which is the only U.S. mining pool that is SOC 1 Type 2* Certified. Further, BlockFills helps miners facilitate bespoke execution, same-day transferring to fiat, collateralized lending services, hedging services, and more.

BlockFills currently serves over 900 enterprise and mining firms in North America and globally.

"We are excited to partner with BlockFills to help cryptocurrency miners, traders, and other participants find green solutions for their energy usage,” said Ronnie Virissimo, Isla Verde Capital Co-CIO. “The space is changing, and it is becoming more imperative that all groups, particularly those on the blockchain, are proactive about reporting on and lowering their carbon footprint, with greater potential for regulation and rules to be put in place. There are other benefits such as potential access to green financing and making the use of clean energy solutions a tool for better financing. We want to make sure these miners and traders are given access to the appropriate products.”

“We are excited to partner with BlockFills in bringing these sustainability products to the Bitcoin mining industry. BlockFills has been a leader in the space for a variety of initiatives, from hardware financing to balance sheet risk management, they're an obvious choice for leading the way in offering sustainable mining solutions. We hope our partnership and offerings will be a tool for miners to reach for as the Bitcoin network moves ahead in its sustainability efforts,” said Nasser Mohsin, Isla Verde Capital Co-CIO.

“Since its inception, BlockFills has been a thought leader in servicing the Bitcoin mining community; from dark pooled spot market liquidity provision and USD loans for covering operating expenses, to equipment financing and managing risk around block rewards. In continuing our efforts to best serve Bitcoin miners and the broader crypto industry, BlockFills is proud to partner with Isla Verde Capital in bringing market access and education on Carbon Offset and Renewable Energy Credit products. We believe that providing market access to Carbon Offsets and REC’s will help the industry accelerate through the noise on Bitcoin Mining carbon intensity, and be well positioned for a future that is centered around environmental consciousness and sustainability initiatives,” said John Divine from BlockFills.

Based out of Chicago and founded in 2018, BlockFills is one of the fastest growing crypto liquidity and technology providers globally. Their digital asset technology is already serving over 800 institutional clients across 50 countries.

To reach BlockFills regarding business opportunities, please email This email address is being protected from spambots. You need JavaScript enabled to view it., or for more information, please visit www.blockfills.com.

About BlockFills

BlockFills is a disruptive financial technology firm dedicated to the provision of end-to-end solutions for global crypto currency market participants. The Company has successfully built and deployed a cutting-edge multi-asset technology platform that has solved major liquidity fragmentation problems in the marketplace. The platform provides price discovery, price aggregation, electronic order matching, smart order routing and trade reconciliation solutions for institutions in the digital spot, derivatives, and lending markets. In addition, BlockFills provides software-as-a-service (SaaS) solutions, designed to simplify all aspects of the trade lifecycle for institutions in the sector.

About Isla Verde Capital

Isla Verde Capital is a fund that began operating in 2021 with its founding partners combining more than 25 years of experience in the renewable energy and fuel markets. IVC boasts a global network of renewable energy project developers and operators, carbon offset project developers, and sustainability consultants. Through these connections, they bring their trading partners a broad spectrum of environmental attributes to achieve their sustainability targets while offering investors access to the growing environmental market space with an experienced management team.

RISK DISCLOSURE AND IMPORTANT INFORMATION

This press release is not an offer to sell or the solicitation of an offer to buy any security in any jurisdiction where such an offer or solicitation would be illegal, nor shall there be any sale of any security in any jurisdiction in which such offer, solicitation or sale would be unlawful prior to registration or qualification under the securities laws of that jurisdiction.

All investing is subject to risk, including the possible loss of all of the money invested. As with any investment strategy, there is no guarantee that investment objectives will be met and investors may lose money. Diversification does not ensure a profit or protect against a loss in a declining market. Past performance is no guarantee of future results.


Contacts

Media Contact for BlockFills:
Michael Grimm, Reputation Partners
This email address is being protected from spambots. You need JavaScript enabled to view it.

Contact for Isla Verde Capital:
This email address is being protected from spambots. You need JavaScript enabled to view it.

SAN ANTONIO--(BUSINESS WIRE)--Valero Energy Corporation (NYSE: VLO, “Valero”) announced today the pricing terms of its previously announced cash tender offers (the “Tender Offers”) to purchase its outstanding 3.650% Senior Notes due 2025 (the “3.650% 2025 Notes”), its outstanding 2.850% Senior Notes due 2025 (the “2.850% 2025 Notes”), its outstanding 3.400% Senior Notes due 2026 (the “3.400% 2026 Notes”), the outstanding 4.375% Senior Notes due 2026 issued by Valero Energy Partners LP and guaranteed by Valero (the “4.375% 2026 Notes”), its outstanding 4.000% Senior Notes due 2029 (the “4.000% 2029 Notes”), its outstanding 4.350% Senior Notes due 2028 (the “4.350% 2028 Notes”), the outstanding 4.500% Senior Notes due 2028 issued by Valero Energy Partners LP and guaranteed by Valero (the “4.500% 2028 Notes”), its outstanding 2.150% Senior Notes due 2027 (the “2.150% 2027 Notes”), its outstanding 6.625% Senior Notes due 2037 (the “6.625% 2037 Notes”), its outstanding 4.900% Senior Notes due 2045 (the “4.900% 2045 Notes”) and its outstanding 7.500% Senior Notes due 2032 (the “7.500% 2032 Notes” and, collectively with the 3.650% 2025 Notes, the 2.850% 2025 Notes, the 3.400% 2026 Notes, the 4.375% 2026 Notes, the 4.000% 2029 Notes, the 4.350% 2028 Notes, the 4.500% 2028 Notes, the 2.150% 2027 Notes, the 6.625% 2037 Notes and the 4.900% 2045 Notes, the “Notes”) for up to an increased maximum aggregate principal amount of $1,250,000,000 (such increased maximum aggregate principal amount, the “Maximum Aggregate Principal Amount”). The terms and conditions of the Tender Offers are described in the Offer to Purchase, dated August 26, 2022 (the “Offer to Purchase”).


The following table lists the Tender Offers that had been validly tendered and not validly withdrawn at or prior to 5:00 p.m., New York City time, on September 9, 2022 (the “Early Tender Date”), as reported by D.F. King & Co., Inc., the tender and information agent. The applicable Reference Yield, Repurchase Yield, Early Tender Payment and Total Consideration (each as defined more fully in the Offer to Purchase) with respect to the Notes accepted for purchase are detailed in the table below.

Title of
Security

CUSIP / ISIN

Initial
Principal
Amount Outstanding

Acceptance
Priority Level

U.S. Treasury
Reference
Security

Reference
Yield

Fixed
Spread

Repurchase
Yield

Early Tender Payment (1)(2)

Total

Consideration (1)(2)

3.650% Senior Notes due 2025

91913YAS9 / US91913YAS90

$252,075,000

1

3.125% UST due 8/15/2025

3.562%

+55 bps

4.112%

$30

$989.10

2.850% Senior Notes due 2025

91913YAY6 / US91913YAY68

$542,869,000

2

3.125% UST due 8/15/2025

3.562%

+55 bps

4.112%

$30

$969.28

3.400% Senior Notes due 2026

91913YAU4 / US91913YAU47

$597,411,000

3

3.125% UST due 8/31/2027

3.392%

+70 bps

4.092%

$30

$974.67

4.375% Senior Notes due 2026(3)

91914JAA0 / US91914JAA07

$207,672,000

4

3.125% UST due 8/31/2027

3.392%

+90 bps

4.292%

$30

$1,003.02

4.000% Senior Notes due 2029

91913YAW0 / US91913YAW03

$1,000,000,000

5

2.750% UST due 8/15/2032

3.285%

+140 bps

4.685%

$30

$961.72

4.350% Senior Notes due 2028

91913YAV2 / US91913YAV20

$750,000,000

6

3.125% UST due 8/31/2027

3.392%

+110 bps

4.492%

$30

$992.85

____________

(1)

Per $1,000 principal amount.

(2)

The Total Consideration for each series of Notes validly tendered prior to or at the Early Tender Date and accepted for purchase is calculated using the applicable fixed spread shown in the table above and is inclusive of the Early Tender Payment for such series of Notes.

(3)

Issued by Valero Energy Partners LP and guaranteed by Valero.

Because the aggregate principal amount of Notes validly tendered and not validly withdrawn at or prior to the Early Tender Date has an aggregate principal amount that exceeds the Maximum Aggregate Principal Amount, Valero does not expect to accept for purchase all Notes that have been validly tendered and not validly withdrawn at or prior to the Early Tender Date. Rather, subject to the Maximum Aggregate Principal Amount, the Series Tender Caps (as defined in the Offer to Purchase) applicable to the 6.625% 2037 Notes and 7.500% 2032 Notes, respectively, and the acceptance priority levels set forth in the table above, in each case as further described in the Offer to Purchase, Valero will accept for purchase the 3.650% 2025 Notes, the 2.850% 2025 Notes, the 3.400% 2026 Notes, the 4.375% 2026 Notes, the 4.000% 2029 Notes and the 4.350% 2028 Notes validly tendered and not validly withdrawn at or prior to the Early Tender Date and does not expect to accept for purchase any 4.500% 2028 Notes, 2.150% 2027 Notes, 6.625% 2037 Notes, 4.900% 2045 Notes and 7.500% 2032 Notes. Valero expects to accept for purchase the 4.350% 2028 Notes validly tendered and not validly withdrawn at or prior to the Early Tender Date with a proration factor of approximately 31.7%. As a result, a holder who validly tenders and does not validly withdraw Notes pursuant to the Tender Offers may have all or a portion of its Notes returned to it.

On the Early Settlement Date (as defined below), Valero will pay the Total Consideration (as shown in the table above) for each $1,000 principal amount of each of the 3.650% 2025 Notes, the 2.850% 2025 Notes, the 3.400% 2026 Notes, the 4.375% 2026 Notes, the 4.000% 2029 Notes and the 4.350% 2028 Notes validly tendered and not validly withdrawn at or prior to the Early Tender Date and accepted for purchase. The Total Consideration was calculated in the manner described in the Offer to Purchase by reference to the applicable fixed spread specified in the table above plus the applicable yield to maturity based on the bid-side price of the applicable U.S. Treasury Reference Security specified in the table above at 10:00 a.m., New York City time, on September 12, 2022. The Total Consideration also includes the Early Tender Payment (as shown in the table above) for each $1,000 principal amount of each of the 3.650% 2025 Notes, the 2.850% 2025 Notes, the 3.400% 2026 Notes, the 4.375% 2026 Notes, the 4.000% 2029 Notes and the 4.350% 2028 Notes validly tendered and not validly withdrawn at or prior to the Early Tender Date and accepted for purchase. Payments for the 3.650% 2025 Notes, the 2.850% 2025 Notes, the 3.400% 2026 Notes, the 4.375% 2026 Notes, the 4.000% 2029 Notes and the 4.350% 2028 Notes accepted for purchase will include accrued and unpaid interest from the last interest payment date applicable to the relevant series of Notes up to, but excluding, the settlement date for Notes that are validly tendered and not validly withdrawn at or prior to the Early Tender Date and accepted for purchase (the “Early Settlement Date”). It is anticipated that the Early Settlement Date will be September 13, 2022, the second business day after the Early Tender Date.

The Tender Offers will expire at midnight, New York City time, at the end of September 23, 2022, unless extended or earlier terminated. Because the Tender Offers have been fully subscribed as of the Early Tender Date, holders who tender Notes after the Early Tender Date will not have any of their Notes accepted for purchase, unless Valero elects to increase or eliminate the Maximum Aggregate Principal Amount. Any Notes tendered after the Early Tender Date, together with any Notes tendered at or prior to the Early Tender Date but not accepted for purchase by Valero, will be returned to the holders thereof as described in the Offer to Purchase, unless Valero elects to increase or eliminate the Maximum Aggregate Principal Amount.

The withdrawal deadline for the Tender Offers was 5:00 p.m., New York City time, on September 9, 2022 and has not been extended. Accordingly, previously tendered Notes and Notes tendered after such withdrawal deadline may not be withdrawn, subject to applicable law.

Valero’s obligation to accept for payment and to pay for the Notes validly tendered and not validly withdrawn in the Tender Offers is subject to the satisfaction or waiver of a number of conditions described in the Offer to Purchase. The Tender Offers may be terminated or withdrawn in whole or terminated or withdrawn with respect to any series of the Notes, subject to applicable law. Valero reserves the right, subject to applicable law, to (1) waive any and all conditions to any of the Tender Offers, (2) extend or terminate any of the Tender Offers, (3) increase, decrease or eliminate the Maximum Aggregate Principal Amount and/or any Series Tender Cap with respect to a particular series or (4) otherwise amend any of the Tender Offers in any respect.

Valero has retained BofA Securities, Inc., Citigroup Global Markets Inc., J.P. Morgan Securities LLC and Wells Fargo Securities, LLC as dealer managers (the “Dealer Managers”) for the Tender Offers. Valero has retained D.F. King & Co., Inc. as the tender and information agent for the Tender Offers. For additional information regarding the terms of the Tender Offers, please contact: BofA Securities, Inc. at (888) 292-0070 (toll free) or (980) 387-3907 (collect); Citigroup Global Markets Inc. at (212) 723-6106 (collect) or (800) 558-3745 (toll free); J.P. Morgan Securities LLC at (866) 834-4666 (toll free) or (212) 834-3554 (collect); or Wells Fargo Securities, LLC at (866) 309-6316 (toll free) or (704) 410-4756 (collect). Requests for documents and questions regarding the tendering of securities may be directed to D.F. King & Co., Inc. by telephone at (212) 269-5550 (for banks and brokers only) or (800) 334-0384 (for all others, toll-free), by email at This email address is being protected from spambots. You need JavaScript enabled to view it. or to the Dealer Managers at their respective telephone numbers.

This announcement is for information purposes only and does not constitute a solicitation of an offer to sell or an offer to purchase any securities. The Tender Offers are being made only pursuant to the Offer to Purchase and only in such jurisdictions as is permitted under applicable law. None of Valero, the tender and information agent, the Dealer Managers or the trustees with respect to the Notes, nor any of their affiliates, makes any recommendation as to whether holders should tender or refrain from tendering all or any portion of their Notes in response to the Tender Offers.

Safe-Harbor Statement

Statements contained in this press release that state Valero’s or its management’s expectations or predictions of the future are forward-looking statements intended to be covered by the safe harbor provisions of the Securities Act of 1933 and the Securities Exchange Act of 1934. The words “anticipate,” “believe,” “expect,” “plan,” “intend,” “scheduled,” “estimate,” “project,” “projection,” “predict,” “budget,” “forecast,” “goal,” “guidance,” “target,” “could,” “would,” “should,” “may,” “strive,” “seek,” “potential,” “opportunity,” “aimed,” “considering,” “continue,” and other similar expressions identify forward-looking statements. Forward-looking statements in this press release include those relating to the expiration date and settlement date for the Tender Offers. It is important to note that actual results could differ materially from those projected in such forward-looking statements based on numerous factors, including those outside of Valero’s control, such as legislative or political changes or developments, market dynamics, cyberattacks, weather events, and other matters affecting our operations or the demand for our products. These factors also include, but are not limited to, the uncertainties that remain with respect to the Russia-Ukraine conflict, the impact of inflation on margins and costs, the COVID-19 pandemic, variants of the COVID-19 virus, governmental and societal responses thereto, and the adverse effects the foregoing may have on our business or economic conditions generally. For more information concerning these and other factors that could cause actual results to differ from those expressed or forecasted, see Valero’s annual report on Form 10-K, the “Risk Factors” section included in the Offer to Purchase, quarterly reports on Form 10-Q, and other reports filed with the Securities and Exchange Commission.

About Valero

Valero Energy Corporation, through its subsidiaries (collectively, “Valero”), is an international manufacturer and marketer of petroleum-based and low-carbon liquid transportation fuels and petrochemical products, and sells its products primarily in the United States (“U.S.”), Canada, the United Kingdom (“U.K.”), Ireland and Latin America. Valero owns 15 petroleum refineries located in the U.S., Canada and the U.K. with a combined throughput capacity of approximately 3.2 million barrels per day. Valero is a joint venture member in Diamond Green Diesel Holdings LLC, which owns a renewable diesel plant in Norco, Louisiana with a production capacity of 700 million gallons per year, and Valero owns 12 ethanol plants located in the Mid-Continent region of the U.S. with a combined production capacity of approximately 1.6 billion gallons per year. Valero manages its operations through its Refining, Renewable Diesel, and Ethanol segments. Please visit www.investorvalero.com for more information.


Contacts

Investors:
Homer Bhullar, Vice President – Investor Relations and Finance, 210-345-1982
Eric Herbort, Director – Investor Relations, 210-345-3331
Gautam Srivastava, Senior Manager – Investor Relations, 210-345-3992

Media:
Lillian Riojas, Executive Director – Media Relations and Communications, 210-345-5002

ST. LOUIS--(BUSINESS WIRE)--Watlow®, a designer and manufacturer of complete industrial thermal systems, is proud to announce that it was selected by Raven SR Inc. as a thermal technology partner for the field trial of their non-combustion equilibrium Steam/CO2 Reforming SR2 unit which converted methane to transportation-grade hydrogen. The SR2 reactor successfully performed at a rate exceeding other commercially available technologies for hydrogen production from methane. Raven’s patented steam / carbon dioxide reforming process transforms all waste – biomass, municipal solid waste, bio-solids, industrial waste, sewage, medical waste and unwanted, unusable, excess, low methane natural gas – into synthetic gas, which is then converted into renewable energy products including hydrogen, sulfur and nitrogen-free Fischer-Tropsch synthetic fuels and additives and solvents.


The SR2 reactor utilizes Watlow’s zero-emissions electric heater technology to power Raven’s reductive chemical reaction, which eliminates combustion and is, therefore, a much cleaner process that converts all feedstock into fuel rather than incinerating it.

“We are thrilled to be partnering with Raven™ on their innovative hydrogen production solution,” said Jeff Diestelmeier, vice president and general manager of Watlow’s energy and environmental technologies business unit. “This technology aligns perfectly with Watlow’s vision of enriching lives through sustainable energy solutions that power the globe.”

Watlow’s thermal system includes high-temperature MULTICELL™ heaters, WATCONNECT® pre-engineered control panels and temperature and power controllers.

Additionally, Watlow engineers developed a special IoT device providing a cloud-connected dashboard for data logging, near real-time monitoring of system output and visualization of thermal performance. The solution also provides a foundation for diagnostic and predictive analytics of the system at scale.

“This was a monumental day to showcase how our technology is highly productive and efficient in creating a hydrogen-rich syngas for downstream conversion into renewable fuels. We now have the means to deliver advanced fuels with low to negative carbon intensity to markets around the world,” said Matt Murdock, CEO of Raven SR.

Raven’s technology provides a carbon-free solution for both the creation and consumption of energy. Hydrogen can be produced with no harmful emissions to power fuel cells that can create electricity with only heat and water vapor as the byproducts.

Raven SR plans to bring its first commercial Steam/CO2 Reforming production facility online in early 2023 at the West Contra Costa sanity landfill in Richmond, Calif., where it will convert organic green waste into transportation-grade hydrogen for local customers.

About Watlow

Watlow is a global industrial technology and manufacturing leader that provides world class engineering expertise and innovative thermal products and systems that enable customers to thrive. Watlow brings its experience to numerous industries, including semiconductor processing, environmental chambers, energy processes, diesel emissions, medical and foodservice equipment.

Since 1922, Watlow has grown in product capability, market experience and global reach. The company holds more than 1100 patents and employs more than 4,200 team members working in 12 manufacturing facilities and five advanced technology and development centers in the United States, Mexico, Europe and Asia. Watlow covers 95 countries through sales and distribution offices around the world. The company continues to grow, while the commitment remains the same – to provide its customers with superior products and services for their individual needs.


Contacts

For additional information call your nearest Watlow representative:
Watlow
Phone: 1+ (800) WATLOW2, 1+ (314) 878-4600
Fax: 1+ (877) 893-1005, 1+ (314) 878-6814

NA: Bob Moore, 314-628-4530, This email address is being protected from spambots. You need JavaScript enabled to view it.

Illustrious Roster of International Leaders, Global Energy Experts, Clean Energy Philanthropists Join More Than 5,000 Attendees and over 300 CEOs at the World Premier Event to Advance the Implementation of Clean Energy Deployment and Innovation

WASHINGTON--(BUSINESS WIRE)--The U.S. Department of Energy (DOE), in partnership with Carnegie Mellon University (CMU), announced an updated roster of speakers for the inaugural 2022 Global Clean Energy Action Forum (GCEAF). Held in Pittsburgh, PA from September 21–23, this landmark event will bring together energy leaders from around the world to turn clean energy ambition into action and accelerate the transition toward a more secure energy future, creating millions of good paying jobs. Pittsburgh serves as an exemplary host city as one of the world’s preeminent communities that is successfully transitioning to a new, just, fair, and prosperous clean energy economy.


The GCEAF will showcase clean energy action aimed at leveraging the trillions of dollars in investment opportunities that will be unleashed this decade by the global transition to net-zero emissions. Hundreds of side events and business forum sessions will focus on every sector of the clean energy economy from renewables to abated fossil energy, to nuclear, to new emerging sectors like hydrogen.

Ukrainian Energy Minister German Galushchenko will join other ministers from around the world in Pittsburgh. Senior White House officials in attendance include Special Presidential Envoy for Climate John Kerry, Director of the National Economic Council Brian Deese, newly appointed Senior Advisor to the President for Clean Energy Innovation and Implementation John Podesta, and Special Presidential Coordinator for Global Infrastructure and Energy Security Amos Hochstein. Other U.S. leaders including President of the AFL-CIO, Elizabeth Shuler, Governor Tom Wolf of Pennsylvania and Senator Joe Manchin (D-WV) will headline mainstage events during the three-day conference.

CLICK HERE for media registration

International leaders attending include:

  • Leila Benali, Minister of Energy Transition and Sustainable Development, Morocco
  • Chris Bowen, Minister of Climate Change and Energy, Australia
  • Khashayar Farmanbar, Minister for Energy and Digital Development, Sweden
  • Leonore Gewessler, Federal Minister for Climate Action, Environment, Energy, Mobility, Innovation and Technology, Austria
  • Rob Jetten, Minister for Climate and Energy Policy, The Netherlands
  • Dr Tan See Leng, Second Minister for Trade and Industry, Singapore
  • Kadri Simson, Commissioner for Energy, European Commission
  • Dr Jitendra Singh, Minister of State for Science and Technology and Earth Sciences, India
  • Jonathan Wilkinson, Minister of Natural Resources, Canada
  • Fatih Birol, Director, International Energy Agency
  • Rafael Grossi, Director General, International Atomic Energy Association
  • Gim Huay, Managing Director, Centre for Nature and Climate, World Economic Forum
  • Francesco La Camera, Director General, International Renewable Energy Agency
  • Angela Wilkinson, Secretary General and Chief Executive Officer, World Energy Council
  • Bill Gates, Co-chairperson, Bill & Melinda Gates Foundation
  • Dr. Rita Baranwal, Chief Technology Officer, Westinghouse
  • Dominique Boies, CEO and CFO, Enerkem
  • Bo Cerup-Simonsen, CEO Mærsk Mc-Kinney Møller Center for Zero Carbon Shipping
  • Claudio Facchin, CEO, Hitachi Energy
  • Dr. Jennifer Holmgren, CEO, LanzaTech
  • Praveer Sinha, CEO and Managing Director, Tata Power Company
  • JB Straubel, Co-Founder & CEO, Redwood Materials and Tesla co-founder
  • Malcolm Turnbull, Chairman, Fortescue Future Industries

The GCEAF follows on the heels of the opening of the UN General Assembly and will convene industry executives, young professionals, civil society and others with science and energy ministers from over 30 countries representing the majority of global emissions and 90% of public financing for clean energy. It will also host the joint convening of the annual Mission Innovation and Clean Energy Ministerials, two platforms created over the last 15 years to advance clean energy innovation and deployment to meet our global climate goals.

Click here for the full list of attendees for the Global Clean Energy Action Forum

Click here the full agenda for the Global Clean Energy Action Forum


Contacts

This email address is being protected from spambots. You need JavaScript enabled to view it.

DUBLIN--(BUSINESS WIRE)--The "Carbon Capture and Storage (CCS) Market - Global Industry Analysis (2018 - 2020) - Growth Trends and Market Forecast (2021 - 2026)" report has been added to ResearchAndMarkets.com's offering.


The global market for carbon capture and storage (CCS) is projected to be valued at US$ 9.42 Bn in 2026. Growing from a market value of US$ 4.17 Bn in 2020, the CCS market is projected to exhibit substantial growth at a CAGR of 15.7% over the forecast period.

Key Highlights of Carbon Capture and Storage Market

CCS possesses the ability to capture more than 90% of carbon dioxide (CO2) emissions and ward off carbon dioxide from entering the atmosphere. This can enable pragmatic and judicious use of carbon dioxide for specific industrial cases.

Industrial activities and burning of fossil fuels led to an outrush of above 30 billion metric tons of CO2 in 2019. CCS technology was successfully able to capture almost 35MT of carbon dioxide emissions.

Currently, 0.1-0.2% of carbon dioxide released from industries and power plants across the globe is captured and stored using CSS technology. However, as the technology matures, this share is expected to increase in the times to follow.

Need for Efficient Utilization of CO2 Pulls Oil & Gas Companies Towards Carbon Capture and Storage (CCS)

With a market share of 61% in 2020, enhanced oil recovery (EOR) is anticipated to lead the worldwide carbon capture and storage industry. The majority of CO2 collected is used by oil and gas firms for EOR processes and blue hydrogen synthesis. Much of the CO2 injected into the oil reservoir is only briefly held in most CO2 EOR projects.

Decommissioning an EOR project more precisely entails "blowing down" the reservoir pressure in order to maximize the quantity of recoverable oil. As a result, just a little quantity of CO2 infused into the stationary oil remains dissolved. This is why some people are skeptical of EOR as a long-term storage solution. Thus, prominent use of CO2 in exploration and production makes it a prime end user industry of carbon capture and storage.

Acquisition of Numerous Commercial-CCS Projects Gives Market Supremacy to Europe

With more than 11 commercial CSS projects, Europe has geared up to gain ascendancy over others in the market by 2030. The region garnered 13 commercial facilities that are either up and running or in different phases of development. The EU's US$ 11.32 bn Innovation fund is expected to act as a key bankroller for planning, construction, and CCS operations. Subsequently, the carbon capture and storage (CCS) market in Europe is expected to propel growth for the forthcoming years.

Key Topics Covered:

1. Executive Summary

2. Market Overview

3. Global Carbon Capture & Storage (CCS) Operational and Future Projects, 2018 - 2026

4. Global Carbon Capture & Storage (CCS) Market Outlook, 2018 - 2026

4.1. Global Carbon Capture & Storage (CCS) Market Outlook, by Source, Volume (MTPA) and Value (US$ Mn), 2018 - 2026

4.1.1. Key Highlights

4.1.1.1. Pre-combustion

4.1.1.2. Post-combustion

4.1.1.3. Oxy-fuel Combustion

4.1.2. BPS Analysis/Market Attractiveness Analysis, by Source

4.2. Global Carbon Capture & Storage (CCS) Market Outlook, by Type, Volume (MTPA) and Value (US$ Mn), 2018 - 2026

4.2.1. Key Highlights

4.2.1.1. Pipeline

4.2.1.2. Ship/Tanker

4.2.1.3. Chemical Carrier Vehicle

4.2.2. BPS Analysis/Market Attractiveness Analysis, by Type

4.3. Global Carbon Capture & Storage (CCS) Market Outlook, by End-use, Volume (MTPA) and Value (US$ Mn), 2018 - 2026

4.3.1. Key Highlights

4.3.1.1. Enhanced Oil Recovery (EOR)

4.3.1.2. Dedicated Geological Storage

4.3.2. BPS Analysis/Market Attractiveness Analysis, by End-use

4.4. Global Carbon Capture & Storage (CCS) Market Outlook, by Region, Volume (MTPA) and Value (US$ Mn), 2018 - 2026

4.4.1. Key Highlights

4.4.1.1. North America

4.4.1.2. Europe

4.4.1.3. Asia Pacific

4.4.1.4. Latin America

4.4.1.5. Middle East & Africa

4.4.2. BPS Analysis/Market Attractiveness Analysis, by Region

5. North America Carbon Capture & Storage (CCS) Market Outlook, 2018 - 2026

6. Europe Carbon Capture & Storage (CCS) Market Outlook, 2018 - 2026

7. Asia Pacific Carbon Capture & Storage (CCS) Market Outlook, 2018 - 2026

8. Latin America Carbon Capture & Storage (CCS) Market Outlook, 2018 - 2026

9. Middle East & Africa Carbon Capture & Storage (CCS) Market Outlook, 2018 - 2026

10. Competitive Landscape

11. Appendix

Companies Mentioned

  • Siemens AG
  • GE
  • Babcock & Wilcox Enterprises, Inc.
  • Mitsubishi Heavy Industries, Ltd.
  • Air Liquide
  • Linde AG
  • Air Products & Chemicals, Inc.
  • Climeworks
  • Total SE
  • Global Thermostat
  • CO2 Solutions
  • Carbon Engineering Ltd.
  • Royal Dutch Shell plc

For more information about this report visit https://www.researchandmarkets.com/r/5wvgox


Contacts

ResearchAndMarkets.com
Laura Wood, Senior Press Manager
This email address is being protected from spambots. You need JavaScript enabled to view it.
For E.S.T Office Hours Call 1-917-300-0470
For U.S./ CAN Toll Free Call 1-800-526-8630
For GMT Office Hours Call +353-1-416-8900

  • “20/20 Vision” projects over $20 Billion of available cash through 20261 and over $20 per share of run-rate Distributable Cash Flow2
  • Lowering long-term leverage target to ~4x
  • Increasing Share Repurchase Authorization by $4 billion
  • Increasing dividend by ~20% this quarter to $1.58 per common share annualized
  • Raising 2022 financial guidance by ~$1.2 billion
  • Pre-filed Corpus Christi Midscale Trains 8 & 9 with FERC in August 2022

HOUSTON--(BUSINESS WIRE)--Cheniere Energy, Inc. (“Cheniere” or the “Company”) (NYSE American: LNG) announced today that its Board of Directors has approved a revised comprehensive, long-term capital allocation plan (the “Plan”) designed to maintain investment grade credit metrics through cycles, further return capital to shareholders over time, and continue to invest in accretive organic growth.

Executing under the capital allocation plan announced in September 2021, Cheniere has repaid or redeemed over $4 billion of long-term indebtedness, repurchased more than $0.6 billion of shares, initiated and paid $1.32 per common share in dividends as of the second quarter of 2022, and reached a positive final investment decision (“FID”) on the Corpus Christi Stage 3 Liquefaction Project (“CCL Stage 3”). Given the Company’s progress on its prior capital allocation plan significantly ahead of schedule, which is driven by the Company’s continued outperformance, Cheniere has reached a new cash flow inflection point and now expects to generate over $20 billion of available cash through 20261 and construction of CCL Stage 3, enabling further execution on its balance sheet, capital return and growth priorities. The Plan is designed to achieve a run-rate Distributable Cash Flow2 (“DCF”) of over $20 per share on a run-rate basis.

Cheniere is also raising full year 2022 Consolidated Adjusted EBITDA2 guidance to $11.0 - $11.5 billion and full year 2022 DCF2 guidance to $8.1 - $8.6 billion due primarily to a change in the expected timing of several cargoes accelerating into 2022 which were previously forecast for 2023 as well as sustained higher margins on LNG throughout 2022.

“Today’s revised capital allocation plan marks another significant milestone for Cheniere and reflects the success achieved by the Cheniere team, particularly in terms of operational excellence and safety. The accelerated progress on our 2021 plan would not have been possible without the hard work and dedication of our entire workforce,” said Jack Fusco, Cheniere’s President and Chief Executive Officer. “As a market leading LNG operator, we are proud of our accomplishments thus far and look forward to continuing to reliably supply the global market with our flexible, cleaner-burning LNG in support of our customers and end-users abroad, while delivering on our commitment to create value for our all of our stakeholders. Energy security has never been more critical, and we are confident in the significant long-term role of North American natural gas in the global energy supply mix.”

The objectives and design of the Plan include:

Long-Term Sustainable Balance Sheet

  • Initial $4 billion debt paydown target achieved
  • Further debt paydown with revised target run-rate, long-term leverage of ~4x with investment grade credit metrics maintained through CCL Stage 3 construction
  • Achieve and maintain investment grade ratings across the Cheniere complex to support cash flow sustainability through cycles

Meaningful Shareholder Returns

  • Upsize share repurchase program by $4 billion for an additional 3-year authorization with potential to repurchase ~10% or more of Cheniere’s market capitalization with excess capital
  • Cumulative debt paydown to share repurchase allocation ratio reset from 4:1 to 1:1
  • Increase annualized dividend by 20% to $1.58 per common share from inaugural $1.32 per common share dividend initiated last year
  • Plan to increase mid-single digit future growth rate of dividend to ~10% through CCL Stage 3 construction

Disciplined Accretive Growth

  • Pre-filed Corpus Christi Midscale Trains 8 & 9 with FERC in August 2022 with near-term goal to achieve ~60 MTPA platform
  • Develop large-scale brownfield growth opportunities at both Sabine Pass and Corpus Christi, with long-term potential to reach ~90 MTPA platform

“Thanks to Cheniere’s continued financial and operational outperformance since we announced our capital allocation framework last fall, we have achieved significant progress on each of the four key pillars of that plan – in a matter of quarters, not years – and are proud to announce our new, revised plan today,” said Zach Davis, Cheniere’s Executive Vice President and Chief Financial Officer. “Our new ‘20/20 vision’ is designed to return significant capital to shareholders, while solidifying investment grade credit metrics and pursuing accretive growth of our platform within our disciplined capital investment parameters. We expect to generate over $20 billion of available cash through 2026 and over $20 of Distributable Cash Flow per share on a run-rate basis. This revised plan supports our efforts to ensure the long-term success and sustainability of Cheniere, while creating and delivering substantial long-term value for our all of our stakeholders.”

2022 REVISED FULL YEAR FINANCIAL GUIDANCE

(in billions)

2022 Previous


2022 Revised

Consolidated Adjusted EBITDA2

$

9.8

-

$

10.3


$

11.0

-

$

11.5

Distributable Cash Flow2

$

6.9

-

$

7.4


$

8.1

-

$

8.6

INVESTOR CONFERENCE CALL AND WEBCAST

Cheniere will host a conference call to discuss the capital allocation plan on Monday, September 12, 2022, at 5:00 p.m. Eastern time / 4:00 p.m. Central time. A listen-only webcast of the call and an accompanying slide presentation may be accessed through our website at www.cheniere.com. Following the call, an archived recording will be made available on our website.

___________________________

1 Forecast as of September 12, 2022 and subject to change based upon, among other things, changes in commodity prices over time.

2 Non-GAAP financial measure. See “Reconciliation of Non-GAAP Measures” for further details.

About Cheniere

Cheniere Energy, Inc. is the leading producer and exporter of liquefied natural gas (LNG) in the United States, reliably providing a clean, secure, and affordable solution to the growing global need for natural gas. Cheniere is a full-service LNG provider, with capabilities that include gas procurement and transportation, liquefaction, vessel chartering, and LNG delivery. Cheniere has one of the largest liquefaction platforms in the world, consisting of the Sabine Pass and Corpus Christi liquefaction facilities on the U.S. Gulf Coast, with total production capacity of approximately 45 million tonnes per annum of LNG in operation and an additional 10+ mtpa of expected production capacity under construction. Cheniere is also pursuing liquefaction expansion opportunities and other projects along the LNG value chain. Cheniere is headquartered in Houston, Texas, and has additional offices in London, Singapore, Beijing, Tokyo, and Washington, D.C.

For additional information, please refer to the Cheniere website at www.cheniere.com and Quarterly Report on Form 10-Q for the quarter ended June 30, 2022, filed with the Securities and Exchange Commission.

Dividends

Future amounts and payment dates of quarterly cash dividends will be subject to the determination and approval of the Company’s Board of Directors. The decision by the Board of Directors whether to pay any future dividends and the amount of any such dividends will be based on, among other things, the Company's financial position, results of operations, cash flows, capital requirements, restrictions under the Company's existing credit agreements and the requirements of applicable law.

Share Repurchase Authorization

Under the share repurchase authorization, repurchases can be made from time to time using a variety of methods, which may include open market purchases, privately negotiated transactions or otherwise, all in accordance with the rules of the Securities and Exchange Commission and other applicable legal requirements. The timing and amount of any shares of the Company’s common stock that are repurchased under the share repurchase authorization will be determined by the Company’s management based on market conditions and other factors. The share repurchase authorization does not obligate the Company to acquire any particular amount of common stock, and may be modified, suspended or discontinued at any time or from time to time at the Company’s discretion.

Forward-Looking Statements

This press release contains certain statements that may include “forward-looking statements” within the meanings of Section 27A of the Securities Act of 1933 and Section 21E of the Securities Exchange Act of 1934. All statements, other than statements of historical or present facts or conditions, included herein are “forward-looking statements.” Included among “forward-looking statements” are, among other things, (i) statements regarding Cheniere’s financial and operational guidance, business strategy, plans and objectives, including the development, construction and operation of liquefaction facilities, (ii) statements regarding regulatory authorizations and approval expectations, (iii) statements expressing beliefs and expectations regarding the development of Cheniere’s LNG terminal and pipeline businesses, including liquefaction facilities, (iv) statements regarding the business operations and prospects of third parties, (v) statements regarding potential financing arrangements, (vi) statements regarding future discussions and entry into contracts, and (vii) statements relating to Cheniere’s capital deployment, including intent, ability, extent, and timing of capital expenditures, debt repayment, dividends, share repurchases and execution on the capital allocation plan. Although Cheniere believes that the expectations reflected in these forward-looking statements are reasonable, they do involve assumptions, risks and uncertainties, and these expectations may prove to be incorrect. Cheniere’s actual results could differ materially from those anticipated in these forward-looking statements as a result of a variety of factors, including those discussed in Cheniere’s periodic reports that are filed with and available from the Securities and Exchange Commission. You should not place undue reliance on these forward-looking statements, which speak only as of the date of this press release. Other than as required under the securities laws, Cheniere does not assume a duty to update these forward-looking statements.

Reconciliation of Non-GAAP Measures
Regulation G Reconciliations

The accompanying news release contains non-GAAP financial measures. Consolidated Adjusted EBITDA, Distributable Cash Flow, and Distributable Cash Flow per share are non-GAAP financial measures that we use to facilitate comparisons of operating performance across periods. These non-GAAP measures should be viewed as a supplement to and not a substitute for our U.S. GAAP measures of performance and the financial results calculated in accordance with U.S. GAAP and reconciliations from these results should be carefully evaluated.

Non-GAAP measures have limitations as an analytical tool and should not be considered in isolation or in lieu of an analysis of our results as reported under GAAP and should be evaluated only on a supplementary basis.

Consolidated Adjusted EBITDA and Distributable Cash Flow

The following table reconciles our actual Consolidated Adjusted EBITDA and Distributable Cash Flow to Net income (loss) attributable to common stockholders for the forecast amounts for full year 2022 (in billions):


Full Year


2022

Net income (loss) attributable to common stockholders


$

1.8


-

$

2.3


Net income attributable to non-controlling interest


1.2


-


1.3


Income tax provision (benefit)


0.9


-


1.0


Interest expense, net of capitalized interest


1.4


-


1.4


Depreciation and amortization expense


1.1


-


1.1


Other expense (income), financing costs, and certain non-cash operating expenses


4.6


-


4.4


Consolidated Adjusted EBITDA


$

11.0


-

$

11.5


Interest expense (net of capitalized interest and amortization) and realized interest rate derivatives


(1.4

)

-


(1.4

)

Maintenance capital expenditures, income tax and other expense


(0.3

)

-


(0.2

)

Consolidated Distributable Cash Flow


$

9.3


-

$

9.9


CQP distributable cash flow attributable to non-controlling interest


(1.2

)

-


(1.3

)

Cheniere Distributable Cash Flow


$

8.1


-

$

8.6


Note: Totals may not sum due to rounding.

Consolidated Adjusted EBITDA represents net income attributable to Cheniere before net income attributable to the non-controlling interest, interest, taxes, depreciation and amortization, adjusted for certain non-cash items, other non-operating income or expense items, and other items not otherwise predictive or indicative of ongoing operating performance, as detailed in the following reconciliation. Consolidated Adjusted EBITDA is not intended to represent cash flows from operations or net income as defined by U.S. GAAP and is not necessarily comparable to similarly titled measures reported by other companies.

We believe Consolidated Adjusted EBITDA provides relevant and useful information to management, investors and other users of our financial information in evaluating the effectiveness of our operating performance in a manner that is consistent with management’s evaluation of business performance. We believe Consolidated Adjusted EBITDA is widely used by investors to measure a company’s operating performance without regard to items such as interest expense, taxes, depreciation and amortization which vary substantially from company to company depending on capital structure, the method by which assets were acquired and depreciation policies. Further, the exclusion of certain non-cash items, other non-operating income or expense items, and items not otherwise predictive or indicative of ongoing operating performance enables comparability to prior period performance and trend analysis.

Consolidated Adjusted EBITDA is calculated by taking net income attributable to common stockholders before net income attributable to non-controlling interest, interest expense, net of capitalized interest, changes in the fair value and settlement of our interest rate derivatives, taxes, depreciation and amortization, and adjusting for the effects of certain non-cash items, other non-operating income or expense items, and other items not otherwise predictive or indicative of ongoing operating performance, including the effects of modification or extinguishment of debt, impairment expense and loss on disposal of assets, changes in the fair value of our commodity and foreign currency exchange derivatives and non-cash compensation expense. We believe the exclusion of these items enables investors and other users of our financial information to assess our sequential and year-over-year performance and operating trends on a more comparable basis and is consistent with management’s own evaluation of performance.

Distributable Cash Flow is defined as cash generated from the operations of Cheniere and its subsidiaries and adjusted for non-controlling interest. The Distributable Cash Flow of Cheniere’s subsidiaries is calculated by taking the subsidiaries’ EBITDA less interest expense, net of capitalized interest, interest rate derivatives, taxes, maintenance capital expenditures and other non-operating income or expense items, and adjusting for the effect of certain non-cash items and other items not otherwise predictive or indicative of ongoing operating performance, including the effects of modification or extinguishment of debt, amortization of debt issue costs, premiums or discounts, changes in fair value of interest rate derivatives, impairment of equity method investment and deferred taxes. Cheniere’s Distributable Cash Flow includes 100% of the Distributable Cash Flow of Cheniere’s wholly-owned subsidiaries. For subsidiaries with non-controlling investors, our share of Distributable Cash Flow is calculated as the Distributable Cash Flow of the subsidiary reduced by the economic interest of the non-controlling investors as if 100% of the Distributable Cash Flow were distributed in order to reflect our ownership interests and our incentive distribution rights, if applicable. The Distributable Cash Flow attributable to non-controlling interest is calculated in the same method as Distributions to non-controlling interest as presented on our Statements of Stockholders’ Equity in our Forms 10-Q and Forms 10-K filed with the Securities and Exchange Commission. This amount may differ from the actual distributions paid to non-controlling investors by the subsidiary for a particular period.

We believe Distributable Cash Flow is a useful performance measure for management, investors and other users of our financial information to evaluate our performance and to measure and estimate the ability of our assets to generate cash earnings after servicing our debt, paying cash taxes and expending sustaining capital, that could be used for discretionary purposes such as common stock dividends, stock repurchases, retirement of debt, or expansion capital expenditures. Distributable Cash Flow is not intended to represent cash flows from operations or net income (loss) as defined by U.S. GAAP and is not necessarily comparable to similarly titled measures reported by other companies.

We have not made any forecast of net income on a run rate basis, which would be the most directly comparable financial measure under GAAP, and we are unable to reconcile differences between run rate Distributable Cash Flow and net income.


Contacts

Cheniere Energy, Inc.
Investors
Randy Bhatia, 713-375-5479
Frances Smith, 713-375-5753

Media Relations
Eben Burnham-Snyder, 713-375-5764
Phil West, 713-375-5586

Offshore Source Logo

Offshore Source keeps you updated with relevant information concerning the Offshore Energy Sector.

Any views or opinions represented on this website belong solely to the author and do not represent those of the people, institutions or organizations that Offshore Source or collaborators may or may not have been associated with in a professional or personal capacity, unless explicitly stated.

Corporate Offices

Technology Systems Corporation
8502 SW Kansas Ave
Stuart, FL 34997

info@tscpublishing.com