Business Wire News

NOT FOR DISTRIBUTION TO U.S. NEWSWIRE SERVICES OR FOR DISSEMINATION IN THE U.S.

TORONTO--(BUSINESS WIRE)--Sherritt International Corporation (“Sherritt”, the “Corporation”, the “Company”) (TSX: S), a world leader in the mining and hydrometallurgical refining of nickel and cobalt from lateritic ores, today reported its financial results for the three months and year ended December 31, 2021. All amounts are in Canadian currency unless otherwise noted.

“Our fourth quarter results capped a year of transition for Sherritt as we pivot towards growth and expansion,” said Leon Binedell, President and CEO of Sherritt International Corporation. “Against a backdrop of a global pandemic, continued sanctions against Cuba, and rising input costs, our strong performance in the fourth quarter enabled us to meet our 2021 targets for production and unit costs at each of our business units. Just as significantly, we also embarked on a multi-pronged strategy focused on generating incremental cash flow and transformative growth at a low capital intensity.”

Mr. Binedell added, “Underpinning the progress we made in 2021 were improved nickel and cobalt market fundamentals being driven by the rapid adoption of electric vehicles. With market conditions expected to be bullish in the near term, Sherritt provides favourable exposure to rising nickel prices as one of the few pure play companies. And as we commercialize projects developed by Sherritt Technologies, increase our combined nickel and cobalt production capacity by up to 20%, and extend the mine life of Moa beyond 2040, we expect to significantly grow shareholder value over the coming years.”

SELECTED Q4 2021 DEVELOPMENTS

  • Sherritt’s share of finished nickel and cobalt production at the Moa Joint Venture (Moa JV) were 4,266 tonnes and 476 tonnes, respectively. The totals, which are consistent with historical performance and reflective of efforts to mitigate the impacts of COVID-19 and the 13-day full-facility shutdown experienced in Q3 2021, enabled Sherritt to meets its production guidance at the Moa JV for FY2021(1).
  • Net Direct Cash Cost (NDCC)(2) at the Moa JV was US$3.60/lb, the lowest total since Q4 2018. NDCC in Q4 2021 benefitted from improved cobalt and fertilizer by-product credits offset by significantly higher input costs, including a 146% increase in sulphur prices, 76% increase in natural gas prices and 72% increase in fuel oil prices.
  • Sherritt recognized net earnings from continuing operations of $14.4 million, or $0.04 per share, for Q4 2021 compared to a net loss of $49.3 million, or a loss of $0.12 per share, in Q4 2020. Adjusted EBITDA(2) was $46.4 million, the highest total since Q4 2017 and indicative of improved nickel and cobalt market fundamentals and Sherritt’s continued efforts to reduce costs.
  • In support of the growth strategy announced on November 3, 2021 aimed at growing finished nickel and cobalt production by 15 to 20% of combined totals achieved in FY2021 and extending the life of mine at Moa beyond 2040, the Moa JV completed a feasibility study for a new slurry preparation plant (SPP) and received approval for planned expenditures from its Board of Directors. The SPP, which is estimated to cost US$27 million and be completed in early 2024 will deliver a number of benefits, including reduced ore haulage, lower carbon intensity from mining, and increased annual production of mixed sulphides by approximately 1,700 tonnes commencing in mid-2024.
  • Sherritt outlined its strategic priorities for 2022, which are focused on establishing the Corporation as a leading green metals producer, leveraging its Technologies group for transformational growth, achieving balance sheet strength, being recognized as a sustainable organization, and maximizing the value of its Cuban energy businesses.
  • Dr. Peter Hancock, a mining industry executive with more than 30 years of experience overseeing nickel mining operations, developing and commercializing process technologies, and ramping up nickel projects, was appointed to Sherritt’s Board of Directors.
  • Announced the planned retirement of Chief Operating Officer, Steve Wood, effective April 30, 2022.
  • Sherritt made a number of promotions to its senior leadership to accelerate its multi-pronged growth strategy naming Dan Rusnell Senior Vice President of Metals, Elvin Saruk Head of Growth Projects in addition to his accountabilities for Oil & Gas and Power, and Greg Honig Head of Marketing and the Technologies Group in addition to his accountabilities as Chief Commercial Officer.
  • Sherritt amended its syndicated revolving-term credit facility with its lenders, increasing the maximum amount of credit available to $100 million from $70 million and extending the maturity to April 2024. Under the amended terms, borrowings on the credit facility are available to fund capital as well as for working capital purposes. Spending on capital expenditures cannot exceed $75 million in a fiscal year. Capital expenditure restrictions do not apply to planned spending of Moa Nickel S.A. The increase in credit facility is indicative of Sherritt’s strengthened financial position and favourable outlook in light of improved nickel and cobalt markets.
  • Received US$6.5 million in Cuban energy payments. Sherritt anticipates continued variability in the timing of collections into 2022, and is working with its Cuban partners to ensure timely receipts.
  • Environmental rehabilitation obligations (ERO) held by Sherritt’s Spanish Oil and Gas operations were secured by a parent company guarantee of €31.5 million ($46.7 million) until December 31, 2023. Unlike the $47 million letter of credit issued previously to support the ERO and secured by Sherritt’s credit facility, the new guarantee has no impact on the Corporation’s available liquidity.
   

(1)

Sherritt adjusted its nickel production guidance for 2021 on November 3, 2021 as a result of disruptions caused in the third quarter by the spread of COVID-19, extension of the full-facility shutdown at the refinery in Fort Saskatchewan, Alberta, and unplanned maintenance activities.


(2)

Non-GAAP financial measures. For additional information see the Non-GAAP and other financial measures section of this press release.

SUMMARY OF KEY 2021 DEVELOPMENTS

  • Sherritt ended 2021 with cash and cash equivalents of $145.6 million ($78.9 million held by Energas in Cuba), down from $167.4 million at the end of last year ($75 million held by Energas in Cuba). The lower cash position and amount held in Canada were driven by lower energy payments from Cuban partners on account of their reduced access to foreign currency and by the deferral of distributions expected from the Moa JV in the fourth quarter as it assessed the impact of delays in product deliveries on account of flooding in B.C. and congestion at the Vancouver Port in November. In January 2022, Sherritt received $8.1 million as its share of Moa JV distributions.
  • Sherritt’s share of production, unit costs, and spending on capital for each of its business units in 2021 were in line with guidance for the year, indicative of ongoing commitments to operational excellence and efforts to mitigate the spread of COVID-19 through additional health and safety measures designed to protect employees, suppliers, and other stakeholders at its operations in Canada and Cuba.
  • Sherritt announced it is embarking on an expansion strategy with its Cuban partners to capitalize on the growing demand for high purity nickel and cobalt being driven by the accelerated adoption of electric vehicles which builds on the 26-year successful track record of the Moa Joint Venture and centres on growing annual finished nickel and cobalt production by 15 to 20% from the 34,710 tonnes produced in 2021 and extending the life of mine at Moa beyond 2040 through the conversion of mineral resources into reserves using an economic cut-off grade.
  • Sherritt improved its net earnings from continuing operations by $72.3 million in FY2021 as a result of strengthened nickel, cobalt, and fertilizer prices and efforts to reduce operating and corporate costs. Adjusted EBITDA was $112.2 million, up 188% from last year.
  • Implemented a 10% workforce reduction at Sherritt’s Corporate office in Toronto that will result in a savings of employee costs of approximately $1.3 million annually.
  • Sherritt released its 2020 Sustainability Report that featured a number of upgraded environmental, social, and governance (ESG) targets, including achieving net zero greenhouse emissions by 2050, obtaining 15% of overall energy from renewable sources by 2030, reducing nitrogen oxide emission intensity by 10% by 2024, and increasing the number of women in the workforce to 36% by 2030.
  • Named Leon Binedell as President and CEO, Yasmin Gabriel as Chief Financial Officer, Greg Honig as Chief Commercial Officer, and Chad Ross as Chief Human Resources Officer as part of senior leadership changes. The appointments underscore Sherritt’s two-pronged growth strategy focused on capitalizing on the accelerating demand for high-purity nickel and cobalt from the electric vehicle industry and commercializing innovative process technology solutions for resources companies looking to improve their environmental performance and increase economic value.

DEVELOPMENTS SUBSEQUENT TO THE YEAR END

  • Sherritt received $8.1 million of its share of Moa JV distributions on January 19, 2022. Given prevailing nickel and cobalt prices, planned spending on capital at the Moa JV, and expected liquidity requirements Sherritt anticipates an additional distribution in Q1 2022. Sherritt also expects distributions for FY2022 to be greater than the $35.9 million (excluding re-directions from its Cuban partner, General Nickel Company S.A.) received in FY2021.

Q4 2021 FINANCIAL HIGHLIGHTS


For the three months ended


For the year ended


2021


2020


2021


2020


$ millions, except per share amount

December 31

December 31

Change

December 31

December 31

Change


Revenue

$

36.6


$

28.2


30

%

$

110.2


$

119.8


(8

%)

Combined revenue(1)


198.6


135.9


46

%


612.8


497.0


23

%

Earnings (loss) from operations and joint venture


20.5


(33.9

)

160

%


8.5


(197.1

)

104

%

Net earnings (loss) from continuing operations


14.4


(49.3

)

129

%


(13.4

)


(85.7

)

84

%

Net earnings (loss) for the period


14.1


(49.6

)

128

%


(18.4

)


22.2


(183

%)

Adjusted EBITDA(1)


46.4


10.7


334

%


112.2


38.9


188

%

Net earnings (loss) from continuing operations ($ per share)


0.04


(0.12

)

133

%


(0.03

)


(0.22

)

86

%


Cash (used) provided by continuing operations for operating activities


(13.4

)


12.7


(206

%)


1.3


48.0


(97

%)

Combined free cash flow(1)


(26.4

)


(11.6

)

(128

%)


14.5


17.9


(19

%)

Average exchange rate (CAD/US$)


1.260


1.303


(3

%)


1.254


1.341


(7

%)

    (1)

Non-GAAP financial measures. For additional information see the Non-GAAP and other financial measures section of this press release.

$ millions, as at December 31


2021


2020

Change


Cash and cash equivalents


$

145.6

$

167.4

(13

%)

Loans and borrowings


444.5


441.4

1

%

Cash and cash equivalents at December 31, 2021 were $145.6 million, down from $163.4 million at September 30, 2021. During the quarter, the Moa JV deferred distributions to its partners as it assessed the impact of delays in customer deliveries caused by flooding in B.C. and congestion at the Vancouver port on its expected cash needs. Subsequent to the year end, Sherritt received $8.1 million as its share of Moa JV distributions.

During the quarter, the Corporation received US$6.5 million in Cuban energy payments, which were offset by the interest payment of $14.8 million on the second lien notes and sustaining capital expenditures of $2.9 million.

During 2021, Sherritt received a total of $52.8 million in direct and re-directed distributions from the Moa JV and its partner, General Nickel Company S.A. (GNC).

Total overdue scheduled receivables at December 31, 2021 were US$156 million, up from US$152.5 million at September 30, 2021. Subsequent to year end, Sherritt received US$2.2 million in Cuban energy payments. Collections on overdue amounts from Sherritt’s Cuban energy partners continue to be adversely impacted by Cuba’s access to foreign currency as a result of ongoing U.S. sanctions and the global pandemic. While Sherritt anticipates improved economic conditions in Cuba in 2022, it continues to anticipate variability in the timing and the amount of energy payments in the near term, and continues to work with its Cuban partners to ensure timely receipt of energy payments.

Of the $145.6 million of cash and cash equivalents, $64.2 million was held in Canada, down from $82.1 million at September 30, 2021 and $78.9 million was held at Energas, up from $76.7 million at September 30, 2021. The remaining amounts were held in Cuba and other countries.

Adjusted net earnings (loss) from continuing operations(1)


2021


2020

For the three months ended December 31

$ millions

$/share

$ millions

$/share


Net earnings (loss) from continuing operations


14.4


0.04


(49.3

)


(0.12

)


Adjusting items:


Unrealized foreign exchange (gain) loss - continuing operations


(1.4

)


-


4.3


0.01


Other contractual benefits expense


0.6


-


-


-


Realized and unrealized losses on commodity put options, net


0.1


-


3.4


0.01


Impairment of Power assets


-


-


9.4


0.02


Other(2)


1.3


-


2.3


0.01


Total adjustments, before tax


0.6


-


19.4


0.05


Tax adjustments


(0.2

)


-


(1.8

)


(0.01

)

Adjusted net earnings (loss) from continuing operations


14.8


0.04


(31.7

)


(0.08

)


2021


2020

For the year ended December 31


$ millions


$/share

$ millions

$/share


Net loss from continuing operations


(13.4

)


(0.03

)


(85.7

)


(0.22

)


Adjusting items:


Unrealized foreign exchange gain - continuing operations


(4.7

)


(0.01

)


(4.4

)


(0.01

)

Severance and other contractual benefits expense


6.1


0.02


-


-


Realized and unrealized losses on commodity put options, net


5.6


0.02


3.4


0.01


Gain on repurchase of notes


(2.1

)


(0.01

)


-


-


Gain on debenture exchange


-


-


(142.3

)


(0.36

)

Impairment of Oil assets


-


-


115.6


0.30


Realized foreign exchange gain due to Cuban currency unification


(10.0

)


(0.03

)


-


-


Impairment of Power assets


-


-


9.4


0.03


Other(2)


5.0


0.01


1.7


-


Total adjustments, before tax


(0.1

)


-


(16.6

)


(0.03

)

Tax adjustments


(0.4

)


-


(2.4

)


(0.01

)

Adjusted net loss from continuing operations


(13.9

)


(0.03

)


(104.7

)


(0.26

)

(1)

A non-GAAP financial measure. The tables above summarize some of the key components of Adjusted net earnings (loss) from continuing operations and associated per share amount. For a full reconciliation to net earnings (loss) from continuing operations and additional information see the Non-GAAP and other financial measures section of this press release.

(2)

Other items primarily relate to inventory obsolescence and (gains) losses in net finance (expense) income.

METALS MARKET

Nickel

Nickel prices hit a seven-year high in Q4 2021, climbing to US$9.59/lb on November 24. The price increase was driven by improving market fundamentals, including strong demand from across multiple industries, consumer stockpiling, reduced inventory levels, and ongoing supply disruptions caused by COVID-19. Rising nickel prices and favourable market conditions were jolted by the rapid spread of the Omicron variant and concerns of its impact on the global economy in early December, causing prices to soften slightly through to the end of the quarter. Nickel prices closed the year at US$9.49/lb, representing a 27% increase for 2021 relative to the closing price of 2020 of US$7.50/lb.

Since the start of 2022, nickel prices have sustained their recent momentum, reaching US$10.89/lb on January 21, the highest price in more than 10 years. It is anticipated that nickel prices will maintain their current robustness through the end of 2022 based on forecasts provided by industry analysts.

Strong nickel demand in Q4 was reflected by the continued decrease in inventory levels since the start of 2021. In Q4, nickel inventory levels on the London Metals Exchange (LME) fell by 35% from 157,062 tonnes at the start of the period to 101,886 tonnes on December 31. Similarly, inventory levels on the Shanghai Futures Exchange fell 35% to 2,406 tonnes, down from 3,728 tonnes at the start of the quarter.

Industry analysts, including Wood Mackenzie and S&P Global, have forecast continued strong demand and market tightness through to the end of the 2022. LME nickel inventories continued to decline in 2022, falling below 100,000 tonnes on January 10, reaching 85,644 tonnes on February 9, the lowest level since November 2019.

Visibility of market fundamentals, including inventory levels, in the mid-term is limited given the economic uncertainty caused by the pandemic and news from Indonesia suggesting that the country, one of the world’s largest suppliers of nickel, plans to curtail exports in an effort to support a domestic refining and processing activities.

The long-term outlook for nickel remains bullish on account of the strong demand expected from the stainless steel sector, the largest market for nickel, and the electric vehicle battery market. Some market observers, such as Wood Mackenzie, have forecast a prolonged nickel supply deficit beginning in 2025 due to recent developments in the electric vehicle market and insufficient nickel production coming on stream in the near term.

Over the past year, multiple automakers and governments have announced plans for significant investments to expand electric vehicle production capacity to meet growing demand as well as more aggressive timelines to phase out the sale of internal combustion engines. In 2021, more than 6.5 million plug-in electric vehicles were sold despite the global pandemic. Industry observers estimate that the number of electric vehicles sold in 2022 will grow to 8.6 million units. CRU has forecast that electric vehicles sales will grow to 17.4 million units by 2025.

As a result of its unique properties, high-nickel cathode formulations remain the dominant choice for long-range electric vehicles manufactured by automakers with Class 1 nickel being an essential feedstock in the battery supply chain. Sherritt is particularly well positioned given our Class 1 production capabilities and the fact that Cuba possesses the world’s fourth largest nickel reserves.

Cobalt

Cobalt prices rose steadily in Q4 2021, closing on December 31 at US$33.78/lb, up 30% from US$25.88/lb at the start of the quarter according to data collected by Fastmarkets MB.

Higher cobalt prices in Q4 2021 were primarily driven by increased buying from electric vehicle battery manufacturers. Cobalt is a key component of rechargeable batteries providing energy stability. Higher cobalt prices in Q4 2021 were also impacted by increased stockpiling by consumers and ongoing supply logistics disruptions in South Africa, where cobalt produced in the Democratic Republic of Congo, the source of almost two-thirds of the world’s supply, is sent before being shipped internationally.

Industry observers, such as CRU, expect cobalt prices to continue to be robust in the near term as limited new sources of supply have been announced to fill expected demand over the next five years.

The outlook for cobalt over the long term remains bullish as demand is expected to grow to approximately 280,000 tonnes by 2025, representing a compound annual growth rate of 13.5% according to CRU.

REVIEW OF OPERATIONS

Moa Joint Venture (50% interest) and Fort Site (100%)


For the three months ended


For the year ended


2021


2020


2021


2020


$ millions (Sherritt's share), except as otherwise noted

December 31

December 31

Change

December 31

December 31

Change


FINANCIAL HIGHLIGHTS


Revenue(1)

$

183.2


$

118.8


54

%

$

560.6


$

425.5


32

%

Cost of Sales(1)


142.7


111.3


28

%


451.4


411.7


10

%

Earnings from operations


36.2


4.4


723

%


98.3


3.9


nm(2)

Adjusted EBITDA(3)


49.4


24.8


99

%


152.3


68.7


122

%


CASH FLOW


Cash provided by continuing operations for operating activities

$

8.9


$

13.4


(34

%)

$

90.5


$

53.7


69

%

Free cash flow(3)


0.6


4.1


(85

%)


56.5


24.5


131

%

Dividend distributions from the Moa Joint Venture(4)


-


26.3


(100

%)


35.9


39.6


(9

%)


PRODUCTION VOLUMES (tonnes)


Mixed Sulphides


3,881


4,421


(12

%)


16,498


17,429


(5

%)

Finished Nickel


4,266


4,020


6

%


15,592


15,753


(1

%)

Finished Cobalt


476


451


6

%


1,763


1,685


5

%

Fertilizer


65,021


56,277


16

%


245,059


235,886


4

%


NICKEL RECOVERY(5) (%)


90

%


86

%

4

%


86

%


86

%

-


SALES VOLUMES (tonnes)


Finished Nickel(6)


4,169


4,177


-


15,603


15,687


(1

%)

Finished Cobalt


474


443


7

%


1,775


1,678


6

%

Fertilizer


51,748


48,542


7

%


168,782


187,922


(10

%)


AVERAGE-REFERENCE PRICE (USD)


Nickel (US$ per pound)

$

8.99


$

7.23


24

%

$

8.39


$

6.25


34

%

Cobalt (US$ per pound)(7)


29.89


15.73


90

%


24.34


15.58


56

%


AVERAGE-REALIZED PRICE (CAD)(3)


Nickel ($ per pound)

$

11.16


$

9.13


22

%

$

10.30


$

8.16


26

%

Cobalt ($ per pound)


31.88


17.55


82

%


25.88


17.84


45

%

Fertilizer ($ per tonne)


545.08


298.02


83

%


438.75


343.45


28

%


UNIT OPERATING COST(3) (US$ per pound)


Nickel - net direct cash cost

$

3.60


$

4.47


(19

%)

$

4.11


$

4.20


(2

%)


SPENDING ON CAPITAL(3)


Sustaining

$

12.1


$

9.3


30

%

$

37.7


$

32.2


17

%


$

12.1


$

9.3


30

%

$

37.7


$

32.2


17

%


(1)

Revenue and Cost of sales of Moa Joint Venture and Fort Site is composed of revenue/cost of sales, respectively, recognized by the Moa Joint Venture at Sherritt’s 50% share, which is equity-accounted and included in share of earnings (loss) of Moa Joint Venture, net of tax, and revenue/cost of sales recognized by Fort Site, which is included in consolidated revenue. For a breakdown of revenue between Moa Joint Venture and Fort Site see the Combined revenue section in the Non-GAAP and other financial measures section of this press release.


(2)

Not meaningful (nm).


(3)

Non-GAAP financial measures. For additional information see the Non-GAAP and other financial measures section of this press release.


(4)

Excludes redirections of dividends from Sherritt’s joint venture partner.


(5)

The nickel recovery rate measures the amount of finished nickel that is produced compared to the original nickel content of the ore that was mined.


(6)

For the three months and year ended December 31, 2021, excludes 600 tonnes (50% basis) of finished nickel purchased from and sold to a third party as it was not internally produced.


(7)

Average standard grade cobalt published price per Fastmarkets MB.

Finished production at the Moa JV in the fourth quarter of 2021 resumed to levels consistent with historical performance following the completion of a 13-day full-facility shutdown and unplanned maintenance activities at the refinery, and efforts to mitigate the spread of COVID-19 in Fort Saskatchewan and in the Holguin province of Cuba through the successful rollout of vaccines and additional health and safety measures to protect employees, suppliers and various stakeholders in the third quarter of 2021. Improved results in Q4 relative to performance in Q3 2021 enabled the Moa JV to meet its targets for finished nickel and cobalt production and achieve unit costs that were below target for the year.

Mixed sulphides production at the Moa JV in Q4 2021 was 3,881 tonnes, down 12% from the 4,421 tonnes produced in Q4 2020.


Contacts

For further investor information contact:
Joe Racanelli, Director of Investor Relations
Telephone: (416) 935-2457
Toll-free: 1 (800) 704-6698
E-mail: This email address is being protected from spambots. You need JavaScript enabled to view it.

Sherritt International Corporation
Bay Adelaide Centre, East Tower
22 Adelaide St. West, Suite 4220
Toronto, ON M5H 4E3
www.sherritt.com


Read full story here

BELMONT, N.C.--(BUSINESS WIRE)--Piedmont Lithium Inc. (“Piedmont” or the “Company”) (NASDAQ: PLL; ASX: PLL), a leading, diversified developer of lithium resources required to enable the U.S. electric vehicle supply chain, is pleased to announce the results of its annual meeting of shareholders held virtually on February 3, 2022 (the “Meeting“), at which the shareholders approved all motions put forward by the Company.


A total of 8,520,938 votes were cast in connection with the Company’s proxy, representing 53.69% of the issued and outstanding common shares of the Company.

All resolutions, as outlined in the Company’s proxy statement dated November 30, 2021, available on the Company’s website and at: Form DEF 14A (dd7pmep5szm19.cloudfront.net) were approved by the requisite majority of votes cast at the Meeting. The number of directors is fixed at 6. The two director nominees named in the Proxy Statement were elected to serve until the 2024 Annual Meeting of Stockholders or until their successors are duly elected and qualified.

The other seven resolutions, the appointment of the Auditors, the issuance of stock options to Mr. Keith Phillips under the Company’s Stock Plan, and the issuance of restricted stock units to Mr. Jeff Armstrong, Mr. Keith Phillips, Mr. Todd Hannigan, Mr. Jorge Beristain, Mr. Claude Demby, and Ms. Susan Jones under the Company’s Stock Plan, also passed at the meeting. Details of voting are provided in the tables that follow:

PROPOSAL 1: Election of two (2) Class I director nominees to serve until the 2024 Annual Meeting of Stockholders and until their successors are duly elected and qualified:

NOMINEE

FOR

WITHHOLD

Mr. Keith Phillips

4,080,447

466,300

Mr. Todd Hannigan

4,020,943

525,804

PROPOSAL 2: Ratification of the selection of Deloitte & Touche LLP as the Company’s independent registered public accounting firm for the year ending June 30, 2022:

FOR

AGAINST

ABSTAIN

7,995,679

100,008

425,251

PROPOSAL 3: Approval to issue 10,786 stock options to Mr. Keith Phillips and/or his nominee under the Company’s Stock Plan:

FOR

AGAINST

ABSTAIN

2,789,952

1,272,986

483,809

PROPOSAL 4: Approval to issue 5,344 restricted stock units to Mr. Keith Phillips and/or his nominee under the Company’s Stock Plan:

FOR

AGAINST

ABSTAIN

3,392,760

668,728

485,259

PROPOSAL 5: Approval to issue 1,796 restricted stock units to Mr. Jeff Armstrong and/or his nominee under the Company’s Stock Plan:

FOR

AGAINST

ABSTAIN

2,892,549

1,171,544

482,654

PROPOSAL 6: Approval to issue 1,197 restricted stock units to Mr. Jorge Beristain and/or his nominee under the Company’s Stock Plan:

FOR

AGAINST

ABSTAIN

2,889,924

1,172,087

484,736

PROPOSAL 7: Approval to issue 1,197 restricted stock units to Mr. Todd Hannigan and/or his nominee under the Company’s Stock Plan:

FOR

AGAINST

ABSTAIN

2,891,059

1,170,771

484,917

PROPOSAL 8: Approval to issue 1,197 restricted stock units to Mr. Claude Demby and/or his nominee under the Company’s Stock Plan:

FOR

AGAINST

ABSTAIN

2,891,627

1,171,156

483,964

PROPOSAL 9: Approval to issue 1,197 restricted stock units to Ms. Susan Jones and/or her nominee under the Company’s Stock Plan:

FOR

AGAINST

ABSTAIN

2,895,108

1,167,384

484,255

A replay of the Meeting is available on the Company’s website and at: www.virtualshareholdermeeting.com/PLL2022.

About Piedmont Lithium

Piedmont Lithium (Nasdaq:PLL; ASX:PLL) is developing a world-class, multi-asset, integrated lithium business focused on enabling the transition to a net zero world and the creation of a clean energy economy in North America. The centerpiece of our operations, Carolina Lithium, is located in the renowned Carolina Tin-Spodumene Belt of North Carolina. Combining our U.S. assets with equally strategic and in-demand mineral resources, and production assets in Quebec and Ghana, positions us to be one of the largest, lowest cost, most sustainable producers of battery-grade lithium hydroxide in the world. We will also be the most strategically located to best serve the fast-growing North American electric vehicle supply chain. The unique geology, geography and proximity of our resources, production operations and customer base, will allow us to deliver valuable continuity of supply of a high-quality, sustainably produced lithium hydroxide from spodumene concentrate, preferred by most EV manufacturers. Our diversified operations will enable us to play a pivotal role in supporting America’s move toward decarbonization and the electrification of transportation and energy storage. For more information, visit www.piedmontlithium.com.

Forward Looking Statements

This press release contains forward-looking statements within the meaning of or as described in securities legislation in the United States and Australia, including statements regarding exploration, development, and construction activities; current plans for Piedmont’s mineral and chemical processing projects; strategy; and expectations regarding permitting. Such forward-looking statements involve substantial and known and unknown risks, uncertainties, and other risk factors, many of which are beyond our control, and which may cause actual timing of events, results, performance or achievements and other factors to be materially different from the future timing of events, results, performance, or achievements expressed or implied by the forward-looking statements. Such risk factors include, among others: (i) that Piedmont will be unable to commercially extract mineral deposits, (ii) that Piedmont’s properties may not contain expected reserves, (iii) risks and hazards inherent in the mining business (including risks inherent in exploring, developing, constructing and operating mining projects, environmental hazards, industrial accidents, weather or geologically related conditions), (iv) uncertainty about Piedmont’s ability to obtain required capital to execute its business plan, (v) Piedmont’s ability to hire and retain required personnel, (vi) changes in the market prices of lithium and lithium products, (vii) changes in technology or the development of substitute products, (viii) the uncertainties inherent in exploratory, developmental and production activities, including risks relating to permitting, zoning and regulatory delays related to our projects as well as the projects of our partners in Quebec and Ghana, (ix) uncertainties inherent in the estimation of lithium resources, (x) risks related to competition, (xi) risks related to the information, data and projections related to Sayona Quebec and Atlantic Lithium, (xii) occurrences and outcomes of claims, litigation and regulatory actions, investigations and proceedings, (xiii) risks regarding our ability to achieve profitability, enter into and deliver product under supply agreements on favorable terms, our ability to obtain sufficient financing to develop and construct our projects, our ability to comply with governmental regulations and our ability to obtain necessary permits, and (xiv) other uncertainties and risk factors set out in filings made from time to time with the U.S. Securities and Exchange Commission (“SEC”) and the Australian Securities Exchange, including Piedmont’s most recent filings with the SEC. The forward-looking statements, projections and estimates are given only as of the date of this presentation and actual events, results, performance, and achievements could vary significantly from the forward-looking statements, projections and estimates presented in this presentation. Readers are cautioned not to put undue reliance on forward-looking statements. Piedmont disclaims any intent or obligation to update publicly such forward-looking statements, projections, and estimates, whether as a result of new information, future events or otherwise. Additionally, Piedmont, except as required by applicable law, undertakes no obligation to comment on analyses, expectations or statements made by third parties in respect of Piedmont, its financial or operating results or its securities.

This announcement has been authorized for release by the Company’s President & CEO, Keith D. Phillips.

Appendix - Results of Annual Meeting of Shareholders

Piedmont Lithium Inc.
Annual General Meeting – 3 February 2022

The following information is provided in accordance with ASX Listing Rule 3.13.2:

Resolution

Number of Proxy Votes

Number of Votes cast on the Poll

Result

For

Against

Abstain

Proxy's discretion

For

Against

Abstain

1.1 Election of Mr Keith Phillips

4,080,447

N/A

466,300

-

4,080,447

N/A

466,300

Vote carried by poll

1.2 Election of Mr Todd Hannigan

4,020,943

N/A

525,804

-

4,020,943

N/A

525,804

Vote carried by poll

2. Ratification of Auditor Selection

7,995,679

100,008

425,521

-

7,995,679

100,008

425,521

Vote carried by poll

3. Approval to issue stock options – Mr Keith Phillips

2,789,952

1,272,986

483,809

-

2,789,952

1,272,986

483,809

Vote carried by poll

4. Approval to issue restricted stock units – Mr Keith Phillips

3,392,760

668,728

485,259

-

3,392,760

668,728

485,259

Vote carried by poll

5. Approval to issue restricted stock units – Mr Jeff Armstrong

2,892,549

1,171,087

482,654

-

2,892,549

1,171,087

482,654

Vote carried by poll

6. Approval to issue restricted stock units – Mr Jorge Beristain

2,889,924

1,172,087

484,736

-

2,889,924

1,172,087

484,736

Vote carried by poll

7. Approval to issue restricted stock units – Mr Todd Hannigan

2,891,059

1,170,771

484,917

-

2,891,059

1,170,771

484,917

Vote carried by poll

8. Approval to issue restricted stock units – Mr Claude Demby

2,891,627

1,171,156

483,964

-

2,891,627

1,171,156

483,964

Vote carried by poll

9. Approval to issue restricted stock units – Ms Susan Jones

2,895,108

1,167,384

484,255

-

2,895,108

1,167,384

484,255

Vote carried by poll


Contacts

Keith Phillips
President & CEO
T: +1 973 809 0505
E: This email address is being protected from spambots. You need JavaScript enabled to view it.

Brian Risinger
VP - Investor Relations and Corporate Communications
T: +1 704 910 9688
E: This email address is being protected from spambots. You need JavaScript enabled to view it.

  • Viston’s premium cash offer progressing through key regulatory milestones
  • Hart-Scott-Rodino Act wait period expired on February 4, 2022 representing a critical milestone achievement under U.S. antitrust law
  • Investment Canada Act initial review period also lapsed on February 3, 2022 with no national security related notice being issued, allowing the Offer under Canadian foreign investment rules to proceed

TORONTO--(BUSINESS WIRE)--Viston United Swiss AG (“Viston”) and its indirect, wholly-owned subsidiary, 2869889 Ontario Inc. (the “Offeror”) today announced completion of two key regulatory milestones in its premium cash offer (the “Offer”) to acquire all of the issued and outstanding common shares (the “Common Shares”) of Petroteq Energy Inc. (“Petroteq”) (TSX-V:PQE; OTC:PQEFF; FSE:PQCF). All financial information in this news release is presented Canadian dollars.

Viston is pleased to announce that the Hart-Scott-Rodino Act (“HSR Act”) waiting period expired on February 4, 2022. The HSR Act is a key U.S. antitrust act that enables the Federal Trade Commission (FTC) and Department of Justice (DOJ) to review proposed merger transactions by requiring the parties to observe a waiting period before closing their transaction. If the FTC or DOJ decides to investigate, the waiting period can be extended for a substantial amount of time. Expiry of the HSR Act waiting period is therefore a critical milestone in completing the Offer.

Viston is also pleased to announce that the initial review period under the Investment Canada Act has also lapsed without any national security related notice being issued. The Investment Canada Act governs foreign investment in Canadian companies and therefore is another critical regulatory milestone.

Reminder to Petroteq Shareholders

Shareholders are reminded:

  • Viston’s premium, all cash Offer is set to expire on February 28, 2022 at 5:00 p.m. (Toronto time). Only by tendering can shareholders avail themselves of the $0.74 cash consideration which represents a 279% premium to the closing price on the TSX-V on the last trading day prior to the trading halt imposed by the TSX-V in August 2021, and a 1,032% premium to the 52-week volume weighted average trading price on the TSX-V prior to the German voluntary public purchase offer made in April 2021.
  • The Board of Directors of Petroteq has unanimously recommended that shareholders tender their Common Shares and has publicly announced that each of the Directors has indicated their intention to tender their own Common Shares to the Offer.
  • Shareholders that hold Petroteq Common Shares through a broker or other financial intermediary should be aware that intermediaries often have internal deadlines several days in advance of the expiry date. Therefore shareholders are encouraged to tender today.

For More Information and How to Tender Shares to the Offer

Shareholders who hold Common Shares through a broker or intermediary should promptly contact them directly and provide their instructions to tender to the Offer, including any U.S. dollar currency election. Registered shareholders that hold Common Shares in their own name need to complete a Letter of Transmittal and send, along with share certificates or DRS statements to the Depositary at the address listed on the Letter of Transmittal.

For assistance or to ask any questions, Shareholders should visit www.petroteqoffer.com or contact Kingsdale Advisors, the Information Agent and Depositary in connection with the Offer, within North America toll-free at 1-866-581-1024, outside North America at 1-416-867-2272 or by e-mail at This email address is being protected from spambots. You need JavaScript enabled to view it..

About the Offeror

The Offeror is an indirect, wholly-owned subsidiary of Viston, a Swiss company limited by shares (AG) established in 2008 under the laws of Switzerland. The Offeror was established on September 28, 2021 under the laws of the Province of Ontario. The Offeror’s registered office is located at 100 King Street West, Suite 1600, 1 First Canadian Place, Toronto, Ontario, Canada M5X 1G5. The registered and head office of Viston is located at Haggenstreet 9, 9014 St. Gallen, Switzerland.

Viston was created to invest in renewable energies and clean technologies, as well as in the environmental protection industry. Viston aims to foster innovative technologies, environmentally-friendly and clean fossil fuels and to help shape the future of energy. Since October 2008, Viston has undertaken its research, development and transfer initiatives in Saint Gallen, Switzerland. Viston has been working to optimize and adapt these technologies to current market requirements to create well-engineered products. Viston’s work also includes the determination of technical and economic risks, as well as the search for financing opportunities.

Caution Regarding Forward-Looking Statements

Certain statements contained in this news release contain “forward-looking information” and are prospective in nature. Forward-looking information is not based on historical facts, but rather on current expectations and projections about future events, and are therefore subject to risks and uncertainties that could cause actual results to differ materially from the future results expressed or implied by the forward-looking information. Often, but not always, forward-looking information can be identified by the use of forward-looking words such as “plans”, “expects”, “intends”, “anticipates”, or variations of such words and phrases or statements that certain actions, events or results “may”, “could”, “should”, “would”, “might” or “will” be taken, occur or be achieved. Forward looking information contained in this news release includes, but is not limited to, statements relating to regulatory approvals; expectations relating to the Offer; and the satisfaction or waiver of the conditions to consummate the Offer. Although the Offeror and Viston believe that the expectations reflected in such forward-looking information are reasonable, such statements involve risks and uncertainties, and undue reliance should not be placed on such statements. Certain material factors or assumptions are applied in making forward-looking information, and actual results may differ materially from those expressed or implied in such statements. Important factors that could cause actual results, performance or achievements of the Offeror or the completion of the Offer to differ materially from any future results, performance or achievements expressed or implied by such forward-looking information include, among other things, the ultimate outcome of any possible transaction between Viston and Petroteq, including the possibility that Petroteq will not accept a transaction with Viston or enter into further discussions regarding a possible transaction, actions taken by Petroteq, actions taken by security holders of Petroteq in respect of the Offer, that the conditions of the Offer may not be satisfied or waived by Viston at the expiry of the Offer period, the ability of the Offeror to acquire 100% of the Common Shares through the Offer, the ability to obtain other regulatory approvals and meet other closing conditions to any possible transaction, including any necessary shareholder approvals, potential adverse reactions or changes to business relationships resulting from the announcement, pendency or completion of the Offer transaction or any subsequent transaction, competitive responses to the announcement or completion of the Offer, unexpected costs, liabilities, charges or expenses resulting from the proposed transaction, exchange rate risk related to the financing arrangements, litigation relating to the proposed transaction, the inability to engage or retain key personnel, any changes in general economic and/or industry-specific conditions, industry risk, risks inherent in the running of the business of the Offeror or its affiliates, legislative or regulatory changes, Petroteq’s structure and its tax treatment, competition in the oil & gas industry, obtaining necessary approvals, financial leverage for additional funding requirements, capital requirements for growth, interest rates, dependence on skilled staff, labour disruptions, geographical concentration, credit risk, liquidity risk, changes in capital or securities markets and that there are no inaccuracies or material omissions in Petroteq’s publicly available information, and that Petroteq has not disclosed events which may have occurred or which may affect the significance or accuracy of such information. These are not necessarily all of the important factors that could cause actual results to differ materially from those expressed in any of the Offeror’s forward-looking information. Other unknown and unpredictable factors could also impact its results. Many of these risks and uncertainties relate to factors beyond the Offeror’s ability to control or estimate precisely. Consequently, there can be no assurance that the actual results or developments anticipated by the Offeror will be realized or, even if substantially realized, that they will have the expected consequences for, or effects on, the Offeror, its future results and performance. Forward-looking information in this news release is based on the Offeror and Viston’s beliefs and opinions at the time the information is given, and there should be no expectation that this forward-looking information will be updated or supplemented as a result of new information, estimates or opinions, future events or results or otherwise, and each of the Offeror and Viston disavows and disclaims any obligation to do so except as required by applicable Law. Nothing contained herein shall be deemed to be a forecast, projection or estimate of the future financial performance of the Offeror or any of its affiliates or Petroteq. Unless otherwise indicated, the information concerning Petroteq contained herein has been taken from or is based upon Petroteq’s and other publicly available documents and records on file with the Securities Regulatory Authorities and other public sources at the time of the Offer. Although the Offeror and Viston have no knowledge that would indicate that any statements contained herein relating to Petroteq, taken from or based on such 5 documents and records are untrue or incomplete, neither the Offeror, Viston nor any of their respective officers or directors assumes any responsibility for the accuracy or completeness of such information, or for any failure by Petroteq to disclose events or facts that may have occurred or which may affect the significance or accuracy of any such information, but which are unknown to the Offeror and Viston.

Additional Information

This news release relates to a tender offer which Viston, through the Offeror, has made to Shareholders. The Offer is being made pursuant to a tender offer statement on Schedule TO (including the Offer to Purchase and Circular, the Notice of Variation and Extension, the letter of transmittal and other related offer documents) initially filed by Viston on October 25, 2021, and as subsequently amended. These materials, as may be amended from time to time, contain important information, including the terms and conditions of the Offer. Subject to future developments, Viston (and, if applicable, Petroteq) may file additional documents with the SEC. This press release is not a substitute for any tender offer statement, recommendation statement or other document Viston and/or Petroteq may file with the SEC in connection with the proposed transaction. This communication does not constitute an offer to buy or solicitation of an offer to sell any securities. Investors and security holders of Petroteq are urged to read the tender offer statement (including the Offer to Purchase and Circular, the Notice of Variation and Extension, the letter of transmittal and other related offer documents) and any other documents filed with the SEC carefully in their entirety if and when they become available as they will contain important information about the proposed transaction. Any investors and security holders may obtain free copies of these documents (if and when available) and other documents filed with the SEC by Viston through the web site maintained by the SEC at www.sec.gov or by contacting Kingsdale Advisors, the Information Agent and Depositary in connection with the offer, within North America toll-free at 1-866-581-1024, outside North America at 1-416-867-2272 or by e-mail at This email address is being protected from spambots. You need JavaScript enabled to view it..


Contacts

Media inquiries:
Hyunjoo Kim
Director, Communications, Marketing and Digital Strategy
Kingsdale Advisors
Phone: 416-867-2357
Email: This email address is being protected from spambots. You need JavaScript enabled to view it.

For assistance in depositing Petroteq Common Shares to the Offer, please contact:
Kingsdale Advisors
130 King Street West, Suite 2950
Toronto, ON M5X 1E2
North American Toll Free: 1-866-581-1024
Outside North America: 1-416-867-2272
Email: This email address is being protected from spambots. You need JavaScript enabled to view it.
www.petroteqoffer.com

AUSTIN, Texas--(BUSINESS WIRE)--#ghgemissions--SeekOps Inc., the technology innovator whose best-in-class sensors and actionable analytics deliver accurate methane emissions quantification, and Flylogix, provider of record-breaking long-range Unmanned Aerial Vehicles (UAVs) have expanded their strategic partnership.


For the past two years, the SeekOps/Flylogix team have conducted multiple successful emissions surveys on the United Kingdom Continental Shelf (UKCS). Sponsored by the Net Zero Technology Centre (NZTC), the team demonstrated top-down methane emissions measurements safely and efficiently for a number of remote offshore platforms, highlighting an industry-best minimum detection level of 2.5 kg/hr. Both companies are now building upon the validation of those surveys to expand coverage across the rest of the UKCS, as well as exclusively deploying UAV missions to the Norwegian Continental Shelf and the Dutch and Danish sectors of the North Sea.

Iain Cooper, CEO at SeekOps said: "With their proven capabilities to effectively deploy our unique sensor consistently, repeatedly, and cost-effectively on facilities for bp, TotalEnergies, Shell, Equinor, TAQA and Harbour Energy, we are very excited to extend our collaboration into a wider range of territories, enabling more operators and assets to accurately quantify and report their emissions as they move toward satisfying the requirements of the Oil and Gas Methane Partnership (OGMP) 2.0 framework. We already have plenty of flights scheduled this year, and we look forward to jointly helping our customers in their decarbonisation efforts.”

Charles Tavner, Executive Chairman at Flylogix said : "When it comes to emissions, you can’t manage what you can’t measure. And so SeekOps’ ability to quantify the invisible, and our use of long-range unmanned systems to change the paradigm on collecting data in remote environments with minimum personnel or operational disruption is a potential game-changer for the energy industry. Delivering business-critical information from remote environments is what Flylogix was founded to do, and so it has been a real privilege to work in partnership with a similarly pioneering organisation such as SeekOps.”

Notes:

SeekOps

SeekOps Inc. deploys advanced sensor technology to detect, localize, and quantify natural gas emissions through integrated drone-based systems. SeekOps latest SeekIR sensors allow business and industry to meet rigorous operational and regulatory demands while safeguarding resources. SeekOps are headquartered in Austin, Texas, with a European office in Aberdeen.

Flylogix

At Flylogix, we are bringing together artificial intelligence, satellite communication and low-cost electronics to develop a new generation of smaller, more efficient, unmanned aircraft. We use these to transform remote operations, dramatically reducing carbon emissions, improving safety and providing new cost-effective solutions. Flylogix is a privately-owned business founded in 2015, and based in Fareham, UK.


Contacts

Paul Khuri, SeekOps VP Business Development, on +1 512-852-8100 or This email address is being protected from spambots. You need JavaScript enabled to view it.

Chris Adams, Flylogix Commercial Director, on +44 (0)7779 696 833 or This email address is being protected from spambots. You need JavaScript enabled to view it.

IWATA, Japan--(BUSINESS WIRE)--Yamaha Motor Co., Ltd. (TOKYO:7272) announces its consolidated business results for the full 2021 fiscal year.


Net sales were 1,812.5 billion yen (an increase of 341.2 billion yen or 23.2% compared with the previous fiscal year) and operating income was 182.3 billion yen (an increase of 100.7 billion yen or 123.3%). Ordinary income was 189.4 billion yen (an increase of 101.7 billion yen or 116.0%) and net income attributable to owners of parent was 155.6 billion yen (an increase of 102.5 billion yen or 193.1%). These represent the Company’s highest figures ever for net sales and income. For the fiscal year, the U.S. dollar traded at 110 yen (a depreciation of 3 yen from the previous fiscal year) and the euro at 130 yen (a depreciation of 8 yen).

Thanks to higher unit sales as well as the increase in unit purchase prices, net sales increased despite the impacts of lower production, labor shortages, and more brought on by the supply shortage of semiconductors and other parts. Operating income rose significantly in part due to the increase in sales but also due to the curbing of fixed costs through the implementation of remote work and other digital methods, foreign exchange impacts, and other factors working to absorb the effects of soaring logistics costs and raw material prices.

Forecast of Consolidated Business Results for the Fiscal Year Ending December 31, 2022

Net Sales

2,000 billion yen
(an increase of 187.5 billion yen or 10.3% from FY2021)

Operating Income

190.0 billion yen
(an increase of 7.7 billion yen or 4.2% from FY2021)

Ordinary Income

190.0 billion yen
(an increase of 0.6 billion yen or 0.3% from FY2021)

Net Income Attributable to Owners of Parent


130.0 billion yen
(a decrease of 25.6 billion yen or down 16.4% compared with FY2021)

These forecast figures are based on the U.S. dollar trading at 113 yen during the fiscal year (a depreciation of 3 yen from FY2021) and the euro at 128 yen (an appreciation of 2 yen).


Contacts

Naoto Horie
Corporate Communication Division
Global PR Team
Yamaha Motor Co., Ltd.
TEL: +81(0)3-5220-7211
This email address is being protected from spambots. You need JavaScript enabled to view it.

NEW YORK--(BUSINESS WIRE)--ATL Partners (“ATL”) and British Columbia Investment Management Corporation (“BCI”) announced today that they have entered into a definitive agreement to sell Pilot Freight Services (“Pilot”), a leading global provider of end-to-end and last mile solutions specializing in big and bulky B2C and B2B freight, to A.P. Moller - Maersk (“Maersk”) for approximately $1.7 billion in cash consideration.

ATL and BCI acquired Pilot in 2016 after identifying a structural shortage in capacity required to meet the needs of shippers and consumers, which was created by the rapid secular growth in the big and bulky segment of e-commerce home delivery and installation. ATL and BCI partnered with management to build Pilot from a family-owned business into the second-largest provider of B2C home delivery in the United States by investing in technology, sales, and operations and acquiring additional capabilities to meet shippers’ needs. Pilot has grown from approximately $28 million of adjusted EBITDA and 800 employees in 2016 to an estimated $127 million of adjusted EBITDA and over 2,600 employees in 2021. Under the ownership of ATL and BCI, Pilot invested over $70 million in technology and data science to enhance and automate decision making and improve productivity. Pilot further accelerated its organic growth through investments in sales personnel and a strategic focus on growing its e-commerce business segments.

To complement strong organic growth, Pilot successfully completed the acquisitions of seventeen franchisees, enhancing operational control and service levels, and completed the acquisitions of three third-party businesses to add capabilities and differentiate Pilot’s service offering. To expand its e-commerce delivery offering, Pilot built out a best-in-class last mile home delivery solution through the acquisitions of Manna Freight Systems in 2018 and DSI Logistics in 2021. Pilot significantly expanded its middle mile capabilities through the acquisition of American Linehaul Corporation in 2021, further differentiating Pilot’s market leading position with an integrated expedited ground network, enabling superior service levels and consistent access to capacity.

We are appreciative and proud of the partnership we’ve had with the Pilot team in successfully executing on the vision of creating a differentiated, market leader to meet the growing e-commerce demand for big and bulky goods,” said Kirby Fine, Partner at ATL Partners. “ATL’s investment process centers around developing an investment theme over multiple years and partnering with a strong founder or management team to execute on that vision. It has been extremely rewarding to work closely with the talented team at Pilot and our partners at BCI, and we look forward to their continued success with Maersk.”

The Pilot team has executed on a range of business improvements and growth initiatives over the past several years, substantially increasing the value of Pilot, and generating significant proceeds for our pension plan and insurance clients,” said Jason Cawley, Senior Managing Director, Private Equity at BCI. “Pilot represented the first co-sponsor investment for BCI’s Private Equity strategy. We have enjoyed a fulfilling partnership with ATL and the distinguished management team at Pilot during this investment. We wish Pilot ongoing success in the future.”

Zach Pollock, CEO of Pilot said, “It has been a privilege to partner with ATL and BCI. They had incredible foresight on where to focus our efforts and investments, and without their guidance, Pilot would not be the company it is today. I am extremely proud of the amazing accomplishments of the entire Pilot organization. We are excited to be joining Maersk and for the significant opportunities this new chapter brings.”

The transaction is subject to regulatory review and approval which is expected to be obtained by Q2 2022. Pilot and Maersk will operate as independent businesses and run their operations as usual until that time.

Harris Williams and Morgan Stanley & Co. LLC served as financial advisors and Gibson, Dunn & Crutcher LLP served as legal counsel to Pilot.

About ATL Partners

Founded in 2014, ATL Partners is a premier sector-focused private equity firm that invests in aerospace, transportation and logistics companies. ATL brings deep sector expertise to its investment approach with ten investment professionals and seven Executive Board members who have decades of combined operating experience in each of ATL’s core sectors. For more information about ATL Partners, visit www.atlpartners.com.

About BCI

With C$199.6 billion of assets under management as of March 31, 2021, British Columbia Investment Management Corporation (BCI) is one of Canada’s largest institutional investors. Based in Victoria, British Columbia, BCI is a long-term investor that invests across a range of asset classes: fixed income; public equities; private equity; infrastructure; renewable resources; real estate; and commercial mortgages. BCI’s clients include public sector pension plans, insurance, and special purpose funds. BCI’s private equity program, with C$20.7 billion of assets under management, has a well-diversified portfolio comprised of direct and fund investments. The team brings industry expertise across financial and business services, healthcare, industrials, consumer, and TMT sectors. For more information about BCI, please visit www.bci.ca.

About Pilot Freight Services

Pilot Freight Services is an award-winning full-service transportation and logistics provider with 87 locations throughout North America. Pilot also has several locations in Western Europe and a presence in the Asia-Pacific marketplace. The company’s freight forwarding services encompass every mode of transportation, including air, ground and ocean, serving all corners of the globe. Pilot’s full mile and final mile home delivery solutions for heavy and hard to handle goods include value-added service offerings such as white glove, assembly and installation. Pilot’s logistics programs offer a complete line of expedited and time-definite services, international shipping solutions, product warehousing and inventory management. Learn more about Pilot Freight Services at www.PilotDelivers.com.


Contacts

For ATL Partners
Nathaniel Garnick
Gasthalter & Co.
T: (212) 257-4170

For BCI
Gwen-Ann Chittenden
Vice President, Corporate Stakeholder Engagement, BCI
This email address is being protected from spambots. You need JavaScript enabled to view it.

With over 3GW of deployed projects globally, Ecoppia’s unmatched solutions portfolio continues to be the leading choice of tier-1 energy players

TEL AVIV, Israel--(BUSINESS WIRE)--#Ecoppia--Ecoppia (TASE: ECPA), the world’s leader in robotic cleaning solutions for photovoltaic solar, announced today another project of 150MW with Sprng Energy, a company owned by the global leading investment platform Actis. Ecoppia robots will be deployed at Sprng Solar’s Ananthapuram project in Andhra Pradesh in Q2 2022.


Actis had initially engaged with Ecoppia back in 2017, installing the fully autonomous robots at 4 different solar sites of its platform-‘Ostro Energy’. Since then, in the last 5 years, Ecoppia’s unparalleled product performance has ensured that all subsequent greenfield solar projects developed by Actis platforms in India, has Ecoppia as their exclusive robotic cleaning solution provider.
Ecoppia’s unmatched reliability and proven effectiveness in soiling removal, is one of the many reasons, Actis’ assets are viewed as technologically superior, low risk, and of a high quality.
During 2020 and 2021, India witnessed over 150 days of national lockdown, resulting in most developers struggling to get solar panels cleaned and properly producing energy. However, none of Ecoppia’s +2GW sites missed even a single day’s cleaning cycle, thanks to its highly reliable, fully autonomous robotic solutions catered by Ecoppia’s strong India team.

For almost a decade, Ecoppia has been innovating the solar market with over 3GW of projects in 4 different continents, allowing site owners to enjoy the benefits of a year-round peak performance while lowering their O&M expenses and overall, their LCOE.

“We are honored to be chosen once again by our valued partner Actis” said Jean Scemama, CEO of Ecoppia. “As market leaders, we take upon ourselves the responsibility to our clients and shareholders to maintain the highest standards, constantly raising the bar higher towards excellency. Ecoppia’s versatile solution portfolio will continue to provide worldwide energy players the key for scalability, sustainability and attractive ROI” he concluded.

About Ecoppia

With over 16GW of agreements, Ecoppia (TASE: ECPA) is a pioneer and world leader in robotic solutions for photovoltaic solar. Ecoppia’s cloud-based, water-free, autonomous robotic solutions remove soil from solar panels daily, leveraging sophisticated technology and advanced Business Intelligence capabilities. Remotely managed and controlled, the Ecoppia platform allows solar sites to maintain peak performance with minimal costs and human intervention. Ecoppia’s proprietary algorithms and robotic solutions make day-to-day O&M at solar sites safer, more efficient and more reliable. Publicly held and backed by prominent international investment funds, Ecoppia works with the largest energy companies across the globe, cleaning millions of solar panels every day. For more information, visit: www.ecoppia.com


Contacts

Anat Cohen Segev
VP Marketing, Ecoppia
This email address is being protected from spambots. You need JavaScript enabled to view it.

DUBLIN--(BUSINESS WIRE)--The "Nonresidential Green Buildings Global Market Report 2022" report has been added to ResearchAndMarkets.com's offering.


The global non-residential green buildings market is expected to grow from $859.52 billion in 2021 to $951.77 billion in 2022 at a compound annual growth rate (CAGR) of 10.7%. The market is expected to reach $1354.59 billion in 2026 at a CAGR of 9.2%.

Major players in the market are Turner Corp.; Clark Construction; AECOM; Swinerton; Hensel Phelps; Skanska; Whiting-Turner Contracting Co.; Holder Construction; Webcor; Walsh Group.

The non-residential green buildings market consists of sales of non-residential green buildings. Green Buildings, in its design, construction or operation, have minimal or no negative impacts on environment and climate but have positive impacts by preserving precious natural resources and improve the quality of life.

This practice creates and uses healthier and more resource-efficient models of construction, renovation, operation, maintenance and demolition. The market consists of revenue generated by the companies and people by the sale of non-residential green buildings.

Asia Pacific is the largest region in the nonresidential green buildings market in 2021. Eastern Europe is expected to be the fastest-growing region in the forecast period. The regions covered in this report are Asia-Pacific, Western Europe, Eastern Europe, North America, South America, Middle East and Africa.

Increased need for sustainable and eco-friendly solutions contributed to the growth of the non-residential green building market. According to the USGBC (U.S. Green Building Council) report, green buildings can reduce carbon emission by 34% and consume 25% less energy than the conventional buildings.

Encouraging sustainable business practices is an important reason for building green in most countries for conservation of energy and protecting natural resources. Moreover, increased concerns of global warming resulted in sustainable and eco-friendly activities increased the demand for Non-residential green building market.

Living roofs or green roofs is increasingly being implemented in green buildings. A green roof is a roof of a building that is covered with vegetation and soil, or a growing medium, planted over a waterproofing membrane. Green roofs last longer when compared to conventional roofs.

They also reduce energy costs with natural insulation, reduce the temperatures (heat and cold) by absorbing and trapping them, and reduce storm water runoff, filters pollutants and carbon dioxide out of the air and increase wildlife habitat in built-up areas. It is believed that to reduce the ambient temperature of the city by 2%, then 8% of roofing in the city must be greener.

In the USA, around 25 cities have some sort of program to encourage green roofs and in Portland, Ore, it is mandatory to have vegetation cover 100% of the roofs on buildings in the central city over 20,000 square feet (with some exceptions). Therefore, green roof is an emerging trend in nonresidential green building market.

Key Topics Covered:

1. Executive Summary

2. Nonresidential Green Buildings Market Characteristics

3. Nonresidential Green Buildings Market Trends And Strategies

4. Impact Of COVID-19 On Nonresidential Green Buildings

5. Nonresidential Green Buildings Market Size And Growth

5.1. Global Nonresidential Green Buildings Historic Market, 2016-2021, $ Billion

5.1.1. Drivers Of The Market

5.1.2. Restraints On The Market

5.2. Global Nonresidential Green Buildings Forecast Market, 2021-2026F, 2031F, $ Billion

5.2.1. Drivers Of The Market

5.2.2. Restraints On the Market

6. Nonresidential Green Buildings Market Segmentation

6.1. Global Nonresidential Green Buildings Market, Segmentation By Product, Historic and Forecast, 2016-2021, 2021-2026F, 2031F, $ Billion

  • Interior Products
  • Exterior Products

6.2. Global Nonresidential Green Buildings Market, Segmentation By Application, Historic and Forecast, 2016-2021, 2021-2026F, 2031F, $ Billion

  • Office
  • Education
  • Hotels and Restraurants
  • Retail
  • Institutional/ Assembly
  • Healthcare
  • Warehouse

6.3. Global Nonresidential Green Buildings Market, Segmentation By Component, Historic and Forecast, 2016-2021, 2021-2026F, 2031F, $ Billion

  • Roofing
  • Insulation
  • Framing
  • Exterior Siding
  • Interior Finishing
  • Others

7. Nonresidential Green Buildings Market Regional And Country Analysis

7.1. Global Nonresidential Green Buildings Market, Split By Region, Historic and Forecast, 2016-2021, 2021-2026F, 2031F, $ Billion

7.2. Global Nonresidential Green Buildings Market, Split By Country, Historic and Forecast, 2016-2021, 2021-2026F, 2031F, $ Billion

Companies Mentioned

  • Turner Corp.
  • Clark Construction
  • AECOM
  • Swinerton
  • Hensel Phelps
  • Skanska
  • Whiting-Turner Contracting Co.
  • Holder Construction
  • Webcor
  • Walsh Group
  • Gilbane Building Co.
  • Suffolk Construction
  • landlease

For more information about this report visit https://www.researchandmarkets.com/r/blo1fs


Contacts

ResearchAndMarkets.com
Laura Wood, Senior Press Manager
This email address is being protected from spambots. You need JavaScript enabled to view it.
For E.S.T Office Hours Call 1-917-300-0470
For U.S./CAN Toll Free Call 1-800-526-8630
For GMT Office Hours Call +353-1-416-8900

  • Nord Stream 2 pipeline seen critically by German majority

HOLZMINDEN, Germany--(BUSINESS WIRE)--#energy--Almost 80 percent of Germans want to gradually make the country independent of energy imports from Russia. 74 percent consider it important to become independent of gas imports - for example delivered via the Nord Stream 2 pipeline. Renewable energies should be expanded more quickly. These are the findings of the new “Energy Trend Survey 2022” by Stiebel Eltron. In February 2022, a market research institute conducted a representative survey of 1,000 German citizens on behalf of the company.


Germany imports more than half of its natural gas from Russia. The German government wants to reduce this dependence though and make greater use of other import options in future.

"Only with the use of green energy will we hit our climate targets," says Kai Schiefelbein, Managing Director of Green Tech manufacturer Stiebel Eltron, which commissioned the Energy Trend Survey 2022. The current results show: For 70 percent of consumers, the goal of making Germany climate-neutral by 2045 is seen as important or very important. Electricity from renewable energies will by then be the central energy source. 71 percent of respondents say switching from fossil fuel combustion to electricity is important to them.

In Germany, around 42 percent of the electricity that comes out of the socket is already generated by renewable sources. According to latest plans of the new government coalition, expansion of renewables is to be accelerated quickly. The goal is to achieve an 80 percent share of renewable energies in gross electricity demand by 2030.

About Stiebel Eltron

Stiebel Eltron is one of the world’s market leading suppliers of technology products for building services and green tech. The internationally operating group is in family ownership with approximately 4.000 employeees worldwide - three national and four international production facilities making more than €700 million turnover in 2020, approximately 50% from abroad. Stiebel Eltron produces smart solutions for every application scenario: Domestic hot water appliances, heat pumps, ventilation systems and room heaters. STIEBEL ELTRON Group (stiebel-eltron.com)


Contacts

Press contact
Henning Schulz
Stiebel Eltron
email: This email address is being protected from spambots. You need JavaScript enabled to view it.


Proceeds will be used to qualify and commission ION’s 10 MWh/yr manufacturing line, to produce its 1st Generation commercial cells for customers.

BELTSVILLE, Md.--(BUSINESS WIRE)--Ion Storage Systems (ION) announced the initial closing of its $30 million Series A fundraising round led by Clear Creek Investments, VoLo Earth Ventures, and Alsop Louie Partners. This Series A round builds on the $8 million seed funding round that Alsop Louie Partners led with participation from VoLo Earth Ventures. The Series A round is expected to close by the end of Q1 2022.

The investment will enable ION to commission and qualify a battery cell manufacturing line at its Beltsville, MD headquarters capable of producing 10MWh/yr of its safe, energy dense and versatile solid state batteries. Production will initially be allocated to qualifying commercial cells for its Aerospace and Defense customers, generating revenue by the end of 2023. The Series A round will also accelerate the development projects ION has signed with multiple electric vehicle manufacturers, defense contractors, and consumer electronics companies. As part of the financing, Todd Crescenzo, Founder and Managing Partner at Clear Creek Investments, and Joseph Goodman, PhD, Co-Founder and Managing Partner at VoLo Earth Ventures will join ION’s board of directors.

“We are excited to begin commercial production of our transformative technology and getting it into the hands of our customers. ION’s battery performance and safety far exceed what traditional Lithium Ion can offer and will become the benchmark for battery design for decades to come,” said Ricky Hanna, ION’s CEO. “Our team continues to work hard to bring our technology to market and make us the first commercial solid state battery company to generate commercial revenue.”

“It is extremely gratifying to see this novel solid state battery technology created in my laboratories at the University of Maryland rapidly transition from academic research to a viable commercial product with such far reaching impact across multiple energy storage markets. The team has been making tremendous strides each and every day as recognized by this major investment in our company, and I am proud to be a part of it,” said Eric Wachsman, ION Founder and Executive Chair.

“Clear Creek is excited to invest with and alongside our investors in Ion Storage Systems given the company’s innovative battery technology, incredible team, and complimentary commercial partners with the aligned goal of disrupting the battery industry for the better,” said Todd Crescenzo, Founder and Managing Partner at Clear Creek Investments.

“ION de-risks electrification for OEMs with a safer, lower cost, and more energy dense battery that is also robust to critical battery materials; lithium, cobalt, and nickel,” said Joseph Goodman PhD, Co-Founder and Managing Director of VoLo Earth Ventures. “Already automotive and aviation OEMs are gaining competitive advantages through partnership with ION."

“We are delighted to continue on this journey with ION to commercialize their disruptive technology platform,” said Mark Fields, Partner at Alsop Louie Partners. “The unique modularity of ION’s platform empowers product developers to design-in, as opposed to design-around the battery.”

About Ion Storage Systems
Ion Storage Systems, from its new state of the art HQ and manufacturing facility, creates high energy density, solid state lithium metal batteries that are safer, lighter and enable form factors with tighter packing density that enhance system performance. ION’s nonflammable technology offers safe operation, greater abuse tolerance, and both volume and weight reduction. These advances empower the world’s innovators to redefine what is possible and begin building the products-of-tomorrow today.

About Clear Creek Investments, LLC
Clear Creek Investments (“CCI”) is an emerging investment manager, based in Solana Beach, California with a focus on investing in companies across the Energy, Food and Water sectors. Specifically, CCI looks to invest in companies across these critical but resource constrained sectors that are stewards of catalytic capital – “doing more with less” in the spirit of global innovation and betterment. CCI takes a long term, patient capital approach when partnering with portfolio companies and invests across public and private markets. The firm was founded in January 2021 and currently manages three investment vehicles across the private and public markets.

About VoLo Earth Ventures
VoLo Earth is addressing our planet's climate crisis at its roots by providing first-in funding and hands-on leadership to early-stage climate tech companies. VoLo Earth strives to grow, propagate, and capitalize on climate solutions with an intent to deliver superior investment returns and quantifiable carbon benefits.

About Alsop Louie Partners
Alsop Louie Partners is an early-stage, risk-oriented technology venture capital firm in San Francisco.


Contacts

Dwight Langhum
Langhum Mitchell Com.: 202.546.9170 

DUBLIN--(BUSINESS WIRE)--The "Power-to-Gas Market Review 2021 and Strategic Plan for 2022 - Insights, Trends, Competition, Growth Opportunities, Market Size, Market Share Data and Analysis Outlook to 2028" report has been added to ResearchAndMarkets.com's offering.


The Power-to-Gas Market is expected to register an attractive growth rate during the outlook period driven by technological innovations and application-specific developments. Market Players in the Power-to-Gas Market business are aligning their operating model to the new normal by pivoting towards digitalization of operations and adapting to emerging technologies in robotic automation and artificial intelligence.

Mergers and acquisitions to acquire new technologies, strengthen portfolios, and leverage capabilities to remain key strategies of top companies in the Power-to-Gas Market industry during the outlook period. Investing in R&D and technology to improve product lines will be the major growth driver in the short to medium term for the Power-to-Gas Market amid prevailing tough conditions. The market study provides a comprehensive description of current trends and developments in the Power-to-Gas Market industry along with a detailed predictive and prescriptive analysis to 2028.

COVID Impact and Post COVID Scenario Analysis

Companies that are adding capacities aggressively to cater to the short-term COVID-induced demand need to be cautious in analyzing these unprecedented demand patterns. Post pandemic transformations in social, economic, trade, and political conditions with expected reforms in environmental regulations will shape the future of the Power-to-Gas Market industry from 2021 to 2025. Power-to-Gas Market has reported mixed results during the COVID 19 for different applications and geographies. The research identifies segment-wise implications of the pandemic and offers different case scenarios representing the Power-to-Gas Market growth prospects to 2028.

Latest Trends, Drivers, Opportunities, and Challenges

Customizing products to cater to a specific application than improvising the product characteristics on a whole has been the emerging trend in the Power-to-Gas Market. Enterprises should incorporate digitally connected processes and focus on operational efficiency, diversifying supply sources, and cost management to create opportunities in the Power-to-Gas Market during the forecast period. Uneven recovery in different end markets and geographies is a key challenge in understanding and analyzing the Power-to-Gas Market landscape.

Competition, Strategies and Company Profiles

While catering to the short-term needs of the market, Power-to-Gas Market players can address this uncertainty with a clear revision of the product portfolio and a lucid long-term strategy with scenario planning. Investing in innovation, identifying emerging applications, and developing sensible business models to generate sustained growth are the winning strategies in the future Power-to-Gas Market. The report presents detailed profiles of top companies serving the Power-to-Gas Market value chain along with their strategies for the near, medium, and long term period.

Regional Analysis of different Power-to-Gas Market Product Types, Applications, and End-Users

Near saturated demand in Europe coupled with comparatively slower momentum in China, after many years of exceptional growth trajectory are limiting the Power-to-Gas Market demand from these regions. However, the fast-paced recovery of developing nations from the COVID impact is expected to bolster the Power-to-Gas Market demand.

The research estimates global Power-to-Gas Market revenues in 2021, considering the Power-to-Gas Market prices, supply, demand, and trade analysis across regions. A detailed market share, penetration, and shift in demand for different types, applications, and geographies in the Power-to-Gas Market from 2021 to 2028 is included.

The report covers North America, Europe, Asia Pacific, Middle East, Africa, and LATAM Power-to-Gas Market statistics from 2020 to 2028 with further division by leading product types, applications, and use cases of Power-to-Gas Market. The status of the Power-to-Gas Market in 16 key countries over the world is elaborated to enable an in-depth understanding of the Power-to-Gas Market industry.

Key Topics Covered:

1. Table of Contents

2. Global Power-to-Gas Market Review, 2020

3. Power-to-Gas Market Insights

4. Power-to-Gas Market Trends, Drivers, and Restraints

5 Five Forces Analysis for Global Power-to-Gas Market

6. Global Power-to-Gas Market Data - Industry Size, Share, and Outlook

7. Asia Pacific Power-to-Gas Market Industry Statistics - Market Size, Share, Competition and Outlook

8. Europe Power-to-Gas Market Historical Trends, Outlook, and Business Prospects

9. North America Power-to-Gas Market Trends, Outlook, and Growth Prospects

10. Latin America Power-to-Gas Market Drivers, Challenges, and Growth Prospects

11. Middle East Africa Power-to-Gas Market Outlook and Growth Prospects

12. Power-to-Gas Market Structure and Competitive Landscape

13. Latest News, Deals, and Developments in Power-to-Gas Market

14. Appendix

For more information about this report visit https://www.researchandmarkets.com/r/icu8cl


Contacts

ResearchAndMarkets.com
Laura Wood, Senior Press Manager
This email address is being protected from spambots. You need JavaScript enabled to view it.

For E.S.T Office Hours Call 1-917-300-0470
For U.S./CAN Toll Free Call 1-800-526-8630
For GMT Office Hours Call +353-1-416-8900

PITTSBURGH--(BUSINESS WIRE)--$X #BigRiverSteelWorks--United States Steel Corporation (NYSE: X) (“U. S. Steel”) broke ground in Osceola, Arkansas on the company’s next-generation highly sustainable and technologically advanced steel mill. The $3 billion steelmaking facility will be the most advanced in North America and largest private project in the history of Arkansas.


“Several years ago, we embarked on a transformative vision for U. S. Steel,” said U. S. Steel President & CEO David B. Burritt. “Now we celebrate, as we take another significant step forward in becoming the steel company of the future. This facility is engineered to bring together the most advanced technology, to create the steel mill of the future that delivers profitable sustainable solutions for our customers.”

The new plant will be adjacent to U. S. Steel’s Big River Steel. Together, the two facilities will be known as Big River Steel Works. The new plant is expected to bring 900 plant jobs to the area, along with thousands of construction jobs. State, county, and local officials, along with key business partners Entergy and BNSF, joined U. S. Steel President & CEO David B. Burritt to celebrate this transformative investment.

“Last month, we announced that U. S. Steel would build a new state-of-the-art mill in Osceola,” Arkansas Governor Asa Hutchinson said. “We are excited to break ground on the project. Once it is finished, it will be the largest single project investment in the state’s history. This is a great opportunity for Arkansas, and I am thrilled to watch the impact this project will have on the northeast Arkansas economy as well as the families of the workers to be employed by the mill.”

The new optimized steel production facility is expected to feature two electric arc furnaces (EAFs) with 3 million tons per year of advanced steelmaking capability, a state-of-the-art endless casting and rolling line, and advanced finishing capabilities. This first use of endless casting and rolling technology in the United States brings significant energy, efficiency, and capability enhancements to the company’s operations.

“It is with great pride that we break ground on U. S. Steel’s latest endeavor in Arkansas,” Arkansas Secretary of Commerce Mike Preston said. “Once this mill reaches full production, Mississippi County will be the largest steel-producing county in the nation. The company’s decision to select Osceola as the site of this mill speaks volumes about the business climate and workforce in the area. By being the home of the first mill in the country to use endless casting and rolling technology, the steel industry will continue to recognize Arkansas for its excellence in steel production.”

Project completion and full operation is anticipated by 2024. Upon completion, this project will apply to become LEED® certified.

To learn more about the project and watch the ceremony in its entirety click here.

Founded in 1901, United States Steel Corporation is a leading steel producer. With an unwavering focus on safety, the company’s customer-centric Best for All℠ strategy is advancing a more secure, sustainable future for U. S. Steel and its stakeholders. With a renewed emphasis on innovation, U. S. Steel serves the automotive, construction, appliance, energy, containers, and packaging industries with high value-added steel products such as U. S. Steel’s proprietary XG3™ advanced high-strength steel. The company also maintains competitively advantaged iron ore production and has an annual raw steelmaking capability of 22.4 million net tons. U. S. Steel is headquartered in Pittsburgh, Pennsylvania, with world-class operations across the United States and in Central Europe. For more information, please visit www.ussteel.com.


Contacts

John Ambler
Vice President
Corporate Communications
T – (412) 433-2407
E – This email address is being protected from spambots. You need JavaScript enabled to view it.

SHENZHEN, China--(BUSINESS WIRE)--Lithium is a key component of rechargeable batteries used in electric vehicle manufacturing, as well as larger-scale battery storage and other electronics that are becoming increasingly demanded around the world. Global lithium carbonate prices have surged to a new high in the first month of 2022, amid continuously increasing global demand from lithium-ion battery manufacturers, especially for electric vehicles.


There are around 88.51 million tonnes of identified lithium reserves globally, top six countries with the largest lithium reserves in the world are Bolivia 25%, Chile 23%, Argentina 11%, the United States 9%, Australia 7% and China 6%.

So did the Lithium Triangle in South America, who holds 59% of global lithium reserves become the world’s largest producer by advantage of its reserves? This is not the case in current reality. In 2021, the largest producer was Australia with 42% of global lithium production. Among global lithium producers, it is not just reserves, but also technology and processing level which determine who is the winner.

Pursuing in Direct Lithium Extraction (DLE) since 1990, Fusion Enertech Development Company Limited’s core research and development technology team, which consists of top Chinese, Russian and European scientists, has been pioneering the world’s top DLE technology for 32 years. Fusion Enertech is the world’s first and only implementer who has successfully industrialized an actual production of high purity lithium carbonate to 30,000 tons per annum in Qarhan, China's largest salt flat. After decades of exploration, optimization and continuous investment, Fusion Enertech has broken through the lithium extraction technology from brine with high magnesium-to-lithium ratio and low lithium content, and made Qinghai of China the region with most significant progress in DLE technology in the world.

Conventional lithium extraction starts from pumping underground brines into evaporation ponds on the surface of salt flat, wait for 9 to 18 months letting solar evaporation reduces the liquid water and then recovers about 40% of lithium.

In response to environmental protection such as global warming, energy-saving, and carbon emission reduction, Fusion Enertech’s new format of Direct Lithium Extraction uses a clean process that involves injecting brine water into the patented adsorption tower which contains a highly selective aluminum hydroxide based organic absorbent called Lithium-ion Enrichment Material (LiEM) to extract lithium within few hours, the solution extracted is purified and concentrated to yield high-grade lithium with 95% of recovery. Scaled industrial production of Fusion Enertech has shown that lithium concentrations to 80,000 mg/L lithium can be produced from brines of ~500 mg/L lithium in 6 hours. Finally, the treated brine returns to the salt flat with zero-pollution.

Li-ion adsorbent with good lithium selectivity, recyclability and low production cost are the keys to the success of DLE. Due to the high selectivity and memory effect of LiEM, lithium can be better separated from other impurities. This high efficient process lowers 20% of conventional cost, does not use any chemical reagents, and does not need to excavate the huge evaporation ponds with large-scale destruction, which protects the original ecosystem of the salt flat resources. A water control and recycling process is adopted in the whole production to save water and reduce energy consumption. Additionally, Fusion Enertech’s DLE also including a magnesium removal technology which enables processing high-purity magnesium oxide as a by-product for manufacturing metal magnesium.

Today, application of LiEM become the easiest and most environmentally friendly adsorption method, for innovative and sustainable lithium extraction processes from salt flats brines of various lithium grades and compositions around the world.

Bolivia owns more than 21 million tons of lithium reserves in the Salar de Uyuni, together with Coipasa and Pastos Grandes, it is estimated that these three salt flats contain more than half of the global lithium reserves, it is the biggest upcoming lithium resource in the world, with a potential annual production capacity of more than 100,000 tons.

Fusion Enertech’s focus in Bolivia are well known through its cooperation with of Yacimientos de Litio Bolivianos (YLB). Executives have made their first investigation visit to Uyuni Salt Flats in July of 2019 and signed a memorandum of understanding for investing a lithium carbonate plant of 30,000 tons annual production capacity using their new generation of DLE technology with the highest level of support.

On October 6th 2021, Fusion Enertech was selected as one of the 8 world’s key lithium enterprises for carrying out pilot DLE tests for brines of Uyuni, Coipasa and Pastos Grandes salt flats of Bolivia, to demonstrate the effectiveness of DLE technology and to make a major leap in the professional development and extraction of the valuable lithium reserves for the global market.


Contacts

Fusion Enertech
Eric Zhu
This email address is being protected from spambots. You need JavaScript enabled to view it.
www.jnworldtech.com

DUBLIN--(BUSINESS WIRE)--The "Natural Gas Distribution Global Market Report 2022" report has been added to ResearchAndMarkets.com's offering.


The global natural gas distribution market is expected to grow from $818.70 billion in 2021 to $905.45 billion in 2022 at a compound annual growth rate (CAGR) of 10.6%. The market is expected to reach $1,320.13 billion in 2026 at a CAGR of 9.9%.

Major companies in the natural gas distribution market include Uniper, Centrica plc, Eni S.p.A., E.ON SE, Chubu Electric Power, Engie, Tokyo Gas, Polish Oil and Gas Co (PGNiG) SA, OSAKA GAS CO and National Grid Plc.

The natural gas distribution market consists of sales of natural gas by entities (organizations, sole traders and partnerships) that operate gas distribution systems (e.g., mains, meters) including gas marketers that buy gas from the well and sell it to a distribution system, gas brokers or agents that arrange the sale of gas over gas distribution systems operated by others and establishments that transmit and distribute gas to final consumers. The natural gas distribution is segmented into industrial and commercial natural gas distribution and household natural gas distribution.

The main types of natural gas distribution are industrial and commercial natural gas distribution, household natural gas distribution. Natural gas is one of the most efficient and non-polluting modern fuels for both industrial and home use. Natural gas has risen gradually in the energy basket of major countries due to its characteristic clean burning nature and availability via pipeline connection, which eliminates the need for local storage and other transit requirements. The different types of operators include public operator and private operator.

Eastern Europe was the largest region in the natural gas distribution market in 2021. Asia Pacific was the second largest region in natural gas distribution market.

Companies in the natural gas distribution industry are investing in robotic wireless in-pipe leak detection systems for faster repair of leakages. Traditional detection systems are often slow. The new robotic technology can detect leaks at a faster pace and with high accuracy.

The robotic devices uses laser beams to detect potential leak points by analyzing the gas concentration in close proximity. This technology provides reliable results and reduced amount of data to be processed in detection to plug gas leakage. For instance, A6 OMD robot, developed by SMP Robotics, is used to detect underground pipeline gas leaks. It uses GPS to frame a map to locate the gas leak for a pipeline of any length.

Companies in the natural gas distribution market are using alternate modes of natural gas transportation for the delivery of natural gas through land. Natural gas is transported mostly through pipes or through shipping vessels. However, companies are now exploring the use of railroads for the delivery of natural gas.

Transporting natural gas through rails might allow the companies to expand its reach to remote industrial areas. Following the trend, in 2019, the U.S Pipeline and Hazardous Materials Safety Administration approved the New Fortress Energy 's plan to transport natural gas from Pennsylvania's Marcellus Shale by train for about 175 miles to South Jersey, U.S.

Key Topics Covered:

1. Executive Summary

2. Report Structure

3. Natural Gas Distribution Market Characteristics

3.1. Market Definition

3.2. Key Segmentations

4. Natural Gas Distribution Market Product Analysis

4.1. Leading Products/ Services

4.2. Key Features and Differentiators

4.3. Development Products

5. Natural Gas Distribution Market Supply Chain

5.1. Supply Chain

5.2. Distribution

5.3. End Customers

6. Natural Gas Distribution Market Customer Information

6.1. Customer Preferences

6.2. End Use Market Size and Growth

7. Natural Gas Distribution Market Trends And Strategies

8. Impact Of COVID-19 On Natural Gas Distribution

9. Natural Gas Distribution Market Size And Growth

9.1. Market Size

9.2. Historic Market Growth, Value ($ Billion)

9.2.1. Drivers Of The Market

9.2.2. Restraints On The Market

9.3. Forecast Market Growth, Value ($ Billion)

9.3.1. Drivers Of The Market

9.3.2. Restraints On The Market

10. Natural Gas Distribution Market Regional Analysis

10.1. Global Natural Gas Distribution Market, 2021, By Region, Value ($ Billion)

10.2. Global Natural Gas Distribution Market, 2016-2021, 2021-2026F, 2031F, Historic And Forecast, By Region

10.3. Global Natural Gas Distribution Market, Growth And Market Share Comparison, By Region

11. Natural Gas Distribution Market Segmentation

11.1. Global Natural Gas Distribution Market, Segmentation By Type, Historic and Forecast, 2016-2021, 2021-2026F, 2031F, $ Billion

  • Industrial And Commercial Natural Gas Distribution
  • Household Natural Gas Distribution

11.2. Global Natural Gas Distribution Market, Segmentation By Type of Operator, Historic and Forecast, 2016-2021, 2021-2026F, 2031F, $ Billion

  • Public Operator
  • Private Operator

12. Natural Gas Distribution Market Segments

12.1. Global Industrial And Commercial Natural Gas Distribution Market, Segmentation By Type, 2016-2021, 2021-2026F, 2031F, Value ($ Billion) -

12.2. Global Household Natural Gas Distribution Market, Segmentation By Type, 2016-2021, 2021-2026F, 2031F, Value ($ Billion) -

13. Natural Gas Distribution Market Metrics

13.1. Natural Gas Distribution Market Size, Percentage Of GDP, 2016-2026, Global

13.2. Per Capita Average Natural Gas Distribution Market Expenditure, 2016-2026, Global

Companies Mentioned

  • Uniper
  • Centrica plc
  • Eni S.p.A.
  • E.ON SE
  • Chubu Electric Power
  • Engie
  • Tokyo Gas
  • Polish Oil and Gas Co (PGNiG) SA
  • OSAKA GAS CO
  • National Grid Plc

For more information about this report visit https://www.researchandmarkets.com/r/l5qcsy


Contacts

ResearchAndMarkets.com
Laura Wood, Senior Press Manager
This email address is being protected from spambots. You need JavaScript enabled to view it.
For E.S.T Office Hours Call 1-917-300-0470
For U.S./CAN Toll Free Call 1-800-526-8630
For GMT Office Hours Call +353-1-416-8900

NEWPORT BEACH, Calif.--(BUSINESS WIRE)--$CLNE--Clean Energy Fuels Corp. (NASDAQ: CLNE), along with its industry partner Union Energy Solutions Limited Partnership, an unregulated affiliate of Enbridge Gas Inc. – an Enbridge Company, announced it has signed an agreement to fuel United Parcel Service (UPS) Canada delivery fleet vehicles with compressed natural gas (CNG) at its London, Ontario station.


UPS Canada has converted 25 package delivery vans to operate on CNG – a lower carbon alternative to gasoline. The Clean Energy-operated CNG fueling station, located near the UPS facility in London, will provide an anticipated 2,000,000 litres (525,000 gasoline gallon equivalent) of CNG in a multi-year agreement. Fueling the trucks with CNG will reduce 700 metric tons of greenhouse gas emissions–the equivalent of planting 11,667 trees, removing 152 cars from the road, and recycling 281 tons of landfill waste.

“We are excited by the growing use of CNG in Ontario that will significantly lower greenhouse gas emissions and result in a positive environmental impact to reduce local air pollutants,” said Chad Lindholm, senior vice president, Clean Energy. “UPS has led the way in sustainable transportation for many years and we’re pleased to partner with them to expand their clean natural gas fleet in Canada. We’re pleased that UPS continues the migration of its package cars to CNG in Canada and applaud their sustainability efforts.”

“We are pleased to help the medium and heavy transportation industries that are working hard to reduce emissions,” said Cynthia Hansen, Executive Vice President & President, Gas Distribution & Storage, Enbridge Inc. “CNG is a cleaner-burning solution for fleet and transit vehicles that can immediately reduce emissions by up to 20 percent as compared to gasoline or diesel while also reducing fuel costs.”

“CNG is an important part of UPS’s strategy to increase its use of alternative fuel and reduce our emissions,” said Floyd Bristol, Vice President of Automotive, UPS Canada. “As a transportation company, we have a responsibility to put sustainability at the core of our operations and adding these new vehicles to our growing alternative fuel fleet in Canada will have a measurable impact.”

“The use of compressed natural gas (CNG) is a cleaner fuel choice that can help reduce greenhouse gas emissions,” said Todd Smith, Ontario Minister of Energy. “Congratulations to Enbridge Gas, Clean Energy and UPS Canada on this exciting initiative that is helping to advance Ontario’s transition towards a lower-carbon future.”

In further growth of CNG volume in Canada, the City of London has expanded its natural gas solid waste fleet from six to eight refuse vehicles, with plans to order more in the near future. Each waste truck fuels with an expected 19,000 litres (5,000 gallons) of CNG per year.

About Clean Energy

Clean Energy Fuels Corp. is the country’s largest provider of the cleanest fuel for the transportation market. Our mission is to decarbonize transportation through the development and delivery of renewable natural gas (RNG), a sustainable fuel derived from organic waste. Clean Energy allows thousands of vehicles, from airport shuttles to city buses to waste and heavy-duty trucks, to reduce their amount of climate-harming greenhouse gas. We operate a vast network of fueling stations across the U.S. and Canada. Visit www.cleanenergyfuels.com and follow @CE_renewables on Twitter.

About Union Energy Solutions

Union Energy Solutions Limited Partnership (UES) is an unregulated affiliate of Enbridge Gas Inc., an Enbridge Company – that focuses on various clean energy business initiatives in the Province of Ontario.

Forward-Looking Statements

This news release contains forward-looking statements within the meaning of Section 27A of the Securities Act of 1933 and Section 21E of the Securities Exchange Act of 1934 that involve risks, uncertainties and assumptions, including without limitation statements about amounts of CNG expected to be consumed, numbers of CNG vehicles expected to be deployed, plans to increase CNG vehicle fleet sizes, the cost of CNG, the benefits of Clean Energy’s fuels and the value of contracts. Actual results and the timing of events could differ materially from those anticipated in these forward-looking statements. The forward-looking statements made herein speak only as of the date of this press release and, unless otherwise required by law, Clean Energy undertakes no obligation to publicly update such forward-looking statements to reflect subsequent events or circumstances. Additionally, the reports and other documents Clean Energy files with the SEC (available at www.sec.gov) contain risk factors, which may cause actual results to differ materially from the forward-looking statements contained in this news release.


Contacts

Clean Energy Contact:
Raleigh Gerber
949-437-1397
This email address is being protected from spambots. You need JavaScript enabled to view it.

Clean Energy Investor Contact:
This email address is being protected from spambots. You need JavaScript enabled to view it.

Union Energy Solutions Contact:
This email address is being protected from spambots. You need JavaScript enabled to view it.

NORWELL, Mass.--(BUSINESS WIRE)--Clean Harbors, Inc. (NYSE: CLH), the leading provider of environmental and industrial services throughout North America, will host its fourth-quarter and full-year 2021 financial results conference call on Wednesday, February 23, 2022 at 9:00 a.m. ET.


On the call, Chairman, President and Chief Executive Officer Alan S. McKim, Executive Vice President and Chief Financial Officer Michael L. Battles, and Senior Vice President of Investor Relations Jim Buckley will discuss Clean Harbors’ financial results, business outlook and growth strategy.

Those who wish to listen to the conference call webcast should visit the Investor Relations section of the Company’s website at www.cleanharbors.com. The live call also can be accessed by dialing 877.709.8155 or 201.689.8881. Please dial in at least 10 minutes prior to the start of the call. If you are unable to listen to the live call, the webcast will be archived on the Company’s website.

About Clean Harbors

Clean Harbors (NYSE: CLH) is North America’s leading provider of environmental and industrial services. The Company serves a diverse customer base, including a majority of Fortune 500 companies. Its customer base spans a number of industries, including chemical, energy and manufacturing, as well as numerous government agencies. These customers rely on Clean Harbors to deliver a broad range of services such as end-to-end hazardous waste management, emergency spill response, industrial cleaning and maintenance, and recycling services. Through its Safety-Kleen subsidiary, Clean Harbors also is North America’s largest re-refiner and recycler of used oil and a leading provider of parts washers and environmental services to commercial, industrial and automotive customers. Founded in 1980 and based in Massachusetts, Clean Harbors operates in the United States, Canada, Mexico, Puerto Rico and India. For more information, visit www.cleanharbors.com.


Contacts

Michael L. Battles
EVP and Chief Financial Officer
Clean Harbors, Inc.
781.792.5100
This email address is being protected from spambots. You need JavaScript enabled to view it.

Jim Buckley
SVP Investor Relations
Clean Harbors, Inc.
781.792.5100
This email address is being protected from spambots. You need JavaScript enabled to view it.

VANCOUVER, British Columbia--(BUSINESS WIRE)--$LPEN--Loop Energy™ (TSX: LPEN), a developer and manufacturer of hydrogen fuel cell solutions, will host a webinar to present its 2022 objectives on February 23 at 8:00 am PST (11:00 am EST).


During the webinar, Loop’s Executive team will share its 2022 objectives relating to its go-to-market strategy, production capacity, product development and cost reduction. After the update, participants will have an opportunity to ask relevant questions.

Loop set some aggressive targets in 2021, and on January 11, it announced that it successfully delivered against its objectives. The milestones included growing its customer portfolio, expanding its production capabilities in Canada and China, progressing the evolution of its fuel stack technology and identifying opportunities for vertical integration. Following the success of 2021, Loop is excited to share its ambitions for 2022 with its stakeholders.

To attend, register for the webinar here. If you would like to submit questions for Loop’s Executive team to address, please email This email address is being protected from spambots. You need JavaScript enabled to view it..

A recording of the webinar and presentation will be available on Loop’s Investor Relations website.

About Loop Energy Inc.

Loop Energy is a leading designer and manufacturer of fuel cell systems targeted for the electrification of commercial vehicles, including light commercial vehicles, transit buses and medium and heavy-duty trucks. Loop’s products feature the Company’s proprietary eFlow™ technology in the fuel cell stack’s bipolar plates. eFlow™ was designed to enable commercial customers to achieve performance maximization and cost minimization. Loop works with OEMs and major vehicle sub-system suppliers to enable the production of hydrogen fuel cell electric vehicles. For more information about how Loop is driving towards a zero-emissions future, visit www.loopenergy.com.


Contacts

Investor Inquiries:
Bill Zhang | Tel: +1 604.222.3400 Ext. 299 | This email address is being protected from spambots. You need JavaScript enabled to view it.
Laine Yonker | Tel: +1 646.653.7035 | This email address is being protected from spambots. You need JavaScript enabled to view it.

Media Inquiries:
Lucas Schmidt | Tel: +1.604.222.3400 Ext. 603 | This email address is being protected from spambots. You need JavaScript enabled to view it.

ANAHEIM, Calif.--(BUSINESS WIRE)--$WLDN--Willdan Group, Inc. (Nasdaq: WLDN) announced today that Utah State University (USU) has awarded it a contract to develop a strategic decarbonization plan for the USU central utility plant. As part of this contract, Willdan will identify and help prioritize a series of projects for construction that focus on the campus’s central heating, cooling, and power generation systems. This contract is part of a larger initiative led by the USU Greenhouse Gas Reduction Steering Committee to accelerate the reduction of greenhouse gas emissions and become a carbon-neutral campus by 2050.


“We’re pleased to offer Utah State University the expertise of our in-house engineers, developers, and energy policy experts as they take this important step,” said Tom Brisbin, Willdan’s CEO and Chairman. “USU is one of the largest energy consumers in the state, so the projects we identify may have a significant impact on the future of building decarbonization in Utah.”

About Utah State University

Since its founding in 1888, Utah State University has evolved from a small agricultural college tucked away in the Northern Utah mountains to a thriving, multi-campus research university known throughout the world for its intellectual and technological leadership. Utah State is a premier student-centered land-grant and space-grant university that fosters the principle that academics come first by cultivating diversity of thought and culture, and by serving the public through learning, discovery, and engagement.

About Willdan

Willdan is a nationwide provider of professional technical and consulting services to utilities, government agencies, and private industry. Willdan’s service offerings span a broad set of complementary disciplines that include electric grid solutions, energy efficiency and sustainability, engineering and planning, and municipal financial consulting. For additional information, visit Willdan's website at www.willdan.com. Follow Willdan on LinkedIn, Facebook, and Twitter.

Forward-Looking Statements

Statements in this press release that are not purely historical are forward-looking statements within the meaning of the Private Securities Litigation Reform Act of 1995. It is important to note that Willdan’s actual results could differ materially from those in any such forward-looking statements. Factors that could cause actual results to differ materially include, but are not limited to, the risk factors listed from time to time in Willdan’s reports filed with the Securities and Exchange Commission, including, but not limited to, the Annual Report on Form 10-K filed for the year ended January 1, 2021. Willdan cautions investors not to place undue reliance on the forward-looking statements contained in this press release. Willdan disclaims any obligation to, and does not undertake to, update or revise any forward-looking statements in this press release.


Contacts

Al Kaschalk
VP Investor Relations
310-922-5643
This email address is being protected from spambots. You need JavaScript enabled to view it.


SASKATOON, Saskatchewan--(BUSINESS WIRE)-- 

Cameco Announces 2021 Financial Results; 50% Increase to 2022 Dividend Aligned with 70 Million Pounds of Long-Term Contracting and Improving Market Fundamentals; Next Phase of its Supply Discipline Begins While Awaiting Further Market Improvements and Contracting Progress

Cameco (TSX: CCO; NYSE: CCJ) today reported its consolidated financial and operating results for the fourth quarter and year ended December 31, 2021 in accordance with International Financial Reporting Standards (IFRS).

Our results reflect the very deliberate execution of our strategy of full-cycle value capture. We have been undertaking work to ensure we have operational flexibility, we are aligning our production decisions with the market fundamentals and our contracting portfolio, and we have been financially disciplined. Since 2016, with our planned and unplanned production cuts, inventory reduction and market purchases, we have removed more than 190 million pounds of uranium from the market, which we believe has contributed to the security of supply concerns in our industry,” said Tim Gitzel, Cameco’s president and CEO.

In alignment with 70 million pounds of additional long-term contracts added to our portfolio since the beginning of 2021 and the improving market sentiment that provides us with leverage to higher prices under our market-related contracts and for our unencumbered productive capacity, we are pleased to announce that it is time for Cameco to proceed with the next phase of our supply discipline decisions. And it is time to reward those who have supported our strategy. We are laying claim to our tier-one incumbency advantage as we further position the company to capture the value we expect to come from the growing demand for nuclear energy driven by the increasingly undeniable conclusion that it must be an essential part of the clean-energy transition.

Our plan in no way represents an end to our supply discipline. What we are contemplating for our supply discipline still represents a much greater reduction than any other producer has made. In fact, we are continuing with indefinite supply discipline. Our plan includes both McArthur River/Key Lake and Cigar Lake operating at less than licensed capacity starting in 2024. We are taking a portfolio approach to our supply discipline. In 2021, we were operating at about 75% below productive capacity (100% basis), which came at a significant cost to our business. By 2024, we plan to be operating at about 40% below productive capacity (100% basis). This will remain our production plan until we see further improvements in the uranium market and have made further progress in securing the appropriate homes for our unencumbered, in-ground inventory under long-term contracts, once again demonstrating that we are a responsible supplier of uranium fuel.

Starting in 2024, it is our plan to produce 15 million pounds per year (100% basis) at McArthur River/Key Lake, 40% below the annual licensed capacity of the operation. At that time, we plan to reduce production at Cigar Lake to 13.5 million pounds per year (100% basis), 25% below its annual licensed capacity, for a combined reduction of 33% of licensed capacity at the two operations. In addition, we plan to keep our tier-two assets on care and maintenance, and production at Inkai will continue to follow the 20% reduction until the end of 2023 unless Kazatomprom further extends its supply reductions.

It will take us some time to transition McArthur River/Key Lake from care and maintenance to its planned production capacity as we complete critical automation, digitization and other projects, execute maintenance readiness checks, and achieve sufficient recruitment and training. Until we achieve a reasonable production rate, we expect to incur operational readiness costs, which will be expensed directly to cost of sales. In 2022, we could produce up to 5 million pounds (100% basis) depending on our success in completing operational readiness activities and managing the potential risks of the COVID-19 pandemic and related supply chain challenges. We will continue to meet our sales commitments from a combination of lower-cost production, inventory and purchases in order to maximize the value of our sales portfolio. As we ramp up to our 2024 planned production capacity, we expect to see a significant improvement in our earnings and cash flow.

Our total planned production in 2022 continues to face risks due to the ongoing COVID-19 pandemic, and related global supply chain disruptions, including at Cigar Lake where we expect to produce 15 million pounds (100% basis), which is 20% below licensed capacity, and at Inkai in Kazakhstan.

Thanks to our deliberate actions and conservative financial management we have been and continue to be resilient. With $1.3 billion in cash and cash equivalents and short-term investments on our balance sheet, improving fundamentals for our business and our decision to prepare McArthur River/Key Lake for production, we have line of sight to a significant improvement in our future financial performance. Our strong balance sheet positions us well to self-manage risk, including any global macro-economic uncertainty and volatility that may arise. Therefore, we are pleased to announce that our board has approved a 50% increase to our annual dividend for 2022. In December 2022 we will pay an annual dividend of $0.12 per common share, up from $0.08 per common share.

Our vision of ‘energizing a clean-air world’ recognizes that we have an important role to play in enabling the vast reductions in greenhouse gas emissions required to accomplish the targets being set by countries and companies around the world to achieve a resilient, net-zero carbon economy. We have operating and idle tier-one assets that are licensed, permitted, long-lived, are proven reliable, and that have expansion capacity. These tier-one assets are backed up by idle tier-two assets and what we think is the best exploration portfolio that leverages existing infrastructure. We are vertically integrated across the nuclear fuel cycle. We have locked in significant value for the fuel services segment of our business in the recent price transition in the conversion market and we are exploring opportunities to further our reach in the nuclear fuel cycle and in innovative, non-traditional commercial uses of nuclear power in Canada and around the world.

We are optimistic about Cameco’s role in capturing long-term value across the fuel chain and supporting the transition to a net-zero carbon economy. We believe we have the right strategy to achieve our vision and we will do so in a manner that reflects our values. For over 30 years, we have been delivering our products responsibly. Sustainability is at the heart of what we do. Embedded in all our decisions is a commitment to addressing the environmental, social and governance risks and opportunities that we believe will make our business sustainable over the long term.”

Summary of Q4 and 2021 results and developments:

  • Fourth quarter net earnings of $11 million; adjusted net earnings of $23 million: Fourth quarter results are driven by normal quarterly variations in contract deliveries and the continued execution of our strategy. Adjusted net earnings is a non-IFRS measure, see below.
  • Annual net loss of $103 million; adjusted net loss of $98 million: Annual results were driven by the continued execution of our strategy and the proactive measures taken due to the COVID-19 pandemic. Adjusted net earnings is a non-IFRS measure, see below.
  • COVID-19 pandemic: The health and safety of our workers, their families and their communities continues to be the priority in all our plans. As a result of the four-month precautionary production suspension at our Cigar Lake operation, in our uranium segment we produced only 6.1 million pounds (our share) in 2021, well below our committed sales. Additionally, we incurred $40 million more in care and maintenance costs than those we had planned for. Partially offsetting these costs was the receipt of about $21 million under the Canada Emergency Wage Subsidy program.
  • Received dividends from JV Inkai: In 2021, we received dividend payments from JV Inkai totaling $40 million (US). JV Inkai distributes excess cash, net of working capital requirements, to the partners as dividends. See Uranium – Tier-one operations – Inkai in our 2021 annual MD&A.
  • Contracting continues in strengthened price environment: In our uranium segment, since the beginning of 2021, we have been successful in adding 70 million pounds to our portfolio of long-term uranium contracts, bringing the total volumes added since 2016 to about 185 million pounds. Nevertheless, we maintain leverage to higher prices with significant unencumbered future productive capacity and a large and growing pipeline of uranium business under discussion. However, we are being strategically patient in our discussions to capture as much value as possible in our contract portfolio. In addition to the off-market contracting interest, there has been a re-emergence of on-market requests for proposals from utilities looking to secure their future requirements.
  • Strong balance sheet: As of December 31, 2021, we had $1.3 billion in cash and cash equivalents and short-term investments and $996 million in long-term debt. In addition, we have a $1 billion undrawn credit facility.
  • Tax dispute: In the fourth quarter we filed a notice of appeal with the Tax Court of Canada (Tax Court) in our dispute with Canada Revenue Agency (CRA) to have our $777 million in cash and letters of credit returned. See Transfer Pricing Dispute in our 2021 annual MD&A.
  • Next phase of our supply discipline strategy: Continuing to align our production decisions with the market conditions and our long-term contract portfolio, starting in 2024, we plan for our share of production to be about 45% below our productive capacity. Productive capacity includes licensed capacity at Cigar Lake and McArthur River/Key Lake, and it includes planned production volumes at Rabbit Lake and our US operations prior to curtailment in 2016. In addition, at Inkai, we will continue to follow the 20% reduction until the end of 2023 as announced by Kazatomprom. This will remain our production plan until we see further improvements in the uranium market and contracting progress, demonstrating that we continue to be a responsible supplier of uranium fuel.
  • 2022 guidance provided: Our outlook for 2022 reflects the expenditures necessary to help us achieve our strategy, including the ramp-up to the planned production of 15 million pounds per year (100% basis) at McArthur River/Key Lake by 2024. As in prior years, we will incur care and maintenance costs for the ongoing suspension of our tier-two assets, which are expected to be between $50 million and $60 million. We also expect to incur between $15 million and $17 million per month at McArthur River/Key Lake in operational readiness costs which will be expensed directly to cost of sales until we achieve a reasonable production rate. Operational readiness costs include all of the costs associated with care and maintenance in addition to the costs to complete critical projects, perform maintenance readiness checks, and recruit and train sufficient mine and mill personnel before beginning operations.
    • Over the course of 2022 and 2023, we will undertake all the activities necessary to ramp up at McArthur River/Key Lake to the planned 2024 production. As a result, in 2022, we could produce up to 5 million pounds (100% basis).
    • At Cigar Lake, we expect production of 15 million pounds (100% basis) in 2022.
    • The production outlook reflects the expected impact of the delays and deferrals to development work at Cigar Lake in 2021 and the ongoing pandemic and supply chain challenges we are currently experiencing at all our operations.

See Outlook for 2022 in our 2021 annual MD&A for more information.

  • 50% increase to 2022 dividend announced: As a result of our deliberate actions and conservative financial management we have been and continue to be resilient. With a strong balance sheet, improving fundamentals for our business, a growing contract portfolio, and our decision to prepare McArthur River/Key Lake to be operationally ready, we have line of sight to a significant improvement in our future earnings and cash flow. Therefore, for 2022, we are increasing our annual dividend. An annual dividend of $0.12 per common share has been declared, payable on December 15, 2022 to shareholders of record on November 30, 2022.
  • Greater focus on technology and its applications: We continue our focus on innovation and accelerating the adoption of advanced digital and automation technologies to allow us to operate our assets with more flexibility.
  • Clean-energy innovation: In 2021, we increased our interest in Global Laser Enrichment LLC (GLE) from 24% to 49% and signed a number of non-binding arrangements to explore several areas of cooperation to advance the commercialization and deployment of small modular reactors (SMRs) in Canada and around the world. This furthers our commitment to responsibly and sustainably manage our business and increase our contributions to global climate change solutions by exploring other emerging and non-traditional opportunities within the fuel cycle.

Consolidated financial results


THREE MONTHS ENDED

YEAR ENDED

CONSOLIDATED HIGHLIGHTS

DECEMBER 31

DECEMBER 31

($ MILLIONS EXCEPT WHERE INDICATED)

2021

2020

2021

2020

Revenue

465

550

1,475

1,800

Gross profit

56

109

2

106

Net earnings (loss) attributable to equity holders

11

80

(103)

(53)


$ per common share (basic)

0.03

0.20

(0.26)

(0.13)


$ per common share (diluted)

0.03

0.20

(0.26)

(0.13)

Adjusted net earnings (loss) (non-IFRS, see below)

23

48

(98)

(66)


$ per common share (adjusted and diluted)

0.06

0.12

(0.25)

(0.17)

Cash provided by operations

59

257

458

57

The 2021 annual financial statements have been audited; however, the 2020 fourth quarter and 2021 fourth quarter financial information presented is unaudited. You can find a copy of our 2021 annual MD&A and our 2021 audited financial statements on our website at cameco.com.

NET EARNINGS

The following table shows what contributed to the change in net earnings and adjusted net earnings (non-IFRS measure, see below) in the three months and year ended December 31, 2021, compared to the same period in 2020.

CHANGES IN EARNINGS

THREE MONTHS ENDED

YEAR ENDED

($ MILLIONS)

DECEMBER 31

DECEMBER 31


IFRS

ADJUSTED

IFRS

ADJUSTED

Net earnings (losses) - 2020

80

48

(53)

(66)

Change in gross profit by segment


(we calculate gross profit by deducting from revenue the cost of products and services sold, and depreciation and amortization (D&A), net of hedging benefits)

Uranium

Lower sales volume

(20)

(20)

(4)

(4)


Higher realized prices ($US)

10

10

5

5


Foreign exchange impact on realized prices

(13)

(13)

(72)

(72)


Higher costs

(47)

(47)

(55)

(55)


change – uranium

(70)

(70)

(126)

(126)

Fuel services

Higher sales volume

4

4

1

1


Higher realized prices ($Cdn)

11

11

23

23


Higher costs

-

-

(2)

(2)


change – fuel services

15

15

22

22

Other changes


Lower administration expenditures

8

8

17

17

Lower exploration expenditures

1

1

3

3

Change in reclamation provisions

(10)

-

32

-

Change in gains or losses on derivatives

(35)

13

(24)

34

Change in foreign exchange gains or losses

7

7

(14)

(14)

Change in earnings from equity-accounted investments

16

16

32

32

Redemption of Series E debentures in 2020

24

24

24

24

Canadian Emergency Wage Subsidy

(37)

(37)

(16)

(16)

Change in income tax recovery or expense

19

5

15

7

Other

(7)

(7)

(15)

(15)

Net earnings (losses) - 2021

11

23

(103)

(98)

Non-IFRS measures

ADJUSTED NET EARNINGS

Adjusted net earnings (ANE) is a measure that does not have a standardized meaning or a consistent basis of calculation under IFRS (non-IFRS financial measure). We use this measure as a more meaningful way to compare our financial performance from period to period. Adjusted net earnings is our net earnings attributable to equity holders, adjusted to better reflect the underlying financial performance for the reporting period. We believe that, in addition to conventional measures prepared in accordance with IFRS, certain investors use this information to evaluate our performance. Adjusted net earnings is one of the targets that we measure to form the basis for a portion of annual employee and executive compensation (see Measuring our results in our 2021 annual MD&A).

In calculating ANE we adjust for derivatives. We do not use hedge accounting under IFRS and, therefore, we are required to report gains and losses on all hedging activity, both for contracts that close in the period and those that remain outstanding at the end of the period. For the contracts that remain outstanding, we must treat them as though they were settled at the end of the reporting period (mark-to-market). However, we do not believe the gains and losses that we are required to report under IFRS appropriately reflect the intent of our hedging activities, so we make adjustments in calculating our ANE to better reflect the impact of our hedging program in the applicable reporting period. See Foreign exchange in our 2021 annual MD&A for more information.

We also adjust for changes to our reclamation provisions that flow directly through earnings. Every quarter we are required to update the reclamation provisions for all operations based on new cash flow estimates, discount and inflation rates. This normally results in an adjustment to an asset retirement obligation asset in addition to the provision balance. When the assets of an operation have been written off due to an impairment, as is the case with our Rabbit Lake and US ISR operations, the adjustment is recorded directly to the statement of earnings as “other operating expense (income)”. See note 15 of our annual financial statements for more information. This amount has been excluded from our ANE measure.

Adjusted net earnings is a non-IFRS financial measure and should not be considered in isolation or as a substitute for financial information prepared according to accounting standards. Other companies may calculate this measure differently, so you may not be able to make a direct comparison to similar measures presented by other companies.

The following table reconciles adjusted net earnings with our net earnings for the three months and years ended December 31, 2021 and 2020.


THREE MONTHS ENDED

YEAR ENDED


DECEMBER 31

DECEMBER 31

($ MILLIONS)

2021

2020

2021

2020

Net earnings (loss) attributable to equity holders

11

80

(103)

(53)

Adjustments


Adjustments on derivatives

5

(43)

13

(45)


Adjustments on other operating expense (income)

10

-

(8)

24


Income taxes on adjustments

(3)

11

-

8

Adjusted net earnings (loss)

23

48

(98)

(66)

Selected segmented highlights


THREE MONTHS ENDED


YEAR ENDED


DECEMBER 31


DECEMBER 31


HIGHLIGHTS

2021

2020

CHANGE

2021

2020

CHANGE

Uranium

Production volume (million lbs)


2.8

2.8

-

6.1

5.0

22%


Sales volume (million lbs)


6.5

8.6

(24)%

24.3

30.7

(21)%


Average realized price1

($US/lb)

39.65

38.43

3%

34.53

34.39

-


($Cdn/lb)

49.94

50.40

(1)%

43.34

46.13

(6)%


Revenue ($ millions)


323

436

(26)%

1,055

1,416

(25)%


Gross profit (loss) ($ millions)


10

80

(88)%

(108)

18

>(100%)

Fuel services

Production volume (million kgU)


3.1

3.3

(6)%

12.1

11.7

3%


Sales volume (million kgU)


4.9

4.4

11%

13.6

13.5

1%


Average realized price 2

($Cdn/kgU)

28.80

26.29

10%

29.72

27.89

7%


Revenue ($ millions)


140

115

22%

404

377

7%


Gross profit ($ millions)


46

32

44%

118

96

23%

1

Uranium average realized price is calculated as the revenue from sales of uranium concentrate, transportation and storage fees divided by the volume of uranium concentrates sold.

2

Fuel services average realized price is calculated as revenue from the sale of conversion and fabrication services, including fuel bundles and reactor components, transportation and storage fees divided by the volumes sold.

Management's discussion and analysis (MD&A) and financial statements

The 2021 annual MD&A and consolidated financial statements provide a detailed explanation of our operating results for the three and twelve months ended December 31, 2021, as compared to the same periods last year, and our outlook for 2022. This news release should be read in conjunction with these documents, as well as our most recent annual information form, all of which are available on our website at cameco.com, on SEDAR at sedar.com, and on EDGAR at sec.gov/edgar.shtml.

Qualified persons

The technical and scientific information discussed in this document for our material properties McArthur River/Key Lake, Cigar Lake and Inkai was approved by the following individuals who are qualified persons for the purposes of NI 43-101:

MCARTHUR RIVER/KEY LAKE

  • Greg Murdock, general manager, McArthur River/Key Lake, Cameco

CIGAR LAKE

  • Lloyd Rowson, general manager, Cigar Lake, Cameco

INKAI

  • Sergey Ivanov, deputy director general, technical services, Cameco Kazakhstan LLP

Caution about forward-looking information

This news release includes statements and information about our expectations for the future, which we refer to as forward-looking information. Forward-looking information is based on our current views, which can change significantly, and actual results and events may be significantly different from what we currently expect.

Examples of forward-looking information in this news release include: our views regarding uranium market fundamentals and improving market sentiment; our expectation of capturing value from a growing demand for nuclear energy and its role in a transition to clean energy, the reduction of greenhouse gas emissions and achieving a net-zero carbon economy; our continuing commitment to our supply discipline strategy; our expectations regarding future operating and production for Cigar Lake and McArthur River/Key Lake and our ability to take the necessary steps to do so; our intention to keep our tier-two assets on care and maintenance, and expectation that production levels at Inkai will continue to be reduced until the end of 2023, unless Kazatomprom further extends its supply reductions; our intention to maintain our announced production plan pending further improvements in the uranium market and progress in our long-term contracting; our expectations regarding improvement in our earnings and cash flow as we transition McArthur River/Key Lake to its planned production capacity; our expectation of continuing to meet sales commitments from a combination of production, inventory and purchases, and sourcing more committed sales from lower-cost produced pounds; our expectations that in 2022 we could produce up to 5 million pounds (100% basis) of uranium at McArthur River/Key Lake, and 15 million pounds (100% basis) at Cigar Lake; our plan for our share of production to be at about 45% below our productive capacity starting in 2024, including a ramp-up to planned production of 15 million pounds per year (100% basis), or 40% below its annual licensed capacity, at McArthur River/Key Lake by 2024, and our plan to reduce production at Cigar Lake to 13.5 million pounds per year (100% basis), or 25% below its annual licensed capacity; the expected care and maintenance costs relating to the ongoing suspension of our tier-two assets, and expected operational readiness costs at McArthur River/Key Lake; our anticipation that we will continue to be resilient, be able to take advantage of improving fundamentals and the potential for significant improvement in our financial performance; our expectation that we are well-positioned to self-manage risk; our intention to pay an annual dividend of $0.


Contacts

Investor inquiries:
Rachelle Girard
306-956-6403
This email address is being protected from spambots. You need JavaScript enabled to view it.

Media inquiries:
Jeff Hryhoriw
306-385-5221
This email address is being protected from spambots. You need JavaScript enabled to view it.


Read full story here
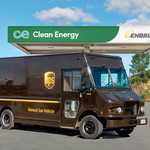
HOUSTON--(BUSINESS WIRE)--Hess Midstream LP (NYSE: HESM) today announced publication of its inaugural Sustainability Report as part of its commitment to transparency about environmental, social and governance plans and performance. The report is available at https://hessmidstream.gcs-web.com/sustainability-report.


Leading sustainability reporting frameworks were used to develop the Hess Midstream Sustainability Report including the Energy Infrastructure Council and GPA Midstream Association Environment, Social and Governance Reporting Template, the Sustainability Accounting Standards Board standard for oil and gas – midstream, the Taskforce for Climate-Related Financial Disclosures and the Global Reporting Initiative Standards.

The Hess Midstream Sustainability Report is a companion to Hess Corporation’s 2020 Sustainability Report, available at www.hess.com/sustainability, which provides greater detail on sustainability strategy, management systems and programs for Hess Corporation that also apply to Hess Midstream.

About Hess Midstream

Hess Midstream is a fee based, growth oriented midstream company that owns, operates, develops and acquires a diverse set of midstream assets to provide services to Hess and third party customers. Hess Midstream owns oil, gas and produced water handling assets that are primarily located in the Bakken and Three Forks Shale plays in the Williston Basin area of North Dakota. More information is available at www.hessmidstream.com.


Contacts

Investor:
Jennifer Gordon
(212) 536-8244

Media:

Robert Young
(713) 496-6076

Offshore Source Logo

Offshore Source keeps you updated with relevant information concerning the Offshore Energy Sector.

Any views or opinions represented on this website belong solely to the author and do not represent those of the people, institutions or organizations that Offshore Source or collaborators may or may not have been associated with in a professional or personal capacity, unless explicitly stated.

Corporate Offices

Technology Systems Corporation
8502 SW Kansas Ave
Stuart, FL 34997

info@tscpublishing.com