Business Wire News

  • Solution opens potential for medium to long-haul routes of 2500 km for 19 to 100 passenger aircraft
  • Distributed propulsor nacelles on the wings increase safety and free-up valuable fuselage space

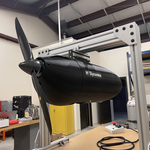
AUSTIN, Texas & TOULOUSE, France--(BUSINESS WIRE)--#aviation--H3 Dynamics has successfully completed the world’s first fully integrated hydrogen-electric propulsion aircraft nacelle, the core enabling power solution for propulsion of future hydrogen aircraft designs.


In the coming years, such a distributed hydrogen electric propulsion architecture could fly 19, 80 or even over 100 passengers, allowing airlines to cover medium and long-haul routes over 2500 km, beyond the short-haul flight distances targeted by emerging battery-based aircraft.

Instead of a single centralized hydrogen fuel cell system, H3 Dynamics distributes multiple integrated powertrains incorporating batteries, fuel cells, hydrogen storage, and smaller electric motors across the wings. This means the size of each fuel cell system, hybrid battery pack, and heat management challenges all become smaller, making systems more manageable and safer.

In 2018, H3 Dynamics filed international patents for full-scale distributed hydrogen propulsion and announced plans for “Element One”, a visionary hydrogen aircraft that applies this technology. Two years later a global hydrogen aviation movement was born: industry leaders announced new hydrogen aircraft plans and startups formed in a new race to the skies.

“Today’s announcement marks a key milestone for H3 Dynamics and the broader aviation industry,” stated Founder and CEO Taras Wankewycz. “It’s the world’s first real-working propulsion system capable of being distributed on the wings of new zero emission aircraft.”

H3 Dynamics has been working alongside the realities of safety certification timelines and entering the market with lower risk, reduced weight unmanned platforms, progressing step by step towards heavier cargo and manned platforms.

H3 Dynamics’ new hydrogen propulsion systems will begin flight tests in France in the coming weeks.

About H3 Dynamics: www.h3dynamics.com

H3 Dynamics is on a mission to decarbonize aviation with a unique solution focused on distributed hydrogen-electric propulsion. The company is implementing an incremental roadmap with 3 key steps, first scaling revenue with autonomous aerial analytics services, then moving to autonomous hydrogen aerial cargo solutions, and powering passenger flight as a final step. The company currently has 80 employees and services clients globally from its 3 regional headquarters in Austin, Singapore, and Paris.


Contacts

MEDIA:
Taras Wankewycz
This email address is being protected from spambots. You need JavaScript enabled to view it.
+33 6 61 02 65 94

TORONTO--(BUSINESS WIRE)--Superior Plus Corp. (“Superior”) (TSX: SPB):


February 2022 Cash Dividend - $0.06 per share

Superior Plus Corp. (“Superior”) today announced its cash dividend for the month of February 2022 of $0.06 per share payable on March 15, 2022. The record date is February 28, 2022 and the ex-dividend date will be February 25, 2022. Superior’s annualized cash dividend rate is currently $0.72 per share. This dividend is an eligible dividend for Canadian income tax purposes.

2021 Fourth Quarter and Year-End Results and Conference Call

Superior expects to release its 2021 fourth quarter and year-end results on Thursday, February 17, 2022 after market close. A conference call and webcast for investors, analysts, brokers and media representatives to discuss the 2021 Fourth Quarter and Year-End Results is scheduled for 10:30 a.m. EST on Friday, February 18, 2022. To participate in the call, dial: 1-844-389-8661. Internet users can listen to the call live at: https://edge.media-server.com/mmc/p/o8johndw, or as an archived call, on Superior's website at: www.superiorplus.com under the Events section.

About the Corporation

Superior is a leading North American distributor and marketer of propane and distillates and related products and services, servicing over 780,000 customer locations in the U.S. and Canada.

For further information about Superior, please visit Superior’s website at: www.superiorplus.com or contact: Beth Summers, Executive Vice President and Chief Financial Officer, Tel: (416) 340-6015, or Rob Dorran, Vice President, Capital Markets, Tel: (416) 340-6003, E-mail: This email address is being protected from spambots. You need JavaScript enabled to view it., Toll Free: 1-866-490-PLUS (7587).

Forward Looking Information

This news release contains certain forward-looking information and statements that are based on Superior’s current expectations, estimates, projections and assumptions in light of its experience and its perception of historical trends. In this news release, such forward-looking information and statements can be identified by terminology such as “will”, "expects", "annualized", and similar expressions.

In particular, this news release contains forward-looking statements and information relating to: future dividends which may be declared on Superior’s common shares, the dividend payment, the tax treatment thereof, and the receipt of cash dividends. These forward-looking statements are being made by Superior based on certain assumptions that Superior has made in respect thereof as at the date of this news release, regarding, among other things: the success of Superior’s operations; prevailing commodity prices, margins, volumes and exchange rates; that Superior’s future results of operations will be consistent with past performance and management expectations in relation thereto; the continued availability of capital at attractive prices to fund future capital requirements; future operating costs; that any required commercial agreements can be reached; that all required regulatory and environmental approvals can be obtained on the necessary terms in a timely manner. These forward-looking statements are not guarantees of future performance and are subject to a number of known and unknown risks and uncertainties, including, but not limited to: the regulatory environment and decisions; non-performance of agreements in accordance with their terms; the impact of competitive entities and pricing; reliance on key industry partners and agreements; actions by governmental or regulatory authorities including changes in tax laws and treatment, or increased environmental regulation; adverse general economic and market conditions in Canada, North America and elsewhere; fluctuations in operating results; labour and material shortages; and certain other risks detailed from time to time in Superior’s public disclosure documents including, among other things, those detailed under the heading "Risk Factors" in Superior’s management's discussion and analysis and annual information form for the year ended December 31, 2020, which can be found at www.sedar.com.

Accordingly, readers are cautioned that events or circumstances could cause results to differ materially from those predicted, forecasted or projected. Such forward-looking statements are expressly qualified by the above statements. Superior does not undertake any obligation to publicly update or revise any forward looking statements or information contained herein, except as required by applicable laws.


Contacts

Beth Summers
Executive Vice President and Chief Financial Officer
Tel: (416) 340-6015
or
Rob Dorran
Vice President, Capital Markets
Tel: (416) 340-6003
E-mail: This email address is being protected from spambots. You need JavaScript enabled to view it.
Toll Free: 1-866-490-PLUS (7587).

  • Recorded GAAP losses were $0.05 per share for the year and GAAP earnings were $0.22 per share for the fourth quarter of 2021, compared to losses of $1.05 and earnings of $0.09, respectively, per share for the same periods in 2020.
  • Non-GAAP core earnings were $1.08 per share for the year and $0.28 per share for the fourth quarter of 2021, compared to $1.61 and $0.21, respectively, per share for the same periods in 2020.
  • Non-GAAP core earnings were consistent with guidance for the year when adjusted for potentially dilutive securities, landing at $1.00 per share.
  • 2022 EPS guidance initiated for GAAP earnings in the range of $0.89 to $1.23 and non-GAAP core earnings in the range of $1.07 to $1.13 per share.
  • On February 8, 2022, Pacific Gas and Electric Company declared payment of all cumulative and unpaid dividends on its preferred shares as of January 31, 2022 and dividends that will be accrued through April 30, 2022, payable on May 13, 2022 and May 15, 2022, respectively, to shareholders of record on April 29, 2022.
  • Completed Enhanced Vegetation Management work on 1,983 miles of powerlines in extreme or elevated fire-risk areas, exceeding goal by 10%.

SAN FRANCISCO--(BUSINESS WIRE)--PG&E Corporation (NYSE: PCG) recorded full-year losses of $102 million, or $0.05 per share and fourth-quarter 2021 income available for common shareholders of $472 million, or $0.22 per share, as reported in accordance with generally accepted accounting principles (GAAP). This compares with losses attributable to common shareholders of $1.3 billion, or $1.05 per share, for the full year of 2020 and income available for common shareholders of $200 million, or $0.09 per share, for the fourth quarter of 2020.

GAAP results include non-core items that management does not consider representative of ongoing earnings, which totaled $2.2 billion after tax, or $1.13 per share, for the year. These results were primarily driven by costs related to the amortization of Wildfire Fund contributions under Assembly Bill (AB) 1054, PG&E Corporation’s and Pacific Gas and Electric Company’s (Utility) reorganization cases under Chapter 11 of the U.S. Bankruptcy Code (Chapter 11), 2019-2020 wildfire-related costs, investigation remedies, and prior period net regulatory recoveries.

Our performance in 2021 confirms my confidence in our future,” said Patti Poppe, CEO of PG&E Corporation. “We met our commitments for the year, and we intend to do so again in 2022. We are a safer company than we were before. And we will use our new operational and organizational structures to build on that progress every day, making investments to produce triple-bottom-line results for people, the planet, and California’s prosperity.”

Non-GAAP Core Earnings

PG&E Corporation’s non-GAAP core earnings, which exclude non-core items, were $2.1 billion, or $1.08 per share (or $1.00 per share on a fully diluted basis), for the full year 2021, compared with $2.0 billion, or $1.61 per share, during the same period in 2020. For the fourth-quarter, non-GAAP core earnings were $596 million, or $0.28 per share, compared with $441 million, or $0.21 per share, during the same period in 2020.

The increase in quarter-over-quarter non-GAAP core earnings per share was primarily driven by regulatory items, timing of taxes, cost reduction, and timing of nuclear refueling outages, partially offset by growth in rate base earnings and unrecoverable interest expense.

PG&E Corporation uses “non-GAAP core earnings,” which is a non-GAAP financial measure, in order to provide a measure that allows investors to compare the underlying financial performance of the business from one period to another, exclusive of non-core items. See the accompanying tables for a reconciliation of non-GAAP core earnings to consolidated earnings (loss) attributable to common shareholders.

2022 Guidance

PG&E Corporation is initiating 2022 GAAP earnings guidance in the range of $0.89 to $1.23 per share, which includes non-core items. PG&E Corporation is initiating 2022 non-core items guidance in the range of $(210) million to $380 million after tax, reflecting costs related to the amortization of Wildfire Fund contributions under AB1054, PG&E Corporation’s and Utility’s reorganization cases under Chapter 11, investigation remedies, and 2019-2020 wildfire-related costs, partially offset by rate neutral securitization and Fire Victim Trust tax benefit and prior period net regulatory recoveries.

On a non-GAAP basis, the guidance range for projected 2022 core earnings is initiated at $1.07 to $1.13 per share. Factors driving non-GAAP core earnings include unrecoverable interest expense of $330 million to $370 million after tax and other earnings factors, including AFUDC equity, incentive revenues, tax benefits, and cost savings, net of below-the-line costs.

Guidance is based on various assumptions and forecasts, including those relating to authorized revenues, future expenses, capital expenditures, rate base, equity issuances, rate neutral securitization, and certain other factors.

Preferred Stock Dividend Information

On February 8, 2022, the Utility declared payment of all cumulative and unpaid dividends on the Utility’s preferred stock as of January 31, 2022 totaling $59.1 million payable on May 13, 2022 to holders of record on April 29, 2022 and declared a dividend on the Utility’s preferred stock totaling $3.5 million that will be accrued during the three-month period ending April 30, 2022 payable on May 15, 2022 to holders of record on April 29, 2022.

The Utility will pay dividends on its eight series of preferred stock as follows:

First Preferred
Stock, $25 Par Value


Quarterly Dividend
to be Paid Per Share


Redeemable


5.00%

$0.31250

5.00% Series A

$0.31250

4.80%

$0.30000

4.50%

$0.28125

4.36%

$0.27250

Non-Redeemable


6.00%

$0.37500

5.50%

$0.34375

5.00%

$0.31250

To be eligible for the preferred dividend payment, a shareholder must have purchased the stock at least one trading day before the applicable record date.

Supplemental Financial Information

In addition to the financial information accompanying this release, presentation slides have been furnished to the Securities and Exchange Commission (SEC) and are available on PG&E Corporation’s website at: http://investor.pgecorp.com/financials/quarterly-earnings-reports/default.aspx.

Earnings Conference Call

PG&E Corporation will also hold a conference call on February 10, 2022, at 11:00 a.m. Eastern Time (8:00 a.m. Pacific Time) to discuss its fourth quarter 2021 results. The public can access the conference call through a simultaneous webcast. The link is provided below and will also be available from the PG&E Corporation website.

What: Fourth Quarter 2021 Earnings Call

When: Thursday, February 10, 2022 at 11:00 a.m. Eastern Time

Where: http://investor.pgecorp.com/news-events/events-and-presentations/default.aspx

A replay of the conference call will be archived through February 17, 2022 at http://investor.pgecorp.com/news-events/events-and-presentations/default.aspx.

Alternatively, a toll-free replay of the conference call may be accessed shortly after the live call through February 17, 2022, by dialing (800) 585-8367. International callers may dial (416) 621-4642. For both domestic and international callers, the confirmation code 6580027 will be required to access the replay.

Public Dissemination of Certain Information

PG&E Corporation and the Utility routinely provide links to the Utility’s principal regulatory proceedings with the CPUC and the Federal Energy Regulatory Commission (FERC) at http://investor.pgecorp.com, under the “Regulatory Filings” tab, so that such filings are available to investors upon filing with the relevant agency. PG&E Corporation and the Utility also routinely post, or provide direct links to, presentations, documents, and other information that may be of interest to investors at http://investor.pgecorp.com, under the “Chapter 11,” “Wildfire and Safety Updates” and “News & Events: Events & Presentations” tabs, respectively, in order to publicly disseminate such information. It is possible that any of these filings or information included therein could be deemed to be material information.

About PG&E Corporation

PG&E Corporation (NYSE: PCG) is a holding company headquartered in San Francisco. It is the parent company of Pacific Gas and Electric Company, an energy company that serves 16 million Californians across a 70,000-square-mile service area in Northern and Central California. For more information, visit http://www.pgecorp.com.

Forward-Looking Statements

This news release contains forward-looking statements that are not historical facts, including statements about the beliefs, expectations, estimates, future plans and strategies of PG&E Corporation and the Utility, including but not limited to earnings guidance for 2022. These statements are based on current expectations and assumptions, which management believes are reasonable, and on information currently available to management, but are necessarily subject to various risks and uncertainties. In addition to the risk that these assumptions prove to be inaccurate, factors that could cause actual results to differ materially from those contemplated by the forward-looking statements include factors disclosed in PG&E Corporation and the Utility’s joint annual report on Form 10-K for the year ended December 31, 2021 and other reports filed with the SEC, which are available on PG&E Corporation's website at www.pgecorp.com and on the SEC website at www.sec.gov. PG&E Corporation and PG&E undertake no obligation to publicly update or revise any forward-looking statements, whether due to new information, future events or otherwise, except to the extent required by law.

PG&E CORPORATION

CONSOLIDATED STATEMENTS OF INCOME


Year ended December 31,


2021


2020


2019

Operating Revenues


Electric

$

15,131


$

13,858


$

12,740


Natural gas


5,511


4,611


4,389


Total operating revenues


20,642


18,469


17,129


Operating Expenses


Cost of electricity


3,232


3,116


3,095


Cost of natural gas


1,149


782


734


Operating and maintenance


10,200


8,684


8,725


Wildfire-related claims, net of recoveries


258


251


11,435


Wildfire fund expense


517


413


Depreciation, amortization, and decommissioning


3,403


3,468


3,234


Total operating expenses


18,759


16,714


27,223


Operating Income (Loss)


1,883


1,755


(10,094

)

Interest income


20


39


82


Interest expense


(1,601

)


(1,260

)


(934

)

Other income, net


457


483


250


Reorganization items, net


(11

)


(1,959

)


(346

)

Income (Loss) Before Income Taxes


748


(942

)


(11,042

)

Income tax provision (benefit)


836


362


(3,400

)

Net Loss


(88

)


(1,304

)


(7,642

)

Preferred stock dividend requirement of subsidiary


14


14


14


Loss Attributable to Common Shareholders

$

(102

)


$

(1,318

)


$

(7,656

)

Weighted Average Common Shares Outstanding, Basic


1,985


1,257


528


Weighted Average Common Shares Outstanding, Diluted


1,985


1,257


528


Net Loss Per Common Share, Basic

$

(0.05

)


$

(1.05

)


$

(14.50

)

Net Loss Per Common Share, Diluted

$

(0.05

)


$

(1.05

)


$

(14.50

)

Reconciliation of PG&E Corporation’s Consolidated Earnings (Loss) Attributable to Common Shareholders in Accordance with Generally Accepted Accounting Principles (“GAAP”) to Non-GAAP Core Earnings

Fourth Quarter, 2021 vs. 2020

(in millions, except per share amounts)


Three Months Ended

December 31,


Year Ended

December 31,


Earnings


Earnings per
Common Share
(Diluted)


Earnings


Earnings per
Common Share
(Diluted)

(in millions, except per share amounts)


2021


2020


2021


2020


2021


2020


2021


2020

PG&E Corporation's Earnings (Loss) on a GAAP basis

$

472

$

200


$

0.22

$

0.09


$

(102

)

$

(1,318

)

$

(0.05

)

$

(1.05

)

Non-core items: (1)


Amortization of Wildfire Fund contribution (2)


85


86


0.04


0.04


372


297


0.19


0.24


Bankruptcy and legal costs (3)


34


59


0.02


0.03


1,413


2,651


0.71


2.11


2019-2020 wildfire-related costs, net of insurance (4)


4


45


0.02


145


213


0.07


0.17


Investigation remedies (5)


1


71


0.03


148


223


0.07


0.18


Prior period net regulatory recoveries (6)


(21

)


(0.01

)


162


(46

)


0.08


(0.04

)

PG&E Corporation’s Non-GAAP Core Earnings (7)

$

596

$

441


$

0.28

$

0.21


$

2,138


$

2,020


$

1.08


$

1.61


All amounts presented in the table above and footnotes below are tax adjusted at PG&E Corporation’s statutory tax rate of 27.98% for 2021 and 2020, except for certain costs that are not tax deductible. Amounts may not sum due to rounding. Reflects 2,128 million and 1,985 million weighted average shares during the three and twelve months ended December 31, 2021, respectively.


(1)

“Non-core items” include items that management does not consider representative of ongoing earnings and affect comparability of financial results between periods, consisting of the items listed in the table above. See Exhibit H: Use of Non-GAAP Financial Measures.


(2)

The Utility recorded costs of $118 million (before the tax impact of $33 million) and $517 million (before the tax impact of $145 million) during the three and twelve months ended December 31, 2021, respectively, associated with the amortization of Wildfire Fund contributions related to Assembly Bill ("AB") 1054.


(3)

PG&E Corporation and the Utility recorded costs of $50 million (before the tax impact of $16 million) and $1.5 billion (before the tax impact of $55 million) during the three and twelve months ended December 31, 2021, respectively, for bankruptcy and legal costs associated with PG&E Corporation and the Utility's Chapter 11 filing. The Utility incurred $32 million (before the tax impact of $9 million) and $135 million (before the tax impact of $38 million) during the three and twelve months ended December 31, 2021, respectively, related to exit financing costs. PG&E Corporation and the Utility also incurred legal and other costs of $18 million (before the tax impact of $7 million) and $63 million (before the tax impact of $17 million) during the three and twelve months ended December 31, 2021, respectively. The Utility also recorded a $1.3 billion adjustment for the grantor trust election related to the Fire Victim Trust during the twelve months ended December 31, 2021.

(in millions, pre-tax)

Three Months Ended
December 31, 2021


Year Ended
December 31, 2021

Exit financing

$

32


$

135

Legal and other costs


18


63

Fire Victim Trust grantor trust election


1,270

Bankruptcy and legal costs

$

50


$

1,469

(4)

The Utility incurred costs, net of probable insurance recoveries, of $6 million (before the tax impact of $2 million) and $202 million (before the tax impact of $57 million) during the three and twelve months ended December 31, 2021, respectively, associated with the 2019-2020 wildfires. This includes costs of $5 million (before the tax impact of $1 million) and $18 million (before the tax impact of $5 million) during the three and twelve months ended December 31, 2021, respectively, for legal and other costs related to the 2019 Kincade fire, as well as $7 million (before the tax impact of $2 million) and $21 million (before the tax impact of $6 million) during the three and twelve months ended December 31, 2021, respectively, for legal and other costs related to the 2020 Zogg fire. In addition, the Utility accrued charges for third-party claims of $175 million (before the tax impact of $49 million) during the twelve months ended December 31, 2021, related to the 2019 Kincade fire, and $100 million (before the tax impact of $28 million) during the twelve months ended December 31, 2021, related to the 2020 Zogg fire. In addition, the Utility also incurred costs of $1 million (before the tax impact of $0.2 million) during the twelve months ended December 31, 2021 for clean-up and repair costs related to the 2019 Kincade fire, and $5 million (before the tax impact of $2 million) during the twelve months ended December 31, 2021 for clean-up and repair costs related to the 2020 Zogg fire. These costs were partially offset by probable insurance recoveries of $6 million (before the tax impact of $2 million) and $118 million (before the tax impact of $33 million) during the three and twelve months ended December 31, 2021, respectively, related to the 2020 Zogg fire.

(in millions, pre-tax)

Three Months Ended
December 31, 2021


Year Ended
December 31, 2021

2019 Kincade fire-related costs


Legal and other costs

$

5


$

18


Third-party claims


175


Utility clean-up and repairs


1


2020 Zogg fire-related costs, net of insurance


Legal and other costs


7


21


Insurance recoveries


(6

)


(118

)

Third-party claims


100


Utility clean-up and repairs


5


2019-2020 wildfire-related costs, net of insurance

$

6


$

202


(5)

The Utility recorded a net benefit of $0.3 million (before the tax detriment of $1 million) and incurred costs of $171 million (before the tax impact of $23 million) during the three and twelve months ended December 31, 2021, respectively, associated with investigation remedies. The Utility recorded $5 million (before the tax impact of $1 million) and $74 million (before the tax impact of $18 million) during the three and twelve months ended December 31, 2021, respectively, related to the California Public Utilities Commission's ("CPUC") Order Instituting Investigation ("OII") into the 2017 Northern California Wildfires and 2018 Camp Fire (the "Wildfires OII") settlement, as modified by the decision different dated April 20, 2020. The Utility also recorded a reduction of $6 million (before the tax detriment of $2 million) and incurred costs of $12 million (before the tax impact of $3 million) during the three and twelve months ended December 31, 2021, respectively, for restoration and rebuild costs associated with the town of Paradise ("2018 Camp Fire"). The Utility also recorded a $40 million charge during the twelve months ended December 31, 2021, in connection with a settlement agreement with the Safety and Enforcement Division's investigation into the 2019 Kincade fire. The Utility also recorded costs of $0.5 million (before the tax impact of $0.1 million) $25 million (before the tax impact of $0.4 million) during the three and twelve months ended December 31, 2021, for system enhancements related to the locate and mark OII. The Utility also recorded an incremental charge of $20 million (before the tax impact of $1 million) during the twelve months ended December 31, 2021 associated with the May 26, 2021 Presiding Officer's Decision ("POD") for the Public Safety Power Shutoff ("PSPS") Order to Show Cause for the Fall 2019 PSPS events.

(in millions, pre-tax)

Three Months Ended
December 31, 2021


Year Ended
December 31, 2021

Wildfire OII disallowance and system enhancements

$

5


$

74

Paradise restoration and rebuild


(6

)


12

2019 Kincade fire settlement


40

Locate and mark OII system enhancements


1


25

Incremental PSPS charge


20

Investigation remedies

$


$

171

(6)

The Utility incurred $257 million (before the tax impact of $95 million) during the twelve months ended December 31, 2021, associated with prior period net regulatory recoveries. This includes $135 million (before the tax impact of $61 million) during the twelve months ended December 31, 2021 related to wildfire response and mitigation regulatory matters, including the 2020 Wildfire Mitigation and Catastrophic Events application settlement. The Utility also recorded a $122 million (before the tax impact of $34 million) adjustment during the twelve months ended December 31, 2021 reflecting the impact of the April 15, 2021 FERC order denying the Utility's request for rehearing on the Transmission Owner ("TO") 18, which rejected the Utility's direct assignment of common plant to FERC, and impacted TO revenues recorded through December 31, 2020.

(in millions, pre-tax)

Three Months Ended
December 31, 2021


Year Ended

December 31, 2021

Wildfire response and mitigation regulatory matters

$


$

135

TO18 FERC ruling impact


122

Prior period net regulatory recoveries

$


$

257

(7)

"Non-GAAP core earnings" is a non-GAAP financial measure. See Exhibit H: Use of Non-GAAP Financial Measures.

PG&E Corporation's 2022 Earnings Guidance


2022

EPS Guidance

Low

High

Estimated Earnings on a GAAP basis


$

0.89


$

1.23


Estimated Non-Core Items: (1)


Amortization of Wildfire Fund contribution (2)

~


0.16


~


0.16


Bankruptcy and legal costs (3)

~


0.09


~


0.04


Investigation remedies (4)

~


0.05


~


0.05


2019-2020 wildfire-related costs (5)

~


0.02


~


0.01


Rate neutral securitization and Fire Victim Trust tax benefit (6)

~


(0.11

)

~


(0.31

)

Prior period net regulatory recoveries (7)

~


(0.03

)

~


(0.03

)

Estimated EPS on a non-GAAP Core Earnings basis

~

$

1.07


~

$

1.13


All amounts presented in the table above and footnotes below are tax adjusted at PG&E Corporation’s statutory tax rate of 27.98% for 2022, except for certain costs that are not tax deductible. Amounts may not sum due to rounding.


(1)

“Non-core items” include items that management does not consider representative of ongoing earnings and affect comparability of financial results between periods. See Exhibit H: Use of Non-GAAP Financial Measures.


(2)

"Amortization of Wildfire Fund contribution” represents the amortization of Wildfire Fund contributions related to AB1054. The total offsetting tax impact for the low and high non-core guidance range is $132 million.


2022

(in millions, pre-tax)


Low guidance range


High guidance range

Amortization of Wildfire Fund contribution


~

$

470


~

$

470

(3)

“Bankruptcy and legal costs" consists of exit financing costs including interest on temporary Utility debt and write-off of unamortized fees related to the retirement of PG&E Corporation debt, and legal and other costs associated with PG&E Corporation and the Utility's Chapter 11 filing. The total offsetting tax impact for the low and high non-core guidance range is $78 million and $31 million, respectively.


2022

(in millions, pre-tax)


Low guidance range


High guidance range

Exit financing


~

$

180


~

$

60

Legal and other costs


~


100


~


50

Bankruptcy and legal costs


~

$

280


~

$

110

(4)

“Investigation remedies" includes costs related to the 2019 Kincade fire settlement with the Safety and Enforcement Division approved by the CPUC on December 2, 2021, the Wildfires OII decision different, Paradise restoration and rebuild, and the locate and mark OII system enhancements. The total offsetting tax impact for the low and high non-core guidance range is $28 million.


2022

(in millions, pre-tax)


Low guidance range


High guidance range

2019 Kincade fire settlement


~

$

85


~

$

85

Wildfire OII disallowance and system enhancements


~


20


~


20

Paradise restoration and rebuild


~


15


~


15

Locate and mark OII system enhancements


~


5


~


5

Investigation remedies


~

$

125


~

$

125

(5)

“2019-2020 wildfire-related costs" includes legal and other costs associated with the 2019 Kincade fire. The total offsetting tax impact for the low and high non-core guidance range is $17 million and $4 million, respectively.


2022

(in millions, pre-tax)

Low guidance range


High guidance range

2019 Kincade fire-related costs


Legal and other costs

~

$

60


~

$

15

2019-2020 wildfire-related costs

~

$

60


~

$

15

(6)

Rate neutral securitization and Fire Victim Trust tax benefit" includes the impact of post-emergence securitization and tax benefits related to Fire Victim Trust. Impacts of the post-emergence rate neutral securitization include the establishment of a securitization regulatory asset and an offsetting regulatory liability associated with revenue credits funded by up-front shareholder contributions and Net Operation Loss monetization. Fire Victim Trust tax benefits include tax benefits recognized upon the sale of PG&E shares by the Fire Victim Trust, which PG&E has elected to treat as a grantor trust. The low and high cases reflect the assumption that the CPUC's final decision, issued on May 11, 2021, authorizing the securitization of $7.5 billion of wildfire-related claims, will become final and non-appealable in 2022. The low case includes tax benefits of the Fire Victim Trust shares sold as of February 9, 2022 and the high case reflects an assumption that the Fire Victim trust sells all 477 million shares in 2022. The total offsetting tax impact for the low and high non-core guidance range is $96 million and $2.1 billion, respectively.


Contacts

Investor Relations Contact: 415.972.7080 | Media Inquiries Contact: 415.973.5930 | www.pgecorp.com


Read full story here

DUBLIN--(BUSINESS WIRE)--The "Global Perovskite Solar Cells Market, By Product Type, By Module Type, By Structure, By Application, Estimation & Forecast, 2017 - 2027" report has been added to ResearchAndMarkets.com's offering.


The global Perovskite Solar Cells market held a market value of USD 352.2 Million in 2020 and is estimated to reach USD 2,012.7 Million by the year 2027. The market is anticipated to register a CAGR of 28.7% during the forecast period.

Perovskite solar cells consists of a perovskite-structured compound, mostly a hybrid inorganic-organic lead or tin-halide-based material. Perovskite is a material having same crystal structure as mineral calcium titanium oxide. The market is anticipated to be driven by the high efficiency of perovskite solar cells. Furthermore, growing focus on solar energy is also estimated to boost the market growth. The market is expected to be restrained by the presence of toxic materials, such as lead coupled with lack of standard solutions.

Companies Mentioned

  • Alfa Aesar
  • BASF
  • Dyenamo
  • Energy Materials Corp.
  • Frontier Energy Solution
  • Fujifilm
  • Fujikura
  • GCL Suzhou Nanotechnology Co., Ltd.
  • Greatcell Energy
  • Hangzhou Microquanta
  • Heiking PV Technology Co., Ltd.
  • Hubei Wonder Solar
  • Hunt Perovskite Technologies (HPT)
  • InfinityPV
  • Jinkosolar
  • Kyocera
  • LG Chem
  • Li Yuan New Energy Technology Co.
  • Merck
  • Microquanta Semiconductor
  • Oxford PV
  • Panasonic
  • Saule Technologies
  • Sharp
  • Solartek
  • Solaronix SA
  • Solliance
  • Tandem PV
  • Toshiba
  • Trina Solar
  • WonderSolar

Growth Influencers:

High efficiency of perovskite solar cells

High efficiency of perovskite solar cells in combination with low cost of processes and materials raise the preferability of these cells over the commercial silicon or other inorganic and organic solar cells. These cells also enable further advancement of the power conversion efficiency beyond those afforded by the silicon solar cells. Power conversion efficiency of metal halide perovskite-based solar cells has reached 25% in 2020 from 3% in 2006. Therefore, such increasing efficiency of perovskite solar cells is expected to boost the market growth.

Segments Overview:

The global perovskite solar cells market is segmented into product type, module type, structure, and application.

By Product Type

  • Hybrid PSCs
  • Flexible PSCs
  • Multi-Junction PSCs

The hybrid PSCs segment is expected to hold the largest market share of around 50%, as they are mostly commonly used. The flexible PSCs segment is anticipated to grow at the fastest CAGR of around 29.8% owing to their increasing demand in the stream of wearable power supply and integration with architectures owing to their various advantages, such as portability, light weight, flexibility, and compatibility with irregular electronic items.

By Module Type

  • Rigid Module
  • Flexible Module

The rigid module segment is estimated to account for the dominant share of the market owing to their rising demand for various applications. The flexible module segment is also expected to grow significantly owing to various technological advancements.

By Structure

  • Planar Perovskite Solar Cells
  • Mesophorous Perovskite Solar Cells

The mesophorous perovksite solar cells segment is expected to surpass a market value of USD 350 million by 2025 as it is the most popularly used structures in fabrication of product, with over 20% power conversion efficiency. Planar perovskite solar cells segment is anticipated to fuel the market growth owing to its growing demand.

By Application

  • Smart Glass
  • BIPV (Building Integrated PVs)
  • Power Station
  • Defense & Aerospace
  • Transportation & Mobility
  • Consumer Electronics (Portable Devices)
  • Utilities
  • Off-Grid Application
  • Others

The BIPV (Building Integrated PVs) segment is estimated to hold the largest market share owing to growing demand of perovskite solar cells in building envelope and part of building components, such as windows, roofs, or facades, among others. The consumer electronics (portable devices) segment is expected to surpass a market size of about USD 400 million by 2027.

The global Perovskite Solar Cells market report answers questions such as:

  • What is the market size and forecast of the Global Perovskite Solar Cells Market?
  • What are the inhibiting factors and impact of COVID-19 on the Global Perovskite Solar Cells Market during the assessment period?
  • Which are the products/segments/applications/areas to invest in over the assessment period in the Global Perovskite Solar Cells Market?
  • What is the competitive strategic window for opportunities in the Global Perovskite Solar Cells Market?
  • What are the technology trends and regulatory frameworks in the Global Perovskite Solar Cells Market?
  • What is the market share of the leading players in the Global Perovskite Solar Cells Market?
  • What modes and strategic moves are considered favorable for entering the Global Perovskite Solar Cells Market?

For more information about this report visit https://www.researchandmarkets.com/r/xyn8il


Contacts

ResearchAndMarkets.com
Laura Wood, Senior Press Manager
This email address is being protected from spambots. You need JavaScript enabled to view it.

For E.S.T Office Hours Call 1-917-300-0470
For U.S./CAN Toll Free Call 1-800-526-8630
For GMT Office Hours Call +353-1-416-8900

  • SES Korea formed, with plans to build a pre-production facility in South Korea
  • SES Korea joins SES Shanghai Giga and SES Boston to accelerate A-sample joint development with GM, Hyundai and Honda, on heels of capital raise from recent business combination and listing on NYSE
  • Cash raised by recent listing on the NYSE is expected to enhance SES growth plans

BOSTON--(BUSINESS WIRE)--$SES--SES AI Corporation (NYSE: SES), headquartered in Boston, a global leader in the development and manufacturing of high-performance lithium-metal (Li-Metal) rechargeable batteries for electric vehicles (EVs) and other applications, announced today that it has incorporated its subsidiary SES Korea and plans to build a pre-production facility in South Korea.


“It’s all about speed and winning the race. Momentum is building as additional auto OEMs want to establish arrangements for the joint development of A-sample batteries with SES. Having SES Boston, Shanghai Giga, and now SES Korea gives us access to deep talent pools and the highly efficient ecosystems in South Korea and China, the two industry powerhouses, as well as unparalleled chemistry and software capabilities in the United States. We also believe that the cash raised by our recent business combination with Ivanhoe Capital Acquisition Corp. and our listing on the New York Stock Exchange will help us to accelerate these developments,” said Dr. Qichao Hu, Founder and CEO of SES.

SES Korea will be SES’s second major operation outside of the United States, after SES Shanghai Giga. SES Korea expects to have approximately 50 employees by the end of 2022. South Korea is home to several of SES’s important strategic partners including Hyundai Motor Company (Hyundai), SK Inc. (SK) and LG Corporation.

South Korea has a strong battery supply chain and a deep talent pool. SES Korea and SES Shanghai Giga will focus on different aspects of supply chain development and different A-sample joint development with auto OEMs.

SES has automotive A-sample joint development agreements (JDAs) with General Motors Company (GM), Hyundai, and Honda Motors (Honda). SES is backed by strategic investors including GM, Hyundai, Honda, Geely Auto Group, SAIC Motor, SK, Koch, Applied Materials, Inc., Tianqi Lithium HK Co. Ltd., Vertex Ventures Holdings, Temasek Holdings Limited, affiliates of LG and Foxconn Technology Group and several others.

“The incorporation of SES Korea marks another milestone in our quest to build on SES’s position as a global leader in the development and manufacturing of high-performance Li-Metal batteries for EVs. South Korea is a powerhouse of EV battery development, so we couldn’t be in a better position in terms of having a long-term base in Korea where we will contribute to the development of cell manufacturing equipment and process development, joint development with auto OEMs, and supply chain development,” said Hans Kim, Vice President & Head of SES Korea.

About SES

SES is a global leader in development and production of high-performance Li-Metal rechargeable batteries for electric vehicles (EVs) and other applications. Founded in 2012, SES is an integrated Li-Metal battery manufacturer with strong capabilities in material, cell, module, AI-powered safety algorithms and recycling. Formerly known as SolidEnergy Systems, SES is headquartered in Boston and has operations in Singapore, Shanghai, and Seoul.

Forward-looking statements

This press release may contain certain “forward-looking statements” within the meaning of the Private Securities Litigation Reform Act of 1995, Section 27A of the Securities Act of 1933, as amended, and Section 21E of the Securities and Exchange Act of 1934, as amended, including statements regarding SES’s or its management teams’ expectations, hopes, beliefs, intentions or strategies regarding the future. The words “believe,” “may,” “will,” “estimate,” “continue,” “anticipate,” “intend,” “expect,” “should,” “would,” “could,” “plan,” “project,” “forecast,” “predict,” “possible,” “potential,” “seem,” “seek,” “future,” “outlook,” “target” and other similar expressions that predict or indicate future events or trends that are not statements of historical matters may identify forward-looking statements, but the absence of these words does not mean that a statement is not forward-looking. These forward-looking statements are based on SES’s current expectations and beliefs concerning future developments and involve a number of risks, uncertainties (some of which are beyond SES’s control) or other assumptions. Many factors could cause actual future events to differ materially from the forward-looking statements in this press release, including but not limited to: changes in domestic and foreign business, market, financial, political and legal conditions; the failure to realize the anticipated benefits of the business combination with Ivanhoe Capital Acquisition Corp., which closed on February 3, 2022 (the “Business Combination”); risks relating to the uncertainty of the projected financial information with respect to SES; risks related to the development and commercialization of SES’s battery technology and the timing and achievement of expected business milestones; the effects of competition on SES’s business; the risk that the Business Combination disrupts current plans and operations of SES as a result of the consummation of the business combination; the ability to recognize the anticipated benefits of the Business Combination, which may be affected by, among other things, competition, the ability of the combined company to grow and manage growth profitably, maintain relationships with customers and retain its management and key employees; risks relating SES’s history of no revenues and net losses; the risk that SES’s joint development agreements and other strategic alliances could be unsuccessful; risks relating to delays in the design, manufacture, regulatory approval and launch of SES’s battery cells; the risk that SES may not establish supply relationships for necessary components or pay components that are more expensive than anticipated; risks relating to competition and rapid change in the electric vehicle battery market; safety risks posed by certain components of SES’s batteries; risks relating to machinery used in the production of SES’s batteries; risks relating to the willingness of commercial vehicle and specialty vehicle operators and consumers to adopt electric vehicles; risks relating to SES’s intellectual property portfolio; the ability of the combined company to issue equity or equity-linked securities or obtain debt financing in the future; and those factors discussed under the heading “Risk Factors,” in the definitive proxy statement/prospectus relating to the Business Combination, and other documents of SES filed, or to be filed, with the SEC. There may be additional risks that SES does not presently know or that SES currently believes are immaterial that could also cause actual results to differ from those contained in the forward-looking statements. In addition, forward-looking statements reflect SES’s expectations, plans or forecasts of future events and views only as of the date of this press release. SES anticipates that subsequent events and developments will cause its assessments to change. However, while SES may elect to update these forward-looking statements at some point in the future, SES specifically disclaims any obligation to do so. These forward-looking statements should not be relied upon as representing SES’s assessments as of any date subsequent to the date of this press release. Accordingly, undue reliance should not be placed upon the forward-looking statements.


Contacts

Investors: Eric Goldstein This email address is being protected from spambots. You need JavaScript enabled to view it.
Media: Irene Lam This email address is being protected from spambots. You need JavaScript enabled to view it.

Kahuna, the leading skills and competency management solutions company, specializing in operational skills, announces its sales team achieved over 120% of its goal in the fourth quarter of 2021.

HOUSTON--(BUSINESS WIRE)--#HRTech--Kahuna, the leading skills and competency management company, announced today that it executed a highly successful fourth quarter in 2021, with sales results at 120% of plan, confirming the strong demand for tech-enabled operational skilling initiatives. Among the many customer additions is a Fortune 500 industrial tools and household hardware manufacturer, as well as Fortune 150 multinational energy provider that operates in 15 countries. Fourth-quarter bookings were a new high for Kahuna.


Kahuna’s Vice President of Sales and Marketing, Sean Rohde, attributes the growth to investments the Energy and Manufacturing verticals are making in their employees. “Heavy industries across the globe continue to be impacted by the pandemic and the great resignation. The organizations that we work with believe that modernizing the development of their employees and investing in upskilling initiatives will not only limit negative short-term impacts but ensure their workforce is a competitive differentiator down the road.” Industry experts are supporting this observation. Josh Bersin, a leader in HR Technology, recently highlighted the importance leading organizations are placing on validated skills and competencies. They've prioritized transparency, signaling to their workforce the roles and skills that are growing in market demand. "We know that training and development are among the top reasons employees cite for staying with a company, so providing your workers with the skills they need increases engagement and fosters a culture of continuous learning."

Kahuna is the leader in operational skills and competency management across heavy industries like Energy, Manufacturing, Healthcare, and Field Service. Kahuna provides a cloud-based software platform that focuses on the curation, assignment, assessment, and development of employee skills at the operational role level and in the flow of work. Integrating with customers' existing technology stack is a key tenant to unlocking value for Kahuna’s customers. Making systems like Workday, ServiceMax, Kronos and Taleo, “Skills Aware” with validated data allows organizations to recruit, onboard, manage and develop their workforce more efficiently and effectively. Kahuna’s data model brings a new level of sophistication to scheduling, dispatching, and training the workforce.

“We see great momentum from our primary verticals as organizations execute on the other side of the pandemic. Our customers see Kahuna as an enabler of change from the status quo,” said Jai Shah, CEO and Co-Founder of Kahuna. “The last quarter was a fantastic way to end 2021. We look forward to building on this momentum in helping organizations meet the incredible challenges facing the workforce today.”

About Kahuna Workforce Solutions

Kahuna Workforce Solutions is transforming competency management and workforce planning. Our flagship Kahuna platform helps organizations gain an objective view of their workforce’s capabilities, measure talent supply against current and future demand, and maximize the return on training investment. Kahuna is used in a wide array of industries including oil and gas, healthcare, manufacturing, construction, and aerospace. For information visit www.kahunaworkforce.com.


Contacts

Torrye Metoyer
Director of Marketing
This email address is being protected from spambots. You need JavaScript enabled to view it.

WYOMISSING, Pa.--(BUSINESS WIRE)--#EDL--Pennant Midstream, LLC (“Pennant”), announced that the company has signed a series of agreements throughout 2021 with a subsidiary of Energy Developments Pty Ltd (“EDL”) headquartered in Brisbane, Australia to accept delivery of renewable natural gas (“RNG") into its natural gas gathering system. Pennant is a partnership between UGI Energy Services, LLC (“UGIES”), which is a subsidiary of UGI Corporation (NYSE: UGI), Harvest Midstream I, L.P, and a subsidiary of Williams Companies.


Under the agreements, Pennant will transport the RNG from the Carbon Limestone Landfill located near Youngstown, OH through its existing system and redeliver the gas to EDL’s downstream markets. The Carbon Limestone Landfill gas, a byproduct of naturally decomposing materials in the landfill, will be processed and conditioned by EDL’s largest North American RNG facility to meet Pennant’s gas quality requirements.

The project is scheduled to become operational in early 2023. When fully operational, the Pennant system will take up to 6,500 Mcf (thousand cubic feet) per day of RNG supply. Under a separate agreement, UGIES will manage construction of an interconnecting pipeline and interconnection with Pennant.

Moving this RNG supply to market through EDL and Pennant’s system will provide benefits to the company and to local communities. From an environmental perspective, accepting delivery of the RNG from Carbon Limestone Landfill will reduce CO2 emissions that would otherwise occur by up to approximately 127,500 metric tons per year. This CO2 reduction equates to removing the emissions from more than 27,700 passenger vehicles over the course of a calendar year.

“Agreements like the one announced today enable UGIES to utilize its best-in-class engineering and construction expertise to bring RNG to market while utilizing the existing Pennant pipeline network,” said Anthony C. Cox, President, Pennant Midstream. “This is an example of UGI and Pennant’s commitment to enabling renewable and sustainable energy projects using the breadth of our industry experience.”

“EDL has owned and operated an extensive portfolio of landfill gas to electricity plants across the United States since 1998; and in recent years, several large plants converting landfill gas to RNG,” said James Harman, Chief Executive Officer, EDL. “We are proud to leverage our waste to clean energy expertise through developments such as the Carbon Limestone RNG project, and to assist one of our key customers with their goal of de-carbonizing through renewable gas supply.”

“We are looking forward to working with EDL on this important project,” said Joseph L. Hartz, President – UGIES. “EDL has established itself as a global leader in renewable projects, including some right here in Pennsylvania. We are confident that this agreement will lead to more opportunities to work together in the future.”

About UGI Energy Services
UGI Energy Services, LLC supplies and markets natural gas, electricity and liquid fuels to approximately 42,000 residential, commercial and industrial customer locations across the mid-Atlantic and northeastern United States. UGI Energy Services also conducts UGI’s midstream natural gas business through its ownership of underground natural gas storage, gas peaking plants and pipeline assets in Pennsylvania and owns all or a portion of electric generation assets principally in Pennsylvania.

About Pennant Midstream
Pennant Midstream operates both wet and dry gas and natural gas liquid gathering pipelines in Mercer and Lawrence Counties, PA; and Mahoning and Columbiana Counties, OH. In addition, Pennant operates a 245,000 Dth/day natural gas processing plant located near New Middletown, OH. Pennant is a partnership between a subsidiary of UGI Energy Services, Harvest Midstream, and a subsidiary of Williams Companies. A subsidiary of UGIES operates the Pennant system.

About EDL
A leading global producer of sustainable distributed energy, EDL owns and operates a portfolio of 94 power stations in North America, Australia and Europe. From innovative renewable operations to clean and remote energy expertise, EDL delivers solutions to a diverse range of customers the world over.

For more information on EDL, visit https://edlenergy.com/

About UGI Corporation
UGI Corporation is a distributor and marketer of energy products and services. Through subsidiaries, UGI operates natural gas and electric utilities in Pennsylvania, natural gas utilities in West Virginia, distributes LPG both domestically (through AmeriGas) and internationally (through UGI International), manages midstream energy assets in Pennsylvania, Ohio, and West Virginia and electric generation assets in Pennsylvania, and engages in energy marketing, including renewable natural gas, in the Mid-Atlantic region of the United States and California, and internationally in France, Belgium, the Netherlands and the UK.

Comprehensive information about UGI Corporation is available on the Internet at https://www.ugicorp.com.


Contacts

UGI Corporation Investor Relations
Tameka Morris, 610-456-6297
Arnab Mukherjee, 610-768-7498
Shelly Oates, 610-992 -3202

DUBLIN--(BUSINESS WIRE)--The "Global LNG Bunkering Market, By Product Type, By Application, By Region, Estimation & Forecast, 2017 - 2027" report has been added to ResearchAndMarkets.com's offering.


The global LNG bunkering market held a market value of USD 2,212.9 Million in 2020 and is forecasted to reach USD 25,045.8 Million by the year 2027. The market is projected to witness a CAGR of 42.6% during the forecast period.

LNG Bunkering is providing liquefied natural gas fuel to a ship for its own consumption. IMO regulation on sulphur content in the marine fuel is anticipated to boost the market growth. Also, increase in gas exploration and production activities are also estimated to boost market growth.

Despite the driving factors, demand supply gap for LNG bunkering are estimated to hinder the market growth. During the COVID-19 pandemic, the market experienced a decline in growth due to temporary bans in export and import. However, the market is anticipated to recover from declining revenues in the second half of 2021, owing to rise in demand for LNG as bunker fuel from the maritime transport.

Companies Mentioned

  • Bomin Linde LNG GmbH & Co. KG
  • Engie SA
  • ENN Energy Holdings Ltd
  • FueLNG Bellina
  • Gas Natural Fenosa
  • GazproBneft Marine Bunker LLC
  • Harvey Gulf International Marine LLC
  • Kawasaki
  • Korea Gas Corporation
  • Mitsui OSK Lines Ltd.
  • Royal Dutch Shell PLC
  • Sembcorp Marine Ltd.
  • Statoil AS
  • Skangas AS (Gasum)
  • Total SA
  • Toyota Tsusho Corp.

Growth Influencers:

MO regulation on sulphur content in the marine fuel.

IMO or International Maritime Organization, in January 2020, announced a new limit of the presence of sulphur content in fuel used in ships. The new regulation is known as IMO 2020 and limits the sulphur content in marine fuel used in board ships which operate outside the designated emission control areas to 0.50% m/m. This is a significant reduction from 3.5%, which was the previously set limit. Owing to this regulation, the demand for liquefied natural gas has increased, which contains negligible amount of sulphur.

Segments Overview:

The global LNG bunkering market is segmented into product type and application.

By Product Type

  • Truck-to-Ship
  • Port-to-Ship
  • Ship-to-Ship
  • Portable Tanks

The truck-to-ship segment accounts for the largest market share of about 60% owing to high adoption of trucks for transportation of marine fuels. The port-to-ship segment is estimated to grow at the fastest rate of around 44% owing to its rising demand globally.

By Application

  • Container Fleet
  • Tanker Fleet
  • Cargo Fleet
  • Ferries
  • Inland Vessels
  • Others

The container fleet segment is anticipated to hold the largest market share, as it is the most common type of fleet used for transportation of fuels and other goods as well. The inland vessels segment is expected to account for a market size of about USD 693.6 million by 2027 owing to its rising penetration across the globe, especially in the developed economies.

Regional Overview:

On a regional basis, the global LNG bunkering market is segmented into North America, Europe, Asia Pacific, Middle East & Africa, and South America.

The Middle East and Africa region is anticipated to hold the dominant share of 54% in the market. This is owing to the favorable government initiatives for the development of more LNG bunkering hubs in countries such as UAE. Furthermore, decreasing prices of LNG coupled with increasing focus on expanding the gas pipeline infrastructure are also likely to fuel the market growth.

The North American market is estimated to witness the fastest growth rate of about 40.9% owing to the presence of a large consumer base along with the rise in maritime trade activities in the region. The Europe, Latin America, and Asia Pacific region are also expected to contribute to the market growth significantly.

The global LNG bunkering market report answers questions such as:

  • What is the market size and forecast of the Global LNG bunkering Market?
  • What are the inhibiting factors and impact of COVID-19 on the Global LNG bunkering Market during the assessment period?
  • Which are the products/segments/applications/areas to invest in over the assessment period in the Global LNG bunkering Market?
  • What is the competitive strategic window for opportunities in the Global LNG bunkering Market?
  • What are the technology trends and regulatory frameworks in the Global LNG bunkering Market?
  • What is the market share of the leading players in the Global LNG bunkering Market?
  • What modes and strategic moves are considered favorable for entering the Global LNG bunkering Market?

For more information about this report visit https://www.researchandmarkets.com/r/ndeyjp.


Contacts

ResearchAndMarkets.com
Laura Wood, Senior Press Manager
This email address is being protected from spambots. You need JavaScript enabled to view it.

For E.S.T Office Hours Call 1-917-300-0470
For U.S./CAN Toll Free Call 1-800-526-8630
For GMT Office Hours Call +353-1-416-8900

James D. Farley, Jr. and Patti Poppe will address delegates at world’s preeminent energy conference, March 7-11 in Houston


HOUSTON--(BUSINESS WIRE)--The CEOs of Ford Motor Company and PG&E Corporation will address delegates in a special dialogue at CERAWeek by IHS Markit 2022 in Houston, March 7-11.

CEOs James D. Farley, Jr. and Patti Poppe will join moderator Daniel Yergin, CERAWeek conference chair and vice chairman of IHS Markit, for a special session focused on the advent of electric cars and what that means for the relationship between the auto and electric power industries – and for motorists and consumers.

“We are pleased to welcome PG&E Corporation CEO Patti Poppe and Ford Motor Company CEO Jim Farley to CERAWeek by IHS Markit 2022 for an important and timely dialogue,” Yergin said. “This year’s conference is keenly focused on the challenges of balance inherent to the energy transition—between what amounts to a rapid transformation of the world’s $86 trillion economy and the need for stable and reliable energy flows and means of transport that people rely on.

“The automotive and electric utility sectors are at the forefront of this transition, and they are increasingly interconnected in shaping its outcome. Both Ford Motor Company and PG&E Corporation are leaders in conceptualizing and shaping this future, and we are grateful to have the two distinguished CEOs of these companies bring their unique knowledge, experience and insights to what will be a stimulating and eye-opening discussion.”

CERAWeek 2022: Pace of Change: Energy, Climate and Innovation will examine the challenges and opportunities of reducing emissions while supplying the needs of a growing global economy in the era of energy transition. The conference is returning to Houston for its 40th annual gathering after being hosted as an all-virtual event in 2021.

Produced by IHS Markit (NYSE: INFO), a world leader in critical information, analytics and solutions, the CERAWeek 2022 conference program will explore key themes related to More Energy, Lower Emissions; Geopolitics and Energy Markets; Workforce of the Future; Competitive Landscape and the Energy Transition; Supply Chains; and Financing the Energy Future.

The conference will also feature the CERAWeek Innovation Agora, serving as the center of technology and innovation programming at the event. Featuring a community of thought leaders, technologists, start-ups, investors, academics, energy companies and government officials, the Innovation Agora will showcase transformational technology platforms in the energy space ranging from digitalization, AI, analytics and connectivity, robotics, blockchain, additive manufacturing, mobility and decarbonization. Newly added for 2022 will be dedicated “Agora Hubs” focused on hydrogen and carbon management.

CERAWeek 2022 speakers will include (partial list):

  • Jennifer Granholm – secretary of energy, U.S. Department of Energy
  • John F. Kerry – special presidential envoy for climate, United States
  • Vicki Hollub – CEO, Occidental
  • Amin Nasser – president and CEO, Saudi Aramco
  • Bernard Looney – CEO, bp
  • Patti Poppe – CEO, PG&E Corporation
  • James D. Farley, Jr. – CEO, Ford Motor Company
  • Pedro Pizarro – president and CEO, Edison International
  • Ben van Beurden – CEO, Royal Dutch Shell
  • Patrick Pouyanné – chairman of the board and CEO, TotalEnergies
  • Jim Fitterling – chairman and CEO, Dow
  • H.E. Mohammad Sanusi Barkindo – secretary general, OPEC
  • Ignacio Galán – chairman and CEO, Iberdrola, S.A.
  • Shrikant Madhav Vaidya – chairman, IndianOil
  • Maria Pope – president and CEO, Portland General Electric
  • Ryan Lance – chairman and CEO, ConocoPhillips
  • H.E. Dr. Sultan Ahmed Al Jaber – minister of industry and advanced technology; special envoy for climate change and chairman of Masdar, United Arab Emirates; Group CEO, Abu Dhabi National Oil Company (ADNOC)
  • Dr. Fatih Birol – executive director, International Energy Agency
  • Josu Jon Imaz – CEO, Repsol
  • Jill Evanko – CEO and president, Chart Industries
  • Hon. Richard Glick – chairman, Federal Energy Regulatory Commission (FERC)
  • Miranda Ballentine – CEO, Renewable Energy Buyers Alliance (REBA)
  • Ernie Thrasher – CEO and chief marketing officer, Xcoal Energy and Resources
  • Øyvind Eriksen – president and CEO, Aker ASA
  • Peter Terwiesch – president, process automation and member of group executive committee, ABB
  • Jean-Pascal Tricoire – chairman and CEO, Schneider Electric
  • RJ Scaringe – CEO, Rivian
  • Barbara Burger – vice president, innovation, Chevron; president, Chevron Technology Ventures
  • Carri Lockhard – executive vice president, technology, digital and innovation, Equinor
  • Christian Bruch – president and CEO, Siemens Energy
  • Sunita Narain – director general, Center for Science and Environment
  • Amos Hochstein – senior advisor for energy security, U.S. Department of State
  • Dan Brouillette – president, Sempra Infrastructure
  • Emma Delaney – executive vice president, customers and products, bp
  • Daniel Poneman – president and CEO, Centrus Energy
  • Scott Sheffield – CEO, Pioneer Natural Resources
  • Hon. Sonya Savage – minister of energy, Alberta, Canada
  • Mark Little – president and CEO, Suncor
  • Felipe Bayón – CEO, Ecopetrol S.A.
  • Dawn Summers – member of the executive board and COO, region EMEA, Wintershall Dea AG
  • Mark Nelson – executive vice president, downstream and chemicals, Chevron

Visit www.ceraweek.com for a complete list of speakers and the most up-to-date program information (subject to change).

Registration Information

CERAWeek by IHS Markit 2022 will be held March 7-11 at the Hilton Americas—Houston. Further information and delegate registration is available at www.ceraweek.com.

Media Accreditation

Media registration is now open. Members of the media interested in covering CERAWeek 2022 are required to apply for accreditation. Applications are subject to approval and can be submitted at the following link: https://ceraweek.com/about/press.html

About IHS Markit (www.ihsmarkit.com)

IHS Markit (NYSE: INFO) is a world leader in critical information, analytics and solutions for the major industries and markets that drive economies worldwide. The company delivers next-generation information, analytics and solutions to customers in business, finance and government, improving their operational efficiency and providing deep insights that lead to well-informed, confident decisions. IHS Markit has more than 50,000 business and government customers, including 80 percent of the Fortune Global 500 and the world’s leading financial institutions. Headquartered in London, IHS Markit is committed to sustainable, profitable growth.

IHS Markit is a registered trademark of IHS Markit Ltd. and/or its affiliates. All other company and product names may be trademarks of their respective owners © 2022 IHS Markit Ltd. All rights reserved.


Contacts

News Media:

Jeff Marn
IHS Markit
+1 202 463 8213
This email address is being protected from spambots. You need JavaScript enabled to view it.

Press Team
+1 303 858 6417
This email address is being protected from spambots. You need JavaScript enabled to view it.

DUBLIN--(BUSINESS WIRE)--The "Electric Vehicle Charging Infrastructure Market: Global Industry Analysis, Trends, Market Size, and Forecasts up to 2027" report has been added to ResearchAndMarkets.com's offering.


The report on the global electric vehicle charging infrastructure market provides qualitative and quantitative analysis for the period from 2019 to 2027. The report predicts the global electric vehicle charging infrastructure market to grow with a CAGR of 43.70% over the forecast period from 2021-2027. The study on electric vehicle charging infrastructure market covers the analysis of the leading geographies such as North America, Europe, Asia-Pacific, and RoW for the period of 2019 to 2027.

The report on electric vehicle charging infrastructure market is a comprehensive study and presentation of drivers, restraints, opportunities, demand factors, market size, forecasts, and trends in the global electric vehicle charging infrastructure market over the period of 2019 to 2027. Moreover, the report is a collective presentation of primary and secondary research findings.

Porter's five forces model in the report provides insights into the competitive rivalry, supplier and buyer positions in the market and opportunities for the new entrants in the global electric vehicle charging infrastructure market over the period of 2019 to 2027. Further, Growth Matrix gave in the report brings an insight into the investment areas that existing or new market players can consider.

Market Dynamics

Drivers

  • Continuous hiking cost of petroleum-based products
  • Governments are increasing initial funding of charging infrastructure installation

Restraints

  • High initial cost of charging stations

Opportunities

  • Government collaboration with multiple oil and gas companies

What does this Report Deliver?

1. Comprehensive analysis of the global as well as regional markets of the electric vehicle charging infrastructure market.

2. Complete coverage of all the segments in the electric vehicle charging infrastructure market to analyze the trends, developments in the global market and forecast of market size up to 2027.

3. Comprehensive analysis of the companies operating in the global electric vehicle charging infrastructure market. The company profile includes analysis of product portfolio, revenue, SWOT analysis and latest developments of the company.

4. Growth Matrix presents an analysis of the product segments and geographies that market players should focus to invest, consolidate, expand and/or diversify.

Segment Covered

The global electric vehicle charging infrastructure market is segmented on the basis of charger type, connector, and application.

The Global Electric Vehicle Charging Infrastructure Market by Charger Type

  • Slow Charger
  • Fast Charger

The Global Electric Vehicle Charging Infrastructure Market by Connector

  • CHAdeMO
  • Combined Charging System (CCS)
  • Others

The Global Electric Vehicle Charging Infrastructure Market by Application

  • Commercial
  • Residential

Company Profiles

  • AeroVironment Inc.
  • ABB Group
  • BP plc (Chargemaster)
  • ChargePoint, Inc.
  • Enphase Energy, Inc.
  • Eaton Corporation plc
  • General Electric Company
  • Leviton Manufacturing Co., Inc.
  • Schneider Electric SE
  • Siemens AG

For more information about this report visit https://www.researchandmarkets.com/r/kqwm1s.


Contacts

ResearchAndMarkets.com
Laura Wood, Senior Press Manager
This email address is being protected from spambots. You need JavaScript enabled to view it.

For E.S.T Office Hours Call 1-917-300-0470
For U.S./CAN Toll Free Call 1-800-526-8630
For GMT Office Hours Call +353-1-416-8900

Other new appointments include Adam Metzger as Interim CFO, and Patrick de Castelbajac and Roei Ganzarski to the company’s Strategic Advisory Board

LOS ANGELES--(BUSINESS WIRE)--#aerospace--“Companies live and die by the caliber of talent that they are able to harness in service of their mission,” said Paul Eremenko, co-founder and CEO of Universal Hydrogen Co. “And we are thrilled to be able to attract some of the top minds and leaders in cleantech, logistics, and aviation to our company and our mission to get aviation and other difficult-to-decarbonize sectors on a trajectory to meet Paris Agreement goals.” Jørn Rosenlund will be the company’s new Chief Operating Officer, coming to Universal Hydrogen from Nel Hydrogen, where he was Chief Strategy Officer and before that Senior VP responsible for the Fueling Division. Jørn joined Nel with the acquisition of H2 Logic, where he was COO. Jørn will be Managing Director of Universal Hydrogen Denmark ApS. He also serves on the board of Everfuel, a European green hydrogen supply and fueling company.


Anna Goranson is Universal Hydrogen’s first VP of People. Anna joins Universal Hydrogen from Airspace, a growth-stage startup providing time-critical logistics, where she also headed the people organization, more than doubling the size of the company. Previously, Anna headed people ops at MediaAlpha and helped lead the company through its IPO. Adam Metzger is named Interim CFO. Adam is a prolific investor and advisor to a broad range of startups. He was previously Vice President at BNP Paribas and prior to that a trader and portfolio manager.

“Jørn, Anna, and Adam will help steer Universal Hydrogen through its next stage of rapid growth,” said Eremenko. “Their mission is to begin the transformation of the company from a tech startup toward an operational mindset, a focus on our airline customers, and an early path to market.”

Universal Hydrogen further added two aviation industry veterans to its Strategic Advisory Board (SAB). Patrick de Castelbajac was formerly CEO of Nordic Aviation Capital, the largest lessor of regional aircraft in the world. Patrick was also CEO of ATR, the leading maker of regional planes, as well as Chief Strategist for Airbus, in charge of the plane maker’s product and services policy. Roei Ganzarski was previously CEO of MagniX, a leader in aircraft electrification, and the Executive Chairman of Eviation Aircraft, the developer of the world’s first all-electric middle-mile aircraft. Roei is a former Boeing executive, having held many roles including CCO of Boeing Flight Services. Patrick and Roei will serve on the SAB alongside current members Tom Enders, Lourdes Maurice, and Carl Burleson.

“I’m no stranger to rapid growth companies that are transforming from a precocious startup to a great public company; it was an easy choice to join Universal Hydrogen as it reaches this important inflection point in its trajectory,” said Rosenlund. “I look forward to working with this incredibly talented group to bring green hydrogen to flight in the next few short years.”

Universal Hydrogen is currently hiring for many roles across the US and Europe. “We will need many more diverse, talented folks passionate about decarbonizing aviation for us to succeed in our mission and move with the necessary speed,” said Goranson. For opportunities and positions at Universal Hydrogen please visit: https://hydrogen.aero/careers/

About Universal Hydrogen

Universal Hydrogen is making hydrogen-powered commercial flight a near-term reality. The company takes a flexible, scalable, and capital-light approach to hydrogen logistics by transporting it in modular capsules over the existing freight network from green production sites to airports around the world. To accelerate market adoption, Universal Hydrogen is also developing a conversion kit to retrofit existing regional airplanes with a hydrogen-electric powertrain compatible with its modular capsule technology.


Contacts

Media
Kate Gundry
This email address is being protected from spambots. You need JavaScript enabled to view it.
617-797-5174

DUBLIN--(BUSINESS WIRE)--The "On-Demand Product: 2022 China Natural Gas Pipeline Map Analyst Edition" map has been added to ResearchAndMarkets.com's offering.


The map represents the latest status and project type of 5511+ pipelines and 84+ underground gas storages (the exact project number is subject to the date your map is tailor-made);

Map Details

  • Map Size: 250x 150 cm
  • Map Language: English
  • Shipping Format: Rolled

Map Features

  • Unprecedented Make-to-Order mapping technology enables your maps to be exported directly from our daily-updated database. This helps you to get the latest project situation exactly on the day your order is placed;
  • Super large size (250x150cm) of the map allows more details which show the exact project locations so that the map would not be again a bunch of unrecognized dots and lines;
  • Subscriber's company name will be added into the map, right below the map's name title.

Industry Statistics Tables

  • Namelist of China's Core Gas Pipelines introduces the selected core pipelines by their name, main area, status, company;
  • Table of China's Underground Gas Storages: introduces the nation's underground gas storages by their name, province, city, status, company and effective storage sizes (existing, under construction, planned);
  • China's Natural Gas Balance Sheet Table: China's total natural gas available for consumption (output, imports, exports, stock changes in the year); total consumption (by main industry sectors) and balance. LNG data is included since 2010;
  • China's Gas Production by Provinces Table: Each year's data include China's natural gas production figures by provinces, approximately 33 columns;
  • China's Gas Production by Major Oil Companies Table: Each year's data include China's natural gas production figures by major oil companies;
  • China's Natural Gas Consumption by Industries: China's natural gas consumption figures by 51 industry sectors;
  • China's Natural Gas Consumption by Provinces: Each year's data include China's natural gas consumption figures (LNG statistics since 2010) by provinces, approximately 33 columns;
  • China's Natural Gas Supply in Cities by Provinces: Each year's data include China's natural gas supply figures in cities by provinces, approximately 33 columns;
  • China's Natural Gas Gasified City Population by Provinces: Each year's data include China's population gasified by natural gas in cities by provinces, approximately 33 columns.

Map Samples

This map provides following sample views:

  • Map Overview
  • Amplified View
  • Amplified Map Legend

For more information about this map visit https://www.researchandmarkets.com/r/spmjir


Contacts

ResearchAndMarkets.com
Laura Wood, Senior Press Manager
This email address is being protected from spambots. You need JavaScript enabled to view it.

For E.S.T Office Hours Call 1-917-300-0470
For U.S./CAN Toll Free Call 1-800-526-8630
For GMT Office Hours Call +353-1-416-8900

ORANGE, Conn.--(BUSINESS WIRE)--AVANGRID, Inc. (AGR: NYSE), a leading sustainable energy company, today announced that Security Limits, Inc. has voluntarily dismissed its case in the U.S. District Court for the Southern District of New York against AVANGRID, its major shareholder Iberdrola, S.A., and all other defendants. Security Limits never provided any evidence or sworn testimony to support its case and has failed to answer or dispute charges of defamation and extortion.


As we’ve said from the start, these claims have no merit and today’s action by Security Limits validates this,” said Robert Kump, AVANGRID President and Deputy CEO. “Critics of AVANGRID seized on these unverified allegations in a rush to judgment, disregarding AVANGRID’s well-documented and independently-recognized compliance and ethics culture, system and practices.”

While the New York case against AVANGRID is over, AVANGRID continues to pursue claims in New Mexico state court against Security Limits and its founder Paolo Silva for defamation and tortious interference. In the suit, AVANGRID lays out how Security Limits, a disgruntled former Avangrid Networks sub-contractor, endeavored to extort AVANGRID into giving it work opportunities. When AVANGRID refused to do so, Security Limits defamed AVANGRID during the public comment periods before the New Mexico Public Regulation Commission, which was considering AVANGRID’s merger with PNM Resources.

Mr. Silva’s statements about our company during the New Mexico Public Regulation Commission public comment periods were false and damaging to our company’s reputation,” Mr. Kump added. “AVANGRID prides itself on being an ethical, responsible company. We do not take false accusations against us lightly, and we will continue to seek relief against Security Limits and Silva to the fullest extent of the law.”

It is important to note that there was no settlement between the parties, and AVANGRID and Iberdrola paid no money to Security Limits. Security Limits dismissed the New York case voluntarily.

AVANGRID has been recognized as one of the World’s Most Ethical companies by the Ethisphere Institute for three consecutive years.

About AVANGRID: AVANGRID, Inc. (NYSE: AGR) aspires to be the leading sustainable energy company in the United States. Headquartered in Orange, CT with approximately $39 billion in assets and operations in 24 U.S. states, AVANGRID has two primary lines of business: Avangrid Networks and Avangrid Renewables. Avangrid Networks owns and operates eight electric and natural gas utilities, serving more than 3.3 million customers in New York and New England. Avangrid Renewables owns and operates a portfolio of renewable energy generation facilities across the United States. AVANGRID employs approximately 7,000 people and has been recognized by JUST Capital in 2021 and 2022 as one of the JUST 100 companies – a ranking of America’s best corporate citizens. In 2022, AVANGRID ranked second within the utility sector for its commitment to the environment and the communities it serves. The company supports the U.N.’s Sustainable Development Goals and was named among the World’s Most Ethical Companies in 2021 for the third consecutive year by the Ethisphere Institute. For more information, visit www.avangrid.com.


Contacts

Zsoka McDonald (203) 997-6892
or This email address is being protected from spambots. You need JavaScript enabled to view it.

Joanie Griffin (505) 261-4444
or This email address is being protected from spambots. You need JavaScript enabled to view it.

Scalable everywhere electricity is needed, HSR catapults past the goals of the Paris Climate Accord with fully clean, carbon-free electric power, at a fraction of the cost of fossil fuels.

DUBLIN--(BUSINESS WIRE)--Holcomb Scientific Research Ltd (HSR), a research and development company, has announced a scientific breakthrough in 100 percent clean energy production with the launch of the Holcomb Energy System (HES). The HES, consisting of a suite of pioneering, patented technologies, presents an entirely new source of true electric power generation capable of addressing critical global issues such as climate change, pollution, and universal access to electricity.


By harnessing previously untapped energy from the electron spin within electrical steel, the HES eliminates the need for any external source of power, such as solar, wind, or fossil fuels. The products are verified and witnessed-certified by SGS and DNV-GL, the world’s leading witness verification firms, and certified to UL and NEC (National Electric Code) standards.

HSR was co-founded and invented by Dr. Robert Holcomb MD, Ph.D., a prestigious academic and physician with decades of experience across the medical, scientific, and energy industries. A pioneer in modern invention with hundreds of patents, Dr. Holcomb said, “Conventional generators are the foundation of the modern world, yet the technology has not improved in any significant way since it was conceived nearly 200 years ago. I ask the people of our world to blaze the trail for our leaders to follow let’s consign fossil fuels to the annals of history and bring clean energy to a world that so desperately needs it.”

The three products are completely fuel-less, release no emissions, have no moving parts, run totally silent, require virtually no maintenance, and are completely scalable anywhere electric power is needed – on or off the grid. The HES comprises the following three patent-protected technologies:

  • The HES In-Line Power Generator (ILPG)
    The ILPG takes power in from any source – either the grid or renewables like wind and solar – and significantly magnifies power output, cutting power costs and carbon footprints up to 80%. The ILPG can be leveraged for various personal, commercial and industrial uses, including homes, apartments, factories, office buildings and along the grid.
  • The HES Stand-Alone Power Generation System
    The HES Stand-Alone Power Generation System operates independently of any outside power source in a self-looping, self-regenerating fashion, powering itself while simultaneously powering any size electric load. This system is scalable to residential and commercial applications, transportation, consumer electronics, and along the power grid.
  • The HES Phase Converter
    The HES Phase Converter converts single or split-phase power into three-phase power, while simultaneously magnifying power output, cutting power costs and carbon footprints up to 80%. Solid-state and tuneable without computers, rectifiers or inverters, the HES Phase Converter provides a modern, inexpensive and reliable solution to the drawbacks of current phase conversion methods.

Dr. Holcomb works alongside his Co-Founder, Ellen Holcomb, who concluded, “We are in a race against time to turn the tide on some of the most pressing environmental challenges confronting our world today - pollution, climate change, and endless wars for fossil fuels. The launch of the Holcomb Energy System is a significant step towards addressing those problems and gives us hope that there is a better future ahead. Together, we can work to save lives, save money, and most importantly, save our beautiful planet.

This launch of the HES brings HSR out of stealth mode after 13 years of intensive research and product development. The HES is already powering two industrial facilities in the U.S. – a 12,000 square foot manufacturing building and two 2,400 square foot commercial facilities, effectively slashing power bills and carbon footprints by approximately 80%.

###

Dr. Robert Holcomb and Ellen Holcomb, Co-founders of HSR, are available for interview.

About Holcomb Scientific Research

Holcomb Scientific Research Ltd (HSR) is a Research and Development (R&D) company that has created the patent-protected Holcomb Energy System (HES), a scientific breakthrough in clean energy generation.

The HES utilizes the natural energy produced by the electron spin in the iron atom, converting it into usable electricity while requiring no fuel, releasing zero carbon emissions, and having no moving parts – therefore running completely silent.

The HES addresses some of the world’s most critical issues, including pollution, climate change, global access to electricity, and endless wars for fossil fuels. Eliminating the need for centrally generated power plants, the HES instead places energy production right where it is being used – in homes, commercial buildings, transportation, consumer electronics, and on or off the grid.


Contacts

Media Enquiries
Wachsman
Laura Cooley
E: This email address is being protected from spambots. You need JavaScript enabled to view it.

DUBLIN--(BUSINESS WIRE)--The "Europe Advanced Energy Management System Market, By Component (Hardware, Software and Service), By End User Vertical (Power and Energy (P&E), Oil & Gas, Telecom & IT and Others), By Solution, By Country, By Company, Forecast & Opportunities, 2026" report has been added to ResearchAndMarkets.com's offering.


The Europe advanced energy management system market is projected to grow at double digit CAGR during the forecast period owing to increasing electricity consumption and growing demand for energy efficiency in end use industries.

Furthermore, need for energy management during high electricity demand and shift from conventional fossil fuels to alternate sources is expected to drive the demand for advanced energy management systems in Europe.

Advanced energy management system is a technology, involving conversion of electricity to energy and vice versa based on the demand for electricity. The technology is gaining prominence as it offers cost effective and reliable power for end user industries such as power & energy, IT & telecom and manufacturing, among others.

Additionally, the growing need for reducing GHG emissions and reliance on fossil fuels is expected to positively impact the growth of the market in the coming years. The Paris Agreement, or COP 21, was also signed in 2016 for reducing GHG emissions and combating climate change by 2100.

The Europe advanced energy management system market is segmented based on component, end user vertical, solution, country, and company. In terms of software, which is a sub-segment of component, utility energy management system accounted for the lion's share in 2020 owing to government initiatives for the introduction of smart grid and declining prices of IoT components.

Leading players in the region are IBM, Rockwell Automation, Schneider Electric, Honeywell, General Electric, Cisco, Eaton Corporation, SAP, Elster Group, Siemens, CA Technologies and Tendril.

Objective of the Study:

  • To analyze and forecast the market size of advanced energy management system market.
  • To classify and forecast advanced energy management system market based on component, end user vertical, solution, country, and company.
  • To identify drivers and challenges for advanced energy management system market.
  • To examine competitive developments such as expansions, new product launches, mergers & acquisitions, etc., in advanced energy management system market.
  • To conduct pricing analysis for advanced energy management system platform market.
  • To identify and analyze the profile of leading players operating in advanced energy management system market.

Report Scope:

Years considered for this report:

  • Historical Years: 2016-2019
  • Base Year: 2020
  • Estimated Year: 2021
  • Forecast Period: 2022-2026

Europe Advanced Energy Management System Market, By Component:

  • Hardware
  • Sensors
  • Controllers
  • Displays
  • Others
  • Software
  • Utility Energy Management System
  • Industrial Energy Management System
  • Enterprise Carbon and Energy Management
  • Residential Energy Management System
  • Others
  • Service
  • Monitoring & Control
  • Implementation & Integration
  • Maintenance
  • Consulting & Training

Europe Advanced Energy Management System Market, By End User Vertical:

  • Power and Energy (P&E)
  • Oil & Gas
  • Telecom and IT
  • Manufacturing
  • Office and Commercial Building
  • Municipal
  • University
  • School
  • Hospital System
  • Others

Europe Advanced Energy Management System Market, By Solution:

  • Carbon Management
  • Demand Response Management
  • Utility Billing and Customer Information System
  • Others

Europe Advanced Energy Management System Market, By Country:

  • Germany
  • France
  • United Kingdom
  • Italy
  • Spain

Competitive Landscape

Company Profiles: Detailed analysis of the major companies present in advanced energy management system market.

  • International Business Machines Corporation
  • Rockwell Automation, Inc
  • Schneider Electric SE
  • Honeywell International Inc
  • General Electric Company
  • Cisco Systems, Inc
  • Eaton Corporation
  • SAP SE
  • Elster Group SE
  • Siemens AG
  • CA Technologies, Inc

For more information about this report visit https://www.researchandmarkets.com/r/mq1na0


Contacts

ResearchAndMarkets.com
Laura Wood, Senior Press Manager
This email address is being protected from spambots. You need JavaScript enabled to view it.

For E.S.T Office Hours Call 1-917-300-0470
For U.S./CAN Toll Free Call 1-800-526-8630
For GMT Office Hours Call +353-1-416-8900

HOUSTON--(BUSINESS WIRE)--The board of directors of Phillips 66 (NYSE: PSX) has declared a quarterly dividend of 92 cents per share on Phillips 66 common stock. The dividend is payable on March 1, 2022, to shareholders of record as of the close of business on Feb. 22, 2022.


About Phillips 66

Phillips 66 is a diversified energy manufacturing and logistics company. With a portfolio of Midstream, Chemicals, Refining, and Marketing and Specialties businesses, the company processes, transports, stores and markets fuels and products globally. Headquartered in Houston, the company has 14,000 employees committed to safety and operating excellence. Phillips 66 had $56 billion of assets as of Dec. 31, 2021. For more information, visit www.phillips66.com or follow us on Twitter @Phillips66Co.


Contacts

Jeff Dietert (investors)
832-765-2297
This email address is being protected from spambots. You need JavaScript enabled to view it.

Shannon Holy (investors)
832-765-2297
This email address is being protected from spambots. You need JavaScript enabled to view it.

Thaddeus Herrick (media)
855-841-2368
This email address is being protected from spambots. You need JavaScript enabled to view it.

  • Novus stockholders have approved the previously announced business combination at the Special Meeting held on February 10, 2022.
  • Transaction is anticipated to close on February 11, 2022

INDIANAPOLIS & LUGANO, Switzerland & WESTLAKE VILLAGE, Calif.--(BUSINESS WIRE)--Novus Capital Corporation II (NYSE: NXU, NXU WS and NXU.U) (“Novus”) today announced that stockholders of record as of January 4, 2022 approved the previously proposed business combination with Energy Vault, Inc. (“Energy Vault”), the company developing sustainable, grid-scale energy storage solutions.

The formal results of the vote will be included in a Current Report on Form 8-K to be filed by Novus with the U.S. Securities and Exchange Commission.

The business combination is expected to close on February 11, 2022, and the combined company is expected to be renamed Energy Vault Holdings, Inc. (the “Company”) and its common stock and warrants are expected to commence trading on the New York Stock Exchange on February 14, 2022, under the new ticker symbols, “NRGV” and “NRGV WS”, respectively.

About Energy Vault

Energy Vault develops sustainable energy storage solutions designed to transform the world’s approach to utility-scale energy storage for grid resiliency. The company’s proprietary, gravity-based Energy Storage Technology and the Energy Storage Management and Integration Platform are intended to help utilities, independent power producers and large industrial energy users significantly reduce their levelized cost of energy while maintaining power reliability. Utilizing eco-friendly materials with the ability to integrate waste materials for beneficial re-use, Energy Vault is facilitating the shift to a circular economy while accelerating the clean energy transition for its customers.

About Novus Capital Corporation II

Novus is a special purpose acquisition company organized for the purpose of effecting a merger, share exchange, asset acquisition, stock purchase, recapitalization, reorganization, or other similar business combination with one or more businesses or entities and its securities are listed on the NYSE under the ticker symbols “NYSE: NXU, NXU.U, NXU WS.”. Novus Capital is led by Robert J. Laikin, Jeff Foster, Hersch Klaff, Larry Paulson, Heather Goodman, Ron Sznaider and Vince Donargo, who have significant hands-on experience helping high-tech companies optimize their existing and new growth initiatives by exploiting insights from rich data assets and intellectual property that already exist within most high-tech companies.

Forward-Looking Statements

Certain statements included in this press release that are not historical facts are forward-looking statements for purposes of the safe harbor provisions under the United States Private Securities Litigation Reform Act of 1995. Forward-looking statements generally are accompanied by words such as “believe,” “may,” “will,” “estimate,” “continue,” “anticipate,” “intend,” “expect,” “should,” “would,” “plan,” “predict,” “potential,” “seem,” “seek,” “future,” “outlook,” “designed,” and similar expressions that predict or indicate future events or trends or that are not statements of historical matters. These forward-looking statements include, but are not limited to, statements regarding the expected timing of the completion of the proposed business combination, and the benefits of the proposed business combination.

These statements are based on various assumptions, whether or not identified in this press release, and on the current expectations of Energy Vault’s and Novus’ management and are not predictions of actual performance. These forward-looking statements are provided for illustrative purposes only and are not intended to serve as, and must not be relied on by an investor as, a guarantee, an assurance, a prediction, or a definitive statement of fact or probability. Actual events and circumstances are difficult or impossible to predict and will differ from assumptions. Many actual events and circumstances are beyond the control of Energy Vault and Novus.

These forward-looking statements are subject to a number of risks and uncertainties, including the occurrence of any event, change or other circumstance that could give rise to the termination of the definitive agreements with respect to the proposed business combination; the outcome of any legal proceeding that may be instituted against Novus, Energy Vault or the combined company following the announcement of the proposed business combination; the inability of the parties to successfully or timely consummate the business combination, including the risk that any regulatory approvals are not obtained, are delayed or are subject to unanticipated conditions that could adversely affect the combined company or the expected benefits of the business combination; failure to realize the anticipated benefits of the business combination; the ability to meet stock exchange listing standards at or following the consummation of the proposed business combination; changes in applicable laws or regulations; and those factors discussed in the Registration Statement and in Novus’ Registration Statement on Form S-4 relating to the business combination under the caption “Risk Factors”, and its Annual Report on Form 10-K for the fiscal year ended December 31, 2020 under the heading “Risk Factors,” and other documents of Novus filed, or to be filed, with the SEC.

Important Information About the Proposed Business Combination and Where to Find It

This communication is being made in respect of the proposed merger transaction involving Novus and Energy Vault. Novus has filed a registration statement on Form S-4 with the SEC, which has been declared effective, a definitive proxy statement/prospectus of Novus, and certain related documents, to be used at the meeting of stockholders to approve the proposed business combination and related matters. Investors and security holders of Novus are urged to read the definitive proxy statement/prospectus, as well as any amendments thereto and other relevant documents that will be filed with the SEC, carefully and in their entirety because they contain important information about Energy Vault, Novus and the business combination. The definitive proxy statement has been mailed to stockholders of Novus as of a record date to be established for voting on the proposed business combination. Investors and security holders will also be able to obtain copies of the registration statement, the definitive proxy statement and other documents containing important information about each of the companies once such documents are filed with the SEC, without charge, at the SEC’s web site at www.sec.gov. The information contained on, or that may be accessed through, the websites referenced in this press release is not incorporated by reference into, and is not a part of, this press release.

Participants in the Solicitation

Novus and its directors and executive officers may be deemed participants in the solicitation of proxies of Novus’ shareholders in connection with the proposed business combination. Energy Vault and its executive officers and directors may also be deemed participants in such solicitation. Security holders may obtain more detailed information regarding the names, affiliations and interests of certain of Novus’ executive officers and directors in the solicitation by reading Novus’ Annual Report on Form 10-K for the fiscal year ended December 31, 2020, Quarterly Report on Form 10-Q for the nine months ended September 30, 2021 and the definitive proxy statement/prospectus and other relevant documents and other materials filed with the SEC in connection with the business combination when they become available. As they become available, these documents can be obtained free of charge from the sources indicated above.

No Offer or Solicitation

This communication does not constitute an offer to sell or the solicitation of an offer to buy any securities or a solicitation of any vote or approval, nor shall there be any sale of any securities in any state or jurisdiction in which such offer, solicitation, or sale would be unlawful prior to registration or qualification under the securities laws of such other jurisdiction.


Contacts

Investors
This email address is being protected from spambots. You need JavaScript enabled to view it.

Media
This email address is being protected from spambots. You need JavaScript enabled to view it.

HOUSTON--(BUSINESS WIRE)--Whiting USA Trust II (the “Trust”) (OTC:WHZT) announced today that the Trust will make a final distribution to unitholders in the first quarter of 2022, which relates to net profits generated during the fourth quarterly payment period of 2021 and the release of funds withheld from previous distributions for the payment of the Trust’s administrative expenses. The net profits interest (“NPI”) held by the Trust, which was the only asset of the Trust other than cash reserves held for future Trust expenses, terminated on December 31, 2021, and accordingly, there will be no future net profits generated or distributed after the March 2022 Distribution (as defined in the next sentence). Unitholders of record on February 22, 2022 will receive a distribution of $0.163070 per unit, which is payable on or before March 1, 2022 (the “March 2022 Distribution”), which will be the final Trust distribution.

As of the date of this press release, 99.9% of the Trust’s total 18,400,000 units outstanding were held by Cede & Co. (the Depository Trust Corporation’s nominee) as the official unitholder of record. The record date of February 22, 2022 for this distribution is only applicable to unitholders of record such as Cede & Co., and the ex-date, as set by The Financial Industry Regulatory Authority, Inc., or FINRA, actually determines which street name holders will be eligible to receive the March 2022 Distribution.

The Trust was entitled to net cash profits generated by the underlying properties through the NPI termination date of December 31, 2021, and accordingly, results in the fourth quarterly payment period include two months of net profits as compared to three months of net profits for previous quarterly payment periods. Sales volumes, net profits and selected performance metrics for this quarterly payment period (mainly affected by October 2021 through November 2021 oil prices and September 2021 through October 2021 gas prices) were:


Sales volumes:


Oil (Bbl)(1)


119,851


Natural gas (Mcf)


116,249


Total (BOE)(2)


139,226


Gross proceeds:


Oil sales(1)(3)


$

8,736,194


Natural gas sales(4)


673,865


Total gross proceeds


$

9,410,059


Costs:


Lease operating expenses(5)


$

6,144,588


Production taxes


494,734


Development costs(6)


466,151


Total costs


$

7,105,473


Net profits


$

2,304,586


Percentage allocable to Trust’s Net Profits Interest


90

%

Total cash available for the Trust


$

2,074,127


Proceeds from sale of oil and gas properties


-


Release of Trust cash reserves(7)


928,972


Montana state income taxes withheld


(2,615)


Net cash proceeds available for distribution


$

3,000,484


Trust units outstanding


18,400,000


Cash distribution per Trust unit


$

0.163070


Selected performance metrics:


Crude oil average realized price (per Bbl)(1)(3)


$

72.89


Natural gas average realized price (per Mcf)(4)


$

5.80


Lease operating expenses (per BOE)(5)


$

44.13


Production tax rate (percent of total gross proceeds)


5.3

%

__________

(1)

Oil includes natural gas liquids.

(2)

Oil and gas volumes decreased 33% during the fourth quarterly payment period of 2021 as compared to the third quarterly payment period of 2021 primarily due to the fourth quarterly payment period including only two months of sales, as compared to three months of sales included in the third quarterly payment period.

(3)

Oil sales proceeds decreased $2.8 million (or 24%) during the fourth quarterly payment period of 2021 as compared to the third quarterly payment period of 2021. The decrease in oil sales proceeds between periods was primarily due to the lower sales volumes included in the fourth quarterly payment period as compared to the previous quarterly payment period, which decrease was partially offset by an increase in NYMEX prices between periods and improved differentials.

(4)

Gas sales proceeds decreased $0.1 million (or 8%) during the fourth quarterly payment period of 2021 as compared to the third quarterly payment period of 2021. The decrease in gas sales proceeds between periods was primarily due to the lower sales volumes included in the fourth quarterly payment period as compared to the previous quarterly payment period, which decrease was partially offset by an increase in NYMEX prices between periods.

(5)

Lease operating expenses decreased $0.4 million (or 6%) during the fourth quarterly payment period of 2021 as compared to the third quarterly payment period of 2021. The decrease in lease operating expenses between periods was primarily due to the fourth quarterly payment period including only two months of expenses, as compared to three months of expenses included in the third quarterly payment period. This decrease was partially offset by higher ad valorem tax expense as a result of the timing of recognizing such expenses.

(6)

Development costs increased $0.1 million (or 26%) during the fourth quarterly payment period of 2021 as compared to the third quarterly payment period of 2021. The increase in development costs was primarily the result of increased workover and development costs on non-operated properties, during the fourth quarterly payment period as compared to the previous quarterly payment period.

(7)

During the second quarterly payment period of 2021, the Trustee determined it was necessary to establish a $1.0 million reserve to ensure that the Trust has sufficient cash available to pay its general and administrative expenses through its termination date, which includes periods after the termination of the net profits interest when no proceeds will be generated. The March 2022 Distribution includes the balance of such reserve less a provision for anticipated final expenses of the Trust.

The NPI, which terminated December 31, 2021, was the only asset of the Trust other than cash reserves held for future Trust expenses and represented the right to receive 90% of the net cash proceeds from Whiting’s interests in certain existing oil and natural gas properties located primarily in the Rocky Mountains, Permian Basin, Gulf Coast and Mid-Continent regions of the United States.

Trust Termination

The Trust is in the process of winding up its affairs and terminating. The Trust will pay no further distributions to unitholders after the March 2022 Distribution.

The market price of the Trust units will decline to zero upon the termination of the Trust. Since the assets of the Trust are depleting assets, a portion of each cash distribution paid on the Trust units, if any, should be considered by investors as a return of capital, with the remainder being considered as a return on investment.

Forward-Looking Statements

This press release contains forward-looking statements, including all statements made in this press release other than statements of historical fact. No assurances can be given that such statements will prove to be correct. The estimated time when the market price of the Trust units should decline to zero is based on the economic rights of the Trust units. The trading price of the Trust units is affected by factors outside of the control of the Trust or Whiting, including actions of market participants, among others. Statements made in this press release are qualified by the cautionary statements made in this press release. The Trustee does not intend, and assumes no obligation, to update any of the statements included in this press release.


Contacts

Whiting USA Trust II
The Bank of New York Mellon Trust Company, N.A., as Trustee
Sarah Newell
(512) 236-6555

Beer Me: Breweries in New England are Leading the Charge on Sustainability

BOSTON--(BUSINESS WIRE)--Breweries across New England are stepping up to help fight climate change, and this weekend is no different. Super Bowl Sunday is not just a day for football in America; it’s one of the days that Americans consume the most beer - approximately 325 million gallons. Yet, all that beer creates a lot of waste that gets sent to landfills or dumped down the drain. Vanguard Renewables in Massachusetts believes that waste is only waste if you waste it - they can recycle that waste and harness it to make renewable energy.


“We work with some of New England's top micro-breweries to recycle their waste - like the spent grains and liquids that are produced from the brewing process,” said Neil H. Smith, CEO of Vanguard Renewables. “The demand for beer on this singular weekend is not new; however, with many brewers choosing to be more sustainable, we provide them with the circular solution they need to recycle their waste. Instead of sending waste byproducts to landfills or incinerators, we help them recycle the material by capturing the methane they emit as they break down and turn that into renewable energy.”

The company has been working with small and large breweries across the region to help Vanguard's Farm Powered mission to turn food waste and dairy cow manure into renewable energy. The company provides a circular solution for these breweries - from farm to kettle to keg, and back to one of New England’s family farms to help create pipeline-quality renewable natural gas that goes on to power our farms, colleges, businesses, and towns across the region.

Noah Bogoff from Berkshire Brewing Company said: “Our family brewery is committed to sustainability, and recycling our waste to create renewable energy is one of the ways that we reach that goal. We are proud to be part of the Vanguard Renewables Farm Powered movement, so much so that we put the Farm Powered logo on every can we distribute. It’s an important way that we demonstrate to our customers that we are committed to doing our part.”

The waste from Vanguard’s partner breweries is collected and brought to one of their six anaerobic digestion facilities in Massachusetts and Vermont, where it's then added to a state-of-the-art hydrolyzer before entering the anaerobic digestion process to create renewable energy. The waste supplied by brewery partners not only helps to produce renewable natural gas, but the byproducts of the anaerobic digestion process also make high-quality bedding for farm animals and a low-carbon and nearly odorless liquid fertilizer to use on their fields.

Nate Lanier, the Co-founder and Head Brewer of Tree House Brewing Company, said: “Working with Vanguard has enabled us to abide by our ethos of environmental responsibility while bringing a benefit to local farmers - it was a no-brainer for us to work with them. They are passionate about what they do, and it shows.”

Vanguard Renewables not only works with Tree House Brewing Company and Berkshire Brewing Company but also with Wachusett Brewing Company to take their organic waste. By collecting the brewer’s spent grains and other byproducts, Vanguard Renewables collaborates with their partners to help reduce their CO2 emissions and help keep the region’s family farmers in business.

Breweries are thinking more and more about what they can do to make a change to be sustainable, reduce their CO2 emissions, and dispose of their spent waste in a way that is good for the environment and keeps that waste out of our landfills and waterways.

Last spring, researchers at Virginia Polytechnic and State University (Virginia Tech) submitted a research paper to the American Chemical Society that shed light on the growing need for beer companies to explore sustainability options. They shared their findings on separating beer waste into proteins for foods and fiber for biofuels.

The paper noted that due to the high demand for craft brewing in the U.S. market, there had been a significant increase in waste byproducts from breweries. They further shared that this waste comprises 85% spent grains, up to 30% protein, and up to 70% fiber.

“Craft breweries care deeply about their communities, environment and supporting our local farmers. Beer is an agricultural product. There’s no beer without farms. Anything that we can do to lessen waste, protect our planet and aid our farmers is a win-win,” says Katie Stinchon, executive director of the Mass Brewers Guild.

New England is no stranger to the craft beer industry, with small and large breweries opening up across the region. The Brewers Association For Small and Independent Craft Brewers noted that in 2020 there were nearly 700 craft breweries in operation in the New England region alone, and there are more still opening every year. That’s a lot of waste being created.

Smith continued: “Companies across all sectors are becoming motivated to move towards sustainable practices, and the commercial brewing industry is no different. It’s been exciting to see how local New England breweries are leading the way in recycling their organic waste and other materials as part of their long-range sustainability goals.”

Vanguard Renewables’ brewery partners are not just doing good for the environment, but they are helping the region's family farmers save money on fertilizers, energy, and bedding. It’s a win for all.

About Vanguard Renewables
Vanguard Renewables is a national leader in developing food and dairy waste-to-renewable energy projects. The Company is committed to advancing decarbonization by reducing greenhouse gas emissions from farms and food waste and supporting regenerative agriculture on partner farms. Vanguard co-founded the industry-leading Farm Powered Strategic Alliance (FPSA) alongside food industry leaders Dairy Farmers of America, Unilever, and Starbucks to develop a circular solution for food waste reduction and recycling and decarbonization of manufacturing and the supply chain. The Company owns and operates six on-farm anaerobic digester facilities in the northeast and plans to expand to more than 100 sites nationwide by 2025. Established relationships and renewable natural gas offtake agreements with national utilities including Dominion Energy, Enbridge, ONE Gas, National Grid, and Eversource, and its strategic alliance with Dairy Farmers of America, position the Company to significantly increase U.S. production and delivery of renewable natural gas to commercial and residential customers across the country. To learn more about Vanguard Renewables, FarmPowered organic waste solutions, the FPSA and its members, and Vanguard’s numerous awards and recognitions, visit the website.

Vanguard Renewables Media Room
https://vanguardrenewables.com/vanguard-renewables-media-room


Contacts

Vanguard Renewables Media Contacts
Billy Kepner
This email address is being protected from spambots. You need JavaScript enabled to view it.
(781) 371-4935

DULUTH, Minn.--(BUSINESS WIRE)--ALLETE, Inc. (NYSE:ALE) today announced that Vice President and Chief Accounting Officer Steve Morris has been promoted to the position of senior vice president and chief financial officer. He succeeds Robert Adams, who recently announced his plan to retire in June of this year.


Morris is a 21-year veteran of the company, and has served as vice president and chief accounting officer since 2016.

“I am very pleased to welcome Steve to his new role as CFO of ALLETE. With his breadth of experience, strategic expertise, integrity, and ability to work and lead across functions, he is an integral member of the senior leadership team and important to the successful execution of the company’s strategic vision and goals,” said ALLETE Chair, President and CEO Bethany Owen. “Throughout his career with the company and notably during the global pandemic, Steve’s ability to adapt in a quickly changing environment, and his commitment to upholding our values and evolving our culture while maintaining a sharp focus on the company’s financial goals, have been unparalleled. His leadership, unique skill set and industry experience will continue to be critical as ALLETE advances the nation’s clean-energy transformation.”

Morris joined the Duluth-based company in 2001 as Minnesota Power’s manager of financial reporting and budgeting, and has held roles with increasing responsibility during his tenure. He was appointed director of internal audit for ALLETE in 2005, named director of accounting in 2010, and in 2014, he was promoted to controller, a position he continued to hold until 2021. Prior to joining ALLETE, Morris spent 16 years with the public accounting firm RSM LLP (formerly McGladrey and Pullen), where he rose to the position of senior manager.

As ALLETE CFO, Morris will have responsibility and broad oversight of all aspects of accounting, financial reporting, internal audit and controls, treasury, risk, business development and investor relations.

“It is an exciting time to be part of ALLETE, and I look forward to executing the company’s sustainability-in-action strategy as we transform the nation’s energy landscape,” Morris said. “ALLETE is a leader in renewable energy, and we will continue to seize opportunities in the clean-energy space from our strong financial position, and meet our strategic goals while delivering value for all of our stakeholders, including employees, customers and investors.”

A graduate of the University of Minnesota Duluth, Morris is a Certified Public Accountant and a member of the American Institute of Certified Public Accountants and the Minnesota Society of Certified Public Accountants. He serves as a board member and treasurer for the Head of the Lakes United Way.

ALLETE, Inc. is an energy company headquartered in Duluth, Minnesota. In addition to its electric utilities, Minnesota Power and Superior Water, Light and Power of Wisconsin, ALLETE owns ALLETE Clean Energy, based in Duluth; and BNI Energy in Bismarck, N.D.; and has an eight percent equity interest in the American Transmission Co. More information about ALLETE is available at www.allete.com. ALE-CORP

The statements contained in this release and statements that ALLETE may make orally in connection with this release that are not historical facts, are forward-looking statements. Actual results may differ materially from those projected in the forward-looking statements. These forward-looking statements involve risks and uncertainties and investors are directed to the risks discussed in documents filed by ALLETE with the Securities and Exchange Commission.


Contacts

Vince Meyer
218-723-3952
This email address is being protected from spambots. You need JavaScript enabled to view it.

Offshore Source Logo

Offshore Source keeps you updated with relevant information concerning the Offshore Energy Sector.

Any views or opinions represented on this website belong solely to the author and do not represent those of the people, institutions or organizations that Offshore Source or collaborators may or may not have been associated with in a professional or personal capacity, unless explicitly stated.

Corporate Offices

Technology Systems Corporation
8502 SW Kansas Ave
Stuart, FL 34997

info@tscpublishing.com