Business Wire News

Facility Provides Flexibility to Fuel Growth Strategy

JACKSONVILLE, Fla.--(BUSINESS WIRE)--$RDW--Redwire Corporation (NYSE: RDW; “Redwire” or “the Company”), a leader in mission critical space solutions and high reliability components for the next generation space economy, today announced that it has entered into an $80 million common stock purchase agreement with B. Riley Principal Capital, LLC (“B. Riley”) to further support its growth strategy through initiatives such as accretive acquisitions and internal investments, to bolster working capital, and/or for general corporate purposes. The agreement governs a committed equity facility that provides the Company with the right, without obligation, to sell and issue up to $80 million of its common stock over a period of 24 months to B. Riley at the Company’s sole discretion, subject to certain limitations and conditions.


“Redwire is a rapidly growing leader in space. Having financial flexibility is key to successfully executing our growth strategy,” said Peter Cannito, Chairman and CEO. “We have evaluated the capital markets and believe that this agreement is the most cost-effective option to provide incremental capital when needed to thoughtfully fuel growth. The agreement allows us the discretion to raise additional capital when market conditions are favorable and there is a specific need.”

This press release is for informational purposes only and it does not represent an offer to sell or the solicitation of an offer to buy any of the Company’s common stock. There will be no sale of common stock in any jurisdiction in which one would be unlawful.

Further details are contained in a Current Report on Form 8-K filed with the Securities and Exchange Commission on April 15, 2022.

About Redwire

Redwire Corporation (NYSE: RDW) is a leader in space infrastructure for the next generation space economy, with valuable IP for solar power generation and in-space 3D printing and manufacturing. With decades of flight heritage combined with the agile and innovative culture of a commercial space platform, Redwire is uniquely positioned to assist its customers in solving the complex challenges of future space missions. For more information, please visit www.redwirespace.com.

Forward Looking Statements

This press release may contain “forward-looking statements” about Redwire's future expectations, plans, outlook, projections and prospects. Such forward-looking statements can be identified by the use of words such as “should,” “may,” “intends,” “anticipates,” “believes,” “estimates,” “projects,” “forecasts,” “expects,” “plans,” “proposes” and similar expressions. Although Redwire believes that the expectations reflected in these forward-looking statements are based on reasonable assumptions, there are a number of risks and uncertainties that could cause actual results to differ materially from such forward-looking statements. You are urged to carefully review and consider any cautionary statements and other disclosures, including the statements made under the heading “Risk Factors” in our Annual Report on Form 10-K for the year ended December 31, 2021. Forward-looking statements speak only as of the date of the document in which they are contained, and Redwire does not undertake any duty to update any forward-looking statements except as may be required by law.


Contacts

Investor Contact:
Michael Shannon
This email address is being protected from spambots. You need JavaScript enabled to view it.
904-425-1413

EL CENTRO, Calif.--(BUSINESS WIRE)--On Tuesday, April 12 at their regular Board meeting, the Imperial County Board of Supervisors continued to make progress on their commitment to improve the economic opportunities of Imperial County in a responsible and environmental manner by moving forward with the development of Lithium Valley. The actions by the Board include developing land use and environmental tools to assist in the streamlining of various renewable resources and energy projects in the southern Salton Sea area; specifically preparing the contract for the Salton Sea Renewable Resource Specific Plan, accompanying Programmatic Environmental Impact Report (EIR), and developing the Lithium Development Infrastructure Assessment planning document. The intended goals of the actions taken by the Board are:


  • To encourage the development of lithium and other mineral recovery facilities utilizing the significant geothermal resource;
  • To develop new and expand existing geothermal power generation facilities; and
  • To develop other renewable resource operations, including, but not limited to, lithium battery manufacturing, clean hydrogen production, organic material repurposing, and renewable fuel alternatives.

Furthermore, the Board expressed their support of the Imperial County Department of Public Works’ development of a Lithium Infrastructure Assessment planning document to provide a better understanding of the needed improvements and anticipated expansion to county roads, bridges, broadband/telecommunications, water and sewer facilities, gas and electrical infrastructure, and quality of life for residents and industry of the southern Salton Sea area.

The Board also shared their commitment in their continued inclusion of the community and all stakeholders, including local and regional environmental and social justice groups, community based organizations, labor unions, and industry representatives to provide a transparent and informative process that will ensure an equitable benefit for all that live and work in Imperial County.

“This is a win-win approach that focuses on working with the public and industry by streamlining the development process while fully addressing the economic, environmental, and social needs of our community in an equitable manner,” stated Chairman of the Board, Jesus E. Escobar.

“We are moving forward with the Master Planning of Lithium Valley in Imperial County. Our comprehensive planning approach will include an assurance for industry, protection for the environment and benefit for our community,” added District 4 Supervisor and Vice-Chair of the Lithium Valley Commission, Ryan Kelley.

For more information on Lithium Valley and the Lithium Valley Economic Investment Opportunity Plan, please visit www.LithiumValley.ImperialCounty.org.

940 Main Street, Suite 208 · El Centro, CA 92243
442-265-1001 Tel · 442-265-1010 Fax
www.ImperialCounty.org


Contacts

Gil Rebollar
(442) 265-1018

CEO Steve Edwards to retire after 44 years with global infrastructure leader


OVERLAND PARK, Kan.--(BUSINESS WIRE)--The Black & Veatch Board of Directors today announces it has selected Mario Azar as the chairman and CEO for the company upon the decision of Steve Edwards to retire after 44 years of outstanding leadership, service and dedication. Azar, currently serving as president, Energy & Process Industries, becomes only the eighth senior leader in the founder, managing partner or chair role in Black & Veatch’s 107-year history.

“As global megatrends reshape the critical infrastructure markets we serve, the Black & Veatch Board of Directors is thrilled to select Mario based on his vast global experience, proven leadership capabilities, innovative and collaborative approach and strong focus on client relationships,” said Edwards. “Since joining the company in 2018, Mario has been the architect of an effort that is repowering the power industry; as well as in the strategic repositioning of our company to address the megatrends our clients and the world faces. This success, and Mario’s leadership throughout our company-wide transformation, highlight the unique skills and experience that make him the ideal choice to lead the company into the future.”

Azar’s global leadership experience spans more than 32 years in the energy and industrial fields, much of it in engineering and construction solutions. Prior to joining Black & Veatch in 2018 as the president of the global power business, Azar served in multiple executive roles and led large global businesses at Siemens, and previously Westinghouse, including as CEO of Siemens Oil & Gas and Marine, an engineered solutions and integration business unit operating globally in over 21 countries. He also founded a private consulting firm focused on energy and heavy industry.

“It is a true honor to be selected to lead Black & Veatch, a company with such deep history and a stellar reputation built by a world-class team of global professionals,” Azar said. “The portfolio of solutions Black & Veatch offers, coupled with our transformed business model aligning with the megatrends reshaping our world, positions us to continue fulfilling our mission of Building a World of Difference for generations to come. I am excited about the future of our company and growing partnerships with our clients as their business needs evolve.”

The company will name a successor to fill Azar’s current role in the near future.

Editor’s Notes:

  • Edwards was appointed to the Black & Veatch Board of Directors in 2012 and was named chief operating officer in March 2013 in a transition role before becoming chair, president and CEO in 2014. His career includes leadership of energy projects in North America, Southeast Asia, Australia, the GCC and India.
  • Azar earned a Bachelor of Science in electrical engineering from the University of North Carolina at Charlotte.
  • Please click here to download high-resolution images of Steve Edwards and Mario Azar and to access additional information.

About Black & Veatch

Black & Veatch is a 100-percent employee-owned global engineering, procurement, consulting and construction company with a more than 100-year track record of innovation in sustainable infrastructure. Since 1915, we have helped our clients improve the lives of people around the world by addressing the resilience and reliability of our most important infrastructure assets. Our revenues in 2020 exceeded US$3.0 billion. Follow us on www.bv.com and on social media.


Contacts

CARL PETZ | +1 913-458-4685 P | +1 913-484-9581 M | This email address is being protected from spambots. You need JavaScript enabled to view it.
24-HOUR MEDIA HOTLINE | +1 855-999-5991

KILGORE, Texas--(BUSINESS WIRE)--Martin Midstream Partners L.P. (NASDAQ: MMLP) (“MMLP” or the “Partnership”) today announced the expiration and results of its previously announced cash tender offer (the “Excess Cash Flow Offer”) to purchase up to $9,305,000 aggregate principal amount (the “Excess Cash Flow Offer Amount”) of its outstanding 11.50% Senior Secured Second Lien Notes due 2025 (the “Notes”) at a purchase price of 100% of the aggregate principal amount thereof, plus accrued and unpaid interest to, but not including, the purchase date.

The Tender Offer expired at 5:00 p.m., New York City time, on April 13, 2022 (the “Expiration Time”). As of the Expiration Time, an aggregate principal amount of $589,229, or approximately 0.20%, of the Notes were validly tendered and not validly withdrawn. MMLP has accepted for payment all Notes validly tendered prior to the Expiration Time pursuant to the Excess Cash Flow Offer and made payment for such Notes on April 14, 2022.

Requests for documents relating to the tender offer may be directed to D.F. King & Co., Inc., the Information Agent, at (800) 628-8532 (Toll-Free) or (212) 269-5550, by email at This email address is being protected from spambots. You need JavaScript enabled to view it., or via the following web address: www.dfking.com/mmlp.

This press release is for informational purposes only and is neither an offer to purchase nor a solicitation of an offer to sell any Notes.

About Martin Midstream Partners

MMLP, headquartered in Kilgore, Texas, is a publicly traded limited partnership with a diverse set of operations focused primarily in the Gulf Coast region of the United States. MMLP’s primary business lines include: (1) terminalling, processing, storage, and packaging services for petroleum products and by-products; (2) land and marine transportation services for petroleum products and by-products, chemicals, and specialty products; (3) sulfur and sulfur-based products processing, manufacturing, marketing and distribution; and (4) natural gas liquids marketing, distribution, and transportation services. To learn more, visit www.MMLP.com. Follow Martin Midstream Partners L.P. on LinkedIn and Facebook.

Forward-Looking Statements

All statements in this release other than historical facts are forward-looking statements within the meaning of the Private Securities Litigation Reform Act of 1995. These forward-looking statements and all references to financial estimates rely on a number of assumptions concerning future events and are subject to a number of uncertainties, including (i) the current and potential impacts of the COVID-19 pandemic generally, on an industry-specific basis, and on the Partnership’s specific operations and business, (ii) the effects of the continued volatility of commodity prices and the related macroeconomic and political environment, and (iii) other factors, many of which are outside its control, which could cause actual results to differ materially from such statements. While the Partnership believes that the assumptions concerning future events are reasonable, it cautions that there are inherent difficulties in anticipating or predicting certain important factors. A discussion of these factors, including risks and uncertainties, is set forth in the Partnership’s annual and quarterly reports filed from time to time with the Securities and Exchange Commission (the “SEC”). The Partnership disclaims any intention or obligation to revise any forward-looking statements, including financial estimates, whether as a result of new information, future events, or otherwise except where required to do so by law.

The information in the Partnership’s website is not, and shall not be deemed to be, a part of this notice or incorporated in filings the Partnership makes with the SEC.

MMLP-C


Contacts

Sharon Taylor
Chief Financial Officer
(877) 256-6644
This email address is being protected from spambots. You need JavaScript enabled to view it.

TULSA, Okla.--(BUSINESS WIRE)--Today, Cypress Environmental Partners, L.P., (NYSE: CELP) (“Cypress”) reported its financial results for the three months and year ended December 31, 2021.


FINANCING

Cypress continues to work with Deutsche Bank AG, its credit facility Administrative Agent, Lead Arranger and Bookrunner, and the six other banks (“Lenders”) and their financial and legal advisors regarding the credit agreement that matures on May 31, 2022. Because the credit agreement matures within one year, the financial statements in Cypress’s Annual Report on Form 10-K disclose substantial doubt about its ability to continue as a going concern, as defined under U.S. Generally Accepted Accounting Principles. This condition resulted in the auditor’s report on the financial statements including a “going concern” uncertainty paragraph, which is an event of default of the credit agreement.

Cypress, with the support of the Lenders, has engaged Piper Sandler to solicit potential debt and equity investors to submit proposals to recapitalize Cypress and has received several proposals that are currently being evaluated by the board of directors and the Lenders.

Cypress also continues to negotiate with contingent fee plaintiffs’ lawyers to resolve litigation and arbitration exposure regarding Fair Labor Standards Act (“FLSA”) claims and associated indemnification demands from customers against whom some such claims have been asserted. Cypress has entered into a settlement covering more than 60 plaintiffs and resolving all of the claims asserted directly against the Company. The ability to resolve such exposure has been an important factor in Cypress’s ability to obtain a renewal from the current Lenders and remains an important element of successfully raising new capital without an in-court restructuring. Cypress and the Lenders may pursue a number of options, including but not limited to the possibility of i) a sale of the debt to a third party; ii) a sale of the debt to a related party; iii) entering into an agreement with a new investor for a stalking horse bid that would lead to an in-court restructuring and section 363 process; or some combination of these actions which may include a court-supervised restructuring. Cypress has incurred and expects to continue to incur significant legal and advisory fees in developing its financing plans. Under the current credit agreement Cypress is responsible for the Lender-mandated legal and financial advisor expenses, which have now exceeded $2.5 million dollars.

The New York Stock Exchange (the “NYSE”) continues to monitor trading in Cypress’s common units for compliance with the NYSE’s requirement of a $15 million market capitalization over 30 trading days; the failure to satisfy this requirement would result in immediate suspension and commencement of delisting procedures. It is likely that Cypress’s common units would be delisted from the NYSE in the event of any restructuring or liquidation proceeding. Such a proceeding would also likely lead to Cypress’s common and preferred equity (including accrued and unpaid distributions) having no value, given the amount of Cypress’s senior secured debt, which is currently $58.1 million.

Cypress believes that its Lenders are fully aligned on the importance of business continuity and normal operations to ensure ongoing reliable service to Cypress’s customers. Cypress and the Lenders intend to complete the process described above without disruption to customers, inspectors, and other employees.

FINANCIAL HIGHLIGHTS

  • Cash balance of $8.3 million at December 31, 2021.
  • Outstanding borrowings of $54.2 million on the credit facility at December 31, 2021.
  • Net loss attributable to common unitholders of $4.1 million for the three months ended December 31, 2021.
  • Adjusted EBITDA of $(0.3 million) for the three months ended December 31, 2021.
  • Distributable cash flow (“DCF”) of $(1.5 million) for the three months ended December 31, 2021.
  • Common unit and preferred unit distributions remain suspended.

FOURTH QUARTER 2021 SUMMARY FINANCIAL RESULTS


Three Months Ended


December 31,


2021

2020


(Unaudited)


(in thousands)


Net loss

$

(2,675)

$

(675)

Net loss attributable to common unitholders

$

(4,099)

$

(1,906)

Net loss per common limited partner unit – basic and diluted

$

(0.34)

$

(0.16)

Adjusted EBITDA (1)

$

(284)

$

1,469

Distributable cash flow (1)

$

(1,546)

$

(810)

(1)

This press release includes the following financial measures not presented in accordance with U.S. generally accepted accounting principles, or GAAP: adjusted EBITDA, adjusted EBITDA attributable to limited partners, and distributable cash flow. Each such non-GAAP financial measure is defined below under “Non-GAAP Financial Information”, and each is reconciled to its most directly comparable GAAP financial measure in schedules at the end of this press release.

CEO'S PERSPECTIVE

“2021 was another difficult year, however I am proud of how our employees navigated the second straight year of COVID-19. Despite over six months of negotiations, we regret that we have been unable to reach an agreement with our Lenders and therefore face the possibility of restructuring. Insiders (management, board, and individuals that control the general partner) own 76% of our equity (common and preferred units) and remain fully aligned with the minority unitholders. The FLSA wage litigation that swept through the inspection industry over the last several years has been expensive and time consuming for our customers, our competitors, and us. We were successful in negotiating a settlement covering over 60 cases; however, we have been unable to reach a global resolution despite months of negotiations. Regardless of the outcome of the negotiations with our Lenders and the FLSA plaintiffs’ lawyers, we are mutually aligned with our Lenders to avoid any adverse impact with operations so that we can continue to serve our customers and maintain our great employees,” said Peter C. Boylan III, Chairman, President, and CEO.

SEGMENT UPDATE

Inspection Services

  • During the fourth quarter Cypress had an average headcount of approximately 430 inspectors working throughout the United States. Headcount declined in early 2022 as the result of changes to inspector pay practices, which were driven in part by the need to mitigate the risk of needing to defend against future FLSA litigation. In early 2022 competitors offering more aggressive pay practices solicited and hired approximately 65 of Cypress’s inspectors as a result of these changes.
  • Cypress continues to pursue business development. In fourth quarter 2021 Cypress submitted over a dozen bids, and thus far in 2022 Cypress has submitted another 16 new bid proposals.
  • General and administrative expense in 4th quarter 2021 included a $0.7 million accrual related to a settlement Cypress reached in early 2022 with over 60 plaintiffs in FLSA litigation.
  • Other income in 4th quarter 2021 included a gain of $1.6 million upon receipt of proceeds from the settlement of a dispute with another party.

Pipeline & Process Services (“PPS”)

  • Cypress discontinued the operations of its 51%-owned subsidiary Brown Integrity, which provided hydrotesting services. Cypress recorded gains of $1.0 million in 4th quarter 2021 related to asset sales within net income (loss) from discontinued operations, net of tax.

Water & Environmental Services (“Environmental Services”)

  • Cypress’s water treatment facilities generally receive more water when its customers’ oil production increases from the completion of new oil wells in North Dakota. 23 drilling rigs are currently operating in North Dakota.
  • In December 2021, Cypress recorded an impairment of $0.9 million to the fixed assets and lease assets of one of its water treatment facilities.

COMMON UNIT & PREFERRED UNIT DISTRIBUTIONS

In July 2020, Cypress announced that it had suspended common unit distributions. Cypress’s credit facility continues to contain significant restrictions on the payment of distributions. Cypress expects to use available cash for working capital needs including restructuring expenses. Cypress continues the suspension of the distribution payments to an affiliate of the general partner to which he is entitled on his preferred units.

FOURTH QUARTER 2021 OPERATING RESULTS BY BUSINESS SEGMENT

Inspection Services

The Inspection Services segment’s results for the three months ended December 31, 2021 and 2020 were:

  • Revenue - $26.7 million and $32.4 million, respectively.
  • Gross Margin - $3.1 million and $3.9 million, respectively.

Water & Environmental Services (“Environmental Services”)

The Environmental Services segment’s results for the three months ended December 31, 2021 and 2020 were:

  • Revenue - $1.1 million and $1.4 million, respectively.
  • Gross Margin - $0.6 million and $0.9 million, respectively

CAPITAL EXPENDITURES

During the quarter, Cypress had less than $0.1 million in capital expenditures, which is reflective of an attractive business model that requires minimal capital expenditures.

ANNUAL REPORT

Cypress filed its annual report on Form 10-K for the year ended December 31, 2021 with the Securities and Exchange Commission today. Cypress will also post a copy of the Form 10-K on its website at www.cypressenvironmental.biz. Unitholders may request a printed copy of these reports free of charge by contacting Investor Relations at Cypress Environmental Partners, L.P., 5727 S. Lewis Ave., Suite 300, Tulsa, OK 74105 or by e-mailing This email address is being protected from spambots. You need JavaScript enabled to view it..

NON-GAAP FINANCIAL INFORMATION

This press release and the accompanying financial schedules include the following non-GAAP financial measures: adjusted EBITDA, adjusted EBITDA attributable to limited partners, and distributable cash flow. The accompanying schedules provide reconciliations of these non-GAAP financial measures to their most directly comparable GAAP financial measures. Cypress's non-GAAP financial measures should not be considered in isolation or as an alternative to its financial measures presented in accordance with GAAP, including revenues, net income or loss attributable to limited partners, net cash provided by or used in operating activities, or any other measure of liquidity or financial performance presented in accordance with GAAP as a measure of operating performance, liquidity, or ability to service debt obligations and make cash distributions to unitholders. The non-GAAP financial measures presented by Cypress may not be comparable to similarly-titled measures of other entities because other entities may not calculate their measures in the same manner.

Cypress defines adjusted EBITDA as net income or loss exclusive of (i) interest expense, (ii) depreciation, amortization, and accretion expense, (iii) income tax expense or benefit, (iv) equity-based compensation expense, (v) and certain other unusual or nonrecurring items. Cypress defines adjusted EBITDA attributable to limited partners as adjusted EBITDA exclusive of amounts attributable to the general partner and to noncontrolling interests. Cypress defines distributable cash flow as adjusted EBITDA attributable to limited partners less cash interest paid, cash income taxes paid, maintenance capital expenditures, and cash distributions paid or accrued on preferred equity. Management believes these measures provide investors meaningful insight into results from ongoing operations.

These non-GAAP financial measures are used as supplemental liquidity and performance measures by Cypress's management and by external users of its financial statements, such as investors, banks, and others to assess:

  • financial performance of Cypress without regard to financing methods, capital structure or historical cost basis of assets;
  • Cypress's operating performance and return on capital as compared to those of other companies, without regard to financing methods or capital structure;
  • viability and performance of acquisitions and capital expenditure projects and the overall rates of return on investment opportunities; and
  • the ability of Cypress's businesses to generate sufficient cash to pay interest costs, support its indebtedness, and make cash distributions to its unitholders.

ABOUT CYPRESS ENVIRONMENTAL PARTNERS, L.P.

Cypress Environmental Partners, L.P. is a master limited partnership that provides essential environmental services to the utility and energy industries, including pipeline & infrastructure inspection, NDE testing, and in-line integrity support services throughout the United States. Cypress also provides environmental services to upstream and midstream energy companies and their vendors in North Dakota, including water treatment, hydrocarbon recovery, and disposal into EPA Class II injection wells to protect our groundwater. Cypress works closely with its customers to help them protect people, property, and the environment, and to assist their compliance with increasingly complex and strict rules and regulations. Cypress is headquartered in Tulsa, Oklahoma.

CAUTIONARY STATEMENTS

This press release may contain or incorporate by reference forward-looking statements as defined under the federal securities laws regarding Cypress Environmental Partners, L.P., including projections, estimates, forecasts, plans and objectives. Although management believes that expectations reflected in such forward-looking statements are reasonable, no assurance can be given that such expectations will prove to be correct. In addition, these statements are subject to certain risks, uncertainties and other assumptions that are difficult to predict and may be beyond Cypress's control. If any of these risks or uncertainties materialize, or if underlying assumptions prove incorrect, Cypress's actual results may vary materially from what management forecasted, anticipated, estimated, projected or expected.

The key risk factors that may have a direct bearing on Cypress's results of operations and financial condition are described in detail in the "Risk Factors" section of Cypress's most recently filed annual report and subsequently filed quarterly reports with the Securities and Exchange Commission. Investors are encouraged to closely consider the disclosures and risk factors contained in Cypress's annual and quarterly reports filed from time to time with the Securities and Exchange Commission. The forward-looking statements contained herein speak as of the date of this announcement. Cypress undertakes no obligation to publicly update or revise any forward-looking statements, whether as a result of new information, future events or otherwise, except as required by applicable securities laws. Information contained in this press release is unaudited and subject to change.

CYPRESS ENVIRONMENTAL PARTNERS, L.P.

Consolidated Balance Sheets

As of December 31, 2021 and 2020

(in thousands)


December 31,

December 31,

2021

2020


ASSETS

Current assets:

Cash and cash equivalents

$

8,251


$

12,138


Trade accounts receivable, net


11,541


16,024


Assets of discontinued operations


3,176


8,182


Prepaid expenses and other


1,945


2,002


Debt issuance costs, net


444


-


Total current assets


25,357


38,346


Property and equipment:

Property and equipment, at cost


15,759


23,449


Less: Accumulated depreciation


9,622


14,059


Total property and equipment, net


6,137


9,390


Intangible assets, net


12,993


15,143


Goodwill


50,392


50,389


Finance lease right-of-use assets, net


60


112


Operating lease right-of-use assets


1,449


1,987


Debt issuance costs, net


-


242


Assets of discontinued operations


-


3,807


Other assets


590


570


Total assets

$

96,978


$

119,986


LIABILITIES AND OWNERS’ EQUITY

Current liabilities:

Accounts payable

$

771


$

855


Accounts payable – affiliates


99


58


Accrued payroll and other


5,350


4,768


Income taxes payable


55


268


Finance lease obligations


49


51


Operating lease obligations


429


439


Current portion of long-term debt


54,229


-


Liabilities of discontinued operations


36


1,582


Total current liabilities


61,018


8,021


Long-term debt


-


62,029


Finance lease obligations


4


55


Operating lease obligations


1,078


1,549


Liabilities of discontinued operations


-


245


Other noncurrent liabilities


318


182


Total liabilities


62,418


72,081


Owners’ equity:

Partners’ capital:

Common units (12,361 and 12,213 units outstanding at December 31, 2021 and December 31, 2020, respectively)


13,472


27,507


Preferred units (5,769 units outstanding at December 31, 2021 and December 31, 2020)


48,424


44,291


General partner


(25,876

)


(25,876

)

Accumulated other comprehensive loss


(2,636

)


(2,655

)

Total partners’ capital


33,384


43,267


Noncontrolling interests


1,176


4,638


Total owners’ equity


34,560


47,905


Total liabilities and owners’ equity

$

96,978


$

119,986


CYPRESS ENVIRONMENTAL PARTNERS, L.P.

Consolidated Statements of Operations

For the Three Months and Years Ended December 31, 2021 and 2020

(in thousands, except per unit data)


Three Months Ended
December 31,


Years Ended
December 31,

2021

2020

2021

2020

(unaudited)

Revenue

$

27,772


$

33,809


$

117,317


$

187,280


Costs of services


24,016


28,969


101,776


163,741


Gross margin


3,756


4,840


15,541


23,539


Operating costs and expense:

General and administrative


5,845


4,554


17,897


18,242


Depreciation, amortization and accretion


1,238


1,077


4,535


4,325


Impairments


881


-


881


-


Loss on asset disposals, net


23


-


32


5


Operating (loss) income


(4,231

)


(791

)


(7,804

)


967


Other (expense) income:

Interest expense


(949

)


(777

)


(3,601

)


(3,959

)

Foreign currency (losses) gains


(21

)


274


(16

)


107


Other, net


1,712


129


2,024


530


Net loss before income tax expense


(3,489

)


(1,165

)


(9,397

)


(2,355

)

Income tax expense (benefit)


10


(29

)


40


482


Net loss from continuing operations


(3,499

)


(1,136

)


(9,437

)


(2,837

)

Net income (loss) from discontinued operations, net of tax


824


461


(2,642

)


2,471


Net loss

$

(2,675

)

$

(675

)

$

(12,079

)

$

(366

)


Net loss from continuing operations

$

(3,499

)

$

(1,136

)

$

(9,437

)

$

(2,837

)

Net income attributable to noncontrolling interests – continuing operations


9


5


30


19


Net loss attributable to limited partners – continuing operations


(3,508

)


(1,141

)


(9,467

)


(2,856

)

Net income (loss) attributable to limited partners – discontinued operations


443


269


(1,132

)


1,441


Net loss attributable to limited partners

$

(3,065

)

$

(872

)

$

(10,599

)

$

(1,415

)


Net loss attributable to limited partners – continuing operations

$

(3,508

)

$

(1,141

)

$

(9,467

)

$

(2,856

)

Net income attributable to preferred unitholder


1,034


1,034


4,133


4,133


Net loss attributable to common unitholders – continuing operations


(4,542

)


(2,175

)


(13,600

)


(6,989

)

Net income (loss) attributable to common unitholders – discontinued operations


443


269


(1,132

)


1,441


Net loss attributable to common unitholders

$

(4,099

)

$

(1,906

)

$

(14,732

)

$

(5,548

)


Net (loss) income per common limited partner unit:

Basic and diluted – continuing operations

$

(0.37

)

$

(0.18

)

$

(1.11

)

$

(0.58

)

Basic and diluted - discontinued operations


0.04


0.02


(0.09

)


0.12


Basic and diluted

$

(0.33

)

$

(0.16

)

$

(1.20

)

$

(0.46

)


Weighted average common units outstanding:


Basic and diluted


12,350


12,211


12,318


12,181


Reconciliation of Net Loss to Adjusted EBITDA

and Distributable Cash Flow


Three Months Ended
December 31,


Years Ended December 31,


2021


2020


2021


2020


(in thousands)


Net loss


$

(2,675

)


$

(675

)


$

(12,079

)


$

(366

)

Add:


Interest expense


949


777


3,601


3,959


Depreciation, amortization and accretion


1,190


1,183


4,721


4,775


Income tax expense (benefit)


10


(29

)


40


482


Equity-based compensation


329


232


1,152


961


Impairments


881


-


881


-


Foreign currency losses


21


-


16


-


Discontinued operations (a)


(989

)


255


1,609


1,169


Less:


Foreign currency gains


-


274


-


107


Adjusted EBITDA


$

(284

)


$

1,469


$

(59

)


$

10,873


Adjusted EBITDA attributable to noncontrolling interests


(100

)


314


(715

)


1,588


Adjusted EBITDA attributable to limited partners


$

(184

)


$

1,155


$

656


$

9,285


Less:


Preferred unit distributions paid or accrued


1,034


1,034


4,133


4,133


Cash interest paid, cash taxes paid, and maintenance capital expenditures


328


931


3,863


5,394


Distributable cash flow


$

(1,546

)


$

(810

)


$

(7,340

)


$

(242

)

(a)

Amounts include net loss on asset disposals, depreciation, amortization, and accretion expense, interest expense, and income tax expenses that were previously reported within the Pipeline & Process Services segment, prior to that segment being reported as a discontinued operation.

Reconciliation of Net Loss Attributable to

Limited Partners to Adjusted EBITDA Attributable

to Limited Partners and Distributable Cash Flow


Three Months Ended December 31,


Years Ended December 31,


2021


2020


2021


2020


(in thousands)


Net loss attributable to limited partners


$

(3,065

)


$

(872

)


$

(10,599

)


$

(1,415

)

Add:


Interest expense


949


777


3,601


3,959


Depreciation, amortization and accretion


1,190


1,183


4,721


4,775


Income tax expense (benefit)


10


(29

)


40


482


Equity-based compensation


329


232


1,152


961


Impairments


881


-


881


-


Foreign currency losses


21


-


16


-


Discontinued operations (a)


(499

)


138


844


630


Less:


Foreign currency gains


-


274


-


107


Adjusted EBITDA attributable to limited partners


$

(184

)


$

1,155


$

656


$

9,285


Less:


Preferred unit distributions paid or accrued


1,034


1,034


4,133


4,133


Cash interest paid, cash taxes paid, and maintenance capital expenditures


328


931


3,863


5,394


Distributable cash flow


$

(1,546

)


$

(810

)


$

(7,340

)


$

(242

)

(a)

Amounts include net loss on asset disposals, depreciation, amortization, and accretion expense, interest expense, and income tax expenses attributable to limited partners that were previously reported within the Pipeline & Process Services segment, prior to that segment being reported as a discontinued operation.

Reconciliation of Net Cash Provided by Operating Activities to

Adjusted EBITDA and Distributable Cash Flow


Years Ended December 31,


2021


2020


(in thousands)


Cash flows provided by operating activities


$

3,317


$

27,922


Changes in trade accounts receivable, net


(4,512

)


(30,481

)

Changes in prepaid expenses and other


(409

)


897


Changes in accounts payable and accounts payable - affiliates


64


366


Changes in accrued payroll and other


(499

)


9,614


Change in income taxes payable


213


747


Interest expense (excluding non-cash interest)


2,646


3,379


Income tax expense (excluding deferred tax benefit)


40


482


Bad debt expense, net of recoveries


29


(470

)

Other


(14

)


(44

)

Discontinued operations (a)


(934

)


(1,539

)

Adjusted EBITDA


$

(59

)


$

10,873


Adjusted EBITDA attributable to noncontrolling interests


(715

)


1,588


Adjusted EBITDA attributable to limited partners


$

656


$

9,285


Less:


Preferred unit distributions paid or accrued


4,133


4,133


Cash interest paid, cash taxes paid, and maintenance capital expenditures


3,863


5,394


Distributable cash flow


$

(7,340

)


$

(242

)


Contacts

Investors:
Cypress Environmental Partners, L.P. - Jeff Herbers – Vice President & Chief Financial Officer
This email address is being protected from spambots. You need JavaScript enabled to view it. or 918-947-5730


Read full story here

Thursday, April 28, 2022 at 11:00 a.m. (ET)

Dial-in numbers: Domestic: 800-869-7402 ; International: 785-830-1999

Passcode: 19728

STAMFORD, Conn.--(BUSINESS WIRE)--United Rentals, Inc. (NYSE: URI) will hold its first quarter 2022 conference call with Matt Flannery, chief executive officer, and Jessica Graziano, chief financial officer, on Thursday, April 28, 2022 at 11:00 a.m. Eastern Time.

The company’s first quarter 2022 press release will be issued and available at unitedrentals.com after the market close on Wednesday, April 27, 2022.

The conference call will also be available by audio webcast at unitedrentals.com, where it will be archived until the next earnings call. In addition, a replay may be accessed for two weeks following the call at 402-220-1606, passcode 19728.

About United Rentals

United Rentals, Inc. is the largest equipment rental company in the world. The company has an integrated network of 1,288 rental locations in North America, 11 in Europe, 28 in Australia and 18 in New Zealand. In North America, the company operates in 49 states and every Canadian province. The company’s approximately 20,400 employees serve construction and industrial customers, utilities, municipalities, homeowners and others. The company offers approximately 4,300 classes of equipment for rent with a total original cost of $15.79 billion. United Rentals is a member of the Standard & Poor’s 500 Index, the Barron’s 400 Index and the Russell 3000 Index® and is headquartered in Stamford, Conn. Additional information about United Rentals is available at unitedrentals.com.


Contacts

Ted Grace
Office: (203) 618-7122
Cell: (203) 399-8951
This email address is being protected from spambots. You need JavaScript enabled to view it.

DUBLIN--(BUSINESS WIRE)--The "Shipbuilding Market by Type and End Use: Global Opportunity Analysis and Industry Forecast, 2021-2030" report has been added to ResearchAndMarkets.com's offering.


Presently, the global shipbuilding industry is dominated by Asia-Pacific followed by Europe, North America, and LAMEA. Asia-Pacific is expected to maintain its dominance in the global market particularly in China, South Korea, and Japan due to some distinct advantages; such as cheaper wages, strong government backing, and strong forward & backward linkage industries. Shipbuilding is a highly capital-intensive industry, owing to which strong government support and political stability is prerequisite to survive this industry.

Prominent factors driving growth of the global shipbuilding market are GDP growth, improved economic growth, global seaborne trade, increase in demand for cargo transportation through ships, rise in trade-related agreements, technological advancements in marine vessel engines, and trend of automation in marine transportation. However, fluctuations in transportation and inventory costs, coupled with environmental concerns associated with marine vessels are some noteworthy trends that could hamper growth of the market.

The global shipbuilding market is segmented on the basis of type, end-use, and region. By type, the market is categorized into oil tankers, bulk carriers, general cargo ships, container ships, passenger ships, and others. On the basis of end-use, the global shipbuilding market is categorized into transport and military. Region wise, it is studied across North America, Europe, Asia-Pacific, and LAMEA.

The key players profiled in the global shipbuilding market includes companies such as BAE Systems PLC, Damen Shipyards group, Fincantieri group, General Dynamics corporation, Huntington Ingalls industries, Korea Shipbuilding & Offshore Engineering, Mitsubishi Heavy Industries, Oshima Shipbuilding co. ltd, Samsuung Heavy Industries, and Sumitomo Heavy Industries.

Market dynamics

Drivers

  • Gradual rise in international seaborne trade
  • Increase in demand for cargo transportation through ships
  • Rise in trade-related agreements
  • Technological advancements in marine vessel engines

Restraints

  • Fluctuations in transportation and inventory costs
  • Environmental concerns associated with marine vessels

Opportunities

  • Trend of automation in marine transportation
  • Increase in marine safety norms

Key Report Benefits:

  • This study presents analytical depiction of the global shipbuilding market analysis along with current the trends and future estimations to depict imminent investment pockets.
  • The overall shipbuilding market opportunity is determined by understanding profitable trends to gain a stronger foothold.
  • The report presents information related to the key drivers, restraints, and opportunities of the global shipbuilding market with a detailed impact analysis.
  • The current shipbuilding market is quantitatively analyzed from 2020 to 2030 to benchmark the financial competency.
  • Porter's five forces analysis illustrates the potency of the buyers and suppliers in the industry.

Key Market Segments:

By Type

  • Oil Tankers
  • Bulk Carriers
  • General Cargo Ships
  • Container Ships
  • Passenger Ships
  • Others

By End Use

  • Transport
  • Military

By Region

  • North America
  • US
  • Canada
  • Mexico
  • Europe
  • Germany
  • UK
  • France
  • Rest of Europe
  • Asia-Pacific
  • China
  • Japan
  • South Korea
  • Rest of Asia-Pacific
  • LAMEA
  • Latin America
  • Middle East
  • Africa

Key Topics Covered:

CHAPTER 1: INTRODUCTION

CHAPTER 2: EXECUTIVE SUMMARY

CHAPTER 3: MARKET OVERVIEW

3.1. Market definition and scope

3.2. Key findings

3.3. Porter's five forces analysis

3.4. Key player positioning (2020)

3.5. Market dynamics

3.6. Impact of COVID-19 on the market

CHAPTER 4: SHIPBUILDING MARKET, TYPE

CHAPTER 5: SHIPBUILDING MARKET, BY END-USE

CHAPTER 6: SHIPBUILDING MARKET, BY REGION

CHAPTER 7: COMPANY PROFILES

  • BAE Systems PLC
  • Damen Shipyards group
  • Fincantieri group
  • General Dynamics corporation
  • Huntington Ingalls industries
  • Korea Shipbuilding & Offshore Engineering
  • Mitsubishi Heavy Industries
  • Oshima Shipbuilding co. ltd
  • Samsuung Heavy Industries
  • Sumitomo Heavy Industries

For more information about this report visit https://www.researchandmarkets.com/r/vzh51a

About ResearchAndMarkets.com

ResearchAndMarkets.com is the world's leading source for international market research reports and market data. We provide you with the latest data on international and regional markets, key industries, the top companies, new products and the latest trends.


Contacts

ResearchAndMarkets.com
Laura Wood, Senior Press Manager
This email address is being protected from spambots. You need JavaScript enabled to view it.

For E.S.T Office Hours Call 1-917-300-0470
For U.S./CAN Toll Free Call 1-800-526-8630
For GMT Office Hours Call +353-1-416-8900

DALLAS--(BUSINESS WIRE)--Pioneer Natural Resources Company (“Pioneer”) (NYSE:PXD) today announced its first quarter 2022 earnings news release is scheduled to be issued after the close of trading on the New York Stock Exchange on Wednesday, May 4, 2022.

A conference call is scheduled for Thursday, May 5, 2022, at 9:00 a.m. Central Time to discuss the first quarter results. Instructions on how to listen to the call and view the accompanying presentation are shown below.

Internet: www.pxd.com
Select “Investors” then “Earnings & Webcasts” to listen to the discussion and view the presentation.

Telephone: Dial (800) 289-0720 confirmation code 3922257 five minutes before the call. View the presentation via Pioneer’s internet address above.

A replay of the webcast will be archived on Pioneer’s website. Alternatively, an audio replay will be available through May 31, 2022. To register and access the audio replay, click here and enter confirmation code 3922257.

Pioneer is a large independent oil and gas exploration and production company, headquartered in Dallas, Texas, with operations in the United States. For more information, visit Pioneer’s website at www.pxd.com.


Contacts

Pioneer Natural Resources Contacts:

Investors
Neal Shah – 972-969-3900
Tom Fitter – 972-969-1821
Greg Wright – 972-969-1770
Chris Leypoldt – 972-969-5834

Media and Public Affairs
Tadd Owens – 972-969-5760

DUBLIN--(BUSINESS WIRE)--The "Global Subsea Power Grid System Market by Component (Cables, Variable Speed Drives, Transformers, Switchgears), Application (Captive Generation, Wind Power), Depth (Shallow Water and Deepwater) and Region - Forecast to 2027" report has been added to ResearchAndMarkets.com's offering.


The global subsea power grid system market is expected to grow from an estimated USD 9.1 billion in 2022 to USD 14.8 billion in 2027, at a CAGR of 10.2% during the forecast period. The subsea power grid comprises of several components such as cables, transformers, variable speed drives, switchgears, and others used for various applications such as captive generation, offshore wind power, and other applications.

Favourable government policies for offshore renewable power production, especially using wind energy along with urgent need to reduce carbon emissions and improve grid reliability and efficiency is expected to drive the demand for subsea power grid systems. The potential of tidal energy to meet subsea power requirements and easy access of wind turbine technology to offshore locations are expected to offer lucrative opportunities for the subsea power grid system market during the forecast period.

However, the shortage of technical professionals in subsea industry, low cost of onshore electricity generation, and climatic challenges pertaining to operations of offshore wind farms may act as challenges restraints for the subsea power grid system market.

The wind power segment, by application, is expected to record the highest CAGR from 2022 to 2027

The subsea power grid system market, by application, has been broadly classified into wind power, captive generation, and Others. The others segment includes solar power, tidal power and gas & diesel based floating power plants. The wind power segment is expected to record the highest CAGR from 2022 to 2027. The increase in the use of subsea power cables in long-distance HV power transmission applications propel the growth of the subsea power grid system market for wind power. Medium-voltage subsea power cables are often used to connect offshore wind platforms to distant onshore installations.

However, high-voltage subsea power cables are preferred for offshore wind power farms installed with many turbines. According to China's National Energy Administration (NEA), 16.9 GW of offshore wind power projects were commissioned in 2021 compared to 9.49 GW installed capacity in 2020.

Countries such as the UK, Germany, China, Japan, and Taiwan have plans to invest significantly to expand and develop their regional offshore wind energy industry. These factors are expected to fuel the demand for subsea power grid systems for offshore wind power generation during the forecast period.

Cables are expected to emerge as the largest segment based on component

The subsea power grid system market, on the basis of component, has been segmented into cables, transformers, switchgears, variable speed drives, and others. The others segment includes connectors, actuators, sensors, and penetrators. The cables segment, by component, is expected to dominate the subsea power grid system market during the forecast period. The adoption of subsea power cables has been mainly driven by the HV power transmission and offshore oil & gas industries. Subsea power cables are widely used to link shore-based power grids.

These cables carry power from one country to another, as well as from one offshore platform to another, and transfer power from offshore renewable energy generation plants, which use wind, wave, and tidal energy to generate electricity; regional electrical transmission networks; etc.

Europe: The largest power grid system market in subsea

The subsea power grid system market has been analyzed for 5 regions, namely Asia Pacific, North America, Europe, Middle East & Africa, South America. Europe is expected to dominate the global power grid system market in subsea between 2022-2027, followed by Asia Pacific and North America. Europe and Asia Pacific are the major contributors to the global power grid system market in subsea owing to the strong demand for renewable energy sources and favorable government policies in these regions.

Most countries in Europe are mainly focusing on renewable energy capacity addition. Countries such as Germany, the UK, the Netherlands, and Norway are leading the renewable energy capacity addition. The growth of the subsea power grid system market is supported by the European Wind Initiative (EWI), a wind energy R&D program developed to take the wind industry to the next level in Europe.

Market Dynamics

Drivers

  • Increased Deepwater Oil and Gas Exploration Activities due to Depleting Onshore Fossil Fuel Reserves
  • Favorable Government Policies for Offshore Renewable Power Production, Especially Using Wind Energy
  • Urgent Need to Reduce Carbon Emissions and Improve Grid Reliability and Efficiency

Restraints

  • High Operational and Technological Risks
  • Greater Energy Losses Witnessed During Long-Distance Power Transmission

Opportunities

  • Potential of Tidal Energy to Meet Subsea Power Requirements
  • Easy Access of Wind Turbine Technology to Offshore Locations

Challenges

  • Shortage of Technical Professionals in Subsea Industry
  • Low Cost of Onshore Electricity Generation
  • Climatic Challenges Pertaining to Operations of Offshore Wind Farms

Companies Mentioned

  • ABB
  • Aker Solutions Asa
  • Apar Industries Ltd.
  • Baker Hughes
  • General Electric
  • Hitachi Energy
  • Ls Cable & System Ltd.
  • Nexans
  • NKT
  • Oceaneering International
  • Prysmian Group
  • Schlumberger
  • Schneider Electric
  • Siemens Energy
  • Ssg Cable
  • Sumitomo Electric Industries, Ltd.
  • Te Connectivity
  • Technipfmc
  • Teledyne Marine
  • ZTT

For more information about this report visit https://www.researchandmarkets.com/r/yuj21q


Contacts

ResearchAndMarkets.com
Laura Wood, Senior Press Manager
This email address is being protected from spambots. You need JavaScript enabled to view it.
For E.S.T Office Hours Call 1-917-300-0470
For U.S./CAN Toll Free Call 1-800-526-8630
For GMT Office Hours Call +353-1-416-8900

HOUSTON--(BUSINESS WIRE)--Crestwood Equity Partners LP (NYSE: CEQP) (“Crestwood”) announced today that the board of directors of its general partner has declared the partnership’s quarterly cash distribution of $0.655 per limited partner unit ($2.620 annually) for the quarter ended March 31, 2022, which represents an approximate 5% increase quarter-over-quarter. In addition, Crestwood announced a quarterly cash distribution of $0.2111 per Class A preferred equity unit ($0.8444 annually). Both common and preferred distributions will be made on May 13, 2022, to unitholders of record as of May 6, 2022.


Robert G. Phillips, Founder, Chairman and Chief Executive Officer of Crestwood, commented, “Crestwood is pleased to announce a nearly 5% increase to our first quarter 2022 common distribution as a result of the recent acquisition of Oasis Midstream which closed on February 1, 2022. The Oasis Midstream integration is progressing ahead of schedule, and the overall market conditions are very favorable for Crestwood to achieve our full-year expectations. We expect elevated producer activity in the Williston, Powder River and Delaware basins during the balance of the year as our gathering and processing assets are leveraged to growth in a high commodity price market. The increase in common distribution reflects both our overall 2022 outlook and positive free cash flow generation, as well as our strategy to return capital to our unitholders while maintaining solid financial metrics.”

Crestwood plans to report financial results for the first quarter 2022 on Tuesday, April 26, 2022, before the New York Stock Exchange opens for trading. Following the announcement, management will host a conference call for investors and analysts at 9:00 a.m. Eastern Time (8:00 a.m. Central Time) that day to discuss the operating and financial results. Crestwood will provide an update on its operations and financial strategy at that time. The call will be broadcast live over the internet via audio webcast. Investors will be able to connect to the webcast via the “Investors” page of Crestwood’s website at www.crestwoodlp.com. Please log in at least ten minutes in advance to register and download any necessary software. A replay will be available shortly after the call for 90 days.

About Crestwood Equity Partners LP

Houston, Texas, based Crestwood Equity Partners LP (NYSE: CEQP) is a master limited partnership that owns and operates midstream businesses in multiple shale resource plays across the United States. Crestwood is engaged in the gathering, processing, treating, compression, storage and transportation of natural gas; storage, transportation, terminalling, and marketing of NGLs; gathering, storage, terminalling and marketing of crude oil; and gathering and disposal of produced water. Visit Crestwood Equity Partners LP at www.crestwoodlp.com; and to learn more about Crestwood’s sustainability efforts, please visit https://esg.crestwoodlp.com.

Forward Looking Statements

This press release may include certain statements concerning expectations for the future that are forward-looking statements as defined by federal securities law. Such forward-looking statements are subject to a variety of known and unknown risks, uncertainties, and other factors that are difficult to predict and many of which are beyond management’s control. These risks and assumptions are described in Crestwood’s annual reports on Form 10-K and other reports that are available from the United States Securities and Exchange Commission. Readers are cautioned not to place undue reliance on forward-looking statements, which reflect management’s view only as of the date made. We undertake no obligation to update any forward-looking statement, except as otherwise required by law.

Tax Notice to Foreign Investors

This release serves as qualified notice to nominees under Treasury Regulation Sections 1.1446-4(b)(4) and (d). Please note that 100% of Crestwood’s distributions to foreign investors are attributable to income that is effectively connected with a United States trade or business. Accordingly, all of Crestwood’s distributions to foreign investors are subject to federal income tax withholding at the highest effective tax rate for individuals or corporations, as applicable. Nominees, and not Crestwood, are treated as the withholding agents responsible for withholding on the distributions received by them on behalf of foreign investors.


Contacts

Crestwood Equity Partners LP
Investor Contact
Rhianna Disch, 713-380-3006
This email address is being protected from spambots. You need JavaScript enabled to view it.
Director, Investor Relations

Sustainability and Media Contact
Joanne Howard, 832-519-2211
This email address is being protected from spambots. You need JavaScript enabled to view it.
Senior Vice President, Sustainability and Corporate Communications

DULUTH, Minn.--(BUSINESS WIRE)--ALLETE, Inc. (NYSE:ALE), today announced it has closed the previously announced acquisition of New Energy Equity, one of the nation’s top distributed solar developers, for approximately $165.5 million.


New Energy Equity, with headquarters in Annapolis, Maryland, has successfully completed more than 250 distributed solar projects across the nation totaling more than 330 megawatts. The company has a development pipeline of about 2 gigawatts across 26 states over the next three years.

An independent study recently ranked ALLETE the No. 1 investor in renewable energy, relative to market capitalization, among all U.S. investor-owned utilities. ALLETE Chair, President and CEO Bethany Owen said New Energy Equity is a complementary fit with the company’s sustainability-in-action strategy.

“We’ve been signaling our move into the solar industry for some time, and as we met with New Energy Equity’s leadership team we knew we had found the right company to position us well,” Owen said. “The team brings a depth of distributed and community solar expertise and experience to ALLETE, along with a proven track record of financial success. The addition of New Energy Equity enhances our strong portfolio of companies and capabilities and opens new growth opportunities as we lead the way to a sustainable energy future.”

New Energy Equity also has two wholly owned subsidiaries, Impact Power Solutions and Energy Support Services. New Energy Equity’s entire team, including management, will remain in place, as will the company's Maryland headquarters and offices in Roseville, Minnesota, and Boulder, Colorado.

ALLETE, Inc. is an energy company headquartered in Duluth, Minnesota. In addition to its electric utilities, Minnesota Power and Superior Water, Light and Power of Wisconsin, ALLETE owns ALLETE Clean Energy, based in Duluth; New Energy Equity, based in Annapolis, Maryland; and BNI Energy in Bismarck, N.D.; and has an 8% equity interest in the American Transmission Co. More information about ALLETE is available at www.allete.com.

ALE-CORP

The statements contained in this release and statements that ALLETE may make orally in connection with this release that are not historical facts, are forward-looking statements. Actual results may differ materially from those projected in the forward-looking statements. These forward-looking statements involve risks and uncertainties and investors are directed to the risks discussed in documents filed by ALLETE with the Securities and Exchange Commission.


Contacts

Vince Meyer
218-723-3952
This email address is being protected from spambots. You need JavaScript enabled to view it.

HOUSTON--(BUSINESS WIRE)--Gulf Coast Ultra Deep Royalty Trust (OTC Pink: GULTU) (the Trust) announced today that it will distribute to unitholders a cash distribution totaling $258,130 for the quarter ended March 31, 2022. Unitholders of record on April 29, 2022 will receive a cash distribution of $0.001121 per unit payable on May 13, 2022.

Natural gas (Mcf) sales volumes, average sales price and net cash proceeds available for distribution for the quarter ended March 31, 2022 are set forth in the table below:


Natural gas (Mcf) sales volumes (a)


115,517


Natural gas (per Mcf) average sales price


$

4.30


Gross proceeds


$

496,826


Post-production costs and specified taxes


(45,796

)

Royalty income


451,030


Interest and dividend income


17


Administrative expenses


(184,167

)

Income in excess of administrative expenses


266,880


Increase in minimum cash reserve


$

(8,750

)

Cash proceeds available for distribution


$

258,130


(a) Attributable to the onshore Highlander subject interest which is the only subject interest with commercial production.

About Gulf Coast Ultra Deep Royalty Trust. The Trust is a Delaware statutory trust created to hold a 5% gross overriding royalty interest in future production from specified Inboard Lower Tertiary/Cretaceous exploration prospects located in the shallow waters of the Gulf of Mexico and onshore in South Louisiana that existed as of December 5, 2012, which are collectively referred to as subject interests. The subject interests and the Trust’s overriding royalty interests are described in the Trust’s filings with the Securities and Exchange Commission (SEC). As described in the Trust’s SEC filings, future distributions are not guaranteed and will depend on the proceeds received by the Trust as a result of actual production volumes, oil and gas prices, post-production costs and specified taxes, and the amount and timing of the Trust’s administrative expenses, among other factors. For additional information on the Trust, please visit http://gultu.q4web.com/home/default.aspx.

Cautionary Statement Regarding Forward-Looking Information. This press release contains forward-looking statements within the meaning of Section 27A of the Securities Act of 1933, as amended, and Section 21E of the Securities Exchange Act of 1934, as amended. Forward-looking statements are all statements other than statements of historical facts, such as any statements regarding the amount and date of quarterly distributions to unitholders. Forward-looking statements are not guarantees or assurances of future performance and actual results may differ materially from those anticipated, projected or assumed in the forward-looking statements. Important factors that may cause actual results to differ materially from those anticipated by the forward-looking statements include, but are not limited to, the amount of cash received or expected to be received by the Trustee from the underlying properties on or prior to a record date for a quarterly cash distribution. Any differences in actual cash receipts by the Trust could affect the amount of quarterly cash distributions. Other important factors that may cause actual results to differ materially include risks inherent in production of oil and gas properties, the ability of commodity purchasers to make payment, the economic effects of the COVID-19 pandemic and federal, state and local governmental actions in response to the pandemic, and other risk factors described in the Trust’s Annual Report on Form 10-K for the year ended December 31, 2021, filed with the SEC. The Trust's annual, quarterly and other filed reports are or will be available over the Internet at the SEC's website at http://www.sec.gov. Statements made in this press release are qualified by the cautionary statements made in this press release. The Trust cautions investors that it does not intend, and assumes no obligation, to update any of the statements included in this press release.

The Bank of New York Mellon Trust Company, N.A. serves as trustee of the Trust. If you have any questions related to the Trust, please see below for contact information:


Contacts

Gulf Coast Ultra Deep Royalty Trust
The Bank of New York Mellon Trust Company, N.A., as Trustee
Sarah Newell
(512) 236-6555

Lower total customer bills forecast for January 2023

CHICAGO--(BUSINESS WIRE)--ComEd today submitted to the Illinois Commerce Commission (ICC) a request for an increase of $199 million in electricity delivery charges to sustain improvements in reliability for residential and commercial customers and support the transition to 100% clean energy. While the request would increase monthly residential delivery charges by about $2.20, there will be offsets and decreases driven mainly by a reduction in energy capacity costs, which ComEd estimates will result in a total average monthly bill next January that will likely be lower than current bills.


The ICC is reviewing a proposal to advance to customers $65 million in deferred income tax benefits, which would offset 82 cents of the monthly delivery charge increase. In addition, the capacity charges that customers pay to ensure enough power supply to meet demand when it is highest are expected to decline by 65% this year.

“As we bring more renewable energy like wind and solar onto the power grid to support the state’s ambitious clean energy goals, we must enhance our infrastructure to safely integrate these resources and ensure the more than 9 million people we serve can continue to count on reliable and affordable energy,” said Gil Quiniones, CEO, ComEd. “The grid was designed decades before widescale adoption of renewables, electric vehicles, digital devices, industrial electrification and emerging sectors like indoor agriculture. We will continue working with local leaders and community groups to ensure the grid can meet the needs of all customers in the 21st century.”

Today’s rate filing begins an eight-month process during which the ICC and other groups will review ComEd’s proposal, including its actual operating costs for 2021 and expected investments for 2022. Regulators must find all of these costs prudent and reasonable before including them in customer rates that take effect in January 2023.

Competitive Rates, Energy Efficiency

ComEd’s average total monthly residential bill was $89.49 in February, slightly less than the $90 total bill in January 2015. Even with the requested increase in delivery charges for 2022 and before expected upcoming offsets, ComEd’s residential customer rates next January are expected to be at least 10% below the average of rates in the 10 largest U.S. metropolitan areas.

ComEd is focused on delivering value to customers and energy efficiency plays a key role. Customers have saved a total of more than $6 billion on their bills as a result of the energy efficiency program that ComEd launched in 2008, with nearly 460,000 families and businesses participating in 2021. ComEd is expanding support for energy efficiency in line with Illinois’ new clean energy law, including programs to help low-income customers save money and energy and electrify their homes to reduce fossil fuel use.

Expanding Solar Energy

ComEd continues to increase customer access to clean and affordable solar energy. By the end of this year, it expects to have more than 80 community solar projects interconnected to its grid, enabling approximately 25,000 residential customers to realize the benefits of solar energy without installing solar panels on their own homes. Since 2019, ComEd has provided more than $44 million to commercial and industrial customers through the distributed generation rebate program, which pays $250 per kilowatt-hour of installed solar power capacity, reducing the upfront costs of rooftop solar.

The transition to clean energy requires advanced technologies to safely integrate distributed energy resources, including renewable energy like solar, wind and battery storage. ComEd is developing software that supports monitoring and coordinated control of solar and wind energy. It’s also conducting pilot projects that demonstrate the value of energy storage systems and their role in promoting reliability, mitigating the intermittency of renewable energy, and deferring or avoiding the cost of traditional grid investments.

Other investments covered by ComEd’s rate request include additional installation of “smart switches” that automatically route power around problem areas. Since 2012, this technology has helped spare ComEd customers more than 17 million service interruptions and saved more than $3 billion in outage costs. In 2021, ComEd also completed digital upgrades to selected substations to enhance remote monitoring capabilities and reduce the risk of outages due to wildlife contacts and extreme weather.

Driving Economic Growth

ComEd grid investments are making a positive economic impact in northern Illinois. In 2021, ComEd helped bring to the region more than 16 new commercial projects, including six new data centers, which will support 4,700 new jobs and generate more than $3 billion in investments. ComEd spent $893 million with minority- and woman-owned businesses in 2021, bringing its total spend with diversity-certified suppliers to $6.4 billion since 2012.

ComEd customers experiencing difficulty paying their electric bill are encouraged to call ComEd at 1-800-334-7661 (1-800-EDISON-1). Information is also available at ComEd.com/PaymentAssistance. ComEd can help connect eligible customers to funding available through state and federal assistance programs, including the Low Income Home Energy Assistance Program (LIHEAP), which is available through May 31, 2022.

ComEd is a unit of Chicago-based Exelon Corporation (NASDAQ: EXC), a Fortune 200 energy company with approximately 10 million electricity and natural gas customers – the largest number of customers in the U.S. ComEd powers the lives of more than 4 million customers across northern Illinois, or 70 percent of the state’s population. For more information visit ComEd.com and connect with the company on Facebook, Twitter, Instagram and YouTube


Contacts

ComEd Media Relations
312-394-3500

HOUSTON--(BUSINESS WIRE)--Helix Energy Solutions Group, Inc. (NYSE: HLX) will issue a press release reporting its first quarter 2022 results on Monday, April 25, 2022, after the close of business. The press release and associated slide presentation will be available on Helix's website, www.HelixESG.com.


Helix will review its first quarter 2022 results on Tuesday, April 26, 2022, at 9:00 a.m. Central Time via a live webcast and teleconference. The live webcast will be available on our website under "For the Investor." Investors and other interested parties wishing to dial in to the teleconference may join by dialing 1-877-243-4912 for participants in the United States or 1-212-231-2938 for international participants. The passcode is "Staffeldt." A replay of the webcast will be available on our website under "For the Investor" by selecting the "Audio Archives" link beginning approximately two hours after the completion of the event.

About Helix

Helix Energy Solutions Group, Inc., headquartered in Houston, Texas, is an international offshore energy services company that provides specialty services to the offshore energy industry, with a focus on well intervention and robotics operations. For more information about Helix, please visit our website at www.HelixESG.com.


Contacts

Erik Staffeldt, Executive Vice President and CFO
email: This email address is being protected from spambots. You need JavaScript enabled to view it.
Ph: 281-618-0465

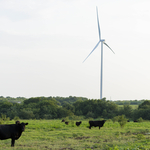
RADNOR, Pa.--(BUSINESS WIRE)--Airgas, an Air Liquide company, is purchasing wind power for an Air Separation Unit (ASU) in Cleburne, Texas, outside of Dallas, making it the first Airgas primary production unit to be powered with an energy mix that includes locally sourced renewable energy. The ASU produces liquid argon, nitrogen and oxygen and will run on wind power mixed with other energy sources, cutting the overall carbon footprint by an estimated 15,840 metric tons per year. This is equivalent to the CO2 emissions associated with the electricity used by approximately 3,000 U.S. homes every year.


Airgas began receiving wind power at the Cleburne plant in November from a nearby subsidiary of NextEra Energy Resources, LLC, the world’s largest generator of renewable energy from the wind and sun. Airgas is leveraging around 20 percent of the renewable wind electricity purchased through an Air Liquide Power Purchase Agreement announced in and planned for since 2018.

In addition to the renewable energy purchased for the Cleburne plant, Airgas is continuing to evaluate new local renewable energy sources for other ASUs in other markets as well. Airgas purchases unbundled Renewable Energy Certificates (RECs) – certifying megawatt hours of electricity generated and delivered to the grid from a renewable energy source – for Air Separation Units operating across the United States.

Airgas will continue to increase its renewable energy mix for primary production units in contribution to Air Liquide Group efforts to reduce Scope 1 and Scope 2 CO2 emissions by 33 percent by 2035 on the path to carbon neutrality by 2050.

Marcelo Fioranelli, CEO, commented: “Airgas is very proud to be using new renewable energy sources to run our Air Separation Units, whether from local sources where available like Cleburne, Texas, or through Renewable Energy Certificates. We are reducing our carbon footprint at an accelerated pace and pushing forward to help our customers environmentally optimize their own processes.”

Airgas, Inc.

Airgas®, an Air Liquide company, is a leading U.S. supplier of industrial, medical and specialty gases, as well as hardgoods and related products; one of the largest U.S. suppliers of safety products; and a leading U.S. supplier of ammonia products and process chemicals.

Dedicated to improving the performance of its more than 1 million customers, Airgas safely and reliably provides products, services and expertise through its more than 18,000 associates, over 1,400 locations, robust e-Business platform, and Airgas Total Access® telesales channel.

As an Air Liquide company, a world leader in gases, technology and services for Industry and Health, Airgas offers customers an unrivaled global footprint and industry-leading technology and innovations.

For more information, please visit www.airgas.com.

________________________________________________________

A world leader in gases, technologies and services for Industry and Health, Air Liquide is present in 75 countries with approximately 66,400 employees and serves more than 3.8 million customers and patients. Oxygen, nitrogen and hydrogen are essential small molecules for life, matter and energy. They embody Air Liquide’s scientific territory and have been at the core of the company’s activities since its creation in 1902.

Air Liquide’s ambition is to be a leader in its industry, deliver long term performance and contribute to sustainability - with a strong commitment to climate change and energy transition at the heart of its strategy. The company’s customer-centric transformation strategy aims at profitable, regular and responsible growth over the long term. It relies on operational excellence, selective investments, open innovation and a network organization implemented by the Group worldwide. Through the commitment and inventiveness of its people, Air Liquide leverages energy and environment transition, changes in healthcare and digitization, and delivers greater value to all its stakeholders.

Air Liquide’s revenue amounted to more than 23 billion euros in 2021. Air Liquide is listed on the Euronext Paris stock exchange (compartment A) and belongs to the CAC 40, CAC 40 ESG, EURO STOXX 50 and FTSE4Good indexes.


Contacts

Airgas Communications
Kim Menard
267-432-7146
This email address is being protected from spambots. You need JavaScript enabled to view it.

MIAMI--(BUSINESS WIRE)--World Fuel Services Corporation (NYSE: INT) invites you to participate in a conference call with its management team on Thursday, April 28, 2022 at 5:00PM Eastern Time to discuss the Company’s first quarter results, as well as certain forward-looking information. The Company plans to release its first quarter results after the market closes on the same date.


The live conference call will be accessible by telephone at (833) 562-0141 (within the United States and Canada) or (661) 567-1221 (International). The call ID is 6092758.

The conference call will also be available via live webcast. The live webcast may be accessed by visiting the Company’s website at www.wfscorp.com and clicking on the webcast icon. An archive of the webcast will be available on the Company’s website two hours after the completion of the live call and will remain available until May 12, 2022.

About World Fuel Services Corporation

Headquartered in Miami, Florida, World Fuel Services is a global energy management company involved in providing supply fulfillment, energy procurement advisory services, and transaction and payment management solutions to commercial and industrial customers, principally in the aviation, marine and land transportation industries. World Fuel Services also offers natural gas and electricity, as well as energy advisory services, including programs for carbon offsets, sustainability solutions and renewable energy alternatives. World Fuel Services sells fuel and delivers services to its clients at more than 8,000 locations in more than 200 countries and territories worldwide.

For more information, visit www.wfscorp.com.


Contacts

Ira M. Birns
Executive Vice President & Chief Financial Officer
or
Glenn Klevitz, Vice President, Treasurer & Investor Relations
(305) 428-8000
This email address is being protected from spambots. You need JavaScript enabled to view it.

Service Cuts Affect Rail Shipments from Donaldsonville and Port Neal Complexes Products Affected Include Urea, UAN and Diesel Exhaust Fluid

DEERFIELD, Ill.--(BUSINESS WIRE)--CF Industries Holdings, Inc. (NYSE: CF), a leading global manufacturer of hydrogen and nitrogen products, today informed customers it serves by Union Pacific rail lines that railroad-mandated shipping reductions would result in nitrogen fertilizer shipment delays during the spring application season and that it would be unable to accept new rail sales involving Union Pacific for the foreseeable future. The Company understands that it is one of only 30 companies to face these restrictions.

CF Industries ships to customers via Union Pacific rail lines primarily from its Donaldsonville Complex in Louisiana and its Port Neal Complex in Iowa. The rail lines serve key agricultural areas such as Iowa, Illinois, Kansas, Nebraska, Texas and California. Products that will be affected include nitrogen fertilizers such as urea and urea ammonium nitrate (UAN) as well as diesel exhaust fluid (DEF), an emissions control product required for diesel trucks. CF Industries is the largest producer of urea, UAN and DEF in North America, and its Donaldsonville Complex is the largest single production facility for the products in North America.

“The timing of this action by Union Pacific could not come at a worse time for farmers,” said Tony Will, president and chief executive officer, CF Industries Holdings, Inc. “Not only will fertilizer be delayed by these shipping restrictions, but additional fertilizer needed to complete spring applications may be unable to reach farmers at all. By placing this arbitrary restriction on just a handful of shippers, Union Pacific is jeopardizing farmers’ harvests and increasing the cost of food for consumers.”

On Friday, April 8, 2022, Union Pacific informed CF Industries without advance notice that it was mandating certain shippers to reduce the volume of private cars on its railroad effective immediately. The Company was told to reduce its shipments by nearly 20%. CF Industries believes it will still be able to fulfill delivery of product already contracted for rail shipment to Union Pacific destinations, albeit with likely delays. However, because Union Pacific has told the Company that noncompliance will result in the embargo of its facilities by the railroad, CF Industries may not have available shipping capacity to take new rail orders involving Union Pacific rail lines to meet late season demand for fertilizer.

The application of nitrogen fertilizer is critical to maximizing crop yields. If farmers are unable to secure all the nitrogen fertilizer that they require in the current season because of supply chain disruptions such as rail shipping restrictions, the Company expects yield will be lower. This will likely extend the timeline to replenish global grains stocks. Low global grains stocks continue to support high front month and forward prices for nitrogen-consuming crops, which has contributed to higher food prices.

CF Industries intends to engage directly with the federal government to ask that fertilizer shipments be prioritized so that spring planting is not adversely impacted.

“CF Industries’ North American manufacturing network continues to produce at a high rate to meet the needs of customers, farmers and consumers,” said Will. “We urge the federal government to take action to remove these Union Pacific rail shipment restrictions to ensure this vital fertilizer will be able to reach U.S. farmers when and where they need it.”

About CF Industries Holdings, Inc.

At CF Industries, our mission is to provide clean energy to feed and fuel the world sustainably. With our employees focused on safe and reliable operations, environmental stewardship, and disciplined capital and corporate management, we are on a path to decarbonize our ammonia production network – the world’s largest – to enable green and blue hydrogen and nitrogen products for energy, fertilizer, emissions abatement and other industrial activities. Our nine manufacturing complexes in the United States, Canada, and the United Kingdom, an unparalleled storage, transportation and distribution network in North America, and logistics capabilities enabling a global reach underpin our strategy to leverage our unique capabilities to accelerate the world’s transition to clean energy. CF Industries routinely posts investor announcements and additional information on the Company’s website at www.cfindustries.com and encourages those interested in the Company to check there frequently.


Contacts

Media
Chris Close
Director, Corporate Communications
847-405-2542 – This email address is being protected from spambots. You need JavaScript enabled to view it.

Investors
Martin Jarosick
Vice President, Treasury and Investor Relations
847-405-2045 – This email address is being protected from spambots. You need JavaScript enabled to view it.

AUSTIN, Texas--(BUSINESS WIRE)--USA Compression Partners, LP (NYSE: USAC) (“USA Compression”) today announced a cash distribution of $0.525 per common unit ($2.10 on an annualized basis) for the first quarter of 2022. The distribution will be paid on May 6, 2022 to unitholders of record as of the close of business on April 25, 2022.


First Quarter 2022 Earnings Conference Call

In addition, USA Compression will release its first quarter 2022 results prior to the opening of U.S. financial markets on Tuesday, May 3. Management will conduct an investor conference call the same day starting at 11 a.m. Eastern Time (10 a.m. Central Time) to discuss financial and operating results. The call will be broadcast live over the internet. Investors may participate either by phone or audio webcast.


By Phone:


Dial 888-394-8218 inside the U.S. and Canada at least 10 minutes before the call and ask for the USA Compression Partners Earnings Call. Investors outside the U.S. and Canada should dial 323-701-0225. The conference ID for both is 8248631.


A replay of the call will be available through May 13, 2022. Callers inside the U.S. and Canada may access the replay by dialing 888-203-1112. Investors outside the U.S. and Canada should dial 719-457-0820. The conference ID for both is 8248631.


By Webcast:


Connect to the webcast via the “Events” page of USA Compression’s Investor Relations website at http://investors.usacompression.com. Please log in at least 10 minutes in advance to register and download any necessary software. A replay will be available shortly after the call.


ABOUT USA COMPRESSION PARTNERS, LP

USA Compression Partners, LP is a growth-oriented Delaware limited partnership that is one of the nation’s largest independent providers of natural gas compression services in terms of total compression fleet horsepower. USA Compression partners with a broad customer base composed of producers, processors, gatherers and transporters of natural gas and crude oil. USA Compression focuses on providing natural gas compression services to infrastructure applications primarily in high-volume gathering systems, processing facilities and transportation applications. More information is available at usacompression.com.

NON-U.S. WITHHOLDING INFORMATION

This release is intended to be a qualified notice under Treasury Regulation Section 1.1446-4(b). Brokers and nominees should treat one hundred percent (100.0%) of USA Compression’s distributions to non-U.S. investors as being attributable to income that is effectively connected with a United States trade or business. Accordingly, USA Compression’s distributions to non-U.S. investors are subject to federal income tax withholding at the highest applicable effective tax rate.

FORWARD-LOOKING STATEMENTS

Statements in this press release may be forward-looking statements as defined under federal law. These forward-looking statements rely on a number of assumptions concerning future events and are subject to a number of uncertainties and factors, many of which are outside the control of USA Compression, and a variety of risks that could cause results to differ materially from those expected by management of USA Compression. USA Compression undertakes no obligation to update or revise forward-looking statements to reflect changed assumptions, the occurrence of unanticipated events or changes to future operating results over time.


Contacts

Matt Liuzzi / 512-369-1624
This email address is being protected from spambots. You need JavaScript enabled to view it.

Small Restaurants in PG&E’s Service Area Can Apply for $3,000 Grants

OAKLAND, Calif.--(BUSINESS WIRE)--Following a successful inaugural program last year, the California Restaurant Foundation (CRF) is again providing grants to independent restaurant owners and their staffs through the Restaurants Care Resilience Fund. The PG&E Corporation Foundation is contributing $500,000 to the fund to support investment in and recovery of California’s restaurant community, which is still reeling from economic impacts of the COVID-19 pandemic.

The Restaurants Care Resilience Fund is accepting applications from April 15-30, 2022. Grant recipients can use the money for equipment upgrades to alleviate deferred maintenance and for employee retention to help with industry-wide staffing challenges. Small restaurants continue to be impacted by the last two years of debt and losses incurred amid rising costs.

Grants are available to California resident restaurant owners with fewer than three units and less than $3 million in revenue. The PG&E Corporation Foundation funding will prioritize minority- and women-owned businesses in PG&E’s service area in Northern and Central California. Last year, 109 grants were awarded to independent restaurant owners in the company’s service area.

“The PG&E Corporation Foundation’s generous contribution will help independent restaurant owners across Northern and Central California invest in their people, their equipment and ultimately, the long-term health and success of their businesses,” said Alycia Harshfield, Executive Director of CRF.

“Kitchens and crews are what keep restaurants running, and the Restaurants Care Resilience Fund is helping owners pay their workers, keep their doors open and fuel our local economies. We’re proud to again support our hometown restaurants through this fund, and all of our small business customers as they continue to recover from the financial effects of the pandemic,” said Robert Kenney, PG&E Senior Vice President of Regulatory and External Affairs, and chair of The PG&E Corporation Foundation board.

Assisting Small and Medium Businesses

PG&E remains committed to providing ways for its small and medium business customers to save energy and money amid the economic hardships suffered during the pandemic. Here are some ways PG&E is helping its customers:

  • Automatically enrolling qualified customers in PG&E’s COVID Relief Payment Plan to help pay down balances over time, protecting from disconnection.
  • Contacting business customers who would save money by choosing a better rate plan for their operations, in line with changing peak hours for time-of-use rate plans.
  • Providing COVID-19 relief and support information to all small business customers, including PG&E resources and external support for businesses like California state programs.
  • Increasing outreach to small business customers highlighting payment support and energy-savings programs through email campaigns, PG&E’s Energy Advisors, and direct mail.
  • Conducting outreach to eligible customers to enroll in a discounted rate for businesses struggling to stay open.
  • Offering rebate and financing solutions to help small business customers realize sustained cost savings.

For more information on PG&E Small and Medium Business customer support, visit pge.com/smbsupport.

For more information on the California Restaurant Foundation, Restaurants Care, or the Restaurant Resilience Fund, visit restaurantscare.org.

About PG&E

Pacific Gas and Electric Company, a subsidiary of PG&E Corporation (NYSE:PCG), is a combined natural gas and electric utility serving more than 16 million people across 70,000 square miles in Northern and Central California. For more information, visit www.pge.com/ and http://www.pge.com/about/newsroom/.


Contacts

MEDIA RELATIONS:
415-973-5930

ALEXANDRIA, Va.--(BUSINESS WIRE)--VSE Corporation (NASDAQ: VSEC), a leading provider of aftermarket distribution and maintenance, repair and overhaul (MRO) services for land, sea and air transportation assets supporting government and commercial markets, today announced that it will issue first quarter 2022 results after market close on Wednesday, April 27, 2022. A conference call will be held Thursday, April 28, 2022 at 8:30 A.M. ET to review the Company’s financial results, discuss recent events and conduct a question-and-answer session.


A webcast of the conference call and accompanying presentation materials will be available in the Investor Relations section of VSE’s website at https://ir.vsecorp.com. To listen to the live broadcast, go to the site at least 15 minutes prior to the scheduled start time in order to register, download and install any necessary audio software.

To participate in the live teleconference on April 28, 2022:
Domestic Live: (877) 407-0789
International Live: (201) 689-8562
Web link: Click here

To listen to a replay of the teleconference through May 12, 2022:
Domestic Replay: (844) 512-2921
International Replay: (412) 317-6671
Replay PIN Number: 13728798

ABOUT VSE CORPORATION
VSE is a leading provider of aftermarket distribution and repair services for land, sea and air transportation assets for government and commercial markets. Core services include maintenance, repair and overhaul (MRO) services, parts distribution, supply chain management and logistics, engineering support, and consulting and training services for global commercial, federal, military and defense customers. VSE also provides information technology and energy consulting services. For additional information regarding VSE’s services and products, visit us at www.vsecorp.com.

FORWARD LOOKING STATEMENTS
This release contains statements that, to the extent they are not recitations of historical fact, constitute “forward-looking statements” as defined in the Private Securities Litigation Reform Act of 1995. All such statements are intended to be subject to the safe harbor protection provided by applicable securities laws. For discussions identifying some important factors that could cause actual VSE results to differ materially from those anticipated in the forward-looking statements in this news release, see VSE’s public filings with the Securities and Exchange Commission. The forward-looking statements included herein are only made as of the date hereof, and VSE specifically disclaims any obligation to update these statements in the future.


Contacts

INVESTOR RELATIONS: Noel Ryan | Phone: 720.778.2415 | This email address is being protected from spambots. You need JavaScript enabled to view it.

Offshore Source Logo

Offshore Source keeps you updated with relevant information concerning the Offshore Energy Sector.

Any views or opinions represented on this website belong solely to the author and do not represent those of the people, institutions or organizations that Offshore Source or collaborators may or may not have been associated with in a professional or personal capacity, unless explicitly stated.

Corporate Offices

Technology Systems Corporation
8502 SW Kansas Ave
Stuart, FL 34997

info@tscpublishing.com