Business Wire News

DUBLIN--(BUSINESS WIRE)--The "Oil and Gas Equipment and Services Capital Raising Quarterly Review - Q2 2020" report has been added to ResearchAndMarkets.com's offering.


"Oil and Gas Equipment and Services Capital Raising Quarterly Review - Q2 2020" report is an essential source of data and trend analysis on financings (equity/debt offerings and PE/VC) in the equipment and services oil and gas industry. The report provides detailed comparative quarter-on-quarter data, on the number of deals and their value, sub-divided into deal types by geographies.

Scope

  • Analyze market trends for the Equipment and Services oil and gas industry in the global arena
  • Analysis of Equity/Debt Offerings, Private Equity, and Venture Financing in the Equipment and Services oil and gas industry
  • Information on the top deals that took place in the industry
  • Geographies covered include - North America, Europe, Asia Pacific, South & Central America, and Middle East & Africa

Reasons to Buy

  • Enhance your decision making capability in a more rapid and time sensitive manner
  • Evaluate ways to raise capital in the market, and identify major financial and legal advisors
  • Do deals with an understanding of how competitors are financed
  • Identify growth segments and opportunities in each region within the industry

Key Topics Covered:

  • Sector Highlights
  • Capital Raising - North America
  • Capital Raising - Europe
  • Capital Raising - Asia
  • Capital Raising - Middle East
  • Capital Raising - Oceania
  • Capital Raising - South America
  • Capital Raising - Africa
  • AppendixList of Tables
  • Top Equipment and Services Capital Raising Transactions in North America in Q2 2020
  • Top Equipment and Services Capital Raising Transactions in Europe in Q2 2020
  • Top Equipment and Services Capital Raising Transactions in Asia in Q2 2020
  • Top Equipment and Services Capital Raising Transactions in Middle East in Q2 2020
  • Top Equipment and Services Capital Raising Transactions in Oceania in Q2 2020
  • Top Equipment and Services Capital Raising Transactions in South America in Q2 2020

List of Figures

  • Equipment and Services Capital Raising Deal Value and Count
  • Equipment and Services Oil and Gas Regional Deal Share and Value in Q2 2020
  • Equipment and Services Oil and Gas North America Deal Value and Count
  • Equipment and Services Oil and Gas Europe Deal Value and Count
  • Equipment and Services Oil and Gas Asia Deal Value and Count
  • Equipment and Services Oil and Gas Middle East Deal Value and Count
  • Equipment and Services Oil and Gas Oceania Deal Value and Count
  • Equipment and Services Oil and Gas South America Deal Value and Count
  • Equipment and Services Oil and Gas Africa Deal Value and Count

For more information about this report visit https://www.researchandmarkets.com/r/dg28ri


Contacts

ResearchAndMarkets.com
Laura Wood, Senior Press Manager
This email address is being protected from spambots. You need JavaScript enabled to view it.
For E.S.T Office Hours Call 1-917-300-0470
For U.S./CAN Toll Free Call 1-800-526-8630
For GMT Office Hours Call +353-1-416-8900

Fourth Quarter 2020 Highlights:


  • Net income was $132.3 million. Net cash provided by operating activities was $174.5 million.
  • Net income attributable to Hess Midstream LP was $6.6 million, or $0.36 per Class A share, after deduction for noncontrolling interests.
  • Adjusted EBITDA1 was $199.1 million, Distributable Cash Flow1 was $176.8 million and Adjusted Free Cash Flow1 was $126.6 million.
  • Increased quarterly cash distribution to $0.4471 per Class A share, an increase of 1.2% compared with the third quarter of 2020 and 5% on an annualized basis, resulting in a 1.4x coverage ratio relative to distributions.
  • Completed construction and preservation activities for the 150 MMcf/d expansion of the Tioga Gas Plant.
  • Exercised the renewal options for additional 10-year terms for certain crude oil gathering, terminaling, storage, gas processing and gas gathering commercial agreements with Hess Corporation, extending these agreements through December 31, 2033.

2021 Guidance Highlights:

  • 2021 net income of $590—$620 million and Adjusted EBITDA of $860—$890 million, resulting in Distributable Cash Flow of $750—$780 million.
  • Capital expenditures expected to reduce to $160 million in 2021, reflecting lower ongoing capital levels following the completion of major construction at the Tioga Gas Plant expansion.
  • Hess Midstream LP expects to generate Adjusted Free Cash Flow of approximately $610—$640 million in 2021, sufficient to fully fund our targeted distributions with excess of approximately $100 million.
  • Completed annual tariff rate redetermination process and established minimum volume commitments (“MVCs”) for 2023 implying continued revenue growth through increasing MVCs in 2022 and expected organic volume growth in 2023.
  • Extended targeted annual distribution per share growth of at least 5% through 2023 with expected annual distribution coverage greater than 1.4x.
  • In 2022 and 2023, Hess Midstream LP expects continued growth in Adjusted EBITDA and Adjusted Free Cash Flow generation sufficient to fully fund growing distributions, creating additional capital allocation flexibility.

HOUSTON--(BUSINESS WIRE)--Hess Midstream LP (NYSE: HESM) (“Hess Midstream”) today reported fourth quarter 2020 net income of $132.3 million compared with net income of $75.1 million for the fourth quarter of 2019, as recast for the 2019 acquisition of Hess Infrastructure Partners LP (“HIP”) by Hess Midstream Operations LP (formerly known as Hess Midstream Partners LP) (the “Partnership”), Hess Midstream’s controlled subsidiary. After deduction for noncontrolling interests, net income attributable to Hess Midstream was $6.6 million, or $0.36 per Class A share. Hess Midstream generated Adjusted EBITDA of $199.1 million. Distributable Cash Flow (“DCF”) for the fourth quarter of 2020 was $176.8 million and Adjusted Free Cash Flow was $126.6 million.

 _________________________

1 Adjusted EBITDA, Distributable Cash Flow and Adjusted Free Cash Flow are non‑GAAP measures. Adjusted Free Cash Flow as reported in this release reflects Hess Midstream’s new definition of Adjusted Free Cash Flow, which is Distributable Cash Flow less expansion capital expenditures and ongoing contributions to equity investments, which is calculated in a manner consistent with similar measures used by other publicly traded midstream energy companies. Prior period calculations of Adjusted Free Cash Flow have been recast to conform to the new presentation, as applicable. Definitions and reconciliations of these non‑GAAP measures to GAAP reporting measures appear in the following pages of this release.

Commenting on the fourth quarter 2020 results, John Gatling, President and Chief Operating Officer of Hess Midstream said, “We executed especially well in 2020, considering the many macro-challenges of the year. 2021 is another inflection point, with Hess Midstream expecting significant adjusted free cash flow and increasing capital allocation flexibility. We plan to continue to enhance our gas capture capability, building out field compression and completing tie in of the Tioga Gas Plant expansion. We remain well-positioned with both pipeline and rail infrastructure to provide our customers with capacity and optionality for crude oil export from the Bakken.”

Hess Midstream’s results contained in this release include historical results of HIP for all periods prior to the closing of the Partnership’s acquisition of HIP, incentive distribution rights simplification and conversion from a master limited partnership into an “Up-C” structure on December 16, 2019 (collectively, the “Transaction”), which was accounted for as a business combination of entities under common control. We refer to certain results as “attributable to Hess Midstream LP,” which exclude (i) noncontrolling interests in the Partnership retained by affiliates of Hess Corporation (“Hess”) and Global Infrastructure Partners, (ii) noncontrolling interests in the historical operating subsidiaries of the Partnership, and (iii) historical activity of HIP prior to its acquisition by the Partnership, which is included in “net parent investment.”

Ongoing Response to COVID-19

The safety of our workforce and the communities where we operate continues to be our top priority. A cross-functional response team remains in place to coordinate our COVID-19 response from a health and safety perspective and to ensure that the detailed prevention protocols in place at all Hess Midstream assets are based on the most current recommendations by government and public health agencies.

Financial Results

Revenues and other income in the fourth quarter of 2020 were $266.5 million compared with $253.5 million in the prior-year quarter. Fourth quarter 2020 revenues included $22.0 million of pass-through rail transportation, electricity, produced water trucking and disposal costs and $6.8 million of shortfall fee payments related to minimum volume commitments compared with $42.6 million and $1.4 million, respectively, in the prior-year quarter. Revenues were up in part due to higher throughput volumes and in part due to higher MVC levels and increased tariff rates. Total costs and expenses in the fourth quarter of 2020 were $111.8 million down from $163.2 million in the prior-year quarter. The decrease was primarily attributable to lower general and administrative expenses that included Transaction costs in the fourth quarter of 2019, lower pass-through transportation costs and lower maintenance expenditures.

Net income for the fourth quarter of 2020 was $132.3 million, or $0.36 per Class A share, after deduction for noncontrolling interests. Substantially all of income tax expense (benefit) is attributed to earnings of Class A shares in accordance with our organizational structure. Net cash provided by operating activities for the fourth quarter of 2020 was $174.5 million.

Adjusted EBITDA for the fourth quarter of 2020 was $199.1 million. Relative to distributions, DCF for the fourth quarter of 2020 of $176.8 million resulted in an approximately 1.4x distribution coverage ratio. Adjusted Free Cash Flow for the fourth quarter of 2020 was $126.6 million.

Operational Highlights

Throughput volumes increased 3% for each of gas gathering and gas processing in the fourth quarter of 2020 compared with the fourth quarter of 2019 driven by higher gas capture by Hess Midstream. Water gathering volumes increased 62% compared with the year-ago quarter reflecting steady organic growth of our water handling business. Throughput volumes decreased 2% for crude oil gathering and 11% for crude oil terminaling in the fourth quarter of 2020 compared with the fourth quarter of 2019 due to natural decline of Hess and third-party production as a result of lower rig count in the Bakken. Third parties comprised approximately 10% of crude oil gathering and gas gathering volumes for the fourth quarter of 2020.

Capital Expenditures

Capital expenditures for the fourth quarter of 2020 totaled $50.8 million, including $50.2 million of expansion capital expenditures and $0.6 million of maintenance capital expenditures. Capital expenditures in the prior-year quarter were $108.2 million, including $106.5 million of expansion capital expenditures and $1.7 million of maintenance capital expenditures. During the fourth quarter of 2020, we completed construction and preservation activities for the 150 MMcf/d expansion of the Tioga Gas Plant. Incremental gas processing capacity is expected to be available in 2021 upon completion of a scheduled plant maintenance turnaround in the third quarter, during which the expansion and residue and natural gas liquid takeaway pipelines will be tied in.

Quarterly Cash Distributions

On January 25, 2021, our general partner’s board of directors declared a cash distribution of $0.4471 per Class A share for the fourth quarter of 2020, an increase of 1.2% over the distribution for the prior quarter, which equals a 5% increase on an annualized basis. The distribution is expected to be paid on February 12, 2021 to shareholders of record as of the close of business on February 4, 2021.

Annual Nomination Process

During the fourth quarter, Hess Midstream completed the annual nomination process set forth in our long-term commercial contracts with Hess. As part of the process, tariff rates were updated and MVCs were reviewed and updated. MVCs are set annually at 80% of Hess’ nomination for the three years following each nomination. Once set, MVCs for each year can only be increased and not reduced. MVCs for all years have been provided in recently released guidance for 2021. MVCs for 2023 imply continued revenue growth through increasing MVCs in 2022 and expected organic volume growth in 2023.

In addition, on December 30, 2020, Hess Midstream exercised its renewal options to extend for additional 10-year terms, through December 31, 2033, certain crude oil gathering, terminaling, storage, gas processing and gas gathering commercial agreements with Hess. There were no changes to any provisions of the existing commercial agreements as a result of the exercise of the renewal options.

Investor Webcast

Hess Midstream will review fourth quarter financial and operating results and other matters on a webcast today at 12:00 p.m. Eastern Time. The live audio webcast is accessible on the Investor page of our website www.hessmidstream.com. Conference call numbers for participation are 866-395-9624, or 213-660-0871 for international callers. The passcode number is 7380097. A replay of the conference call will be available at the same location following the event.

About Hess Midstream

Hess Midstream LP is a fee‑based, growth-oriented midstream company that operates, develops and acquires a diverse set of midstream assets to provide services to Hess and third‑party customers. Hess Midstream owns oil, gas and produced water handling assets that are primarily located in the Bakken and Three Forks Shale plays in the Williston Basin area of North Dakota. More information is available at www.hessmidstream.com.

Reconciliation of U.S. GAAP to Non‑GAAP Measures

In addition to our financial information presented in accordance with U.S. generally accepted accounting principles (“GAAP”), management utilizes certain additional non‑GAAP measures to facilitate comparisons of past performance and future periods. “Adjusted EBITDA” presented in this release is defined as reported net income (loss) before net interest expense, income tax expense, depreciation and amortization and our proportional share of depreciation of our equity affiliates, as further adjusted to eliminate the impact of certain items that we do not consider indicative of our ongoing operating performance, such as transaction costs, other income and other non-cash, non-recurring items, if applicable. “Distributable Cash Flow” or “DCF” is defined as Adjusted EBITDA less net interest, excluding amortization of deferred financing costs, cash paid for federal and state income taxes and maintenance capital expenditures. DCF does not reflect changes in working capital balances. We previously reported the non-GAAP measure of “free cash flow”, which we defined as Adjusted EBITDA less capital expenditures. As this definition varied from other definitions of free cash flow, we determined it was appropriate to discontinue reporting free cash flow as previously defined and to report Adjusted Free Cash Flow beginning with the fourth quarter of 2020. We define “Adjusted Free Cash Flow” as DCF less expansion capital expenditures and ongoing contributions to equity investments. We believe that investors’ understanding of our performance is enhanced by disclosing these measures as they may assist in assessing our operating performance as compared to other publicly traded companies in the midstream energy industry, without regard to historical cost basis or, in the case of Adjusted EBITDA, financing methods, and assessing the ability of our assets to generate sufficient cash flow to make distributions to our shareholders. These measures are not, and should not be viewed as, a substitute for GAAP net income or cash flow from operating activities and should not be considered in isolation. Reconciliations of Adjusted EBITDA, DCF and Adjusted Free Cash Flow to reported net income (GAAP) and net cash provided by operating activities (GAAP), are provided below. Hess Midstream is unable to project net cash provided by operating activities with a reasonable degree of accuracy because this metric includes the impact of changes in operating assets and liabilities related to the timing of cash receipts and disbursements that may not relate to the period in which the operating activities occur. Therefore, Hess Midstream is unable to provide projected net cash provided by operating activities, or the related reconciliation of projected Adjusted Free Cash Flow to projected net cash provided by operating activities without unreasonable effort.


Fourth Quarter


(unaudited)


2020


2019


(in millions, except ratio and per-share data)


Reconciliation of Adjusted EBITDA and Distributable Cash Flow to net income:


Net income


$

132.3


$

75.1


Plus:


Depreciation expense


40.0


37.5


Proportional share of equity affiliates' depreciation


1.3


1.5


Interest expense, net


23.4


18.2


Income tax expense (benefit)


2.1


(0.1

)

Transaction costs


-


26.2


Adjusted EBITDA


199.1


158.4


Less:


Interest, net


21.7


16.6


Maintenance capital expenditures


0.6


1.7


Distributable cash flow


$

176.8


$

140.1


Reconciliation of Adjusted EBITDA, Distributable Cash Flow and Adjusted Free Cash Flow to net cash provided by operating activities:


Net cash provided by operating activities


$

174.5


$

136.3


Changes in assets and liabilities


1.4


(25.2

)

Amortization of deferred financing costs


(1.4

)


(1.3

)

Proportional share of equity affiliates' depreciation


1.3


1.5


Interest expense, net


23.4


18.2


Earnings from equity investments


3.1


2.9


Distribution from equity investments


(2.9

)


-


Transaction costs


-


26.2


Other


(0.3

)


(0.2

)

Adjusted EBITDA


$

199.1


$

158.4


Less:


Interest, net


21.7


16.6


Maintenance capital expenditures


0.6


1.7


Distributable cash flow


$

176.8


$

140.1


Less:


Expansion capital expenditures


50.2


106.5


Adjusted free cash flow*


$

126.6


$

33.6


Distributed cash flow


127.2


121.1


Distribution coverage ratio


1.4

x


1.2

x

Distribution per Class A share/limited partner unit


$

0.4471


$

0.4258


* Adjusted Free Cash Flow as reported in this release reflects Hess Midstream’s new definition of Adjusted Free Cash Flow, which is DCF less expansion capital expenditures and ongoing contributions to equity investments, which conforms to definitions used by other publicly traded midstream energy companies. Prior period calculations of Adjusted Free Cash Flow have been recast to conform to the new presentation, as applicable.


Guidance


Year Ending


December 31, 2021


(Unaudited)

(in millions)


Reconciliation of Adjusted EBITDA, Distributable Cash Flow and Adjusted Free Cash Flow to net income:


Net income


$

590 – 620

Plus:


Depreciation expense*


160

Interest expense, net


100

Income tax expense


10

Adjusted EBITDA


$

860 – 890

Less:


Interest, net, and maintenance capital expenditures


110

Distributable cash flow


$

750 – 780

Less:


Expansion capital expenditures


140

Adjusted free cash flow


$

610 – 640

*Includes proportional share of equity affiliates' depreciation


Cautionary Note Regarding Forward-looking Information

This press release contains “forward-looking statements” within the meaning of U.S. federal securities laws. Words such as “anticipate,” “estimate,” “expect,” “forecast,” “guidance,” “could,” “may,” “should,” “would,” “believe,” “intend,” “project,” “plan,” “predict,” “will,” “target” and similar expressions identify forward-looking statements, which are not historical in nature. Our forward-looking statements may include, without limitation: our future financial and operational results; our business strategy; our industry; our expected revenues; our future profitability; our maintenance or expansion projects; our projected budget and capital expenditures and the impact of such expenditures on our performance; and future economic and market conditions in the oil and gas industry.

Forward-looking statements are based on our current understanding, assessments, estimates and projections of relevant factors and reasonable assumptions about the future. Forward-looking statements are subject to certain known and unknown risks and uncertainties that could cause actual results to differ materially from our historical experience and our current projections or expectations of future results expressed or implied by these forward-looking statements. The following important factors could cause actual results to differ materially from those in our forward-looking statements: the direct and indirect effects of the COVID-19 global pandemic and other public health developments on our business and those of our business partners, suppliers and customers, including Hess; the ability of Hess and other parties to satisfy their obligations to us, including Hess’ ability to meet its drilling and development plans on a timely basis or at all and the operation of joint ventures that we may not control; our ability to generate sufficient cash flow to pay current and expected levels of distributions; reductions in the volumes of crude oil, natural gas, natural gas liquids (“NGLs”) and produced water we gather, process, terminal or store; fluctuations in the prices and demand for crude oil, natural gas and NGLs, including as a result of the COVID-19 global pandemic; changes in global economic conditions and the effects of a global economic downturn on our business and the business of our suppliers, customers, business partners and lenders; our ability to comply with government regulations or make capital expenditures required to maintain compliance, including our ability to obtain or maintain permits necessary for capital projects in a timely manner, if at all, or the revocation or modification of existing permits; our ability to successfully identify, evaluate and timely execute our capital projects, investment opportunities and growth strategies, whether through organic growth or acquisitions; costs or liabilities associated with federal, state and local laws, regulations and governmental actions applicable to our business, including legislation and regulatory initiatives relating to environmental protection and safety, such as spills, releases, pipeline integrity and measures to limit greenhouse gas emissions; our ability to comply with the terms of our credit facility, indebtedness and other financing arrangements, which, if accelerated, we may not be able to repay; reduced demand for our midstream services, including the impact of weather or the availability of the competing third-party midstream gathering, processing and transportation operations; potential disruption or interruption of our business due to catastrophic events, such as accidents, severe weather events, labor disputes, information technology failures, constraints or disruptions and cyber-attacks; any limitations on our ability to access debt or capital markets on terms that we deem acceptable, including as a result of weakness in the oil and gas industry or negative outcomes within commodity and financial markets; liability resulting from litigation; and other factors described in Item 1A—Risk Factors in our Annual Report on Form 10-K and any additional risks described in our other filings with the Securities and Exchange Commission.

As and when made, we believe that our forward-looking statements are reasonable. However, given these risks and uncertainties, caution should be taken not to place undue reliance on any such forward-looking statements since such statements speak only as of the date when made and there can be no assurance that such forward-looking statements will occur and actual results may differ materially from those contained in any forward-looking statement we make. Except as required by law, we undertake no obligation to publicly update or revise any forward-looking statements, whether because of new information, future events or otherwise.

HESS MIDSTREAM LP

SUPPLEMENTAL FINANCIAL DATA (UNAUDITED)

(IN MILLIONS)


Fourth


Fourth


Third


Quarter


Quarter


Quarter


2020


2019


2020


Statement of operations


Revenues


Affiliate services


$

266.5


$

253.1


$

264.7


Other income


-


0.4


0.1


Total revenues


266.5


253.5


264.8


Costs and expenses


Operating and maintenance expenses (exclusive of depreciation shown separately below)


66.6


92.7


83.9


Depreciation expense


40.0


37.5


39.5


General and administrative expenses


5.2


33.0


4.2


Total costs and expenses


111.8


163.2


127.6


Income from operations


154.7


90.3


137.2


Income from equity investments


3.1


2.9


3.6


Interest expense, net


23.4


18.2


23.2


Income before income tax expense (benefit)


134.4


75.0


117.6


Income tax expense (benefit)


2.1


(0.1

)


1.8


Net income


$

132.3


$

75.1


$

115.8


Less: Net income (loss) attributable to net parent investment


-


(11.0

)


-


Less: Net income attributable to noncontrolling interest


125.7


70.0


110.2


Net income attributable to Hess Midstream LP


6.6


16.1


5.6


Less: General partner's interest in net income


-


0.3


-


Limited partners' interest in net income


$

6.6


$

15.8


$

5.6


Net income attributable to Hess Midstream LP per Class A share/limited partner unit:


Basic


$

0.36


$

0.28


$

0.31


Diluted


$

0.36


$

0.28


$

0.31


Weighted average Class A shares outstanding subsequent to December 16, 2019:


Basic


18.0


18.0


18.0


Diluted


18.2


18.0


18.1


Weighted average limited partner units outstanding prior to December 16, 2019


Basic:


Common


27.3


Subordinated


27.3


Diluted:


Common


27.5


Subordinated


27.3


HESS MIDSTREAM LP

SUPPLEMENTAL FINANCIAL DATA (UNAUDITED)

(IN MILLIONS)


Year Ended December 31,


2020


2019


Statement of operations


Revenues


Affiliate services


$

1,091.6


$

847.6


Other income


0.3


0.7


Total revenues


1,091.9


848.3


Costs and expenses


Operating and maintenance expenses (exclusive of depreciation shown separately below)


337.4


276.8


Depreciation expense


156.9


142.5


General and administrative expenses


21.1


52.4


Total costs and expenses


515.4


471.7


Income from operations


576.5


376.6


Income from equity investments


10.3


3.4


Interest expense, net


94.7


62.4


Gain on sale of property, plant and equipment


0.1


-


Income before income tax expense (benefit)


492.2


317.6


Income tax expense (benefit)


7.3


(0.1

)

Net income


$

484.9


$

317.7


Less: Net income (loss) attributable to net parent investment


-


(55.0

)

Less: Net income attributable to noncontrolling interest


460.9


302.6


Net income attributable to Hess Midstream LP


24.0


70.1


Less: General partner's interest in net income


-


3.4


Limited partners' interest in net income


$

24.0


$

66.7


Net income attributable to Hess Midstream LP per Class A share/limited partner unit:


Basic:


$

1.33


$

1.21


Diluted:


$

1.31


$

1.20


Weighted average Class A shares outstanding subsequent to December 16, 2019


Basic


18.0


18.0


Diluted


18.1


18.0


Weighted average limited partner units outstanding prior to December 16, 2019


Basic:


Common


27.3


Subordinated


27.3


Diluted:


Common


27.5


Subordinated


27.3


Contacts

For Hess Midstream LP

Investor Contact:
Jennifer Gordon
(212) 536-8244

Media Contact:
Robert Young
(713) 496-6076


Read full story here

DUBLIN--(BUSINESS WIRE)--The "Norway Upstream (Oil and Gas) Fiscal and Regulatory Guide" report has been added to ResearchAndMarkets.com's offering.


"Norway Upstream (Oil and Gas) Fiscal and Regulatory Guide", presents the essential information relating to the terms which govern investment into Norway's upstream oil and gas sector.

The report sets out in detail the contractual framework under which firms must operate in the industry, clearly defining factors affecting profitability and quantifying the state's take from hydrocarbon production. Considering political, economic and industry specific variables, the report also analyses future trends for Norway's upstream oil and gas investment climate.

Norway governs upstream petroleum operations through a royalty and tax framework. In June 2020, the government approved an investment tax relief package that temporarily amends the rules on depreciation, tax-free income (uplift), and losses as defined in the Petroleum Tax Act.

The package allows development expenses and uplift (temporarily increased to 24%) to be immediately deducted from the special tax base for 2020 and 2021. The tax value of losses incurred in 2020 and 2021 will also be refunded. After 2021, eligible projects will continue to benefit from the incentive.

There have been early indications that the package will be effective in ensuring continued investment in Norway's industry. To promote continued exploration, the government has also launched the APA 2020 licensing round. The deadline to apply for the round is September 22, 2020 and awards are expected in Q1 2021.

Scope

  • Overview of current fiscal terms governing upstream oil and gas operations in Norway
  • Assessment of the current fiscal regime's state take and attractiveness to investors
  • Charts illustrating the regime structure, and legal and institutional frameworks
  • Detail on legal framework and governing bodies administering the industry
  • Levels of upfront payments and taxation applicable to oil and gas production
  • Information on application of fiscal and regulatory terms to specific licenses
  • Outlook on future of fiscal and regulatory terms in Norway

Reasons to Buy

  • Understand the complex regulations and contractual requirements applicable to Norway's upstream oil and gas sector
  • Evaluate factors determining profit levels in the industry
  • Identify potential regulatory issues facing investors in the country's upstream sector
  • Utilize considered insight on future trends to inform decision-makings

Key Topics Covered:

1. Executive Summary

1.1 Regime Overview - Royalty Tax Agreement

1.2 Timeline

2. State Take Assessment

3. Key Fiscal Terms

3.1 Royalties, Bonuses and Fees

3.2 Abandonment and Decommissioning

3.3 Direct Taxation

3.4 Indirect Taxation

3.5 State Participation

4. Regulation and Licensing

4.1 Legal Framework

4.2 Institutional Framework

4.3 Licensing Process

4.4 License Terms

5. Appendix

For more information about this report visit https://www.researchandmarkets.com/r/jtfsca


Contacts

ResearchAndMarkets.com
Laura Wood, Senior Press Manager
This email address is being protected from spambots. You need JavaScript enabled to view it.
For E.S.T Office Hours Call 1-917-300-0470
For U.S./CAN Toll Free Call 1-800-526-8630
For GMT Office Hours Call +353-1-416-8900

Broadens Eligibility Requirements, Adds New Tournaments to 2021 Season

KENNESAW, Ga.--(BUSINESS WIRE)--Yamaha Marine today announced the expansion of Power Pay, a contingency program that provides a cash bonus to Yamaha anglers who place in sanctioned salt and freshwater tournaments. For the 2021 season, Yamaha adds 68 new competitive fishing events, enhances the payout bonus amounts and broadens the eligibility requirements to eligible anglers who own a Yamaha outboard with a warranty start date within the 60 months prior to registering for Power Pay.


“The rules no longer require Power Pay anglers to be the original outboard owners. Now, Power Pay eligibility is open to second, third and even fourth Yamaha owners as long as the outboard has been warranty registered within the stated time,” said Connor Megan, Senior Regional Marketing Specialist, Yamaha Marine Engine Systems. “The first year of the program was a tremendous success with hundreds of qualified anglers winning nearly $140,000 in Power Pay bonus money despite the difficult situations created by COVID-19. We think 2021 will be even bigger.”

Introduced in the fall of 2019, Power Pay gives anglers the opportunity to receive compensation for running eligible Yamaha outboards. Eligible anglers running Yamaha outboards can sign up for the program by visiting yamahapowerpay.com. All applicants are required to accept and adhere to the Yamaha Angler Code of Ethics before completing the registration for the program. Once registered, the highest placing angler in specified Power Pay sanctioned tournaments that meets all eligibility requirements will be compensated by Yamaha accordingly.

New tournaments for 2021 include the MLF Bass Pro Tour, Bass Champs Texas, Carolina Bass Challenge, Texas Team Trail®, Nichols Team Series Oklahoma, Phoenix BFL Regionals, EFL™ Redfish Contender Series and EFL™ Redfish Tour. Additional eligible Power Pay tournaments and trails include the Bassmaster Classic®, Bassmaster® Angler of the Year, Bassmaster Opens, B.A.S.S. Nation®, Bassmaster Elites, Bassmaster College Series, Bassmaster High School series, A.B.A. Bass Pro Shops® Open Series, Alabama Bass Trail, MWC, The National Walleye Tour®, AIM® Walleye, Kingfish Cup and Flatsmasters®.

For more information and complete terms and conditions about Power Pay, visit yamahapowerpay.com. Some restrictions apply. Void where prohibited by law.

Yamaha Marine products are marketed throughout the United States and around the world. Yamaha Marine Engine Systems, based in Kennesaw, Ga., supports its 2,000 U.S. dealers and boat builders with marketing, training and parts for Yamaha’s full line of products and strives to be the industry leader in reliability, technology and customer service. Yamaha Marine is the only outboard brand to have earned NMMA®’s C.S.I. Customer Satisfaction Index award every year since its inception. Visit www.yamahaoutboards.com.

REMEMBER to always observe all applicable boating laws. Never drink and drive. Dress properly with a USCG-approved personal floatation device and protective gear.

© 2020 Yamaha Motor Corporation, U.S.A. All rights reserved.

This document contains many of Yamaha's valuable trademarks. It may also contain trademarks belonging to other companies. Any references to other companies or their products are for identification purposes only and are not intended to be an endorsement. Bassmaster and B.A.S.S. Nation are registered trademarks of B.A.S.S. LLC.


Contacts

Melissa Boudoux
Manager, Communications
Yamaha U.S. Marine Engine Systems
Office: (770) 701-3269
Mobile: (404) 381-7593
This email address is being protected from spambots. You need JavaScript enabled to view it.

Neal Wheaton
Wilder+Wheaton for
Yamaha U.S Marine Engine Systems
Mobile: (404) 317-0698
This email address is being protected from spambots. You need JavaScript enabled to view it.

DUBLIN--(BUSINESS WIRE)--The "Brunei Midstream Oil and Gas Industry Outlook to 2025" report has been added to ResearchAndMarkets.com's offering.


Brunei Midstream Oil and Gas Industry Outlook to 2025 - Market Outlook for Liquefied Natural Gas (LNG), Oil Storage and Pipelines is a comprehensive report on midstream oil and gas industry in Brunei. The report provides details such as name, type, operational status and operator for all active and planned (new build) LNG terminals, oil storage terminals and major trunk pipelines in Brunei till 2025. Further, the report also offers recent developments in the country's midstream sector, wherever available.

Scope

  • Updated information related to all active, planned and announced LNG terminals, oil storage terminals and trunk pipelines in the country, including operator and equity details
  • Key mergers and acquisitions and asset transactions in the country's midstream oil and gas industry, where available
  • Latest developments, financial deals and awarded contracts related to midstream oil and gas industry in the country, wherever available

Reasons to Buy

  • Gain strong understanding of the country's midstream oil and gas industry
  • Facilitate decision making on the basis of strong historical and outlook of capacity/length data
  • Assess your competitor's major oil storage terminals, major trunk pipelines and underground gas storage sites in the country
  • Analyze the latest developments related to the country's midstream oil and gas industry

Key Topics Covered:

1. Table of Contents

1.1. List of Tables

1.2. List of Figures

2. Introduction

2.1. What is This Report About?

2.2. Market Definition

3. Brunei LNG Industry

3.1. Brunei LNG Industry, Liquefaction

3.1.1. Brunei LNG Industry, Liquefaction, Overview

3.1.2. Brunei LNG Industry, Total Liquefaction Capacity

3.2. Brunei LNG Industry, Liquefaction Capacity by Company

3.3. Brunei LNG Industry, Liquefaction Capacity by Terminal

3.4. Brunei LNG Industry, Liquefaction Asset Details

3.4.1. Brunei LNG Industry, Liquefaction Active Asset Details

4. Brunei Oil Storage Industry

4.1. Brunei Oil Storage Industry, Overview

4.2. Brunei Oil Storage Industry, Storage Operations

4.2.1. Brunei Oil Storage Industry, Total Storage Capacity

4.3. Brunei Oil Storage Industry, Storage Capacity by Company

4.4. Brunei Oil Storage Industry, Storage Capacity by Terminal

4.5. Brunei Oil Storage Industry, Asset Details

4.5.1. Brunei Oil Storage Industry, Active Asset Details

5. Brunei Oil and Gas Pipelines Industry

5.1. Brunei Oil Pipelines

5.1.1. Brunei Oil Pipelines, Key Data

5.2. Brunei Oil Pipelines, Overview

5.3. Brunei Oil and Gas Pipelines Industry, Crude Oil Pipeline Length by Company

5.4. Brunei Oil and Gas Pipelines Industry, Crude Oil Pipelines

5.5. Brunei Oil and Gas Pipelines Industry, Oil Pipelines Asset Details

5.5.1. Brunei Oil and Gas Pipelines Industry, Oil Pipelines Active Asset Details

5.6. Brunei Gas Pipelines, Key Data

5.6.1. Brunei Gas Pipelines, Overview

5.7. Brunei Oil and Gas Pipelines Industry, Natural Gas Pipeline Length by Company

5.8. Brunei Oil and Gas Pipelines Industry, Natural Gas Pipelines

5.9. Brunei Oil and Gas Pipelines Industry, Gas Pipelines Asset Details

5.9.1. Brunei Oil and Gas Pipelines Industry, Gas Pipelines Active Asset Details

6. Recent Developments

6.1. Other Significant Developments

7. Appendix

For more information about this report visit https://www.researchandmarkets.com/r/les68h


Contacts

ResearchAndMarkets.com
Laura Wood, Senior Press Manager
This email address is being protected from spambots. You need JavaScript enabled to view it.
For E.S.T Office Hours Call 1-917-300-0470
For U.S./CAN Toll Free Call 1-800-526-8630
For GMT Office Hours Call +353-1-416-8900

Company on track to close transaction in the second half of 2021

ORANGE, Conn.--(BUSINESS WIRE)--AVANGRID, Inc. (NYSE: AGR), a leading clean energy company, confirmed today that the applicable waiting period under the Hart-Scott-Rodino Antitrust Improvements Act of 1976 ("HSR Act") has expired in relation to the proposed merger combination with PNM Resources (NYSE: PNM).


The company continues to pursue state and Federal regulatory approvals for the merger, including approvals from the Federal Energy Regulatory Commission, the Federal Communications Commission, the Federal Nuclear Regulatory Commission, the Committee on Foreign Investment in the US, as well as the New Mexico Public Regulation Commission and the Public Utility Commission of Texas. The agreement between AVANGRID and PNM Resources is also subject to approval by PNM Resources’ shareholders.

AVANGRID announced the strategic merger combination with PNM Resources in October 2020 in an all cash offer for PNM Resources’ shares at $50.30 per share, an $8.3 billion enterprise value transaction. The resulting entity would be one of the major clean energy companies in the US with ten regulated utilities in six states and the third largest renewables company with operations in 24 states.

About AVANGRID: AVANGRID, Inc. (NYSE: AGR) is a leading, sustainable energy company with approximately $36 billion in assets and operations in 24 U.S. states. With headquarters in Orange, Connecticut, AVANGRID has two primary lines of business: Avangrid Networks and Avangrid Renewables. Avangrid Networks owns eight electric and natural gas utilities, serving more than 3.3 million customers in New York and New England. Avangrid Renewables owns and operates a portfolio of renewable energy generation facilities across the United States. AVANGRID employs approximately 6,600 people. AVANGRID supports the U.N.’s Sustainable Development Goals and was named among the World’s Most Ethical Companies in 2019 and 2020 by the Ethisphere Institute. For more information, visit www.avangrid.com.


Contacts

Media:
Athena Hernandez, 203-231-2146 or This email address is being protected from spambots. You need JavaScript enabled to view it.

Investors:
Patricia Cosgel, 203-499-2624 or This email address is being protected from spambots. You need JavaScript enabled to view it.

Fourth Quarter Financial and Operational Highlights:

  • Net loss was $97 million, or $0.32 per common share, compared with a net loss of $222 million, or $0.73 per common share in the fourth quarter of 2019
  • Adjusted net loss1 was $176 million, or $0.58 per common share, compared with an adjusted net loss of $180 million, or $0.60 per common share in the prior-year quarter
  • Completed the sale of the Corporation's 28% working interest in the Shenzi Field in the deepwater Gulf of Mexico for net proceeds of $482 million, after closing adjustments
  • Oil and gas net production, excluding Libya, averaged 309,000 barrels of oil equivalent per day (boepd), down from 316,000 boepd in the fourth quarter of 2019; Bakken net production was 189,000 boepd, up 9% from 174,000 boepd in the prior-year quarter
  • Production from Phase 1 of the Liza Field development on the Stabroek Block, offshore Guyana, reached its nameplate capacity of 120,000 gross barrels of oil per day (bopd) in December
  • E&P capital and exploratory expenditures were $371 million, compared with $876 million in the prior-year quarter
  • Cash and cash equivalents, excluding Midstream, were $1.74 billion at December 31, 2020
  • Year-end proved reserves were 1,170 million barrels of oil equivalent (boe); organic reserve replacement for 2020 was 95% (158% excluding price revisions)

2021 Guidance:

  • Net production, excluding Libya, is forecast to be approximately 310,000 boepd
  • E&P capital and exploratory expenditures are expected to be $1.9 billion


NEW YORK--(BUSINESS WIRE)--Hess Corporation (NYSE: HES) today reported a net loss of $97 million, or $0.32 per common share, in the fourth quarter of 2020, compared with a net loss of $222 million, or $0.73 per common share, in the fourth quarter of 2019. On an adjusted basis, the Corporation reported a net loss of $176 million, or $0.58 per common share, in the fourth quarter of 2020, compared with an adjusted net loss of $180 million, or $0.60 per common share, in the prior-year quarter. Adjusted after-tax results reflect reductions in operating costs, exploration expense and depreciation, depletion and amortization expenses compared with the fourth quarter of 2019, which were largely offset by lower realized crude oil selling prices in the fourth quarter of 2020.

  1. “Adjusted net income (loss)” is a non-GAAP financial measure. The definition of this non-GAAP measure and a reconciliation to its nearest GAAP equivalent measure appears on pages 7 and 8.

     “We are successfully executing our strategy which has positioned our company to deliver industry leading cash flow growth over the next decade,” CEO John Hess said. “In 2021, our priorities remain to preserve cash, capability and the long term value of our assets, with more than 80% of our capital expenditures allocated to our high return investments in Guyana and the Bakken.”

     After-tax income (loss) by major operating activity was as follows:


Three Months Ended
December 31,
(unaudited)


Year Ended
December 31,
(unaudited)


2020


2019


2020


2019


(In millions, except per share amounts)

Net Income (Loss) Attributable to Hess Corporation


Exploration and Production

$

(39)


$

(64)


$

(2,841)


$

53


Midstream

62


33


230


144


Corporate, Interest and Other

(120)


(191)


(482)


(605)


Net income (loss) attributable to Hess Corporation

$

(97)


$

(222)


$

(3,093)


$

(408)


Net income (loss) per common share (diluted) (a)

$

(0.32)


$

(0.73)


$

(10.15)


$

(1.37)


Adjusted Net Income (Loss) Attributable to Hess Corporation


Exploration and Production

$

(118)


$

(124)


$

(643)


$

(10)


Midstream

62


49


230


160


Corporate, Interest and Other

(120)


(105)


(481)


(431)


Adjusted net income (loss) attributable to Hess Corporation

$

(176)


$

(180)


$

(894)


$

(281)


Adjusted net income (loss) per common share (diluted) (a)

$

(0.58)


$

(0.60)


$

(2.93)


$

(0.95)


Weighted average number of shares (diluted)

305.1


302.8


304.8


301.2


  1. Calculated as net income (loss) attributable to Hess Corporation less preferred stock dividends, divided by weighted average number of diluted shares.

Exploration and Production:

     E&P net loss was $39 million in the fourth quarter of 2020, compared with a net loss of $64 million in the fourth quarter of 2019. On an adjusted basis, E&P's fourth quarter 2020 net loss was $118 million, compared with an adjusted net loss of $124 million in the prior-year quarter. The Corporation’s average realized crude oil selling price, excluding the effect of hedging, was $39.45 per barrel in the fourth quarter of 2020, compared with $55.05 per barrel in the prior-year quarter, primarily reflecting a decrease in benchmark oil prices. Crude oil hedging activities improved after-tax results by $112 million in the fourth quarter of 2020, compared with losses of $2 million in the fourth quarter of 2019. Including hedging, the Corporation’s average realized crude oil selling price was $45.32 per barrel in the fourth quarter of 2020, compared with $54.90 per barrel in the year-ago quarter. The average realized natural gas liquids (NGL) selling price in the fourth quarter of 2020 was $15.80 per barrel, compared with $13.87 per barrel in the prior-year quarter, while the average realized natural gas selling price was $3.35 per mcf, compared with $3.48 per mcf in the fourth quarter of 2019.

     Net production, excluding Libya, was 309,000 boepd in the fourth quarter of 2020, compared with 316,000 boepd in the fourth quarter of 2019. Production from Libya resumed in the fourth quarter of 2020 and averaged a net rate of 12,000 boepd compared with 22,000 boepd in the fourth quarter of 2019.

     Cash operating costs, which include operating costs and expenses, production and severance taxes, and E&P general and administrative expenses, were $11.31 per boe in the fourth quarter of 2020, down 10% from $12.59 per boe in the prior-year quarter due to cost reduction initiatives and lower production and severance taxes. Cash operating costs in the fourth quarter of 2020 included workover and hurricane-related maintenance costs in the Gulf of Mexico.

Oil and Gas Reserves Estimates:

     Oil and gas proved reserves at December 31, 2020, which are subject to final review, were 1,170 million boe, compared with 1,197 million boe at December 31, 2019. Net proved reserve additions in 2020 of 117 million boe included net negative revisions of 79 million boe due to lower commodity prices. The net additions were primarily related to Guyana, which included the sanction of the Payara development in 2020. Excluding asset sales, the Corporation replaced 95% of its 2020 production (158% excluding price revisions) at a finding and development cost of approximately $15.25 per boe (approximately $9.10 per boe excluding price revisions).

Operational Highlights for the Fourth Quarter of 2020:

     Bakken (Onshore U.S.): Net production from the Bakken increased to 189,000 boepd from 174,000 boepd in the prior-year quarter. Net oil production was 97,000 bopd compared with 106,000 bopd in the fourth quarter of 2019, primarily due to decreased drilling and completion activity as a result of reducing the number of operated rigs from six to one in May 2020. Natural gas and NGL production increased from additional natural gas captured and processed, and approximately 6,000 boepd of additional volumes received under percentage of proceeds contracts resulting from lower prices. The Corporation operated one rig in the fourth quarter, drilling 7 wells, completing 8 wells, and bringing 12 new wells online.

     As previously announced, the Corporation chartered three very large crude carriers (VLCCs) to transport and store a total of 6.3 million barrels of Bakken crude oil produced during the second and third quarters of 2020 for sale in Asian markets. The first VLCC cargo of 2.1 million barrels was sold in September and cash proceeds were received in October. In December, the Corporation entered into agreements to sell the second and third VLCC cargos totaling 4.2 million barrels for delivery in the first quarter of 2021. The sales, including associated hedging gains and costs will be recognized, and cash proceeds will be received, in the first quarter of 2021.

     Gulf of Mexico (Offshore U.S.): Net production from the Gulf of Mexico was 32,000 boepd, compared with 70,000 boepd in the prior-year quarter reflecting downtime for hurricane-related maintenance in the quarter and lower production from the Shenzi Field, which was sold in November 2020 for net proceeds of $482 million. Net production from the Shenzi Field was 3,000 boepd in the fourth quarter of 2020 compared with 12,000 boepd in the fourth quarter of 2019.

      Guyana (Offshore): At the Stabroek Block (Hess – 30%), the Corporation’s net production from the Liza Field, which commenced in December 2019, averaged 26,000 bopd in the fourth quarter of 2020. The operator, Esso Exploration and Production Guyana Limited, completed the commissioning of the natural gas injection system allowing the Liza Destiny floating production, storage and offloading vessel (FPSO) to reach its nameplate capacity of 120,000 gross bopd in December. Phase 2 of the Liza Field development, which will utilize the Liza Unity FPSO with an expected capacity of 220,000 gross bopd, remains on target to achieve first oil by early 2022. The Payara development was sanctioned in September 2020 and will utilize the Prosperity FPSO with an expected capacity of 220,000 gross bopd, with first oil targeted in 2024.

     At the Kaieteur Block (Hess – 15%), the operator, Esso Exploration and Production Guyana Limited, completed drilling of the Tanager-1 exploration well, which did not encounter commercial quantities of hydrocarbons on a stand-alone basis. Fourth quarter results include a charge of $14 million in exploration expense for well costs incurred. At the Stabroek Block, the Hassa-1 well encountered approximately 50 feet of oil bearing reservoir in deeper geologic intervals, although the well did not encounter oil in the primary target areas. Well data will be incorporated into future exploration and development planning.

     After drilling the Tanager-1 well, the Stena Carron drillship completed appraisal work at the Redtail-1 well before moving to the Canje Block, offshore Guyana. After drilling the Hassa-1 well, the Noble Don Taylor drillship began development drilling at Liza Phase 2. The Noble Bob Douglas and the Noble Tom Madden drillships are currently drilling and completing Liza Phase 2 development wells.

     Malaysia and JDA (Offshore): Net production at the North Malay Basin and JDA was 56,000 boepd, compared with 64,000 boepd in the prior-year quarter, reflecting COVID-19 impacts on economic activity in Malaysia and Thailand which reduced natural gas nominations.

Midstream:

     The Midstream segment had net income of $62 million in the fourth quarter of 2020, compared with net income of $33 million in the prior-year quarter. On an adjusted basis, fourth quarter 2019 net income was $49 million. The improved fourth quarter 2020 results were primarily driven by higher volumes and tariff rates, and lower maintenance expenses.

Corporate, Interest and Other:

     After-tax expense for Corporate, Interest and Other was $120 million in the fourth quarter of 2020, compared with $191 million in the fourth quarter of 2019. On an adjusted basis, after-tax expense for Corporate, Interest and Other was $105 million in the fourth quarter of 2019. Interest expense increased $17 million compared with the prior-year quarter due to interest on the Corporation's $1.0 billion three year term loan entered into in March 2020 and a decrease in capitalized interest.

Capital and Exploratory Expenditures:

     E&P capital and exploratory expenditures were $371 million in the fourth quarter of 2020, down from $876 million in the prior-year quarter. The decrease is primarily driven by a reduced rig count in the Bakken and lower activity in the Gulf of Mexico. Midstream capital expenditures were $51 million in the fourth quarter of 2020, down from $108 million in the prior-year quarter.

Liquidity:

     Excluding the Midstream segment, Hess Corporation had cash and cash equivalents of $1.74 billion and debt and finance lease obligations totaling $6.6 billion at December 31, 2020. The Corporation’s debt to capitalization ratio as defined in its debt covenants was 47.5% at December 31, 2020 and 39.6% at December 31, 2019. Net proceeds of $482 million from the sale of the Corporation's interest in the Shenzi Field were received in the fourth quarter. Realized settlements on closed crude oil put option contracts for the full year of 2020 totaled approximately $875 million.

     The Midstream segment had cash and cash equivalents of $4 million and total debt of $1.9 billion at December 31, 2020.

     Net cash provided by operating activities was $486 million in the fourth quarter of 2020, up from $286 million in the fourth quarter of 2019. Net cash provided by operating activities before changes in operating assets and liabilities2 was $532 million in the fourth quarter of 2020, compared with $520 million in the prior-year quarter. Changes in operating assets and liabilities decreased cash flow from operating activities by $46 million during the fourth quarter of 2020 and by $234 million in the fourth quarter of 2019. Proceeds from the September sale of the first VLCC cargo of 2.1 million barrels of oil were received in October and are a component of changes in operating assets and liabilities for the fourth quarter. Proceeds from the sale of the second and third VLCC cargos totaling 4.2 million barrels of oil will be received in the first quarter of 2021.

     For calendar year 2021, the Corporation has purchased WTI put options with an average monthly floor price of $45 per barrel for 100,000 bopd, and Brent put options with an average monthly floor price of $50 per barrel for 20,000 bopd.

Items Affecting Comparability of Earnings Between Periods:

     The following table reflects the total after-tax income (expense) of items affecting comparability of earnings between periods:


Three Months Ended
December 31,
(unaudited)


Year Ended
December 31,
(unaudited)


2020


2019


2020


2019


(In millions)

Exploration and Production

$

79


$

60


$

(2,198)


$

63


Midstream


(16)


(16)


Corporate, Interest and Other


(86)


(1)


(174)


Total items affecting comparability of earnings between periods

$

79


$

(42)


$

(2,199)


$

(127)


     Fourth quarter 2020: Fourth quarter results included a pre-tax gain of $79 million ($79 million after income taxes) associated with the sale of the Corporation's 28% working interest in the Shenzi Field in the deepwater Gulf of Mexico.

     Fourth Quarter 2019: E&P results included a noncash income tax benefit of $60 million resulting from the reversal of a valuation allowance against net deferred tax assets in Guyana upon achieving first production from the Liza Field. Midstream results included a pre-tax charge of $30 million ($16 million after noncontrolling interests) for nonrecurring transaction related costs for HESM’s acquisition of HIP and corporate restructuring. Corporate, Interest and Other results included an allocation of noncash income tax expense of $86 million that was previously a component of accumulated other comprehensive income related to the Corporation's 2019 crude oil hedge contracts.

2.

Net cash provided by (used in) operating activities before changes in operating assets and liabilities” is a non-GAAP financial measure. The definition of this non-GAAP measure and a reconciliation to its nearest GAAP equivalent measure appears on pages 7 and 8.

Reconciliation of U.S. GAAP to Non-GAAP Measures:

     The following table reconciles reported net income (loss) attributable to Hess Corporation and adjusted net income (loss):


Three Months Ended
December 31,
(unaudited)


Year Ended
December 31,
(unaudited)


2020


2019


2020


2019


(In millions)

Net income (loss) attributable to Hess Corporation

$

(97)


$

(222)


$

(3,093)


$

(408)


Less: Total items affecting comparability of earnings between periods

79


(42)


(2,199)


(127)


Adjusted net income (loss) attributable to Hess Corporation

$

(176)


$

(180)


$

(894)


$

(281)


     The following table reconciles reported net cash provided by (used in) operating activities from net cash provided by (used in) operating activities before changes in operating assets and liabilities:


Three Months Ended
December 31,
(unaudited)


Year Ended
December 31,
(unaudited)


2020


2019


2020


2019


(In millions)

Net cash provided by (used in) operating activities before changes in operating assets and liabilities

$

532


$

520


$

1,803


$

2,237


Changes in operating assets and liabilities

(46)


(234)


(470)


(595)


Net cash provided by (used in) operating activities

$

486


$

286


$

1,333


$

1,642


Hess Corporation will review fourth quarter financial and operating results and other matters on a webcast at 10 a.m. today (EDT). For details about the event, refer to the Investor Relations section of our website at www.hess.com.

Hess Corporation is a leading global independent energy company engaged in the exploration and production of crude oil and natural gas. More information on Hess Corporation is available at www.hess.com.

Forward-looking Statements

This release contains “forward-looking statements” within the meaning of Section 27A of the Securities Act of 1933, as amended, and Section 21E of the Securities Exchange Act of 1934, as amended. Words such as “anticipate,” “estimate,” “expect,” “forecast,” “guidance,” “could,” “may,” “should,” “would,” “believe,” “intend,” “project,” “plan,” “predict,” “will,” “target” and similar expressions identify forward-looking statements, which are not historical in nature. Our forward-looking statements may include, without limitation: our future financial and operational results; our business strategy; estimates of our crude oil and natural gas reserves and levels of production; benchmark prices of crude oil, NGLs and natural gas and our associated realized price differentials; our projected budget and capital and exploratory expenditures; expected timing and completion of our development projects; and future economic and market conditions in the oil and gas industry.

Forward-looking statements are based on our current understanding, assessments, estimates and projections of relevant factors and reasonable assumptions about the future. Forward-looking statements are subject to certain known and unknown risks and uncertainties that could cause actual results to differ materially from our historical experience and our current projections or expectations of future results expressed or implied by these forward-looking statements. The following important factors could cause actual results to differ materially from those in our forward-looking statements: fluctuations in market prices of crude oil, NGLs and natural gas and competition in the oil and gas exploration and production industry, including as a result of the global COVID-19 pandemic; reduced demand for our products, including due to the global COVID-19 pandemic or the outbreak of any other public health threat, or due to the impact of competing or alternative energy products and political conditions and events; potential failures or delays in increasing oil and gas reserves, including as a result of unsuccessful exploration activity, drilling risks and unforeseen reservoir conditions, and in achieving expected production levels; changes in tax, property, contract and other laws, regulations and governmental actions applicable to our business, including legislative and regulatory initiatives regarding environmental concerns, such as measures to limit greenhouse gas emissions and flaring as well as fracking bans; disruption or interruption of our operations due to catastrophic events, such as accidents, severe weather, geological events, shortages of skilled labor, cyber-attacks or health measures related to the COVID-19 pandemic; the ability of our contractual counterparties to satisfy their obligations to us, including the operation of joint ventures under which we may not control; unexpected changes in technical requirements for constructing, modifying or operating exploration and production facilities and/or the inability to timely obtain or maintain necessary permits; availability and costs of employees and other personnel, drilling rigs, equipment, supplies and other required services; any limitations on our access to capital or increase in our cost of capital, including as a result of weakness in the oil and gas industry or negative outcomes within commodity and financial markets; liability resulting from litigation, including heightened risks associated with being a general partner of Hess Midstream LP; and other factors described in Item 1A—Risk Factors in our Annual Report on Form 10-K and any additional risks described in our other filings with the Securities and Exchange Commission (SEC).

As and when made, we believe that our forward-looking statements are reasonable. However, given these risks and uncertainties, caution should be taken not to place undue reliance on any such forward-looking statements since such statements speak only as of the date when made and there can be no assurance that such forward-looking statements will occur and actual results may differ materially from those contained in any forward-looking statement we make. Except as required by law, we undertake no obligation to publicly update or revise any forward-looking statements, whether because of new information, future events or otherwise.

Non-GAAP financial measures

The Corporation has used non-GAAP financial measures in this earnings release. “Adjusted net income (loss)” presented in this release is defined as reported net income (loss) attributable to Hess Corporation excluding items identified as affecting comparability of earnings between periods. “Net cash provided by (used in) operating activities before changes in operating assets and liabilities” presented in this release is defined as Net cash provided by (used in) operating activities excluding changes in operating assets and liabilities. Management uses adjusted net income (loss) to evaluate the Corporation’s operating performance and believes that investors’ understanding of our performance is enhanced by disclosing this measure, which excludes certain items that management believes are not directly related to ongoing operations and are not indicative of future business trends and operations. Management believes that net cash provided by (used in) operating activities before changes in operating assets and liabilities demonstrates the Corporation’s ability to internally fund capital expenditures, pay dividends and service debt. These measures are not, and should not be viewed as, a substitute for U.S. GAAP net income (loss) or net cash provided by (used in) operating activities. A reconciliation of reported net income (loss) attributable to Hess Corporation (U.S. GAAP) to adjusted net income (loss), and a reconciliation of net cash provided by (used in) operating activities (U.S. GAAP) to net cash provided by (used in) operating activities before changes in operating assets and liabilities are provided in the release.

Cautionary Note to Investors

We use certain terms in this release relating to resources other than proved reserves, such as unproved reserves or resources.


Contacts

For Hess Corporation

Investors:
Jay Wilson
(212) 536-8940

Media:
Lorrie Hecker
(212) 536-8250

Jamie Tully
Sard Verbinnen & Co
(312) 895-4700


Read full story here

SAN FRANCISCO--(BUSINESS WIRE)--Generate, one of the leading global operators of diversified sustainable infrastructure, today announced the appointment of two new members to its Board of Directors – experienced sustainability and energy executives Kristin Groos Richmond and Susan Gonzalez.


“I am pleased to welcome Kristin and Susan to our board. Together they bring extensive experience in leading and advising transformational companies in sustainability, infrastructure and finance,” said Scott Jacobs, chief executive officer and co-founder of Generate. “Generate is entering a new phase of growth as we scale up our efforts to combat the existential threat of climate change and rebuild the world with sustainable infrastructure. Their contributions and guidance will help us grow into a more global and diversified company and continue on our mission to prove sustainability wins.”

Kristin Richmond is co-founder and chief executive officer of Revolution Foods, a leading provider of prepared meals and wellness for students, families and communities across the United States. Prior to founding Revolution Foods, Richmond co-founded the Kenya Community Center for Learning and worked in investment banking. She holds a B.S. from Boston College and an M.B.A. from U.C. Berkeley. She is a Pahara-Aspen Fellow and a Young Global Leader of the World Economic Forum.

Susan Gonzalez brings decades of experience in leading transformative energy companies. From 1998 to 2018, Susan was General Counsel, Managing Board member and Secretary of InterGen N.V., a global independent power producer. Prior to InterGen, she served as counsel for Stratus Computer, Major Australia Timber, and United Technologies Corp. She holds a B.A. from the University of Michigan, and a J.D. from Suffolk University Law School.

The new board appointments are effective January 2021.

“Generate has an opportunity to create a massive impact in infrastructure and clean energy,” Richmond said. “I am honored to join Generate’s board and am looking forward to working with the leadership team and my fellow board members to continue expanding the company’s reach and growth in sustainable energy and ESG.”

“I’m thrilled to be joining Generate’s board at a time when sustainable infrastructure growth is critically important,” said Gonzalez. “Generate is truly a company driving systemic change and I look forward to helping the company achieve its vision.”

Over the last six years, Generate has built more than 2,000 sustainable infrastructure assets across the energy, waste, water and transport markets, establishing market leadership in areas including battery storage; community, commercial and industrial solar; energy efficiency; electric vehicles; fuel cells; wastewater treatment; distributed desalination; and organic waste management.

“We are delighted to welcome Kristin and Susan to Generate’s board of directors,” said Richard Kauffman, chair of the board of Generate, chairman of the New York State Energy Research and Development Authority (NYSERDA) and former New York State energy czar. “Their deep expertise in operations, regulatory affairs, energy and sustainability are an excellent fit for our board and will support Generate through its next phase growth as we see unprecedented demand for sustainable infrastructure.”

About Generate

Generate Capital, Inc. is a leading sustainable infrastructure company driving the infrastructure revolution. Generate builds, owns, operates and finances solutions for clean energy, water, waste and transportation. Founded in 2014, Generate partners with over 35 technology and project developers and owns and operates more than 2,000 assets globally. Generate is the one-stop shop offering pioneers of the infrastructure revolution tailored funding and support needed to get projects built. Our Infrastructure-as-a-Service™ model delivers affordable, reliable and sustainable resources to over 1,000 customers, companies, communities, school districts and universities. Together, we are rebuilding the world. For more information, please visit www.generatecapital.com.


Contacts

Emily Chasan
(415)-480-2914
This email address is being protected from spambots. You need JavaScript enabled to view it.

DUBLIN--(BUSINESS WIRE)--The "Denmark Midstream Oil and Gas Industry Outlook to 2025" report has been added to ResearchAndMarkets.com's offering.


Denmark Midstream Oil and Gas Industry Outlook to 2025 - Market Outlook for Liquids Storage, Pipelines, Underground Gas Storage and Gas Processing is a comprehensive report on midstream oil and gas industry in Denmark.

The report also provides details such as name, type, operational status and operator for all active and planned (new build) liquids storage terminals major trunk pipelines, underground gas storage sites and gas processing plants in Denmark till 2025. Further, the report also offers recent developments and latest contracts awarded in the country's midstream sector, wherever available.

Scope

  • Updated information related to all active, planned and announced oil storage terminals, trunk pipelines, underground gas storage and gas processing plants in the country, including operator and equity details
  • Key mergers and acquisitions and asset transactions in the country's midstream oil and gas industry, where available
  • Latest developments, financial deals and awarded contracts related to midstream oil and gas industry in the country, wherever available

Reasons to Buy

  • Gain strong understanding of the country's midstream oil and gas industry
  • Facilitate decision making on the basis of strong historical and outlook of capacity/length data
  • Assess your competitor's major oil storage terminals, major trunk pipelines and gas processing plants in the country
  • Analyze the latest developments and awarded contracts related to the country's midstream oil and gas industry

Key Topics Covered:

1. Table of Contents

1.1. List of Tables

1.2. List of Figures

2. Introduction

2.1. What is This Report About?

2.2. Market Definition

3. Denmark Oil Storage Industry

3.1. Denmark Oil Storage Industry, Key Data

3.2. Denmark Oil Storage Industry, Overview

3.3. Denmark Oil Storage Industry, Storage Operations

3.3.1. Denmark Oil Storage Industry, Total Storage Capacity

3.3.2. Denmark Oil Storage Industry, Storage Capacity by Major Companies

3.3.3. Denmark Oil Storage Industry, Storage Capacity Share by Area

3.4. Denmark Oil Storage Industry, Storage Capacity by Terminal

3.5. Denmark Oil Storage Industry, Asset Details

3.5.1. Denmark Oil Storage Industry, Active Asset Details

4. Denmark Oil and Gas Pipelines Industry

4.1. Denmark Oil Pipelines

4.1.1. Denmark Oil Pipelines, Key Data

4.2. Denmark Oil Pipelines, Overview

4.3. Denmark Oil and Gas Pipelines Industry, Crude Oil Pipeline Length by Major Companies

4.4. Denmark Oil and Gas Pipelines Industry, Crude Oil Pipelines

4.5. Denmark Oil and Gas Pipelines Industry, Oil Pipelines Asset Details

4.5.1. Denmark Oil and Gas Pipelines Industry, Oil Pipelines Active Asset Details

4.5.2. Denmark Oil and Gas Pipelines Industry, Oil Pipelines Planned Asset Details

4.6. Denmark Gas Pipelines, Key Data

4.6.1. Denmark Gas Pipelines, Overview

4.7. Denmark Oil and Gas Pipelines Industry, Natural Gas Pipeline Length by Major Companies

4.8. Denmark Oil and Gas Pipelines Industry, Natural Gas Pipelines

4.9. Denmark Oil and Gas Pipelines Industry, Gas Pipelines Asset Details

4.9.1. Denmark Oil and Gas Pipelines Industry, Gas Pipelines Active Asset Details

4.9.2. Denmark Oil and Gas Pipelines Industry, Gas Pipelines Planned Asset Details

5. Denmark Underground Gas Storage Industry

5.1. Denmark Underground Gas Storage Industry, Key Data

5.2. Denmark Underground Gas Storage Industry, Overview

5.3. Denmark Underground Gas Storage Industry, Gas Storage Capacity by Company

5.4. Denmark Underground Gas Storage Industry, Storage Capacity by Area

5.5. Denmark Underground Gas Storage Industry, Storage Capacity by Site

5.5.1. Denmark Underground Gas Storage Industry, Storage Capacity by Active Sites

5.6. Denmark Underground Gas Storage Industry, Asset Details

5.6.1. Denmark Underground Gas Storage Industry, Active Asset Details

6. Denmark Gas Processing Industry

6.1. Denmark Gas Processing Industry, Overview

6.2. Denmark Gas Processing Industry, Gas Processing Capacity by Company

6.3. Denmark Gas Processing Industry, Processing Plant Number by Facility Type

6.4. Denmark, Gas Processing Industry, Capacity Contribution of Various Provinces

6.5. Denmark Gas Processing Industry, Gas Processing Capacity

6.6. Denmark Gas Processing Industry, Asset Details

6.6.1. Denmark Gas Processing Industry, Active Asset Details

7. Recent Contracts

7.1. Detailed Contract Summary

7.1.1. Awarded Contracts

9. Recent Developments

8.1. Other Significant Developments

8.2. New Contracts Announcements

9. Appendix

For more information about this report visit https://www.researchandmarkets.com/r/uyuhln


Contacts

ResearchAndMarkets.com
Laura Wood, Senior Press Manager
This email address is being protected from spambots. You need JavaScript enabled to view it.
For E.S.T Office Hours Call 1-917-300-0470
For U.S./CAN Toll Free Call 1-800-526-8630
For GMT Office Hours Call +353-1-416-8900

3.7 MW of combined capacity will generate enough electricity to supply over 600 homes annually

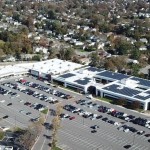
JERICHO, N.Y.--(BUSINESS WIRE)--Kimco Realty Corp. (NYSE:KIM), one of North America’s largest publicly traded owners and operators of open-air, grocery-anchored shopping centers and mixed-use assets, today announced that it has initiated five new solar projects. Four of the projects are installed at Kimco properties in the New York metropolitan region, including the company’s new headquarters in Jericho, Long Island as well as Greenridge Plaza, Forest Avenue Shopping Center, and Richmond Shopping Center, all on Staten Island. The fifth is in Massachusetts at Festival at Hyannis Shopping Center. The projects will result in 3.7 MW of solar generating an estimated 4.64 million kWh annually, which is enough to power more than 600 homes per year.


The solar project at Kimco’s Jericho Atrium headquarters, on the site of its Jericho Commons Shopping Center, is part of Long Island’s Commercial Solar Feed-in Tariff program, and will supply clean energy to the local utility, PSEG Long Island. The Staten Island projects are part of the New York community solar program. These solar arrays will provide energy to community solar subscribers in the ConEdison utility area, giving residents the opportunity to purchase clean power.

“These new installations will double the size of rooftop solar within our portfolio while adding clean energy into the local power mix in the communities these properties serve,” said Conor Flynn, CEO of Kimco Realty. “We pioneered retail property rooftop solar with our first installation in 2009, and we continue to explore ways to responsibly expand this program that will benefit our shareholders and the communities in which we operate.”

All five projects were facilitated through Kimco’s partnership with Black Bear Energy and were developed beginning in 2020 by Green Street Power Partners.

Kimco’s solar program is just one of the ways it has worked to minimize the company’s environmental impact. As a result of Kimco’s continued efforts in this area, along with its leading-edge social impact and governance initiatives, the company was recently named to the Dow Jones Sustainability World Index, where it is the only North American retail real estate owner listed. The DJSI World Index is comprised of corporate leaders in global sustainability, with companies listed on the Index representing the top 10 percent of the largest 2,500 companies in the S&P Global Broad Market Index based on long-term economic and environmental, social and governance (ESG) factors. Kimco has been the sole retail real estate owner listed on the DJSI North America Index for the last six years, and the company also is a constituent of the FTSE4Good Index Series, designed to measure the performance of companies demonstrating strong ESG practices.

About Kimco

Kimco Realty Corp. (NYSE: KIM) is a real estate investment trust (REIT) headquartered in Jericho, N.Y., that is one of North America’s largest publicly traded owners and operators of open-air shopping centers. As of September 30, 2020, the company owned interests in 400 U.S. shopping centers and mixed-use assets comprising 70 million square feet of leasable space primarily concentrated in the top major metropolitan markets. Publicly traded on the NYSE since 1991 and included in the S&P 500 Index, the company has specialized in shopping center acquisitions, development, and management for more than 60 years. For further information, please visit www.kimcorealty.com, the company’s blog at kimcorealty.com/blog, or follow Kimco on Twitter at www.twitter.com/kimcorealty.

The company announces material information to its investors using the company’s investor relations website (investors.kimcorealty.com), SEC filings, press releases, public conference calls, and webcasts. The company also uses social media to communicate with its investors and the public, and the information the company posts on social media may be deemed material information. Therefore, the company encourages investors, the media, and others interested in the company to review the information that it posts on the company’s social media channels, including Facebook (www.facebook.com/kimcorealty), Twitter (www.twitter.com/kimcorealty), YouTube (www.youtube.com/kimcorealty) and LinkedIn (www.linkedin.com/company/kimco-realty-corporation). The list of social media channels that the company uses may be updated on its investor relations website from time to time.


Contacts

Jennifer Maisch
Vice President, Marketing & Communications
Kimco Realty Corporation
516-869-7224
This email address is being protected from spambots. You need JavaScript enabled to view it.

HOUSTON--(BUSINESS WIRE)--Cheniere Energy Partners, L.P. (“Cheniere Partners”) (NYSE American: CQP) today declared (i) a cash distribution of $0.655 ($2.62 annualized) per common unit to unitholders of record as of February 8, 2021, and (ii) the related distribution to its general partner. These distributions are payable on February 12, 2021.

This press release serves as qualified notice to nominees as provided for under Treasury Regulation Section 1.1446-4(b)(4) and (d). Please note that 100 percent of Cheniere Partners’ distributions to foreign investors are attributable to income that is effectively connected with a United States trade or business. Accordingly, all of Cheniere Partners’ distributions to foreign investors are subject to federal income tax withholding at the highest applicable effective tax rate. Nominees are treated as withholding agents responsible for withholding distributions received by them on behalf of foreign investors.

About Cheniere Partners

Cheniere Partners is developing, constructing and operating natural gas liquefaction facilities at the Sabine Pass LNG terminal located in Cameron Parish, Louisiana, on the Sabine-Neches Waterway less than four miles from the Gulf Coast. Cheniere Partners is currently operating five natural gas liquefaction Trains and is constructing one additional Train for a total production capacity of approximately 30 mtpa of LNG at the Sabine Pass terminal. The Sabine Pass LNG terminal has operational regasification facilities that include five LNG storage tanks, two marine berths and vaporizers and an additional marine berth that is under construction. Cheniere Partners also owns the Creole Trail Pipeline, a 94-mile pipeline that interconnects the Sabine Pass LNG terminal with a number of large interstate pipelines.

For additional information, please refer to the Cheniere Partners website at www.cheniere.com and Quarterly Report on Form 10-Q for the quarter ended September 30, 2020, filed with the Securities and Exchange Commission.

Forward-Looking Statements

This press release contains certain statements that may include “forward-looking statements.” All statements, other than statements of historical or present facts or conditions, included herein are “forward-looking statements.” Included among “forward-looking statements” are, among other things, (i) statements regarding Cheniere Partners’ financial and operational guidance, business strategy, plans and objectives, including the development, construction and operation of liquefaction facilities, (ii) statements regarding expectations regarding regulatory authorizations and approvals, (iii) statements expressing beliefs and expectations regarding the development of Cheniere Partners’ LNG terminal and liquefaction business, (iv) statements regarding the business operations and prospects of third parties, (v) statements regarding potential financing arrangements, (vi) statements regarding future discussions and entry into contracts, and (vii) statements regarding the COVID-19 pandemic and its impact on our business and operating results. Although Cheniere Partners believes that the expectations reflected in these forward-looking statements are reasonable, they do involve assumptions, risks and uncertainties, and these expectations may prove to be incorrect. Cheniere Partners’ actual results could differ materially from those anticipated in these forward-looking statements as a result of a variety of factors, including those discussed in Cheniere Partners’ periodic reports that are filed with and available from the Securities and Exchange Commission. You should not place undue reliance on these forward-looking statements, which speak only as of the date of this press release. Other than as required under the securities laws, Cheniere Partners does not assume a duty to update these forward-looking statements.


Contacts

Cheniere Energy Partners, L.P.
Investors
Randy Bhatia 713-375-5479
Megan Light 713-375-5492
or
Media Relations
Eben Burnham-Snyder 713-375-5764
Jenna Palfrey 713-375-5491

DUBLIN--(BUSINESS WIRE)--The "Global Oil and Gas Discoveries Quaterly Review, Q2 2020 - China and Brazil Led Discoveries Count in the Quarter" report has been added to ResearchAndMarkets.com's offering.


Globally, a total of 23 oil and gas discoveries were made during Q2 2020. Of these, 15 are oil discoveries and eight are gas discoveries. North America, Former Soviet Union, Asia, and South America lead with four discoveries each in the quarter. Among countries, China and Brazil, had the highest number of discoveries with three each in Q2 2020.

Scope

  • Count of oil and gas discoveries by key countries in Q2 2020 vis-a-vis Q1 2020
  • Count of oil and gas discoveries by key countries in H1 2020
  • Count of oil and gas discoveries by key operators in Q2 2020 vis-a-vis Q1 2020
  • Count of oil and gas discoveries by key operators in H1 2020
  • Count of oil and gas discoveries by well terrain in Q2 2020 vis-a-vis Q1 2020
  • Count of oil and gas discoveries by well terrain in H1 2020
  • Count of oil and gas discoveries by resource type in Q2 2020 vis-a-vis Q1 2020
  • Count of oil and gas discoveries by resource type in H1 2020
  • Select details about oil and gas discoveries in Q2 2020

Reasons to Buy

  • Obtain most up to date information available on the global oil and gas discoveries
  • Facilitate decision making on the basis of strong discoveries data
  • Develop business strategies with the help of specific insights on oil and gas discoveries data
  • Assess your competitor's oil and gas discoveries

Q2 2020 Global Oil and Gas Discoveries Review

Global Oil and Gas Discoveries by Key Countries

  • Count of Oil and Gas Discoveries by Key Countries in Q2 2020 vis-a-vis Q1 2020
  • Count of Oil and Gas Discoveries by Key Countries in2020

Global Oil and Gas Discoveries by Key Operators

  • Count of Oil and Gas Discoveries by Key Operators in Q2 2020 vis-a-vis Q1 2020
  • Count of Oil and Gas Discoveries by Key Operators in 2020

Global Oil and Gas Discoveries by Well Terrain

  • Count of Oil and Gas Discoveries by Well Terrain in Q2 2020 vis-a-vis Q1 2020
  • Count of Oil and Gas Discoveries by Well Terrain in 2020

Global Oil and Gas Discoveries by Resource Type

  • Count of Oil and Gas Discoveries by Resource Type in Q2 2020 vis-a-vis Q1 2020
  • Count of Oil and Gas Discoveries by Resource Type in 2020

Global Oil and Gas Discoveries in Q2 2020

Appendix

For more information about this report visit https://www.researchandmarkets.com/r/2y0uru


Contacts

ResearchAndMarkets.com
Laura Wood, Senior Press Manager
This email address is being protected from spambots. You need JavaScript enabled to view it.
For E.S.T Office Hours Call 1-917-300-0470
For U.S./CAN Toll Free Call 1-800-526-8630
For GMT Office Hours Call +353-1-416-8900

THIS NEWS RELEASE IS INTENDED FOR DISTRIBUTION IN CANADA ONLY AND IS NOT FOR DISTRIBUTION, DIRECTLY OR INDIRECTLY, IN OR INTO THE UNITED STATES (INCLUDING ITS TERRITORIES AND POSSESSIONS, ANY STATE OF THE UNITED STATES OR THE DISTRICT OF COLUMBIA), OR ANY JURISDICTION WHERE TO DO SO WOULD CONSTITUTE A VIOLATION OF THE RELEVANT LAWS OF SUCH JURISDICTION.

VANCOUVER, British Columbia--(BUSINESS WIRE)--$GRN #RNG--Greenlane Renewables Inc. (“Greenlane”) (TSXV: GRN / FSE: 52G) is pleased to announce that it has closed its previously announced upsized bought deal offering (the “Offering”) of 12,190,000 common shares (“Shares”), which included 1,590,000 additional shares issued pursuant to the underwriters’ full exercise of their over-allotment option, at a price of $2.17 per share for total gross proceeds of approximately $26.5 million.


TD Securities Inc. acted as lead underwriter and sole bookrunner on behalf of itself and a syndicate of underwriters including Raymond James Ltd., Haywood Securities Inc., Canaccord Genuity Corp., Beacon Securities Limited, and Paradigm Capital Inc. in connection with the Offering.

The Company will use the net proceeds of the Offering for development of and investments in new renewable natural gas projects, for strategic growth initiatives, and for general corporate purposes (including the Company’s ongoing business initiatives) and working capital.

The Shares were issued pursuant to a prospectus supplement that has been filed with the securities regulatory authorities in each of the provinces of British Columbia, Alberta, Manitoba and Ontario under the Company’s base shelf prospectus dated July 31, 2019 and may also be offered by way of private placement into the United States pursuant to Rule 144A. No securities regulatory authority has either approved or disapproved of the contents of this news release.

The securities offered have not been, and will not be, registered under the United States Securities Act of 1933, as amended, or any state securities laws, and may not be offered, sold or delivered, directly or indirectly, in the United States, its possessions and other areas subject to its jurisdiction or to, or for the account or for the benefit of a U.S. person, unless an exemption from registration is available. This news release is for information purposes only and does not constitute an offer to sell or a solicitation of an offer to buy any securities of the Company in any jurisdiction.

About Greenlane Renewables

Greenlane Renewables is a leading global provider of biogas upgrading systems that are helping decarbonize natural gas. Our systems produce clean, low-carbon renewable natural gas from organic waste sources including landfills, wastewater treatment plants, dairy farms, and food waste, suitable for either injection into the natural gas grid or for direct use as vehicle fuel. Greenlane is the only biogas upgrading company offering the three main technologies: water wash, pressure swing adsorption, and membrane separation. With over 30 years industry experience, patented proprietary technology, and over 110 biogas upgrading systems supplied into 18 countries worldwide, including the world’s largest biogas upgrading facility, Greenlane is inspired by a commitment to helping waste producers, gas utilities or project developers turn a low-value product into a high-value low-carbon renewable resource. For further information, please visit www.greenlanerenewables.com.

FORWARD LOOKING INFORMATION – This news release contains “forward-looking information” within the meaning of applicable securities laws. All statements contained herein that are not historical in nature contain forward-looking information. Forward-looking information can be identified by words or phrases such as “may”, “expect”, “likely”, “should”, “would”, “plan”, “anticipate”, “intend”, “potential”, “proposed”, “estimate”, “believe” or the negative of these terms, or other similar words, expressions and grammatical variations thereof, or statements that certain events or conditions "may" or "will" happen. The forward-looking information contained in this press release includes statements regarding the use of proceeds of the Offering for which readers are referred to the Company’s prospectus supplement for a full description of the uses of proceeds and associated risk factors. The forward-looking information contained herein is made as of the date of this press release and is based on assumptions management believed to be reasonable at the time such statements were made, including management's perceptions of future growth, results of operations, operational matters, historical trends, current conditions and expected future developments, as well as other considerations that are believed to be appropriate in the circumstances. While management considers these assumptions to be reasonable based on information currently available to management, there is no assurance that such expectations will prove to be correct. By their nature, forward-looking information is subject to inherent risks and uncertainties that may be general or specific and which give rise to the possibility that expectations, forecasts, predictions, projections or conclusions will not prove to be accurate, that assumptions may not be correct and that objectives, strategic goals and priorities will not be achieved. A variety of factors, including known and unknown risks, many of which are beyond the Company’s control, could cause actual results to differ materially from the forward-looking information in this press release. Such factors include, without limitation, risks identified in the Company's annual information form, base shelf prospectus and prospectus supplement, which have been filed under the Company's SEDAR profile at www.sedar.com. Readers are cautioned not to put undue reliance on forward-looking information. The Company undertakes no obligation to update or revise any forward-looking information, whether as a result of new information, future events or otherwise, except as required by applicable law. Forward-looking statements contained in this news release are expressly qualified by this cautionary statement.


Contacts

Incite Capital Markets
Eric Negraeff / Darren Seed
Ph: 604.493.2004
Brad Douville, President & CEO, Greenlane Renewables
Email: This email address is being protected from spambots. You need JavaScript enabled to view it.


LONDON--(BUSINESS WIRE)--#GlobalSubmarinePowerCableMarket--Global submarine power cable market will grow by USD 1.08 Billion During 2020-2024.

Amid the COVID-19 pandemic, the global submarine power cable market registered a YOY growth of 1.74% in 2020 and the market is estimated to expand at a CAGR of over 4% during the forecast period. The report offers a detailed analysis of the impact of the COVID-19 pandemic on the market in optimistic, probable, and pessimistic forecast scenarios.

For the Right Perspective & Competitive Insights – Get a Free Sample Report Delivered Instantly

The 120-page report analyzes the submarine power cable market by end-user (offshore wind, island connection and inter-country, offshore oil, and others) and geography (Europe, APAC, North America, MEA, and South America). The report offers competitive intelligence about market leaders, key industry opportunities, trends, and threats impacting the growth of the market. Also, the report includes information on marketing, brand, strategy and market development, sales, and supply functions. Download Our Free Sample Report to Know More

The submarine power cable market is driven by growing wind power generation capacity. In addition, rising global energy demand is anticipated to boost the growth of the submarine power cable market.

The growing emphasis on the installation of clean and sustainable energy sources has led to an increase in the number of wind power plants worldwide. Besides, factors such as government policies for the generation of clean energy, decreasing cost of wind power generation, and technological advances of wind turbine components have further fueled the growth of global onshore and offshore wind power generation capacity. With the rising number of offshore wind power farms, the demand for submarine power cables will increase during the forecast period.

Buy 1 Technavio report and get the second for 50% off. Buy 2 Technavio reports and get the third for free.

View market snapshot before purchasing

Major Five Submarine Power Cable Companies:

ABB Ltd.

ABB Ltd. operates its business through segments such as Electrification, Industrial Automation, Motion, Robotics & Discrete Automation, and Corporate and Other. The company provides submarine power cables for offshore wind farms and others.

Anixter International Inc.

Anixter International Inc. operates its business through segments such as Network & Security Solutions, Electrical & Electronic Solutions, and Utility Power Solutions. The company offers marine power cables that are used for wiring in ships, and in mobile and fixed offshore units such as drilling rigs and oil platforms.

Belden Inc.

Belden Inc. operates its business through segments such as Enterprise Solutions and Industrial Solutions. The company offers MarineTuff Offshore and Marine Cables for signal transmission and extended offshore applications.

Fujikura Ltd.

Fujikura Ltd. operates its business through segments such as Power & Telecommunication Systems Company, Electronics Business Company, Automotive Products Company, Real Estate Business Company, and Other. The company offers DC Submarine SCFF Cable. It is used to transmit electricity across a strait, or to an island.

Furukawa Electric Co. Ltd.

Furukawa Electric Co. Ltd. operates its business through segments such as Industrial Machinery, Rock Drill Machinery, UNIC Machinery, Metals, Electronics, and Others. The company offers submarine cables which are used in areas such as the transmission of electricity generated using offshore wind power generating facilities.

Register for a free trial today and gain instant access to 17,000+ market research reports.

Technavio's SUBSCRIPTION platform

Submarine Power Cable Market End-user Outlook (Revenue, USD Billion, 2019-2024)

  • Offshore wind - size and forecast 2019-2024
  • Island connection and inter-country - size and forecast 2019-2024
  • Offshore oil - size and forecast 2019-2024
  • Others - size and forecast 2019-2024

Submarine Power Cable Market Geography Outlook (Revenue, USD Billion, 2019-2024)

  • Europe - size and forecast 2019-2024
  • APAC - size and forecast 2019-2024
  • North America - size and forecast 2019-2024
  • MEA - size and forecast 2019-2024
  • South America - size and forecast 2019-2024

Are you a start-up willing to make it big in the business? Grab an exclusive Report

Related Reports on Industrials Include:

Global Submarine Fiber Cable Market – Global submarine fiber cable market is segmented by investment source (consortia, private enterprises, and governments and development banks) and geography (Europe, APAC, North America, MEA, and South America). Click Here to Get an Exclusive Free Sample Report

Global Offshore Wind Cable Market – Global offshore wind cable market is segmented by product (export cable and inter-array cable) and geography (APAC, Europe, MEA, North America, and South America). Click Here to Get an Exclusive Free Sample Report

About Technavio

Technavio is a leading global technology research and advisory company. Their research and analysis focuses on emerging market trends and provides actionable insights to help businesses identify market opportunities and develop effective strategies to optimize their market positions.

With over 500 specialized analysts, Technavio’s report library consists of more than 17,000 reports and counting, covering 800 technologies, spanning across 50 countries. Their client base consists of enterprises of all sizes, including more than 100 Fortune 500 companies. This growing client base relies on Technavio’s comprehensive coverage, extensive research, and actionable market insights to identify opportunities in existing and potential markets and assess their competitive positions within changing market scenarios.


Contacts

Technavio Research
Jesse Maida
Media & Marketing Executive
US: +1 844 364 1100
UK: +44 203 893 3200
Email: This email address is being protected from spambots. You need JavaScript enabled to view it.
Website: www.technavio.com/


BOXBOROUGH, Mass.--(BUSINESS WIRE)--#airportsecurity--Today, Integrated Defense and Security Solutions announces that the Company has earned ISO 9001:2015 Certification for its quality management system.


ISO 9001:2015 is a globally recognized quality management standard developed and published by the International Organization for Standardization (ISO). The certification provides a model for companies of all types and sizes to use in building an effective quality management system. The standard is based on several quality management principles, including having a strong customer focus, involvement of high-level company management, an outlined process-based approach, and ongoing improvement of the approach.

IDSS was issued the ISO 9001:2015 certificate (#700-300-4698) by TUV Rheinland of North America, a world-class management systems certification body. Activities at the IDSS corporate headquarters located at 85 Swanson Road in Boxborough, Massachusetts are included in the scope of certification. "Every IDSS security scanner is built to the highest quality standards," said IDSS CEO Jeffrey Hamel. "Our ISO 9001:2015 accreditation is confirmation of our ongoing commitment to reliability, quality assurance, and safety."

Integrated Defense and Security Solutions (www.idsscorp.net) is a small business security technology manufacturer based in Boxborough, Massachusetts. The company develops and manufactures Artificial Intelligence (AI) driven Computed Tomography Scanners to assist Airport and Customs security providers in their mission. The award winning DETECT™ 1000, is the first and only scanner to achieve to achieve APSS Level 1 certification by the Transportation Security Administration (TSA) and is certified to EDSCB C3 by European Civil Aviation Conference (ECAC) for explosives detection. IDSS is also the Grand Prize Winner of the DHS Opioid Challenge.


Contacts

Sissy Pressnell, IDSS
Phone: 202-365-2476
Email: This email address is being protected from spambots. You need JavaScript enabled to view it.

DUBLIN--(BUSINESS WIRE)--The "Iran Crude Oil Refinery Outlook to 2025" report has been added to ResearchAndMarkets.com's offering.


Iran Crude Oil Refinery Outlook to 2025 is a comprehensive report on crude oil refinery industry in Iran.

The report also provides details on oil refineries such as name, type, operational status, operator apart from capacity data for the major processing units, for all active and planned refineries in Iran for the period 2015-2025. Further, the report also offers recent developments, financial deals as well as latest contracts awarded in the country's oil refinery industry, wherever available.

Scope

  • Updated information related to all active, planned and announced refineries in the country, including operator and equity details
  • Information on CDU, condensate splitter, coking, catalytic cracking and hydrocracking capacities by refinery in the country, wherever available
  • Key mergers and acquisitions, and asset transactions in the country's crude oil industry, wherever available
  • Latest developments, and awarded contracts related to crude oil refineries in the country, wherever available

Reasons to Buy

  • Gain strong understanding of the country's crude oil refining industry
  • Facilitate decision making on the basis of strong historical and outlook of capacity data
  • Assess your competitor's major crude oil refining assets and their performance in the country
  • Analyze the latest developments, financial deals and awarded contracts related to the country's crude oil refining industry
  • Understand the country's financial deals landscape by analyzing how competitors are financed, and the mergers and partnerships that have shaped the market

Key Topics Covered:

1. Table of Contents

1.1. List of Tables

1.2. List of Figures

2. Introduction

2.1. What is This Report About?

2.2. Market Definition

3. Iran Refining Industry

3.1. Iran Refining Industry, Key Data

3.2. Iran Refining Industry, Overview

3.3. Iran Refining Industry, Total Refining Capacity

3.4. Iran Refining Industry, Crude Distillation Unit Capacity

3.5. Iran Refining Industry, Condensate Splitter Unit Capacity

3.6. Iran Refining Industry, Coking Capacity

3.7. Iran Refining Industry, Catalytic Cracking Capacity

3.8. Iran Refining Industry, Hydrocracking Capacity

3.9. Iran Refining Industry, Asset Details

3.9.1. Iran Refining Industry, Active Asset Details

3.9.2. Iran Refining Industry, Planned Asset Details

4. Recent Contracts

4.1. Detailed Contract Summary

4.1.1. Awarded Contracts

5. Financial Deals Landscape

5.1. Detailed Deal Summary

5.1.1. Acquisition

5.1.2. Debt Offerings

5.1.3. Partnerships

5.1.4. Asset Transactions

6. Recent Developments

6.1. Other Significant Developments

7. Appendix

For more information about this report visit https://www.researchandmarkets.com/r/n3bg3w


Contacts

ResearchAndMarkets.com
Laura Wood, Senior Press Manager
This email address is being protected from spambots. You need JavaScript enabled to view it.
For E.S.T Office Hours Call 1-917-300-0470
For U.S./CAN Toll Free Call 1-800-526-8630
For GMT Office Hours Call +353-1-416-8900

AUSTIN, Texas--(BUSINESS WIRE)--WhiteWater Midstream (WWM) today announced that the Agua Blanca pipeline system expansion has entered commercial service. The 1.8 billion cubic-feet-per-day (Bcf/d) expansion of Agua Blanca will deliver gas from across the Delaware Basin to the Waha hub. Backed by long-term firm contracts, the expansion brings the system’s total capacity to over 3 Bcf/d, which will help alleviate in-basin take away constraints and reduce natural gas flaring.


The Agua Blanca system is connected to almost twenty gas processing sites in the Delaware Basin and is currently transporting gas produced in Culberson, Loving, Reeves, Pecos, Winkler and Ward counties in Texas, and Eddy and Lea counties in New Mexico, to the Waha hub. The recent expansion includes a 42-inch diameter trunk line that more than doubles system capacity while providing significant incremental takeaway options for plants servicing Texas and New Mexico gas producers.

“We are excited to begin commercial operations of this expansion ahead of schedule while continuing to provide reliable and transparent transportation services to producers and processors in Texas and New Mexico,” said WhiteWater Chief Executive Officer Christer Rundlof. “WWM remains committed to developing premier Permian basin residue assets as the markets continue to normalize and growth resumes.”

WhiteWater Midstream’s investment in the Agua Blanca joint venture is led by First Infrastructure Capital. Inquiries regarding the Agua Blanca Expansion should be directed to This email address is being protected from spambots. You need JavaScript enabled to view it..

About WhiteWater Midstream

WhiteWater Midstream is a management owned, Austin based midstream company. WhiteWater Midstream is partnered with multiple private equity funds including but not limited to Ridgemont Equity Partners, Denham Capital Management, First Infrastructure Capital and the Ontario Power Generation Inc. Pension Plan. Since inception, WhiteWater has reached final investment decision on ~$3 billion in greenfield development projects. For more information about WhiteWater Midstream, visit www.whitewatermidstream.com.

About First Infrastructure Capital

First Infrastructure Capital Advisors, LLC is a Houston-based investment firm specializing in greenfield projects and companies operating in the midstream, downstream, electric power, telecommunications, and renewable energy industries. First Infrastructure Capital Advisors, LLC is an SEC-registered investment adviser, which manages funds affiliated with First Infrastructure Capital, L.P. For more information about First Infrastructure Capital, visit www.firstinfracap.com.


Contacts

Investor Relations Contacts:

WhiteWater Midstream
Bryan Willoughby
Director, Business Development
(512) 953-2100
www.whitewatermidstream.com

Oceana applauds the president’s bold action to protect our ocean and coastal resources

WASHINGTON--(BUSINESS WIRE)--#ProtectOurCoast--Today, President Biden is expected to sign an executive order pausing all federal offshore and onshore oil and gas leasing.


“Oceana applauds the president's bold action to halt new offshore oil and gas leasing. More drilling means more climate pollution that we simply cannot afford. Climate change is already wreaking havoc on our lives and livelihoods and it’s a relief to see President Biden putting solutions to the climate crisis first,” said Diane Hoskins, campaign director at Oceana. “President Biden’s actions are a win for the health of our ocean, our economy and our climate. We look forward to working with the Biden-Harris administration to permanently move away from dirty and dangerous offshore drilling toward clean, renewable energy sources like offshore wind.”

A new Oceana analysis released this week finds ending new leasing for offshore oil and gas could prevent over 19 billion tons of greenhouse gas emissions as well as more than $720 billion in damages to people, property and the environment.

Additionally, the analysis found that ending new leasing will also safeguard the U.S. clean coast economy, which supports around 3.3 million American jobs and $250 billion in GDP through activities like tourism, recreation and fishing.

As of today, opposition and concern over offshore drilling activities nationwide includes:

  • Every East and West Coast governor, including Florida, Georgia, South Carolina, North Carolina, Virginia, Maryland, Delaware, New Jersey, New York, Connecticut, Rhode Island, Massachusetts, New Hampshire, Maine, California, Oregon and Washington
  • More than 390 local municipalities
  • Over 2,300 local, state and federal bipartisan officials
  • East and West Coast alliances representing over 56,000 businesses and 500,000 fishing families
  • Pacific, New England, South Atlantic and Mid-Atlantic fishery management councils
  • More than 120 scientists
  • More than 80 former military leaders
  • Commercial and recreational fishing interests such as Southeastern Fisheries Association, Snook and Gamefish Foundation, Fisheries Survival Fund, Southern Shrimp Alliance, Billfish Foundation and International Game Fish Association
  • California Coastal Commission, California Fish and Game Commission and California State Lands Commission
  • Department of Defense, NASA, U.S. Air Force and Florida Defense Support Task Force

To learn more about Oceana’s campaign to stop the expansion of offshore drilling activities, please click here.

Oceana is the largest international advocacy organization dedicated solely to ocean conservation. Oceana is rebuilding abundant and biodiverse oceans by winning science-based policies in countries that control one-third of the world’s wild fish catch. With more than 225 victories that stop overfishing, habitat destruction, pollution, and the killing of threatened species like turtles and sharks, Oceana’s campaigns are delivering results. A restored ocean means that 1 billion people can enjoy a healthy seafood meal, every day, forever. Together, we can save the oceans and help feed the world. Visit USA.Oceana.org to learn more.


Contacts

Christine Ayala This email address is being protected from spambots. You need JavaScript enabled to view it. 972.765.3644
Dustin Cranor: This email address is being protected from spambots. You need JavaScript enabled to view it., 954.348.1314

CHICAGO--(BUSINESS WIRE)--PNE USA, Inc., a subsidiary of PNE AG, a publicly traded renewable energy company based in Cuxhaven, Germany, announced it has acquired four solar projects, totaling 280 megawatts (MW). The projects, located in the MISO, PJM, and WECC markets, add to PNE USA’s growing pipeline of onshore wind, solar, and battery storage projects under development. PNE USA builds on its parent company’s more than 30 years of success in onshore and offshore wind in Europe and marks PNE Group’s entrance into the United States solar business.


In the US, PNE has developed and sold more than 425 MW of utility scale wind and solar energy projects. To support its strategic growth plans, the company has strengthened its leadership team, with Rocky Ray, as Director of Wind Development and Dave Savage, as Director of Solar Development. The two experienced executives lead project development activities for the US market including managing the existing pipeline and identifying new opportunities.

In addition, Karl Dahlstrom has been promoted to Chief Executive Officer, replacing retired CEO, Ron Flax-Davidson. Karl is now responsible for spearheading and overseeing the strategic growth and direction in the US market, including development and sale of the company’s current portfolio of renewable energy projects as well as growing the portfolio through new acquisitions and greenfield development. Karl has a proven track record of successfully leading teams, development and financing of multiple energy facilities across the United States.

Karl Dahlstrom, CEO of PNE USA, remarked, “I am honored to be leading PNE USA as we move into an important growth phase. The acquisition of these four solar projects is a testament to our belief in the future of renewable energy in the US market. With a strong commitment from PNE AG, as well as an experienced team and a balanced portfolio of development projects, we are well positioned for success.”

About PNE USA

PNE USA is a leading renewable energy company with projects in development and operating throughout the United States. As a subsidiary of the PNE AG Group, headquartered in Germany, our experienced team is committed to successfully developing, financing, constructing, and operating utility scale wind, photovoltaic solar, and energy storage projects. We are driven by the belief that a better future will be built on better energy choices. With this belief we are dedicated to making that better future happen.

About PNE Group

The internationally operating PNE Group is one of the most experienced project developers of onshore and offshore wind farms. Based on this success, the Group has developed into a "clean energy solutions provider.” From initial site exploration and implementation of approval procedures via financing and turnkey construction to operation and repowering, the Company's services encompass all the phases of developing and operating wind farms. In addition to wind energy, the Company’s range of offers includes photovoltaics, electricity storage, service products and the supply of clean electricity. PNE is also focussing on the development of power-to-X solutions.


Contacts

Sarah Bray
Innovant Public Relations
This email address is being protected from spambots. You need JavaScript enabled to view it.
832.226.2116

CAMDEN, N.J.--(BUSINESS WIRE)--American Water (NYSE: AWK), the largest publicly-traded U.S. water and wastewater utility company, announced today that it is one of 380 companies across 11 sectors included in the 2021 Bloomberg Gender-Equality Index (GEI). This is the third consecutive year that American Water has been included in this index. The GEI expanded in 2021 to represent 44 countries and regions, including firms headquartered in Indonesia and Bermuda for the first time. Companies range from a variety of industries, including automotive, banking, consumer services, engineering and construction, and retail.


“American Water is proud to be included in the 2021 Bloomberg Gender-Equality Index and be recognized for our longstanding commitment to gender equality throughout our company,” said Walter Lynch, President & CEO of American Water. “At American Water, diversity of backgrounds, ideas, thoughts, and experiences is vital to our culture and the way we do business. Creating an environment where differences are embraced and where every person feels engaged and included makes us safer, stronger, and more successful.”

The GEI brings transparency to gender-related practices and policies at publicly listed companies increasing the breadth of environmental, social, governance (ESG) data available to investors. The comprehensive, transparent GEI scoring methodology allows investors to assess company performance and compare across industry peer groups.

“The companies included in the 2021 GEI are expanding the ESG data universe to include gender-related data that investors are demanding today,” said Peter T. Grauer, Chairman of Bloomberg. “Their commitment to disclosure is making the business case for inclusion and driving transparency in the markets.”

Through disclosure of gender-related metrics using the GEI framework, the firms included in the 2021 GEI have committed to provide a comprehensive look at their investment in workplace gender equality and the communities in which they operate, raising the bar of what should be expected from other companies within the same industry. American Water was included in this year’s index for scoring at or above a global threshold established by Bloomberg to reflect a high level of disclosure and overall performance across the framework’s five pillars.

Both the framework and the GEI are voluntary and have no associated costs. The GEI is a reference index and is not for use as a financial benchmark. The index is not ranked. While all public companies are encouraged to disclose supplemental gender data for their company’s investment profile on the Bloomberg Terminal, those that have a market capitalization of USD one billion are eligible for inclusion in the index. To learn more please visit the GEI website. Bloomberg Terminal subscribers can access the GEI at {BGEI <GO>}.

About American Water

With a history dating back to 1886, American Water is the largest and most geographically diverse U.S. publicly traded water and wastewater utility company. The company employs more than 6,800 dedicated professionals who provide regulated and market-based drinking water, wastewater and other related services to more than 14 million people in 46 states. American Water provides safe, clean, affordable and reliable water services to our customers to make sure we keep their lives flowing. For more information, visit amwater.com and follow American Water on Twitter, Facebook and LinkedIn.


Contacts

Media Contact:
Joseph Szafran
External Affairs Manager
856-955-4304
This email address is being protected from spambots. You need JavaScript enabled to view it.

Veronika Henze
Bloomberg LP
1-646-324-1596
This email address is being protected from spambots. You need JavaScript enabled to view it.

Liidia Liuksila
Bloomberg LP
+1 212-617-5424
This email address is being protected from spambots. You need JavaScript enabled to view it.

Offshore Source Logo

Offshore Source keeps you updated with relevant information concerning the Offshore Energy Sector.

Any views or opinions represented on this website belong solely to the author and do not represent those of the people, institutions or organizations that Offshore Source or collaborators may or may not have been associated with in a professional or personal capacity, unless explicitly stated.

Corporate Offices

Technology Systems Corporation
8502 SW Kansas Ave
Stuart, FL 34997

info@tscpublishing.com