Business Wire News

  • Fourth quarter loss of $665 million; adjusted loss of $11 million
  • Annual capital spending down 35 percent
  • Increased 2020 dividend per share for 33rd consecutive year


SAN RAMON, Calif.--(BUSINESS WIRE)--Chevron Corporation (NYSE: CVX) today reported a loss of $665 million ($(0.33) per share - diluted) for fourth quarter 2020, compared with a loss of $6.6 billion ($(3.51) per share - diluted) in fourth quarter 2019. Included in the current quarter was a charge of $120 million associated with Noble Energy, Inc. acquisition costs. Foreign currency effects decreased earnings by $534 million. Adjusted loss of $11 million ($(0.01) per share - diluted) in fourth quarter 2020 compares to adjusted earnings of $2.8 billion ($1.49 per share - diluted) in fourth quarter 2019.

Chevron reported a full-year 2020 loss of $5.5 billion ($(2.96) per share - diluted), compared with earnings of $2.9 billion ($1.54 per share - diluted) in 2019. Included in 2020 were net charges for special items of $4.5 billion, compared to net charges of $8.7 billion for special items in 2019. Foreign currency effects decreased earnings in 2020 by $645 million. Adjusted loss of $368 million ($(0.20) per share - diluted) in full-year 2020 compares to adjusted earnings of $11.9 billion ($6.27 per share - diluted) in full-year 2019. For a reconciliation of adjusted earnings/(loss), see Attachment 5.

Sales and other operating revenues in fourth quarter 2020 were $25 billion, compared to $35 billion in the year-ago period.

Earnings Summary


Three Months
Ended Dec. 31


Year Ended
Ended Dec. 31


Millions of dollars


2020


2019


2020


2019


Earnings by business segment


Upstream


$501


$(6,734)


$(2,433)


$2,576


Downstream


(338)


672


47


2,481


All Other


(828)


(548)


(3,157)


(2,133)


Total (1)(2)


$(665)


$(6,610)


$(5,543)


$2,924


(1) Includes foreign currency effects


$(534)


$(256)


$(645)


$(304)


(2) Net income attributable to Chevron Corporation (See Attachment 1)


“2020 was a year like no other,” said Mike Wirth, Chevron’s chairman of the board and chief executive officer. “We were well positioned when the pandemic and economic crisis hit, and we exited the year with a strong balance sheet, having completed a major acquisition and increased our dividend payout for the 33rd consecutive year.”

“When market conditions deteriorated, we swiftly reduced capital spending by 35 percent from 2019 and also reduced operating costs, demonstrating our commitment to capital and cost discipline,” Wirth added. Excluding severance expense, 2020 operating expenses were down $1.4 billion from the prior year. Chevron also completed an enterprise-wide transformation program and the integration of Noble Energy, positioning the company for the future.

“The acquisition of Noble Energy was completed in October, adding high-quality assets, opportunities and people to Chevron,” Wirth said. The company also generated asset sales proceeds of $2.9 billion in 2020, including the sale of its Appalachia natural gas business in December. For 2018 through 2020, the company generated asset sales proceeds of $7.7 billion, in the middle of its guidance range of $5-$10 billion.

Chevron added 832 million barrels of net oil-equivalent proved reserves in 2020. These additions, which are subject to final reviews, are net of reductions associated with lower commodity prices, decisions to reduce capital funding for various projects and asset sales. The largest net additions were from the acquisition of Noble Energy and from assets in Kazakhstan. The largest net reductions were from assets in Australia, Venezuela, and the Permian Basin and asset sales in Appalachia. The company will provide additional details relating to 2020 reserve additions in its Annual Report on Form 10-K scheduled for filing with the SEC on February 25, 2021.

“In 2020, we increased production of renewable products and investments in low-carbon technologies, consistent with our commitment to succeed in a lower carbon future,” Wirth stated. During the year, the company announced first gas production at its CalBioGas renewable natural gas (RNG) joint venture in California, formed a new RNG partnership with Brightmark and announced first production of renewable base oil through its Novvi joint venture. The company also entered agreements to invest in carbon capture and other emerging low carbon technologies through its Future Energy Fund.

At year-end, balances of cash, cash equivalents, and marketable securities totaled $5.6 billion, a decrease of $0.1 billion from the end of 2019. Total debt at December 31, 2020 was $44.3 billion, an increase of $17.3 billion from a year earlier, including $9.4 billion from Noble Energy.

UPSTREAM

Worldwide net oil-equivalent production was 3.28 million barrels per day in fourth quarter 2020, an increase of 6 percent from a year ago. The increase was largely due to the Noble Energy acquisition, partially offset by production curtailments. Worldwide net oil-equivalent production for the full-year 2020 was 3.08 million barrels per day, an increase of 1 percent from the prior year.

U.S. Upstream


Three Months
Ended Dec. 31


Year Ended
Ended Dec. 31


Millions of dollars


2020


2019


2020


2019


Earnings

$101


$(7,465)


$(1,608)


$(5,094)


U.S. upstream operations earned $101 million in fourth quarter 2020, compared with a loss of $7.47 billion a year earlier. The increase was primarily due to the absence of fourth quarter 2019 impairments of $8.2 billion, partially offset by lower crude oil realizations.

The company’s average sales price per barrel of crude oil and natural gas liquids was $33 in fourth quarter 2020, down from $47 a year earlier. The average sales price of natural gas was $1.49 per thousand cubic feet in fourth quarter 2020, up from $1.10 in last year’s fourth quarter.

Net oil-equivalent production of 1.20 million barrels per day in fourth quarter 2020 was up 197,000 barrels per day from a year earlier. The increase was due to 231,000 barrels per day of production from the Noble Energy acquisition. Additional production increases from shale and tight properties in the Permian Basin were more than offset by normal field declines, weather effects in the Gulf of Mexico and a 25,000 barrels per day decrease related to the Appalachian asset sale. The net liquids component of oil-equivalent production in fourth quarter 2020 increased 14 percent to 880,000 barrels per day, while net natural gas production increased 39 percent to 1.89 billion cubic feet per day, compared to last year’s fourth quarter.

International Upstream


Three Months
Ended Dec. 31


Year Ended
Ended Dec. 31


Millions of dollars


2020


2019


2020


2019


Earnings*

$400


$731


$(825)


$7,670


*Includes foreign currency effects


$(384)


$(226)


$(285)


$(323)


International upstream operations earned $400 million in fourth quarter 2020, compared with $731 million a year ago. The decrease in earnings was primarily due to the absence of a 2019 gain of $1.2 billion on the sale of the U.K. Central North Sea assets, lower crude oil and natural gas realizations and lower crude oil sales volumes. Partially offsetting the decrease was the absence of fourth quarter 2019 write-offs and impairment charges of $2.2 billion along with lower operating expenses. Foreign currency effects had an unfavorable impact on earnings of $158 million between periods.

The average sales price for crude oil and natural gas liquids in fourth quarter 2020 was $40 per barrel, down from $57 a year earlier. The average sales price of natural gas was $4.23 per thousand cubic feet in the fourth quarter, compared with $5.71 in last year’s fourth quarter.

Net oil-equivalent production of 2.08 million barrels per day in fourth quarter 2020 was flat relative to fourth quarter 2019. Higher production due to 124,000 barrels per day of production from the Noble Energy acquisition and favorable entitlement effects were offset by production curtailments associated with OPEC+ restrictions and market conditions, asset sale-related decreases of 82,000 barrels per day and normal field declines. The net liquids component of oil-equivalent production decreased 2 percent to 1.10 million barrels per day in fourth quarter 2020, while net natural gas production of 5.90 billion cubic feet per day increased 3 percent, compared to last year's fourth quarter.

DOWNSTREAM

U.S. Downstream


Three Months
Ended Dec. 31


Year Ended
Ended Dec. 31


Millions of dollars


2020


2019


2020


2019


Earnings

$(174)


$488


$(571)


$1,559


U.S. downstream operations reported a loss of $174 million in fourth quarter 2020, compared with earnings of $488 million a year earlier. The decrease was mainly due to lower margins on refined product sales and lower sales volumes, partially offset by lower operating expenses and higher earnings from 50 percent-owned Chevron Phillips Chemical Company LLC.

Refinery crude oil input in fourth quarter 2020 decreased 17 percent to 806,000 barrels per day from the year-ago period, as the company cut refinery runs in response to the weak refining margin environment.

Refined product sales of 1.02 million barrels per day were also down 17 percent from fourth quarter 2019, mainly due to lower jet fuel, diesel and gasoline demand associated with the COVID-19 pandemic.

International Downstream


Three Months
Ended Dec. 31


Year Ended
Ended Dec. 31


Millions of dollars


2020


2019


2020


2019


Earnings*

$(164)


$184


$618


$922


*Includes foreign currency effects


$(140)


$(32)


$(152)


$17


International downstream operations reported a loss of $164 million in fourth quarter 2020, compared with earnings of $184 million a year earlier. The decrease in earnings was largely due to lower margins on refined product sales, partially offset by lower operating expenses. Foreign currency effects had an unfavorable impact on earnings of $108 million between periods.

Refinery crude oil input of 541,000 barrels per day in fourth quarter 2020 decreased 6 percent from the year-ago period, primarily due to the economic slowdowns in response to the COVID-19 pandemic, partially offset by the absence of the fourth quarter 2019 major planned turnaround at the Star Petroleum Refining Company in Thailand.

Refined product sales of 1.23 million barrels per day in fourth quarter 2020 were down 4 percent from the year-ago period, mainly due to lower jet fuel demand associated with the COVID-19 pandemic, partially offset by higher diesel sales resulting from the second quarter 2020 acquisition of Puma Energy (Australia) Holdings Pty Ltd.

ALL OTHER


Three Months
Ended Dec. 31


Year Ended
Ended Dec. 31


Millions of dollars


2020


2019


2020


2019


Net Charges*

$(828)


$(548)


$(3,157)


$(2,133)


*Includes foreign currency effects


$(10)


$2


$(208)


$2


All Other consists of worldwide cash management and debt financing activities, corporate administrative functions, insurance operations, real estate activities and technology companies.

Net charges in fourth quarter 2020 were $828 million, compared to $548 million a year earlier. The increase in net charges between periods was mainly due to higher pension expenses and Noble Energy acquisition costs, partially offset by favorable tax items. Foreign currency effects increased net charges by $12 million between periods.

CASH FLOW FROM OPERATIONS

Cash flow from operations in 2020 was $10.6 billion, compared with $27.3 billion in 2019. Excluding working capital effects, cash flow from operations in 2020 was $12.2 billion, compared with $25.8 billion in 2019.

CAPITAL AND EXPLORATORY EXPENDITURES

Capital and exploratory expenditures in 2020 were $13.5 billion, compared with $21.0 billion in 2019. The amounts included $4.0 billion in 2020 and $6.1 billion in 2019 for the company’s share of expenditures by affiliates, which did not require cash outlays by the company. Expenditures for upstream represented 81 percent of the company-wide total in 2020. Included in 2020 were inorganic capital expenditures of $350 million primarily associated with the downstream acquisition of Puma Energy (Australia) Holdings Pty Ltd. The acquisition of Noble Energy is not included in the company’s capital and exploratory expenditures.

NOTICE

Chevron’s discussion of fourth quarter 2020 earnings with security analysts will take place on Friday, January 29, 2021, at 8:00 a.m. PDT. A webcast of the meeting will be available in a listen-only mode to individual investors, media, and other interested parties on Chevron’s website at www.chevron.com under the “Investors” section. Additional financial and operating information and other complementary materials will be available under “Events and Presentations” in the “Investors” section on the Chevron website.

As used in this news release, the term “Chevron” and such terms as “the company,” “the corporation,” “our,” “we,” “us” and “its” may refer to Chevron Corporation, one or more of its consolidated subsidiaries, or to all of them taken as a whole. All of these terms are used for convenience only and are not intended as a precise description of any of the separate companies, each of which manages its own affairs.

Please visit Chevron’s website and Investor Relations page at www.chevron.com and www.chevron.com/investors, LinkedIn: www.linkedin.com/company/chevron, Twitter: @Chevron, Facebook: www.facebook.com/chevron, and Instagram: www.instagram.com/chevron, where Chevron often discloses important information about the company, its business, and its results of operations.

This press release includes adjusted earnings/(loss), which reflect earnings or losses excluding significant non-operational items including impairment charges, write-offs, severance costs, Noble Energy acquisition costs, gains on asset sales, unusual tax items, the Anadarko merger termination fee, foreign currency effects and other special items. We believe it is useful for investors to consider these figures in comparing the underlying performance of our business across periods. The presentation of this additional information is not meant to be considered in isolation or as a substitute for net income (loss) as prepared in accordance with U.S. GAAP. A reconciliation to net income (loss) attributable to Chevron Corporation is shown in Attachment 5.

CAUTIONARY STATEMENTS RELEVANT TO FORWARD-LOOKING INFORMATION FOR THE PURPOSE OF “SAFE HARBOR” PROVISIONS OF THE PRIVATE SECURITIES LITIGATION REFORM ACT OF 1995

This news release contains forward-looking statements relating to Chevron’s operations that are based on management's current expectations, estimates and projections about the petroleum, chemicals and other energy-related industries. Words or phrases such as “anticipates,” “expects,” “intends,” “plans,” “targets,” “forecasts,” “projects,” “believes,” “seeks,” “schedules,” “estimates,” “positions,” “pursues,” “may,” “could,” “should,” “will,” “budgets,” “outlook,” “trends,” “guidance,” “focus,” “on schedule,” “on track,” “is slated,” “goals,” “objectives,” “strategies,” “opportunities,” “poised,” “potential” and similar expressions are intended to identify such forward-looking statements. These statements are not guarantees of future performance and are subject to certain risks, uncertainties and other factors, many of which are beyond the company’s control and are difficult to predict. Therefore, actual outcomes and results may differ materially from what is expressed or forecasted in such forward-looking statements. The reader should not place undue reliance on these forward-looking statements, which speak only as of the date of this news release. Unless legally required, Chevron undertakes no obligation to update publicly any forward-looking statements, whether as a result of new information, future events or otherwise.

Among the important factors that could cause actual results to differ materially from those in the forward-looking statements are: changing crude oil and natural gas prices and demand for our products, and production curtailments due to market conditions; crude oil production quotas or other actions that might be imposed by the Organization of Petroleum Exporting Countries and other producing countries; public health crises, such as pandemics (including coronavirus (COVID-19)) and epidemics, and any related government policies and actions; changing economic, regulatory and political environments in the various countries in which the company operates; general domestic and international economic and political conditions; changing refining, marketing and chemicals margins; the company’s ability to realize anticipated cost savings, expenditure reductions and efficiencies associated with enterprise transformation initiatives; actions of competitors or regulators; timing of exploration expenses; timing of crude oil liftings; the competitiveness of alternate-energy sources or product substitutes; technological developments; the results of operations and financial condition of the company’s suppliers, vendors, partners and equity affiliates, particularly during extended periods of low prices for crude oil and natural gas during the COVID-19 pandemic; the inability or failure of the company’s joint-venture partners to fund their share of operations and development activities; the potential failure to achieve expected net production from existing and future crude oil and natural gas development projects; potential delays in the development, construction or start-up of planned projects; the potential disruption or interruption of the company’s operations due to war, accidents, political events, civil unrest, severe weather, cyber threats, terrorist acts, or other natural or human causes beyond the company’s control; the potential liability for remedial actions or assessments under existing or future environmental regulations and litigation; significant operational, investment or product changes required by existing or future environmental statutes and regulations, including international agreements and national or regional legislation and regulatory measures to limit or reduce greenhouse gas emissions; the potential liability resulting from pending or future litigation; the company's ability to achieve the anticipated benefits from the acquisition of Noble Energy; the company’s future acquisitions or dispositions of assets or shares or the delay or failure of such transactions to close based on required closing conditions; the potential for gains and losses from asset dispositions or impairments; government mandated sales, divestitures, recapitalizations, industry-specific taxes, tariffs, sanctions, changes in fiscal terms or restrictions on scope of company operations; foreign currency movements compared with the U.S. dollar; material reductions in corporate liquidity and access to debt markets; the receipt of required Board authorizations to pay future dividends; the effects of changed accounting rules under generally accepted accounting principles promulgated by rule-setting bodies; the company’s ability to identify and mitigate the risks and hazards inherent in operating in the global energy industry; and the factors set forth under the heading “Risk Factors” on pages 18 through 21 of the company's 2019 Annual Report on Form 10-K, as updated by Part II, Item 1A, "Risk Factors" in the company's subsequently filed Quarterly Reports on Form 10-Q, and in other subsequent filings with the U.S. Securities and Exchange Commission. Other unpredictable or unknown factors not discussed in this news release could also have material adverse effects on forward-looking statements.

CHEVRON CORPORATION - FINANCIAL REVIEW

Attachment 1

(Millions of Dollars, Except Per-Share Amounts)


(unaudited)


CONSOLIDATED STATEMENT OF INCOME


Three Months
Ended December 31


Year Ended
December 31

REVENUES AND OTHER INCOME

2020


2019


2020


2019


Sales and other operating revenues

$

24,843


$

34,574


$

94,471


$

139,865


Income (loss) from equity affiliates

568


538


(472

)


3,968


Other income (loss)

(165

)


1,238


693


2,683


Total Revenues and Other Income

25,246


36,350


94,692


146,516


COSTS AND OTHER DEDUCTIONS


Purchased crude oil and products

13,387


19,693


50,488


80,113


Operating expenses *

6,488


7,214


25,416


25,945


Exploration expenses

367


272


1,537


770


Depreciation, depletion and amortization

4,486


16,429


19,508


29,218


Taxes other than on income

1,276


969


4,499


4,136


Interest and debt expense

199


178


697


798


Total Costs and Other Deductions

26,203


44,755


102,145


140,980


Income (Loss) Before Income Tax Expense

(957

)


(8,405

)


(7,453

)


5,536


Income tax expense (benefit)

(301

)


(1,738

)


(1,892

)


2,691


Net Income (Loss)

(656

)


(6,667

)


(5,561

)


2,845


Less: Net income (loss) attributable to noncontrolling interests

9


(57

)


(18

)


(79

)

NET INCOME (LOSS) ATTRIBUTABLE TO
CHEVRON CORPORATION

$

(665

)


$

(6,610

)


$

(5,543

)


$

2,924


* Includes operating expense, selling, general and administrative expense, and other components of net periodic benefit costs


PER-SHARE OF COMMON STOCK


Net Income (Loss) Attributable to Chevron Corporation


- Basic

$

(0.33

)


$

(3.51

)


$

(2.96

)


$

1.55


- Diluted

$

(0.33

)


$

(3.51

)


$

(2.96

)


$

1.54


Weighted Average Number of Shares Outstanding (000's)


- Basic

1,910,724


1,872,317


1,870,027


1,882,499


- Diluted

1,910,724


1,872,317


1,870,027


1,895,126


CHEVRON CORPORATION - FINANCIAL REVIEW

Attachment 2

(Millions of Dollars)


(unaudited)


EARNINGS BY MAJOR OPERATING AREA

Three Months
Ended December 31


Year Ended
December 31


2020


2019


2020


2019

Upstream


United States

$

101


$

(7,465

)


$

(1,608

)


$

(5,094

)

International

400


731


(825

)


7,670


Total Upstream

501


(6,734

)


(2,433

)


2,576


Downstream


United States

(174

)


488


(571

)


1,559


International

(164

)


184


618


922


Total Downstream

(338

)


672


47


2,481


All Other (1)

(828

)


(548

)


(3,157

)


(2,133

)

Total (2)

$

(665

)


$

(6,610

)


$

(5,543

)


$

2,924


SELECTED BALANCE SHEET ACCOUNT DATA (Preliminary)


Dec 31,
2020


Dec 31,
2019

Cash and Cash Equivalents


$

5,596


$

5,686


Marketable Securities


$

31


$

63


Total Assets


$

239,790


$

237,428


Total Debt


$

44,315


$

26,973


Total Chevron Corporation Stockholders' Equity


$

131,688


$

144,213


Three Months
Ended December 31


Year Ended
December 31

CAPITAL AND EXPLORATORY EXPENDITURES(3)

2020


2019


2020


2019

United States


Upstream

$

1,198


$

2,268


$

5,130


$

8,197


Downstream

271


487


1,021


1,868


Other

43


132


226


365


Total United States

1,512


2,887


6,377


10,430


International


Upstream

1,285


2,754


5,784


9,627


Downstream

376


370


1,325


920


Other

4


5


13


17


Total International

1,665


3,129


7,122


10,564


Worldwide

$

3,177


$

6,016


$

13,499


$

20,994


(1) Includes worldwide cash management and debt financing activities, corporate administrative functions, insurance operations, real estate activities, and technology companies.


(2) Net Income (Loss) Attributable to Chevron Corporation (See Attachment 1).


(3) Includes interest in affiliates:


United States

$

73


$

112


$

324


$

368


International

846


1,422


3,658


5,744


Total

$

919


$

1,534


$

3,982


$

6,112


CHEVRON CORPORATION - FINANCIAL REVIEW

Attachment 3

(Billions of Dollars)

(unaudited)


SUMMARIZED STATEMENT OF CASH FLOWS (Preliminary)1


Year Ended
December 31

OPERATING ACTIVITIES

2020


2019

Net Income (Loss)

$

(5.6

)


$

2.8


Adjustments


Depreciation, depletion and amortization

19.5


29.2


Distributions more (less) than income from equity affiliates

2.0


(2.1

)

Loss (gain) on asset retirements and sales

(0.8

)


(1.4

)

Net foreign currency effects

0.6


0.3


Deferred income tax provision

(3.6

)


(2.0

)

Net decrease (increase) in operating working capital

(1.7

)


1.5


Other operating activity


(1.1

)

Net Cash Provided by Operating Activities

$

10.6


$

27.3


INVESTING ACTIVITIES


Capital expenditures

(8.9

)


(14.1

)

Proceeds and deposits related to asset sales and returns of investment

3.0


3.0


Net maturities of (investments in) time deposits


1.0


Other investing activity(2)

(1.0

)


(1.2

)

Net Cash Used for Investing Activities

$

(7.0

)


$

(11.5

)


FINANCING ACTIVITIES


Net change in debt

7.5


(7.8

)

Cash dividends — common stock

(9.7

)


(9.0

)

Net sales (purchases) of treasury shares

(1.5

)


(2.9

)

Distributions to noncontrolling interests


Net Cash Used for Financing Activities

$

(3.7

)


$

(19.8

)


EFFECT OF EXCHANGE RATE CHANGES ON CASH, CASH EQUIVALENTS AND RESTRICTED CASH

(0.1

)


0.3


NET CHANGE IN CASH, CASH EQUIVALENTS AND RESTRICTED CASH

$

(0.2

)


$

(3.6

)

(1) Totals may not match sum of parts due to presentation in billions.


(2) Primarily borrowings of loans by equity affiliates.


Contacts

Sean Comey -- +1 925-842-5509


Read full story here

DUBLIN--(BUSINESS WIRE)--The "Biogas - Global Market Trajectory & Analytics" report has been added to ResearchAndMarkets.com's offering.


The publisher brings years of research experience to the 8th edition of this report. The 140-page report presents concise insights into how the pandemic has impacted production and the buy side for 2020 and 2021. A short-term phased recovery by key geography is also addressed.

Global Biogas Market to Reach $42.7 Billion by 2027

Amid the COVID-19 crisis, the global market for Biogas estimated at US$30.3 Billion in the year 2020, is projected to reach a revised size of US$42.7 Billion by 2027, growing at a CAGR of 5% over the period 2020-2027.

Electricity & Heat, one of the segments analyzed in the report, is projected to record 4.7% CAGR and reach US$22.5 Billion by the end of the analysis period. After an early analysis of the business implications of the pandemic and its induced economic crisis, growth in the Vehicle Fuel segment is readjusted to a revised 5.5% CAGR for the next 7-year period.

The U.S. Market is Estimated at $8.9 Billion, While China is Forecast to Grow at 4.7% CAGR

The Biogas market in the U.S. is estimated at US$8.9 Billion in the year 2020. China, the world`s second largest economy, is forecast to reach a projected market size of US$7.6 Billion by the year 2027 trailing a CAGR of 4.7% over the analysis period 2020 to 2027. Among the other noteworthy geographic markets are Japan and Canada, each forecast to grow at 4.8% and 4% respectively over the 2020-2027 period. Within Europe, Germany is forecast to grow at approximately 4.2% CAGR.

Competitors identified in this market include, among others:

  • AAT Abwasser- und Abfalltechnik GmbH
  • BEKON GmbH
  • Biogas Technology Ltd.
  • Cargill, Inc.
  • Chevron Corporation
  • Environmental Energy Engineering Co.
  • Environmental Products & Technology Corp.

Key Topics Covered:

I. INTRODUCTION, METHODOLOGY & REPORT SCOPE

II. EXECUTIVE SUMMARY

1. MARKET OVERVIEW

  • Global Competitor Market Shares
  • Biogas Competitor Market Share Scenario Worldwide (in %): 2019 & 2025
  • Impact of Covid-19 and a Looming Global Recession

2. FOCUS ON SELECT PLAYERS

3. MARKET TRENDS & DRIVERS

4. GLOBAL MARKET PERSPECTIVE

III. MARKET ANALYSIS

IV. COMPETITION

  • Total Companies Profiled: 56

For more information about this report visit https://www.researchandmarkets.com/r/xmhj8i


Contacts

ResearchAndMarkets.com
Laura Wood, Senior Press Manager
This email address is being protected from spambots. You need JavaScript enabled to view it.

For E.S.T Office Hours Call 1-917-300-0470
For U.S./CAN Toll Free Call 1-800-526-8630
For GMT Office Hours Call +353-1-416-8900

WESTLAKE, Ohio--(BUSINESS WIRE)--TravelCenters of America Inc. (Nasdaq: TA) today announced that it plans to issue a press release containing its fourth quarter 2020 financial results after the Nasdaq closes for trading on Thursday, February 25, 2021. On Friday, February 26, 2021 at 10:00 a.m. Eastern Time, Chief Executive Officer Jonathan M. Pertchik, President Barry Richards and Chief Financial Officer and Treasurer Peter Crage will host a conference call to review the fourth quarter 2020 results.


The conference call telephone number is (877) 329-4614. Participants calling from outside the United States and Canada should dial (412) 317-5437. No pass code is necessary to access the call from either number. Participants should dial in about 15 minutes prior to the scheduled start of the call. A replay of the conference call will be available through Friday, March 5, 2021. To hear the replay, dial (412) 317-0088. The replay pass code is 10150721.

A live audio webcast of the conference call will also be available in a listen-only mode on the company's website, which is located at www.ta-petro.com. Participants who want to access the webcast should visit the company's website about five minutes before the call. The archived webcast will be available for replay on the company's website after the call.

About TravelCenters of America Inc.:

TravelCenters of America Inc. (Nasdaq: TA) is the nation's largest publicly traded full-service travel center network. Founded in 1972 and headquartered in Westlake, Ohio, its nearly 20,000 employees serve customers in over 270 locations in 44 states and Canada, principally under the TA®, Petro Stopping Centers® and TA Express® brands. Offerings include diesel and gasoline fuel, convenience stores, truck maintenance and repair, full-service and quick-service restaurants, car and truck parking and other services and amenities dedicated to providing great experiences for professional drivers and the general motoring public. TravelCenters of America operates nearly 650 full-service and quick-service restaurants and 10 proprietary brands, including Quaker Steak and Lube®, Iron Skillet® and Country Pride®. For more information, visit www.ta-petro.com.


Contacts

Kristin Brown, Director, Investor Relations
(617) 796-8251
www.ta-petro.com

DUBLIN--(BUSINESS WIRE)--The "Europe Offshore Pipeline Market Forecast to 2027 - COVID-19 Impact and Regional Analysis by Diameter, Line Type, and Product" report has been added to ResearchAndMarkets.com's offering.


The Europe offshore pipeline market is expected to grow from US$ 4,959.17 million in 2019 to US$ 6,612.02 million by 2027; it is estimated to grow at a CAGR of 3.9% from 2020 to 2027.

Increasing demand for natural gas and crude oil drives the growth of the Europe offshore pipeline market. The markets in the UK and Germany are presenting the most considerable growth. The robust surge in petrochemical demand in Europe resulted in increased consumption. Rise in industrial production and high demand for trucking services boost the need for petrochemicals, thereby fueling the growth of the market across the region. Moreover, growing air traffic volumes across Europe is another factor increasing oil consumption. Europe is witnessing high demand for natural gas owing to rise in use of natural gas in diverse industrial sectors. Surge in demand for oil & gas is attributed to increasing industrialization and urbanization. Several oil & gas companies across the region are increasing their offshore exploration & production (E&P) activities to meet the constantly rising energy demand. One of the significant oil & gas pipeline projects across Europe is Nord Stream 2 Gas Pipeline (Russia), which may get launched by the end of 2020. Rising demand for oil & gas increases E&P activities, which, in turn, supports the growth of the Europe offshore pipeline market.

Countries in Europe, especially the UK and Russia, are adversely affected by the COVID-19 pandemic. In Europe, several countries are suffering an economic downturn and decline in business activities across the oil & gas sector due to the drop in oil prices in the first quarter of 2020. Many of these countries are implementing drastic measures on activities of imports and exports, and shipment of goods by partially closing their borders. The restrictions are hindering the demand for energy in various industry verticals, which restrains the growth of Europe offshore pipeline market.

The impact of the COVID-19 outbreak varies from country to country across Europe as countries are reporting a surge in the number of confirmed cases, and are imposing stringent and more extended lockdown or social isolation. The measures are disrupting businesses industry verticals and the demand for oil commodities. The lockdown is hindering the offshore pipeline market in Europe owing to the disruption in oil & gas sector across countries. However, several industries across a few countries are reopening and subsequently are driving the demand for energy is expected to resume the construction of oil & gas activities to support the growth. Thus, the market is projected to recover steadily over the coming period and gain traction for offshore pipelines across Europe during the forecast period.

Based on product, the refined products segment led the Europe offshore pipeline market in 2019. The refined products segment comprises pipelines used to distribute all oil & gas related refined final products to the customers. For instance, the distribution of natural gas is mostly done through pipelines. Also, liquid fertilizers are primarily transmitted through long distances pipelines. Additionally, LNG transported through ships requires short pipelines for connecting the vessel and onshore storage tanks. The surge in industrialization and urbanization across Europe is expected to accelerate the demand for refined products in coming years, which would drive the Europe offshore pipeline market during the forecast period.

Reasons to Buy

  • Save and reduce time carrying out entry-level research by identifying the growth, size, leading players and segments in the Europe offshore pipeline market.
  • Highlights key business priorities in order to assist companies to realign their business strategies
  • The key findings and recommendations highlight crucial progressive industry trends in the Europe offshore pipeline market, thereby allowing players across the value chain to develop effective long-term strategies
  • Develop/modify business expansion plans by using substantial growth offering developed and emerging markets
  • Scrutinize in-depth Europe market trends and outlook coupled with the factors driving the offshore pipeline market, as well as those hindering it
  • Enhance the decision-making process by understanding the strategies that underpin commercial interest with respect to client products, segmentation, pricing and distribution

Market Dynamics

Drivers

  • Increase in the Demand for Natural Gas and Crude Oil
  • Demand for Safe, Cost-Effective, and Efficient Connectivity

Restraints

  • Issues Related to Cross- Border Pipeline Transportation

Opportunities

  • Exploration of New Oil & Gas Reserves

Future Trends

  • Enhancements in Flexible Pipe Technology

Companies Mentioned

  • Bechtel Corporation
  • Fugro
  • John Wood Group PLC
  • Larsen & Toubro Limited
  • McDermott International, Inc.
  • Petrofac Limited
  • Saipem S.p.A
  • Sapura Energy Berhad
  • Subsea 7 S.A.
  • TechnipFMC plc

For more information about this report visit https://www.researchandmarkets.com/r/bbo4ps


Contacts

ResearchAndMarkets.com
Laura Wood, Senior Press Manager
This email address is being protected from spambots. You need JavaScript enabled to view it.
For E.S.T Office Hours Call 1-917-300-0470
For U.S./CAN Toll Free Call 1-800-526-8630
For GMT Office Hours Call +353-1-416-8900

EAST AURORA, N.Y.--(BUSINESS WIRE)--The Board of Directors of Moog Inc. (NYSE: MOG.A and MOG.B) has declared a quarterly dividend of $.25 per share on the Company’s issued and outstanding shares of Class A common stock and Class B common stock. The dividend will be paid on March 1, 2021 to all shareholders of record as of the close of business on February 12, 2021.

The dividend represents a use of cash of approximately $8 million. Future declarations of quarterly dividends are subject to the determination and discretion of Moog’s Board of Directors.

Moog Inc. is a worldwide designer, manufacturer, and integrator of precision control components and systems. Moog’s high-performance systems control military and commercial aircraft, satellites and space vehicles, launch vehicles, missiles, automated industrial machinery, marine and medical equipment. Additional information about the company can be found at www.moog.com.

Cautionary Statement

Information included or incorporated by reference in this report that does not consist of historical facts, including statements accompanied by or containing words such as “may,” “will,” “should,” “believes,” “expects,” “expected,” “intends,” “plans,” “projects,” “approximate,” “estimates,” “predicts,” “potential,” “outlook,” “forecast,” “anticipates,” “presume” and “assume,” are forward-looking statements. Such forward-looking statements are made pursuant to the safe harbor provisions of the Private Securities Litigation Reform Act of 1995. These forward-looking statements reflect the Company’s current views with respect to certain current and future events and financial performance and are not guarantees of future performance. This includes but is not limited to, the Company’s expectation and ability to pay a quarterly cash dividend on its common stock in the future, subject to the determination by the board of directors, and based on an evaluation of company earnings, financial condition and requirements, business conditions, capital allocation determinations and other factors, risks and uncertainties. The impact or occurrence of these could cause actual results to differ materially from the expected results described in the forward-looking statements. These important factors, risks and uncertainties include:

COVID-19 Pandemic Risks

  • We face various risks related to health pandemics such as the global COVID-19 pandemic, which may have material adverse consequences on our operations, financial position, cash flows, and those of our customers and suppliers.

Strategic Risks

  • We operate in highly competitive markets with competitors who may have greater resources than we possess;
  • Our new products and technology research and development efforts are substantial and may not be successful which could reduce our sales and earnings;
  • Our inability to adequately enforce and protect our intellectual property or defend against assertions of infringement could prevent or restrict our ability to compete; and
  • Our sales and earnings may be affected if we cannot identify, acquire or integrate strategic acquisitions, or as we conduct divestitures.

Market Condition Risks

  • The markets we serve are cyclical and sensitive to domestic and foreign economic conditions and events, which may cause our operating results to fluctuate;
  • We depend heavily on government contracts that may not be fully funded or may be terminated, and the failure to receive funding or the termination of one or more of these contracts could reduce our sales and increase our costs;
  • The loss of The Boeing Company as a customer or a significant reduction in sales to The Boeing Company could adversely impact our operating results; and
  • We may not realize the full amounts reflected in our backlog as revenue, which could adversely affect our future revenue and growth prospects.

Operational Risks

  • Our business operations may be adversely affected by information systems interruptions, intrusions or new software implementations;
  • We may not be able to prevent, or timely detect, issues with our products and our manufacturing processes which may adversely affect our operations and our earnings;
  • If our subcontractors or suppliers fail to perform their contractual obligations, our prime contract performance and our ability to obtain future business could be materially and adversely impacted; and
  • The failure or misuse of our products may damage our reputation, necessitate a product recall or result in claims against us that exceed our insurance coverage, thereby requiring us to pay significant damages.

Financial Risks

  • We make estimates in accounting for over-time contracts, and changes in these estimates may have significant impacts on our earnings;
  • We enter into fixed-price contracts, which could subject us to losses if we have cost overruns;
  • Our indebtedness and restrictive covenants under our credit facilities could limit our operational and financial flexibility;
  • The phase out of LIBOR may negatively impact our debt agreements and financial position, results of operations and liquidity;
  • Significant changes in discount rates, rates of return on pension assets, mortality tables and other factors could adversely affect our earnings and equity and increase our pension funding requirements;
  • A write-off of all or part of our goodwill or other intangible assets could adversely affect our operating results and net worth; and
  • Unforeseen exposure to additional income tax liabilities may affect our operating results.

Legal and Compliance Risks

  • Contracting on government programs is subject to significant regulation, including rules related to bidding, billing and accounting standards, and any false claims or non-compliance could subject us to fines, penalties or possible debarment;
  • Our operations in foreign countries expose us to political and currency risks and adverse changes in local legal and regulatory environments;
  • Government regulations could limit our ability to sell our products outside the United States and otherwise adversely affect our business;
  • We are involved in various legal proceedings, the outcome of which may be unfavorable to us; and
  • Our operations are subject to environmental laws, and complying with those laws may cause us to incur significant costs.

General Risks

  • The United Kingdom's decision to exit the European Union may result in short-term and long-term adverse impacts on our results of operations;
  • Escalating tariffs, restrictions on imports or other trade barriers between the United States and various countries may impact our results of operations;
  • Future terror attacks, war, natural disasters or other catastrophic events beyond our control could negatively impact our business; and
  • Our performance could suffer if we cannot maintain our culture as well as attract, retain and engage our employees.

These factors are not exhaustive. New factors, risks and uncertainties may emerge from time to time that may affect the forward-looking statements made herein. Given these factors, risks and uncertainties, investors should not place undue reliance on forward-looking statements as predictive of future results. We disclaim any obligation to update the forward-looking statements made in this report.


Contacts

Ann Marie Luhr
716-687-4225

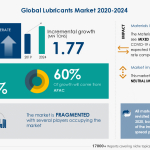
LONDON--(BUSINESS WIRE)--#GlobalLubricantsMarket--The lubricants market is poised to grow by 1.77 mn tons during 2020-2024, progressing at a CAGR of almost 1% during the forecast period.


Worried about the impact of COVID-19 on your Business? Here is an Exclusive report talking about Market scenarios, Estimates, the impact of lockdown, and Customer Behaviour.

Get FREE Sample Report in Minutes!

The report on the lubricants market provides a holistic update, market size and forecast, trends, growth drivers, and challenges, as well as vendor analysis.

The report offers an up-to-date analysis regarding the current global market scenario and the overall market environment. The market is driven by increasing demand from end-user industries.

The lubricants market analysis includes product segment and geography landscape. This study identifies the high growth of the construction industry in APAC as one of the prime reasons driving the lubricants market growth during the next few years.

This report presents a detailed picture of the market by the way of study, synthesis, and summation of data from multiple sources by an analysis of key parameters.

The lubricants market covers the following areas:

Lubricants Market Sizing

Lubricants Market Forecast

Lubricants Market Analysis

Companies Mentioned

  • BP Plc
  • Chevron Corp.
  • Exxon Mobil Corp.
  • FUCHS PETROLUB SE
  • Idemitsu Kosan Co. Ltd.
  • PetroChina Co. Ltd.
  • Petroliam Nasional Berhad
  • Royal Dutch Shell Plc
  • Total SA
  • Valvoline Inc. 

Related Reports on Materials Include:

  • Grease Market by End-user and Geography - Forecast and Analysis 2020-2024- The grease market size has the potential to grow by USD 217.66 million during 2020-2024, and the market’s growth momentum will accelerate at a CAGR of 1.81%. To get extensive research insights: Click and get FREE sample report in minutes
  • Strontium Market by End-user and Geography - Forecast and Analysis 2020-2024- The strontium market size has the potential to grow by 34.10 thousand MT during 2020-2024, and the market’s growth momentum will accelerate at a CAGR of 3.20%. To get extensive research insights: Click and get FREE sample report in minutes

Key Topics Covered:

Executive Summary

Market Landscape

  • Market ecosystem
  • Value chain analysis

Market Sizing

  • Market definition
  • Market segment analysis
  • Market size 2019
  • Market outlook: Forecast for 2019 - 2024

Five Forces Analysis

  • Five forces summary
  • Bargaining power of buyers
  • Bargaining power of suppliers
  • Threat of new entrants
  • Threat of substitutes
  • Threat of rivalry
  • Market condition

Market Segmentation by Product

  • Market segments
  • Comparison by Product
  • Mineral-oil based lubricants - Market size and forecast 2019-2024
  • Synthetic lubricants - Market size and forecast 2019-2024
  • Bio-based lubricants - Market size and forecast 2019-2024
  • Market opportunity by Product

Market Segmentation by Application

  • Market segments
  • Comparison by Application
  • Automotive oils - Market size and forecast 2019-2024
  • Industrial oils - Market size and forecast 2019-2024
  • Process oils - Market size and forecast 2019-2024
  • Metalworking fluids - Market size and forecast 2019-2024
  • Greases - Market size and forecast 2019-2024
  • Market opportunity by Application

Customer landscape

Geographic Landscape

  • Geographic segmentation
  • Geographic comparison
  • APAC - Market size and forecast 2019-2024
  • Europe - Market size and forecast 2019-2024
  • North America - Market size and forecast 2019-2024
  • MEA - Market size and forecast 2019-2024
  • South America - Market size and forecast 2019-2024
  • Key leading countries
  • Market opportunity by geography
  • Market drivers
  • Market challenges
  • Market trends

Vendor Landscape

  • Overview
  • Vendor landscape
  • Landscape disruption

Vendor Analysis

  • Vendors covered
  • Market positioning of vendors
  • BP Plc
  • Chevron Corp.
  • Exxon Mobil Corp.
  • FUCHS PETROLUB SE
  • Idemitsu Kosan Co. Ltd.
  • PetroChina Co. Ltd.
  • Petroliam Nasional Berhad
  • Royal Dutch Shell Plc
  • Total SA
  • Valvoline Inc.

Appendix

  • Scope of the report
  • Currency conversion rates for US$
  • Research methodology
  • List of abbreviations

Technavio suggests three forecast scenarios (optimistic, probable, and pessimistic) considering the impact of COVID-19. Technavio’s in-depth research has direct and indirect COVID-19 impacted market research reports.

Register for a free trial today and gain instant access to 17,000+ market research reports.

Technavio's SUBSCRIPTION platform

About Us

Technavio is a leading global technology research and advisory company. Their research and analysis focuses on emerging market trends and provides actionable insights to help businesses identify market opportunities and develop effective strategies to optimize their market positions. With over 500 specialized analysts, Technavio’s report library consists of more than 17,000 reports and counting, covering 800 technologies, spanning across 50 countries. Their client base consists of enterprises of all sizes, including more than 100 Fortune 500 companies. This growing client base relies on Technavio’s comprehensive coverage, extensive research, and actionable market insights to identify opportunities in existing and potential markets and assess their competitive positions within changing market scenarios.


Contacts

Technavio Research
Jesse Maida
Media & Marketing Executive
US: +1 844 364 1100
UK: +44 203 893 3200
Email: This email address is being protected from spambots. You need JavaScript enabled to view it.
Website: www.technavio.com/

ALEXANDRIA, Va.--(BUSINESS WIRE)--VSE Corporation (NASDAQ: VSEC), a leading provider of aftermarket distribution and maintenance, repair and overhaul (MRO) services for land, sea and air transportation assets in the public and private sectors, today announced that it has priced its previously announced underwritten public offering of 1,428,600 shares of its common stock at a price to the public of $35.00 per share. VSE has also granted the underwriters a 30-day option to purchase up to an additional 214,290 shares. The offering is expected to close on February 2, 2021, subject to the satisfaction of customary closing conditions.


Net proceeds from the offering are expected to be approximately $47 million after deducting underwriting discounts and commissions and before estimated offering expenses. VSE expects to use the net proceeds from this offering for general corporate purposes, which may include among other things, financing strategic acquisitions, working capital requirements for new program launches, and repaying outstanding borrowings under its revolving credit facility.

William Blair & Company, L.L.C. and Canaccord Genuity LLC are acting as joint book-running managers and representatives of the underwriters for the offering. B. Riley Securities, Inc. and The Benchmark Company, LLC are serving as co-managers for the offering.

A shelf registration statement relating to the securities being offered has been filed with the Securities and Exchange Commission (the “SEC”) and has been declared effective. This press release does not constitute an offer to sell or the solicitation of an offer to buy any securities described herein, nor shall there be any sale of the securities in any state or jurisdiction in which such an offer, solicitation or sale would be unlawful prior to registration or qualification under the securities law of any such jurisdiction. The offering is being made only by means of a preliminary prospectus supplement and accompanying prospectus. A preliminary prospectus supplement and accompanying prospectus relating to the offering have been filed with the SEC and are available free of charge on the SEC’s website at http://www.sec.gov. Copies of the preliminary prospectus supplement and accompanying prospectus relating to this offering of securities may also be obtained from William Blair & Company, L.L.C., Attention: Prospectus Department, 150 North Riverside Plaza, Chicago, Illinois 60606, by telephone at (800) 621-0687 or by email at This email address is being protected from spambots. You need JavaScript enabled to view it. or Canaccord Genuity LLC, Attention: Syndicate Department, 99 High Street, 12th Floor, Boston, MA 02110, or by email at This email address is being protected from spambots. You need JavaScript enabled to view it..

ABOUT VSE CORPORATION

VSE is a leading provider of aftermarket distribution and repair services for land, sea and air transportation assets for government and commercial markets. Core services include maintenance, repair and overhaul (MRO) services, parts distribution, supply chain management and logistics, engineering support, and consulting and training services for global commercial, federal, military and defense customers. VSE also provides information technology and energy consulting services. For additional information regarding VSE’s services and products, visit us at www.vsecorp.com.

FORWARD-LOOKING STATEMENTS

This press release may contain statements that, to the extent they are not recitations of historical fact, constitute "forward looking statements" within the meaning of applicable U.S. federal securities laws. All such statements are intended to be covered by the safe harbor provisions for forward-looking statements contained in the Private Securities Litigation Reform Act of 1995 and includes this statement for purposes of such safe harbor provisions.

“Forward-looking” statements, as such term is defined by the SEC in its rules, regulations and releases, represent our expectations or beliefs, including, but not limited to, statements concerning our operations, economic performance, financial condition, growth and acquisition strategies, investments and future operational plans. Without limiting the generality of the foregoing, words such as “may,” “will,” “expect,” “believe,” “anticipate,” “intend,” “forecast,” “seek,” “plan,” “predict,” “project,” “could,” “estimate,” “might,” “continue,” “seeking” or the negative or other variations thereof or comparable terminology are intended to identify forward-looking statements.

These statements speak only as of the date of this press release and we undertake no ongoing obligation, other than that imposed by law, to update these statements. These statements relate to, among other things, our intent, belief or current expectations with respect to: our future financial condition, results of operations or prospects; our business and growth strategies; and our financing plans and forecasts. You are cautioned that any such forward-looking statements are not guarantees of future performance and involve significant risks and uncertainties, and that actual results may differ materially from those contained in or implied by the forward-looking statements as a result of various factors, some of which are unknown, including, without limitation:

  • delays in contract awards and funding due to uncertain government budgets and shifting government priorities;
  • the impact on our business, results of operations and financial condition from the ongoing and global COVID-19 pandemic, or any other pandemic, epidemic or outbreak of infectious disease in the United States or globally;
  • intense competition from existing and new competitors;
  • our ability to renew and/or maintain certain programs that comprise a material portion of our revenue;
  • changes in procurement processes and government regulations and our ability to comply with such requirements;
  • the performance of the aviation aftermarket, which could be impacted by lower demand for business aviation and commercial air travel or airline fleet changes causing lower demand for our goods and services;
  • our ability to successfully execute our acquisition strategy;
  • changes in future business conditions, which could negatively impact our business investments, recorded goodwill, and/or purchased intangible assets;
  • the adverse impact of government audits or investigations on our business;
  • changes in governmental rules and regulations, including with respect to environmental matters, and related costs and liabilities;
  • adverse economic conditions in the United States and globally;
  • security threats, including cyber security threats, and related disruptions;
  • our dependence on access to and performance of third‑party package delivery companies;
  • our high level of indebtedness;
  • our ability to raise capital to fund our operations; and
  • the other risk factors mentioned under Item 1A, “Risk Factors” in our Annual Report on Form 10-K for the year ended December 31, 2019, our subsequent Quarterly Reports on Form 10-Q for the quarters ended March 31, 2020 and June 30, 2020 and our other filings with the SEC from time to time.

You are advised, however, to consult any further disclosures we make on related subjects in our periodic reports on Forms 10-K, 10-Q or 8-K filed or furnished to the SEC.


Contacts

INVESTOR RELATIONS:
Noel Ryan | Phone: 720.778.2415 | This email address is being protected from spambots. You need JavaScript enabled to view it.

The Port’s Future is Bright

HOUSTON--(BUSINESS WIRE)--The Port Commission of the Port of Houston Authority held its first meeting of the year on Tuesday.


Port Chairman Ric Campo began the meeting by expressing his appreciation for the efforts of Houston Ship Channel partners, including federal officials and industry stakeholders and Port Authority staff, as Project 11 (the Houston Ship Channel Improvement program) achieved two significant milestones.

Earlier this month, Project 11 received a “new start” designation, and $19.5 million in federal funds were included in the U.S. Army Corps of Engineers 2021 work program to support its work to widen and deepen the channel. This followed authorization of Project 11 in the Water Resources and Development Act of 2020, as part of a larger legislative package passed by Congress in December.

“The significance of this appropriation is tremendous, as it paves the way to a clearer and smoother path to the start of construction,” Chairman Campo said. He underlined the importance of the designation, adding that “there is only one new start designation for a major deep-water channel in the U.S. each year.”

Chairman Campo emphasized that channel partners “were essential in pushing this decision over the top in the 11th hour.” Chairman Campo also laid out key priorities to keep Project 11 moving forward to be “turning dirt” later this year.

Executive Director Roger Guenther highlighted achievements and accomplishments made in 2020 in his staff report to the Commission.

He said that despite the challenges due to the pandemic, Port Houston handled 2.99 million twenty-foot equivalent container units (TEU) in 2020. This mark fell “just shy” of last year’s record by only 828 TEU. Guenther described that as “about a half-day’s work on one ship with three gangs (work crews) working.”

In his report, Guenther also said that there is a bright future for the port that “can only get better” saying that the public container terminals have taken off with a rapid start in 2021. He showcased an aerial photo of the first ship to use six cranes that boasted the second-largest lift count (cranes moving containers from ships) on a vessel operation at Port Houston’s public facilities.

Guenther said that this activity demonstrates the “pent-up demand” by carriers to bring larger vessels to the port, and the urgency to complete Project 11.

The staff briefing included an update and discussion on the Port Authority’s recent draft Disparity Study and Small Business Development Program. Port Authority staff has been “working diligently” on developing recommendations “for a race- and gender- conscious supplier diversity program for Port Commission consideration.”

Chairman Campo said, “Initial discussions will take place with the Commission’s Procurement and Small Business Task Force, to develop elements of a MWBE program to enhance the Port Authority’s Small Business program.”

He described the process to include creating policy, identifying resources, developing a budget, and defining program activities, with an advisory and peer review.

Chairman Campo said, “We will push forward to identify steps to successful preparation and implementation of this program.”

Port Houston has also released its Clean Air Strategy Plan draft: https://porthouston.com/environment/air-quality/.

The Clean Air Strategy Plan Draft will be available for public comment until Feb. 24. The public may email comments to: This email address is being protected from spambots. You need JavaScript enabled to view it..

The next regular Port Commission meeting is scheduled for Feb. 23.

About Port Houston

For more than 100 years, Port Houston has owned and operated the public wharves and terminals along the Houston Ship Channel, including the area’s largest breakbulk facility and two of the most efficient and fastest-growing container terminals in the country. Port Houston is the advocate and a strategic leader for the Channel. The Houston Ship Channel complex and its more than 200 public and private terminals, collectively known as the Port of Houston, is the nation’s largest port for waterborne tonnage and an essential economic engine for the Houston region, the state of Texas, and the U.S. The Port of Houston supports the creation of nearly 1.35 million jobs in Texas and 3.2 million jobs nationwide, and economic activity totaling $339 billion in Texas – 20.6 percent of Texas’ total gross domestic product (GDP) – and $801.9 billion in economic impact across the nation. For more information, visit the website at www.PortHouston.com.


Contacts

Lisa Ashley, Director, Media Relations
Office: 713-670-2644; Mobile: 832-247-8179
E-mail: This email address is being protected from spambots. You need JavaScript enabled to view it.

DUBLIN--(BUSINESS WIRE)--The "Global Thermal Energy Storage Market - Forecasts from 2020 to 2025" report has been added to ResearchAndMarkets.com's offering.


The global thermal energy storage market is evaluated at US$4.204 billion for the year 2019 growing at a CAGR of 12.38% reaching the market size of US$8.466 billion by the year 2025.

Thermal energy storage is the technology that is used to store thermal energy by varying the temperature so that it can be used later for different purposes. The market is majorly driven by the fact that with a significant depletion in the availability of fossil resources and also the negative impact of these resources on nature, the demand for renewable and more sustainable resources has increased significantly. Renewable energies such as ocean waves, solar radiation, wind and biogas. Thermal energy storage systems are used majorly in building and industrial processes. A thermal energy storage has ample number of advantages like, increase in overall efficiency and also provides more reliability. A key factor which drives the market is that thermal energy storage also proves to be economically better as it takes lesser amount of investment and incurs lower running costs. Moreover, there has been a significant increase in the demand of thermal energy storage solutions owing to the increased applications like, heating, ventilating and HVACs.

The advent of COVID-19 had an adverse impact on the market since the pandemic brought the activities in various industries to a standstill including all the oil & gas and renewable energy plants across several countries and slowed the growth of the thermal energy storage market to a significant level in the year 2020. With the industries getting back on the track and recovering after suffering losses due to the pandemic, major activities like production and exploration have resumed. The growth of the thermal energy storage market is expected to show gradual increase initially but is expected to witness rapid growth after the industries resume full-fledged activities in the coming years.

Increasing demand of energy storage owing to the increasing levels of energy generation

The increasing demand of thermal energy storage solutions is majorly due to a significant increase in the solar power generation globally. According to the International Renewable Energy Agency, the rapid increase in the generation of renewable sources of energy can help to reduce the Co2 emissions according to the Paris Climate targets that are to be achieved by 2050. Moreover, according to the data of International Renewable Energy Agency, the generation of electricity through solar resources has increased exponentially over the years with 131,462 GwH in 2013 to 549,833 GwH in 2018. With such an immense rate of solar power generation and increasing number of plants being operated, the demand for thermal energy storage solutions is expected to witness a rapid rise during the forecast period.

Molten salt storage is expected to have a significant share

The thermal energy storage with molten salt type is expected to have a significant share in the market during the forecast period owing to its economic advantages over its counterparts. The molten salt in storage in concentrated solar power plants is one of the cheapest ways to store thermal energy for long hours. Moreover, the molten salt storage has large scale storage capacity and higher boiling points compared to others. The system also provides with higher volumetric heat capacities due to which the system is preferred by ample customers.

Companies Mentioned

  • BrightSource Energy Inc.
  • Aalborg CSP A/S
  • Abengoa SA
  • Baltimore Aircoil Company
  • Burns & McDonnell
  • SaltX Technology Holding AB
  • Caldwell Energy Company
  • Terrafore Technologies LLC
  • Trane Technologies plc
  • Cristopia Energy Systems

Key Topics Covered:

1. Introduction

2. Research Methodology

3. Executive Summary

4. Market Dynamics

4.1. Market Drivers

4.2. Market Restraints

4.3. Porters Five Forces Analysis

4.4. Industry Value Chain Analysis

5. Thermal Energy Storage Market Analysis, by Type

5.1. Introduction

5.2. Molten salt

5.3. Chilled Water

5.4. Heat

5.5. Ice

5.6. Others

6. Thermal Energy Storage Market Analysis, by Application

6.1. Introduction

6.2. Power Generation

6.3. Heating & Cooling

7. Thermal Energy Storage Market Analysis, by Technology

7.1. Introduction

7.2. Sensible Heat storage

7.3. Latent Heat storage

7.4. Thermochemical heat storage

8. Thermal energy storage Market Analysis, by Geography

8.1. Introduction

8.2. North America

8.3. South America

8.4. Europe

8.5. Middle East and Africa

8.6. Asia Pacific

9. Competitive Environment and Analysis

9.1. Major Players and Strategy Analysis

9.2. Emerging Players and Market Lucrativeness

9.3. Mergers, Acquisitions, Agreements, and Collaborations

9.4. Vendor Competitiveness Matrix

10. Company Profiles

For more information about this report visit https://www.researchandmarkets.com/r/4ax9vb


Contacts

ResearchAndMarkets.com
Laura Wood, Senior Press Manager
This email address is being protected from spambots. You need JavaScript enabled to view it.
For E.S.T Office Hours Call 1-917-300-0470
For U.S./CAN Toll Free Call 1-800-526-8630
For GMT Office Hours Call +353-1-416-8900

ALEXANDRIA, Va.--(BUSINESS WIRE)--VSE Corporation (NASDAQ: VSEC), a leading provider of aftermarket distribution and maintenance, repair and overhaul (MRO) services for land, sea and air transportation assets in the public and private sectors, today announced it has commenced an underwritten public offering, subject to market and other conditions, of shares of its common stock pursuant to an effective shelf registration statement. In addition, VSE intends to grant the underwriters an option for a period of 30 days to purchase up to an additional 15% of the shares of common stock offered in the public offering.


VSE expects to use the net proceeds from this offering for general corporate purposes, which may include among other things, financing strategic acquisitions, working capital requirements for new program launches, and repaying outstanding borrowings under its revolving credit facility.

William Blair & Company, L.L.C. and Canaccord Genuity LLC are acting as joint book-running managers and representatives of the underwriters for the offering.

A shelf registration statement relating to the securities being offered has been filed with the Securities and Exchange Commission (the “SEC”) and has been declared effective. This press release does not constitute an offer to sell or the solicitation of an offer to buy any securities described herein, nor shall there be any sale of the securities in any state or jurisdiction in which such an offer, solicitation or sale would be unlawful prior to registration or qualification under the securities law of any such jurisdiction. The offering is being made only by means of a preliminary prospectus supplement and accompanying prospectus. A preliminary prospectus supplement and accompanying prospectus relating to the offering have been filed with the SEC and are available free of charge on the SEC’s website at http://www.sec.gov. Copies of the preliminary prospectus supplement and accompanying prospectus relating to this offering of securities may also be obtained from William Blair & Company, L.L.C., Attention: Prospectus Department, 150 North Riverside Plaza, Chicago, Illinois 60606, by telephone at (800) 621-0687 or by email at This email address is being protected from spambots. You need JavaScript enabled to view it. or Canaccord Genuity LLC, 99 High Street, 12th Floor, Boston, MA 02110, Attention: Syndicate Department, or by email at This email address is being protected from spambots. You need JavaScript enabled to view it..

ABOUT VSE CORPORATION

VSE is a leading provider of aftermarket distribution and repair services for land, sea and air transportation assets for government and commercial markets. Core services include maintenance, repair and overhaul (MRO) services, parts distribution, supply chain management and logistics, engineering support, and consulting and training services for global commercial, federal, military and defense customers. VSE also provides information technology and energy consulting services. For additional information regarding VSE’s services and products, visit us at www.vsecorp.com.

FORWARD-LOOKING STATEMENTS

This press release may contain statements that, to the extent they are not recitations of historical fact, constitute "forward looking statements" within the meaning of applicable U.S. federal securities laws. All such statements are intended to be covered by the safe harbor provisions for forward-looking statements contained in the Private Securities Litigation Reform Act of 1995 and includes this statement for purposes of such safe harbor provisions.

“Forward-looking” statements, as such term is defined by the SEC in its rules, regulations and releases, represent our expectations or beliefs, including, but not limited to, statements concerning our operations, economic performance, financial condition, growth and acquisition strategies, investments and future operational plans. Without limiting the generality of the foregoing, words such as “may,” “will,” “expect,” “believe,” “anticipate,” “intend,” “forecast,” “seek,” “plan,” “predict,” “project,” “could,” “estimate,” “might,” “continue,” “seeking” or the negative or other variations thereof or comparable terminology are intended to identify forward-looking statements.

These statements speak only as of the date of this press release and we undertake no ongoing obligation, other than that imposed by law, to update these statements. These statements relate to, among other things, our intent, belief or current expectations with respect to: our future financial condition, results of operations or prospects; our business and growth strategies; and our financing plans and forecasts. You are cautioned that any such forward-looking statements are not guarantees of future performance and involve significant risks and uncertainties, and that actual results may differ materially from those contained in or implied by the forward-looking statements as a result of various factors, some of which are unknown, including, without limitation:

  • delays in contract awards and funding due to uncertain government budgets and shifting government priorities;
  • the impact on our business, results of operations and financial condition from the ongoing and global COVID-19 pandemic, or any other pandemic, epidemic or outbreak of infectious disease in the United States or globally;
  • intense competition from existing and new competitors;
  • our ability to renew and/or maintain certain programs that comprise a material portion of our revenue;
  • changes in procurement processes and government regulations and our ability to comply with such requirements;
  • the performance of the aviation aftermarket, which could be impacted by lower demand for business aviation and commercial air travel or airline fleet changes causing lower demand for our goods and services;
  • our ability to successfully execute our acquisition strategy;
  • changes in future business conditions, which could negatively impact our business investments, recorded goodwill, and/or purchased intangible assets;
  • the adverse impact of government audits or investigations on our business;
  • changes in governmental rules and regulations, including with respect to environmental matters, and related costs and liabilities;
  • adverse economic conditions in the United States and globally;
  • security threats, including cyber security threats, and related disruptions;
  • our dependence on access to and performance of third-party package delivery companies;
  • our high level of indebtedness;
  • our ability to raise capital to fund our operations; and
  • the other risk factors mentioned under Item 1A, “Risk Factors” in our Annual Report on Form 10-K for the year ended December 31, 2019, our subsequent Quarterly Reports on Form 10-Q for the quarters ended March 31, 2020 and June 30, 2020 and our other filings with the SEC from time to time.

You are advised, however, to consult any further disclosures we make on related subjects in our periodic reports on Forms 10-K, 10-Q or 8-K filed or furnished to the SEC.


Contacts

INVESTOR RELATIONS CONTACT: Noel Ryan | Phone: 720.778.2415 | This email address is being protected from spambots. You need JavaScript enabled to view it.

DUBLIN--(BUSINESS WIRE)--The "Flue Gas Desulfurization Market Forecast to 2027 - COVID-19 Impact and Global Analysis By Type (Dry FGD and Wet FGD) and Application (Power Generation, Chemical, Iron and Steel, Cement Manufacturing, and Others)" report has been added to ResearchAndMarkets.com's offering.


The market was valued at US$ 18,128.01 million in 2019 and is projected to reach US$ 27,655.04 million by 2027; it is expected to grow at a CAGR of 5.6% from 2020 to 2027

Increasing demand from power and energy sector to escalate flue gas desulfurization market growth

The demand for flue gas desulfurization is rising across diversified end-use industries. Further, rapid industrialization and strategic initiatives taken by the manufacturers are expected to proliferate the growth of the market. Additionally, technological advancements in the designing of FGD systems are expected to provide ample opportunities for market growth.

Power facilities are the most extensive generators of SO2. When SO2 combines with moisture in clouds, it forms acid rain. Incorporation of flue gas desulfurization systems lessens SO2 emissions by 98%. According to the International Energy Agency, the coal-fired power plants produce about 37% of the globe's electricity, making them the largest single electricity generation source worldwide. However, such plants are bound to release pollutants, especially sulfur, which deteriorates the quality of environment.

Chiyoda Corporation; Ducon; General Electric; S.A Hamon; Mitsubishi Heavy Industries, Ltd.; Rafako S.A; Valmet; Doosan Lentjes; Babcock and Wilcox Enterprises, Inc.; and Marsulex Environmental Technologies are among the well-established players in the flue gas desulfurization market.

Impact of COVID-19 Pandemic on Flue Gas Desulfurization Market

As of December 2020, the US, Brazil, India, Russia, Spain, and the UK are among the worst-affected countries in terms confirmed COVID-19 cases and reported deaths. The COVID-19 has been affecting economies and industries in various countries due to lockdowns, travel bans, and business shutdowns.

Food & beverages is one the world's major industries suffering serious disruptions such as supply chain breaks, technology events cancellations, and office shutdowns as a result of this outbreak. For instance, China is the global hub of manufacturing and the largest raw material supplier for various industries, and it is also one of the worst-affected countries. The lockdown of various plants and factories in China is affecting the global supply chains and negatively impacting the manufacturing, delivery schedules, and sales of various materials.

Various companies have already announced possible delays in product deliveries and slump in future sales of their products. In addition, the global travel bans imposed by countries in Europe, Asia, and North America are affecting the business collaborations and partnerships opportunities. All these factors are anticipated to affect the industries in a negative manner and thus act as restraining factors for the growth of various markets related to this industry in the coming months.

Key Topics Covered:

1. Introduction

1.1 Study Scope

1.2 Report Guidance

1.3 Market Segmentation

2. Key Takeaways

3. Research Methodology

3.1 Scope of the Study

3.2 Research Methodology

4. Flue Gas Desulfurization Market Landscape

4.1 Market Overview

4.2 PEST Analysis

4.3 Expert Opinion

5. Flue Gas Desulfurization Market - Key Market Dynamics

5.1 Market Drivers

5.1.1 Increasing Demand from Power & Energy Sector

5.1.2 Stringent Rules and Regulations By The Government

5.2 Market Restraints

5.2.1 High Cost of Reagents and Safety Concerns Associated with FGD System

5.3 Market Opportunities

5.3.1 Rising Demand for Flue Gas Desulfurization Gypsum For Soil Amendment Applications

5.4 Future Trend

5.4.1 Technological Advancements regarding Flue Gas Desulfurization

5.5 Impact Analysis Of Drivers And Restraints

6. Flue Gas Desulfurization - Global Market Analysis

6.1 Flue Gas Desulfurization Market Overview

6.2 Flue Gas Desulfurization Market - Revenue and Forecast to 2027 (US$ Million)

6.3 Market Positioning - Global Market Players

7. Flue Gas Desulfurization Market Analysis - By Type

7.1 Overview

7.2 Flue Gas Desulfurization Market Breakdown, By Type, 2019 and 2027

7.3 Dry FGD

7.4 Wet FGD

8. Global Flue Gas Desulfurization Market Analysis - By Application

8.1 Overview

8.2 Flue Gas Desulfurization Market Breakdown, By Application, 2019 and 2027

8.3 Power Generation

8.4 Chemical

8.5 Iron and Steel

8.6 Cement Manufacturing

9. Flue Gas Desulfurization Market - Geographic Analysis

10. Overview - Impact of COVID-19

11. Industry Landscape

11.1 Overview

11.2 Strategy & Business Planning

11.3 Merger and Acquisition

12. Key Company Profiles

  • Chiyoda Corporation
  • Ducon
  • General Electric
  • S.A Hamon
  • Mitsubishi Heavy Industries, Ltd.
  • Rafako S.A
  • Valmet
  • Doosan Lentjes
  • Babcock and Wilcox Enterprises, Inc.
  • Marsulex Environmental Technologies

For more information about this report visit https://www.researchandmarkets.com/r/r5x3oi


Contacts

ResearchAndMarkets.com
Laura Wood, Senior Press Manager
This email address is being protected from spambots. You need JavaScript enabled to view it.
For E.S.T Office Hours Call 1-917-300-0470
For U.S./CAN Toll Free Call 1-800-526-8630
For GMT Office Hours Call +353-1-416-8900

ALEXANDRIA, Va.--(BUSINESS WIRE)--VSE Corporation (NASDAQ: VSEC), a leading provider of distribution and maintenance, repair and overhaul (MRO) services for land, sea and air transportation assets in the public and private sectors, today announced that it has entered into an exclusive, life-of-program distribution agreement with Pratt & Whitney Canada. Under the terms of the agreement, VSE Aviation will be the exclusive global licensed distributor for new radial parts and inventory of Pratt & Whitney Canada’s APS500 Auxiliary Power Unit (APU) for commercial applications.


Under the terms of the agreement, VSE Aviation is appointed the exclusive licensed distributor for more than 1,500 aftermarket parts and components supporting Pratt & Whitney Canada’s APS500 and the Embraer Regional Jet (ERJ), De Havilland Canada DHC-8 (Dash 8), Gulfstream, Bombardier and Textron aircraft platforms. The agreement term is for the commercial life of the program. The program will be implemented and executed throughout 2021.

“We are very pleased to announce this partnership to support Pratt & Whitney Canada’s APS500 at global MROs, regional airlines and business jet repair centers,” stated John Cuomo, President and CEO of VSE Corporation. “This new award highlights VSE Aviation’s strong technical product expertise and depth of experience managing complex global distribution programs serving the commercial, business jet, and general aviation aftermarket. Further, this award positions us to significantly grow our presence as a leading distributor of flight-critical components, while continuing to leverage the differentiated value proposition we deliver to our customers.”

“This long-term agreement expands our relationship with Pratt & Whitney Canada into APU parts distribution and grows our addressable market into new regional jet platforms, while also broadening our core business jet product portfolio,” stated Ben Thomas, Group President, VSE Aviation. “This announcement, together with our recently announced landing gear initiative, reflects our increased focus on serving high-value products in niche markets. We look forward to supporting Pratt & Whitney Canada as their exclusive solutions partner for this APU in the years ahead.”

“As the APS500 OEM, we will continue to manufacture the APU and provide spare parts to VSE Aviation under an exclusive distribution license,” stated Satheeshkumar Kumarasingam, Vice President of Customer Service, Pratt & Whitney Canada. “We initiated this transaction as part of our ongoing efforts to increase the availability of spare parts to APS500 customers around the world. Given VSE Aviation’s extensive reach into secondary aviation markets, they are well positioned to increase service levels associated with the APS500.”

ABOUT VSE CORPORATION

VSE is a leading provider of aftermarket distribution and repair services for land, sea and air transportation assets for government and commercial markets. Core services include maintenance, repair and overhaul (MRO) services, parts distribution, supply chain management and logistics, engineering support, and consulting and training services for global commercial, federal, military and defense customers. VSE also provides information technology and energy consulting services. For additional information regarding VSE’s services and products, visit us at www.vsecorp.com.

FORWARD LOOKING STATEMENTS

This release contains statements that, to the extent they are not recitations of historical fact, constitute “forward-looking statements” as defined in the Private Securities Litigation Reform Act of 1995. All such statements are intended to be subject to the safe harbor protection provided by applicable securities laws. For discussions identifying some important factors that could cause actual VSE results to differ materially from those anticipated in the forward-looking statements in this news release, see VSE’s public filings with the Securities and Exchange Commission. The forward-looking statements included herein are only made as of the date hereof, and VSE specifically disclaims any obligation to update these statements in the future.


Contacts

INVESTOR RELATIONS CONTACT: Noel Ryan | Phone: 720.778.2415

  • Commissioning of one feed and one sales gas train and one refrigeration compression train complete for the Pipestone Processing Facility.
  • Siemens Energy will provide tailored maintenance services to Keyera Partnership for the gas turbine installation.

HOUSTON--(BUSINESS WIRE)--#cyberdefense--Siemens Energy recently completed the commissioning of one feed and sales gas train and one refrigeration compression train for the Pipestone Processing Facility in Grand Prairie, Alberta, Canada. The Pipestone Processing Facility is owned by Keyera Partnership, a subsidiary of Keyera Corp.


The feed and sales gas train features two high-efficiency DATUM centrifugal compressors and a gearbox, driven by a 40-megawatt SGT-750 industrial gas turbine. The refrigeration train consists of a gearbox and an electric motor-driven DATUM compressor with a variable frequency drive. The project is the first application of this generation of gas turbine for a gas processing plant in North America.

The dry-low emissions (DLE) combustion system of the SGT-750 turbine offers world-class emission performance and fuel flexibility over a wide load range. The turbine can achieve single-digit NOₓ emission levels down to a 20% load. The compression train also includes a waste heat recovery unit, which will enhance processing efficiency and further contribute to reducing the plant’s carbon footprint.

The facility has a total sour gas processing capacity of 200 million cubic feet per day (with acid injection capabilities), along with 24,000 barrels per day of raw condensate processing capacity and associated water disposal facilities.

A flexible long-term service contract is in place between Siemens Energy and Keyera Partnership. As part of the agreement, Siemens Energy will provide tailored maintenance services to Keyera Partnership for the SGT-750 installation.

“The fact that Siemens Energy was selected for both compression trains with a long-term service contract is a testament to confidence not only in the technical capabilities of our equipment but also in our ability to ensure smooth, on-time delivery and execution,” said Patrice Laporte, Head of North America Industrial Applications Products for Siemens Energy. “The high efficiency of the DATUM compressors, coupled with the low-emissions profile and industry-leading fuel efficiency of the SGT-750 gas turbine, will enable the Pipestone facility to ensure compliance with applicable Canadian regulations and achieve a lower carbon footprint relative to other processing facilities of comparable size.”

This press release and a press picture are available at www.siemens-energy.com/press

For further information on the SGT-750 gas turbine, please see http://bit.ly/38B6XSx

For further information on centrifugal compressors, visit http://bit.ly/3sLE6TY

For further information on service programs, visit http://bit.ly/3ivJAgB

Follow us on Twitter at: www.twitter.com/siemens_energy

Siemens Energy is one of the world’s leading energy technology companies. The company works with its customers and partners on energy systems for the future, thus supporting the transition to a more sustainable world. With its portfolio of products, solutions and services, Siemens Energy covers almost the entire energy value chain – from power generation and transmission to storage. The portfolio includes conventional and renewable energy technology, such as gas and steam turbines, hybrid power plants operated with hydrogen, and power generators and transformers. More than 50 percent of the portfolio has already been decarbonized. A majority stake in the listed company Siemens Gamesa Renewable Energy (SGRE) makes Siemens Energy a global market leader for renewable energies. An estimated one-sixth of the electricity generated worldwide is based on technologies from Siemens Energy. Siemens Energy employs more than 90,000 people worldwide in more than 90 countries and generated revenue of around €27.5 billion in fiscal year 2020. www.siemens-energy.com.


Contacts

Contact for journalists
Janet Ofano
Phone: +1 803-389-6753
E-mail: This email address is being protected from spambots. You need JavaScript enabled to view it.

Stacia Licona
Phone: +1 281-721-3402
E-mail: This email address is being protected from spambots. You need JavaScript enabled to view it.

HOUSTON--(BUSINESS WIRE)--SANDRIDGE MISSISSIPPIAN TRUST I (OTC: SDTTU) today announced a quarterly distribution for the three-month period ended December 31, 2020 (which primarily relates to production attributable to the Trust’s interests from September 1, 2020 to November 30, 2020) of approximately $0.1 million, or $0.0029 per unit. The Trust makes distributions on a quarterly basis on or about the 60th day following the completion of each quarter. The distribution is expected to occur on or before February 26, 2021 to holders of record as of the close of business on February 12, 2021.

During the three-month production period ended November 30, 2020, average natural gas and natural gas liquids (“NGL”) prices increased compared to the three-month period ended August 31, 2020. Combined sales volumes slightly decreased compared to the previous period. As no additional development wells will be drilled, the Trust’s production is expected to decline each quarter during the remainder of its life.

As described in the Trust’s annual and quarterly reports filed with the Securities and Exchange Commission (the “SEC”), the trust agreement governing the Trust requires the Trust to dissolve and commence winding up of its business and affairs if cash available for distribution for any four consecutive quarters, on a cumulative basis, is less than $1.0 million. As cash available for distribution for the four consecutive quarters ended September 30, 2020, on a cumulative basis, totaled approximately $815,000, the Trust was required to dissolve and commence winding up beginning as of the close of business on November 13, 2020 (the “dissolution trigger date”). Accordingly, the Trustee is required to sell all of the Trust’s assets, either by private sale or public auction, and distribute the net proceeds of the sale to the Trust unitholders after payment, or reasonable provision for payment, of all Trust liabilities, which is expected to include the establishment of cash reserves in such amounts as the Trustee in its discretion deems appropriate for the purpose of making reasonable provision for all claims and obligations of the Trust, including any contingent, conditional or unmatured claims and obligations, in accordance with the Delaware Statutory Trust Act. The sale process will involve costs that will reduce the amounts of any distributions to unitholders during the winding up period. As required by the trust agreement, the Trustee has engaged a third-party advisor to assist with the marketing and sale of the Trust’s assets. As provided in the trust agreement, SandRidge has a right of first refusal with respect to any sale of assets to a third party. The Trustee expects to complete the sale of the Trust’s assets and distribute the net proceeds of the sale to the Trust unitholders by the third quarter of 2021, and the Trust units are expected to be canceled shortly thereafter. Pending the sale or sales of the royalty interests, the Trust anticipates that it will continue to receive income from the royalty interests and will continue to make quarterly distributions to unitholders to the extent there is available cash after payment of Trust expenses and additions to cash reserves. The Trust will remain in existence until the filing of a certificate of cancellation with the Secretary of State of the State of Delaware following the completion of the winding up process.

The Trust owns royalty interests in oil and natural gas properties in the Mississippian formation in Alfalfa, Garfield, Grant and Woods counties in Oklahoma and is entitled to receive proceeds from the sale of production attributable to the royalty interests. As described in the Trust’s filings with the Securities and Exchange Commission (the “SEC”), the amount of the quarterly distributions is expected to fluctuate from quarter to quarter, depending on the proceeds received by the Trust as a result of actual production volumes, oil, natural gas and NGL prices, and the amount and timing of the Trust’s administrative expenses, among other factors. All Trust unitholders share distributions on a pro rata basis.

Volumes, average prices and distributable income available to unitholders for the period were (dollars in thousands, except average prices and per unit amount):

Sales Volumes


Oil (MBbl)

5


NGL (MBbl)

17


Natural Gas (MMcf)

186


Combined (MBoe)

54


Average Price


Oil (per Bbl)

$

38.06


NGL (per Bbl)

$

10.62


Natural Gas (per Mcf)

$

1.83


Natural Gas (per Mcf) including impact of post-production expenses

$

1.15


Revenues

$

732


Expenses

556


Distributable income

$

176


Additional cash reserve

96


Distributable income available to unitholders

$

80


Distributable income per unit (28,000,000 units issued and outstanding)

$

0.0029


As previously disclosed, commencing with the distribution to unitholders paid in the first quarter of 2019, the Trustee has withheld, and in the future intends to withhold, the greater of $35,000 or 3.5% of the funds otherwise available for distribution to Trust unitholders each quarter to gradually increase cash reserves for the payment of future known, anticipated or contingent expenses or liabilities by a total of approximately $1,425,000. In light of the early termination of the Trust, the Trustee has elected to withhold approximately $96,000, the remaining amount needed to reach its targeted cash reserve. Cash held in reserve will be invested as required by the Trust Agreement. Any cash reserved in excess of the amount necessary to pay or provide for the payment of future known, anticipated or contingent expenses or liabilities of the Trust eventually will be distributed to unitholders, together with interest earned on the funds.

Pursuant to Internal Revenue Code Section 1446, withholding tax on income effectively connected to a United States trade or business allocated to non-U.S. persons ("ECI") should be made at the highest marginal rate. Under Section 1441, withholding tax on fixed, determinable, annual, periodic income from United States sources allocated to non-U.S. persons should be made at 30% of gross income unless the rate is reduced by treaty. This is intended to be a qualified notice by SandRidge Mississippian Trust I to nominees and brokers as provided for under Treasury Regulation Section 1.1446-4(b), and while specific relief is not specified for Section 1441 income, this disclosure is intended to suffice. Nominees and brokers should withhold at the highest marginal rate on the distribution made to non-U.S. persons. The Tax Cuts and Jobs Act (the "TCJA") enacted in December 2017 treats a non-U.S. holder's gain on the sale of Trust units as ECI to the extent such holder would have had ECI if the Trust had sold all of its assets at fair market value on the date of the exchange. The TCJA also requires the transferee of units to withhold 10% of the amount realized on the sale of exchange of units (generally, the purchase price) unless the transferor certifies that it is not a nonresident alien individual or foreign corporation. Pending the finalization of proposed regulations under IRC Section 1446, the IRS has suspended this new withholding obligation with respect to publicly traded partnerships such as the Trust, which is classified as a partnership for federal and state income tax purposes.

This press release contains statements that are “forward-looking statements” within the meaning of Section 21E of the Securities Exchange Act of 1934, as amended. All statements contained in this press release, other than statements of historical facts, are “forward-looking statements” for purposes of these provisions. These forward-looking statements include the amount and date of any anticipated distribution to unitholders; expectations regarding the timing of the completion of the sale process and the winding up of the Trust, including the cancellation of the Trust units; expectations regarding the costs involved in the sale process; and statements regarding the possibility of future distributions to unitholders during the winding up period. The anticipated distribution is based, in part, on the amount of cash received or expected to be received by the Trust from SandRidge with respect to the relevant period. Any differences in actual cash receipts by the Trust could affect this distributable amount. The amount of such cash received or expected to be received by the Trust (and its ability to pay distributions) has been and will be significantly and negatively impacted by prevailing low commodity prices, which have declined sharply since the beginning of 2020 in response to the economic effects of the COVID-19 pandemic and the announcement in March 2020 of planned production increases by Saudi Arabia and could remain low for an extended period of time or decline further. Continued low oil, NGL and natural gas prices will reduce revenues to the Trust, which will reduce the amount of cash available for distribution to unitholders and in certain periods could result in no distributions to unitholders. Other important factors that could cause actual results to differ materially include expenses of the Trust and reserves for anticipated future expenses, and the effect, impact, potential duration or other implications of the COVID-19 pandemic. Statements made in this press release are qualified by the cautionary statements made in this press release. Neither SandRidge nor the Trustee intends, and neither assumes any obligation, to update any of the statements included in this press release. An investment in Common Units issued by SandRidge Mississippian Trust I is subject to the risks described in the Trust’s Annual Report on Form 10-K for the year ended December 31, 2019, the Trust’s Quarterly Report on Form 10-Q for the period ended September 30, 2020, and all of its other filings with the SEC. The Trust’s annual, quarterly and other filed reports are or will be available over the Internet at the SEC’s website at http://www.sec.gov.


Contacts

SandRidge Mississippian Trust I
The Bank of New York Mellon Trust Company, N.A., as Trustee
Sarah Newell
1(512) 236-6555

DUBLIN--(BUSINESS WIRE)--The "Global Amphibious Landing Craft Market 2021-2025" report has been added to ResearchAndMarkets.com's offering.


The publisher has been monitoring the amphibious landing craft market and it is poised to grow by $483.62 million during 2021-2025 progressing at a CAGR of 3% during the forecast period.

The report on amphibious landing craft market provides a holistic analysis, market size and forecast, trends, growth drivers, and challenges, as well as vendor analysis covering around 25 vendors.

The report offers an up-to-date analysis regarding the current global market scenario, latest trends and drivers, and the overall market environment. The market is driven by the upgrade of capabilities to counter emerging threats, increasing commercial adoption of amphibious landing craft, and increase in number of joint operations fueling procurement.

The amphibious landing craft market analysis includes type segment and geographical landscapes. This study identifies the integration of directed-energy weapons (DEWs) as one of the prime reasons driving the amphibious landing craft market growth during the next few years. Also, advent of hybrid drive trains in AAVs, and induction of amphibious ships into naval forces will lead to sizable demand in the market.

Companies Mentioned

  • Almaz Shipbuilding Co.
  • BAE Systems Plc
  • Bland Group Ltd.
  • CNH Industrial NV
  • CNIM SA
  • Rostec State Corp.
  • Singapore TechnologiesA Engineering Ltd.
  • Textron Inc.
  • Wetland Equipment Co. Inc.
  • Wilco Manufacturing LLC

The report on amphibious landing craft market covers the following areas:

  • Amphibious landing craft market sizing
  • Amphibious landing craft market forecast
  • Amphibious landing craft market industry analysis

The study was conducted using an objective combination of primary and secondary information including inputs from key participants in the industry. The report contains a comprehensive market and vendor landscape in addition to an analysis of the key vendors.

The publisher presents a detailed picture of the market by the way of study, synthesis, and summation of data from multiple sources by an analysis of key parameters such as profit, pricing, competition, and promotions. It presents various market facets by identifying the key industry influencers. The data presented is comprehensive, reliable, and a result of extensive research - both primary and secondary. The market research reports provide a complete competitive landscape and an in-depth vendor selection methodology and analysis using qualitative and quantitative research to forecast an accurate market growth.

Key Topics Covered:

1. Executive Summary

  • Market Overview

2. Market Landscape

  • Market ecosystem
  • Value chain analysis

3. Market Sizing

  • Market definition
  • Market segment analysis
  • Market size 2020
  • Market outlook: Forecast for 2020 - 2025

4. Five Forces Analysis

  • Five Forces Summary
  • Bargaining power of buyers
  • Bargaining power of suppliers
  • Threat of new entrants
  • Threat of substitutes
  • Threat of rivalry
  • Market condition

5. Market Segmentation by Type

  • Market segments
  • Comparison by Type
  • Amphibious ACVs and APCs - Market size and forecast 2020-2025
  • Air cushion vehicle - Market size and forecast 2020-2025
  • LCU and LCM - Market size and forecast 2020-2025
  • Market opportunity by Type

6. Customer Landscape

7. Geographic Landscape

  • Geographic segmentation
  • Geographic comparison
  • North America - Market size and forecast 2020-2025
  • Europe - Market size and forecast 2020-2025
  • APAC - Market size and forecast 2020-2025
  • South America - Market size and forecast 2020-2025
  • MEA - Market size and forecast 2020-2025
  • Key leading countries
  • Market opportunity by geography
  • Market drivers
  • Market challenges
  • Market trends

8. Vendor Landscape

  • Overview
  • Vendor landscape
  • Landscape disruption

9. Vendor Analysis

  • Vendors covered
  • Market positioning of vendors

10. Appendix

  • Scope of the report
  • Currency conversion rates for US$
  • Research methodology
  • List of abbreviations

For more information about this report visit https://www.researchandmarkets.com/r/70micg


Contacts

ResearchAndMarkets.com
Laura Wood, Senior Press Manager
This email address is being protected from spambots. You need JavaScript enabled to view it.

For E.S.T Office Hours Call 1-917-300-0470
For U.S./CAN Toll Free Call 1-800-526-8630
For GMT Office Hours Call +353-1-416-8900

DALLAS--(BUSINESS WIRE)--Energy Transfer LP (NYSE: ET) today announced a quarterly cash distribution of $0.1525 per ET common unit ($0.61 on an annualized basis) for the fourth quarter ended December 31, 2020. The announced quarterly distribution is consistent with the distribution for the third quarter of 2020 and will be paid on February 19, 2021 to unitholders of record as of the close of business on February 8, 2021.


Fourth Quarter and Full Year 2020 Earnings Release and Conference Call

In addition, Energy Transfer plans to release earnings for the fourth quarter and full year 2020 on Wednesday, February 17, 2021, after the market closes. The company will conduct a conference call on Wednesday, February 17, 2021 at 4:00 p.m. Central Time/5:00 p.m. Eastern Time to discuss quarterly results and provide a company update including an outlook for 2021. The conference call will be broadcast live via an internet webcast, which can be accessed on Energy Transfer’s website at energytransfer.com. The call will also be available for replay on Energy Transfer’s website for a limited time.

Energy Transfer LP (NYSE: ET) owns and operates one of the largest and most diversified portfolios of energy assets in the United States, with a strategic footprint in all of the major domestic production basins. ET is a publicly traded limited partnership with core operations that include complementary natural gas midstream, intrastate and interstate transportation and storage assets; crude oil, natural gas liquids (NGL) and refined product transportation and terminalling assets; NGL fractionation; and various acquisition and marketing assets. ET, through its ownership of Energy Transfer Operating, L.P., also owns Lake Charles LNG Company, as well as the general partner interests, the incentive distribution rights and 28.5 million common units of Sunoco LP (NYSE: SUN), and the general partner interests and 46.1 million common units of USA Compression Partners, LP (NYSE: USAC). For more information, visit the Energy Transfer website at energytransfer.com.

Forward-Looking Statements

This press release may include certain statements concerning expectations for the future that are forward-looking statements as defined by federal law. Such forward-looking statements are subject to a variety of known and unknown risks, uncertainties, and other factors that are difficult to predict and many of which are beyond management’s control. An extensive list of factors that can affect future results are discussed in the Partnership’s Annual Report on Form 10-K and other documents filed from time to time with the Securities and Exchange Commission. In addition to the risks and uncertainties previously disclosed, the Partnership has also been, or may in the future be, impacted by new or heightened risks related to the COVID-19 pandemic, and we cannot predict the length and ultimate impact of those risks. The Partnership undertakes no obligation to update or revise any forward-looking statement to reflect new information or events.

This release serves as qualified notice to nominees as provided for under Treasury Regulation section 1.1446-4(b)(4) and (d). Please note that 100 percent of Energy Transfer LP’s distributions to foreign investors are attributable to income that is effectively connected with a United States trade or business. Accordingly, all of Energy Transfer LP’s distributions to foreign investors are subject to federal tax withholding at the highest applicable effective tax rate. Nominees, and not Energy Transfer LP, are treated as withholding agents responsible for withholding distributions received by them on behalf of foreign investors.

The information contained in this press release is available on our website at energytransfer.com.


Contacts

Investor Relations:
Bill Baerg
Brent Ratliff
Lyndsay Hannah
214-981-0795

Media Relations:
Vicki Granado
214-840-5820

Agreement Marks Key Milestone in Ecological Restoration Plan

HOUSTON--(BUSINESS WIRE)--#RES--RES and the Klamath River Renewal Corporation (KRRC) today announced that they have signed a contract for RES to provide restoration services in connection with the removal of four dams on the Klamath River. The agreement between RES and KRRC finalizes habitat restoration, maintenance, and liability transfer responsibilities for a fixed price, opening the door to a successful restoration of native vegetation and anadromous fish habitat along the historical, pre-dam path of the Klamath River.


The agreement confirms RES’ role as lead restoration contractor. The design and management plans described in the agreement fulfill the stringent permitting criteria of regulatory agencies involved in the project, including the Federal Energy Regulatory Commission (FERC), fisheries agencies in California and Oregon, and the U.S. Army Corps of Engineers.

“We are proud to have RES as our partner in accomplishing our shared vision of a renewed river system,” said Mark Bransom, CEO of the Klamath River Renewal Corporation. “Restoration is not some small task tagged on to a dam removal project. Extensively treating the thousands of acres in the project footprint following dam deconstruction – from planting native vegetation and stabilizing soils to ensuring tributary connectivity and controlling invasive species – is vital to achieving our overarching goal of recovering declining fish populations. We selected RES because of their successful track record permitting thousands of projects, many at the landscape-level, creating rich, high-functioning ecosystems with each one.”

The primary goal of the dam removal is reopening access to more than 400 miles of historical anadromous fish habitat, including critical spawning areas. Achieving that goal includes reconnecting tributaries to the Klamath River, and the restoration contract covers the design, construction, and long-term management of 18,000 feet of high-priority tributaries. It also includes revegetation of 2,200 acres of new ground set to be exposed once reservoirs behind the dams are drawn down. The restoration plan minimizes temporary impacts on landowners, agriculture, and recreational users of the river while accelerating its return to the full ecological functioning of historical times.

“Our vision for this project encompasses both RES’ experience in restoration at scale, and the ecological knowledge of the Native American tribes whose culture and livelihood depend on a healthy river and salmon population,” said Sam Burley, RES general counsel. “Part of our excitement about this project reflects our deep engagement with the Yurok, Karuk, and other Tribes. We believe it is critical to integrate their knowledge into our plan as we move to implement a shared vision of renewal for the Klamath River and the species and communities that depend on it.”

As part of the contract, RES voluntarily assumes liability for the success of the ecological restoration, including responsibility for one of the project’s primary post-dam removal challenges: the stabilization of sediment left behind after reservoirs are drawn down.

“We are both proud and humbled to be leading this restoration,” said Darrell Whitley, RES president and CEO. “Our approach to all our projects is one of long-term stewardship, ensuring that our design, implementation, and adaptive management result in sites that are self-sustaining and provide the expected ecological uplift. That fundamental belief has never been more important than for this project. This is true restoration, returning an ecosystem to its historical condition after 100 years of impacts. Its benefits will be felt throughout the watershed and all the way downstream to the Pacific Ocean, touching not just the landscape and ecosystem, but also the people that depend on the river for their health, well-being, and livelihoods.”

About RES

RES (Resource Environmental Solutions) is restoring a resilient earth for a modern world, project by project. As the nation’s largest ecological restoration company, RES provides environmental mitigation, stormwater and water quality, and climate and flooding resilience solutions with a focus on full delivery, long-term stewardship, and guaranteed performance. RES designs, builds, and sustains sites that preserve the environmental balance, restoring our land and waters to enhance lives for generations to come.

For more information, visit www.res.us.


Contacts

Gaye Denley
Director, Marketing
This email address is being protected from spambots. You need JavaScript enabled to view it. | 303.815.5211

HOUSTON--(BUSINESS WIRE)--USD Partners LP (NYSE: USDP) (the “Partnership”) announced today that the Board of Directors of its general partner declared a quarterly cash distribution of $0.111 per unit for the fourth quarter of 2020 ($0.444 per unit on an annualized basis), the same amount as distributed in the prior quarter. The distribution is payable on February 19, 2021, to unitholders of record at the close of business on February 10, 2021.


Fourth Quarter 2020 Earnings Release Date and Conference Call Information

The Partnership plans to report fourth quarter 2020 financial and operating results after market close on Wednesday March 3, 2021. The Partnership will host a conference call and webcast regarding fourth quarter 2020 results at 11:00 a.m. Eastern Time (10:00 a.m. Central Time) on Thursday, March 4, 2021.

To listen live over the Internet, participants are advised to log on to the Partnership’s website at www.usdpartners.com and select the “Events & Presentations” sub-tab under the “Investors” tab. To join via telephone, participants may dial (877) 266-7551 domestically or +1 (339) 368-5209 internationally, conference ID 3094936. Participants are advised to dial in at least five minutes prior to the call.

An audio replay of the conference call will be available for thirty days by dialing (800) 585-8367 domestically or +1 (404) 537-3406 internationally, conference ID 3094936. In addition, a replay of the audio webcast will be available by accessing the Partnership's website after the call is concluded.

About USD Partners LP

USD Partners LP is a fee-based, growth-oriented master limited partnership formed in 2014 by US Development Group, LLC (“USDG”) to acquire, develop and operate midstream infrastructure and complementary logistics solutions for crude oil, biofuels and other energy-related products. The Partnership generates substantially all of its operating cash flows from multi-year, take-or-pay contracts with primarily investment grade customers, including major integrated oil companies, refiners and marketers. The Partnership’s principal assets include a network of crude oil terminals that facilitate the transportation of heavy crude oil from Western Canada to key demand centers across North America. The Partnership’s operations include railcar loading and unloading, storage and blending in on-site tanks, inbound and outbound pipeline connectivity, truck transloading, as well as other related logistics services. In addition, the Partnership provides customers with leased railcars and fleet services to facilitate the transportation of liquid hydrocarbons and biofuels by rail.

USDG, which owns the general partner of USD Partners LP, is engaged in designing, developing, owning, and managing large-scale multi-modal logistics centers and energy-related infrastructure across North America. USDG solutions create flexible market access for customers in significant growth areas and key demand centers, including Western Canada, the U.S. Gulf Coast and Mexico. Among other projects, USDG, along with its partner Gibson Energy, Inc., is pursuing long-term solutions to transport heavier grades of crude oil produced in Western Canada through the construction of a Diluent Recovery Unit at the Hardisty terminal, which is expected to be placed into service late in the second quarter or early in the third quarter of 2021. USDG is also currently pursuing the development of a premier energy logistics terminal on the Houston Ship Channel with capacity for substantial tank storage, multiple docks (including barge and deepwater), inbound and outbound pipeline connectivity, as well as a rail terminal with unit train capabilities. For additional information, please visit texasdeepwater.com. Information on USDG’s website is not part of this press release.

Qualified Notice to Nominees

This release serves as qualified notice to nominees as provided for under Treasury Regulation Section 1.1446-4(b)(4) and (d). Please note that we believe that 100 percent of the Partnership’s distributions to foreign investors are attributable to income that is effectively connected with a United States trade or business. Accordingly, all of the Partnership’s distributions to foreign investors are subject to federal income tax withholding at the highest effective tax rate for individuals or corporations, as applicable. Nominees, and not the Partnership, are treated as withholding agents responsible for withholding distributions received by them on behalf of foreign investors.

Cautionary Note Regarding Forward-Looking Statements

This press release contains forward-looking statements within the meaning of U.S. federal securities laws, including statements with respect to the amount and timing of the Partnership’s fourth quarter 2020 cash distribution and the business prospects of the Partnership and USDG. Words and phrases such as “plans,” “expects,” “will,” “pursuing,” and similar expressions are used to identify such forward-looking statements. However, the absence of these words does not mean that a statement is not forward-looking. Forward-looking statements relating to the Partnership are based on management’s expectations, estimates and projections about the Partnership, its interests, USDG’s projects and the energy industry in general on the date this press release was issued. These statements are not guarantees of future performance and involve certain risks, uncertainties and assumptions that are difficult to predict. The current economic downturn and pandemic introduces unusual risks and an inability to predict all risks that may impact the Partnership’s business and outlook. Therefore, actual outcomes and results may differ materially from what is expressed or forecast in such forward-looking statements. Factors that could cause actual results or events to differ materially from those described in the forward-looking statements include those as set forth under the heading “Risk Factors” in the Partnership’s most recent Annual Report on Form 10-K and in its subsequent filings with the Securities and Exchange Commission. The Partnership is under no obligation (and expressly disclaims any such obligation) to update or alter its forward-looking statements, whether as a result of new information, future events or otherwise.

Category: Earnings


Contacts

Investor Relations Contacts:
Adam Altsuler, (281) 291-3995
Senior Vice President and Chief Financial Officer

Jennifer Waller, (832) 991-8383
Director, Financial Reporting and Investor Relations

DUBLIN--(BUSINESS WIRE)--The "Biorefinery - Global Market Trajectory & Analytics" report has been added to ResearchAndMarkets.com's offering.


The publisher brings years of research experience to the 6th edition of this report. The 183-page report presents concise insights into how the pandemic has impacted production and the buy side for 2020 and 2021. A short-term phased recovery by key geography is also addressed.

Global Biorefinery Market to Reach US$1.4 Trillion by the Year 2027

Amid the COVID-19 crisis, the global market for Biorefinery estimated at US$679.8 Billion in the year 2020, is projected to reach a revised size of US$1.4 Trillion by 2027, growing at a CAGR of 10.5% over the analysis period 2020-2027.

Industrial Biotechnology, one of the segments analyzed in the report, is projected to grow at a 9.9% CAGR to reach US$693.2 Billion by the end of the analysis period. After an early analysis of the business implications of the pandemic and its induced economic crisis, growth in the Physico-Chemical segment is readjusted to a revised 11.7% CAGR for the next 7-year period. This segment currently accounts for a 38.4% share of the global Biorefinery market.

The U.S. Accounts for Over 28.8% of Global Market Size in 2020, While China is Forecast to Grow at a 14% CAGR for the Period of 2020-2027

The Biorefinery market in the U.S. is estimated at US$196.1 Billion in the year 2020. The country currently accounts for a 28.85% share in the global market. China, the world second largest economy, is forecast to reach an estimated market size of US$253.2 Billion in the year 2027 trailing a CAGR of 14% through 2027. Among the other noteworthy geographic markets are Japan and Canada, each forecast to grow at 7.4% and 9.2% respectively over the 2020-2027 period. Within Europe, Germany is forecast to grow at approximately 8.3% CAGR while Rest of European market (as defined in the study) will reach US$253.2 Billion by the year 2027.

Thermochemical Segment Corners a 8.9% Share in 2020

In the global Thermochemical segment, USA, Canada, Japan, China and Europe will drive the 8% CAGR estimated for this segment. These regional markets accounting for a combined market size of US$45.4 Billion in the year 2020 will reach a projected size of US$78 Billion by the close of the analysis period. China will remain among the fastest growing in this cluster of regional markets. Led by countries such as Australia, India, and South Korea, the market in Asia-Pacific is forecast to reach US$202.2 Billion by the year 2027, while Latin America will expand at a 10% CAGR through the analysis period.

Competitors identified in this market include, among others:

  • Abengoa Bioenergia SA
  • Neste Corporation
  • Pacific Ethanol, Inc.
  • Renewable Energy Group, Inc.
  • Valero Marketing and Supply Company

Key Topics Covered:

I. INTRODUCTION, METHODOLOGY & REPORT SCOPE

II. EXECUTIVE SUMMARY

1. MARKET OVERVIEW

  • Impact of Covid-19 and a Looming Global Recession
  • Global Competitor Market Shares
  • Biorefinery Competitor Market Share Scenario Worldwide (in %): 2018E

2. FOCUS ON SELECT PLAYERS

3. MARKET TRENDS & DRIVERS

4. GLOBAL MARKET PERSPECTIVE

III. MARKET ANALYSIS

IV. COMPETITION

  • Total Companies Profiled: 41

For more information about this report visit https://www.researchandmarkets.com/r/62nfpy


Contacts

ResearchAndMarkets.com
Laura Wood, Senior Press Manager
This email address is being protected from spambots. You need JavaScript enabled to view it.

For E.S.T Office Hours Call 1-917-300-0470
For U.S./CAN Toll Free Call 1-800-526-8630
For GMT Office Hours Call +353-1-416-8900

LOS ANGELES--(BUSINESS WIRE)--Faraday Future, a global shared intelligent mobility ecosystem company and China’s largest privately owned automotive group, Zhejiang Geely Holding Group, have jointly signed a framework cooperation agreement. The two sides will cooperate in technology and engineering support, and will explore the possibility of using OEM production services provided by the joint venture between Foxconn and Geely.


At the same time, Geely Holding Group has also signed a subscription agreement to become a minority investor in Faraday Future in connection with the previously announced business combination between Faraday Future and Property Solutions Acquisition Corp. (NASDAQ: PSAC), which remains subject to customary terms and conditions including the consummation of such business combination.

Users can reserve an FF 91 now at: https://www.ff.com/us/reserve

ABOUT FARADAY FUTURE

Established in May 2014, Faraday Future (FF) is a global shared intelligent mobility ecosystem company, headquartered in Los Angeles, California. FF’s vision is to create a shared intelligent mobility ecosystem that empowers everyone to move, connect, breathe, and live freely. FF aims to perpetually improve the way people move by creating a forward-thinking mobility ecosystem that integrates clean energy, AI, the Internet and new usership models. With the FF 91, FF has envisioned a vehicle that redefines transportation, mobility, and connectivity, creating a true “third Internet living space,” complementing users’ home and smartphone Internet experience.

FOLLOW FARADAY FUTURE:

https://www.ff.com/

https://twitter.com/FaradayFuture

https://www.facebook.com/faradayfuture/

https://www.instagram.com/faradayfuture/

www.linkedin.com/company/faradayfuture

IMPORTANT INFORMATION AND WHERE TO FIND IT

This press release references a proposed transaction between PSAC and FF. PSAC intends to file with the Securities and Exchange Commission (“SEC”) a registration statement on Form S-4 that will include a proxy statement and prospectus of PSAC and a consent solicitation statement with respect to FF. The proxy statement/consent solicitation statement/prospectus will be mailed to stockholders of PSAC as of a record date to be established for voting on the proposed business combination. PSAC also will file other relevant documents from time to time regarding the proposed transaction with the SEC. INVESTORS AND SECURITY HOLDERS OF PSAC ARE URGED TO READ THE PROXY STATEMENT, PROSPECTUS AND OTHER RELEVANT DOCUMENTS THAT WILL BE FILED BY PSAC FROM TIME TO TIME WITH THE SEC CAREFULLY AND IN THEIR ENTIRETY WHEN THEY BECOME AVAILABLE BECAUSE THEY WILL CONTAIN IMPORTANT INFORMATION ABOUT THE PROPOSED TRANSACTION. Investors and security holders will be able to obtain free copies of the proxy statement/consent solicitation statement/prospectus and other documents containing important information about PSAC and FF once such documents are filed with the SEC, through the website maintained by the SEC at http://www.sec.gov. Copies of the documents filed with the SEC by PSAC when and if available, can also be obtained free of charge by directing a written request to Property Solutions Acquisition Corp., 654 Madison Avenue, Suite 1009, New York, New York 10065.

PARTICIPANTS IN THE SOLICITATION

PSAC and FF and their respective directors and executive officers, under SEC rules, may be deemed to be participants in the solicitation of proxies of PSAC’s stockholders in connection with the proposed business combination between PSAC and FF. Investors and security holders may obtain more detailed information regarding the names and interests in the proposed transaction of PSAC’s directors and officers in PSAC’s filings with the SEC, including PSAC’s Quarterly Report on Form 10-Q for the period ended September 30, 2020, which was filed with the SEC on November 13, 2020. Information regarding the persons who may, under SEC rules, be deemed participants in the solicitation of proxies to PSAC’s stockholders in connection with the proposed business combination will be set forth in the proxy statement/consent solicitation statement/prospectus for the proposed business combination when available. Additional information regarding the interests of participants in the solicitation of proxies in connection with the proposed business combination will be included in the proxy statement/consent solicitation statement/prospectus that PSAC intends to file with the SEC.

NO OFFER OR SOLICITATION

This communication shall neither constitute an offer to sell or the solicitation of an offer to buy any securities, nor shall there be any sale of securities in any jurisdiction in which the offer, solicitation or sale would be unlawful prior to the registration or qualification under the securities laws of any such jurisdiction.

FORWARD-LOOKING STATEMENTS

This press release includes “forward-looking statements” within the meaning of the “safe harbor” provisions of the United States Private Securities Litigation Reform Act of 1995. When used in this press release, the words “estimates,” “projected,” “expects,” “anticipates,” “forecasts,” “plans,” “intends,” “believes,” “seeks,” “may,” “will,” “should,” “future,” “propose” and variations of these words or similar expressions (or the negative versions of such words or expressions) are intended to identify forward-looking statements. These forward-looking statements are not guarantees of future performance, conditions or results, and involve a number of known and unknown risks, uncertainties, assumptions and other important factors, many of which are outside PSAC’s or FF’s management’s control, that could cause actual results or outcomes to differ materially from those discussed in the forward-looking statements. Important factors, among others, that may affect actual results or outcomes include: the inability to complete the transactions contemplated by the framework cooperation agreement or proposed business combination; the inability to recognize the anticipated benefits of the proposed framework cooperation agreement or business combination, which may be affected by, among other things, the amount of cash available following any redemptions by PSAC stockholders; the ability to meet the Nasdaq’s listing standards following the consummation of the transactions contemplated by the proposed business combination; costs related to the proposed framework cooperation agreement or business combination; FF’s ability to execute on its plans to develop and market its vehicles and the timing of these development programs; FF’s estimates of the size of the markets for its vehicles; the rate and degree of market acceptance of FF’s vehicles; the success of other competing manufacturers; the performance and security of FF’s vehicles; potential litigation involving PSAC or FF; the result of future financing efforts and general economic and market conditions impacting demand for FF’s products. Other factors include the possibility that the proposed transactions do not close, including due to the failure to receive required security holder approvals, or the failure of other closing conditions. The foregoing list of factors is not exhaustive. You should carefully consider the foregoing factors and the other risks and uncertainties described in the “Risk Factors” section of the registration statement on Form S-4 and proxy statement/consent solicitation statement/prospectus discussed above and other documents filed by PSAC from time to time with the SEC. These filings identify and address other important risks and uncertainties that could cause actual events and results to differ materially from those contained in the forward-looking statements. Forward-looking statements speak only as of the date they are made. Readers are cautioned not to put undue reliance on forward-looking statements, and neither PSAC nor FF undertake any obligation to update or revise any forward-looking statements, whether as a result of new information, future events or otherwise, except as required by law.


Contacts

FOR FARADAY FUTURE
Investors:
This email address is being protected from spambots. You need JavaScript enabled to view it.

Media:
This email address is being protected from spambots. You need JavaScript enabled to view it.

Offshore Source Logo

Offshore Source keeps you updated with relevant information concerning the Offshore Energy Sector.

Any views or opinions represented on this website belong solely to the author and do not represent those of the people, institutions or organizations that Offshore Source or collaborators may or may not have been associated with in a professional or personal capacity, unless explicitly stated.

Corporate Offices

Technology Systems Corporation
8502 SW Kansas Ave
Stuart, FL 34997

info@tscpublishing.com