Business Wire News

IRVING, Texas--(BUSINESS WIRE)--Exxon Mobil Corporation (NYSE:XOM) issued the following statement in response to Engine No. 1’s nomination of directors for election to ExxonMobil’s board of directors at its 2021 annual meeting of shareholders.


ExxonMobil has engaged with Engine No. 1 since mid-December. The company’s board affairs committee will evaluate Engine No. 1’s notice of nomination and nominees in line with the corporation’s by-laws.

ExxonMobil will continue to update shareholders in the coming weeks on the company’s strategy to build long-term, sustainable value for shareholders. It will also provide updates on company performance and actions to address climate change, including initiatives to commercialize technologies which are key to reducing emissions and meeting societal goals consistent with the Paris Agreement.

ExxonMobil remains committed to investing in the company’s industry-leading advantaged opportunities, significantly reducing costs and improving operational performance to deliver improved shareholder returns and maintain a strong and reliable dividend.

About ExxonMobil

ExxonMobil, one of the largest publicly traded international energy companies, uses technology and innovation to help meet the world’s growing energy needs. ExxonMobil holds an industry-leading inventory of resources, is one of the largest refiners and marketers of petroleum products, and its chemical company is one of the largest in the world. To learn more, visit exxonmobil.com and the Energy Factor.

Follow us on Twitter and LinkedIn.

Cautionary Statement

Statements of future events, goals or plans in this release are forward-looking statements. Actual future results could vary depending on changes in supply and demand and other market factors affecting future prices of oil, gas, and petrochemical products; changes in the relative energy mix across activities and geographies; the actions of competitors; changes in regional and global economic growth rates and consumer preferences; the pace of regional and global recovery from the COVID-19 pandemic and actions taken by governments and consumers resulting from the pandemic; and other factors discussed in this release and in Item 1A. “Risk Factors” in ExxonMobil’s Annual Report on Form 10-K for 2019 and subsequent Quarterly Reports on Forms 10-Q, as well as under the heading “Factors Affecting Future Results” on the Investors page of ExxonMobil’s website at www.exxonmobil.com.

Important Additional Information Regarding Proxy Solicitation

Exxon Mobil Corporation (“ExxonMobil”) intends to file a proxy statement and associated BLUE proxy card with the U.S. Securities and Exchange Commission (the “SEC”) in connection with the solicitation of proxies for ExxonMobil’s 2021 Annual Meeting (the “Proxy Statement”). ExxonMobil, its directors and certain of its executive officers will be participants in the solicitation of proxies from shareholders in respect of the 2021 Annual Meeting. Information regarding the names of ExxonMobil’s directors and executive officers and their respective interests in ExxonMobil by security holdings or otherwise is set forth in ExxonMobil’s Annual Report on Form 10-K for the fiscal year ended December 31, 2019, filed with the SEC on February 26, 2020, ExxonMobil’s proxy statement for the 2020 Annual Meeting of Shareholders, filed with the SEC on April 9, 2020 and ExxonMobil’s Form 8-K filed with the SEC on December 1, 2020. To the extent holdings of such participants in ExxonMobil’s securities are not reported, or have changed since the amounts described, in the 2020 proxy statement, such changes have been reflected on Initial Statements of Beneficial Ownership on Form 3 or Statements of Change in Ownership on Form 4 filed with the SEC. Details concerning the nominees of ExxonMobil’s Board of Directors for election at the 2021 Annual Meeting will be included in the Proxy Statement. BEFORE MAKING ANY VOTING DECISION, INVESTORS AND SHAREHOLDERS OF THE COMPANY ARE URGED TO READ ALL RELEVANT DOCUMENTS FILED WITH OR FURNISHED TO THE SEC, INCLUDING THE COMPANY’S DEFINITIVE PROXY STATEMENT AND ANY SUPPLEMENTS THERETO AND ACCOMPANYING BLUE PROXY CARD WHEN THEY BECOME AVAILABLE, BECAUSE THEY WILL CONTAIN IMPORTANT INFORMATION. Investors and shareholders will be able to obtain a copy of the definitive Proxy Statement and other relevant documents filed by ExxonMobil free of charge from the SEC’s website, www.sec.gov. ExxonMobil’s shareholders will also be able to obtain, without charge, a copy of the definitive Proxy Statement and other relevant filed documents by directing a request by mail to ExxonMobil Shareholder Services at 5959 Las Colinas Boulevard, Irving, Texas, 75039-2298 or at This email address is being protected from spambots. You need JavaScript enabled to view it. or from the investor relations section of ExxonMobil’s website, www.exxonmobil.com/investor.


Contacts

ExxonMobil Media Relations:
(972) 940-6007

ANNAPOLIS, Md.--(BUSINESS WIRE)--$HASI #earnings--Hannon Armstrong Sustainable Infrastructure Capital, Inc. ("Hannon Armstrong," or the "Company") (NYSE: HASI), a leading investor in climate solutions, today announced that the Company will release its fourth quarter and full year 2020 results after market close on Thursday, February 18, 2021, to be followed by a conference call at 5:00 p.m. (Eastern Time).


The conference call can be accessed live over the phone by dialing 1-866-652-5200 or for international callers, 1-412-317-6060. Please ask to be connected to the Hannon Armstrong call. A replay will be available two hours after the call and can be accessed by dialing 1-877-344-7529, or for international callers, 1-412-317-0088. The passcode for the replay is 10151938. The replay will be available until February 25, 2021.

Interested investors and other parties may also listen to a simultaneous webcast of the conference call by logging onto the Investor Relations section of the Company's website at www.hannonarmstrong.com. The online replay will be available for a limited time beginning immediately following the call.

To learn more about Hannon Armstrong, please visit the Company's website at www.hannonarmstrong.com. In addition to filing or furnishing required information to the U.S. Securities and Exchange Commission, Hannon Armstrong uses its website as a channel of distribution of material Company information. Financial and other material information regarding Hannon Armstrong is routinely posted on the Company's website and is readily accessible.

ABOUT HANNON ARMSTRONG

Hannon Armstrong (NYSE: HASI) is the first U.S. public company solely dedicated to investments in climate solutions, providing capital to leading companies in energy efficiency, renewable energy, and other sustainable infrastructure markets. With more than $6 billion in managed assets as of September 30, 2020, Hannon Armstrong’s core purpose is to make climate-positive investments with superior risk-adjusted returns. For more information, please visit www.hannonarmstrong.com. Follow Hannon Armstrong on LinkedIn and Twitter @HannonArmstrong.


Contacts

HANNON ARMSTRONG
INVESTOR RELATIONS INQUIRIES:
Chad Reed
This email address is being protected from spambots. You need JavaScript enabled to view it.
410-571-6189

DUBLIN--(BUSINESS WIRE)--The "Propane - Global Market Trajectory & Analytics" report has been added to ResearchAndMarkets.com's offering.


This report presents concise insights into how the pandemic has impacted production and the buy side for 2020 and 2021. A short-term phased recovery by key geography is also addressed.

Global Propane Market to Reach $147.7 Billion by 2027

Amid the COVID-19 crisis, the global market for Propane estimated at US$126.5 Billion in the year 2020, is projected to reach a revised size of US$147.7 Billion by 2027, growing at a CAGR of 2.2% over the analysis period 2020-2027.

Residential, one of the segments analyzed in the report, is projected to record a 2.5% CAGR and reach US$15 Billion by the end of the analysis period. After an early analysis of the business implications of the pandemic and its induced economic crisis, growth in the Commercial segment is readjusted to a revised 2.2% CAGR for the next 7-year period.

The U.S. Market is Estimated at $34.2 Billion, While China is Forecast to Grow at 4.2% CAGR

The Propane market in the U.S. is estimated at US$34.2 Billion in the year 2020. China, the world's second largest economy, is forecast to reach a projected market size of US$29 Billion by the year 2027 trailing a CAGR of 4.2% over the analysis period 2020 to 2027.

Among the other noteworthy geographic markets are Japan and Canada, each forecast to grow at 0.5% and 1.6% respectively over the 2020-2027 period. Within Europe, Germany is forecast to grow at approximately 1% CAGR.

Chemical & Refinery Segment to Record 2.3% CAGR

In the global Chemical & Refinery segment, USA, Canada, Japan, China and Europe will drive the 1.9% CAGR estimated for this segment. These regional markets accounting for a combined market size of US$17.1 Billion in the year 2020 will reach a projected size of US$19.6 Billion by the close of the analysis period.

China will remain among the fastest growing in this cluster of regional markets. Led by countries such as Australia, India, and South Korea, the market in Asia-Pacific is forecast to reach US$20 Billion by the year 2027, while Latin America will expand at a 3.1% CAGR through the analysis period.

Competitors identified in this market include, among others:

  • AmeriGas Propane, Inc.
  • Anadarko Petroleum Corporation
  • DCC plc
  • Lykins Energy Solution
  • Marsh LP Gas Company Inc.
  • Sparlingss Propane Co. Ltd.
  • Suburban Propane Partners L.P.
  • ThompsonGas
  • UGI Corporation

Key Topics Covered

I. INTRODUCTION, METHODOLOGY & REPORT SCOPE

II. EXECUTIVE SUMMARY

1. MARKET OVERVIEW

  • Global Competitor Market Shares
  • Propane Competitor Market Share Scenario Worldwide (in %): 2019 & 2025
  • Impact of COVID-19 and a Looming Global Recession

2. FOCUS ON SELECT PLAYERS

3. MARKET TRENDS & DRIVERS

4. GLOBAL MARKET PERSPECTIVE

III. MARKET ANALYSIS

  • United States
  • Canada
  • Japan
  • China
  • Europe
  • Asia-Pacific
  • Latin America
  • Middle East
  • Africa

IV. COMPETITION

  • Total Companies Profiled: 46

For more information about this report visit https://www.researchandmarkets.com/r/6ow1up


Contacts

ResearchAndMarkets.com
Laura Wood, Senior Press Manager
This email address is being protected from spambots. You need JavaScript enabled to view it.
For E.S.T Office Hours Call 1-917-300-0470
For U.S./CAN Toll Free Call 1-800-526-8630
For GMT Office Hours Call +353-1-416-8900

MINNEAPOLIS--(BUSINESS WIRE)--C.H. Robinson Worldwide, Inc. (“C.H. Robinson”) (Nasdaq: CHRW) today reported financial results for the quarter ended December 31, 2020.


Fourth Quarter Key Metrics:

  • Total revenues increased 19.9 percent to $4.5 billion
  • Gross profits increased 10.5 percent to $636.1 million
  • Adjusted gross profits(1) increased 10.7 percent to $640.6 million
  • Income from operations increased 51.2 percent to $206.8 million
  • Adjusted operating margin(1) increased 870 basis points to 32.3 percent
  • Diluted earnings per share (EPS) increased 47.9 percent to $1.08
  • Cash flow from operations decreased 23.4 percent to $162.1 million

Full-Year Key Metrics:

  • Total revenues increased 5.9 percent to $16.2 billion
  • Gross profits decreased 7.0 percent to $2.4 billion
  • Adjusted gross profits(1) decreased 6.7 percent to $2.4 billion
  • Income from operations decreased 14.8 percent to $673.3 million
  • Adjusted operating margin(1) decreased 260 basis points to 27.9 percent
  • Diluted earnings per share (EPS) decreased 11.2 percent to $3.72
  • Cash flow from operations decreased 40.2 percent to $499.2 million

(1) Adjusted gross profits and adjusted operating margin are Non-GAAP financial measures. The same factors described in this release that impacted the Non-GAAP measures also impacted the comparable GAAP measures. Refer to page 10 for further discussion and a GAAP to Non-GAAP reconciliation.

“Our fourth quarter was marked by solid performance across our broad service portfolio, continued progress on repricing our truckload business to reflect the changing market conditions, and further advancements in our technology and transformation efforts that are providing meaningful improvements,” said Bob Biesterfeld, Chief Executive Officer of C.H. Robinson. "Our enterprise portfolio that allows us to offer end-to-end solutions for our customers is unique to the logistics industry, and shippers continue to rely on Robinson's global supply chain expertise and our data and scale advantages to ensure critical goods are moved as quickly and as inexpensively as possible."

Fourth Quarter Results Summary

  • Total revenues increased 19.9 percent to $4.5 billion, driven primarily by higher pricing and higher volume across most of our service lines.
  • Gross profits increased 10.5 percent to $636.1 million. Adjusted gross profits increased 10.7 percent to $640.6 million, primarily driven by higher pricing and higher volume in our Global Forwarding business segment and contributions from the acquisition of Prime Distribution Services ("Prime").
  • Operating expenses decreased 1.9 percent to $433.8 million, primarily due to cost savings initiatives. Personnel expenses increased 3.4 percent to $309.3 million, compared to the fourth quarter of 2019, which included a reduction in incentive compensation. Average headcount decreased 4.8 percent, despite headcount additions from Prime that added approximately 2.0 percentage points. Selling, general and administrative (“SG&A”) expenses of $124.5 million decreased 13.0 percent, primarily due to cost savings initiatives including lower travel expenses.
  • Income from operations totaled $206.8 million, up 51.2 percent due to the increase in adjusted gross profits. Adjusted operating margin of 32.3 percent increased 870 basis points.
  • Interest and other expenses totaled $12.0 million, consisting primarily of $12.3 million of interest expense, which decreased $0.1 million versus last year due to a lower average debt balance. The fourth quarter also included a $1.1 million favorable impact from foreign currency revaluation and realized foreign currency gains and losses.
  • The effective tax rate in the quarter was 24.1 percent compared to 21.4 percent in the fourth quarter last year. The increase was primarily due to one-time items related to the tax provision in Mexico, which were favorable in the fourth quarter of 2019 and unfavorable in the fourth quarter of 2020.
  • Net income totaled $147.8 million, up 49.1 percent from a year ago. Diluted EPS of $1.08 increased 47.9 percent.

Full Year Results Summary

  • Total revenues increased 5.9 percent to $16.2 billion, driven primarily by higher pricing in ocean and air services and contributions from the Prime acquisition.
  • Gross profits decreased 7.0 percent to $2.4 billion. Adjusted gross profits decreased 6.7 percent to $2.4 billion, primarily driven by lower adjusted gross profit margins in truckload services, partially offset by contributions from the Prime acquisition and higher adjusted gross profits in air and ocean services.
  • Operating expenses decreased 3.2 percent to $1.7 billion. Personnel expenses decreased 4.3 percent to $1.2 billion, driven primarily by cost savings initiatives, including a 2.8 percent decrease in average headcount, and a decline in benefits expenses and incentive compensation. SG&A expenses decreased 0.3 percent to $496.1 million, primarily due to significantly lower travel expenses, partially offset by the ongoing expenses from the Prime acquisition.
  • Income from operations totaled $673.3 million, down 14.8 percent from last year due to a decline in adjusted gross profits. Adjusted operating margin of 27.9 percent decreased 260 basis points.
  • Interest and other expenses totaled $44.9 million, which primarily consists of $49.1 million of interest expense. The twelve-month period also included a $3.3 million favorable impact from foreign currency revaluation and realized foreign currency gains and losses.
  • The effective tax rate for the full year was 19.4 percent compared to 22.3 percent in the year-ago period. The lower effective tax rate was due primarily to the tax benefit related to stock-based compensation, including delivery of a one-time deferred stock award that was granted to the company's prior Chief Executive Officer in 2000, and due to tax planning initiatives.
  • Net income totaled $506.4 million, down 12.2 percent from a year ago. Diluted EPS of $3.72 decreased 11.2 percent.

North American Surface Transportation Results

Summarized financial results of our NAST segment are as follows (dollars in thousands):


Three Months Ended December 31,


Twelve Months Ended December 31,


2020


2019


% change


2020


2019


% change

Total revenues

$

3,089,674


$

2,788,547


10.8

%


$

11,312,553


$

11,283,692


0.3

%

Adjusted gross profits(1)

396,814


390,641


1.6

%


1,517,091


1,797,369


(15.6)

%

Income from operations

150,577


130,548


15.3

%


508,475


722,763


(29.6)

%

____________________________________________

(1) Adjusted gross profits is a non-GAAP financial measure explained later in this release. The difference between adjusted gross profits and gross profits is not material.

Fourth quarter total revenues for C.H. Robinson's NAST segment totaled $3.1 billion, an increase of 10.8 percent over the prior year, primarily driven by higher truckload pricing and an increase in less than truckload ("LTL") shipments. NAST adjusted gross profits increased 1.6 percent in the quarter to $396.8 million, with the March 2020 acquisition of Prime contributing 4.0 percentage points of adjusted gross profit growth in the quarter. Adjusted gross profits in truckload decreased 2.1 percent and LTL adjusted gross profits increased 4.0 percent versus the year-ago period. Our average truckload linehaul rate per mile charged to our customers, which excludes fuel surcharges, increased approximately 29 percent in the quarter, while truckload linehaul cost per mile, excluding fuel surcharges, increased approximately 32.5 percent. Truckload volume declined 3.5 percent in the quarter, and LTL volumes grew 20.0 percent, representing an overall market share gain for NAST in the quarter when compared to a 4 percent increase in industry volumes, as measured by the Cass Freight Index. Operating expenses decreased 5.3 percent primarily due to cost savings initiatives. Income from operations increased 15.3 percent to $150.6 million, and adjusted operating margin expanded 450 basis points to 37.9 percent. NAST average headcount was down 8.4 percent in the quarter, with Prime contributing 4.0 percentage points of growth.

Global Forwarding Results

Summarized financial results of our Global Forwarding segment are as follows (dollars in thousands):


Three Months Ended December 31,


Twelve Months Ended December 31,


2020


2019


% change


2020


2019


% change

Total revenues

$

1,030,364


$

600,168


71.7

%


$

3,100,525


$

2,327,913


33.2

%

Adjusted gross profits(1)

180,057


128,989


39.6

%


628,988


533,976


17.8

%

Income from operations

58,480


15,030


289.1

%


175,513


80,527


118.0

%

____________________________________________

(1) Adjusted gross profits is a non-GAAP financial measure explained later in this release. The difference between adjusted gross profits and gross profits is not material.

Fourth quarter total revenues for the Global Forwarding segment increased 71.7 percent to $1.0 billion, primarily driven by higher pricing in ocean across the industry driven by higher demand and higher pricing in air due to reduced air cargo capacity, increased charter flights and larger shipment sizes. Adjusted gross profits increased 39.6 percent in the quarter to $180.1 million. Ocean adjusted gross profits increased 53.1 percent, driven by higher pricing and a 12.0 percent increase in volumes. Adjusted gross profits in air increased 38.3 percent driven by higher pricing, partially offset by a 7.5 percent decline in shipments. Customs adjusted gross profits increased 4.5 percent, primarily driven by an 8.0 percent increase in transaction volume. Operating expenses increased 6.7 percent, primarily driven by increased incentive compensation in personnel expenses and partially offset by cost savings initiatives. Fourth quarter average headcount decreased 4.1 percent. Income from operations increased 289.1 percent to $58.5 million, and adjusted operating margin expanded 2,080 basis points to 32.5 percent in the quarter.

All Other and Corporate Results

Total revenues and adjusted gross profits for Robinson Fresh, Managed Services and Other Surface Transportation are summarized as follows (dollars in thousands):


Three Months Ended December 31,


Twelve Months Ended December 31,


2020


2019


% change


2020


2019


% change

Total revenues

$

429,414


$

404,611


6.1

%


$

1,794,028


$

1,697,903


5.7

%

Adjusted gross profits(1):


Robinson Fresh

$

23,591


$

22,907


3.0

%


$

105,700


$

109,183


(3.2)

%

Managed Services

24,738


21,380


15.7

%


94,828


83,365


13.8

%

Other Surface Transportation

15,378


14,946


2.9

%


65,650


62,417


5.2

%

____________________________________________

(1) Adjusted gross profits is a non-GAAP financial measure explained later in this release. The difference between adjusted gross profits and gross profits is not material.

Fourth quarter Robinson Fresh adjusted gross profits increased 3.0 percent to $23.6 million, primarily due to volume growth and margin expansion in our retail vertical. Managed Services adjusted gross profits increased 15.7 percent in the quarter, primarily due to a 27.0 percent increase in volume. Other Surface Transportation adjusted gross profits increased 2.9 percent to $15.4 million. Europe truckload adjusted gross profit was up 1.7 percent in the quarter due to a 7.0 percent volume increase and strength of the Euro.

Other Income Statement Items

The fourth quarter effective tax rate was 24.1 percent, up from 21.4 percent last year. The increase in effective tax rate was due primarily to benefits from foreign tax credits recognized in the fourth quarter of 2019. We expect our 2021 full-year effective tax rate to be 20 to 22 percent.

Interest and other expenses totaled $12.0 million, consisting primarily of $12.3 million of interest expense, which decreased $0.1 million versus last year due to a lower average debt balance. The fourth quarter also included a $1.1 million favorable impact from foreign currency revaluation and realized foreign currency gains and losses.

Diluted weighted average shares outstanding in the quarter were up 0.4 percent due primarily to a higher share price that created a higher dilutive effect from stock options.

Cash Flow Generation and Capital Distribution

Cash from operations totaled $162.1 million in the fourth quarter, compared to $211.6 million in the fourth quarter of 2019. The $49.5 million decrease in cash flow was driven by a $112 million sequential increase in accounts receivable and contract assets that coincided with an increase in gross sales.

In the fourth quarter, $112.8 million was returned to shareholders, with $110.3 million in total repurchases of common stock, as the company resumed its opportunistic share repurchase program in the fourth quarter, and $2.5 million in cash dividends. The quarterly dividend that was declared in the fourth quarter was paid on January 4, 2021 rather than in December, which defers the tax obligation of our shareholders into 2021.

Capital expenditures totaled $13.7 million in the quarter and $54.0 million for 2020. Capital expenditures for 2021 are expected to be $55 million to $65 million, with the majority dedicated to technology.

Outlook

“Due to several factors, including shortages in the number of drivers and available carrier capacity, freight markets remain tight, and we anticipate this will continue for much of 2021. We're committed to creating better outcomes for our customers and carriers, by delivering industry leading technology that is built by and for supply chain experts and by leveraging our broad service portfolio and our unmatched combination of experience, scale and information advantage to meet their ever-changing needs,” Biesterfeld stated. "We're also firmly committed to the focus areas of our investors, including profitable market share growth, investing in technology to unlock growth and efficiency, being a responsible corporate citizen, and driving the transformation of C.H. Robinson, so that we can deliver industry-leading margins and enhance shareholder value."

About C.H. Robinson

C.H. Robinson solves logistics problems for companies across the globe and across industries, from the simple to the most complex. With $21 billion in freight under management and 19 million shipments annually, we are one of the world’s largest logistics platforms. Our global suite of services accelerates trade to seamlessly deliver the products and goods that drive the world’s economy. With the combination of our multimodal transportation management system and expertise, we use our information advantage to deliver smarter solutions for our 105,000 customers and 73,000 contract carriers. Our technology is built by and for supply chain experts to bring faster, more meaningful improvements to our customers’ businesses. As a responsible global citizen, we are also proud to contribute millions of dollars to support causes that matter to our company, our Foundation and our employees. For more information, visit us at www.chrobinson.com (Nasdaq: CHRW).

Except for the historical information contained herein, the matters set forth in this release are forward-looking statements that represent our expectations, beliefs, intentions or strategies concerning future events. These forward-looking statements are subject to certain risks and uncertainties that could cause actual results to differ materially from our historical experience or our present expectations, including, but not limited to, such factors such as changes in economic conditions, including uncertain consumer demand; changes in market demand and pressures on the pricing for our services; competition and growth rates within the third party logistics industry; freight levels and increasing costs and availability of truck capacity or alternative means of transporting freight; changes in relationships with existing contracted truck, rail, ocean, and air carriers; changes in our customer base due to possible consolidation among our customers; our ability to successfully integrate the operations of acquired companies with our historic operations; risks associated with litigation, including contingent auto liability and insurance coverage; risks associated with operations outside of the United States; risks associated with the potential impact of changes in government regulations; risks associated with the produce industry, including food safety and contamination issues; fuel price increases or decreases, or fuel shortages; cyber-security related risks; the impact of war on the economy; changes to our capital structure; risks related to the elimination of LIBOR; changes due to catastrophic events including pandemics such as COVID-19; and other risks and uncertainties detailed in our Annual and Quarterly Reports.

Any forward-looking statement speaks only as of the date on which such statement is made, and we undertake no obligation to update such statement to reflect events or circumstances arising after such date. All remarks made during our financial results conference call will be current at the time of the call, and we undertake no obligation to update the replay.

Conference Call Information:
C.H. Robinson Worldwide Fourth Quarter 2020 Earnings Conference Call
Wednesday, January 27, 2021; 8:30 a.m. Eastern Time
Presentation slides and a simultaneous live audio webcast of the conference call may be accessed through the Investor Relations link on C.H. Robinson’s website at www.chrobinson.com.
To participate in the conference call by telephone, please call ten minutes early by dialing: 877-269-7756
International callers dial +1-201-689-7817

We invite call participants to submit questions in advance of the conference call, and we will respond to as many of the questions as we can in the time allowed. To submit your question(s) in advance of the call, please email This email address is being protected from spambots. You need JavaScript enabled to view it..

Adjusted Gross Profit by Service Line
(in thousands)

This table of summary results presents our service line adjusted gross profits on an enterprise basis. The service line adjusted gross profits in the table differ from the service line adjusted gross profits discussed within the segments as our segments have revenues from multiple service lines.


Three Months Ended December 31,


Twelve Months Ended December 31,


2020


2019


% change


2020


2019


% change

Adjusted gross profits(1):


Transportation


Truckload

$

277,509


$

281,544


(1.4)

%


$

1,071,873


$

1,348,878


(20.5)

%

LTL

117,864


113,605


3.7

%


457,290


477,348


(4.2)

%

Ocean

112,412


73,483


53.0

%


350,094


308,367


13.5

%

Air

35,723


25,940


37.7

%


151,443


106,777


41.8

%

Customs

23,977


22,925


4.6

%


87,095


91,828


(5.2)

%

Other logistics services

51,113


39,708


28.7

%


195,159


149,664


30.4

%

Total transportation

618,598


557,205


11.0

%


2,312,954


2,482,862


(6.8)

%

Sourcing

21,980


21,658


1.5

%


99,303


103,448


(4.0)

%

Total adjusted gross profits

640,578


578,863


10.7

%


2,412,257


2,586,310


(6.7)

%

____________________________________________

(1) Adjusted gross profits is a non-GAAP financial measure explained later in this release. The difference between adjusted gross profits and gross profits is not material.

GAAP to Non-GAAP Reconciliation
(unaudited, in thousands)

Our adjusted gross profit is a non-GAAP financial measure. Adjusted gross profit is calculated as gross profit excluding amortization of internally developed software utilized to directly serve our customers and contracted carriers. We believe adjusted gross profit is a useful measure of our ability to source, add value, and sell services and products that are provided by third parties, and we consider adjusted gross profit to be a primary performance measurement. Accordingly, the discussion of our results of operations often focuses on the changes in our adjusted gross profit. The reconciliation of gross profit to adjusted gross profit is presented below (in thousands):


Three Months Ended December 31,


Twelve Months Ended December 31,


2020


2019


2020


2019

Revenues:


Transportation

$

4,311,852


$

3,570,405


$

15,147,562


$

14,322,295


Sourcing

237,600


222,921


1,059,544


987,213


Total revenues

4,549,452


3,793,326


16,207,106


15,309,508


Costs and expenses:


Purchased transportation and related services

3,693,254


3,013,200


12,834,608


11,839,433


Purchased products sourced for resale

215,620


201,263


960,241


883,765


Direct internally developed software amortization

4,510


3,366


16,634


11,492


Total direct expenses

3,913,384


3,217,829


13,811,483


12,734,690


Gross profit

$

636,068


$

575,497


$

2,395,623


$

2,574,818


Plus: Direct internally developed software amortization

4,510


3,366


16,634


11,492


Adjusted gross profit

$

640,578


$

578,863


$

2,412,257


$

2,586,310


Our adjusted operating margin is a non-GAAP financial measure calculated as operating income divided by adjusted gross profit. We believe adjusted operating margin is a useful measure of our profitability in comparison to our adjusted gross profit which we consider a primary performance metric as discussed above. The comparison of operating margin to adjusted operating margin is presented below:


Three Months Ended December 31,


Twelve Months Ended December 31,


2020


2019


2020


2019


Total Revenues

$

4,549,452


$

3,793,326


$

16,207,106


$

15,309,508


Operating income

206,802


136,806


673,268


789,976


Operating margin

4.5

%


3.6

%


4.2

%


5.2

%


Adjusted gross profit

$

640,578


$

578,863


$

2,412,257


$

2,586,310


Operating income

206,802


136,806


673,268


789,976


Adjusted operating margin

32.3

%


23.6

%


27.9

%


30.5

%


Condensed Consolidated Statements of Income

(unaudited, in thousands, except per share data)


Three Months Ended
December 31,


Twelve Months Ended
December 31,


2020


2019


2020


2019


Revenues:


Transportation

$

4,311,852


$

3,570,405


$

15,147,562


$

14,322,295


Sourcing

237,600


222,921


1,059,544


987,213


Total revenues

4,549,452


3,793,326


16,207,106


15,309,508


Costs and expenses:


Purchased transportation and related services

3,693,254


3,013,200


12,834,608


11,839,433


Purchased products sourced for resale

215,620


201,263


960,241


883,765


Personnel expenses

309,260


298,981


1,242,867


1,298,528


Other selling, general, and administrative expenses

124,516


143,076


496,122


497,806


Total costs and expenses

4,342,650


3,656,520


15,533,838


14,519,532


Income from operations

206,802


136,806


673,268


789,976


Interest and other expense

(12,033)


(10,784)


(44,937)


(47,719)


Income before provision for income taxes

194,769


126,022


628,331


742,257


Provision for income taxes

46,962


26,916


121,910


165,289


Net income

$

147,807


$

99,106


$

506,421


$

576,968


Net income per share (basic)

$

1.09


$

0.73


$

3.74


$

4.21


Net income per share (diluted)

$

1.08


$

0.73


$

3.72


$

4.19


Weighted average shares outstanding (basic)

135,970


135,997


135,532


136,955


Weighted average shares outstanding (diluted)

137,176


136,621


136,173


137,735


Business Segment Information

(unaudited, in thousands, except average headcount)


NAST


Global
Forwarding


All
Other and
Corporate


Consolidated

Three Months Ended December 31, 2020


Total revenues


$

3,089,674


$

1,030,364


$

429,414


$

4,549,452


Adjusted gross profits(1)


396,814


180,057


63,707


640,578


Income (loss) from operations


150,577


58,480


(2,255)


206,802


Depreciation and amortization


5,764


6,810


12,086


24,660


Total assets (2)


2,946,409


1,392,411


805,438


5,144,258


Average headcount


6,555


4,626


3,610


14,791


NAST


Global
Forwarding


All
Other and
Corporate


Consolidated

Three Months Ended December 31, 2019


Total revenues


$

2,788,547


$

600,168


$

404,611


$

3,793,326


Adjusted gross profits(1)


390,641


128,989


59,233


578,863


Income (loss) from operations


130,548


15,030


(8,772)


136,806


Depreciation and amortization


6,384


9,293


9,650


25,327


Total assets (2)


2,550,010


1,021,592


1,069,458


4,641,060


Average headcount


7,154


4,824


3,562


15,540


Contacts

Chuck Ives, Director of Investor Relations
Email: This email address is being protected from spambots. You need JavaScript enabled to view it.


Read full story here

DUBLIN--(BUSINESS WIRE)--The "Power Plants Security - Global Market Trajectory & Analytics" report has been added to ResearchAndMarkets.com's offering.


The publisher brings years of research experience to the 6th edition of this report. The 155-page report presents concise insights into how the pandemic has impacted production and the buy side for 2020 and 2021. A short-term phased recovery by key geography is also addressed.

Global Power Plants Security Market to Reach $106.4 Billion by 2027

Amid the COVID-19 crisis, the global market for Power Plants Security estimated at US$74.9 Billion in the year 2020, is projected to reach a revised size of US$106.4 Billion by 2027, growing at a CAGR of 5.1% over the analysis period 2020-2027.

Oil & Gas, one of the segments analyzed in the report, is projected to record a 4.4% CAGR and reach US$38.2 Billion by the end of the analysis period. After an early analysis of the business implications of the pandemic and its induced economic crisis, growth in the Thermal & Hydro segment is readjusted to a revised 5% CAGR for the next 7-year period.

The U.S. Market is Estimated at $22.1 Billion, While China is Forecast to Grow at 4.9% CAGR

The Power Plants Security market in the U.S. is estimated at US$22.1 Billion in the year 2020. China, the world`s second largest economy, is forecast to reach a projected market size of US$18.8 Billion by the year 2027 trailing a CAGR of 4.9% over the analysis period 2020 to 2027. Among the other noteworthy geographic markets are Japan and Canada, each forecast to grow at 4.9% and 4.1% respectively over the 2020-2027 period. Within Europe, Germany is forecast to grow at approximately 4.3% CAGR.

Nuclear Segment to Record 5.9% CAGR

In the global Nuclear segment, USA, Canada, Japan, China and Europe will drive the 5.9% CAGR estimated for this segment. These regional markets accounting for a combined market size of US$13.8 Billion in the year 2020 will reach a projected size of US$20.7 Billion by the close of the analysis period. China will remain among the fastest growing in this cluster of regional markets. Led by countries such as Australia, India, and South Korea, the market in Asia-Pacific is forecast to reach US$12.3 Billion by the year 2027.

Competitors identified in this market include, among others:

  • Acorn Energy Inc.
  • BAE Systems Plc
  • Elbit Systems Ltd.
  • HCL Technologies Limited
  • Honeywell International Inc.
  • Lockheed Martin Corp.
  • McAfee, LLC
  • Siemens AG
  • Thales Group

Key Topics Covered:

I. INTRODUCTION, METHODOLOGY & REPORT SCOPE

II. EXECUTIVE SUMMARY

1. MARKET OVERVIEW

  • Impact of Covid-19 and a Looming Global Recession
  • Global Competitor Market Shares
  • Power Plants Security Competitor Market Share Scenario Worldwide (in %): 2018E

2. FOCUS ON SELECT PLAYERS

3. MARKET TRENDS & DRIVERS

4. GLOBAL MARKET PERSPECTIVE

III. MARKET ANALYSIS

IV. COMPETITION

  • Total Companies Profiled: 41

For more information about this report visit https://www.researchandmarkets.com/r/iynlp0


Contacts

ResearchAndMarkets.com
Laura Wood, Senior Press Manager
This email address is being protected from spambots. You need JavaScript enabled to view it.

For E.S.T Office Hours Call 1-917-300-0470
For U.S./CAN Toll Free Call 1-800-526-8630
For GMT Office Hours Call +353-1-416-8900

HOUSTON--(BUSINESS WIRE)--Sunnova Energy International Inc. (“Sunnova”) (NYSE: NOVA), a leading U.S. residential solar and energy storage service provider, announced today it will release its fourth quarter and full year 2020 results after the markets close on February 24, 2021, to be followed by a conference call to discuss the results at 8:30 a.m. Eastern Time on February 25, 2021.

To register for this conference call, please use this link http://www.directeventreg.com/registration/event/5276028. After registering, a confirmation will be sent through email, including dial-in details and unique conference call codes for entry. To ensure you are connected for the full call we suggest registering a day in advance or at a minimum 10 minutes before the start of the call. A replay will be available two hours after the call and can be accessed by dialing 800-585-8367, or for international callers, 416-621-4642. The conference ID for the live call and the replay is 5276028. The replay will be available until March 4, 2021.

Interested investors and other parties may also listen to a simultaneous webcast of the conference call by logging onto the Investor Relations section of Sunnova’s website at www.sunnova.com.

About Sunnova

Sunnova Energy International Inc. (NYSE: NOVA) is a leading residential solar and energy storage service provider with customers across the U.S. states and its territories. Sunnova’s goal is to be the source of clean, affordable and reliable energy with a simple mission: to power energy independence so that homeowners have the freedom to live life uninterruptedTM.

For more information, visit www.sunnova.com, follow us on Twitter @Sunnova_Solar and connect with us on Facebook.


Contacts

Investor & Analyst Contact
Rodney McMahan
Sunnova Energy International Inc.
This email address is being protected from spambots. You need JavaScript enabled to view it.
(281) 971-3323

Press & Media Contact
Kelsey Hultberg
Sunnova Energy International Inc.
This email address is being protected from spambots. You need JavaScript enabled to view it.

LONDON--(BUSINESS WIRE)--#GlobalMarineTurbinePropulsionEngineMarket--The new marine turbine propulsion engine market research from Technavio indicates neutral growth in the short term as the business impact of COVID-19 spreads.


Get detailed insights on the COVID-19 pandemic crisis and recovery analysis of the marine turbine propulsion engine market.

Get FREE report sample within MINUTES

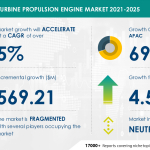
"One of the primary growth drivers for this market is the surge in commercial shipping,” says a senior analyst for the industrials industry at Technavio. The vendors should focus on growth prospects in the fast-growing segments while maintaining their positions in the slow-growing segments. As the markets recover, Technavio expects the marine turbine propulsion engine market size to grow by USD 569.21 million during the period 2021-2025.

Marine Turbine Propulsion Engine Market Segment Highlights for 2020

  • The marine turbine propulsion engine market is expected to post a year-over-year growth rate of 4.57%.
  • Based on the end-user, the commercial and naval ships saw maximum growth in 2020. The market is driven by factors such as the surge in commercial shipping and an increase in naval vessels.
  • The growth of the market segment will be significant during the forecast period.

Regional Analysis

  • 69% of the growth will originate from the APAC region.
  • APAC will offer several growth opportunities to market vendors during the forecast period.
  • China, South Korea (Republic of Korea), and Japan are the key markets for marine turbine propulsion engines in APAC.

Click here to learn about report detailed analysis and insights on how you can leverage them to grow your business.

Related Reports on Industrials Include:

Global Industrial Belt Tensioners Market- The industrial belt tensioners market is segmented by type (automatic and non-automatic), geography (APAC, Europe, North America, South America, and MEA), and key vendors. Click Here to Get an Exclusive Free Sample Report

Global Sinter Plant Market- The sinter plant market is segmented by product (MHMG system, sinter machine, WGR system, and SCS system), geography (APAC, Europe, MEA, North America, and South America), and key vendors. Click Here to Get an Exclusive Free Sample Report

Notes:

  • The marine turbine propulsion engine market size is expected to accelerate at a CAGR of over 5% during the forecast period.
  • The marine turbine propulsion engine market is segmented by end-user (Commercial & naval ships and Leisure ships) and geography (APAC, Europe, North America, MEA, and South America).
  • The market is fragmented due to the presence of many established vendors holding significant market share.
  • The research report offers information on several market vendors, including Caterpillar Inc., Cummins Inc., General Electric Co., Hyundai Heavy Industries Co. Ltd., Mitsubishi Heavy Industries Ltd., MTU Aero Engines AG, Rolls-Royce Plc, Volkswagen AG, Wartsila Corp., and Yanmar Holdings Co. Ltd.

Register for a free trial today to access 17,000+ market research reports using Technavio's SUBSCRIPTION platform

About Us

Technavio is a leading global technology research and advisory company. Their research and analysis focuses on emerging market trends and provides actionable insights to help businesses identify market opportunities and develop effective strategies to optimize their market positions. With over 500 specialized analysts, Technavio’s report library consists of more than 17,000 reports and counting, covering 800 technologies, spanning across 50 countries. Their client base consists of enterprises of all sizes, including more than 100 Fortune 500 companies. This growing client base relies on Technavio’s comprehensive coverage, extensive research, and actionable market insights to identify opportunities in existing and potential markets and assess their competitive positions within changing market scenarios.


Contacts

Technavio Research
Jesse Maida
Media & Marketing Executive
US: +1 844 364 1100
UK: +44 203 893 3200
Email: This email address is being protected from spambots. You need JavaScript enabled to view it.
Website: www.technavio.com/

TULSA, Okla.--(BUSINESS WIRE)--Blueknight Energy Partners, L.P. (“Blueknight” or the “Partnership”) (Nasdaq: BKEP and BKEPP), announced today that the board of directors of its general partner has declared a quarterly cash distribution on the Partnership’s common units of $0.04 per common unit, as well as a cash distribution of $0.17875 per unit on the Partnership’s preferred units for the quarter ended December 31, 2020. The fourth quarter 2020 distributions for both the common and preferred units remain unchanged from those paid for the third quarter of 2020. The distributions are payable on February 12, 2021, on all outstanding common and preferred units to unitholders of record as of the close of business on February 5, 2021.


Forward-Looking Statements and Treasury Regulation Notice

This release may include forward-looking statements. Statements included in this release that are not historical facts are forward-looking statements. Such forward-looking statements are subject to various risks and uncertainties. These risks and uncertainties include, among other things, uncertainties relating to the Partnership’s future cash flows and operations, the Partnership’s ability to pay future distributions, future market conditions, current and future governmental regulation, future taxation and other factors discussed in the Partnership’s filings with the Securities and Exchange Commission. If any of these risks or uncertainties materializes, or should underlying assumptions prove incorrect, actual results or outcomes may vary materially from those expected. The Partnership undertakes no obligation to publicly update or revise any forward-looking statement, whether as a result of new information, future events or otherwise.

This release is intended to be a qualified notice under Treasury Regulation Section 1.1446-4(b) (4) and (d). Brokers and nominees should treat one hundred percent (100.0%) of Blueknight’s distributions to foreign investors as being attributable to income that is effectively connected with a United States trade or business. Accordingly, Blueknight’s distributions to foreign investors are subject to federal income tax withholding at the highest applicable effective tax rate. Nominees, and not Blueknight, are treated as withholding agents responsible for withholding on the distributions received by them on behalf of foreign investors.

About Blueknight

Blueknight owns and operates a diversified portfolio of complementary midstream energy assets consisting of:

  • 8.8 million barrels of liquid asphalt storage located at 53 terminals in 26 states;
  • 6.9 million barrels of above-ground crude oil storage capacity located primarily in Oklahoma, approximately 6.6 million barrels of which are located at the Cushing Interchange terminalling facility in Cushing, Oklahoma;
  • 604 miles of crude oil pipeline located primarily in Oklahoma; and
  • 63 crude oil transportation vehicles deployed primarily in Oklahoma and Texas.

Blueknight provides integrated terminalling, gathering and transportation services for companies engaged in the production, distribution and marketing of liquid asphalt and crude oil. Blueknight is headquartered in Tulsa, Oklahoma. For more information, visit the Partnership’s website at www.bkep.com.


Contacts

Blueknight Investor Relations
Chase Jacobson, (918) 237-4032
This email address is being protected from spambots. You need JavaScript enabled to view it.

Investment Capitalizes on Accelerating Growth in C&I Solar Market

SAN DIEGO & NEW YORK--(BUSINESS WIRE)--EDF Renewables North America (EDFR), a leading developer in the renewable energy sector, today announced its 100-percent acquisition of EnterSolar, a national provider of distributed generation solar solutions to corporate commercial and industrial (C&I) customers. EDF Renewables previously held a 50-percent interest in EnterSolar in a strategic partnership they announced on September 24, 2018. As a wholly-owned subsidiary of EDF Renewables, EnterSolar will operate as a part of the Distributed Solutions Group and benefit from increased financial stability and broader offerings, including energy storage and smart electric vehicle charging.


EnterSolar brings a strong 15-year track record of providing behind-the-meter solar solutions for a diverse range of corporate clients nationally and will continue to provide C&I customers with premier solar and solar-plus-storage solutions in the same committed manner. With 59 MW of solar capacity installed in 2020 alone, EnterSolar has consistently ranked among the top developers of C&I solar in the U.S. Through this acquisition, EnterSolar benefits from EDF Renewables’ equipment procurement capabilities, project development capital, and additional product offerings, while positioning EDFR to meet the accelerating demand for distributed generation solar solutions from the corporate C&I market.

“We are excited to be wholly a part of EDF Renewables. The acquisition allows EnterSolar to fully leverage EDF Renewables’ unparalleled experience in grid-scale renewable energy and our solid track record in developing behind-the-meter solar photovoltaic projects in order to become the preferred provider of distributed generation solar solutions to the corporate marketplace,” Peyton Boswell, Managing Director of EnterSolar.

Raphael Declercq, Executive Vice President, Distributed Solutions and Strategy, commented, “The initial investment in EnterSolar proved to be the absolute right partnership for synergy between EDFR’s strengths and EnterSolar’s expertise in the C&I market. We are excited today to further our ambitions as one company to provide customers with a wider choice of product offerings to meet the growing demand for distributed energy solutions.”

Declercq added, “With skillful and talented employees at all levels, EnterSolar positions EDF Renewables Distributed Solutions Group for a promising and successful future.”

About EDF Renewables North America:

EDF Renewables North America is a market leading independent power producer and service provider with 35 years of expertise in renewable energy. The Company delivers grid-scale power: wind (onshore and offshore), solar photovoltaic, and storage projects; distributed solutions: solar, solar+storage, EV charging and energy management; and asset optimization: technical, operational, and commercial skills to maximize performance of generating projects. EDF Renewables’ North American portfolio consists of 16 GW of developed projects and 11 GW under service contracts. EDF Renewables North America is a subsidiary of EDF Renouvelables, the dedicated renewable energy affiliate of the EDF Group. For more information visit: www.edf-re.com. Connect with us on LinkedIn, Facebook, Twitter, Instagram and YouTube

About EnterSolar:

EnterSolar is a national provider of solar energy and solar-plus-storage systems to the commercial marketplace. The Company’s financing, engineering and project management teams work with each client to deliver a customized solar solution that provides a compelling return on investment. Expert in solar's dynamic legislative environment, EnterSolar’s team helps clients leverage tax credits and other financial incentives at the federal, state and utility levels to maximize project returns. EnterSolar’s clients encompass a wide range of industries and include multinational retailers, REITS, global manufacturers and major distributors among others. EnterSolar was acquired by EDF Renewables North America in 2021. For more information visit: www.entersolar.com. Connect with us on LinkedIn, Facebook, Twitter, Instagram, and YouTube.


Contacts

EDF Renewables
Sandi Briner, +1 858-521-3525
This email address is being protected from spambots. You need JavaScript enabled to view it.

EnterSolar
Emily Lau, +1 917-580-3198
This email address is being protected from spambots. You need JavaScript enabled to view it.

LONDON--(BUSINESS WIRE)--#AI--Kooling, a technology start-up that helps leading businesses to reduce their impact on Climate Change, welcomes Walter Susini, Senior Vice President of Marketing EMEA at The Coca Cola Company, as Senior Advisor of the Board. He brings strategic marketing, branding and innovation experience to the business, gained in the largest and most successful companies worldwide.


Walter has inspired the world’s leading brands on the importance of purpose and stakeholder value in order to drive sustainable growth.

In his current role at The Coca-Cola Company, Walter is leading an ambitious transformation of its EMEA marketing and innovation agenda and capabilities. During his 28 years career he has been working in consultancy, marketing and advertising in four continents. He led the global creative strategy, content and design function at Unilever as VP of Global Marketing, after starting his career at JW Thompson in strategic planning.

Walter also has successful experience as an entrepreneur, founding and running his own branding and innovation consultant firm with offices in Brazil, Mexico and Argentina.

David Falconi, Founder and CEO of Kooling, said: “We could not be more excited to welcome Walter to the Kooling family. It’s striking how closely the values Walter promotes match the mission, vision and purpose of Kooling. I have full confidence he’ll bring invaluable insight and direction on how we support our stakeholders and fulfill our mission.”

Walter Susini, SVP Marketing of The Coca Cola Company said: “In all my career I’ve always been a strong believer that being a good business is good for the business. When we talk about sustainable practices, companies need to be part of the solution as they have been part of the problem and Kooling is the perfect platform for those companies that want to have a positive impact on the planet.”

About Kooling: Kooling uses Big Data and AI to empower every business to reduce its impact on Climate Change. In 2020, the UK Government invested in Kooling innovation with an R&D Grant. Kooling was founded in London in 2019.


Contacts

David Falconi | 020 7846 0119 | This email address is being protected from spambots. You need JavaScript enabled to view it.

Award Signifies BISTel’s Expansion into Auto, Industrial and Pharma Manufacturing with GrandView™ APM AI Enabler for Industrial Assets for Constant Uptime, Extended Asset Life, and Reduced Equipment Maintenance Costs

SANTA CLARA, Calif.--(BUSINESS WIRE)--#AI--Targeting the fast growing $60 billion asset performance management (APM) market, manufacturing AI analytics leader BISTel, says its expanded global sales footprint, together with enhanced cloud, Internet of things (IoT) and AI technologies will power a wave of new intelligent AI manufacturing applications in 2021. “The expansion and deployment of our award-winning GrandView APM framework will spark continuous improvement programs across the pharmaceutical, petrochemical and industrial manufacturing sectors as the deployment of digital transformation technologies gains traction worldwide,” said W.K. Choi, CEO, BISTel.


GrandView Taps $250 Billion Market by 2030

According to Transparency Market Research, the global asset performance management market is the fastest growing market within Industry 4.0. It is projected to grow from almost $70 billion in 2020 to more than $240 billion by 2030. Widespread adoption across manufacturing sectors such as pharma, oil and gas, industrial, metals, healthcare, auto and chemical are contributing significantly to a compounded annual growth rate (CAGR) of more than 16.1 percent over the next 10 years. The predictive maintenance market is by far the fastest growth segment within the APM market, growing from $14.1 billion in 2020 to almost $68 billion by 2030. “Following three years of development, GrandView APM was launched last year to address the needs of this fast-growing market. By helping to transition manufacturers from legacy, inefficient scheduled based maintenance to AI predictive based maintenance approaches, manufacturers will save millions of dollars in maintenance costs alone and extend the life of equipment,” commented Choi.

Powerful Visualization and Integrated Analytics Secure Award Win and Drive Growth in 2021

The Pharma Manufacturing 2020 Innovation Award winner was chosen for its ability to integrate big data analytics and an IoT technology platform with smart manufacturing applications supported by BISTel’s manufacturing domain expertise. The GrandView™ solution provides for continuous monitoring of the health and performance of factory equipment, pumps, motors, fans, and other industrial assets and showcases powerful data visualization for all users. Coupled with an asset health index and AI predictive analytics technology, users can generate a RUL (remaining useful life) prediction, pinpointing when assets will fail. Users can also connect the GrandView APM’s prediction to their plant’s CMMS, EAM or ERP systems, automatically generating a work order scan to order parts and perform maintenance — thereby minimizing or even eliminating system downtime.

Asset Data Centric Management Approach

BISTel’s asset data centric management approach is driving the deployment of the new GrandView-APM framework. Manufactures recognize the importance of an asset data centric management approach because this approach generates deeper insights at the asset level across the entire production environment. This approach calls for connecting, analyzing and sharing knowledge among engineers, processes and equipment across the ecosystem, putting data to work to yield the type of insights that drive continuous manufacturing improvements to greater heights.

On Tap for 2021

According to Choi, “Significant investments in sales, technology and product development will support a massive growth initiative across the manufacturing sector, especially in highly complex environments where we excel in and where quality and productivity are critical,” noted Choi. “With pharma, oil & gas, and industrial production sectors investing heavily in new industry 4.0 technologies, BISTel’s GrandView APM is well positioned to grow rapidly in 2021.”

Many Opportunities to Connect with Customers in 2021

GrandView investments mean taking this innovative solution to as many customers as possible in 2021. In Q1 alone, BISTel will appear at Automate Forward 2021, Impact Series 2021, and AI Expo. You can also sign up to participate in the BISTel FREE POC Program that enables manufacturers to test drive the GrandView APM for free. For more information visit www.grandview-apm.com

About BISTel

From its industry proven Equipment Engineering Systems (EES) framework to its new its AI GrandView APM analytics solution and Decision Support System (DSS) designed for knowledge sharing across the manufacturing ecosystem, BISTel continues to pioneer advancements that drive the digital transformation of the manufacturing sector. For more than 20 years, BISTel’s intelligent manufacturing solutions collect and manage data, monitor the health of equipment, optimize process flows, analyze large data, quickly identify root cause failures to mitigate risk, predicting issues before they occur and extending the life of valuable equipment and other assets through industry leading predictive analytics. BISTel helps customers reduce downtime, improve yield, increase asset utilization, achieving significant production and engineering efficiencies across the factory. Founded in 2000, BISTel has more than 395 employees worldwide. The company is headquartered in Santa Clara with offices in California, China, France, Seoul, Singapore and Texas. BISTel’s domain expertise in manufacturing AI, includes, auto, flat panel, industrial, petrochemicals, semiconductor as well as automotive, and pharmaceutical manufacturing. For more information visit bistel.com or www.grandview-apm.com


Contacts

Stewart Chalmers
+1 818-681-3588
This email address is being protected from spambots. You need JavaScript enabled to view it.

PRINCETON, N.J.--(BUSINESS WIRE)--Climate Real Impact Solutions II Acquisition Corporation (the “Company”) today announced the pricing of its initial public offering of 21,000,000 units at a price of $10.00 per unit. The units are expected to be listed for trading on the New York Stock Exchange under the ticker symbol “CLIM.U” beginning January 27, 2021. Each unit consists of one share of the Company’s Class A common stock and one-fifth of one redeemable warrant. Each whole warrant entitles the holder thereof to purchase one share of Class A common stock at a price of $11.50 per share. Once the securities comprising the units begin separate trading, the Company expects that its Class A common stock and warrants will be listed on the New York Stock Exchange under the symbols ‘‘CLIM” and ‘‘CLIM WS,’’ respectively.

The Company was formed for the purpose of effecting a merger, capital stock exchange, asset acquisition, stock purchase, reorganization or similar business combination with one or more businesses. Although the Company’s efforts to identify a prospective business combination opportunity will not be limited to a particular industry, it intends to focus on businesses in the climate sector.

Barclays and BofA Securities are acting as joint book-running managers. The Company has granted the underwriters a 45-day option to purchase up to 3,150,000 additional units at the initial public offering price to cover over-allotments, if any.

The public offering is being made only by means of a prospectus. When available, copies of the prospectus relating to the offering may be obtained from Barclays, c/o Broadridge Financial Solutions, 1155 Long Island Avenue, Edgewood, NY 11717, Telephone: (888) 603-5847, Email: This email address is being protected from spambots. You need JavaScript enabled to view it.; and BofA Securities, NC1-004-03-43, 200 North College Street, 3rd floor, Charlotte NC 28255-0001, Attn: Prospectus Department, Email: This email address is being protected from spambots. You need JavaScript enabled to view it..

A registration statement relating to the securities became effective on January 26, 2021. This press release shall not constitute an offer to sell or the solicitation of an offer to buy securities, nor shall there be any sale of these securities in any state or jurisdiction in which such offer, solicitation, or sale would be unlawful prior to registration or qualification under the securities laws of any such state or jurisdiction. The offering is expected to close on January 29, 2021, subject to customary closing conditions.

Forward-Looking Statements

This press release contains statements that constitute “forward-looking statements,” including with respect to the proposed initial public offering and the Company’s plans with respect to the target industry for a potential business combination. No assurance can be given that the offering discussed above will be completed on the terms described, or at all, or that the Company will ultimately complete a business combination transaction. Forward-looking statements are subject to numerous conditions, many of which are beyond the control of the Company, including those set forth in the Risk Factors section of the Company’s registration statement and preliminary prospectus for the Company’s offering filed with the U.S. Securities and Exchange Commission (the “SEC”). Copies of these documents are available on the SEC’s website, at www.sec.gov. The Company undertakes no obligation to update these statements for revisions or changes after the date of this release, except as required by law.


Contacts

Isaac Steinmetz
Director of Media Relations
This email address is being protected from spambots. You need JavaScript enabled to view it.
(646) 883-3655

RedRaven Delivers the Future of Production to Keep Industries Up and Running

DALLAS--(BUSINESS WIRE)--Flowserve Corporation (NYSE: FLS), a leading provider of flow control products and services for the global infrastructure markets, announced today the launch of a revolutionary IoT service suite to help production facilities monitor their assets remotely, predict equipment failures before they happen and take preventive measures to avoid business disruptions. Called RedRaven, the new platform supports any flow control equipment regardless of manufacturer, opening the door for companies to quickly realize the full benefits of IoT and predictive analytics without major infrastructure changes.


IIoT-based predictive maintenance solutions are expected to reduce factory equipment maintenance costs by 40%, according to Deloitte. Predictive maintenance can also reduce safety, health, environment and quality risks by 14% and extend the life of an aging asset by 20%, according to PwC.

“We’re betting big on IoT to help companies avoid costly downtime, which is not feasible in today’s world,” said Scott Rowe, Flowserve president and chief executive officer. “The COVID-19 pandemic illustrated the critical importance of digitization in production facilities for business continuity, and RedRaven can help companies accelerate their digital transformation to start reaping the numerous productivity and profitability benefits of IoT.”

RedRaven is a services platform that takes a systems approach. Available with wireless or wired options based on applications, it includes sensors that are placed on industrial equipment and gateways that collect data from assets and then transmit it to the cloud with a secure, data-encrypted solution. Companies can access critical data on their equipment performance via Flowserve’s secure Insight Portal dashboard. A big differentiator in the marketplace is Flowserve’s dedicated remote monitoring facility, which is staffed by a team of technical specialists who don’t just identify problems, but also tell companies how to fix the issues and support them throughout their entire IoT journey. RedRaven works for any company with flow control equipment such as those in the oil and gas, water, chemical, power, food and beverage and mining industries, among many others.

Key advantages of RedRaven include:

  • Reduce expensive downtime and repairs with the ability to predict failures of critical assets before they happen and take preventive action
  • Identify and fix issues immediately with near-real-time monitoring from any location
  • Improve efficiency, productivity and worker safety with the ability to determine when and where technicians are needed and avoid unnecessary equipment checks
  • Gain real insights to make informed decisions that improve plant productivity and profitability
  • Run equipment at peak performance and reduce total cost of ownership

The name RedRaven comes from the bird known for its intelligence and insight.

To learn more, visit www.flowserve.com/iot

About Flowserve

Flowserve Corp. is one of the world’s leading providers of fluid motion and control products and services. Operating in more than 55 countries, the company produces engineered and industrial pumps, seals and valves as well as a range of related flow management services. More information about Flowserve can be obtained by visiting the company’s website at www.flowserve.com.

Safe Harbor Statement

This news release includes forward-looking statements within the meaning of Section 27A of the Securities Act of 1933 and Section 21E of the Securities Exchange Act of 1934, which are made pursuant to the safe harbor provisions of the Private Securities Litigation Reform Act of 1995, as amended. Words or phrases such as “may,” “should,” “expects,” “could,” “intends,” “plans,” “anticipates,” “estimates,” “believes,” “forecasts,” “predicts” or other similar expressions are intended to identify forward-looking statements, which include, without limitation, earnings forecasts, statements relating to our business strategy and statements of expectations, beliefs, future plans and strategies and anticipated developments concerning our industry, business, operations and financial performance and condition.

The forward-looking statements included in this news release are based on our current expectations, projections, estimates and assumptions. These statements are only predictions, not guarantees. Such forward-looking statements are subject to numerous risks and uncertainties that are difficult to predict. These risks and uncertainties may cause actual results to differ materially from what is forecast in such forward-looking statements, and include, without limitation, the following: a portion of our bookings may not lead to completed sales and our ability to convert bookings into revenues at acceptable profit margins; changes in global economic conditions and the potential for unexpected cancellations or delays of customer orders in our reported backlog; our dependence on our customers’ ability to make required capital investment and maintenance expenditures; risks associated with cost overruns on fixed-fee projects and in taking customer orders for large complex custom engineered products; the substantial dependence of our sales on the success of the oil and gas, chemical, power generation and water management industries; the adverse impact of volatile raw materials prices on our products and operating margins; our ability to execute and realize the expected financial benefits from our strategic manufacturing optimization and realignment initiatives; economic, political and other risks associated with our international operations, including military actions or trade embargoes that could affect customer markets, particularly Middle Eastern markets and global oil and gas producers, and non-compliance with U.S. export/re-export control, foreign corrupt practice laws, economic sanctions and import laws and regulations; increased aging and slower collection of receivables, particularly in Latin America and other emerging markets; our exposure to fluctuations in foreign currency exchange rates, including in hyperinflationary countries such as Venezuela; our furnishing of products and services to nuclear power plant facilities and other critical processes; potential adverse consequences resulting from litigation to which we are a party, such as litigation involving asbestos-containing material claims; a foreign government investigation regarding our participation in the United Nations Oil-for-Food Program; expectations regarding acquisitions and the integration of acquired businesses; our ability to anticipate and manage cybersecurity risk, including the risk of potential business disruptions or financial losses; our relative geographical profitability and its impact on our utilization of deferred tax assets, including foreign tax credits; the potential adverse impact of an impairment in the carrying value of goodwill or other intangible assets; our dependence upon third-party suppliers whose failure to perform timely could adversely affect our business operations; the highly competitive nature of the markets in which we operate; environmental compliance costs and liabilities; potential work stoppages and other labor matters; our ability to protect our intellectual property in the U.S., as well as in foreign countries; obligations under our defined benefit pension plans; and other factors described from time to time in our filings with the Securities and Exchange Commission.

All forward-looking statements included in this news release are based on information available to us on the date hereof, and we assume no obligation to update any forward-looking statement.


Contacts

Flowserve Contacts
Investor
Jay Roueche, Vice President, Investor Relations, 1+972-443-6560
Mike Mullin, Director, Investor Relations, 1+972-443-6636

Media
Lars Rosene, Vice President, Corporate Communications & Public Affairs, 1+972-443-6644

DUBLIN--(BUSINESS WIRE)--The "North America Maritime Real-time Positioning System Market Forecast to 2027 - COVID-19 Impact and Regional Analysis by Component, Technology, Application, and Vessel Type" report has been added to ResearchAndMarkets.com's offering.


North America Maritime Real-time Positioning System Market is expected to reach US$ 521.95 million by 2027 from US$ 64.28 million in 2019. The market is estimated to grow at a CAGR of 30.4 % from 2020 to 2027.

The report provides trends prevailing in the North America maritime real-time positioning system market along with the drivers and restraints pertaining to the market growth. Growing use of RFID in shipping industry and increase in the number of cargo vessels are the major factor driving the growth of the North America maritime real-time positioning system market. However, technical complexities and scarcity of skilled workforce hinder the growth of North America maritime real-time positioning system market.

Further, in case of COVID-19, North America is highly affected specially the US. The North America region is a crucial region for the demand of maritime solutions owing to the presence of developed countries such as the US and Canada in this region. Logistics and transportation is an essential element for the smooth operations of any industry including FMCG, healthcare, retail, automotive and others, where shipping contributes a substantial share in the global logistics and transportation sector.

The continuous growth in the number of infected individuals has led the North American government to impose lockdown across the nation's borders which has affected the North America maritime real-time positioning system market badly. The majority of the manufacturing plants are either temporarily shut or operating with minimum staff; the supply chain of components and parts is disrupted; these are some of the critical issues faced by the North American countries which has also affected the maritime real-time positioning system market negatively in the region

Envision Enterprise Solutions America Inc., MER Group, ORBCOMM Inc., SHIPCOM WIRELESS Inc., Zebra Technologies Corporation are among the leading companies in the North America maritime real-time positioning system market.

The companies are focused on adopting organic growth strategies such as product launches and expansions to sustain their position in the dynamic market. For instance, in 2020, Saab, ORBCOMM and AAC Clyde Space declared introduced space-based communication for the maritime sector through the new automatic tracking standard, VHF Data Exchange System (VDES).

Key Topics Covered:

1. Introduction

2. Key Takeaways

3. Research Methodology

4. North America Maritime Real-time Positioning System Market Landscape

4.1 Market Overview

4.2 North America PEST Analysis

4.3 Expert Opinion

4.4 Porter's Five Forces Analysis

5. North America Maritime Real-time Positioning System Market - Key Market Dynamics

5.1 Market Drivers

5.1.1 Growing Use of RFID in Shipping Industry

5.1.2 Increase in the Number of Cargo Vessels

5.2 Market Restraint

5.2.1 Technical Complexities and Scarcity of Skilled Workforce

5.3 Market Opportunity

5.3.1 Up Surging Growth Potential

5.4 Market Trend

5.4.1 Development of Advanced Technologies

5.5 Impact Analysis of Drivers and Restraints

6. Maritime Real-time Positioning System Market - North America Analysis

6.1 North America Maritime Real-time Positioning System Market Overview

6.2 North America Maritime Real-time Positioning System Market - Revenue and Forecast to 2027 (US$ Million)

6.3 Market Positioning - Market Players Ranking

7. North America Maritime Real-time Positioning System Market Analysis - by Component

7.1 Overview

7.2 North America Maritime Real-time Positioning System Market, by Component (2019 and 2027)

7.3 Hardware

7.3.1 Overview

7.3.2 Hardware: Maritime Real-time Positioning System Market - Revenue and Forecast to 2027 (US$ Million)

7.3.2.1 Readers and Trackers

7.3.2.2 Tags/Badges

7.3.2.3 Others

7.4 Software

7.5 Services

8. North America Maritime Real-time Positioning System Market - by Application

8.1 Overview

8.2 North America Maritime Real-time Positioning System Market, by Application (2019 and 2027)

8.3 Fleet Management

8.4 Inventory and Asset Management

8.5 Crew Tracking

9. North America Maritime Real-time Positioning System Market Analysis - by Technology

9.1 Overview

9.2 North America Maritime Real-time Positioning System Market, by Technology (2019 and 2027)

9.3 RFID

9.4 GPS

10. North America Maritime Real-time Positioning System Market Analysis - by Vessel Type

10.1 Overview

10.2 North America Maritime Real-time Positioning System Market, by Vessel Type (2019 and 2027)

10.3 Fishing Vessels

10.4 Cargo Vessels

10.5 Service Vessels

10.6 Passenger Ships and Ferries

11. North America Maritime Real-Time Positioning System Market - Country Analysis

12. Impact of COVID-19 Outbreak

12.1 North America: Impact Assessment of COVID-19 Pandemic

13. Industry Landscape

13.1 Overview

13.2 Market Initiative

13.3 Merger and Acquisition

14. Company Profiles

  • Envision Enterprise Solutions America Inc.
  • MER Group
  • ORBCOMM Inc.
  • SHIPCOM WIRELESS Inc.
  • Zebra Technologies Corporation

For more information about this report visit https://www.researchandmarkets.com/r/o9qhj4


Contacts

ResearchAndMarkets.com
Laura Wood, Senior Press Manager
This email address is being protected from spambots. You need JavaScript enabled to view it.

For E.S.T Office Hours Call 1-917-300-0470
For U.S./CAN Toll Free Call 1-800-526-8630
For GMT Office Hours Call +353-1-416-8900

DENVER--(BUSINESS WIRE)--SSP Innovations, LLC (“SSP” or the “Company”), a provider of IT services and software to electric, gas, and water utilities, is pleased to announce the acquisition of 3-GIS, LLC (“3-GIS”). 3-GIS, based in Decatur, Alabama, is an IT services and software company focused on the telecom industry and offers a suite of products that allows their customers to plan, design, construct, and manage their networks.


3-GIS founders, Tom Counts, Tommy Siniard, and Jerry Golden, will continue to spearhead the advancement of 3-GIS products and services throughout the telecom industry while continuing to build the joint company’s international presence. Dustin Sutton, President of 3-GIS, will continue overseeing all aspects of the telecom business line in coordination with SSP CEO Skye Perry.

“Through the acquisition of 3-GIS, we are creating a market leader across the Esri utility and telecom verticals," SSP CEO Skye Perry said. "We are excited to support 3-GIS’s continued growth while aligning them with the SSP brand and strong utility presence.”

“We are thrilled to partner with SSP and Warren Equity," 3-GIS CEO Tom Counts said. "The pairing of 3-GIS’s telecom product offerings and SSP’s utility product offerings will allow the Company to better serve customers through a combination of market-leading geospatial products, services, consulting, and data management practices.”

In conjunction with the adoption of digital mapping technologies, the infrastructure market is becoming increasingly dependent on GIS-specific data and applications across all business functions, including design and build activities, data management, workforce management, compliance and testing, asset maintenance, and customer service. SSP’s and 3-GIS’s solutions allow customers to optimize their geospatial strategy across all of these facets.

“We believe the addition of 3-GIS’s broad suite of software and experienced team will greatly benefit the SSP platform,” said Scott Bruckmann, Partner at Warren Equity. “The combination of SSP and 3-GIS creates a leading company focused on the digital transformation of asset management in the infrastructure market.”

This transaction is SSP’s fourth add-on acquisition since Warren Equity’s investment in April 2017.

About SSP Innovations

SSP, headquartered in Centennial, Colorado, is an IT services and software development company focused on delivering GIS and workforce management solutions to electric, gas, and water utilities as well as oil & gas pipeline operators and telecommunication providers. More information about SSP is available at http://sspinnovations.com/.

About Warren Equity Partners

Warren Equity Partners is a private equity firm that invests in small and middle market operating companies primarily in North America. The firm invests in established companies where additional capital and operating resources can accelerate growth, targeting companies in the industrial services, industrial products, business services, and distribution sectors. Warren Equity invests in the form of buyouts, growth equity, and recapitalizations. For more information, please visit www.warrenequity.com.


Contacts

Keith Freeman
SSP Innovations, LLC
720-279-9894

Oceana calls on President Biden to permanently protect our coasts from offshore oil drilling

WASHINGTON--(BUSINESS WIRE)--An Oceana analysis released today finds permanent offshore drilling protections for unleased federal waters could prevent over 19 billion tons of greenhouse gas emissions as well as more than $720 billion in damages to people, property and the environment. Oceana calls on President Biden to permanently protect our coasts from offshore drilling to ensure the future of our coastal economy that depends on a healthy ocean and help address the growing climate crisis.


“By permanently protecting our coasts from dirty offshore drilling and advancing clean energy sources like offshore wind, we can simultaneously combat climate change and safeguard our clean coast economy,” said Oceana campaign director Diane Hoskins. “President Biden has an incredible opportunity to act on climate change and protect our coasts once and for all by closing the chapter on future offshore oil leasing. If enacted, President Biden’s campaign commitments to tackle the climate crisis and protect our waters from new offshore oil drilling will ensure we build back better, keep coastal economies safe from oil disasters and support a transition to clean, renewable energy.”

Oceana’s analysis finds banning offshore drilling in all federal waters could:

  • Prevent more than 19 billion tons of greenhouse gas emissions: the equivalent of taking every car in the nation off the road for 15 years – or nearly three times the total annual emissions in the U.S.
  • Prevent over $720 billion in damages to people, property and the environment: comparable to more than the annual GDP of a major city like Washington D.C., Boston or Atlanta
  • Safeguard the U.S. clean coast economy, which supports around 3.3 million American jobs and $250 billion in GDP through activities like tourism, recreation and fishing
  • Support a transition away from fossil fuels toward clean, renewable energy sources like offshore wind

Oceana recommends President Biden end new leasing for offshore oil and gas and prioritize responsible development of offshore wind to combat the climate crisis. Oceana also recommends that Congress enact a permanent ban on all new leasing for offshore oil and gas.

“Oil and gas companies are responsible for the devastating impacts of climate change, like more frequent and powerful storms, droughts, wildfires and famine,” said Jacqueline Savitz, chief policy officer at Oceana. “These companies should not be granted license to continue generating the greenhouse gases that are driving the climate catastrophe. Climate change is wreaking havoc today, now, in America. To avoid even worse damage in the future, we must begin the transition to clean energy immediately.”

As of today, opposition and concern over offshore drilling activities nationwide includes:

  • Every East and West Coast governor, including Florida, Georgia, South Carolina, North Carolina, Virginia, Maryland, Delaware, New Jersey, New York, Connecticut, Rhode Island, Massachusetts, New Hampshire, Maine, California, Oregon and Washington
  • More than 390 local municipalities
  • Over 2,300 local, state and federal bipartisan officials
  • East and West Coast alliances representing over 55,000 businesses and 500,000 fishing families
  • Pacific, New England, South Atlantic and Mid-Atlantic fishery management councils
  • More than 120 scientists
  • More than 80 former military leaders
  • Commercial and recreational fishing interests such as Southeastern Fisheries Association, Snook and Gamefish Foundation, Fisheries Survival Fund, Southern Shrimp Alliance, Billfish Foundation and International Game Fish Association
  • California Coastal Commission, California Fish and Game Commission and California State Lands Commission
  • Department of Defense, NASA, U.S. Air Force and Florida Defense Support Task Force

For Oceana’s full analysis, please visit Oceana.org/ClimateCrisis.

To learn more about Oceana’s campaign to stop the expansion of offshore drilling activities, please click here.

Oceana is the largest international advocacy organization dedicated solely to ocean conservation. Oceana is rebuilding abundant and biodiverse oceans by winning science-based policies in countries that control one-third of the world’s wild fish catch. With more than 225 victories that stop overfishing, habitat destruction, pollution, and the killing of threatened species like turtles and sharks, Oceana’s campaigns are delivering results. A restored ocean means that 1 billion people can enjoy a healthy seafood meal, every day, forever. Together, we can save the oceans and help feed the world. Visit USA.Oceana.org to learn more.


Contacts

Christine Ayala This email address is being protected from spambots. You need JavaScript enabled to view it. 972.765.3644
Dustin Cranor: This email address is being protected from spambots. You need JavaScript enabled to view it., 954.348.1314

Former Dell sales enablement leader, Tim Banks will be responsible for creating strategy and executing plans for key relationships, while laying the foundation for a team of partnership development professionals

AUSTIN, Texas--(BUSINESS WIRE)--GRC (Green Revolution Cooling), the leader in single-phase immersion cooling for data centers, today announced the appointment of Tim Banks to the role of Director of Strategic Alliances, where he will bring to GRC his well-established record of developing channel partner programs, vertical marketing strategies, and sales enablement training.


Banks brings more than a decade of experience as a sales leader, most recently as enterprise sales enablement manager at Dell Technologies, preceded by a successful stint at HPE.

“With the increased demand in data center liquid immersion cooling coupled with unlimited partnership opportunities, Tim’s breadth of experience in partnership development will help ensure GRC’s successful alliances throughout the data center industry, and we are thrilled to welcome him to the team,” said Jim Weynand, CRO of GRC. “Tim’s demonstrated success developing go-to-market initiatives and supporting partners and sales perfectly positions him to for this new role and building our partner ecosystem as we challenge the legacy orthodoxy of the data center industry.”

In his role, Banks will be responsible for identifying and supporting key alliance and partnership opportunities, creating strategy, and executing the plan for expanding GRC’s relationships with key technology partners, including OEM server manufacturers and data center infrastructure providers.

“I look forward to maximizing my experience in strategic alliances to contribute to the rapid growth and development of GRC,” said Tim Banks, Director of Strategic Alliances, GRC. “I’m thrilled to join the GRC team as it continues to meet the demand of more efficient cooling technologies while providing solutions for high-density computing environments.”

Today’s announcement follows this month’s appointment of GRC’s new Vice President of Operations and Chief Product Officer and is a prelude to further company expansion and rollout of new data center liquid immersion cooling products.

About GRC

GRC is The Immersion Cooling Authority®. The company's patented immersion-cooling technology radically simplifies deployment of data center cooling infrastructure. By eliminating the need for chillers, CRACs, air handlers, humidity controls, and other conventional cooling components, enterprises reduce their data center design, build, energy, and maintenance costs. GRC’s solutions are deployed in eighteen countries and are ideal for next-gen applications platforms, including artificial intelligence, blockchain, HPC, 5G, and other edge computing and core applications. Their systems are environmentally resilient, sustainable, and space saving, making it possible to deploy them in virtually any location with minimal lead time. Visit http://grcooling.com for more information.


Contacts

Milldam Public Relations
Adam Waitkunas
978-828-8304 (mobile)
This email address is being protected from spambots. You need JavaScript enabled to view it.

HOUSTON--(BUSINESS WIRE)--Genesis Energy, L.P. (NYSE: GEL) will announce its earnings for the Fourth Quarter ended December 31, 2020 on February 18, 2021, before the market opens.


Genesis Energy, L.P.’s Fourth Quarter Earnings Conference Call will be held Thursday, February 18, 2021, at 8:30 a.m. Central time (9:30 a.m. Eastern time). This call can be accessed at www.genesisenergy.com. Choose the Investor Relations button. For those unable to attend the live broadcast, a replay will be available beginning approximately one hour after the event.

Genesis Energy, L.P. is a diversified midstream energy master limited partnership headquartered in Houston, Texas. Genesis’ operations include offshore pipeline transportation, sodium minerals and sulfur services, marine transportation and onshore facilities and transportation. Genesis’ operations are primarily located in the Gulf Coast region of the United States, Wyoming and the Gulf of Mexico.


Contacts

Genesis Energy, L.P.
Ryan Sims
SVP – Finance and Corporate Development
(713) 860-2521

MONTREAL & QUEBEC CITY--(BUSINESS WIRE)--Northern Genesis Acquisition Corp. (NYSE: NGA) announces that its proposed business combination partner, Lion Electric (Lion), a leading manufacturer of all-electric medium and heavy-duty urban vehicles, announced today a new chapter in its collaboration with FLO and its parent company AddEnergie, with the signing of a reseller agreement. FLO is a leading North American charging network operator for electric vehicles and the provider of AddEnergie’s smart charging software and equipment. As part of the agreement, Lion will now offer its clients across North America the lineup of AddEnergie charging stations provided by FLO, including AC and DC smart chargers, as well as its associated charging and energy management cloud software services.


FLO’s charging products will be added to the portfolio of charging solutions offered by LionEnergy, a dedicated team of infrastructure and energy management specialists within Lion, whose mission is to facilitate the electric vehicle transition journey for customers by educating them and by providing complete turnkey charging infrastructure solutions, tailored to their respective needs. LionEnergy supports the customers at all steps, from equipment selection to installation and equipment management. The announcement was made during IMPULSION MTL International Fleet Forum, where representatives from both companies participated.

“Adequate energy management is an essential factor to reduce total cost of ownership of electric vehicles, and FLO’s expertise in smart charging is another opportunity for us to offer LionEnergy customers products and services that will help maximize their return on investment,” said Marc Bedard, CEO and Founder of Lion Electric. “This partnership demonstrates the shared vision of two North American leaders in transportation electrification and we are excited to see what the future brings for our two companies.”

“Our collaboration with Lion started in 2015 and has helped FLO develop innovative and relevant charging solutions for medium and heavy-duty electric transportation. As this particular segment is now ripe for accelerated growth, we are delighted to be working with an industry leader like Lion to efficiently power fleets, and ultimately put more zero-emission vehicles on the road today and into the future,” said Louis Tremblay President and CEO of FLO | AddEnergie.

Lion has over 300 zero-emission vehicles on the road in North America today, with over 6 million miles driven since 2016. All of Lion’s vehicles are built at the company’s North American facility, which has the capacity to build up to 2,500 vehicles per year.

FLO offers a comprehensive suite of charging equipment, from residential to 100 kW DC fast charging stations. Thanks to innovative software solutions, FLO has extensive experience supporting fleet electrification and smart energy management.

About Lion Electric

Lion Electric is an innovative manufacturer of zero-emission vehicles. The company creates, designs and manufactures all-electric class 5 to class 8 commercial urban trucks and all-electric buses and minibuses for the school, paratransit and mass transit segments. Lion is a North American leader in electric transportation and designs, builds and assembles all its vehicles’ components, including chassis, battery packs, truck cabins and bus bodies.

Always actively seeking new and reliable technologies, Lion vehicles have unique features that are specifically adapted to its users and their everyday needs. Lion believes that transitioning to all-electric vehicles will lead to major improvements in our society, environment and overall quality of life.

About Northern Genesis Acquisition Corp.

Northern Genesis Acquisition Corp. (NYSE: NGA) is a special purpose acquisition company formed for the purpose of effecting a merger, stock exchange, acquisition, reorganization or similar business combination with one or more businesses. The Northern Genesis management team brings a unique entrepreneurial owner-operator mindset and a proven history of creating shareholder value across the sustainable power and energy value chain. Northern Genesis is committed to helping the next great public company find its path to success; a path which will most certainly recognize the growing sensitivity of customers, employees and investors to alignment with the principles underlying sustainability.

Transaction with Northern Genesis

On December 31, 2020, Lion filed with the U.S. Securities and Exchange Commission (“SEC”) a preliminary registration statement on Form F-4 (the “Registration Statement”), which includes a preliminary proxy statement of Northern Genesis, in connection with their proposed business combination.

Upon closing of the proposed business combination, a wholly-owned subsidiary of Lion Electric will merge with and into Northern Genesis, and Lion is expected to be listed on the New York Stock Exchange (NYSE) under the new ticker symbol “LEV”.

The business combination has been unanimously approved by the Boards of Directors of both Northern Genesis and Lion Electric and is expected to close in the first quarter of 2021, subject to the Registration Statement being declared effective by the SEC, approval by Northern Genesis stockholders as well as other customary closing conditions.

Important Information and Where to Find It

The Registration Statement filed by Lion Electric with the SEC includes a preliminary prospectus relating to the registration of the securities to be issued by Lion Electric to Northern Genesis’ stockholders in connection with the transaction, and a preliminary proxy statement of Northern Genesis in connection with Northern Genesis’ solicitation of proxies for the vote by its stockholders with respect to the transaction and other matters as described in the Registration Statement. After the Registration Statement has been cleared by the SEC and declared effective, Northern Genesis will mail a definitive proxy statement to its stockholders. Investors and security holders of Northern Genesis and other interested parties are urged to read the Registration Statement, the preliminary proxy statement/prospectus and amendments thereto and the definitive proxy statement/prospectus (the “Joint Proxy Statement/Prospectus”), any amendments to the foregoing, and any other documents filed with the SEC, when available, because they will contain important information about Lion Electric, Northern Genesis and the proposed business combination. Investors and security holders of Northern Genesis may obtain free copies of the Joint Proxy Statement/Prospectus (when available) and other documents filed with the SEC by Northern Genesis and Lion Electric through the website maintained by the SEC at http://sec.report or by directing a request to: Northern Genesis Acquisition Corp., 4801 Main Street, Suite 1000, Kansas City, MO 64112 or (816) 514-0324. The information contained on, or that may be accessed through, the websites referenced in this press release is not incorporated by reference into, and is not a part of, this press release.

Participants in the Solicitation

Northern Genesis and its directors and executive officers and other persons may be deemed to be participants in the solicitations of proxies from Northern Genesis’ stockholders in respect of the proposed business combination. Lion Electric and its officers and directors may also be deemed participants in such solicitation. Information regarding Northern Genesis’ directors and executive officers is available under the heading “Management” in its final prospectus dated August 17, 2020 filed with the SEC on August 18, 2020 (the “IPO Prospectus”). Additional information regarding the participants in the proxy solicitation and a description of their direct and indirect interests, by security holdings or otherwise, which may, in some cases, be different than those of their stockholders generally, are contained in the Joint Proxy Statement/Prospectus and will be contained in other relevant materials to be filed with the SEC in connection with the proposed business combination when they become available. Stockholders, potential investors and other interested persons should read the Joint Proxy Statement/Prospectus carefully when it becomes available before making any voting or investment decisions. When available, these documents can be obtained free of charge from the sources indicated above.

No Offer or Solicitation

This press release shall not constitute an offer to sell or the solicitation of an offer to buy any securities or constitute a solicitation of any vote or approval. No offer of securities, other than with respect to the concurrent private placement of Lion shares as described in the Registration Statement, shall be made except by means of a prospectus meeting the requirements of Section 10 of the Securities Act.

Forward-Looking Statements

All statements other than statements of historical facts contained in this press release constitute “forward-looking statements” (which shall include forward-looking information within the meaning of Canadian securities laws) within the meaning of Section 27A of the Securities Act. Forward-looking statements may generally be identified by the use of words such as “believe,” “may,” “will,” “continue,” “anticipate,” “intend,” “expect,” “should,” “would,” “could,” “plan,” “project,” “potential,” “seem,” “seek,” “future,” “target” or other similar expressions that predict or indicate future events or trends or that are not statements of historical matters, although not all forward-looking statements contain such identifying words. These forward-looking statements include, but are not limited to, statements regarding the transaction, including with respect to timing and closing thereof and the ability to consummate the transaction. These statements are based on various assumptions, whether or not identified in this press release, and on the current expectations of Lion Electric’s and Northern Genesis’ management and are not predictions of actual performance. Forward-looking statements involve inherent risks and uncertainties, most of which are difficult to predict and many of which are beyond the control of Lion Electric and Northern Genesis, and are based on a number of assumptions, as well as other factors that Lion Electric and Northern Genesis believe are appropriate and reasonable in the circumstances, but there can be no assurance that such estimates and assumptions will prove to be correct or that the Lion Electric’s vision, business, objectives, plans and strategies will be achieved. Many risks and uncertainties could cause Lion Electric’s actual results, performance or achievements or future events or developments to differ materially from those expressed or implied by the forward-looking statements, including those factors discussed in the Registration Statement and Northern Genesis’ IPO Prospectus, as well as other documents filed or to be filed by Lion Electric or Northern Genesis in accordance with applicable securities laws. These factors are not intended to represent a complete list of the factors that could affect Northern Genesis or Lion Electric, and there may be additional risks that neither Northern Genesis nor Lion Electric presently know or that Northern Genesis and Lion Electric currently believe are immaterial that could also cause actual results to differ from those contained in the forward-looking statements. In addition, forward-looking statements reflect Northern Genesis’ and Lion Electric’s expectations, plans or forecasts of future events and views as of the date of this press release. Northern Genesis and Lion Electric anticipate that subsequent events and developments will cause their respective assessments to change. However, while Northern Genesis and Lion Electric may elect to update these forward-looking statements at some point in the future, Northern Genesis and Lion Electric have no intention and undertake no obligation to do so except as required by applicable law. These forward-looking statements should not be relied upon as representing Northern Genesis’ and Lion Electric’s assessments as of any date subsequent to the date of this press release.

About FLO

FLO is a leading North American charging network for electric vehicles and a major provider of smart charging software and equipment. Every month, FLO and its parent company, AddEnergie, enable approximately half a million charging events and the transfer of 5.5 GWh in electricity, thanks to over 35,000 high-quality stations deployed on public networks, commercial and residential installations. FLO’s headquarters and network operations center are based in Quebec City, and AddEnergie's assembly plant is located in Shawinigan (Quebec). The company also has an office in Montreal and regional teams located in Ontario, British Columbia, California, New York and Florida. For more information, visit flo.com.


Contacts

Northern Genesis:

Investor Relations
This email address is being protected from spambots. You need JavaScript enabled to view it.
816-514-0324

This email address is being protected from spambots. You need JavaScript enabled to view it.

AKRON, Ohio--(BUSINESS WIRE)--$BW--Babcock & Wilcox (B&W) (NYSE: BW) announced today that its strategic growth and expansion initiatives in Asia and the Middle East have continued to accelerate, resulting in two new contracts totaling $10 million for its B&W Environmental business segment.

“We are continuing to make progress in leveraging B&W’s industry-leading technologies and strong operational presence in Asia and the Middle East to provide advanced environmental solutions for our customers,” said B&W Chief Operating Officer Jimmy Morgan. “These two new contracts, which include the design and supply of our SPIG S.p.A. cooling system technologies, demonstrate that the actions we’ve taken to increase our business focus on these regions are already paying off.”

“As we look ahead in 2021 and beyond, we see other significant opportunities for all of our business segments – B&W Environmental, B&W Renewable and B&W Thermal – in the Asia-Pacific, Middle East and Africa regions, with a combined addressable market potential of nearly $12 billion over the next three years,” Morgan said.

Each contract calls for B&W Environmental to design and supply SPIG S.p.A. cooling technologies for industrial projects in Asia and the Middle East. The cooling systems include fiberglass reinforced plastic (FRP) cooling towers, cooling cells and other technologies designed to increase cooling efficiency, reduce environmental impact and improve safe operation under extreme weather conditions.

B&W Environmental’s cooling system experience includes wet, dry and wet/dry hybrid cooling solutions and the supply of designs for a wide range of project specifications such as high seismic loads, vibration control, corrosion, noise control, sub-freezing operation, and seawater use.

About B&W

Headquartered in Akron, Ohio, Babcock & Wilcox Enterprises, Inc., is a global leader in energy and environmental technologies and services for the power and industrial markets. Follow us on LinkedIn and learn more at www.babcock.com.

About B&W Environmental

Babcock & Wilcox Environmental offers a full suite of best-in-class emissions control products and solutions for utility and industrial steam generation applications around the world. The segment’s broad experience includes systems for ash handling, particulate control, nitrogen oxides and sulfur dioxides removal, chemical looping for carbon control, and mercury control, along with cooling solutions.

Forward-Looking Statements

B&W cautions that this release contains forward-looking statements, including, without limitation, statements relating to the company’s plan to expand its presence in Asia and the Middle East in support of the growth of its three business segments – B&W Renewable, B&W Environmental and B&W Thermal – and the execution and completion of two contracts for the design and supply of cooling systems for industrial facilities. These forward-looking statements are based on management’s current expectations and involve a number of risks and uncertainties. For a more complete discussion of these risk factors, see our filings with the Securities and Exchange Commission, including our most recent annual report on Form 10-K. If one or more of these risks or other risks materialize, actual results may vary materially from those expressed. We caution readers not to place undue reliance on these forward-looking statements, which speak only as of the date of this release, and we undertake no obligation to update or revise any forward-looking statement, except to the extent required by applicable law.


Contacts

Investors:
Megan Wilson
Vice President, Corporate Development & Investor Relations
Babcock & Wilcox
704.625.4944 | This email address is being protected from spambots. You need JavaScript enabled to view it.

Media:
Ryan Cornell
Public Relations
Babcock & Wilcox
330.860.1345 | This email address is being protected from spambots. You need JavaScript enabled to view it.

Offshore Source Logo

Offshore Source keeps you updated with relevant information concerning the Offshore Energy Sector.

Any views or opinions represented on this website belong solely to the author and do not represent those of the people, institutions or organizations that Offshore Source or collaborators may or may not have been associated with in a professional or personal capacity, unless explicitly stated.

Corporate Offices

Technology Systems Corporation
8502 SW Kansas Ave
Stuart, FL 34997

info@tscpublishing.com